Article

Sustainability and Energy Efficiency: BIM 6D. Study of the BIM Methodology Applied to Hospital Buildings. Value of Interior Lighting and Daylight in Energy Simulation

by
Francisco Javier Montiel-Santiago
1,2,
Manuel Jesús Hermoso-Orzáez
2,* and
Julio Terrados-Cepeda
2
1
Hospital of Jaén Maintenance Service, Servicio Andaluz de Salud, 23007 Jaén, Spain
2
Department of Graphic Engineering Design and Projects, Universidad de Jaén, 23071 Jaén, Spain
*
Author to whom correspondence should be addressed.
Sustainability 2020, 12(14), 5731; https://doi.org/10.3390/su12145731
Submission received: 28 June 2020 / Revised: 10 July 2020 / Accepted: 11 July 2020 / Published: 16 July 2020
(This article belongs to the Special Issue The Future of Interior Lighting is here)

Abstract

:
One of the least used aspects of BIM (Building Information Modeling) is the ability to obtain the energy model of the building using the BIM methodology known as BIM 6D. This digital information model allows simulating the real energy behavior of the building and the improvement in the building’s lighting systems, both natural and artificial, in particular daylighting. In this way, the BIM 6D simulation allows us to make design and operation decisions for the building, not only for new buildings that must be, in accordance with current legislation, NZEB (Nearly Zero-Energy Building) but also for the rehabilitation of existing buildings. Particularly in buildings for sanitary use, BIM 6D allows an exhaustive analysis of the energy impact of said rehabilitation, guiding it towards an improvement in energy and light efficiency, which in turn provides greater quality and comfort in the use of the sustainable building. This subject of study is especially important in public buildings for hospital use. Buildings where energy efficiency and comfort, oriented towards optimal and efficient lighting, are two fundamental criteria highly appreciated by patients and citizens in general. Once the energy model of the building has been obtained, it is possible to study and identify possible alternatives to improve energy efficiency and improve lighting, as well as to analyze the possibilities of incorporating other more efficient forms of renewable energy, such as the use of daylight. In this work we can see how applying a set of simulated improvement actions in BIM 6D achieves an energy saving of 50% in general and up to 13% only by acting on lighting systems, allowing the decarbonization of buildings with high energy consumption, such as hospitals, and in turn, will lead to an improvement in the energy certification of these buildings; thus achieving a better and higher quality of habitability, using more efficient forms of lighting and transforming buildings into more sustainable spaces.

1. Introduction

Building Information Modeling (BIM) is a work methodology based on digitalization and collaboration between agents throughout the entire life cycle of a building or infrastructure. This methodology requires knowledge and training in technologies associated with new design tools [1], and its objective is to obtain greater efficiency in infrastructure investment, reduce risks [2], and uncertainties with an increase in quality [3]. The (BIM) methodology is a project technique which regards information as a key relevant factor throughout the project life cycle by elaborating a database where each element has associated visualization attributes and related attached information, such as building materials, technical characteristics, constructions costs, etc. [4]. Although the use of this methodology is essentially aimed at increasing the efficiency of both public and private investment [5], additionally, there are many beneficial effects that its incorporation is likely to generate. These include the improvement of the documentary management of the projects, the long-term maintenance of the facilities and the training of the operators and the rest of the agents involved in the different phases of a Project, as well as the management and resolution of conflicts between the different agents involved in a Project [6]. These are the key elements that have made BIM increasingly present throughout the world and especially in the countries of the EU (European Union) [7].
The BIM methodology is at the heart of the digital transformation of the construction sector and the built environment. Governments and public promoters across Europe and around the world recognize the value of BIM as a strategic factor for cost, social and environmental quality, as well as value in establishing growth and competitiveness policies in the sector [8,9,10,11]. Many are taking proactive steps for the use of BIM in the construction, execution and operation of public goods sectors to guarantee these economic, environmental, and social benefits.
The BIM methodology encompasses the control, direction, monitoring, and control of the project and the management of all the information that is generated throughout the development of the project: from the initial planning stages, through conceptual design and selection of alternatives, procurement from suppliers, the establishment of the most advanced phases that include structural design and facilities [12]. Without forgetting, of course, the monitoring or control and the management of the construction and future maintenance of the facilities, 4D, 5D, 6D, and 7D Stages [7], are key aspects such as energy efficiency [13], functional safety and sustainability of buildings and infrastructure, the last two being crucial (See Table 1) [14].
The advanced BIM 4D is now widely used, and its increasing adoption is due to the general acceptance that 4D relates to planning at large. This is confirmed in Table 1 (planning is labeled by “Time”) [15,16]. Several authors have linked different specific tasks to BIM 5D cost [17,18]. The 4th and 5th BIM dimensions are well established, and BIM 4D and 5D have really been able to help in terms of cost and planning. Multiple authors agreed on the consensus of what the BIM 4D and BIM 5D refer to. However, there exists no agreement between the 6D and onwards [19,20].
The revised bibliography attributes the sixth BIM 6D dimension to the model information in relation to the energy efficiency and sustainability of the building model. They developed a model that can automatically assess the energy performance and sustainability of a project, allowing designers to select the best design option [21,22]. Consequently, we can briefly say that the information linked to the 3D model is called by the authors as BIM 3D. There is also a broad consensus on 4D BIM and 5D BIM, where the fourth dimension is linked to time, and the fifth dimension is linked to cost. However, for BIM 6D and 7D, there is no real setting. The results of the systematic review show that these two areas are still in their infancy, illustrated by some ambiguities to which these BIM dimensions refer. We will start with the BIM 6D concept associated with aspects related to energy efficiency and simulation, which are associated with aspects of environmental pollution and sustainable building, considering that the aspects associated with efficient and sustainable maintenance, as well as the life cycle of materials, would be closer to the concept defined in the BIM 7D dimension [7]. Even so, at the moment, it is beginning to speak about the eighth dimension or BIM 8D, such as the one dedicated to the prevention of occupational risks and safety and health in the project [23].
In conclusion, BIM assumes the evolution of traditional design systems based on the plane, since it incorporates geometric information (3D), time (4D), costs (5D), environmental sustainability (6D) and facility management (7D) [24].
To maintain the standard of living and comfort of our current society, high energy consumption is needed, which, taken to the building sector in Europe, represents around 40% of final energy consumption in the European Union (EU) [25], as manifested in Directive 2012/27/EU [26]. Furthermore, the growing concern for the conservation of the environment and, in particular, for climate change, has led the European Union to search for solutions capable of correcting this effect. For this, and to achieve a rational use of energy and the decarbonization of the building sector, the EU has established increasingly restrictive requirements regarding the energy efficiency of buildings since Directive 2002/91/EC [27], which was replaced by Directive 2010/31/EU [28], and recently amended in turn, by Directive (EU) 2018/844 [27], and they have been transposed into Spanish regulations mainly in the (CTE-DB-HE) basic document of energy-saving (Ministry of Development, 2019), framed within the Technical Building Code (CTE) published as Royal Decree (Ministry of Housing, 2006) [29,30].
The increase in global environmental concerns, as well as the advancement of computational tools and methods, have had significant impacts on the way in which buildings are designed. Building professionals are increasingly expected to improve the energy performance of their design. To achieve a high level of energy performance, multidisciplinary simulation-based optimization can be utilized to help designers in exploring more design alternatives and making informed decisions. Because of the high complexity in setting up a building model for multi-objective design optimization, there is a great demand for utilizing and integrating the advanced modeling and simulation technologies, including BIM [31].
Considering the above, and given that BIM is a strong collaborative work methodology for the management of building projects through a digital model, which allows these projects, throughout their life cycle, to be more efficient and sustainable. This methodology allows obtaining the energy model of the building and its subsequent analysis, which is known as the sixth dimension of the BIM or BIM 6D, where information from the previous dimensions is used, mainly the definition of geometry, construction materials, and equipment [32]. By means of this energy model, the real behavior of the building can be simulated, allowing it to help in making decisions about the design and operation of the building, not only for new buildings that must be, according to current legislation (CTE-DB-HE) [33], NZEB (Nearly Zero-Energy Building) [34] but also for the rehabilitation of existing buildings [35], since it allows a comprehensive analysis of the impact of such rehabilitation, orienting it towards improving energy efficiency, which, in turn, provides greater quality and comfort in the use of the building. Although it is true, that it is in the design phase of new buildings, when the greatest emphasis can be made on the future building to be built concerning sustainability and energy efficiency, where the building geometry is decided, as well the orientation, compactness, envelope, etc., it is still interesting to use this methodology to study the possibilities of improving energy efficiency for the rehabilitation of existing buildings, given that, as previously mentioned BIM improves sustainability by throughout the entire life cycle of the building [36]. The global buildings sector is now responsible for 40% of final energy consumption as well as accounting for 33% of energy-related carbon dioxide emissions. This has resulted in a growing urgency to address energy and emissions from buildings and construction, to meet restrictive 2020 targets as specified by the European Union (EU) [37]. To achieve these targets, a number of funding initiatives have been put in place through Horizon 2020 with a focus on BIM due to it having the potential to rapidly produce energy outputs that enable design teams to analyze and compare the most cost-effective, energy-efficient options [38]. However, despite the recorded benefits that BIM can bring to the design, there is still a lack of understanding of how it can be used [39].
In this work, the possibilities of improving the energy efficiency of the building that the BIM methodology offers us, specifically for an existing building for hospital use, as well as the ability to identify possible alternatives that improve the quality and comfort of the existing renovated building is studied [40]. This study also analyzes the possibilities of incorporating renewable energies and use of natural light, which allow a reduction in CO2 emissions from the building, [41] which will result in environmental improvement and increase the sustainability of the building [42], at the same time that it would allow the study of the economic savings of the renovated building compared to the current building [43,44]. All this is taking into account the great energy-saving potential that thermal and lighting systems mainly offer in the existing buildings [45]. One of the major factors in verifying how internal environments and buildings are qualified by people is daylight. The role of daylight in day to day basis and the fact of providing internal space quality make it that important [46].
Specifically, in terms of lighting buildings, the BIM methodology allows studying the necessary light levels for the comfort of the occupants to ensure they are met, and by simulation of the energy model, the possibility of improving efficiency can be studied from various perspectives, such as lighting equipment consumption, occupancy control, daylighting, building orientation, and ratio of the glazed area on walls. Unfortunately, these latter two options are usually not viable for building rehabilitation. On the other hand, it must be taken into account that the rest of the measures are easily applicable to hospital buildings without interfering with their continuous activity, in addition to being amortizable investments in the short term, compared to other measures to improve energy efficiency in hospital buildings [44]. In this sense, there are very interesting works aimed at taking advantage of simulated lighting data using Building Information Modeling (BIM) of a building, which are key to improving the building’s energy and light efficiency allowing the designer to simulate strategies for saving and simulate control of lighting savings [47]. It is possible to analyze the improvement in visual comfort for the renovation of the building, using Building Information Modeling (BIM) and parametric environmental analysis tools. The building model is exported to Computer-Aided Design software to execute parametric daylight analyses through environmental simulation soft [48].
Finally, it should be noted, that BIM 6D can be used as a tool to support the implementation of the Green Building Certifications (GBCs), for example, Leadership in Energy and Environmental Design (LEED) [49], Building Research Establishment Environmental Assessment Methodology (BREEAM), and German Sustainable Building Council (DGNB) [50,51]. In fact, REVIT INSIGHT [52], includes tests to verify compliance with the LEED daylight credit.

2. Materials and Methods

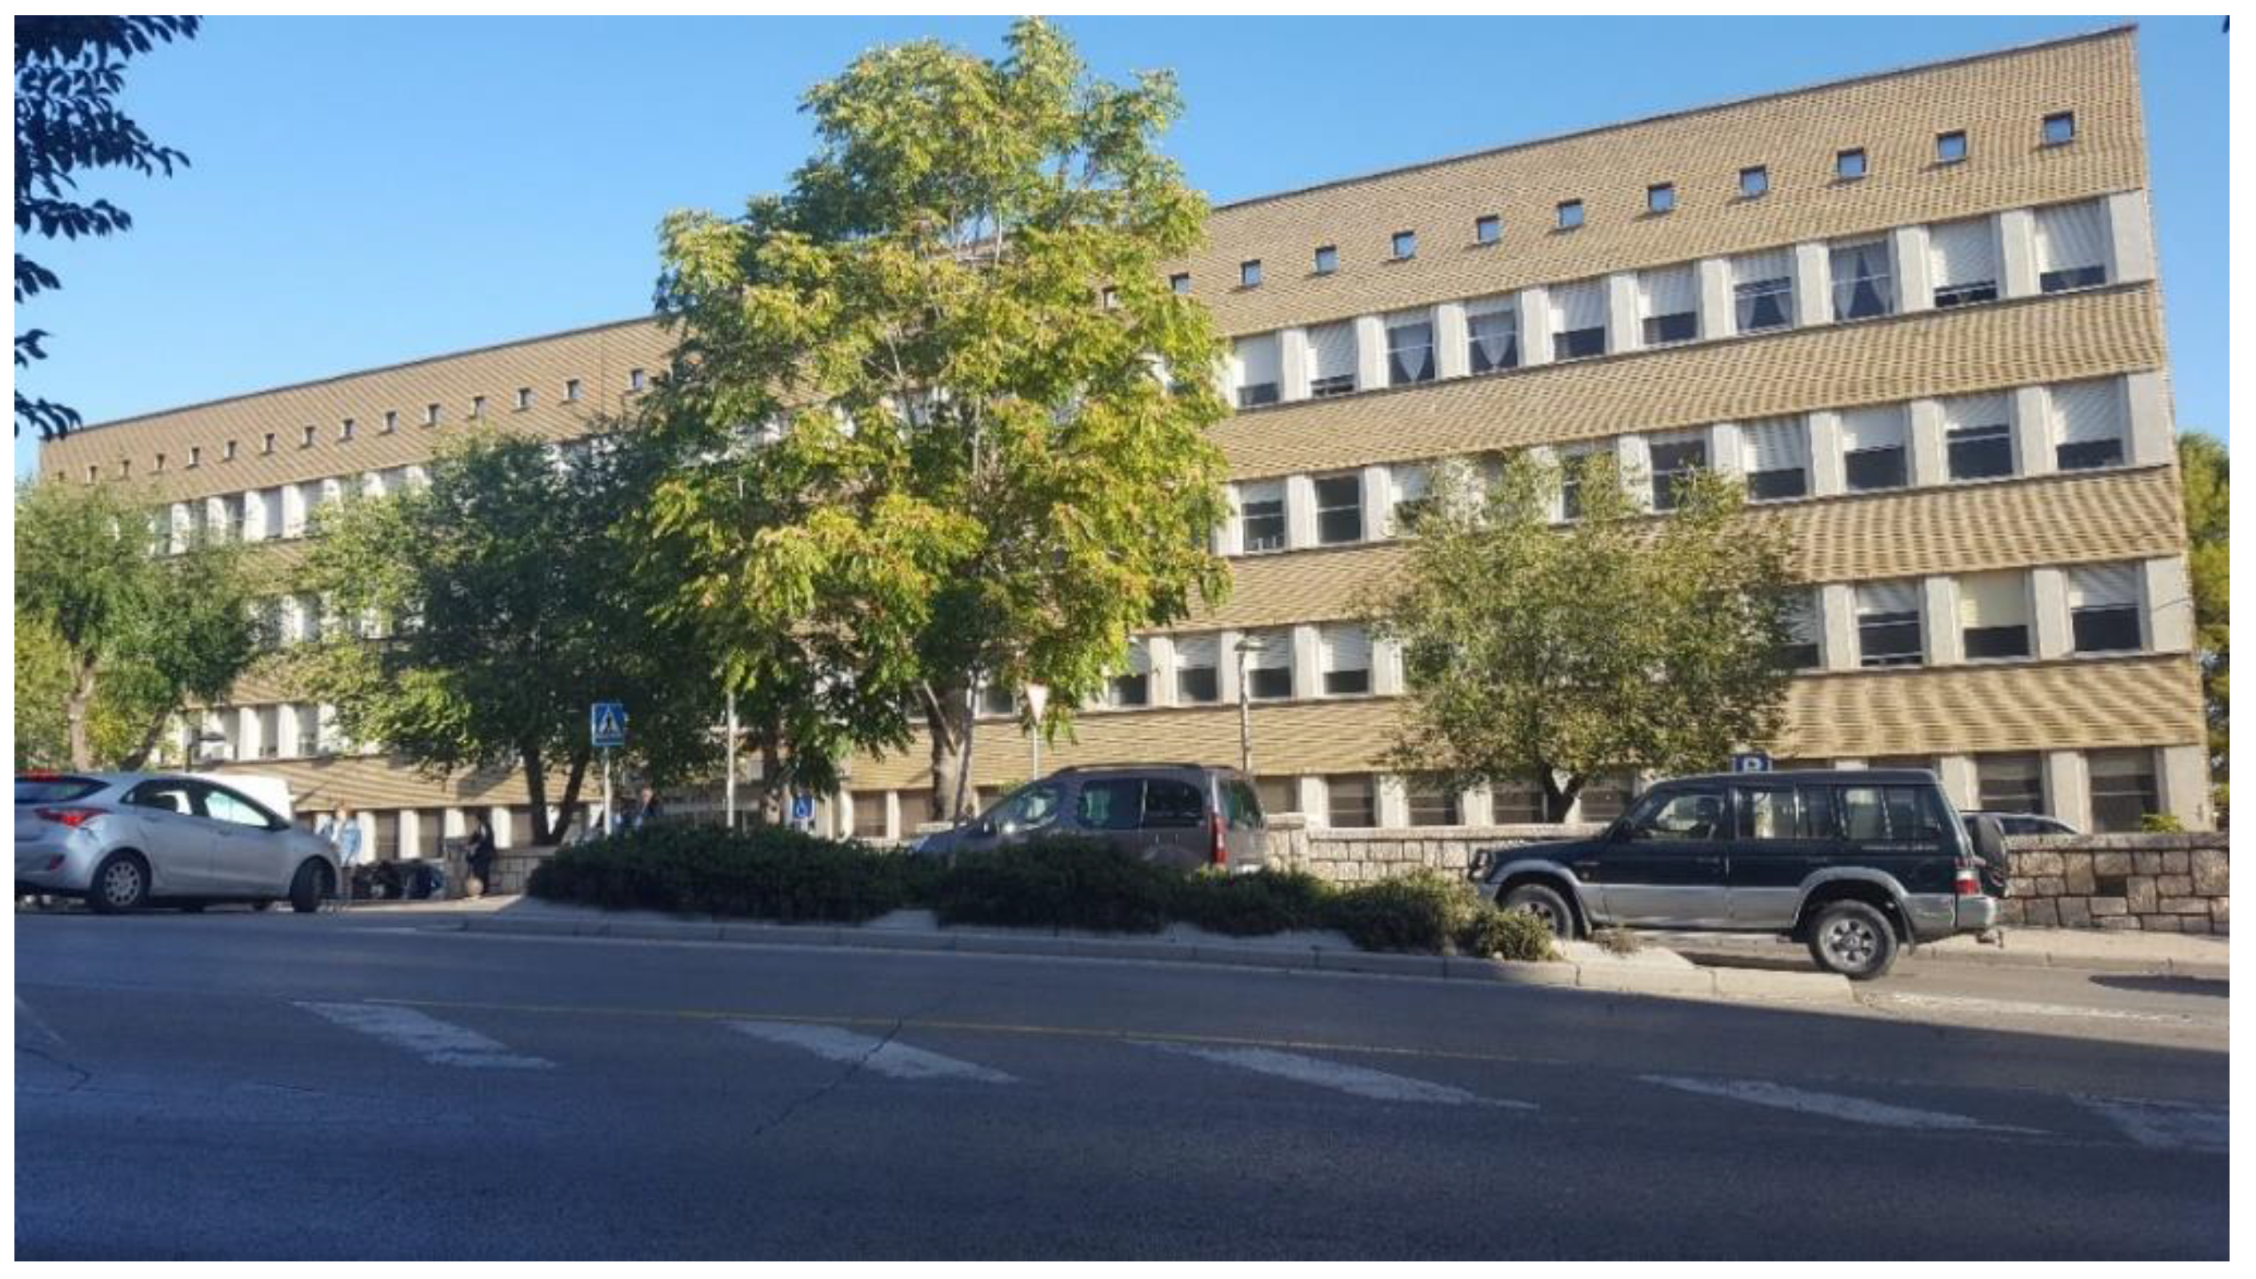
2.1. Object of Study

This document aims to study a working methodology in which using a BIM model of an existing building for hospital use, a simulation of energy behavior can be carried out, and energy analysis on this model can be carried out, allowing the operation of the building to be studied before initiating a possible renovation or rehabilitation on the existing building. To do this, the energy model of a building (BEM), which within the BIM methodology is known as BIM 6D [53] or the sixth dimension of the BIM, was obtained.
Through energy simulation, and after analyzing the current energy state of the building, the aim was to study possible alternatives to improve energy efficiency, optimizing its sustainability [51,54], and to study the possibilities of incorporating renewable energy and using natural light in the BIM model of the building.
On the other hand, through these improvements in the sustainability of the building, whether this methodology can be a tool to help in decision-making, when it comes to rehabilitating and modernizing a building, in addition to enabling quantifiable criteria for valuation in administrative contracting, for the awarding of projects, and thus, mitigate the lack of definition of formulas and objective approach for evaluating the energy efficiency criteria in public building construction was studied [11,55,56].
Finally, the intention is to analyze, through energy simulation, the status of the existing building with respect to the criteria required for daylighting in LEED certification of new buildings.

2.2. Methodology

First, the architectural modeling of the building was carried out, and for this, the BIM REVIT software was used [57]. With this software, the energy model was also obtained, with which the energy simulation and analysis were subsequently performed with the plugin for REVIT, INSIGHT 360 [58]. This software performs energy simulation in the cloud, using industry-leading, trusted and widely established DOE 2.2 and EnergyPlus [59] simulation engines, DOE 2.2 [60] being the calculation engine of the Calener Unified Tool, a general option [61], to perform energy certifications for buildings in Spain. Once the energy simulation was carried out, the INSIGHT 360 platform visualized and interacted with the results obtained, through diagrams and performance diagrams directly in a virtual model, which allowed studying both the current state of the building, as well as possible energy improvements on the building [62,63].
Through REVIT INSIGHT 360 LIGHTING, and also through cloud calculations, an analysis of lighting and natural light of the BIM model through automatic and customizable configurations for different types of study was carried out. The different analyzes that the plugin allows to carry out are:
  • Illuminance Analysis.
  • Daylight Autonomy (sDA preview; LEED v4 EQc7 option 1).
  • LEED 2009 IEQc8 option 1.
  • LEED v4 EQc7 option 2.
  • Solar Access.

2.3. Case Study

The Diagnosis and Treatment Centre of the University Hospital of Jaén is a health center of the Andalusian Health Service, which belongs to the Health Department of the Andalusian Government, located in Jaén, corresponding to climate zone C4, according to the Technical Code of the Building (CTE) and which meets the typology of a grand tertiary (GT) building [64]. The construction of the building dates from 1972, as a specialized care center. The building’s main activity is the care of the external consultations of the University Hospital of Jaén. Complimentary activities in the building are the medical inspection offices (U.M.V.I.), community mental health, and files in the basement of the building (see Figure 1).

2.3.1. Building Description

The Diagnosis and Treatment Center of the University Hospital of Jaén is located in a 1000 m2 building with a very long rectangular floor and has 4 floors built above ground, plus a semi-basement and basement. The total floor area is approximately 6200 m2. The 6 floors into which the building is divided are Basement, Semi-basement, Low, First to third. The building is made of a reinforced concrete structure, and the walls of the exterior enclosure are exposed brick factory, and have a half-foot chamber and the second partition of the plastered brick factory. The building’s floors are also made of reinforced concrete. The exterior carpentry is made of aluminum with 6 mm single glass without a thermal break bridge. The interior partitions are made with brick partition plastered on both sides. The main roof of the building is curved tile, gabled, non-passable. The pavements are mainly terrazzo. The coverings are ceramic cladding in toilets, plaster, and painted plaster.
The thermal behavior of the building elements was obtained by observing interventions carried out after the execution of the building, for example opening gaps in the façade wall for emergency exits and consulted in technical literature [65,66]. The thermal characteristics of the building envelope elements are shown in Table 2.

2.3.2. Description of the Building Facilities

The production of cold for air conditioning is carried out by means of two chillers per direct expansion floor with ducts.
Regarding heat generation, to supply hot water for air conditioning, boilers are used, fed with natural gas. The boilers are located in the thermal power station of the University Hospital of Jaén, and supply a series of water radiators situated along the perimeter area of the building.
The production of sanitary hot water (DHW) is carried out with hot water boilers fed with natural gas, located in the H.U.J.
The luminaires in the building are mostly fluorescent lamps. It does not have control elements for interior lighting or daylight [67].
The description of the building technical equipment can see in Table 3.

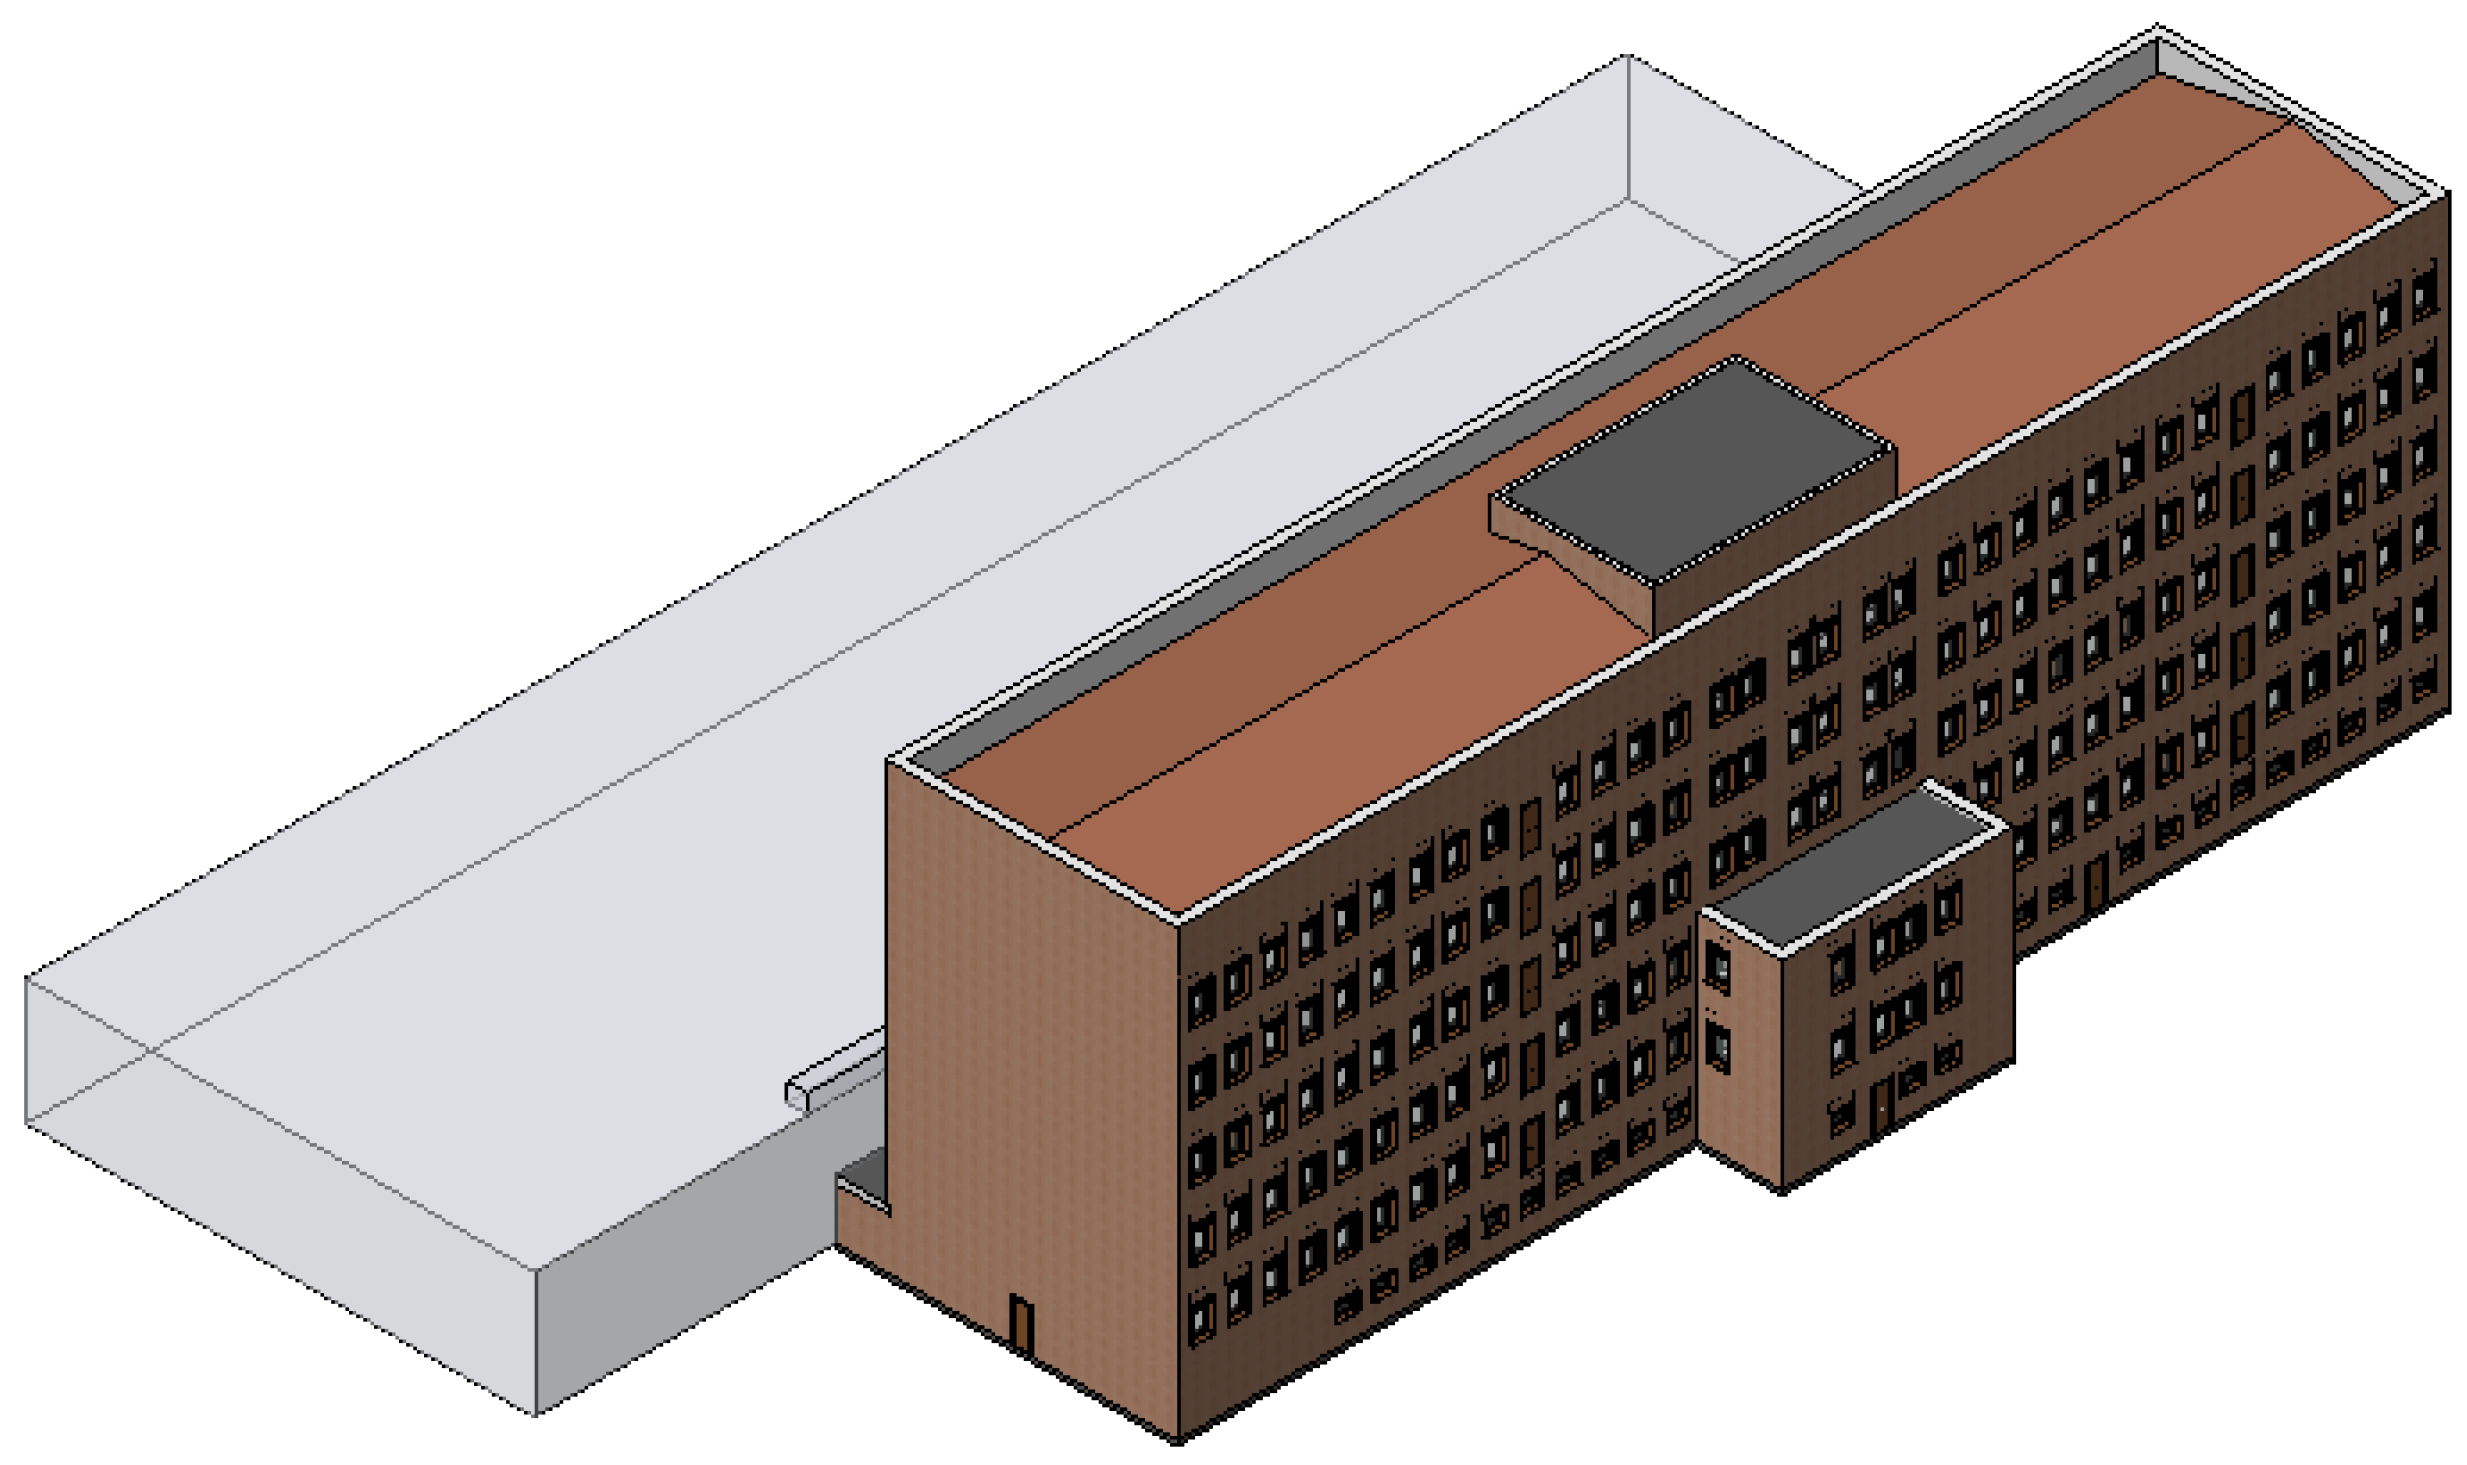
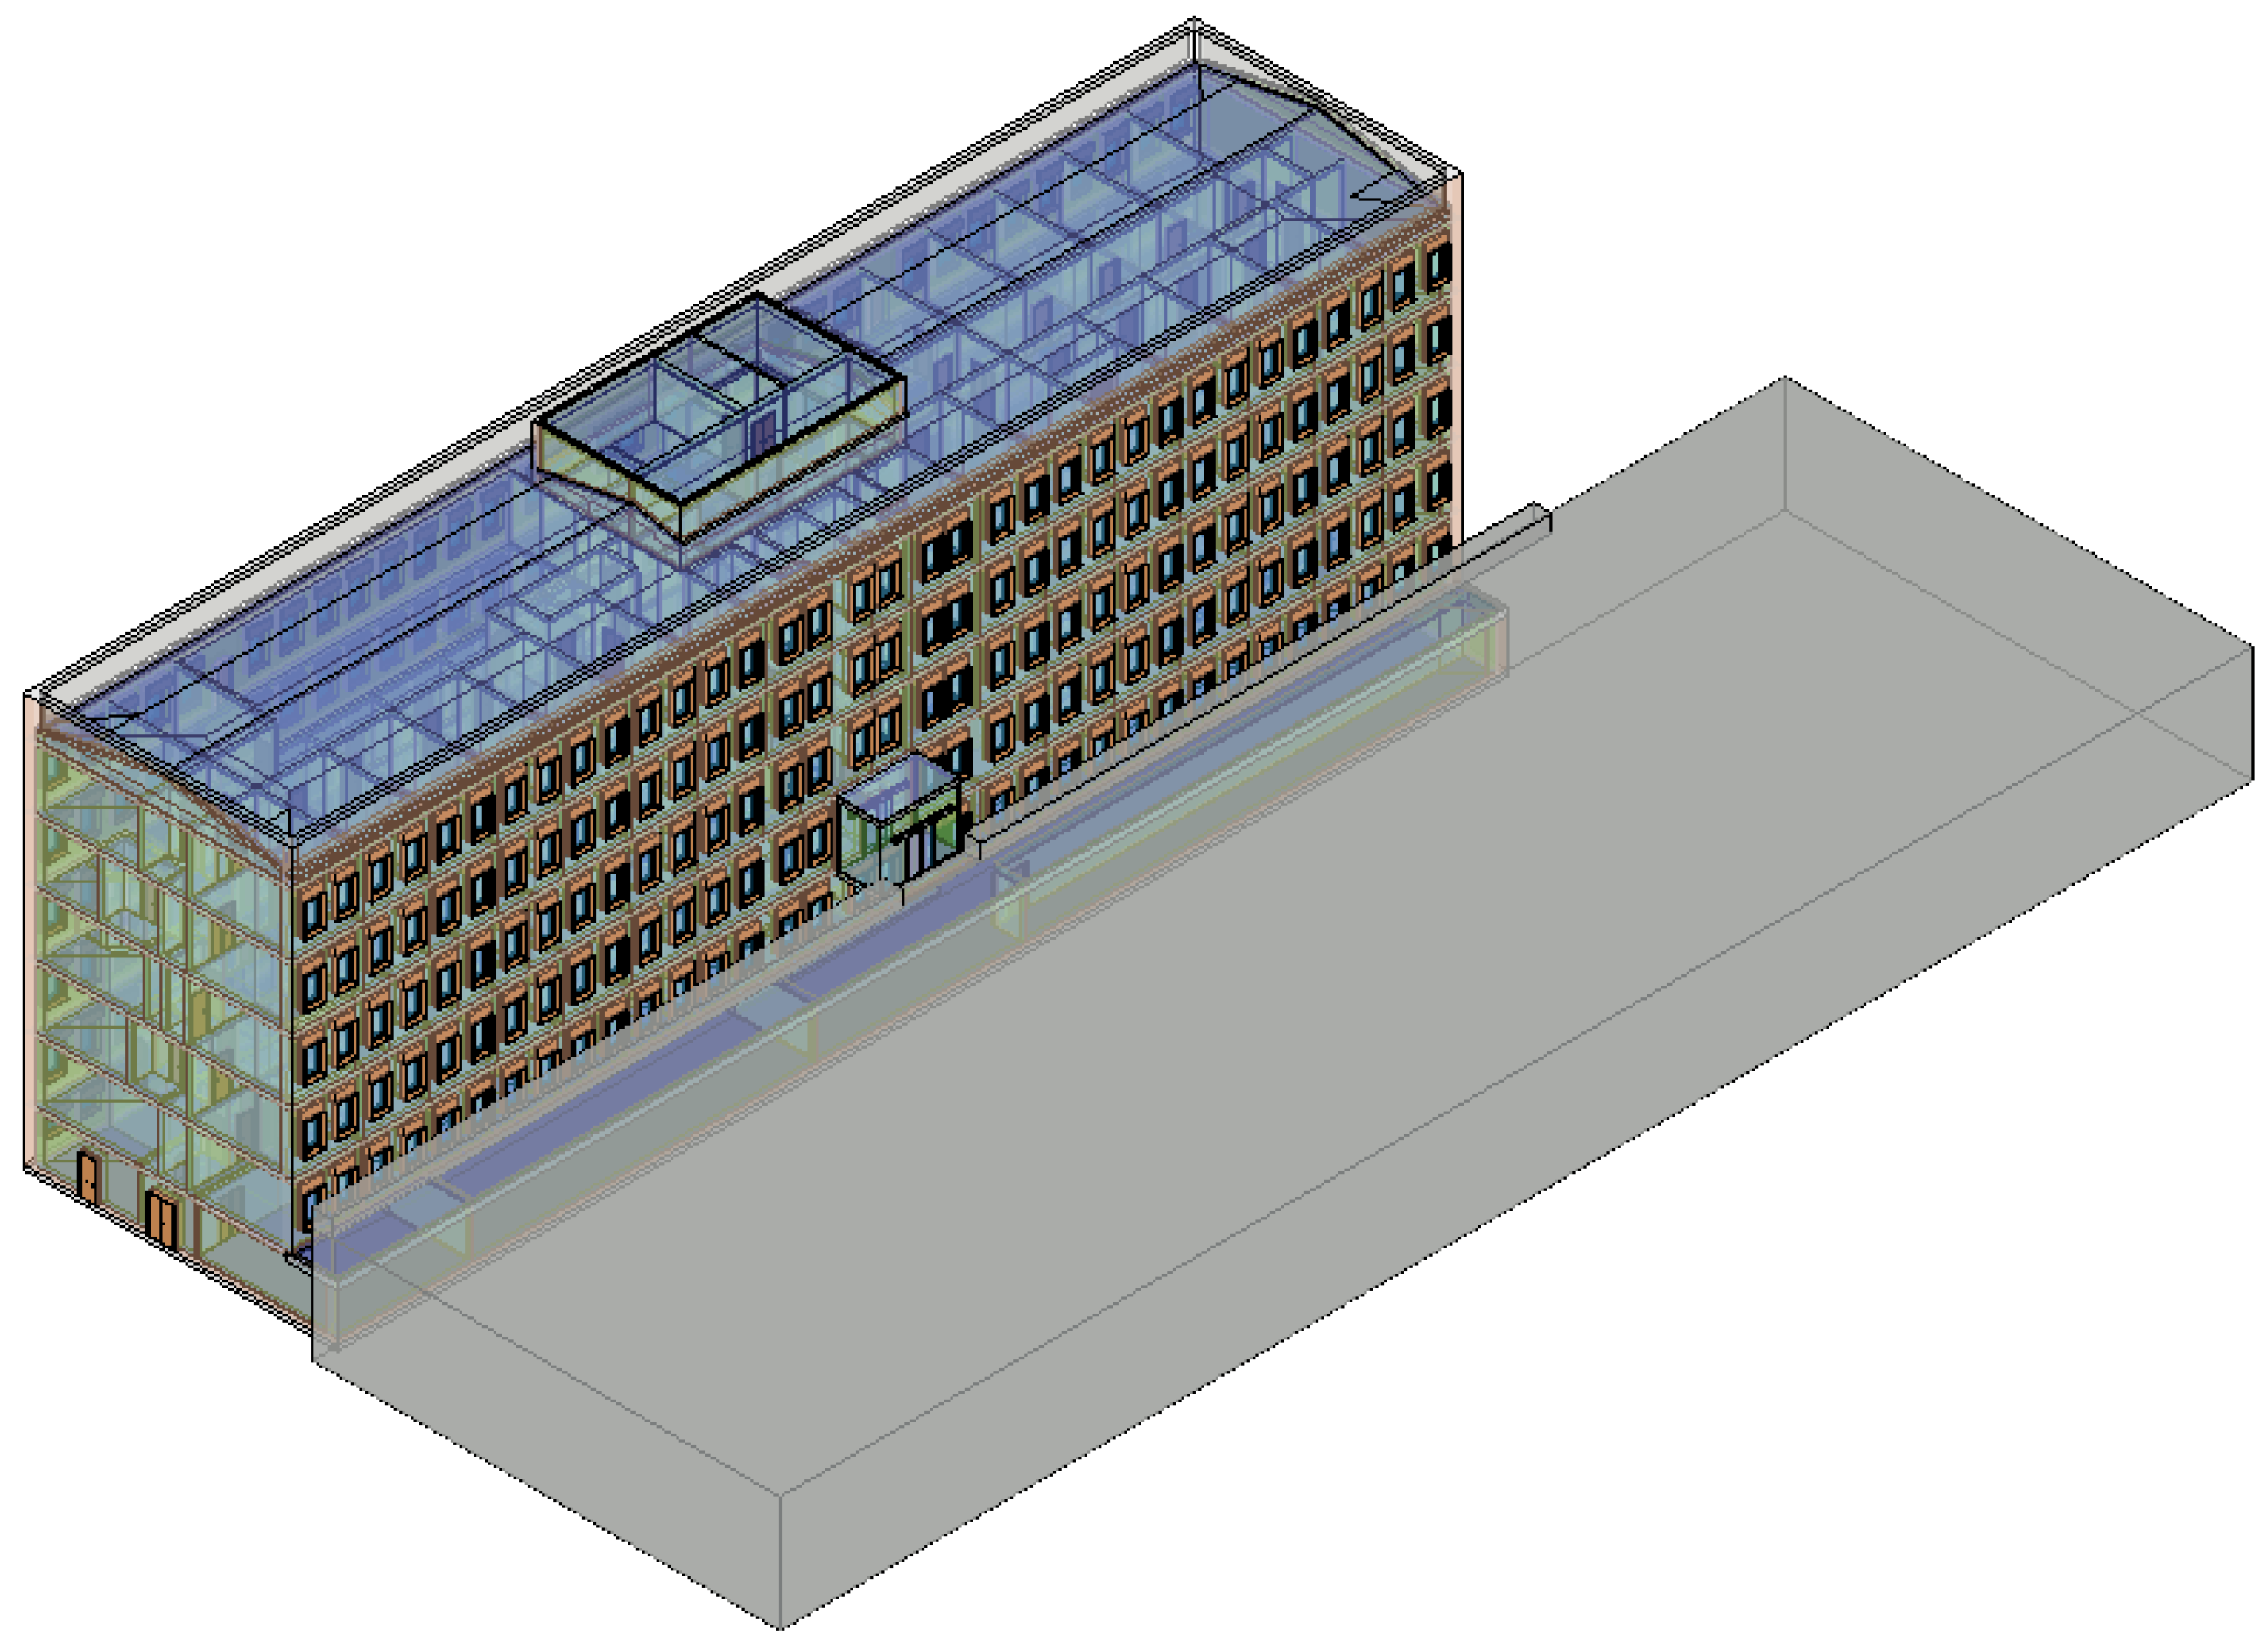
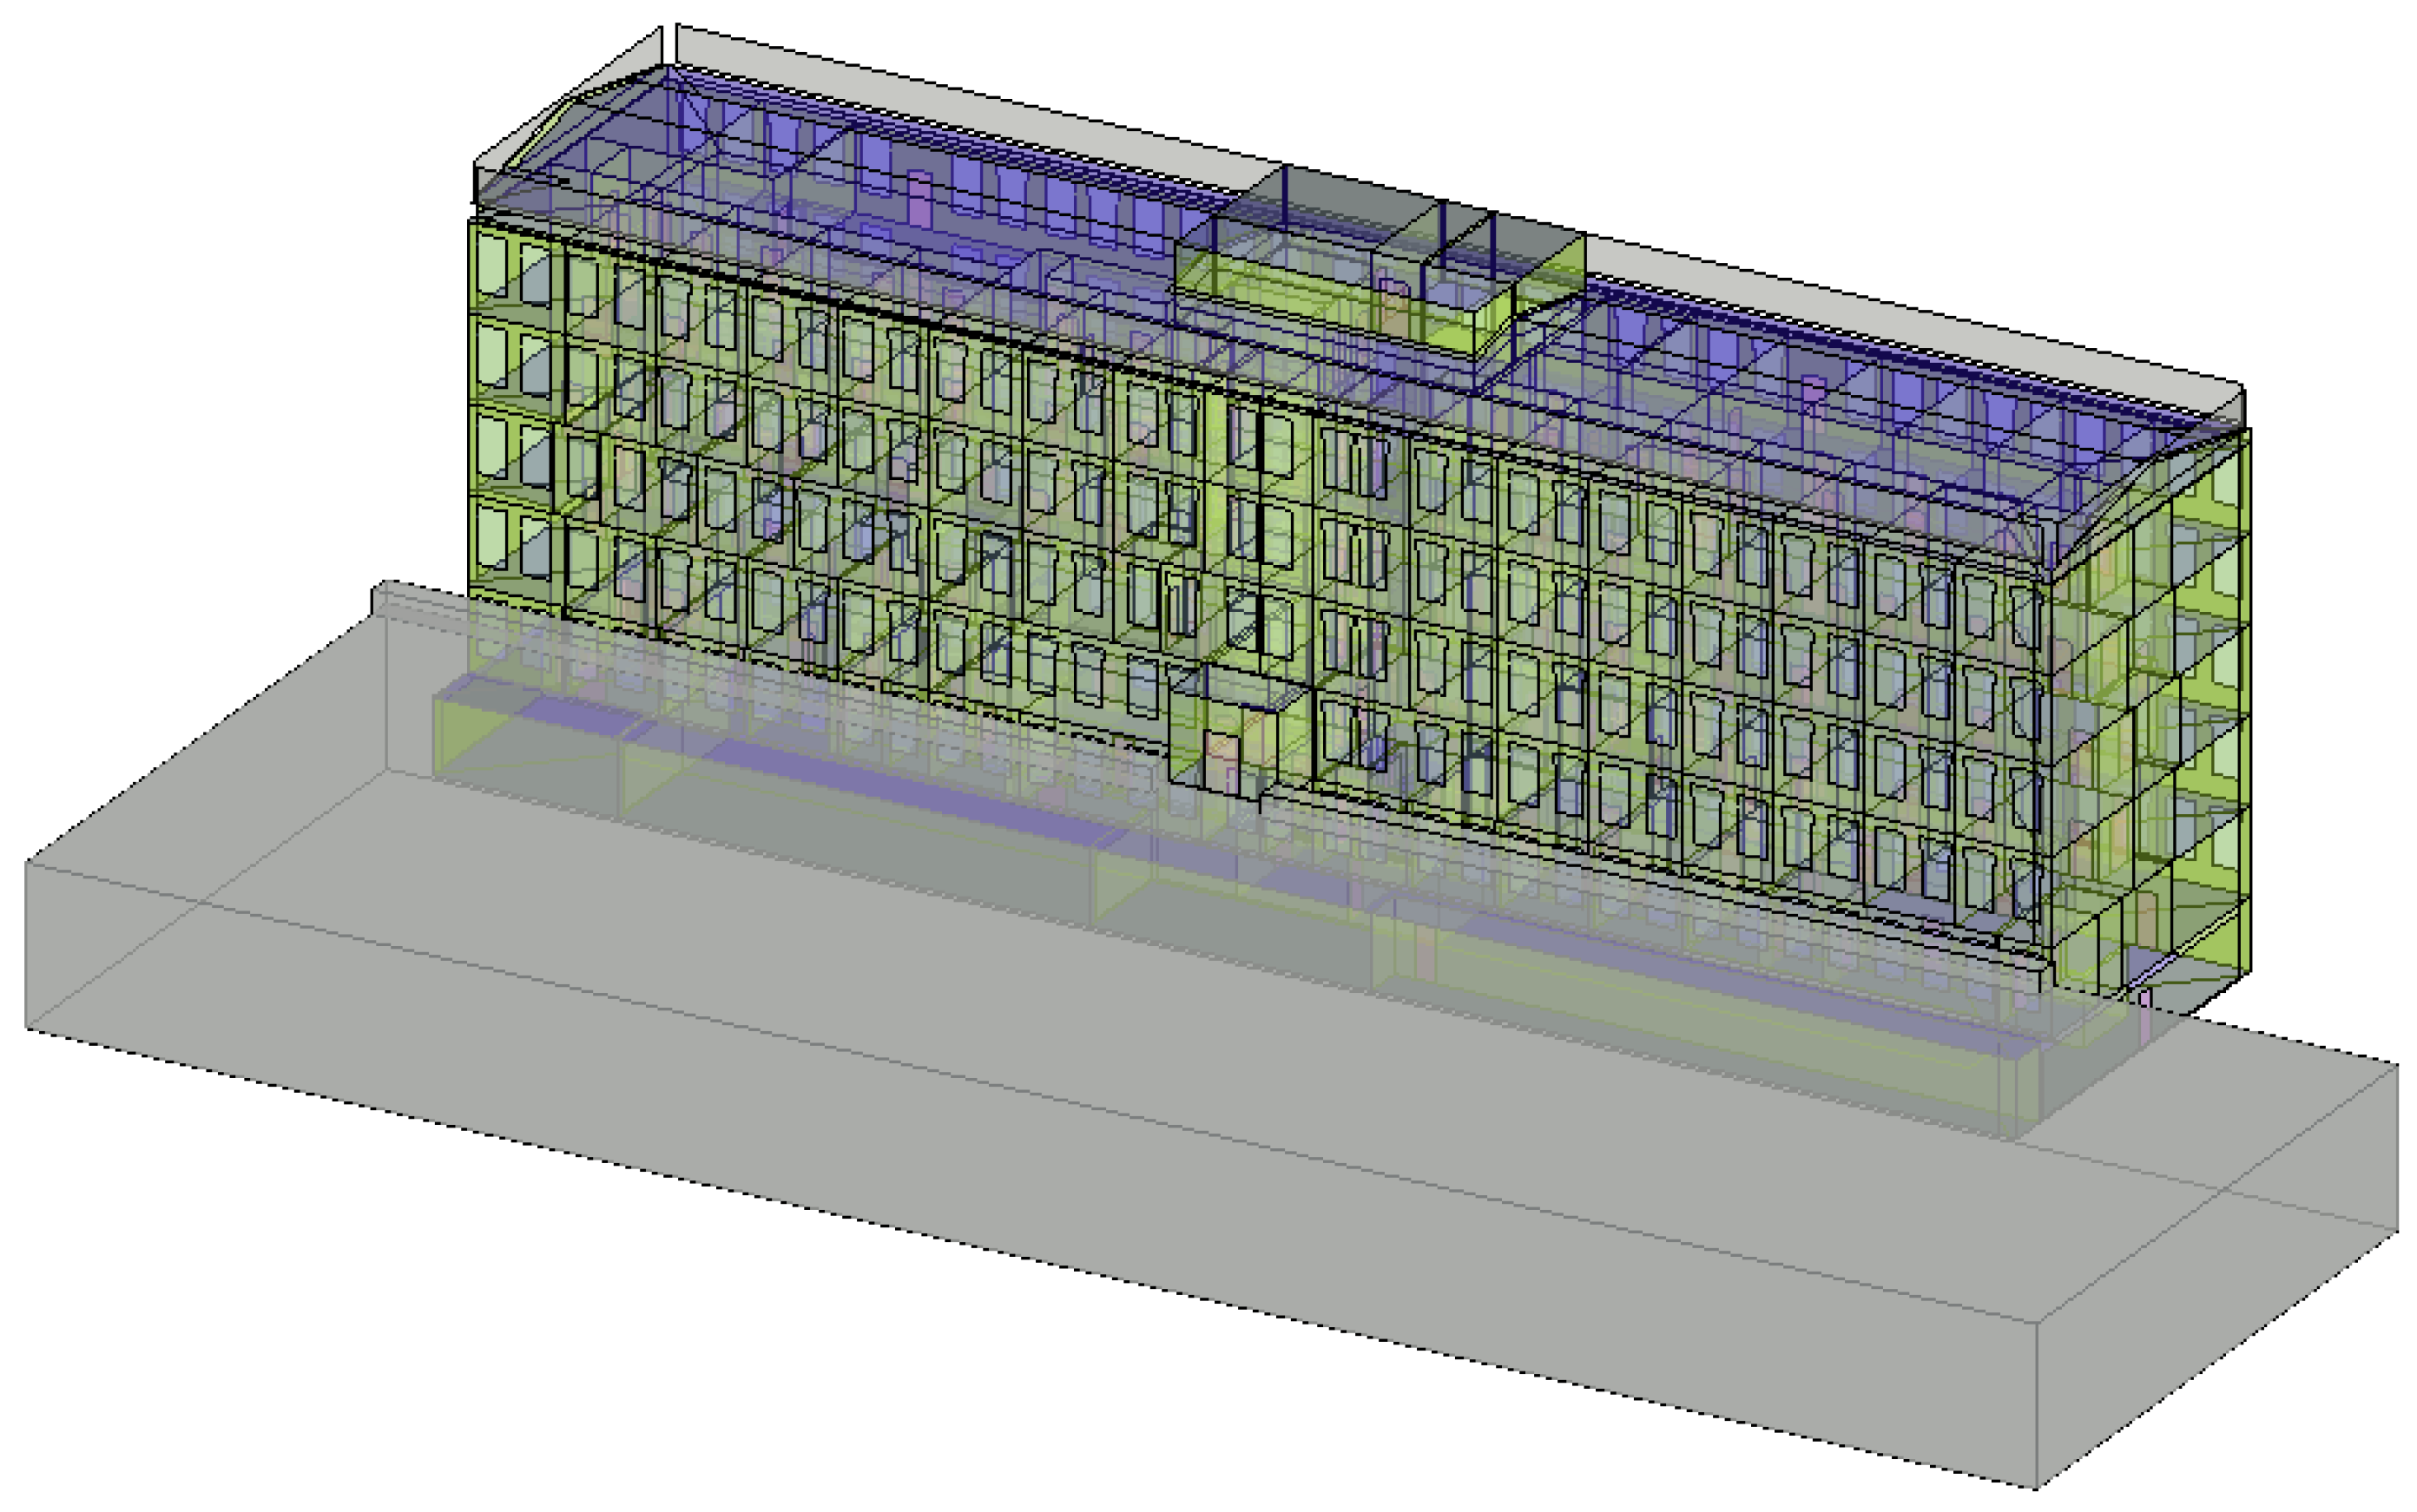
2.3.3. Building Definition in BIM for Energy Simulation

In this section, it is necessary to define all the data required to carry out the energy simulation of the health center with the BIM software. Said data are those referring to the geometry, spaces, thermal envelope, climate, geographic location, and operational and occupational characteristics of the spaces, as well as the definition of the building’s systems and facilities and the assignment of said systems and facilities to the corresponding spaces [68].
First, the building plans were used in “dxf” [57] format, which served as a template for the construction of the building’s geometry and BIM architecture using the REVIT program. Once the architectural model was obtained, the materials of the thermal envelope of the building, the operational and occupational characteristics of all the spaces were configured to obtain the energy model, also with the REVIT software [57].

2.3.4. Architectural Model of the Building

Figure 2 shows the BIM architectural model of the health center, which consists of 226 spaces, with 354 windows and 242 doors.

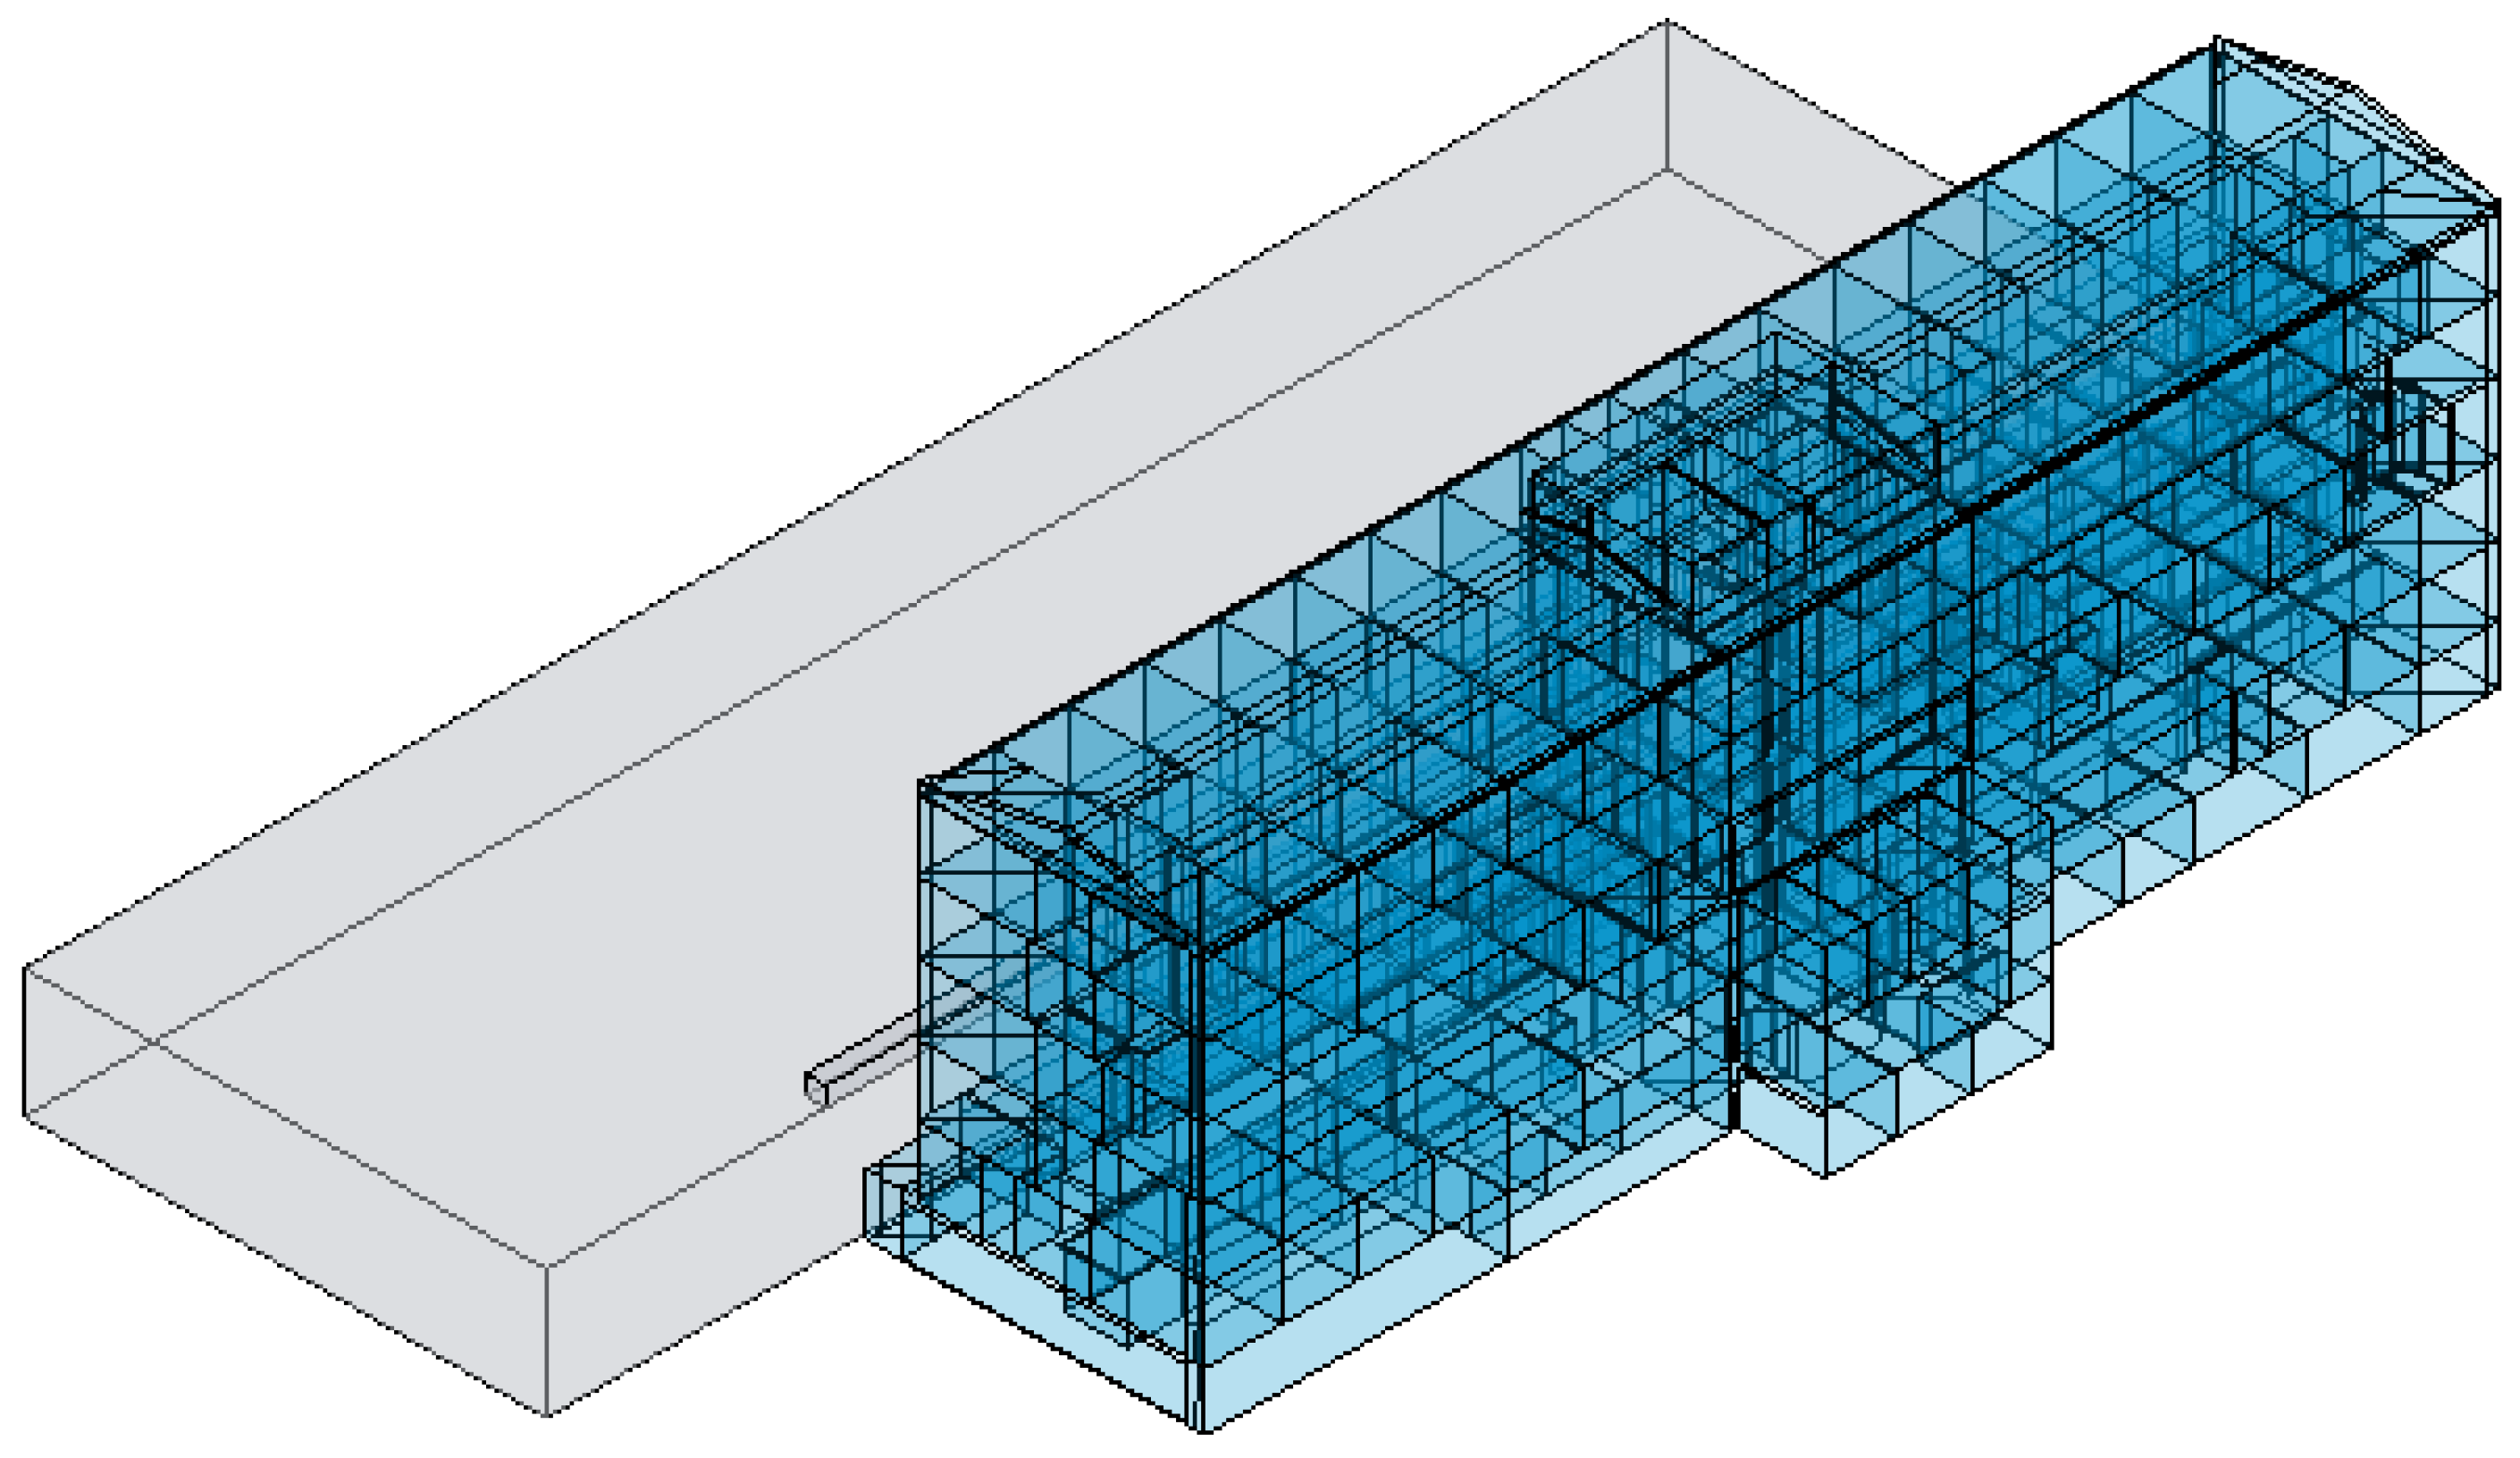
2.3.5. Building Energy Model (BEM)

With the architectural model and also using the REVIT software, the energy model of the building was obtained, where the air conditioning system was defined, and the energy configuration of the building was carried out, and its occupational characteristics assigned. Subsequently, the simulation and energy analysis were performed with the REVIT add-on, INSIGHT int the cloud. Finally, the visualization and interaction with the results obtained on this platform were analyzed through diagrams and performance diagrams directly in a virtual model. Figure 3, Figure 4 and Figure 5 [58].

2.4. Limits of the Study

At this point, it should be noted that this study on energy simulation of buildings using a BIM model, while offering interesting results and ideas, is a simulation study and has the typical limitations of this type of study, among which, in our case, are the following:
  • Uncertainty regarding the results due to lack of measurement verification, as it is an old building that does not have appropriate counters that allow having real data;
  • The characteristics of the thermal envelope also present some uncertainty, since they have been determined by observation, thickness measurement, and consultation in technical literature, not performing thermal transmittance measurements using specialized equipment;
  • The thermal properties of the windows should be selected from a list of predefined windows in the software used. It should be noted that this list is quite numerous, so it is easy to find windows with similar characteristics to those of the existing building;
  • To carry out the energy simulation, the HVAC systems available in the simulation software closest to the real ones of the building were used. Since the software used, when selecting HVAC systems, has a predefined list of systems that the user must adjust and cannot modify;
  • To define the operational, occupational, and internal load characteristics of the spaces of the BIM model, first, distinguishing between air-conditioned and non-air-conditioned spaces was done. Second, due to the large number (226) of airconditioned spaces, three types of use have been identified: welfare, administrative, and common areas;
  • The software used does not consider thermal bridges;
  • The proposals for energy efficiency improvement must be selected from a list that is predefined in the performance diagrams for each of the factors analyzed by the simulation software used.

3. Results

First, the results obtained from the energy simulation of the Hospital Center with the BIM software tool are presented [52,57].
Subsequently, the behavior of the building from the energy and environmental point of view will also be optimized, also from the BIM software platform, studying the different possible improvement alternatives for the building studied in the discussion of the results section [69].

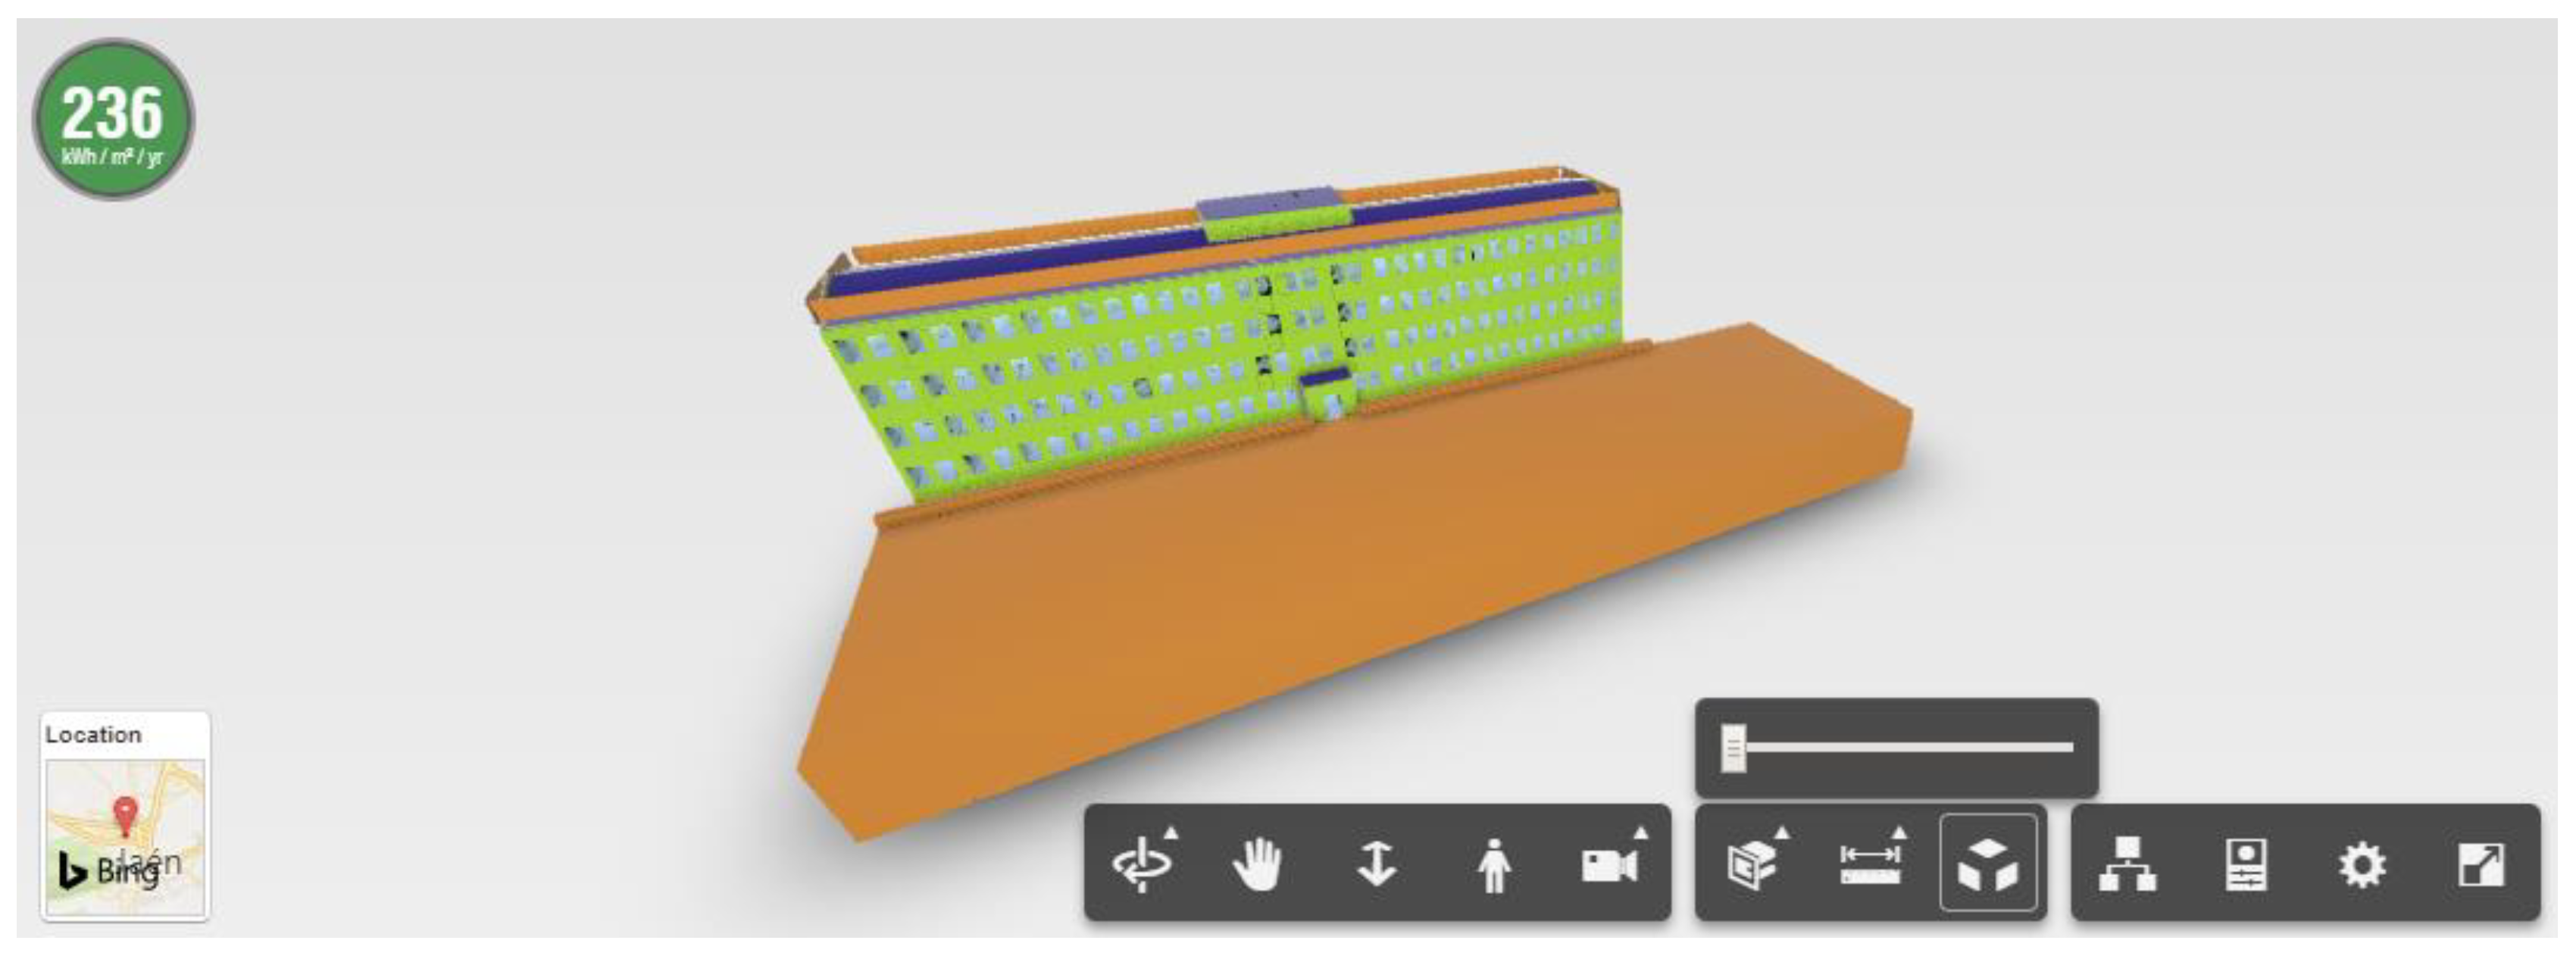
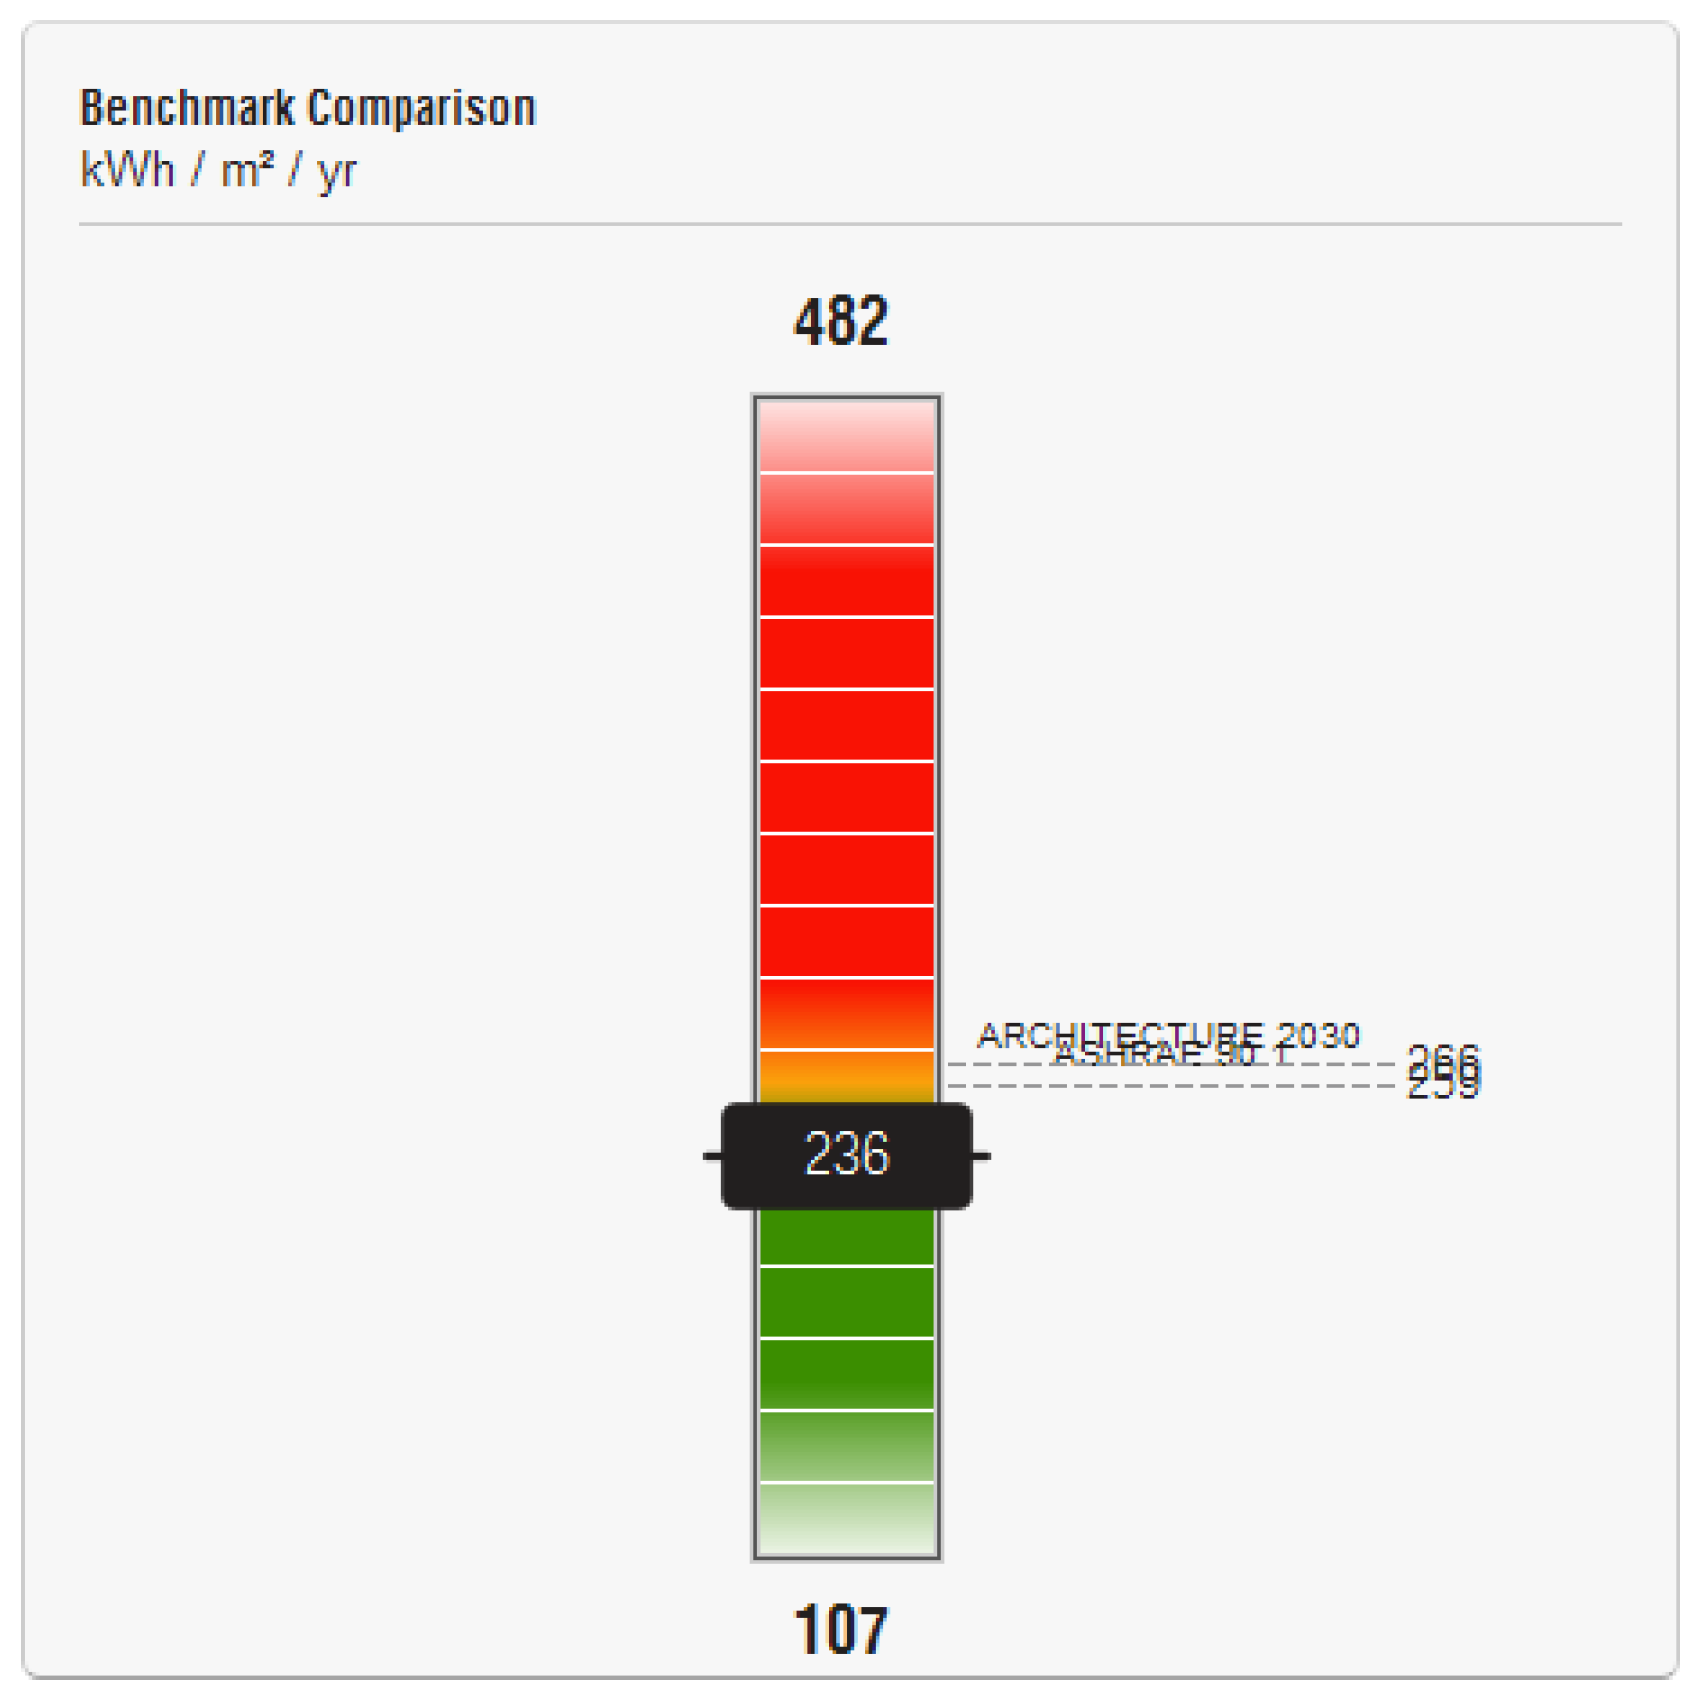
3.1. Result Obtained in the Energy Simulation for All Possible Cases of the Building

As can be seen in Figure 6 and Figure 7, of the cases analyzed for our building, we obtained:
  • Maximum consumption: 482 kWh/(m2 year);
  • Average consumption: 236 kWh/(m2 year);
  • Minimum consumption: 107 kWh/(m2 year).
At this point, it should be said that BIM software used, with the data from our building modeled in BIM, performs the simulation combining all the analysis factors of point 3.2, where each has a series of predefined values. It shows the results identifying three situations: the worst possible case, the average of all cases, and the best possible case. Since the software can be used for both new or existing buildings, it analyzes all the possibilities available. However, in point 3.3, the result was specifically adjusted to our BIM model that corresponded to the existing building.

3.2. Factors Analyzed in the Energy Simulation

In the energy simulation platform of the BIM software used, the visualization and interaction with the results obtained through diagrams and performance diagrams directly in a virtual model was analyzed. The factors analyzed in the energy simulation are the following:
  • Efficiency of air conditioning systems;
  • Energy efficiency of lighting;
  • Electrical power of the rest of the equipment installed in the building;
  • Thermal properties of windows and Shades on windows (N-S-E-W);
  • Thermal properties of the materials that make up the façade;
  • Thermal properties of the materials that make up the roof;
  • Infiltration;
  • Lighting control (occupancy and daylighting);
  • Planning of the occupation and operation of the building;
  • Photovoltaic solar energy (covered area, return on investment, the energy efficiency of the panels;
  • Building orientation and window ratio to the wall (N-S-E-W).

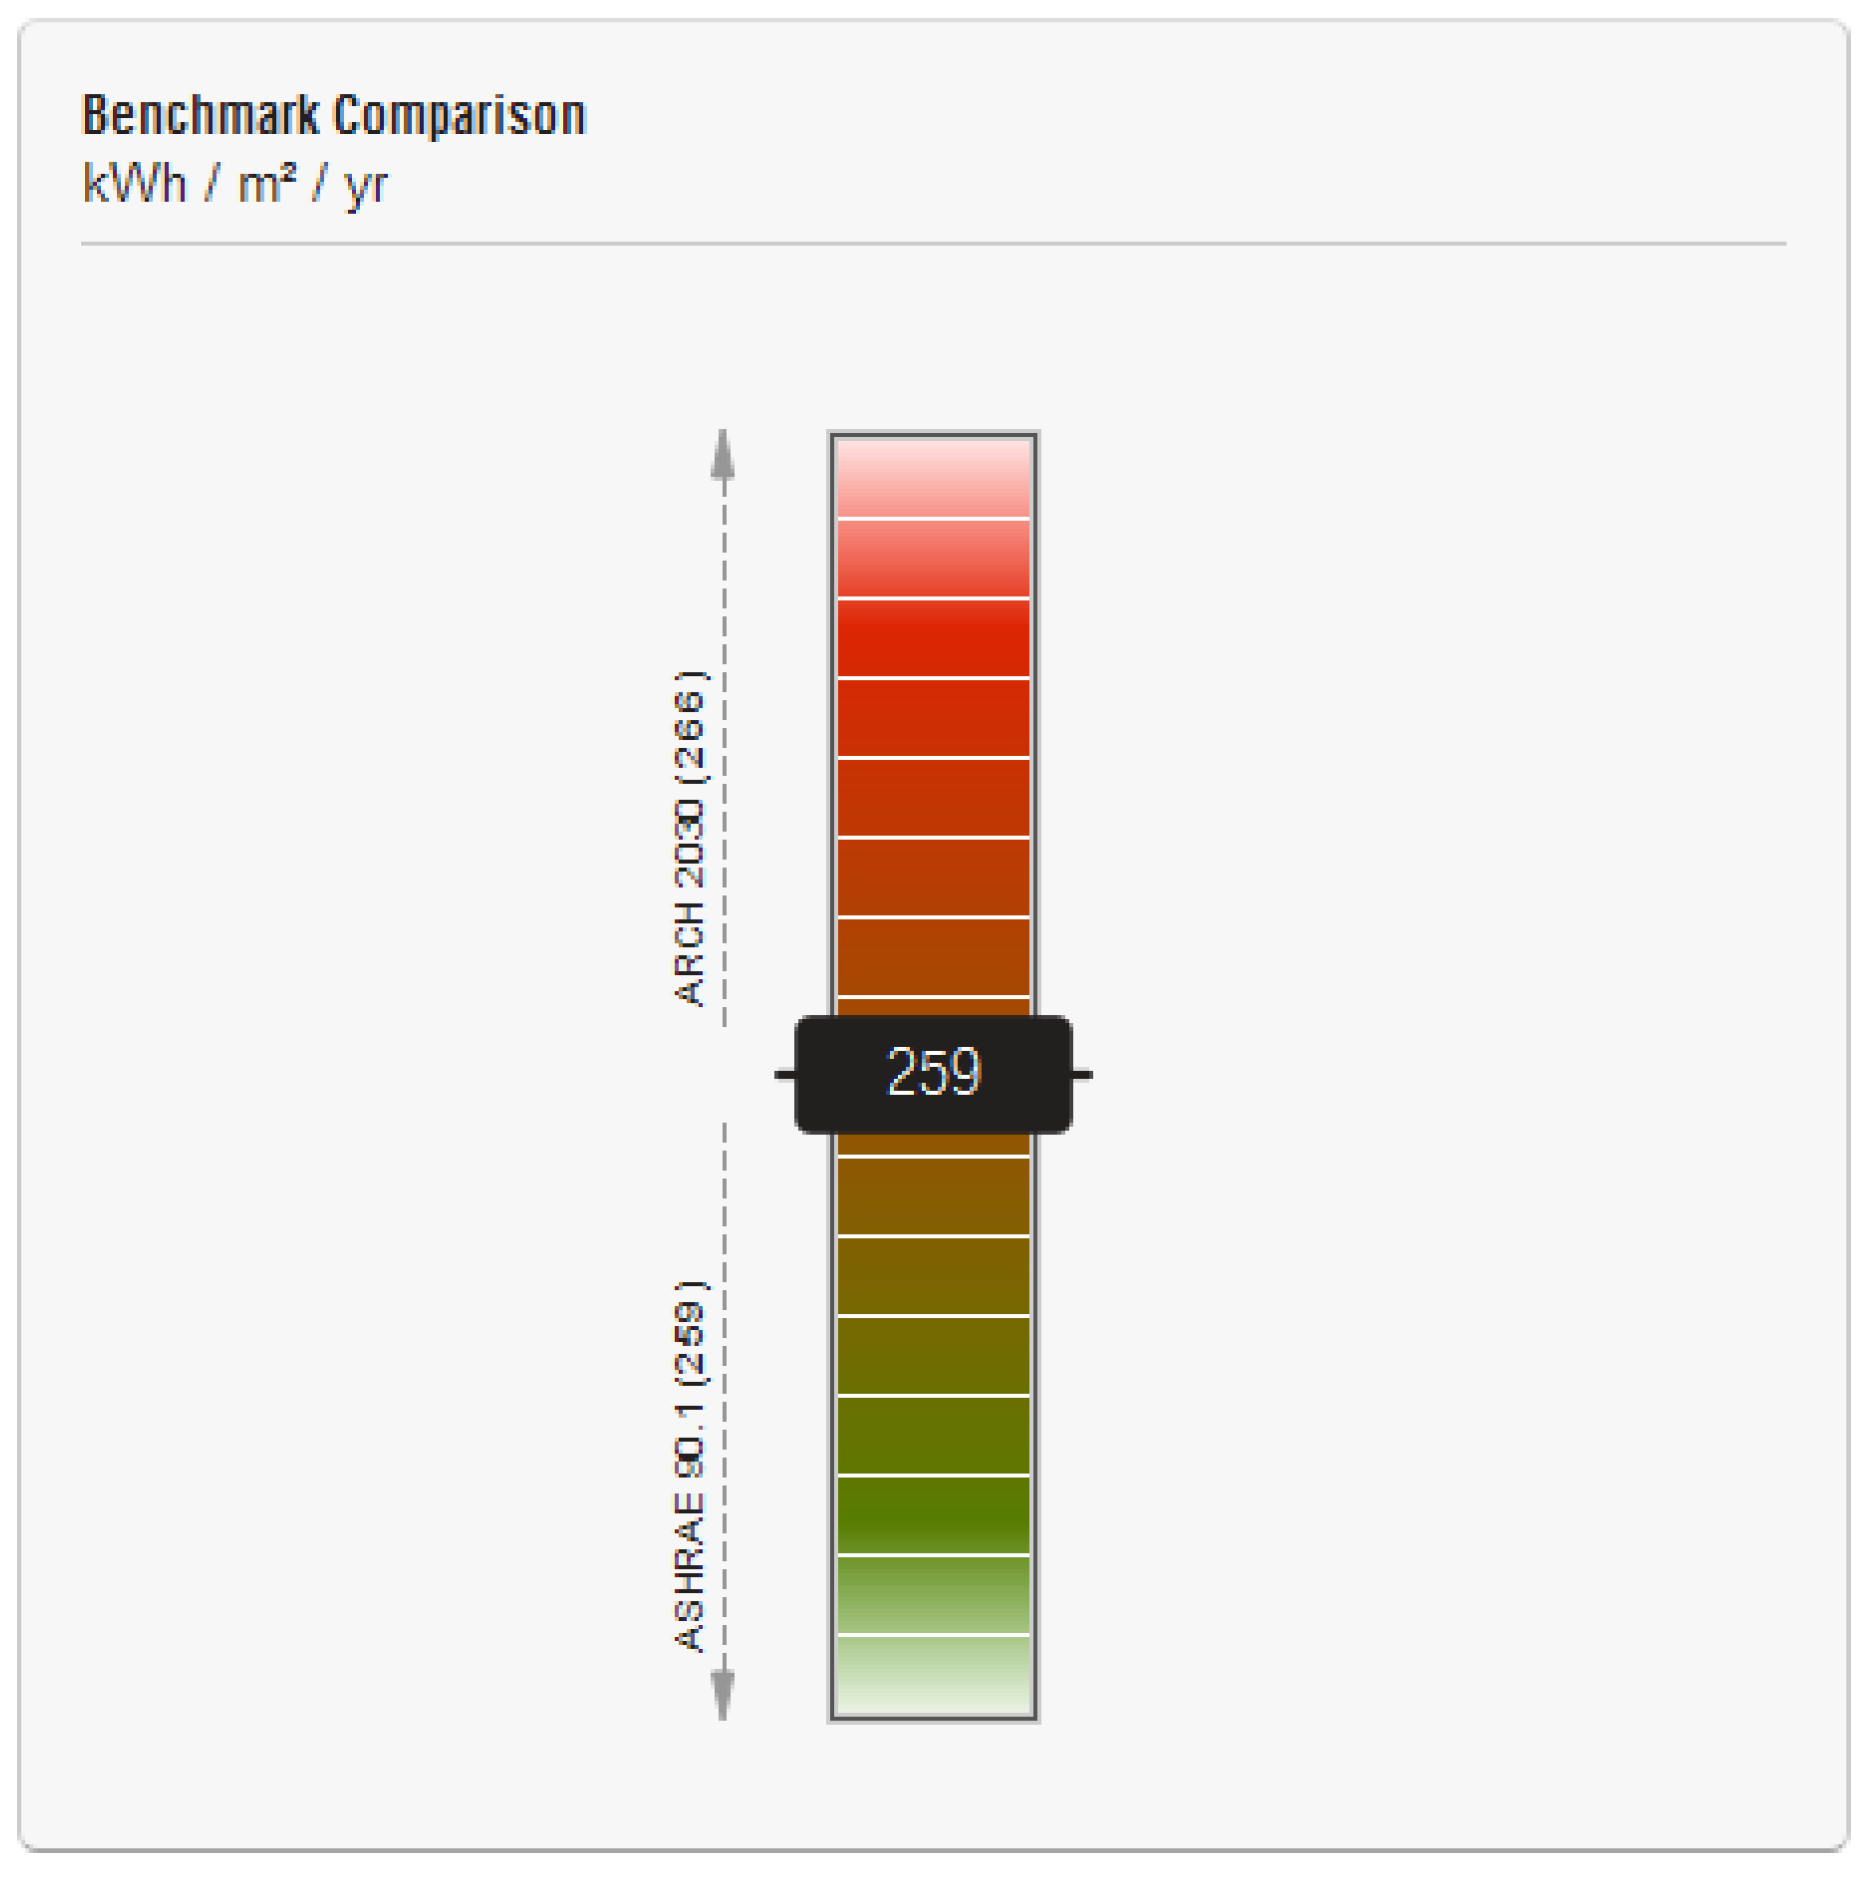
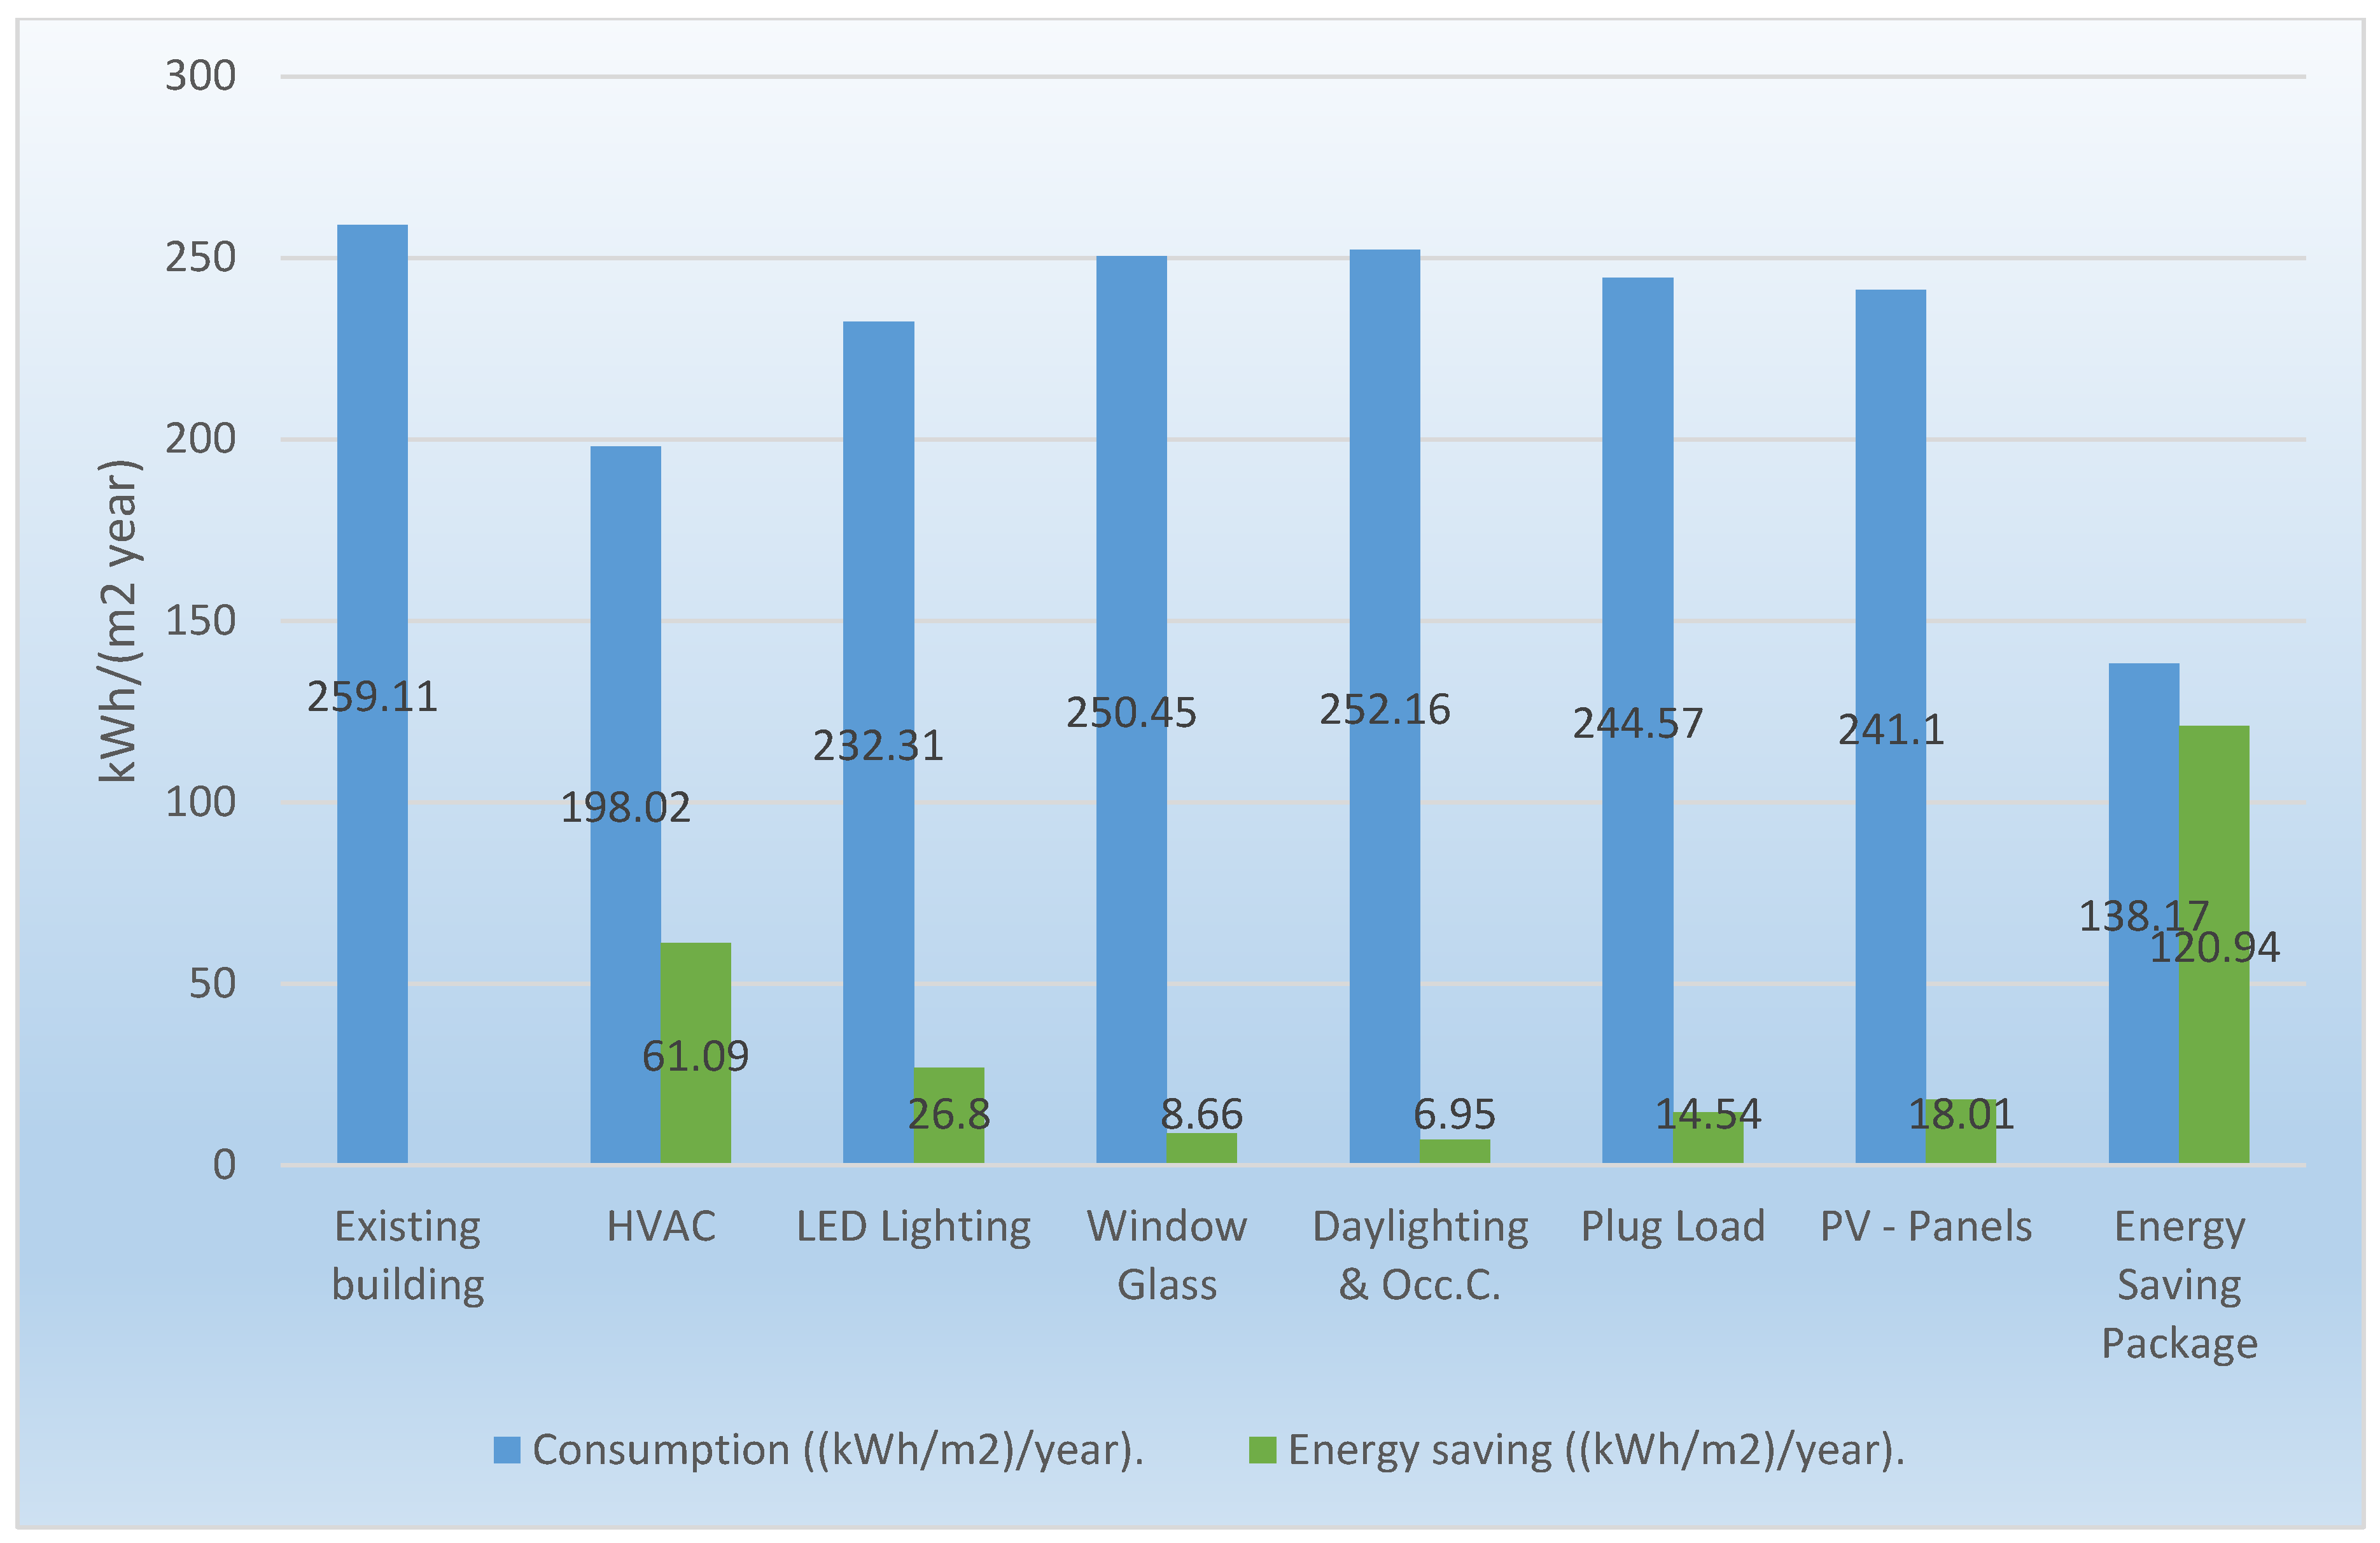
3.3. Result Adjusted to the BIM Model of Our Existing Building

Adjusting the study factors in our BIM model to the real ones of the existing building, the result obtained in the energy simulation is as follows:
In the case of a new building, it would be possible to analyze all the factors available in the simulation software, until finding the most sustainable solution before constructing the building. However, in our case, since it is an existing building, the analysis factors habe been adjusted to the actual values of the building, that is, to those defined in the BIM model of the building, as indicated in Section 3.1. and which coincides with the situation of the triangle in the performance diagrams (see Figure 9a). From the INSIGHT sample, this configuration was used in which the values of the analysis factors were modified to obtain the energy improvements for the buildingIn this case, we are going to study and discuss the different improvement alternatives.

4. Discussion

Next, we will propose, by way of discussion, different improvement options, to analyze them individually and jointly, using the methodological tool explained above.

4.1. Result of the Different Alternatives for Improving Energy Efficiency Over the Initial Situation

Based on the application of different proposals to improve energy and environmental efficiency, we obtained the following results presented in Table 4.
Table 4 shows in the second row, the energy consumption of the existing building modeled in BIM (259.11 kWh/(m2 year)). In the following rows, each of the improvements applied to the building is shown, developed below in the text. The name given to the scenario of each improvement, as well as the energy consumption of each new scenario resulting from applying this energy improvement is also shown. In the last column, the energy saved concerning the initial situation of the existing building is shown. Finally, in the last row of Table 4, the result of all the improvements, developed in the text below, is shown.
From the data entered into the BIM model, and with the result provided by the energy analysis software, certain characteristics of the building were modified, as shown in the following sections, and the energy simulator provided the new situation or scenario, the difference being the energy saved in comparison to the initial case.

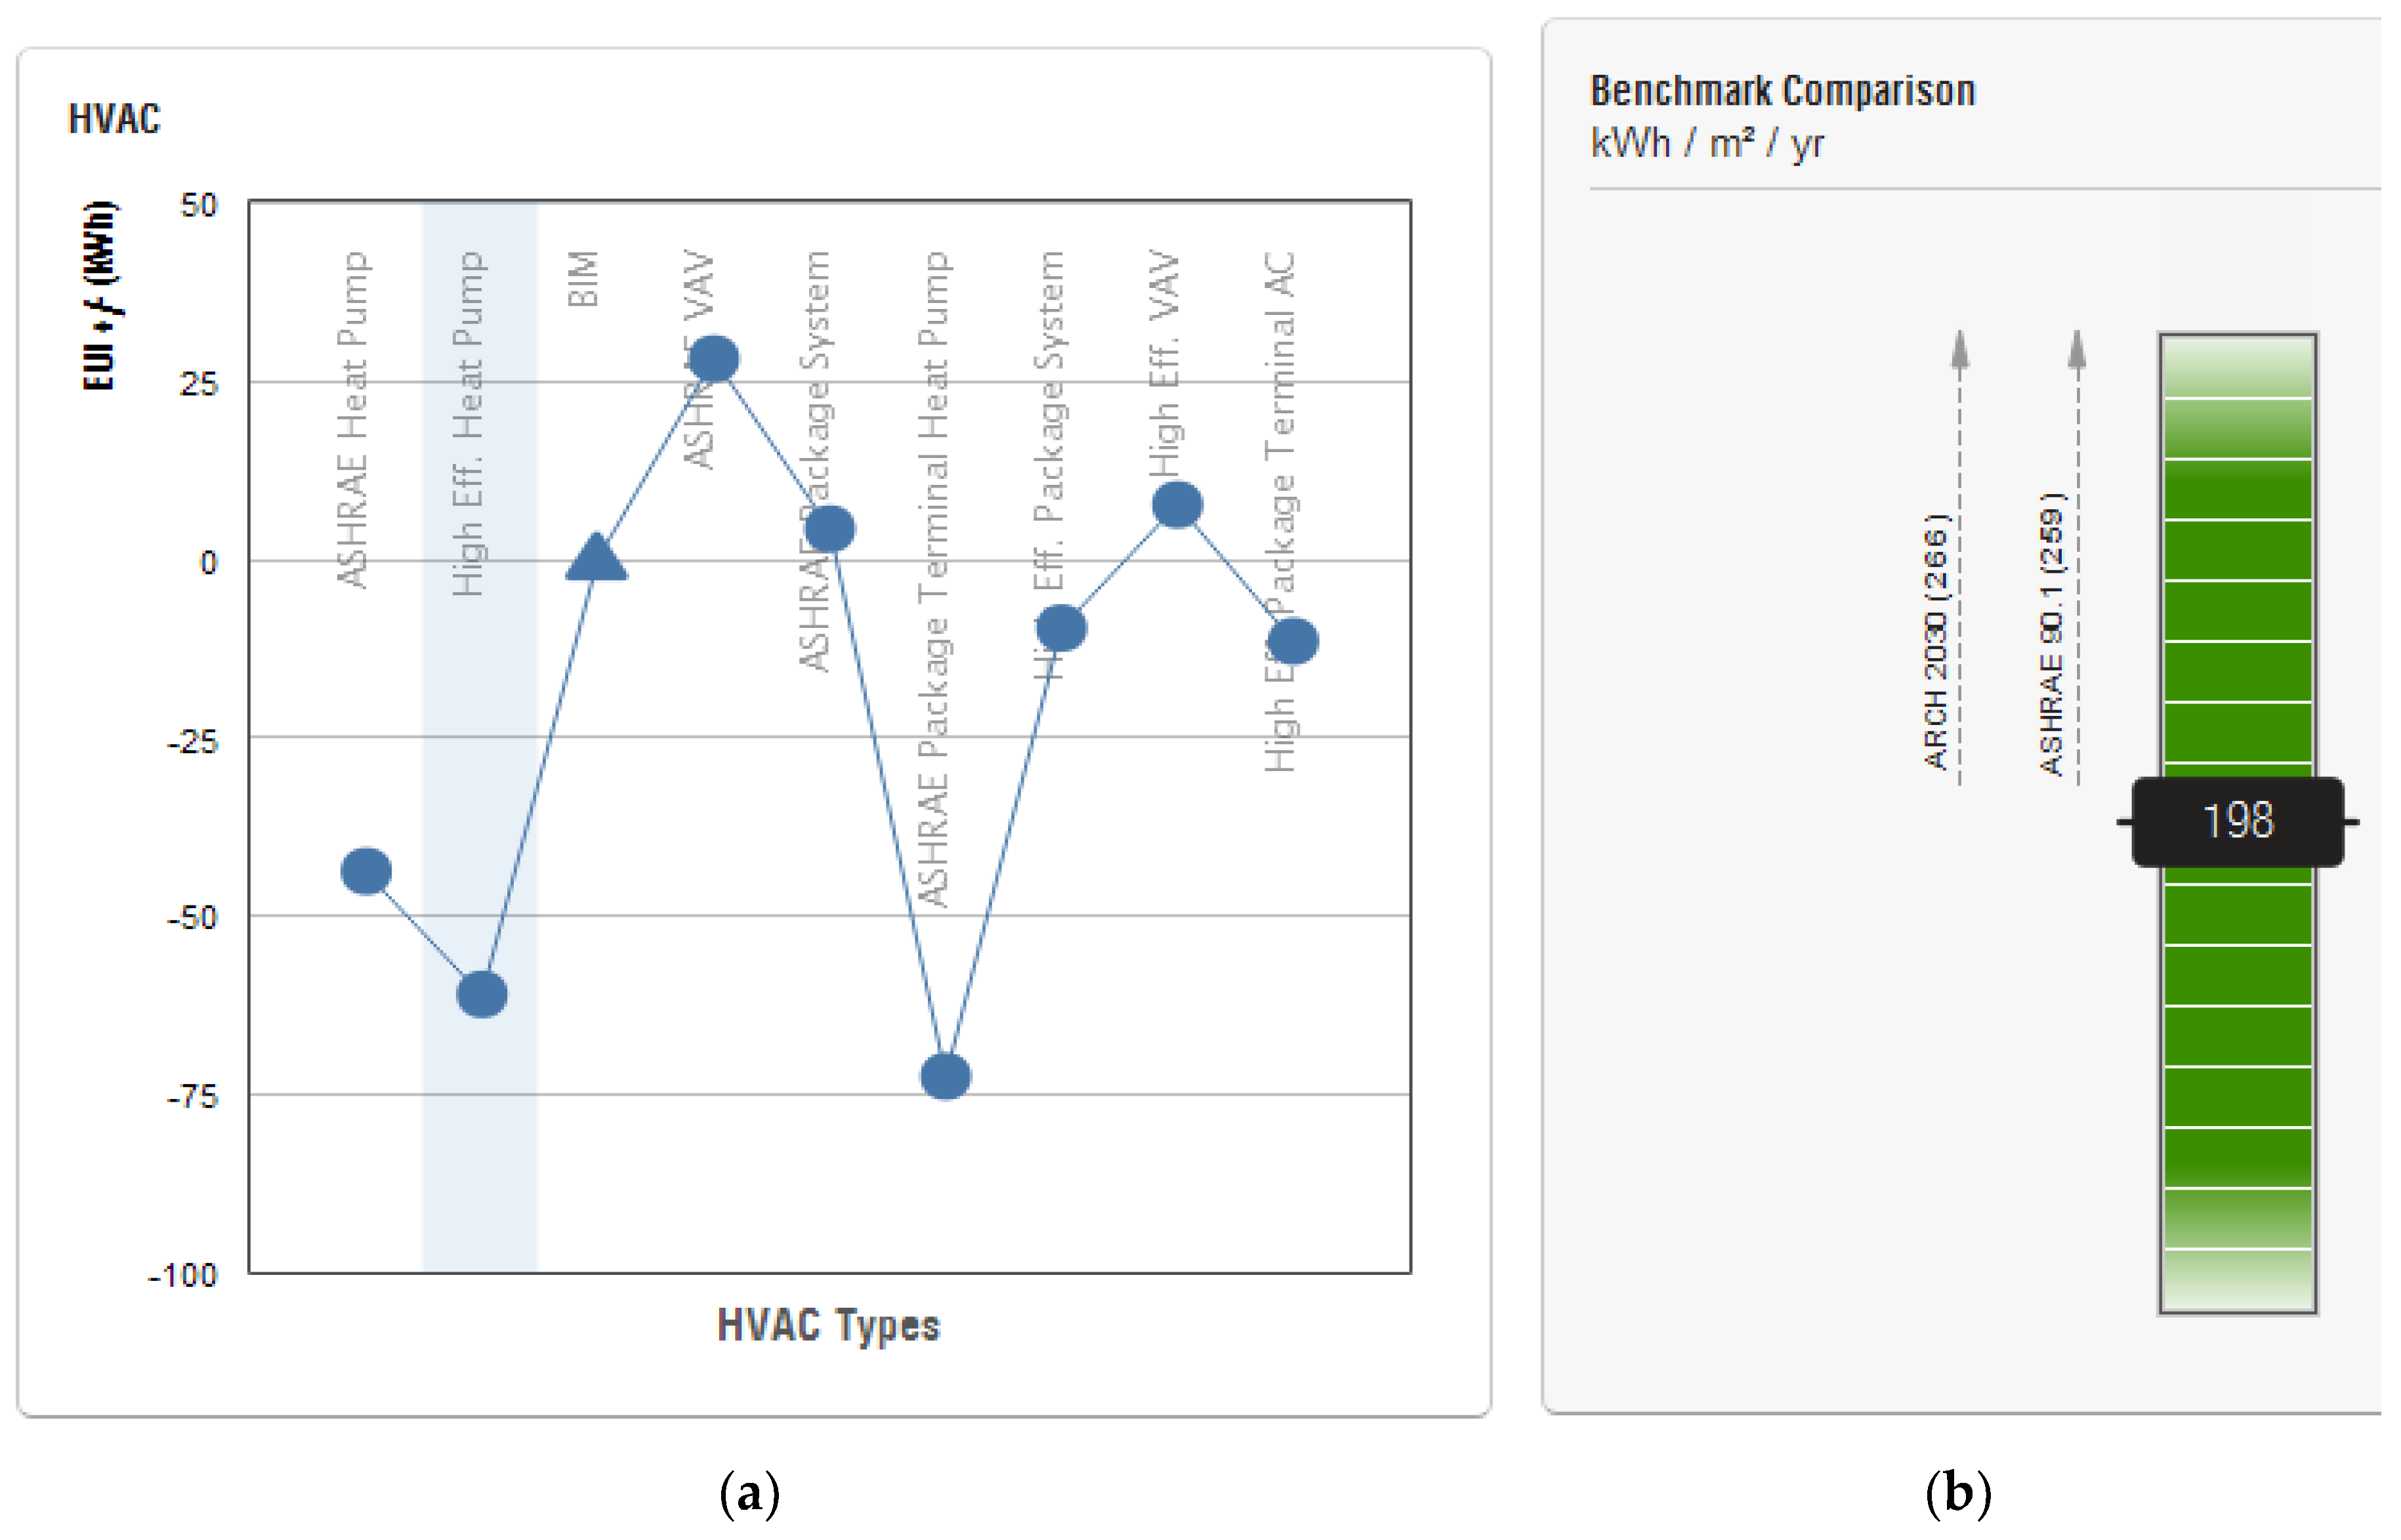
4.2. Improvement of the Building’s Air Conditioning System

This improvement consisted of replacing the current air conditioning systems of the building with a new system based on highly efficient heat pumps. The results obtained after applying the improvement in the energy simulation were (See Figure 9 and Table 4):
  • Consumption: 198.02 kWh/(m2 year);
  • Energy-saving: 61.09 kWh/(m2 year).

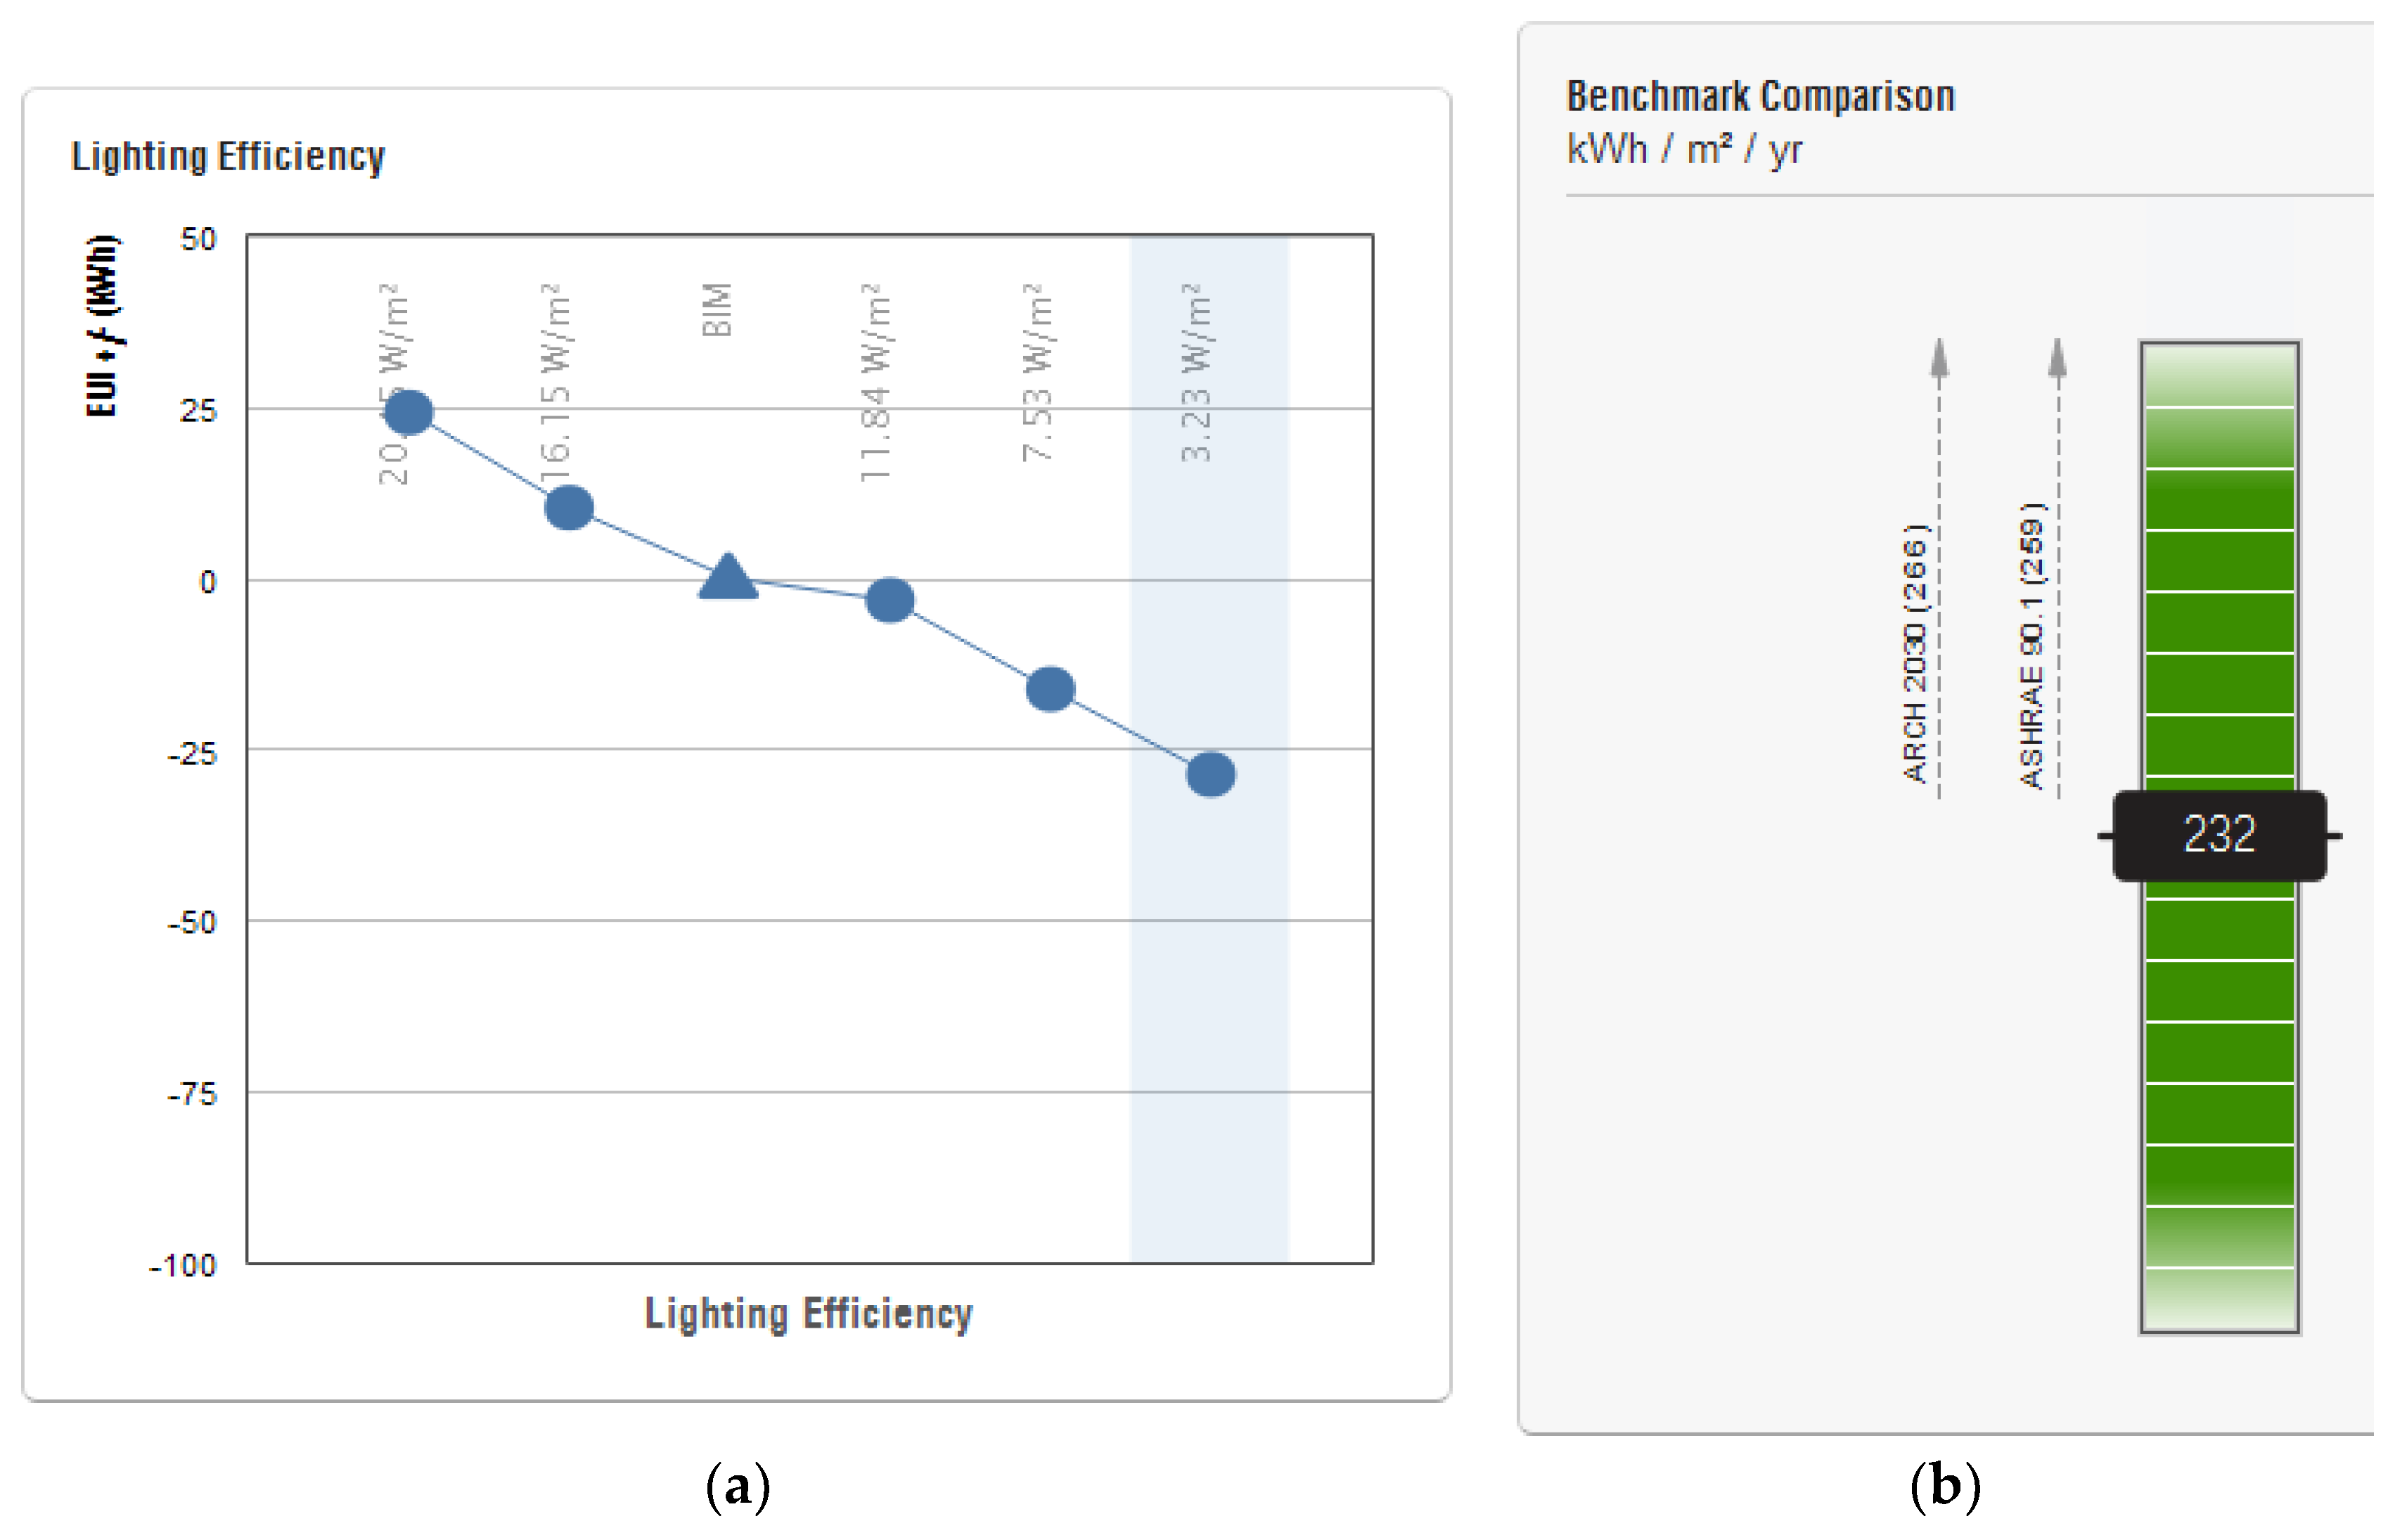
4.3. Improvement of the Building’s Lighting System. (LED Lighting System)

This improvement consisted of replacing current fluorescent-type luminaires with others with LED technology.
The results obtained after applying the improvement in the energy simulation were (See Figure 10 and Table 4):
  • Consumption: 232.31 kWh/(m2 year);
  • Energy-saving: 26.8 kWh/(m2 year).
It should be noted, that this measure achieved significant energy savings and is currently one of the installations with the shortest payback in Health Centers [70], and at the same time, allows adapting the lighting levels of the different hospital areas, as well as analyzing the use of natural light, as will be seen in Section 4.5. of this paper. On the other hand, it is worth noting that, normally, its installation is usually quick and does not require hospital activity to cease.

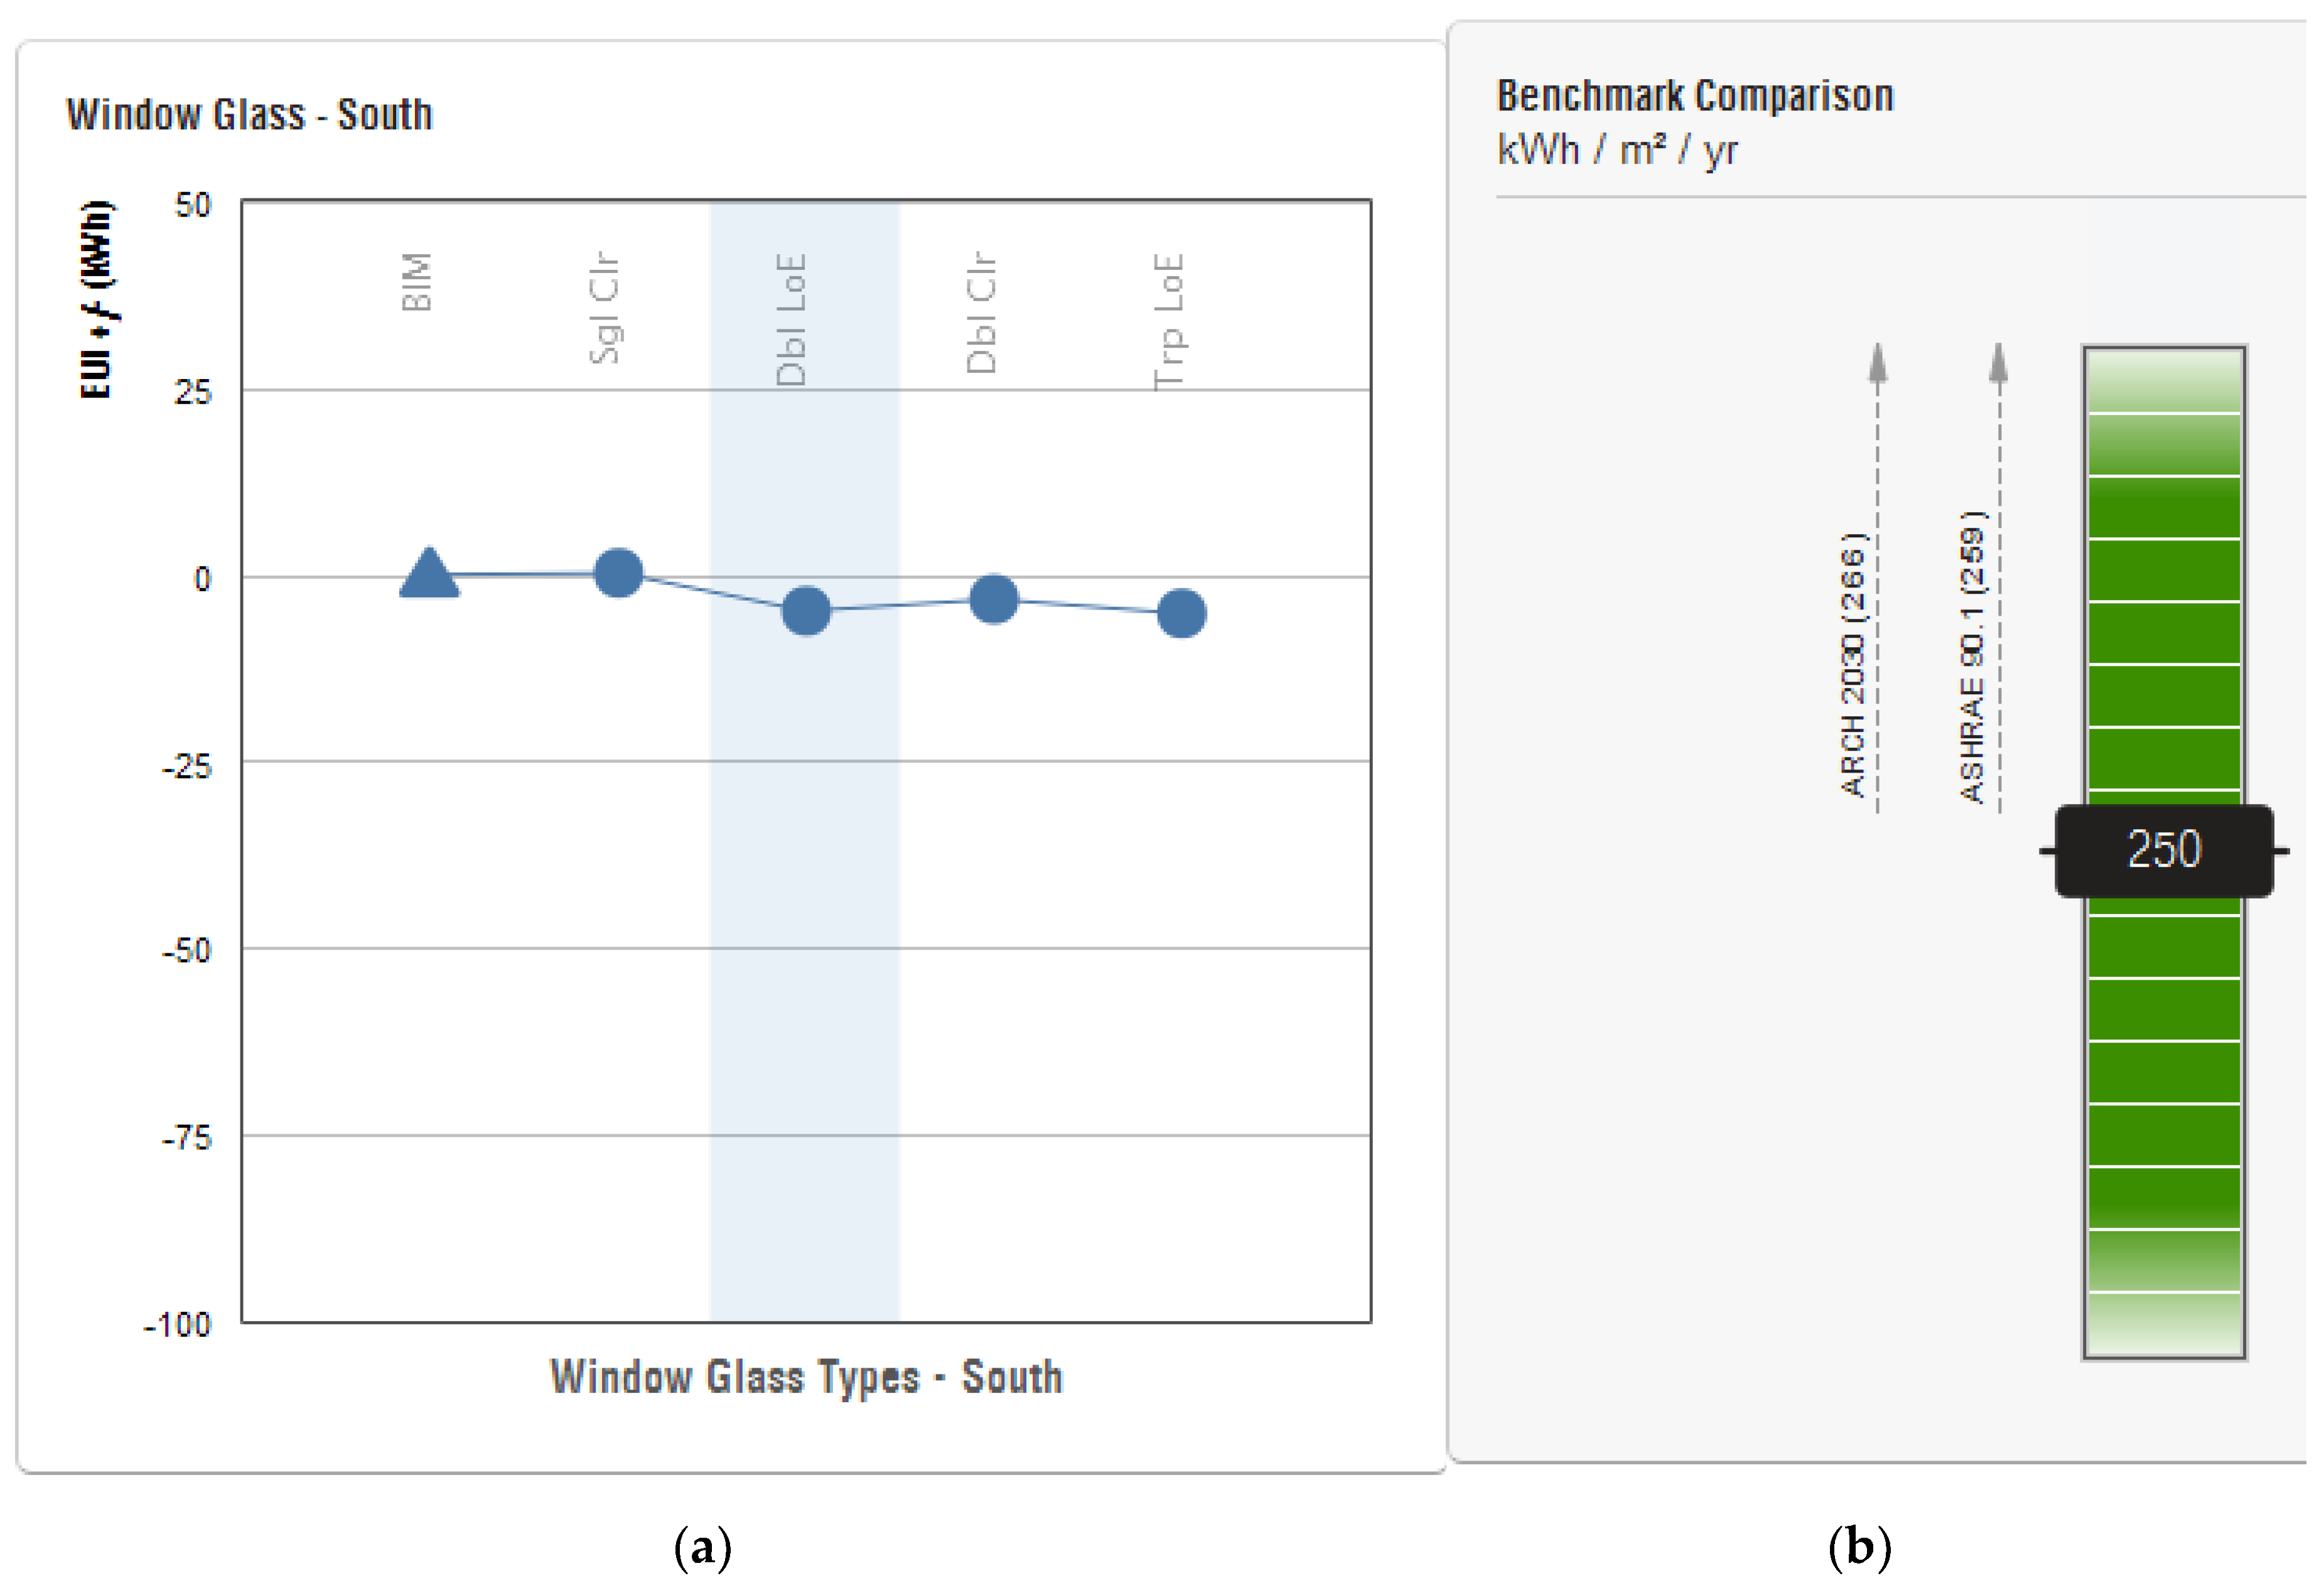
4.4. Improvement of the Quality of the Holes in the Building Envelope. Exterior Quality of the Cladding of Windows Glass

This improvement consisted of replacing the current single glass windows with low-emissive double glass [13].
The results obtained after applying the improvement in the energy simulation were (See Figure 11 and Table 4):
  • Consumption: 250.45 kWh/(m2 year).
  • Energy-saving: 8.66 kWh/(m2 year).

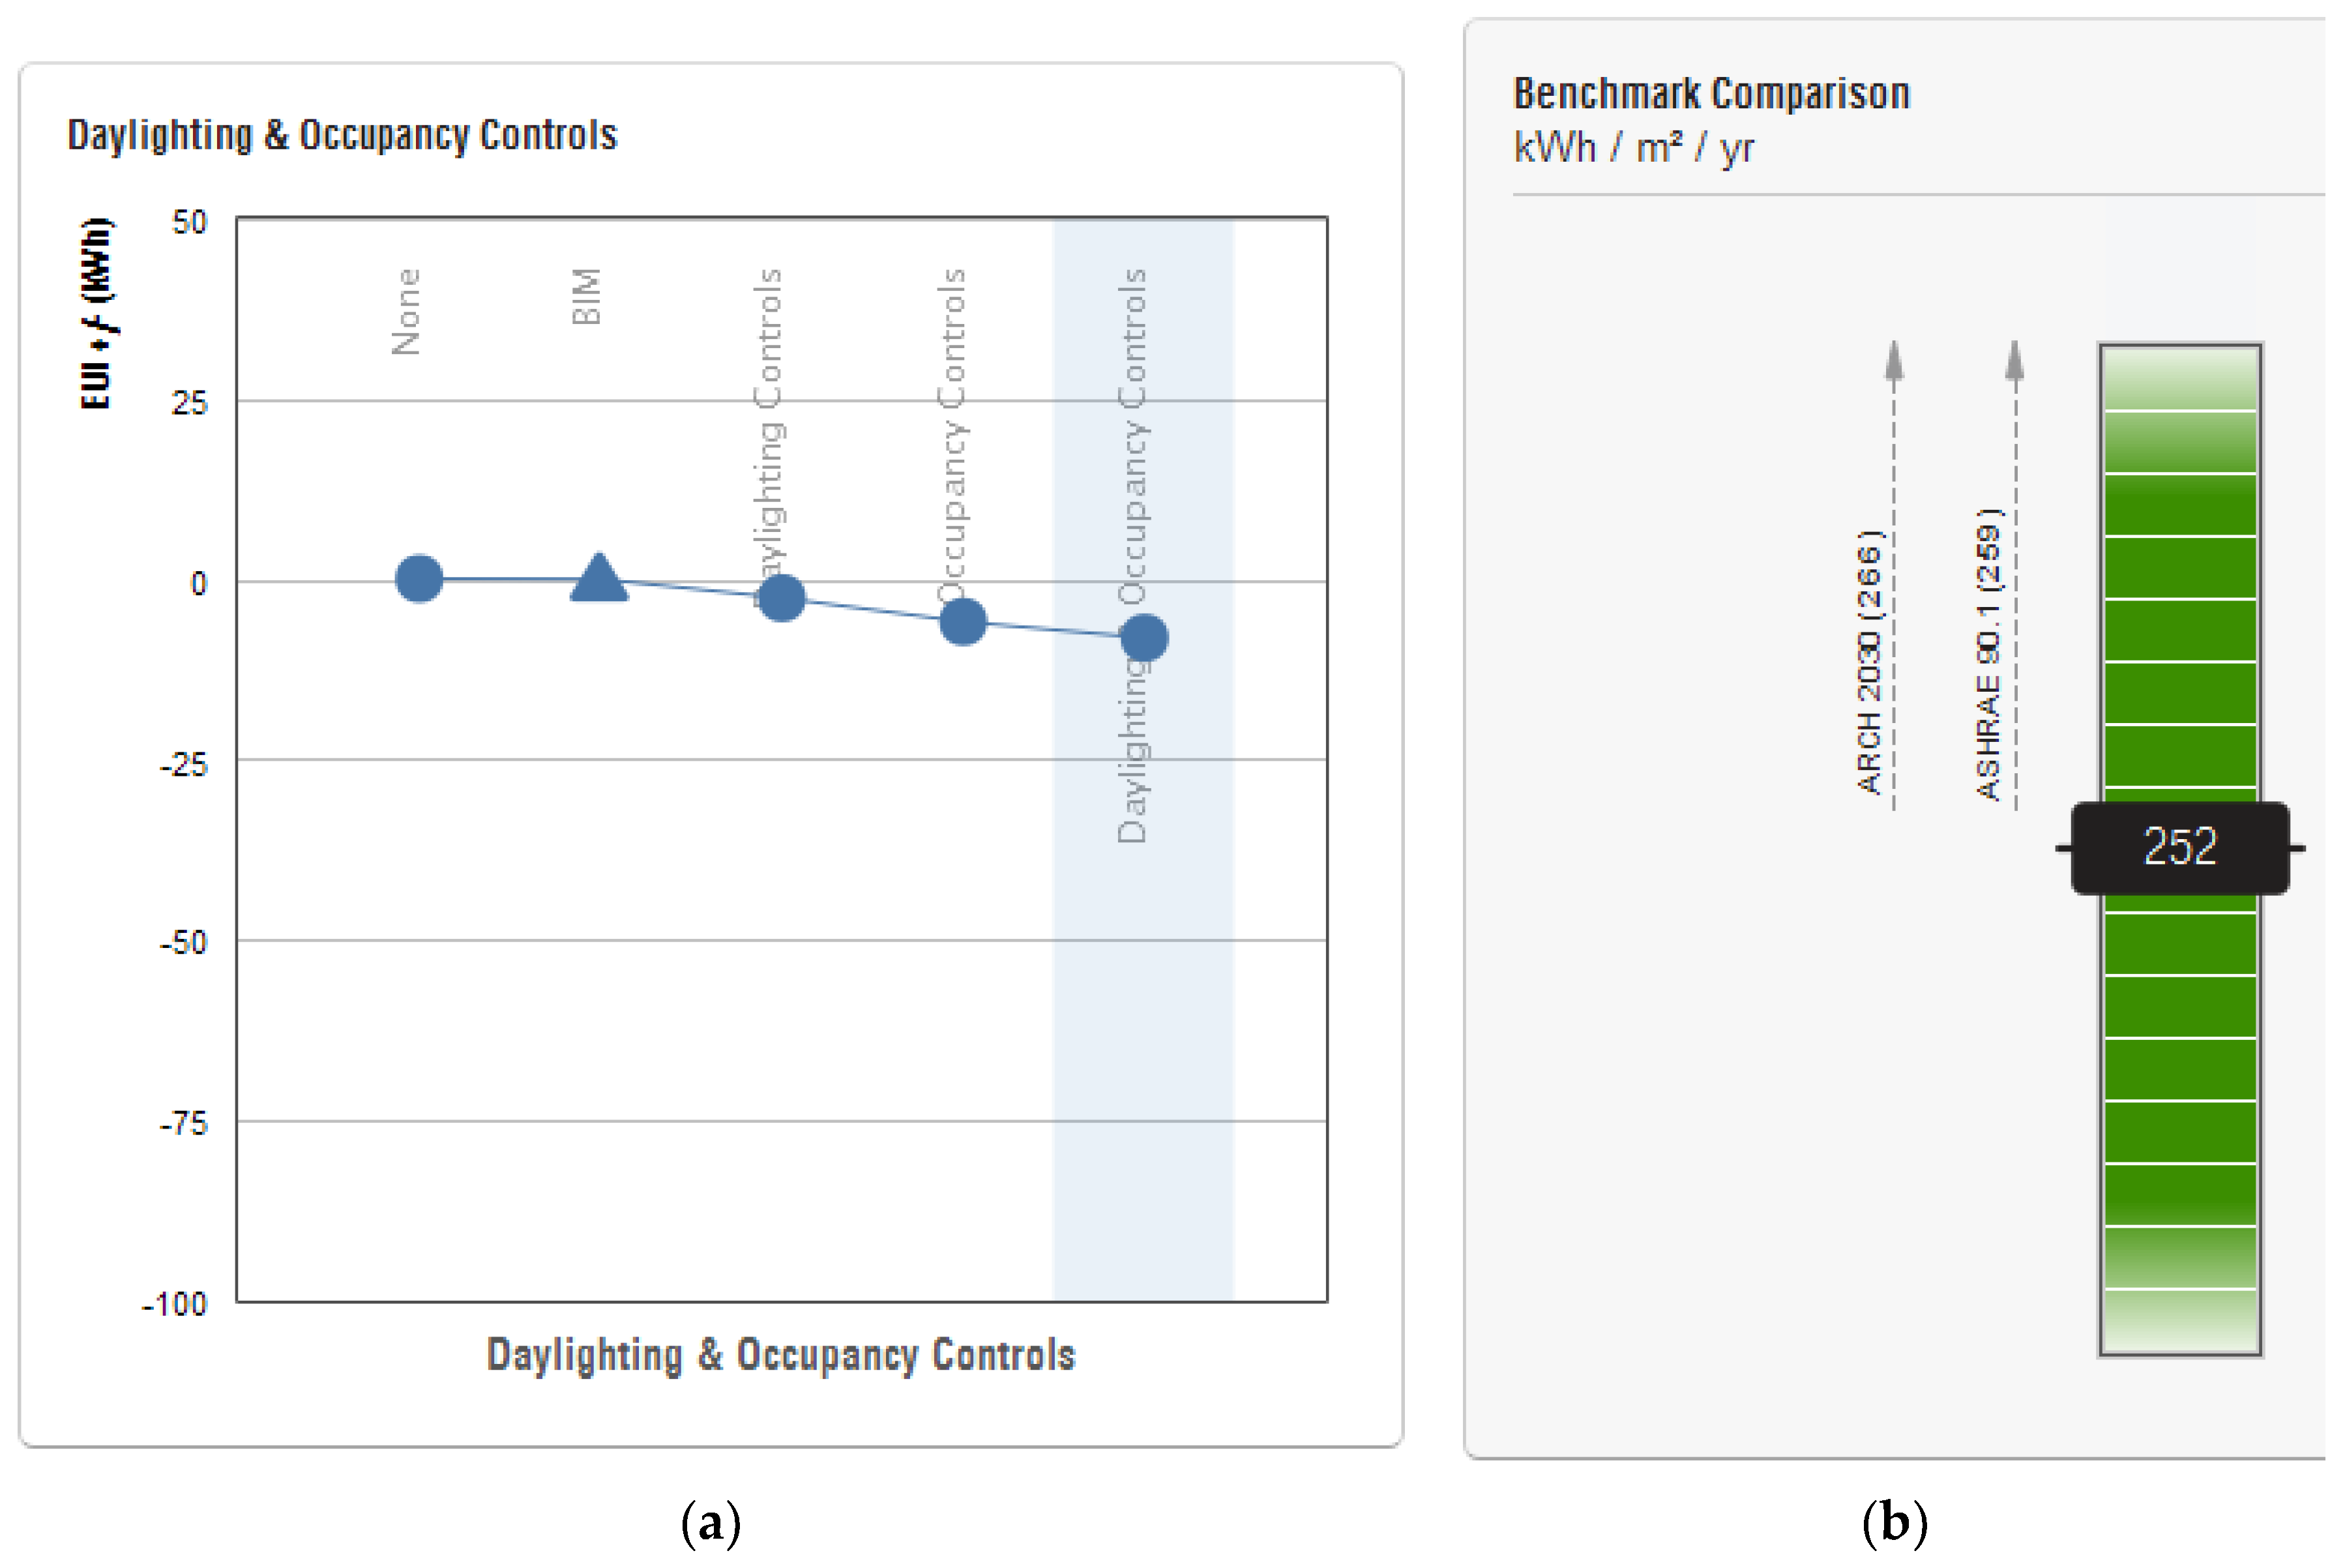
4.5. Improvement of the Building Lighting Regulation and Control System. (Lighting Control System)

This improvement consisted of the installation of a regulation system for the lighting of the building, combining presence detectors and twilight sensors to optimize electricity consumption. Home automation on-site in lighting [71,72,73].
The results obtained after applying the improvement in the energy simulation were (See Figure 12 and Table 4):
  • Consumption: 252.16 kWh/(m2 year).
  • Energy-saving: 6.95 kWh/(m2 year).
At this point, the results of the different types of solar lighting analyses that have been calculated for this building have been shown. However, it is true that there are fewer possibilities for action to improve these results, given it is more difficult to modify the number and size of the glazed surface in an existing building than in the design phase of new buildings.

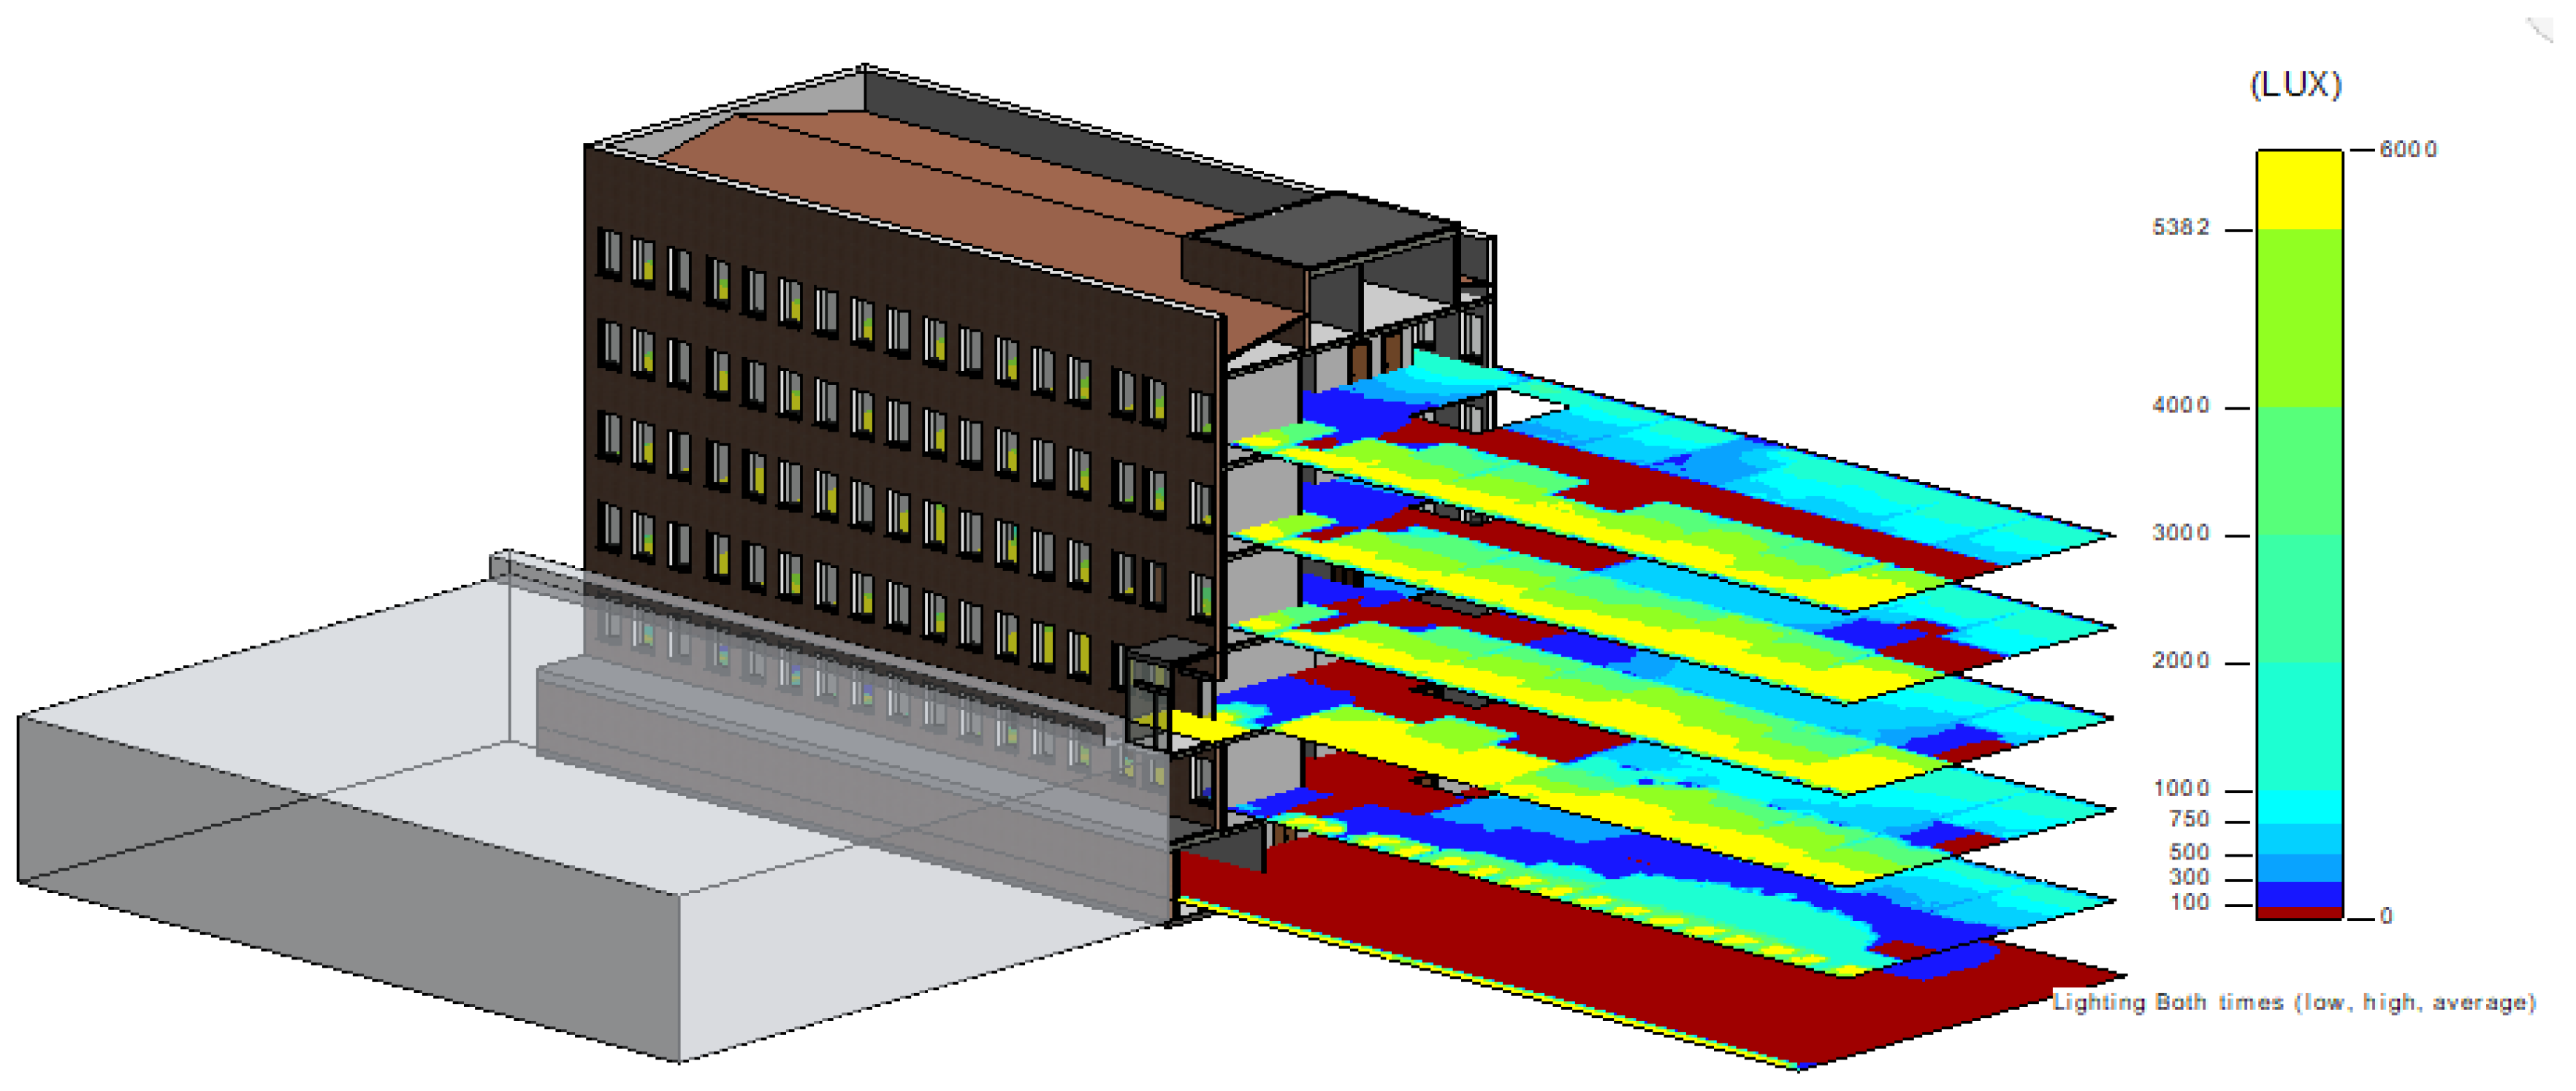
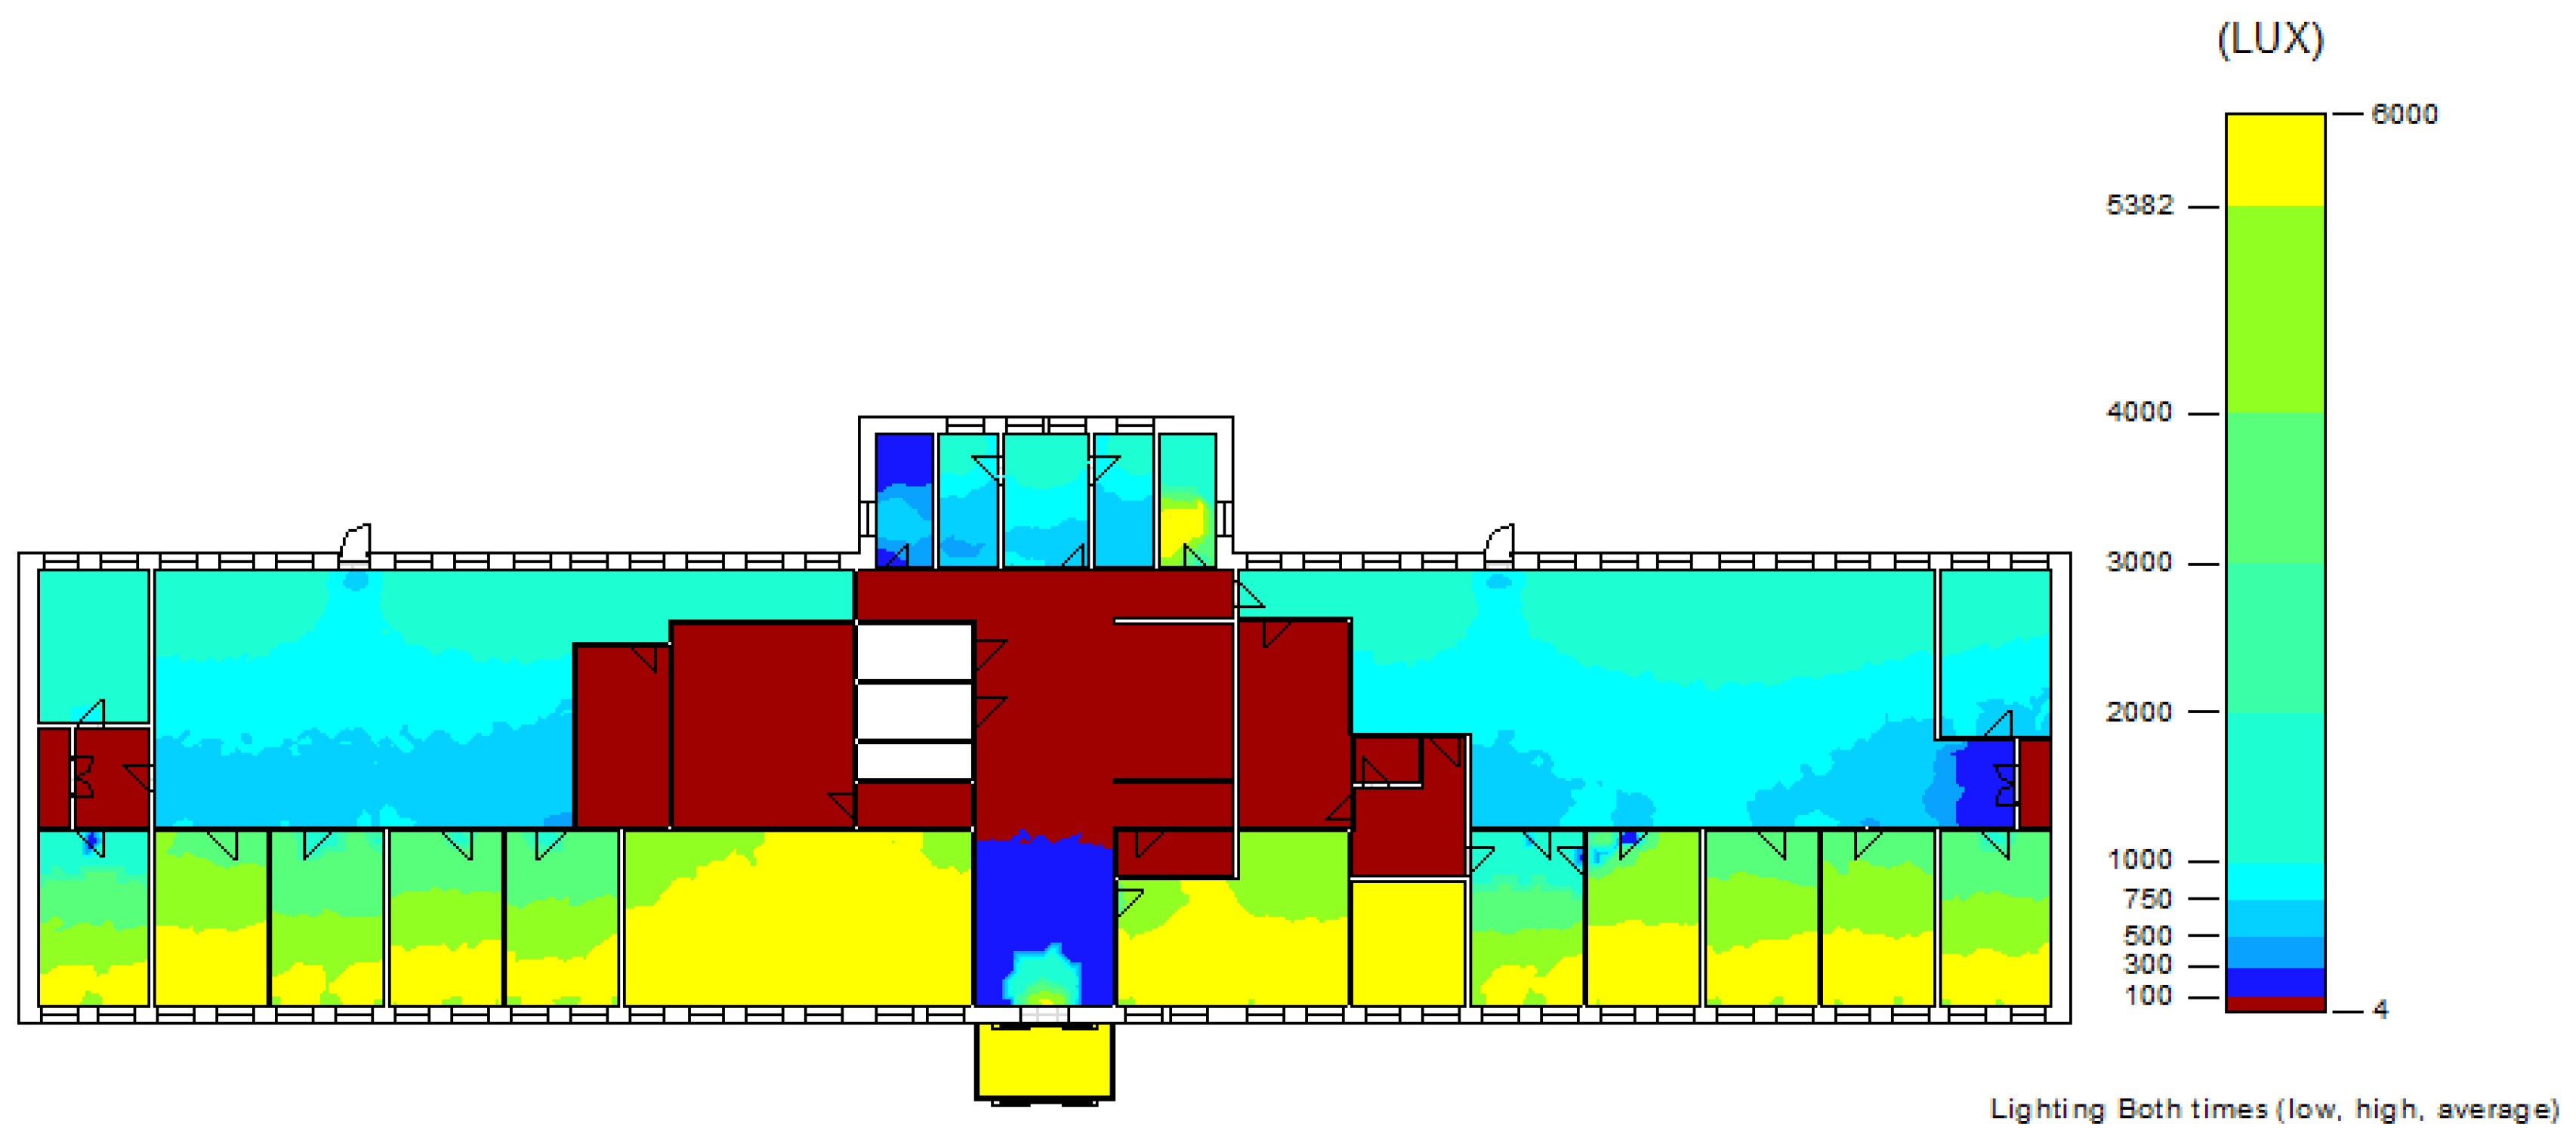
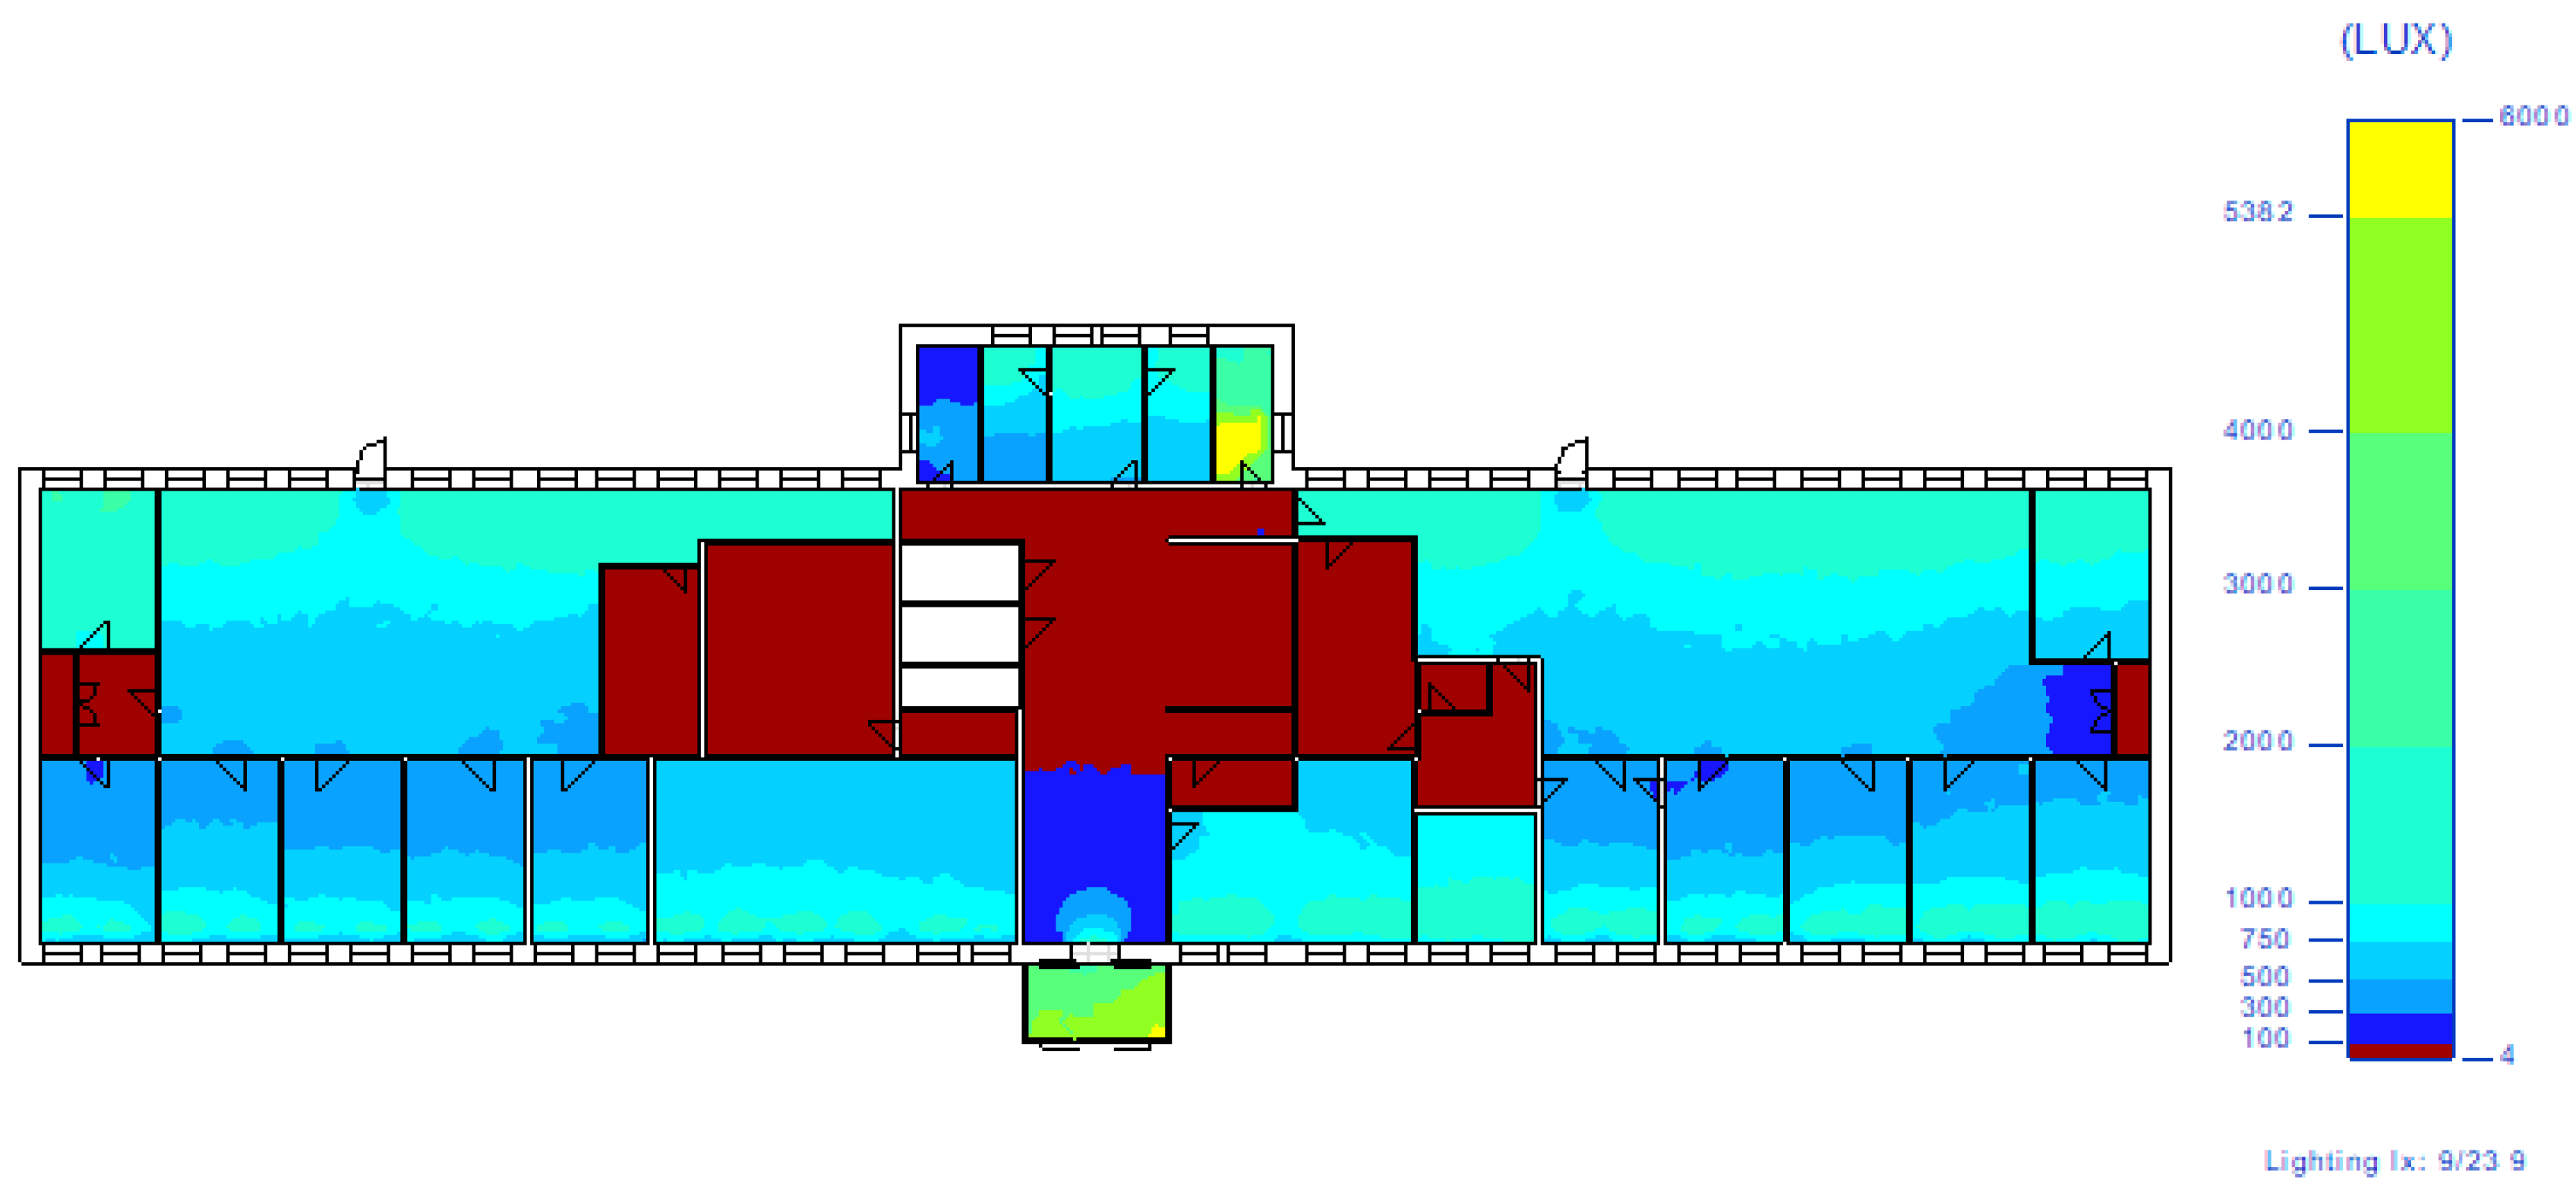
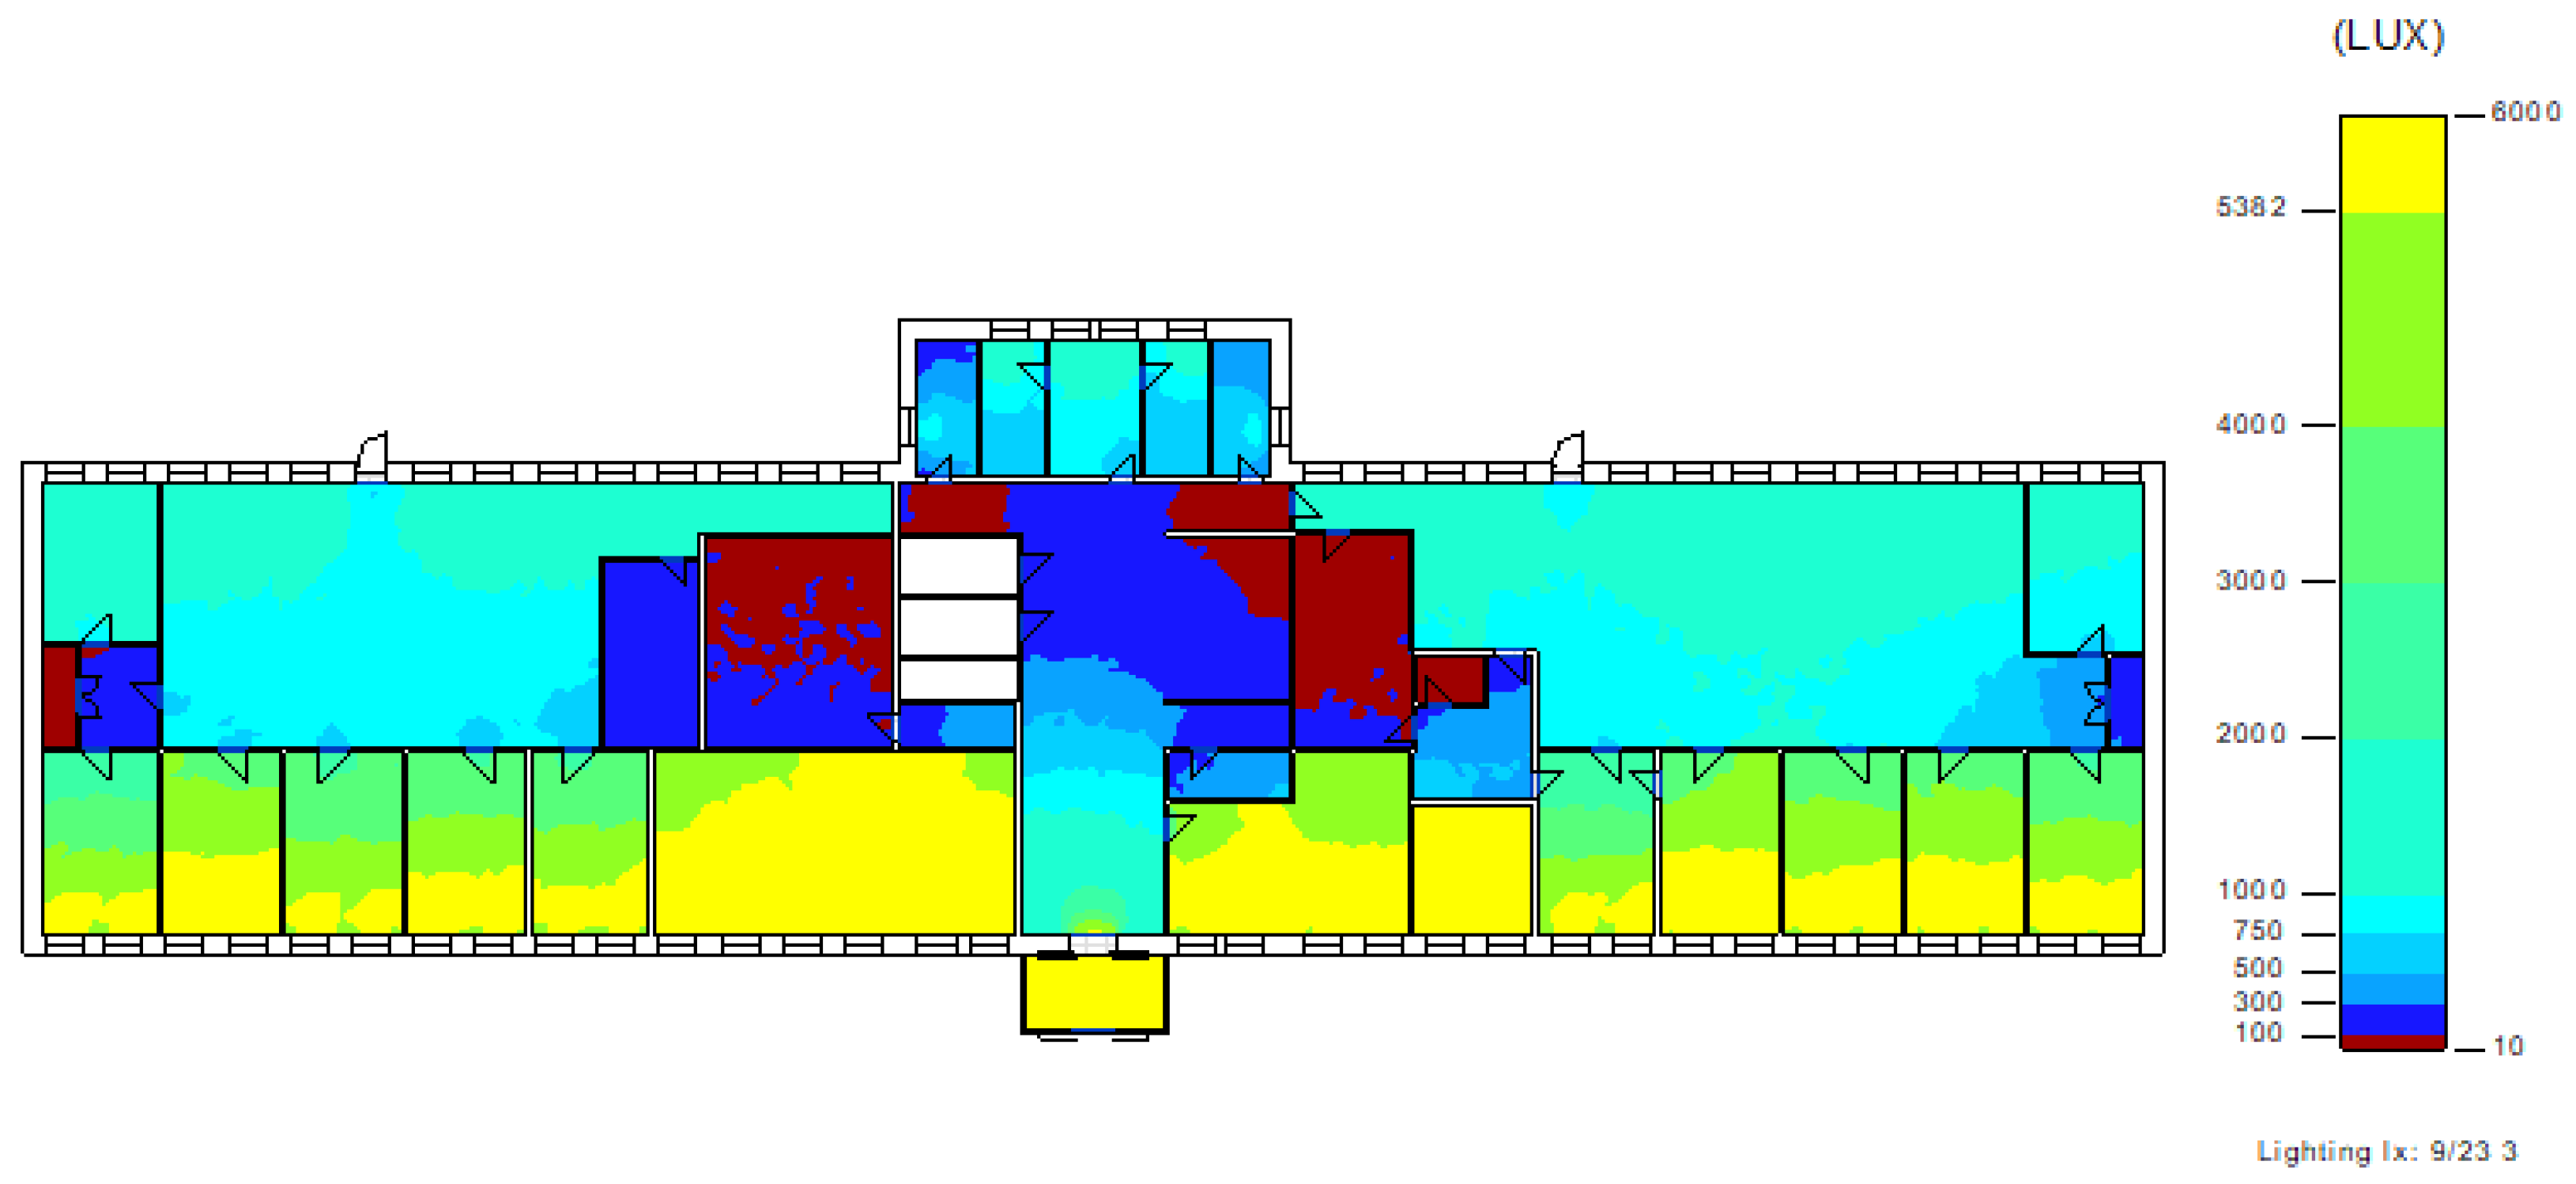
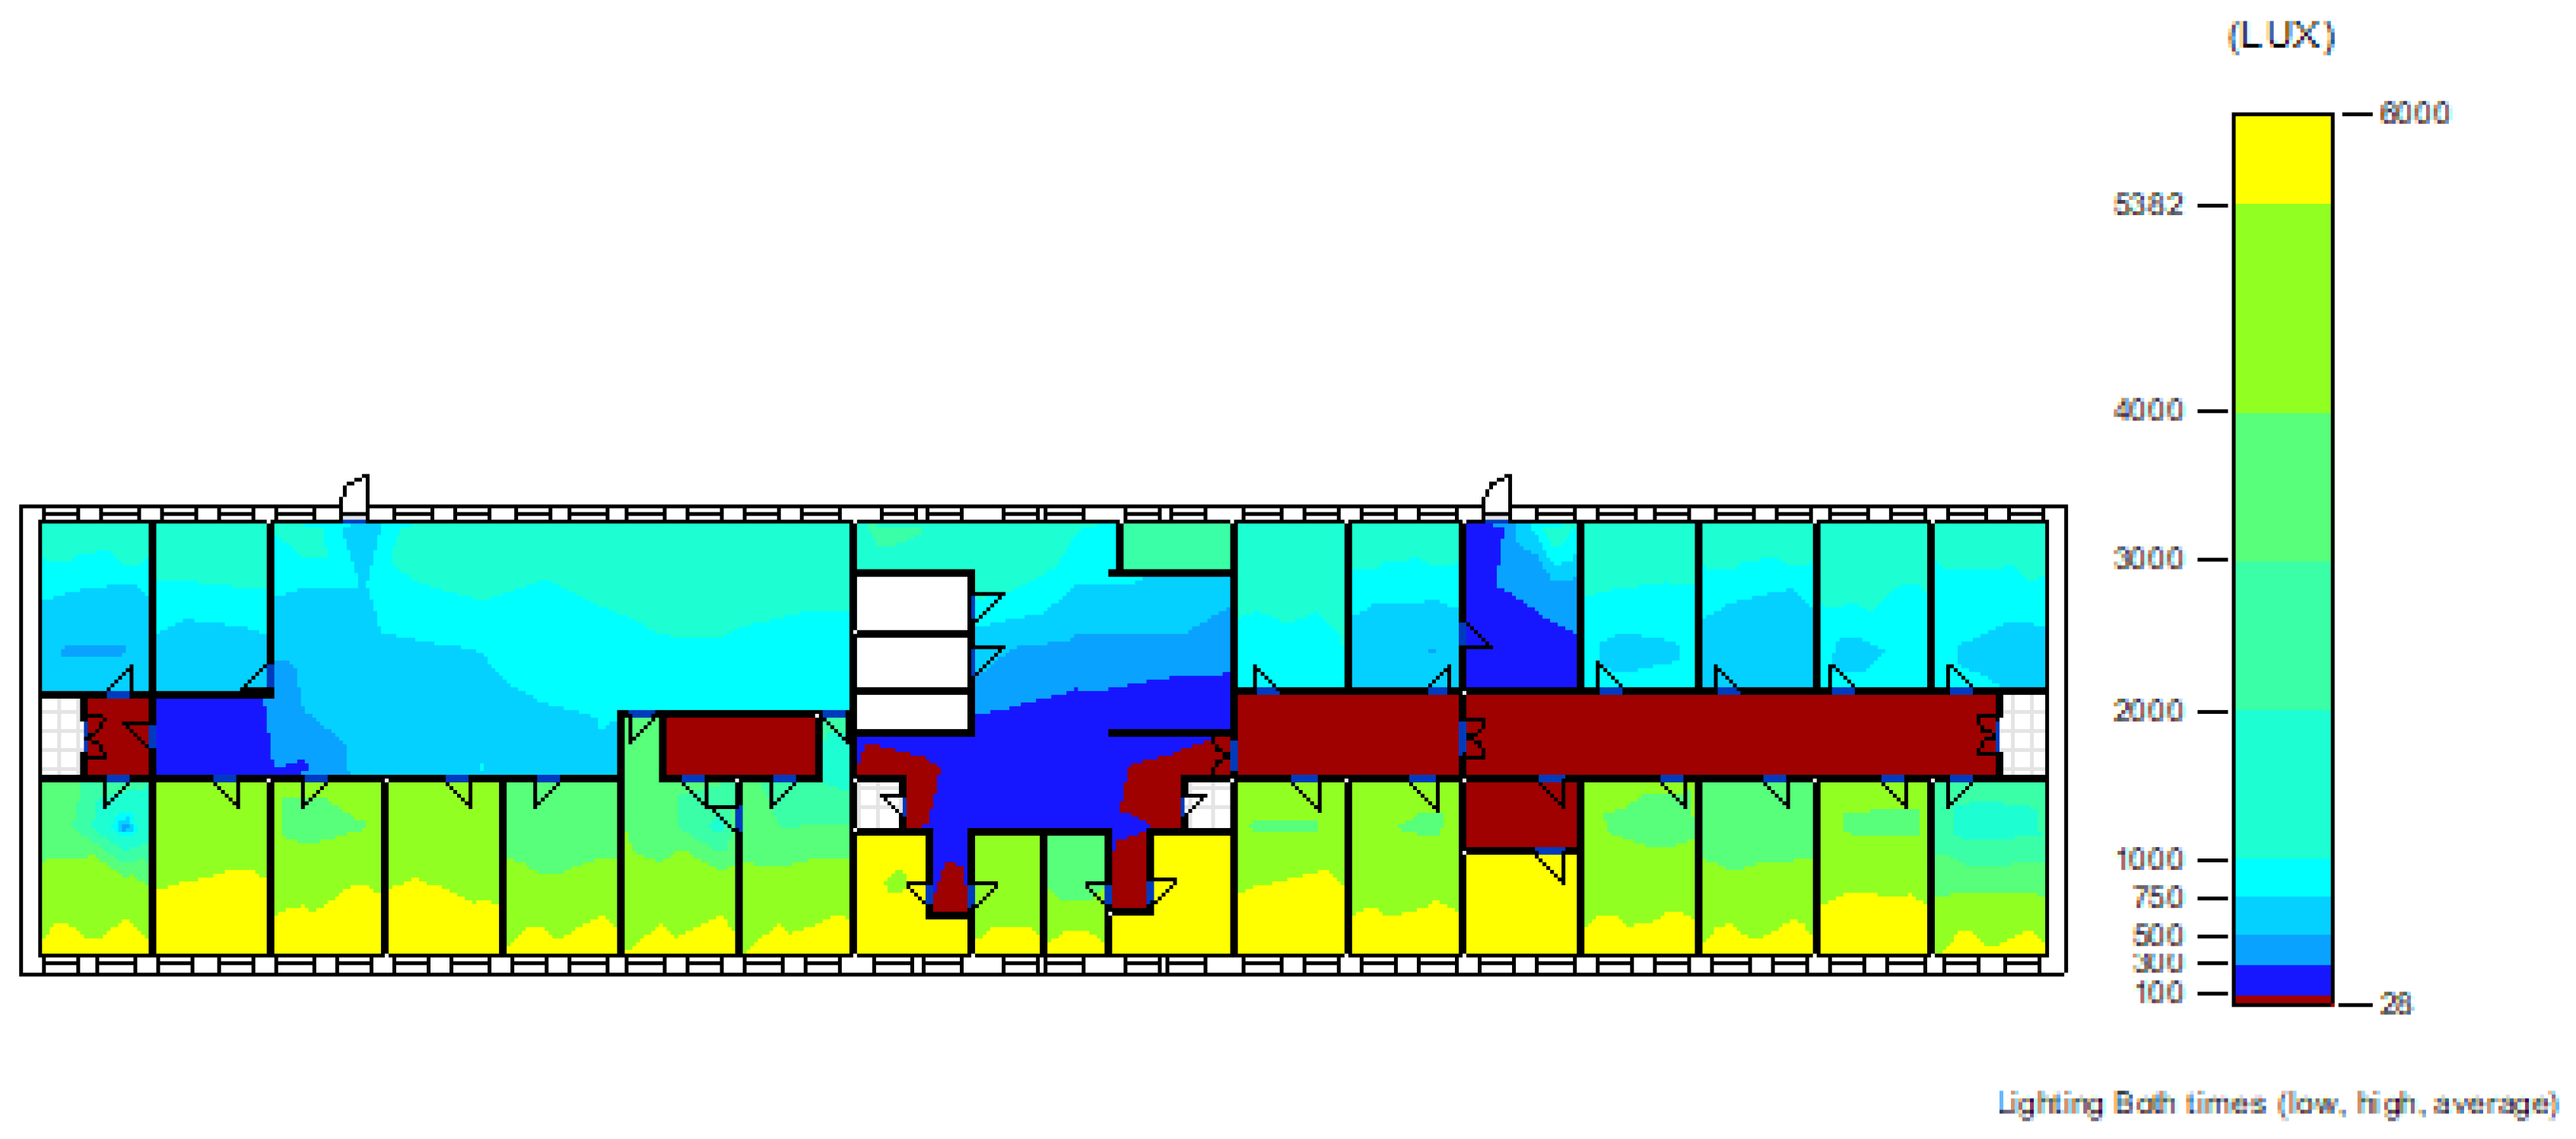
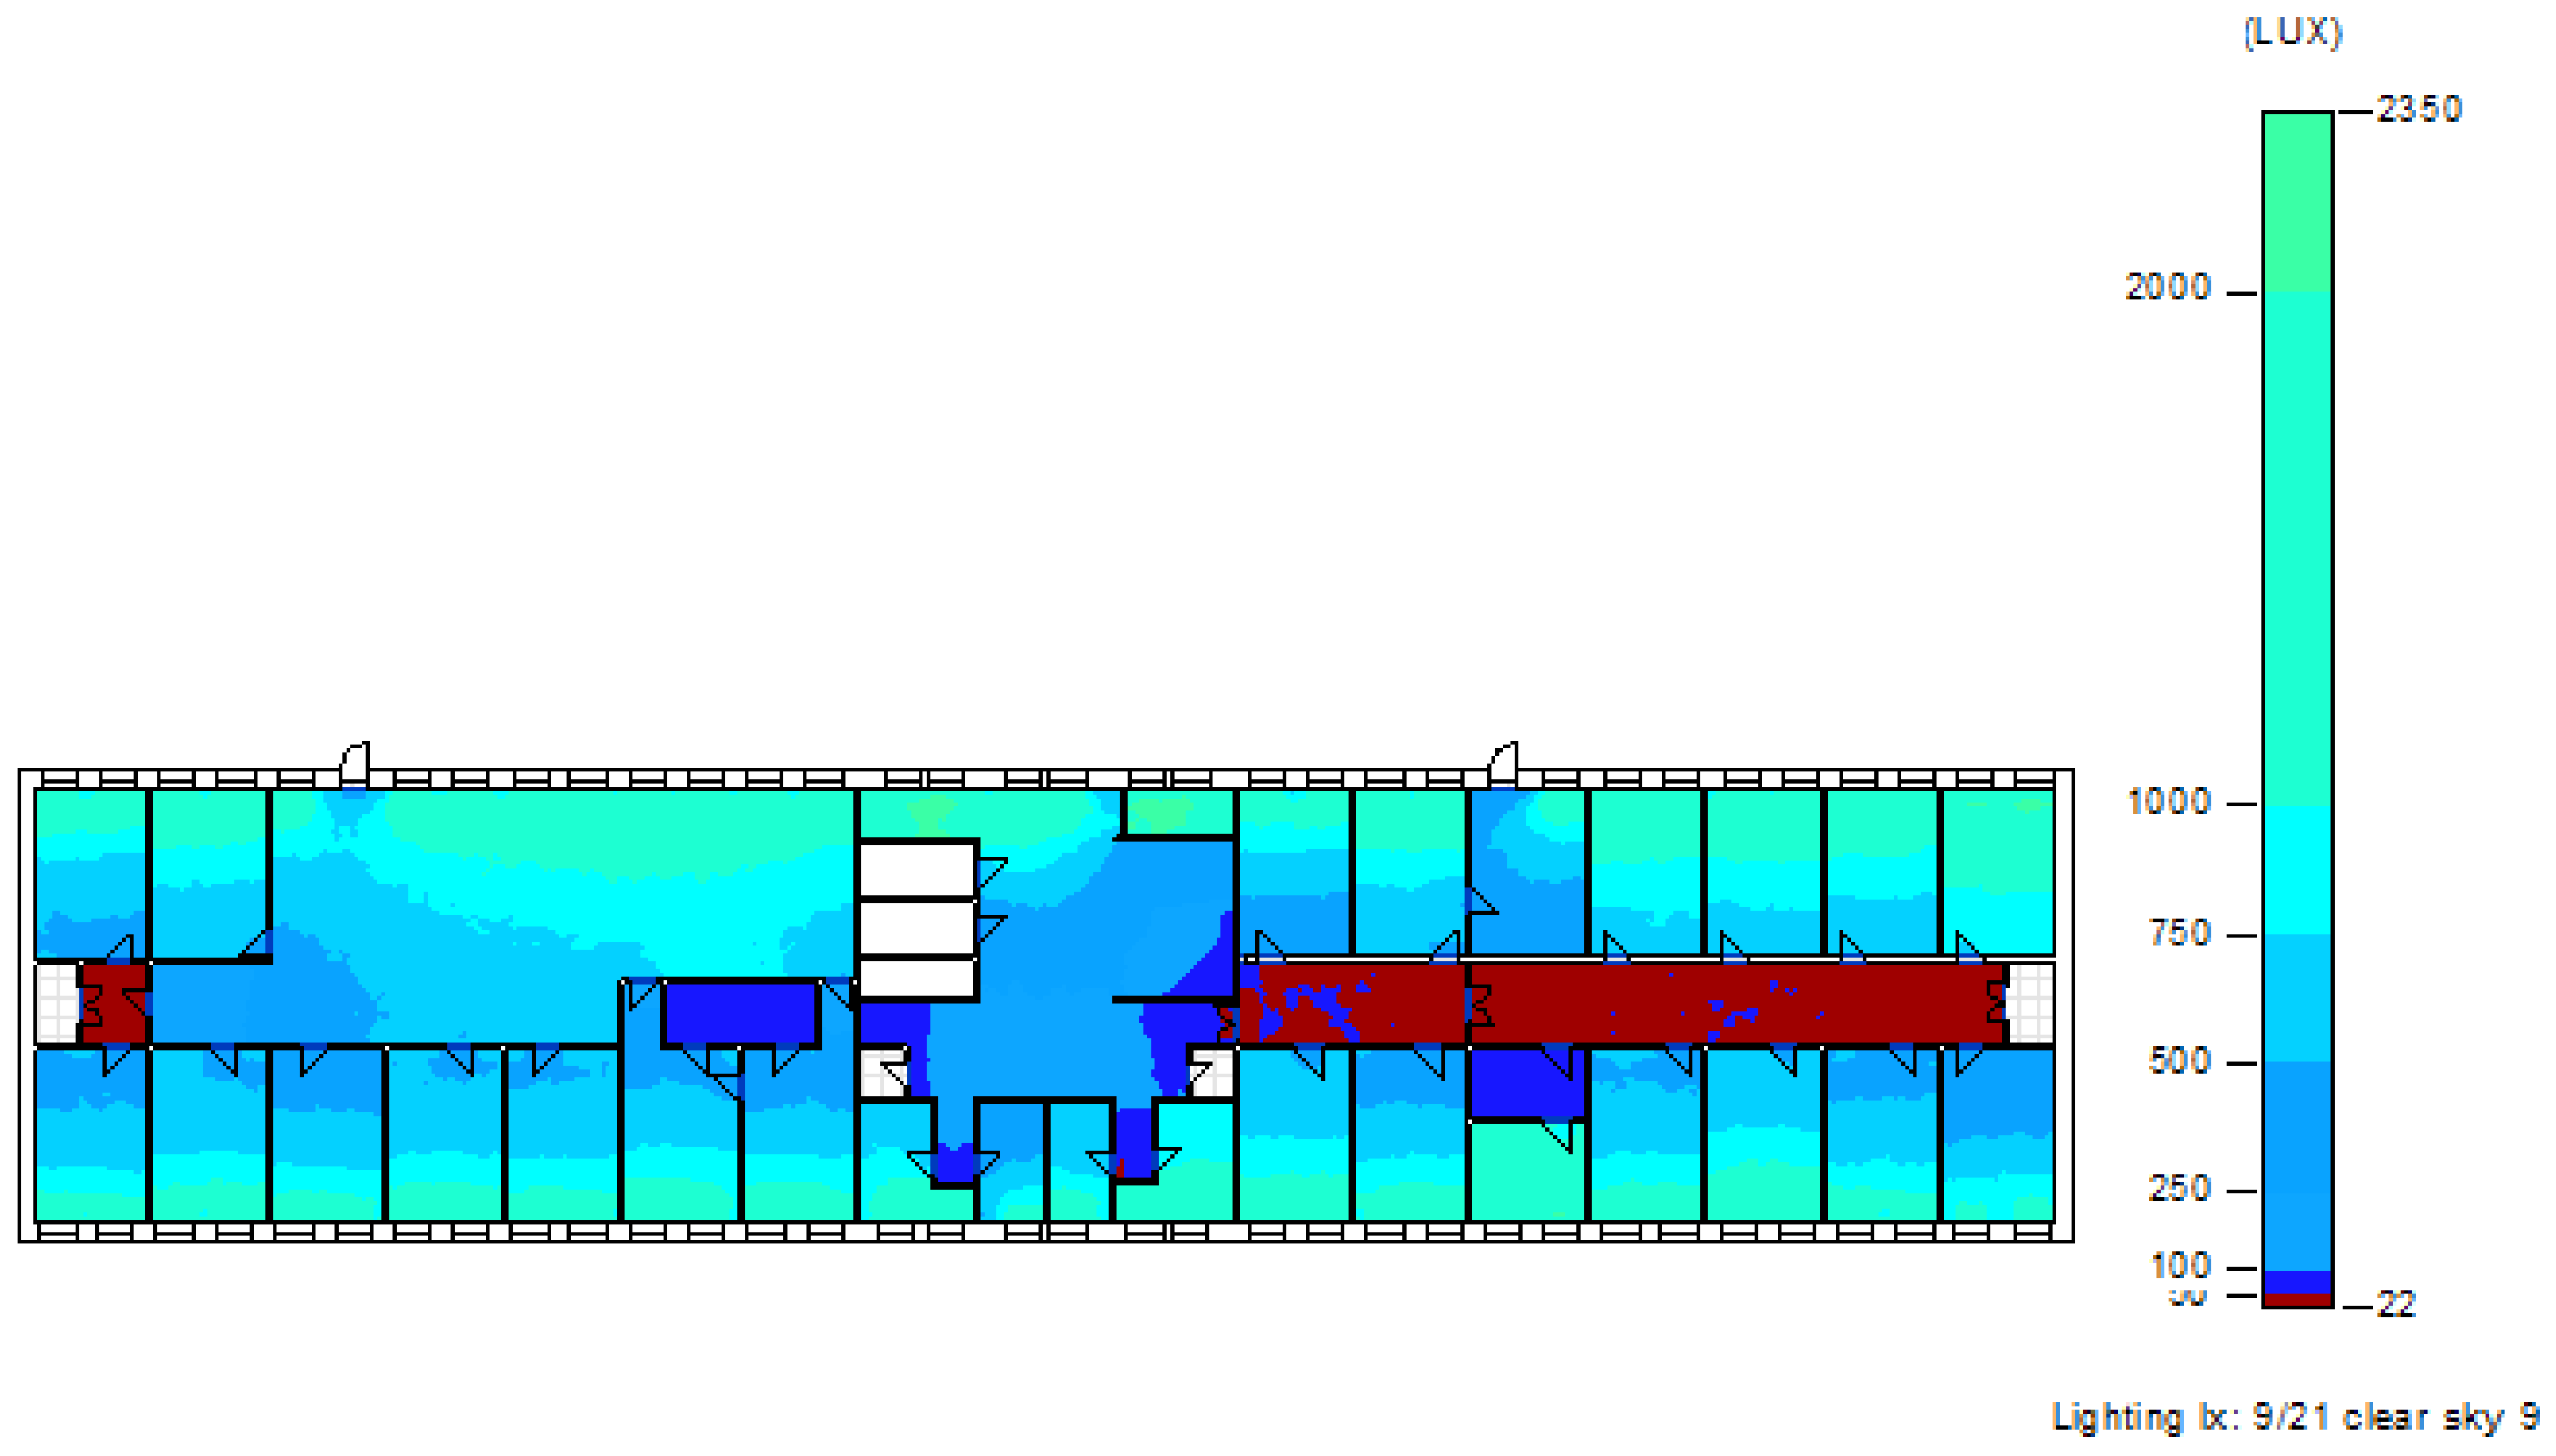
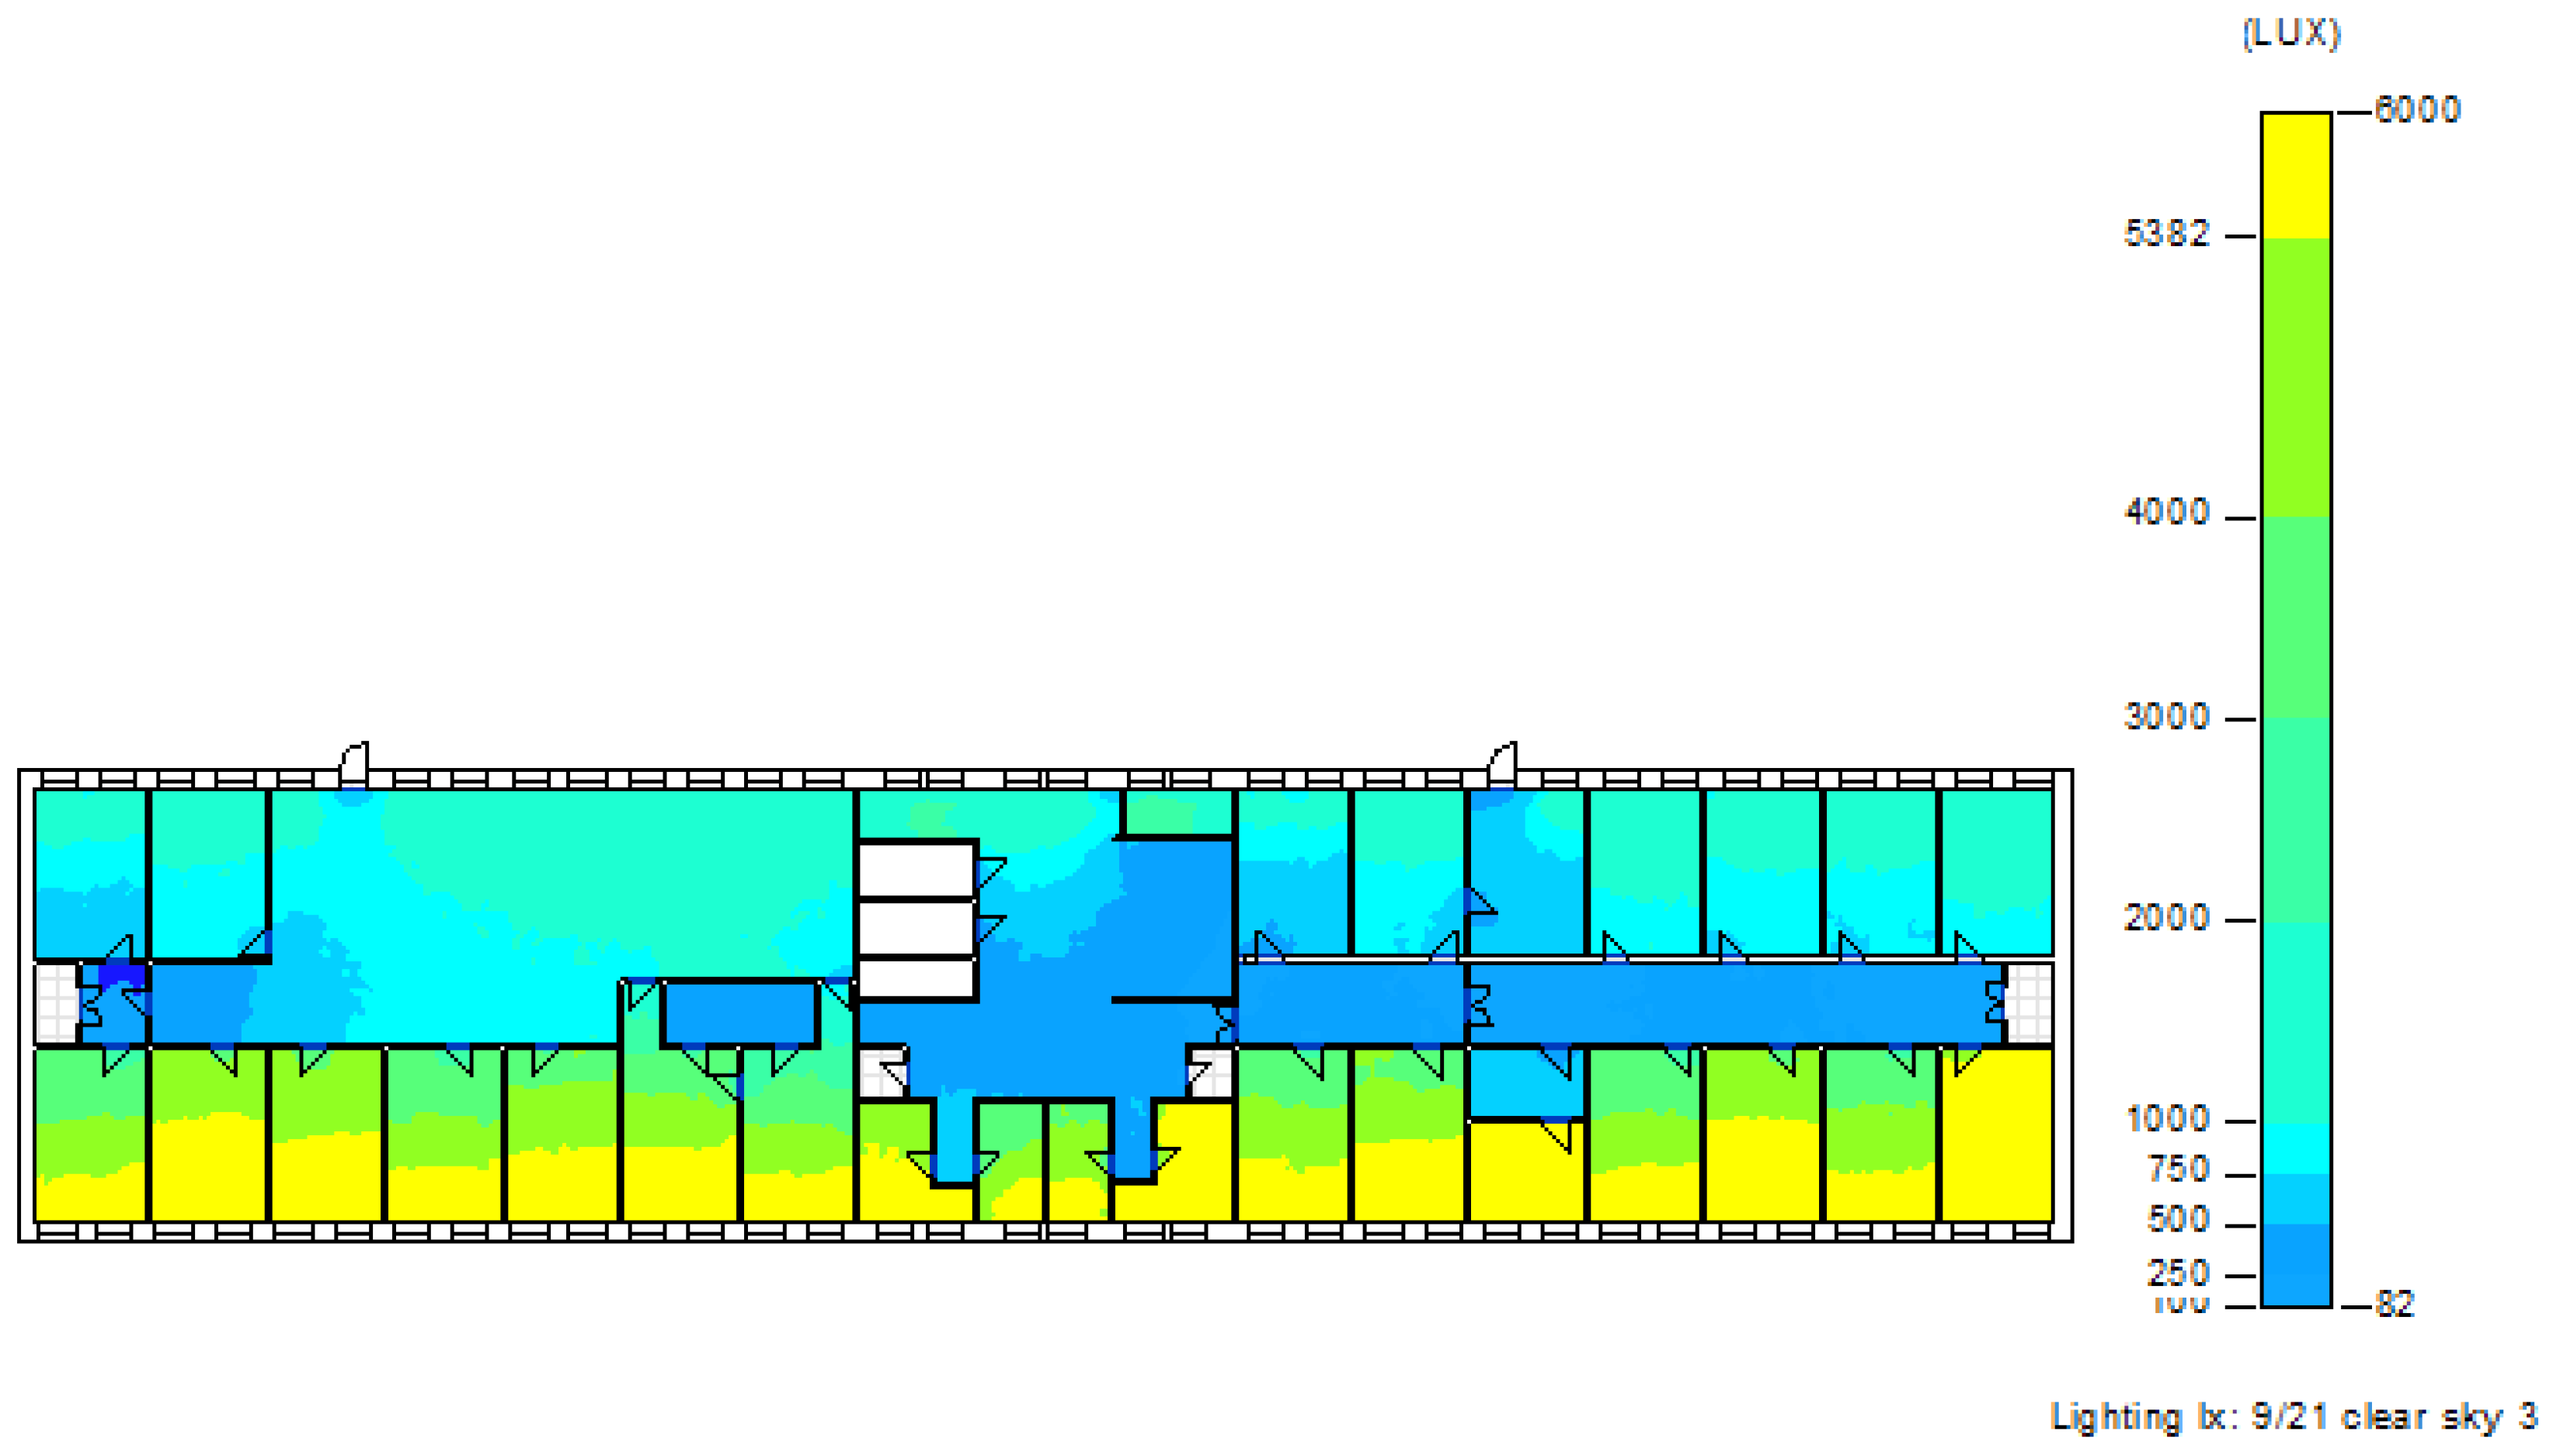
4.5.1. Daylighting. Illuminance Analysis

This section shows the calculation of the illuminance (lux) of the building rooms obtained in REVIT. This type of calculation allows a large number of parameters to be varied to personalize the analysis, such as the sky model, moments (day and hour) of lighting calculation, an upper and lower limit of illuminance, height above the floor of illuminance, in the calculation plane [48,74].
For this case, the data were:
  • Sky model: Perez All-Weather Sky;
  • Date/Time 1: 09/23, 9:00 (Solar Data 1: GHI: 242 W/m2; DNI: 462 W/m2; DHI 71W/m2);
  • Date/Time 1: 09/23, 15:00 (Solar Data 2: GHI: 595 W/m2; DNI: 733 W/m2; DHI 85W/m2);
  • Threshold: Lower and upper: 300 and 3000 lux;
  • Analysis plane Height: 32 inches (82 cm) above the floor;
  • Clear sky.
The results of the simulation were (see Figure 13, Figure 14, Figure 15, Figure 16 and Figure 17):
Total Both (low, high, average)—40% Passing.
29% either time below the threshold.
31% either time above the threshold.
9:00—71% Passing.       15:00—53% Passing.
29% below threshold.     15% below threshold.
1% above threshold.      31% above threshold.
Considering that the building has blinds for manual use to provide shade, if said blinds were automated, the results would be as follows:
Total Both (low, high, average)—71% Passing.
9:00—71% Passing.      15:00—85% Passing.

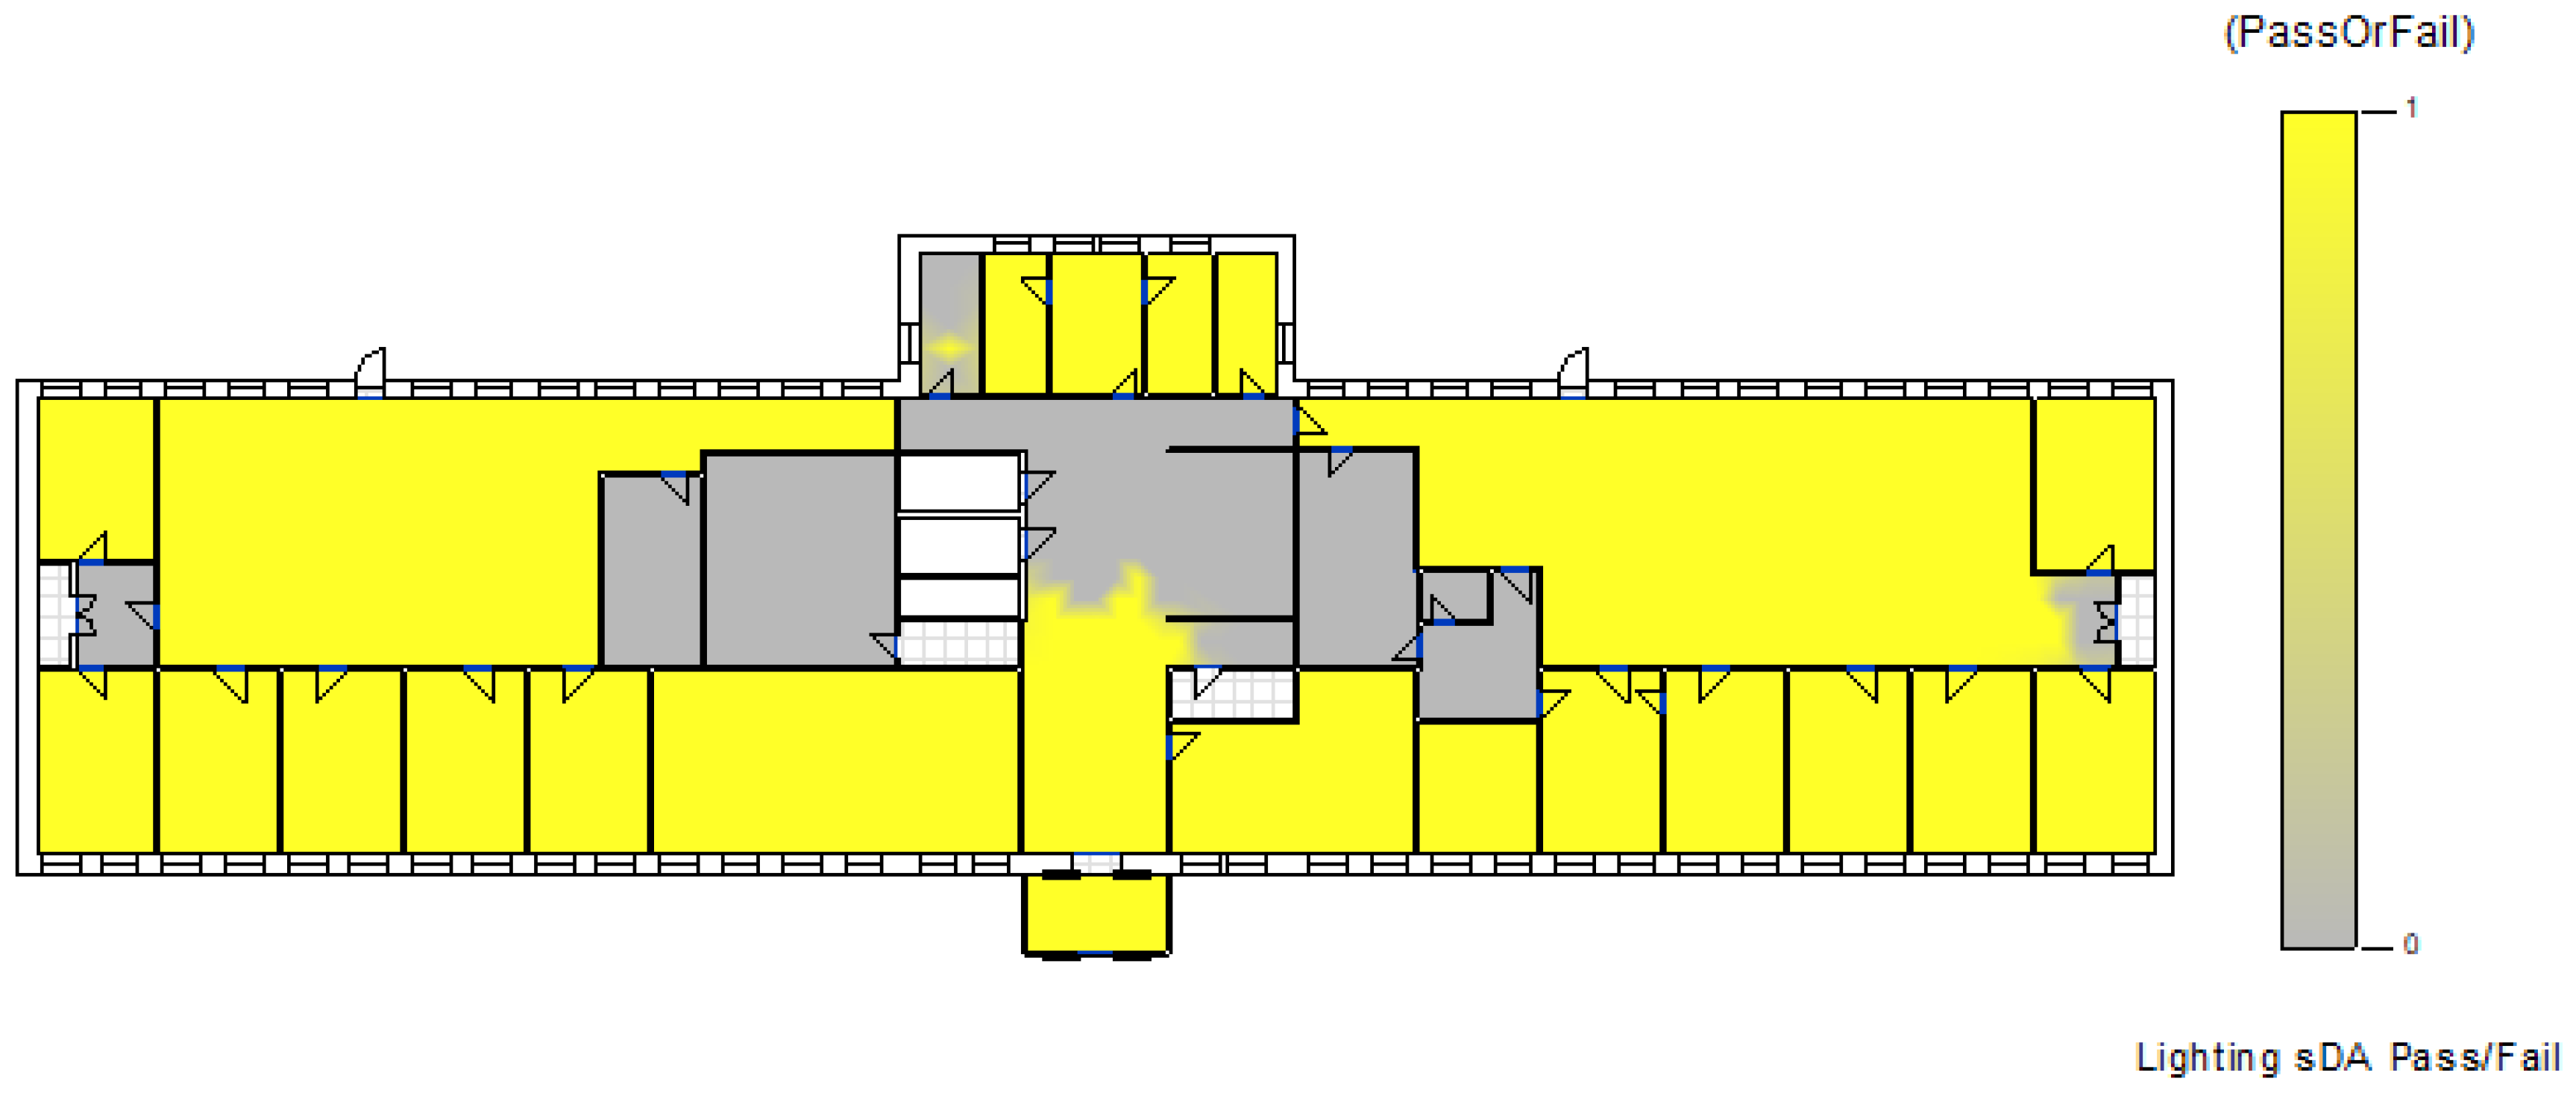
4.5.2. Daylight Autonomy (sDA Preview; LEED v4 EQc7 Option 1)

This type of analysis corresponds to the LEED v4 EQ7 option 1 sustainability criteria [49], although in this analysis, the software allows configuring the parameters to adapt to similar autonomy analysis used in other countries. In this study, the analysis corresponds exactly to the requirement LEED v4 EQc7 opt1.
sDA: sDA300/50 (> 300 lux, > 50% of year). The percentage of floor area that receives over 300 lux for at least 50% of 3650 annual hours.
ASE: ASE1000/250 (> 1000 lux, < 250/3650 of the year). The percentage of floor area that receives over 1000 lux for more than 250/3650 annual hours.
The results of the simulation were (see Figure 18 and Figure 19):
Building scored 0 LEED points with 50% of the building area meeting sDA (spatial daylight autonomy) % hours in rooms with <20% area above ASE (annual sunlight exposure). At least 55% must exceed sDA300/50 in rooms with ASE1000/250 < 20% of room area. Expected result for a building of this age, but close to scoring.

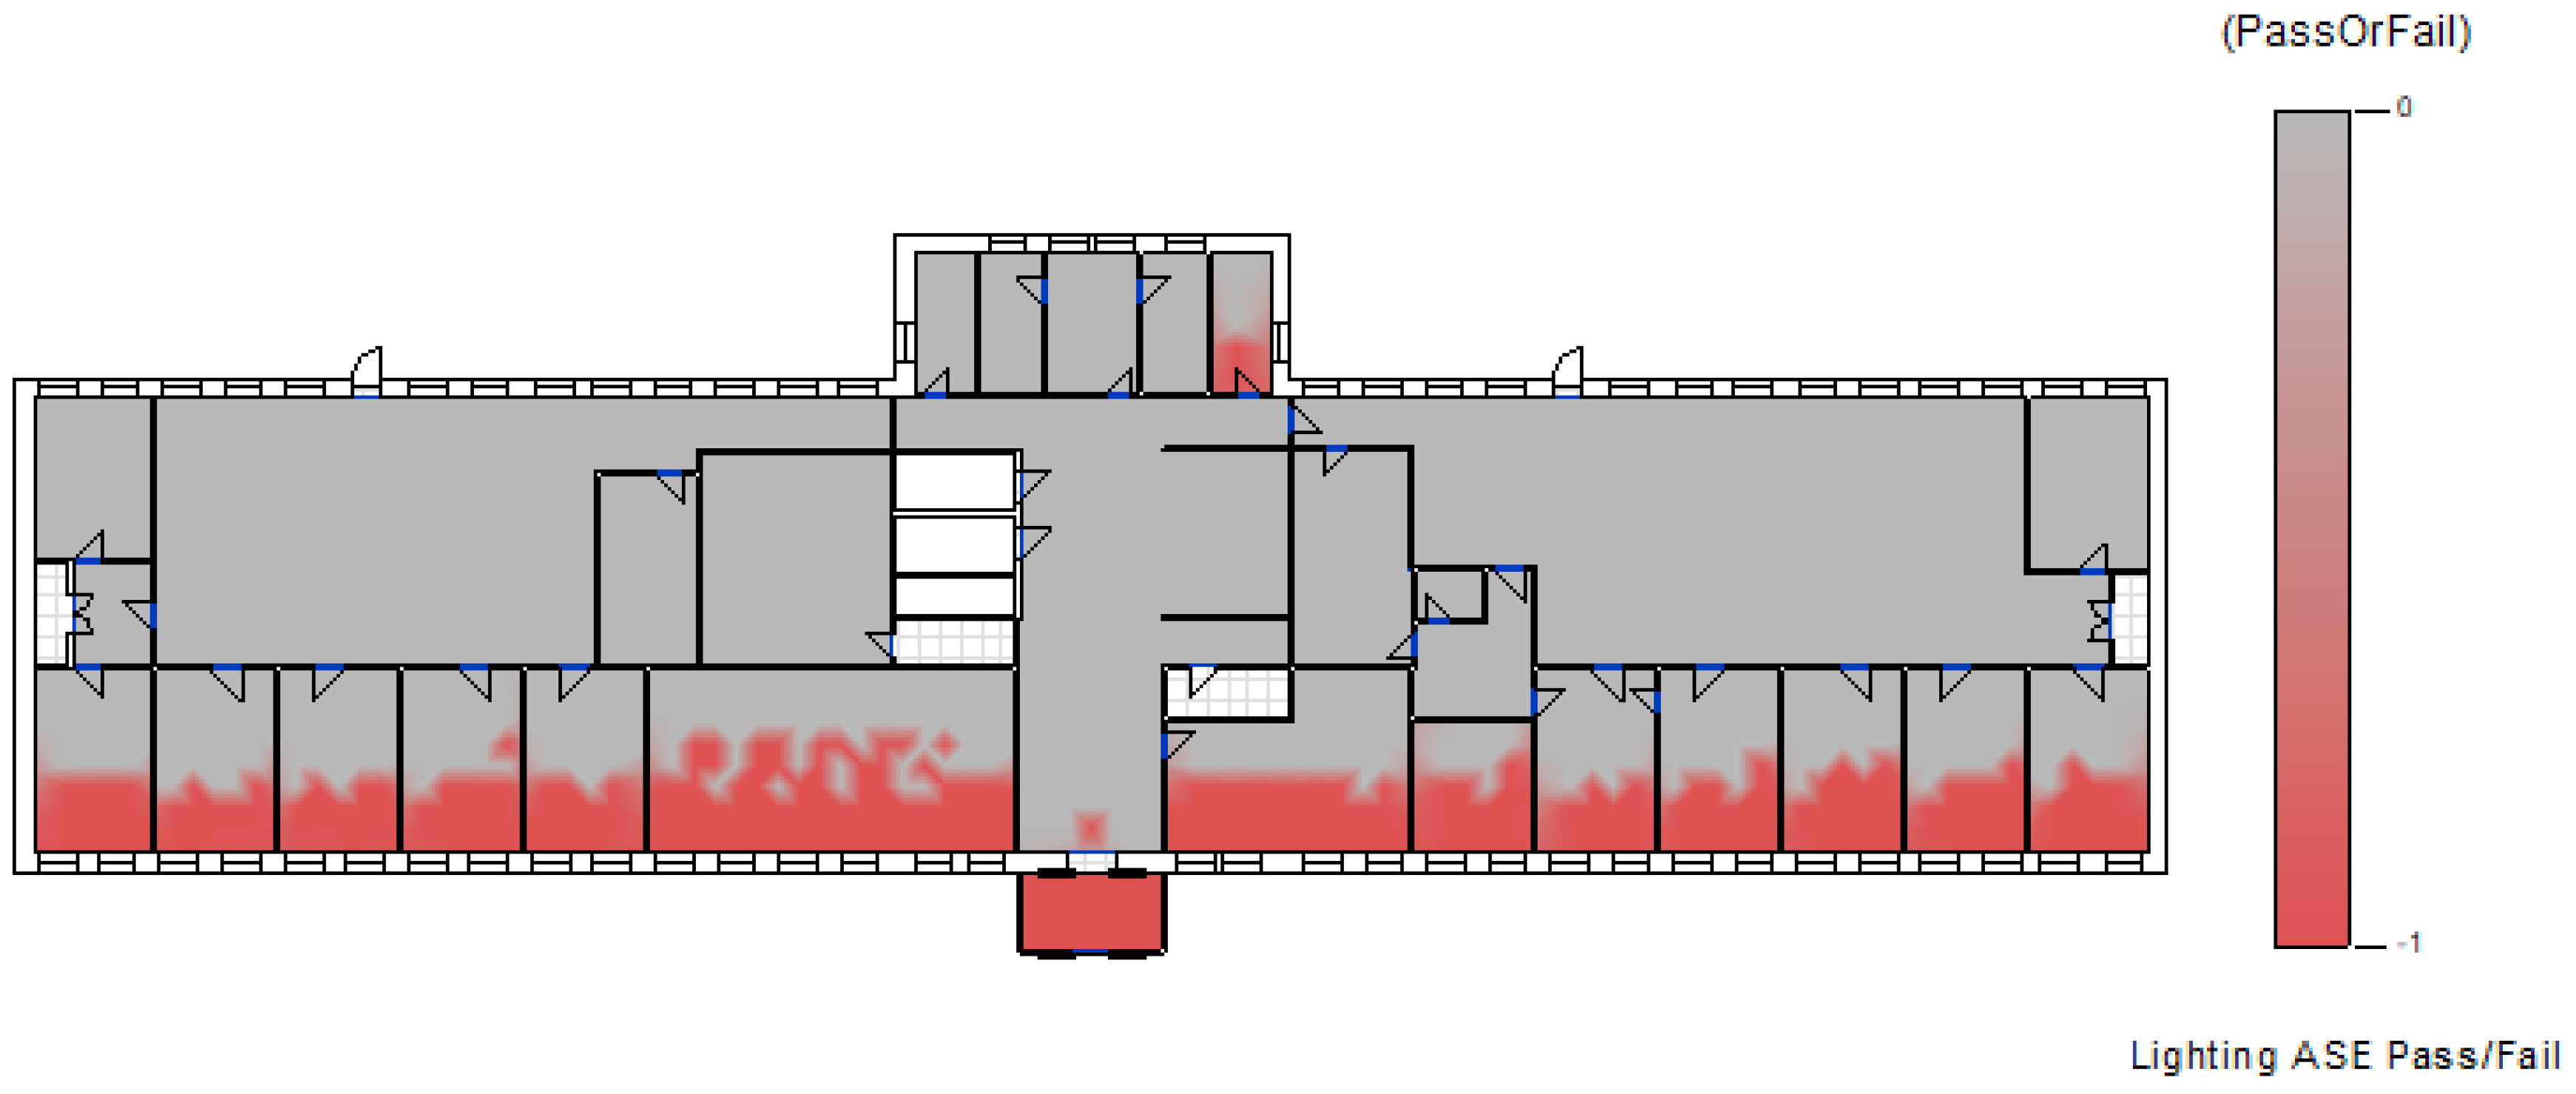
4.5.3. LEED v4 EQc7 Option 2

This type of analysis corresponds to the LEED v4 EQ7 option 2 sustainability criteria [49].
For this case, the data were:
  • Date/Time: Equinox averages, 9:00 a.m. and 3:00 p.m., clear sky.
  • Solar Data 1: 9/21 9:00 GHI: 223 W/m2; DNI: 426 W/m2; DHI 69W/m2).
  • Solar Data 2: 9/21 15:00 GHI: 631 W/m2; DNI: 749 W/m2; DHI 86W/m2).
  • Threshold: Lower and upper: 300 and 3000 lux.
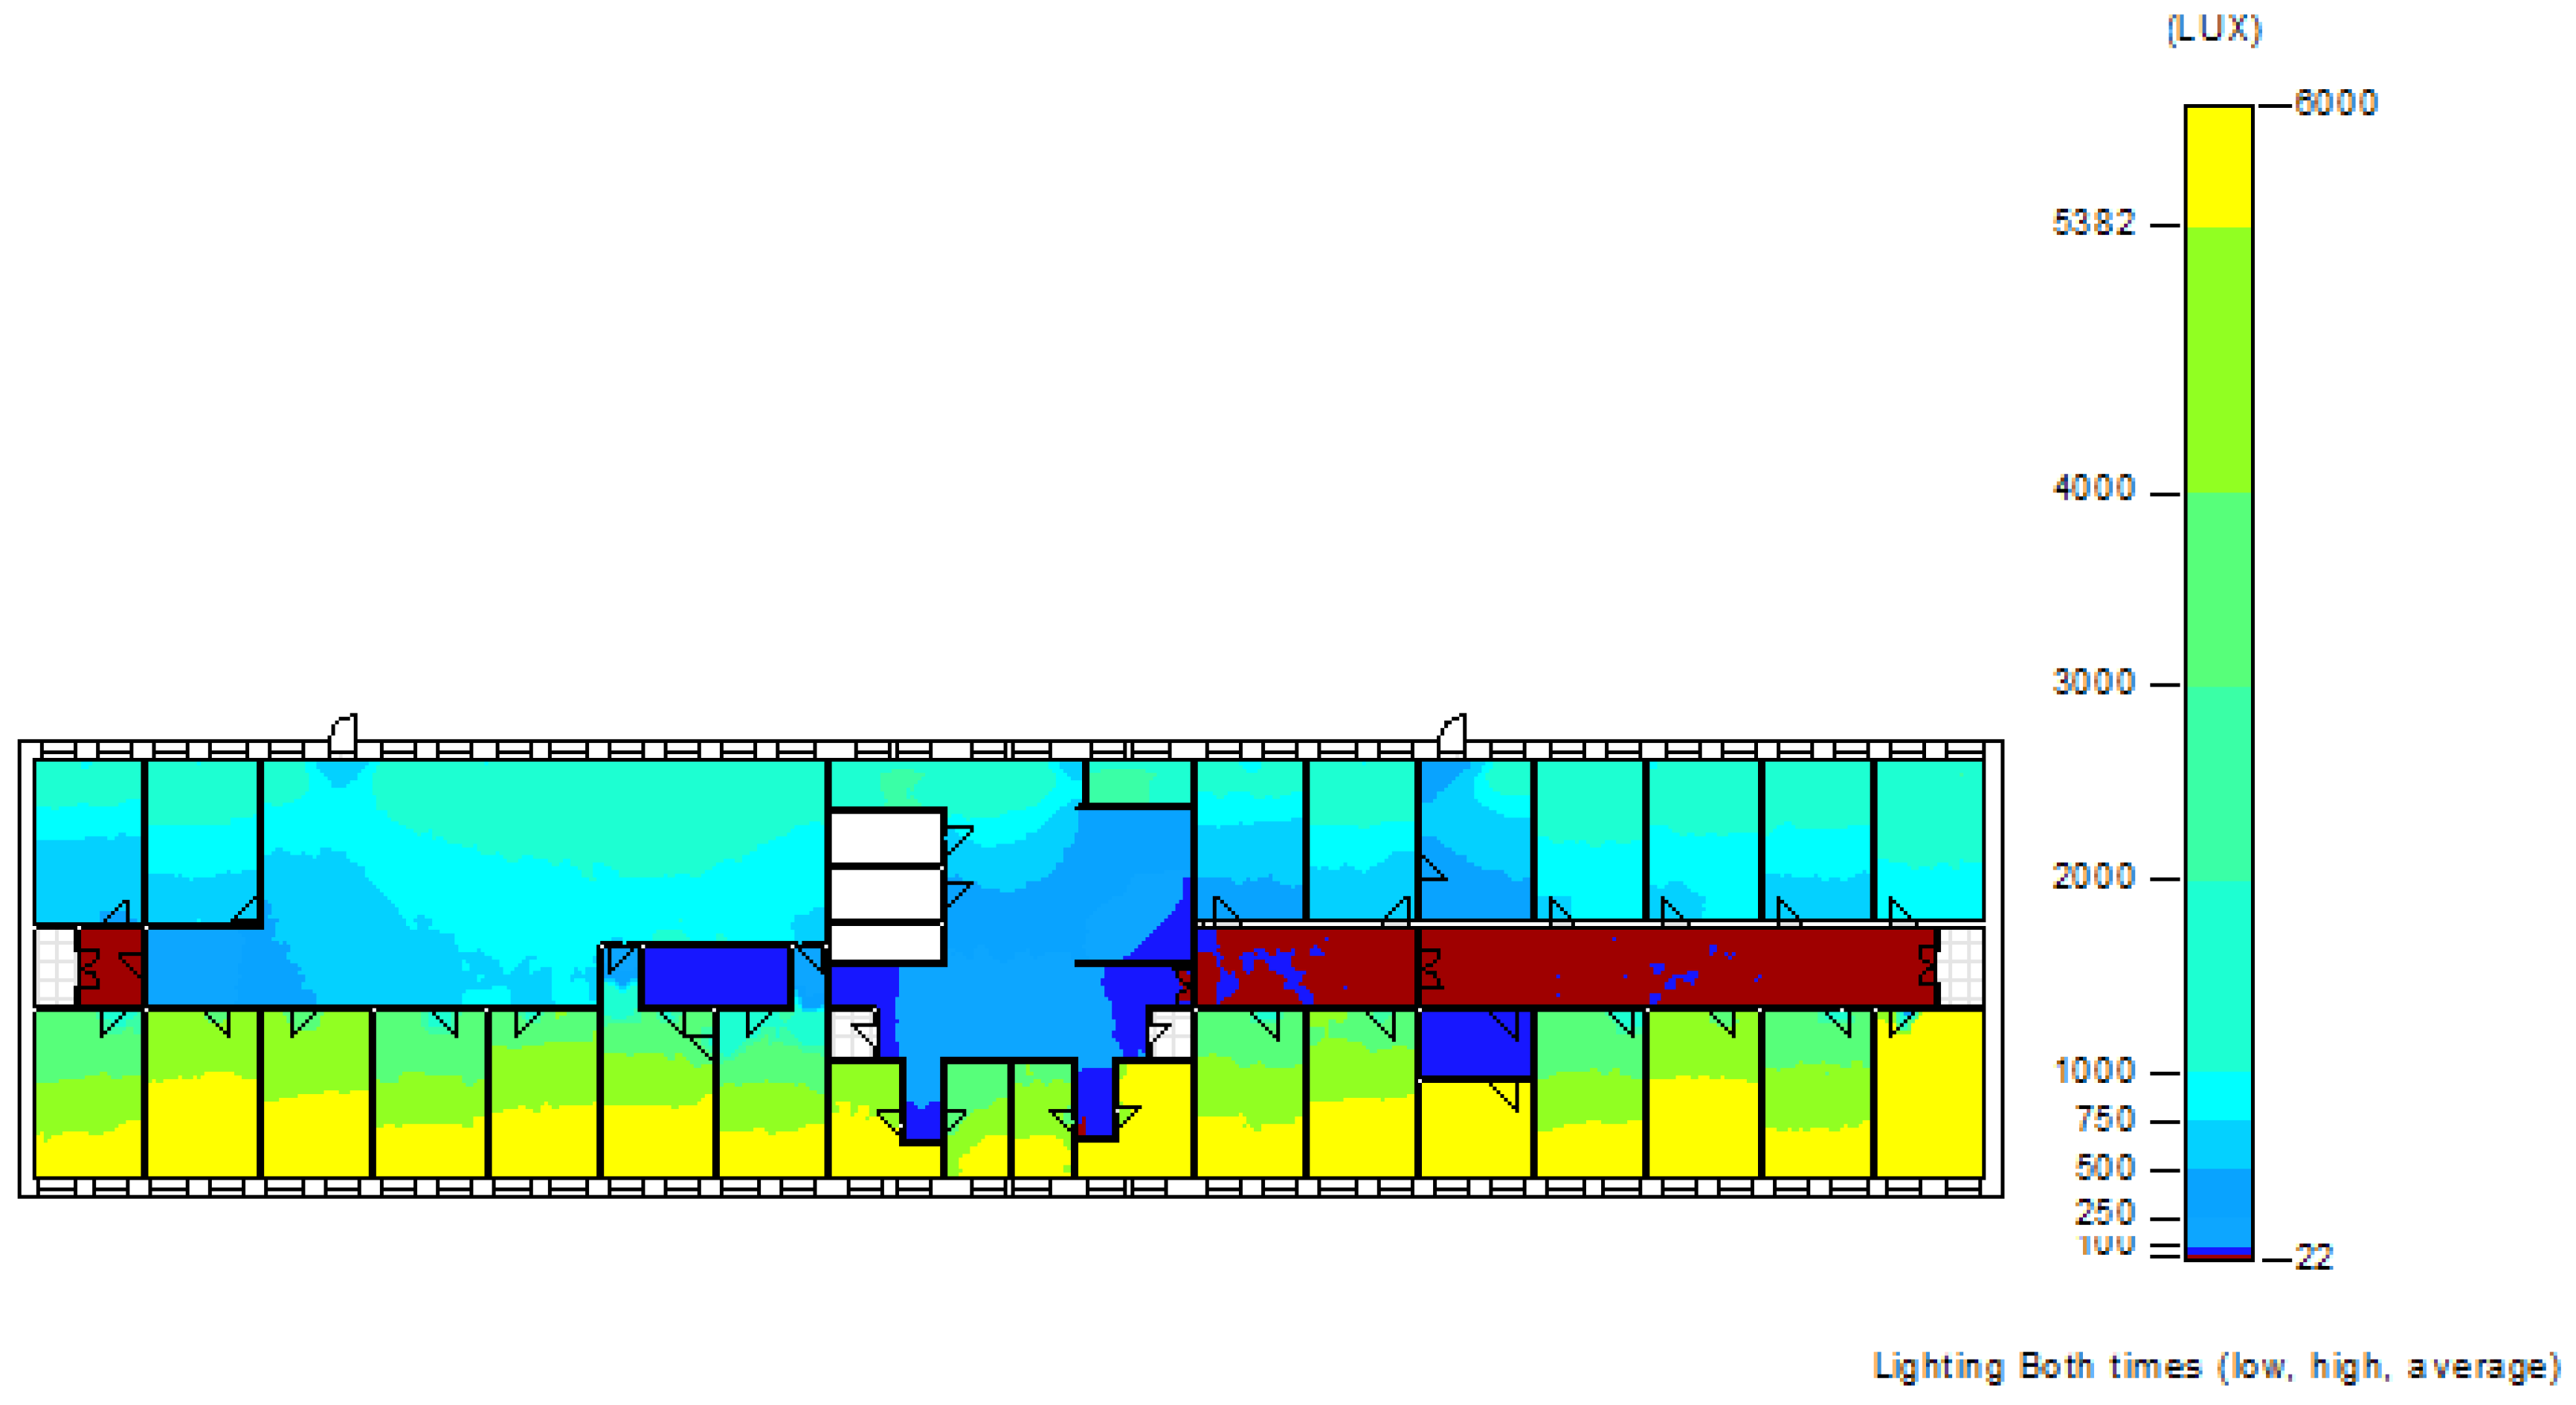
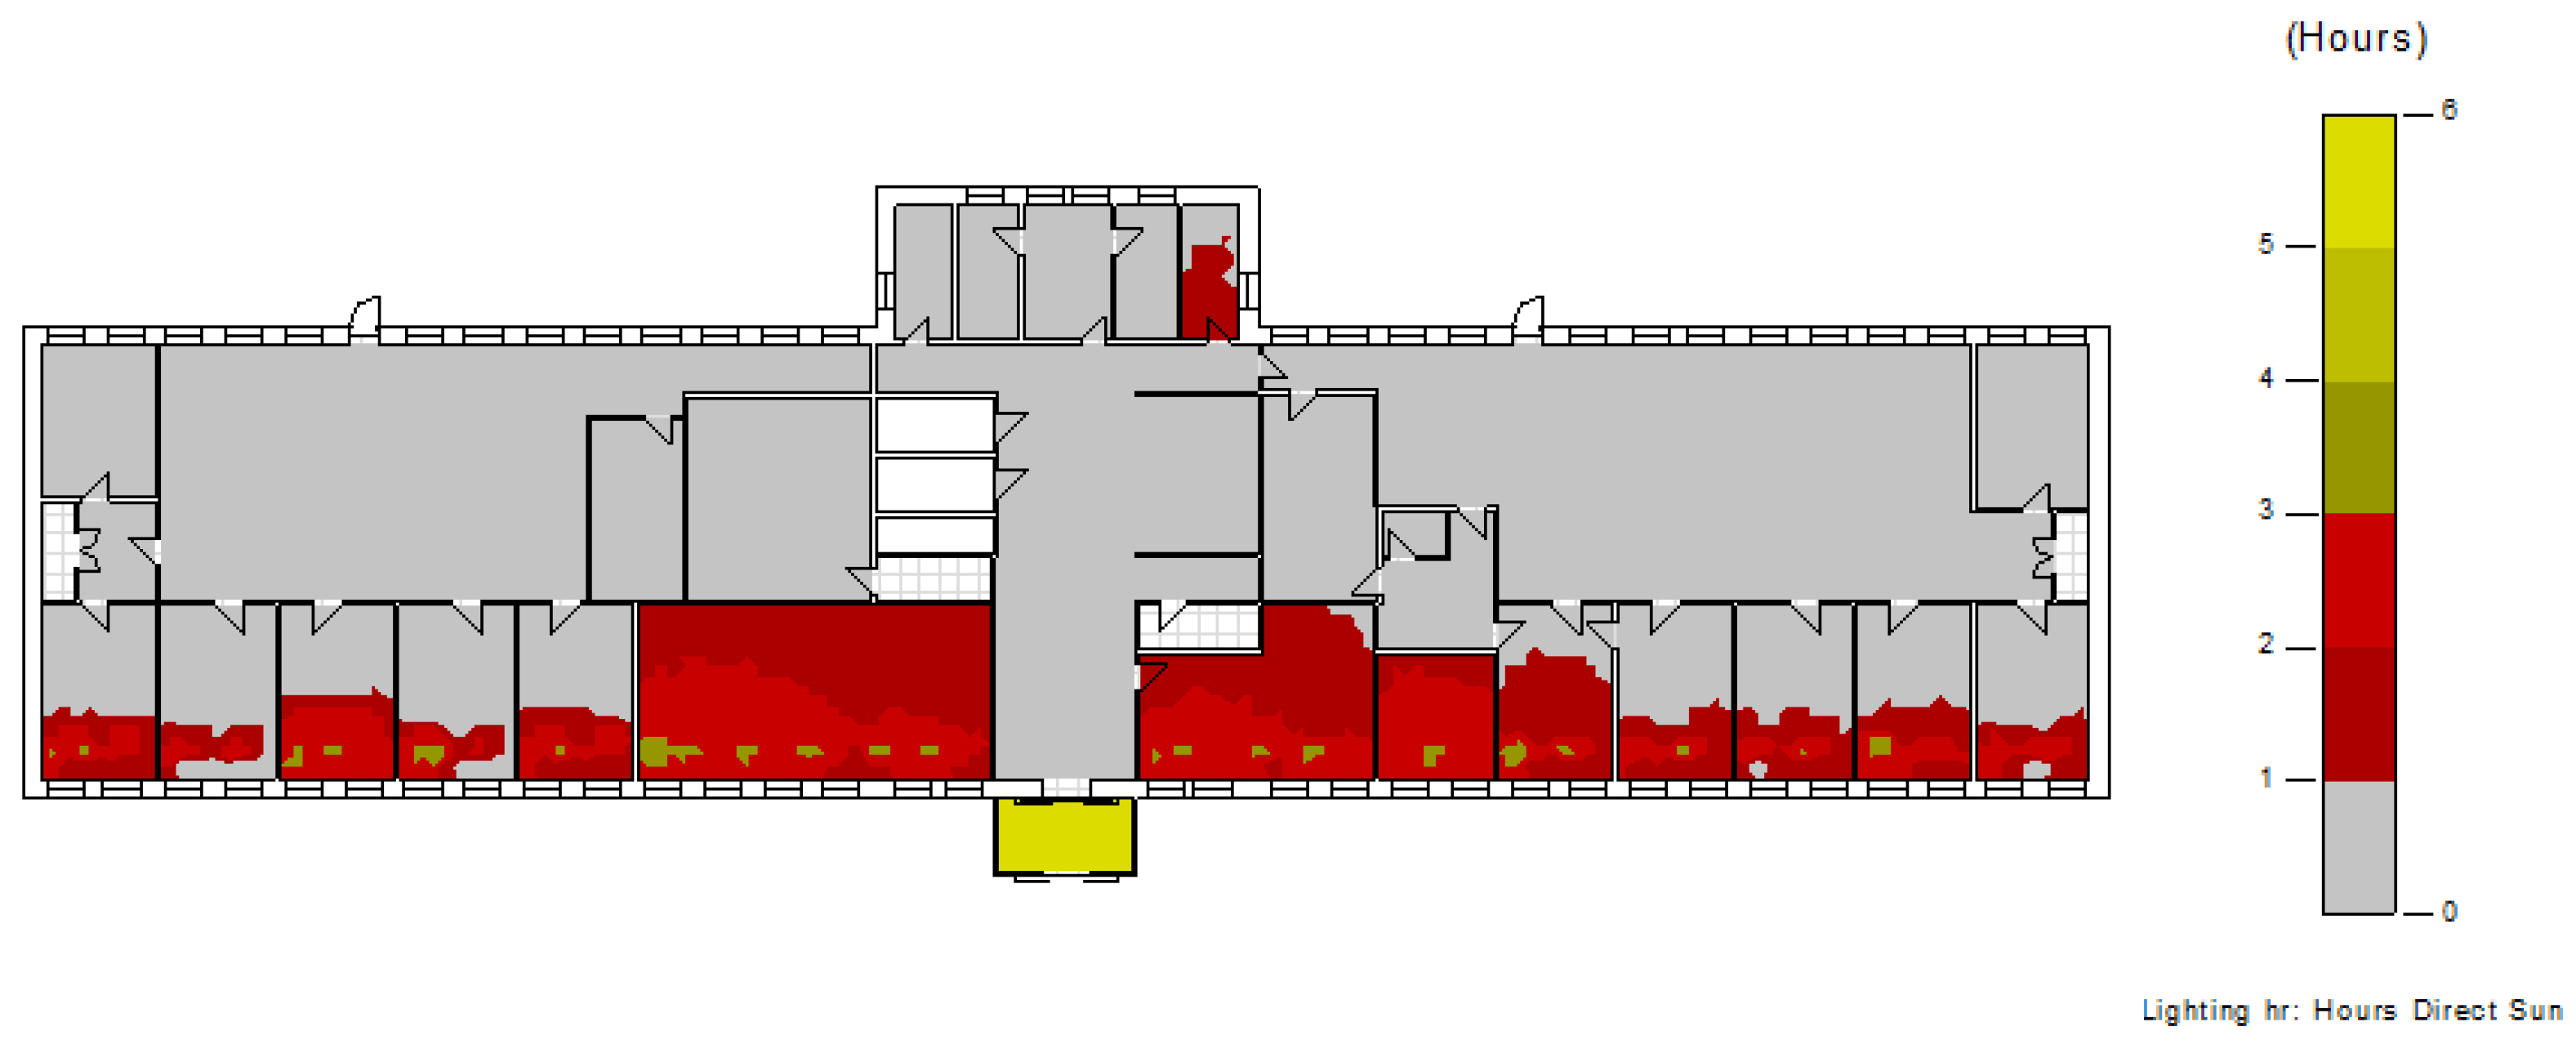
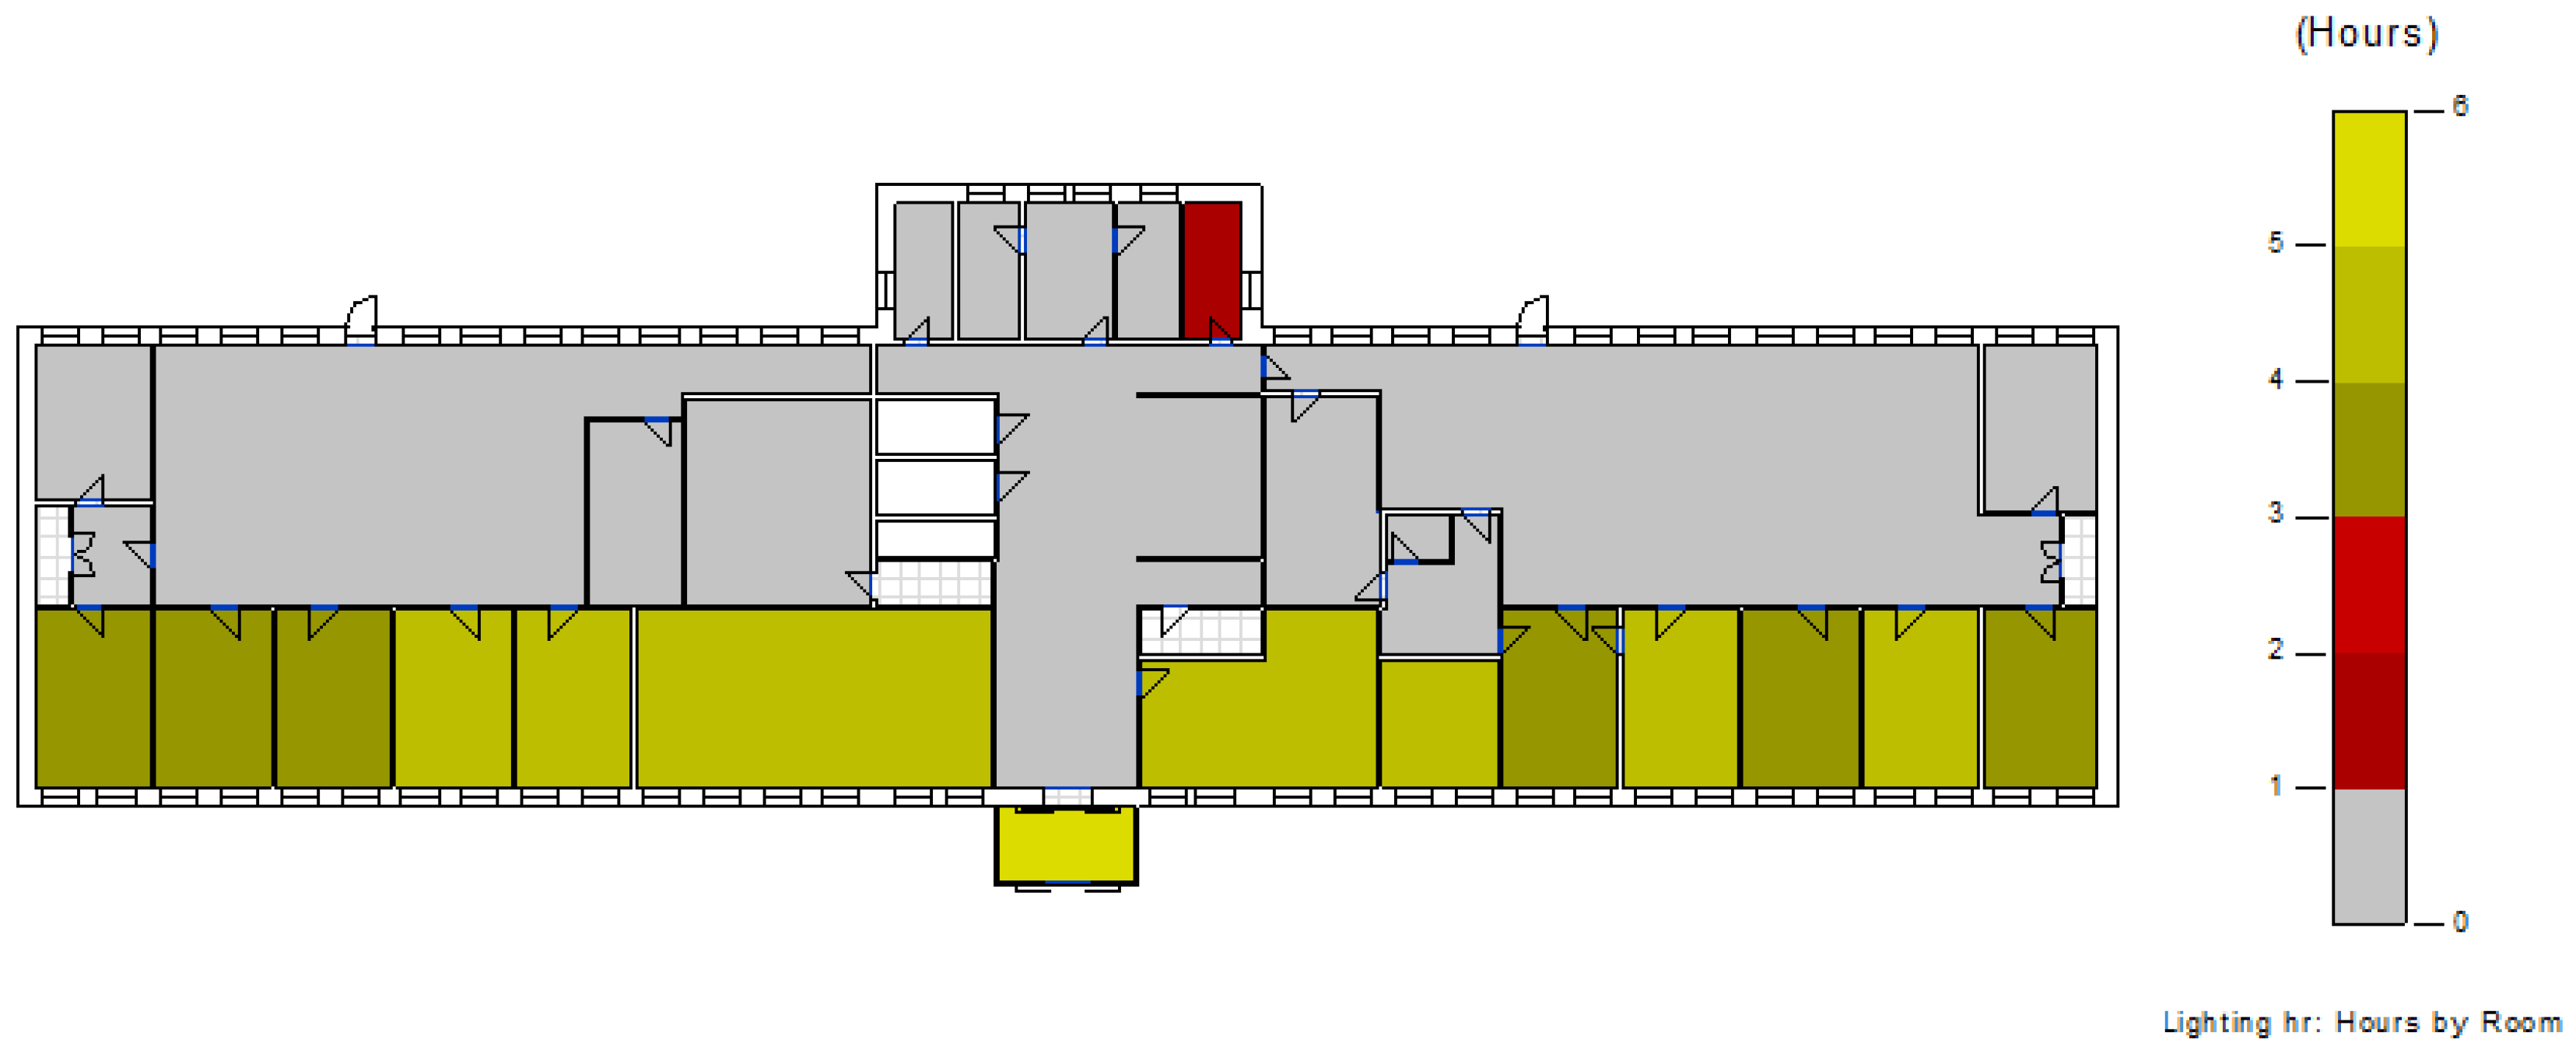
The results of the simulation were (see Figure 20, Figure 21 and Figure 22):
Total Equinox (low, high, average)—41% Passing. Building scores 0 LEED points.
29% either time below the threshold.
31% either time above the threshold.
9:00—71% Passing.          15:00—51% Passing.
29% below threshold.         19% below threshold.
0% above threshold w/o shades.    30% above threshold w/o shades.
Considering that the building has blinds for manual use to provide shade, if said blinds were automated, the results would be as follows:
Total Both (low, high, average)—71% Passing. Very close to scoring near scoring (75% would be necessary).
9:00—71% Passing.      15:00—81% Passing.

4.5.4. Solar Access

The solar lighting analysis or solar access study allows determining if space is receiving enough natural light throughout the day. It is also called daylight access, and many countries and regions are now requiring that new buildings meet solar access standards, such as SEPP 65 in Australia [75]. This type of analysis calculates the number of hours that direct solar radiation affects a room, for a given day, and for a set range of hours on that day [76].
For this case, the data were:
  • Date/Time: 09/21 from 9:00 a.m. to 3:00 p.m. (6 h).
  • Threshold: minimum of 3 h.
  • Analysis plane height: 1 inch above the floor.
The results of the simulation were (see Figure 23 and Figure 24):
From 9 a.m. to 2 p.m.—47% of Rooms Analyzed meet a minimum number of hours of Direct Solar Passing.
47% of rooms have ≥3 h.
52% of rooms have 0 h.

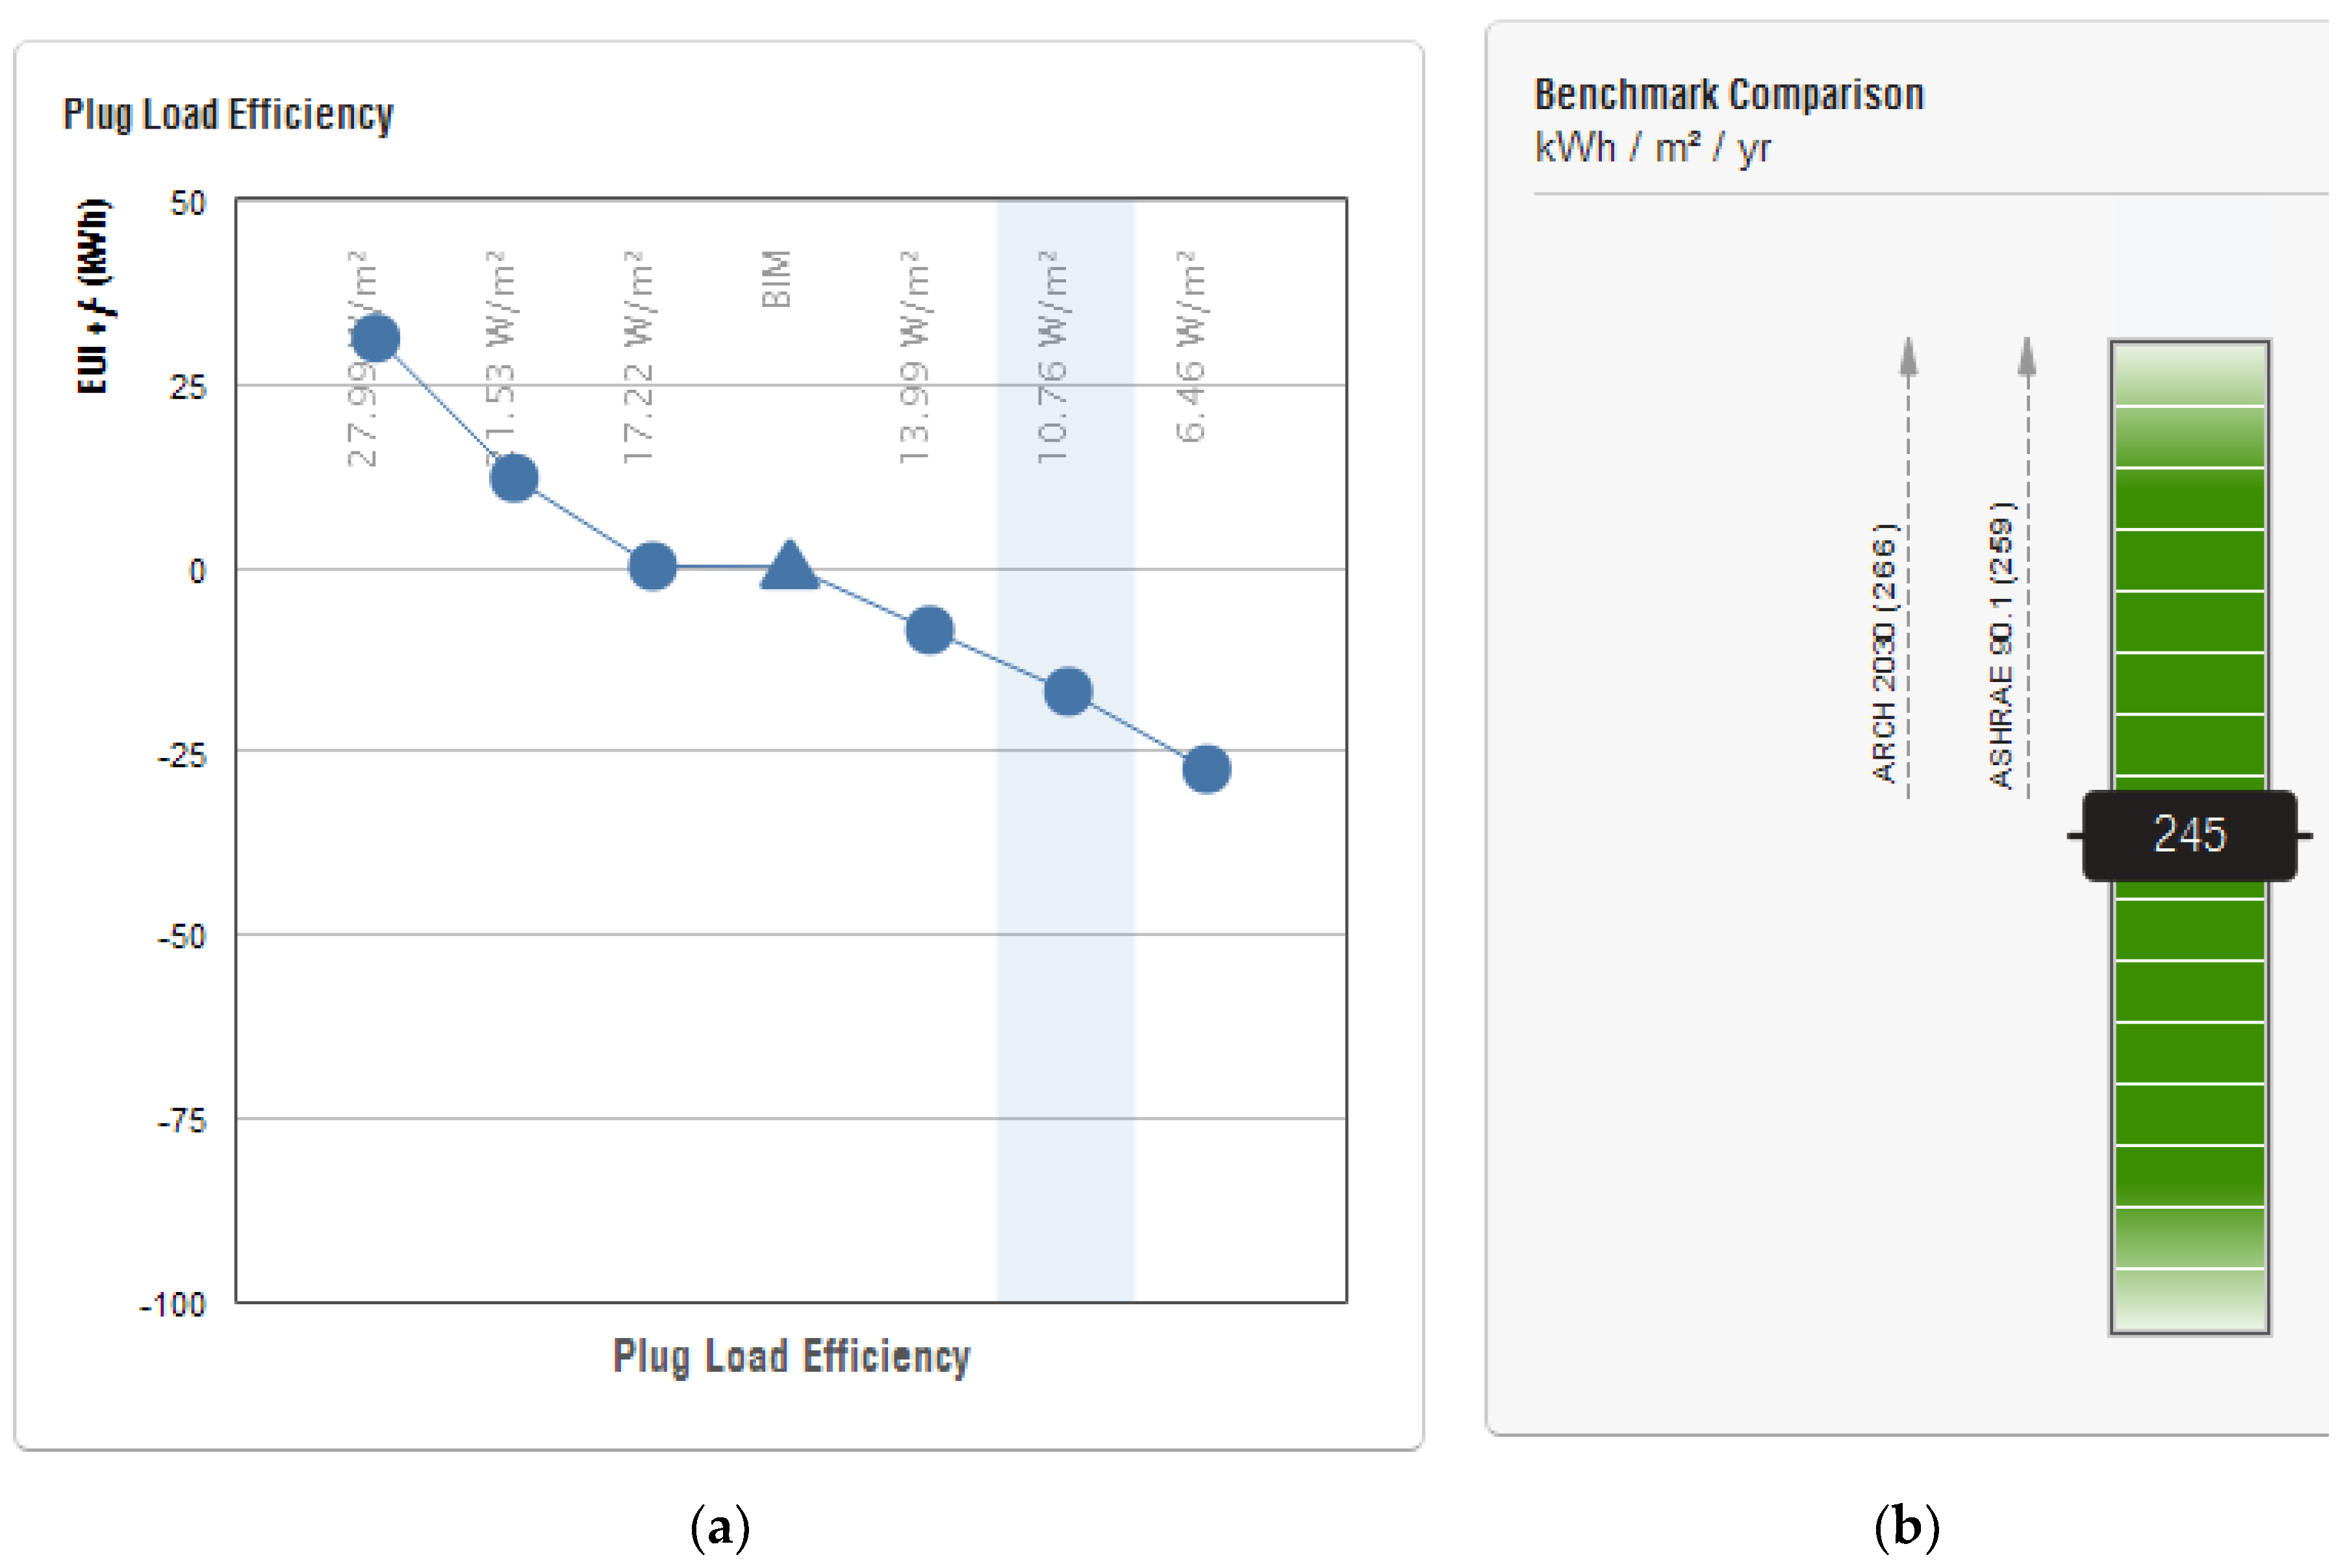
4.6. Improvement of Installed Electrical Power of Equipment in the Building. (Efficient Consumption Equipment)

This improvement consisted of the installation of more efficient equipment than that currently installed in the building (elevators, electromedical equipment (RX), office equipment, etc.).
The results obtained after applying the improvement in the energy simulation were (see Figure 25 and Table 4):
  • Consumption: 244.57 kWh/(m2 year).
  • Energy-saving: 14.54 kWh/(m2 year).

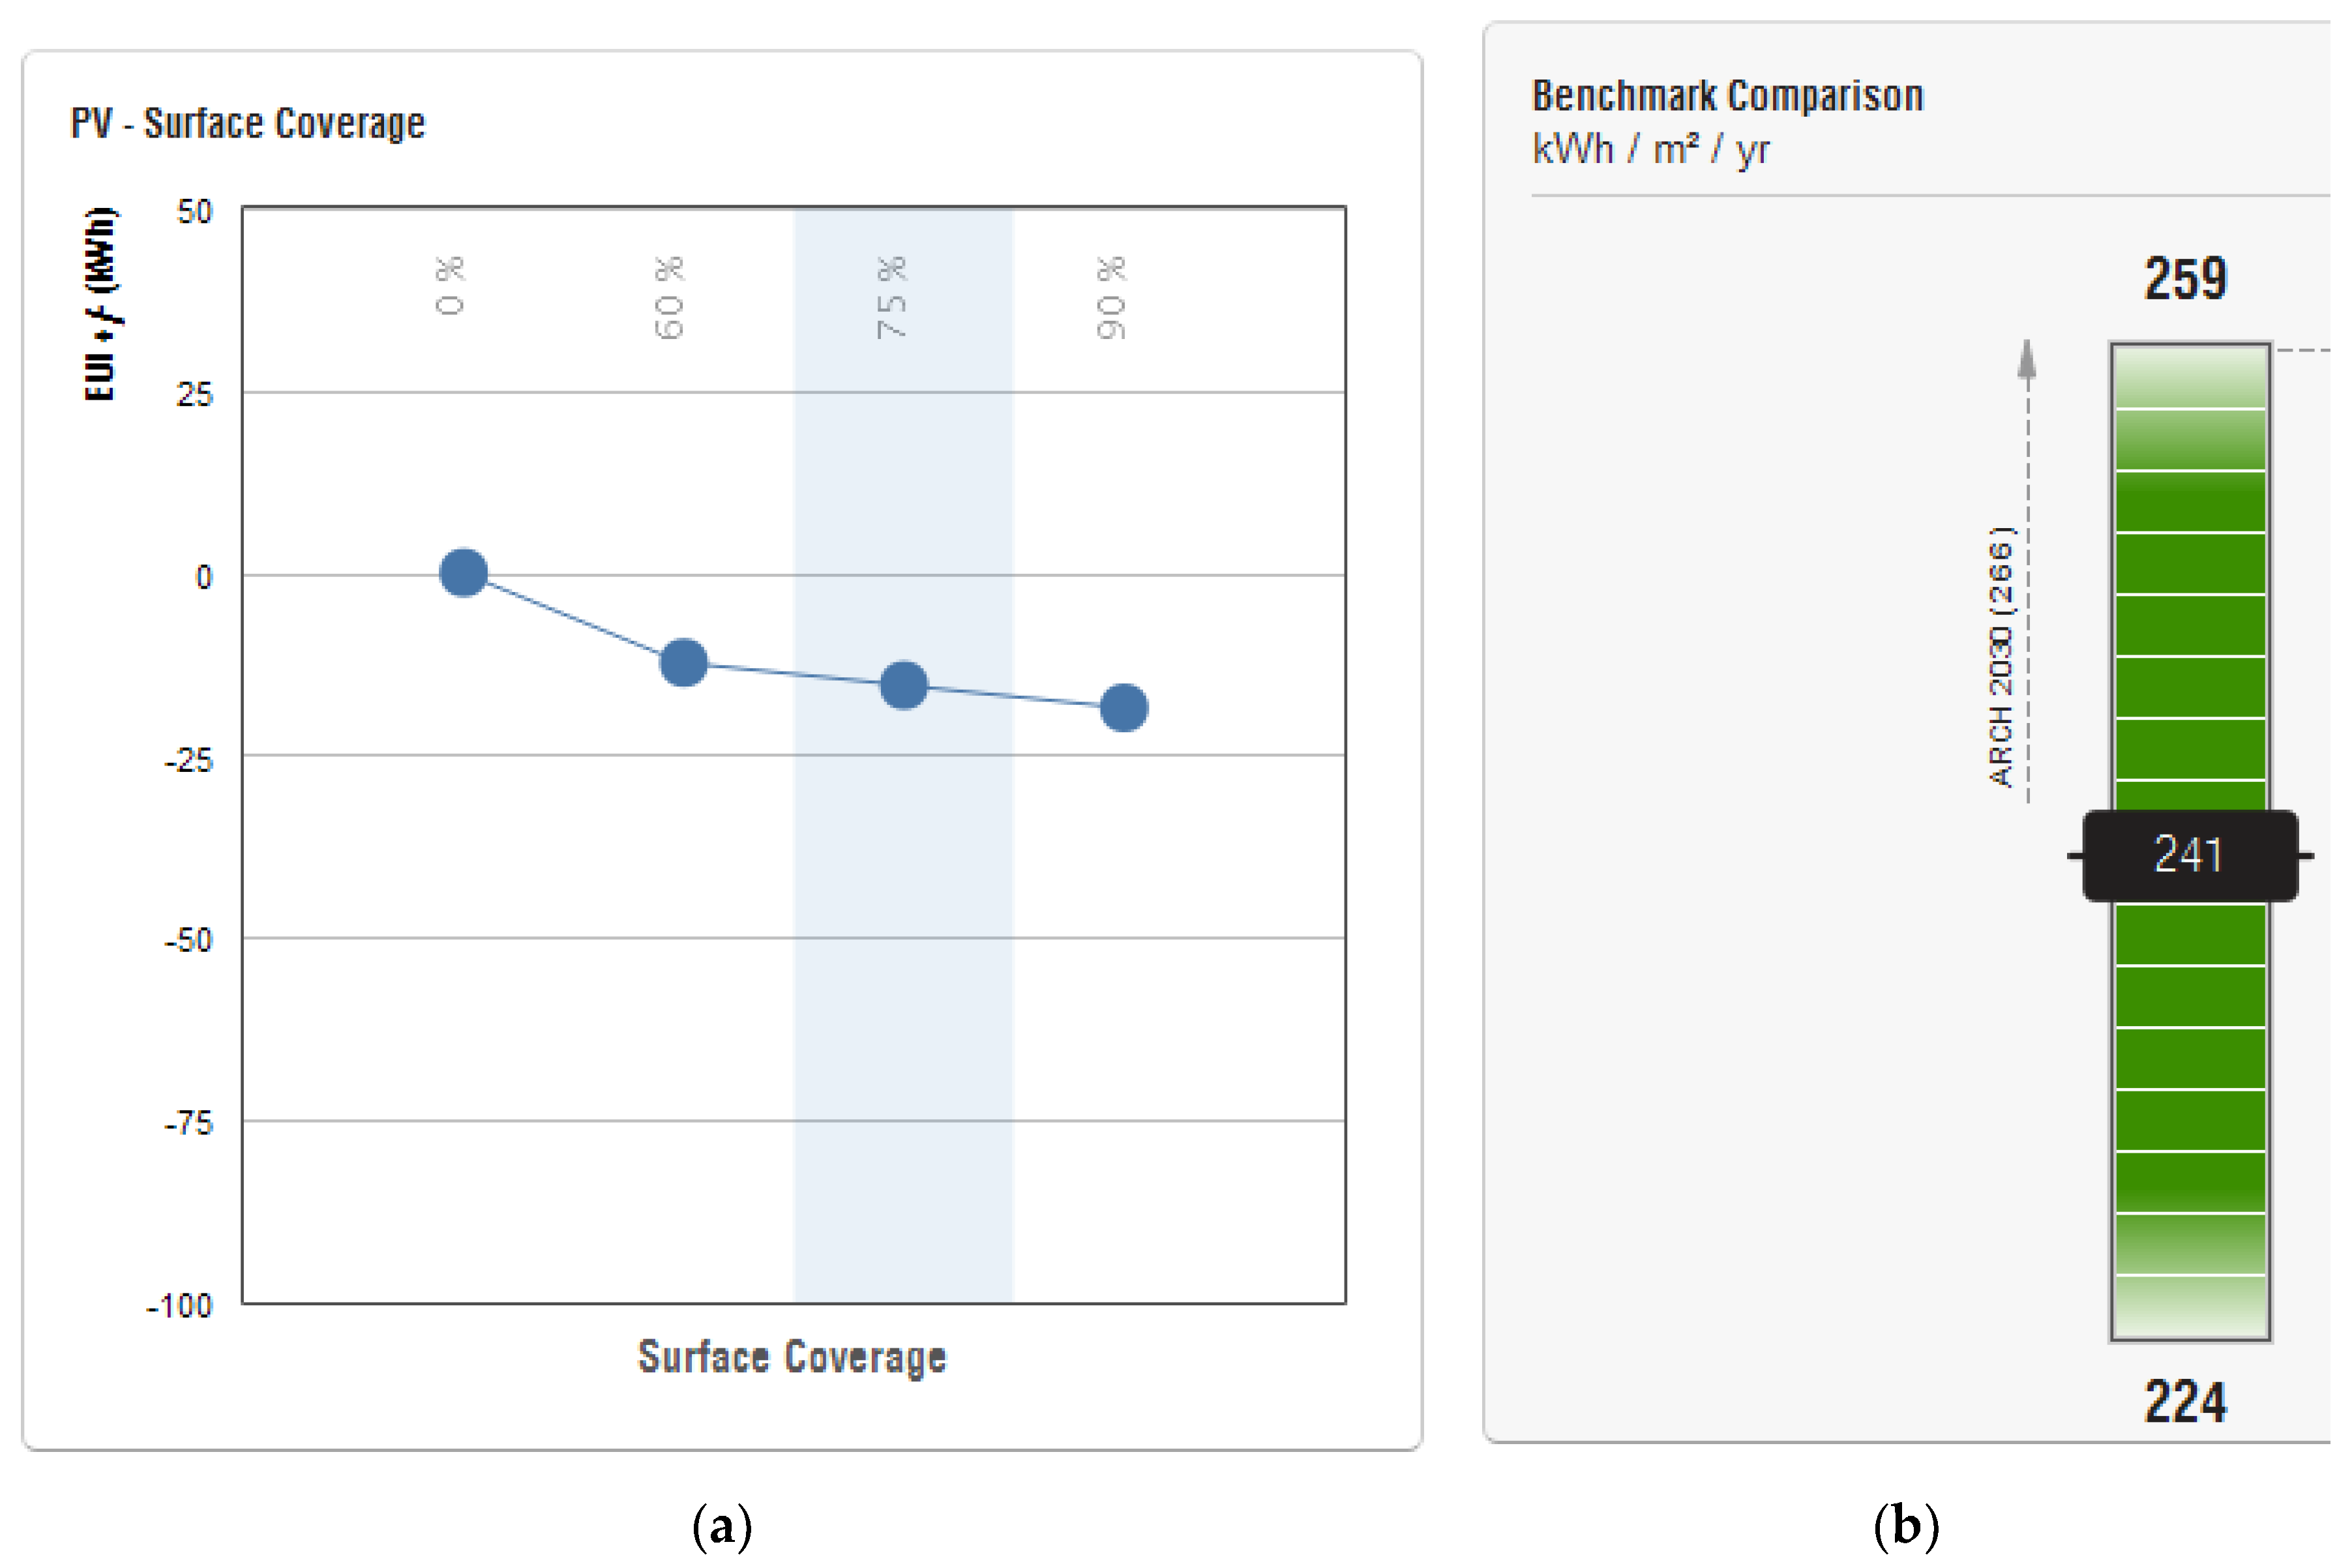
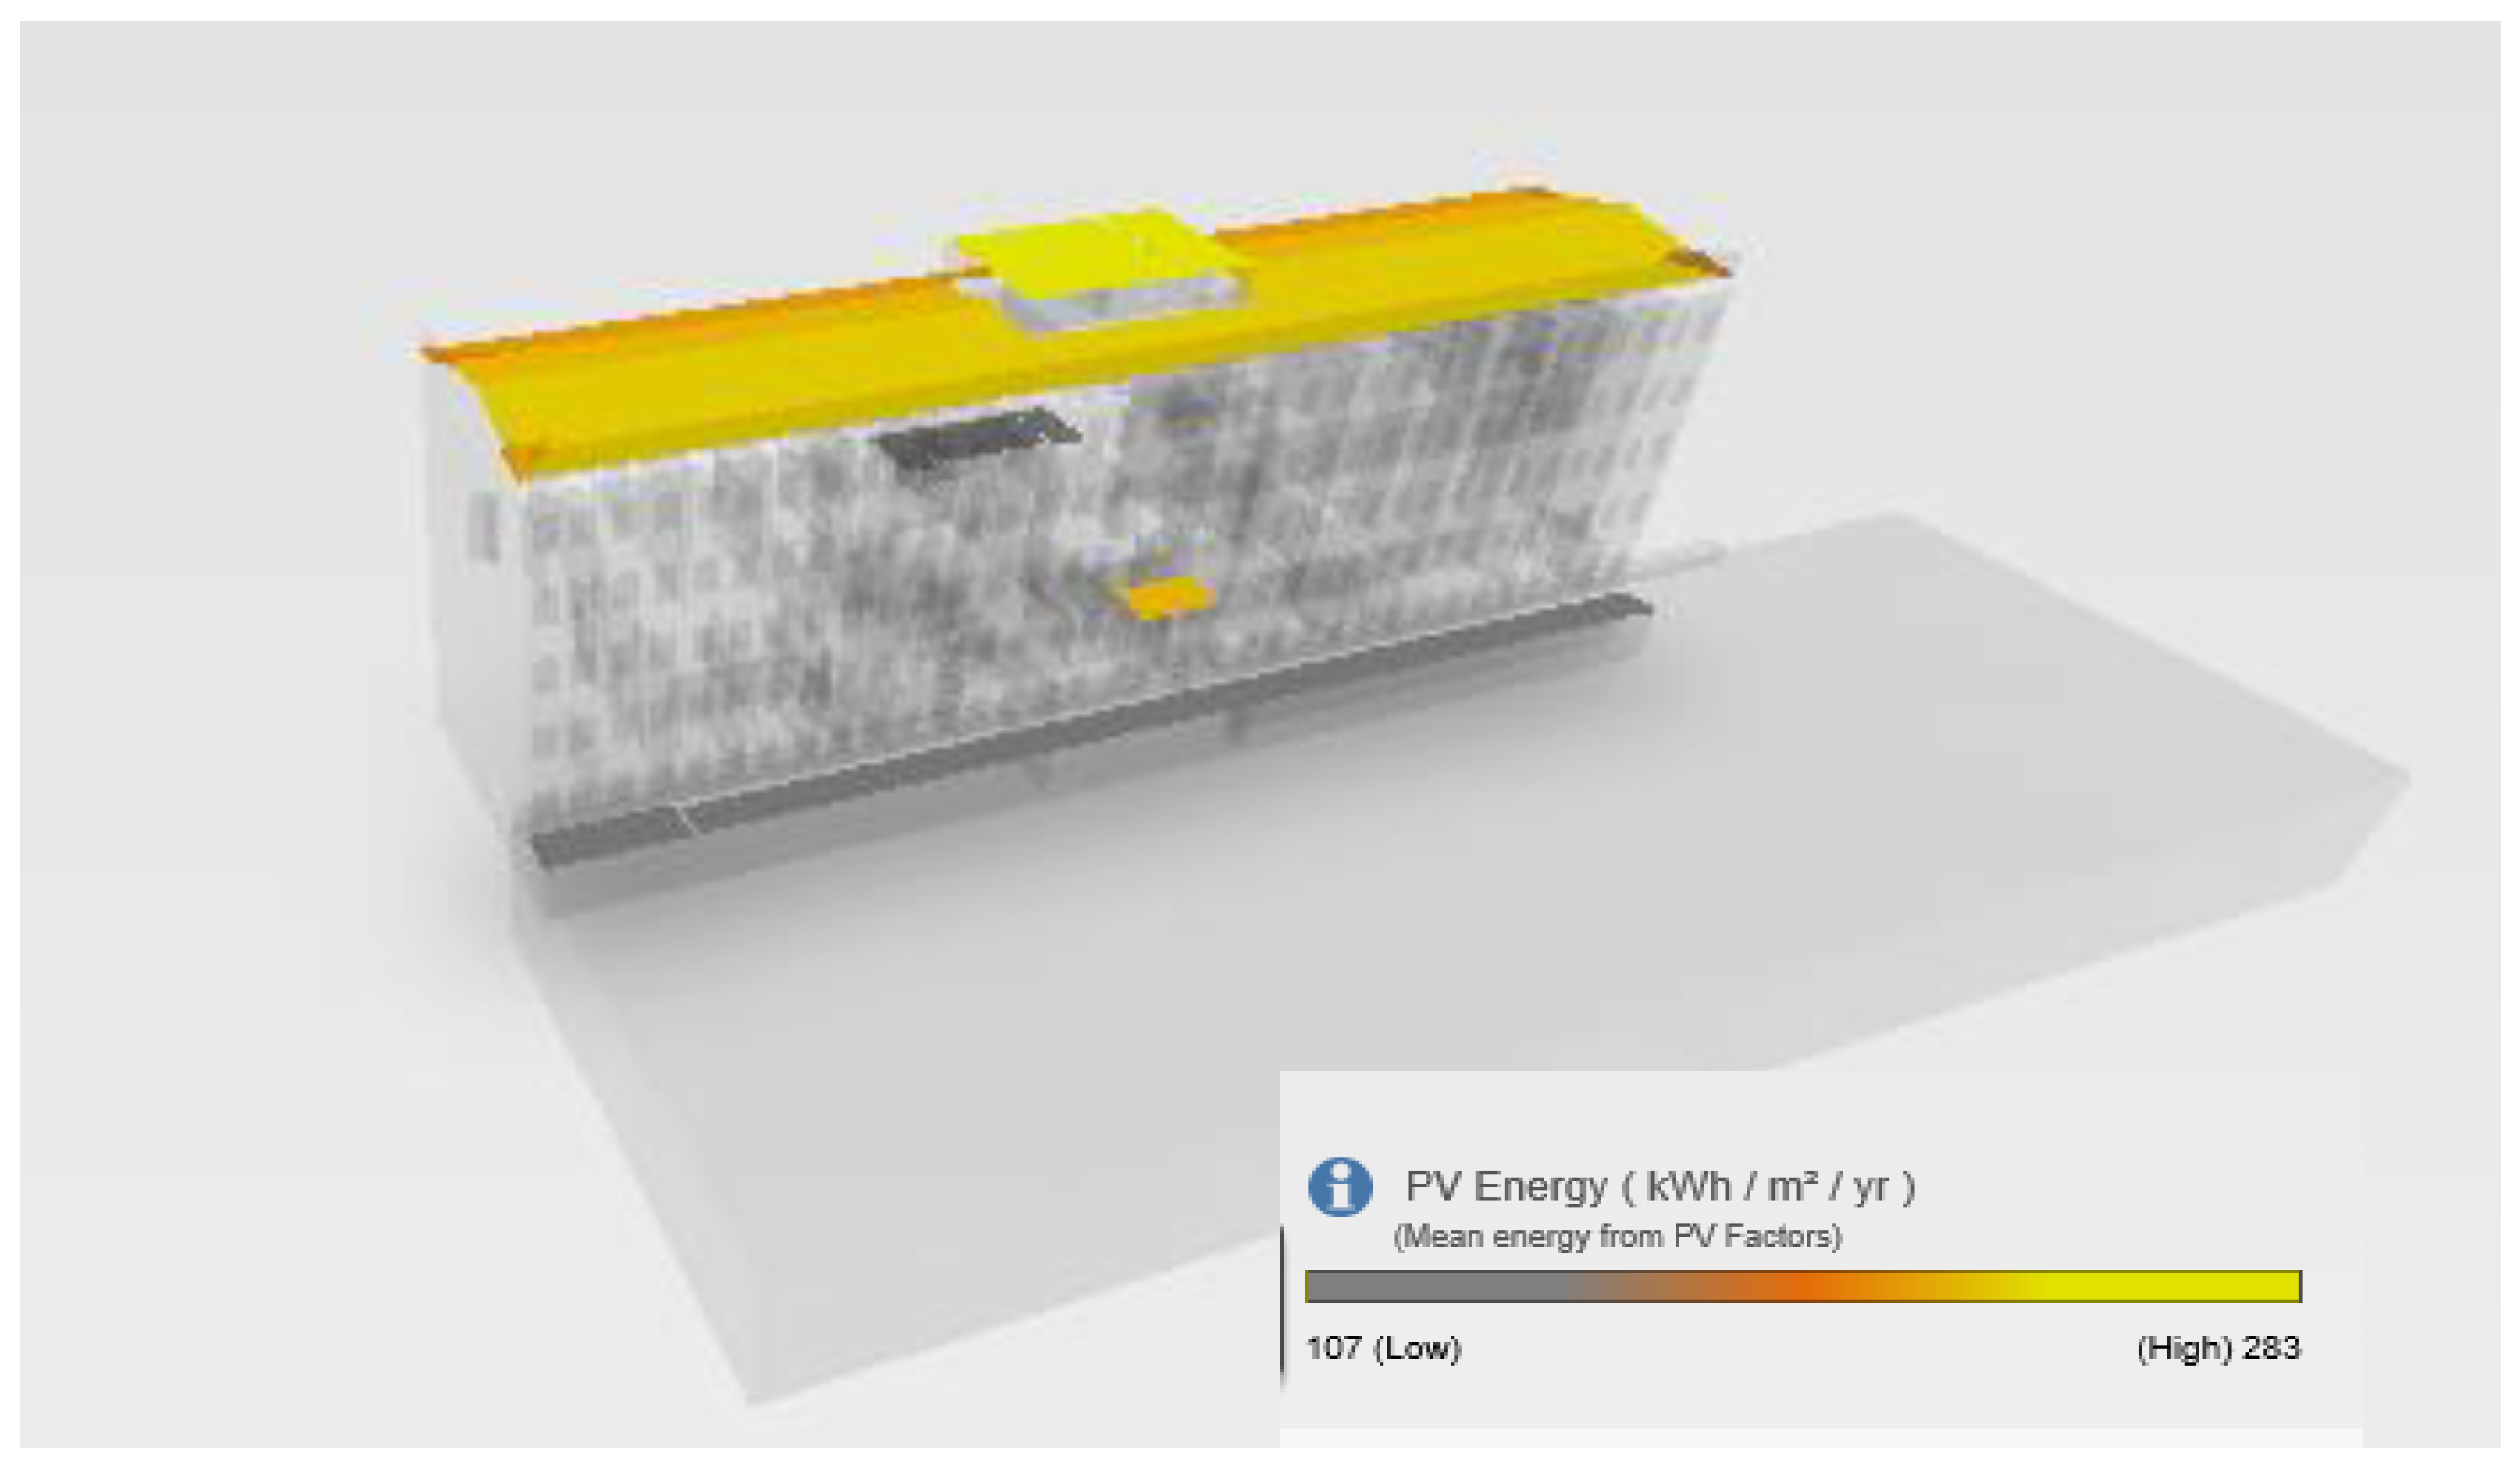
4.7. Improvement of Electric Power Generation. Installation of Photovoltaic Panels on the Roof

This improvement consisted of the installation of photovoltaic panels of high efficiency on 75% on the building’s roof. The results obtained after applying the improvement in the energy simulation were (See Figure 26 and Table 4):
  • Average consumption: 241.10 kWh/(m2 year).
  • Average energy saving: 18.01 kWh/(m2 year).
In this case, as can be seen in Figure 26b, the energy simulation gave us three values again, the best, the average, and the worst possible result. This is because the BIM energy analysis software, for this factor, analyzes various possibilities since it considers that the value of solar radiation is not a fixed constant. Therefore, in this case, we were left with the average value, although if favorable solar radiation circumstances occur, we could have greater energy savings.
Regarding the installation of REVIT photovoltaic panels, it also analyzes the optimal surface for the placement of the panels, as well as the photovoltaic energy to be obtained on the said surface [77]. (See Figure 27).
Once the different proposals have been analyzed in isolation, we observed the results of applying together all the solutions proposed above.

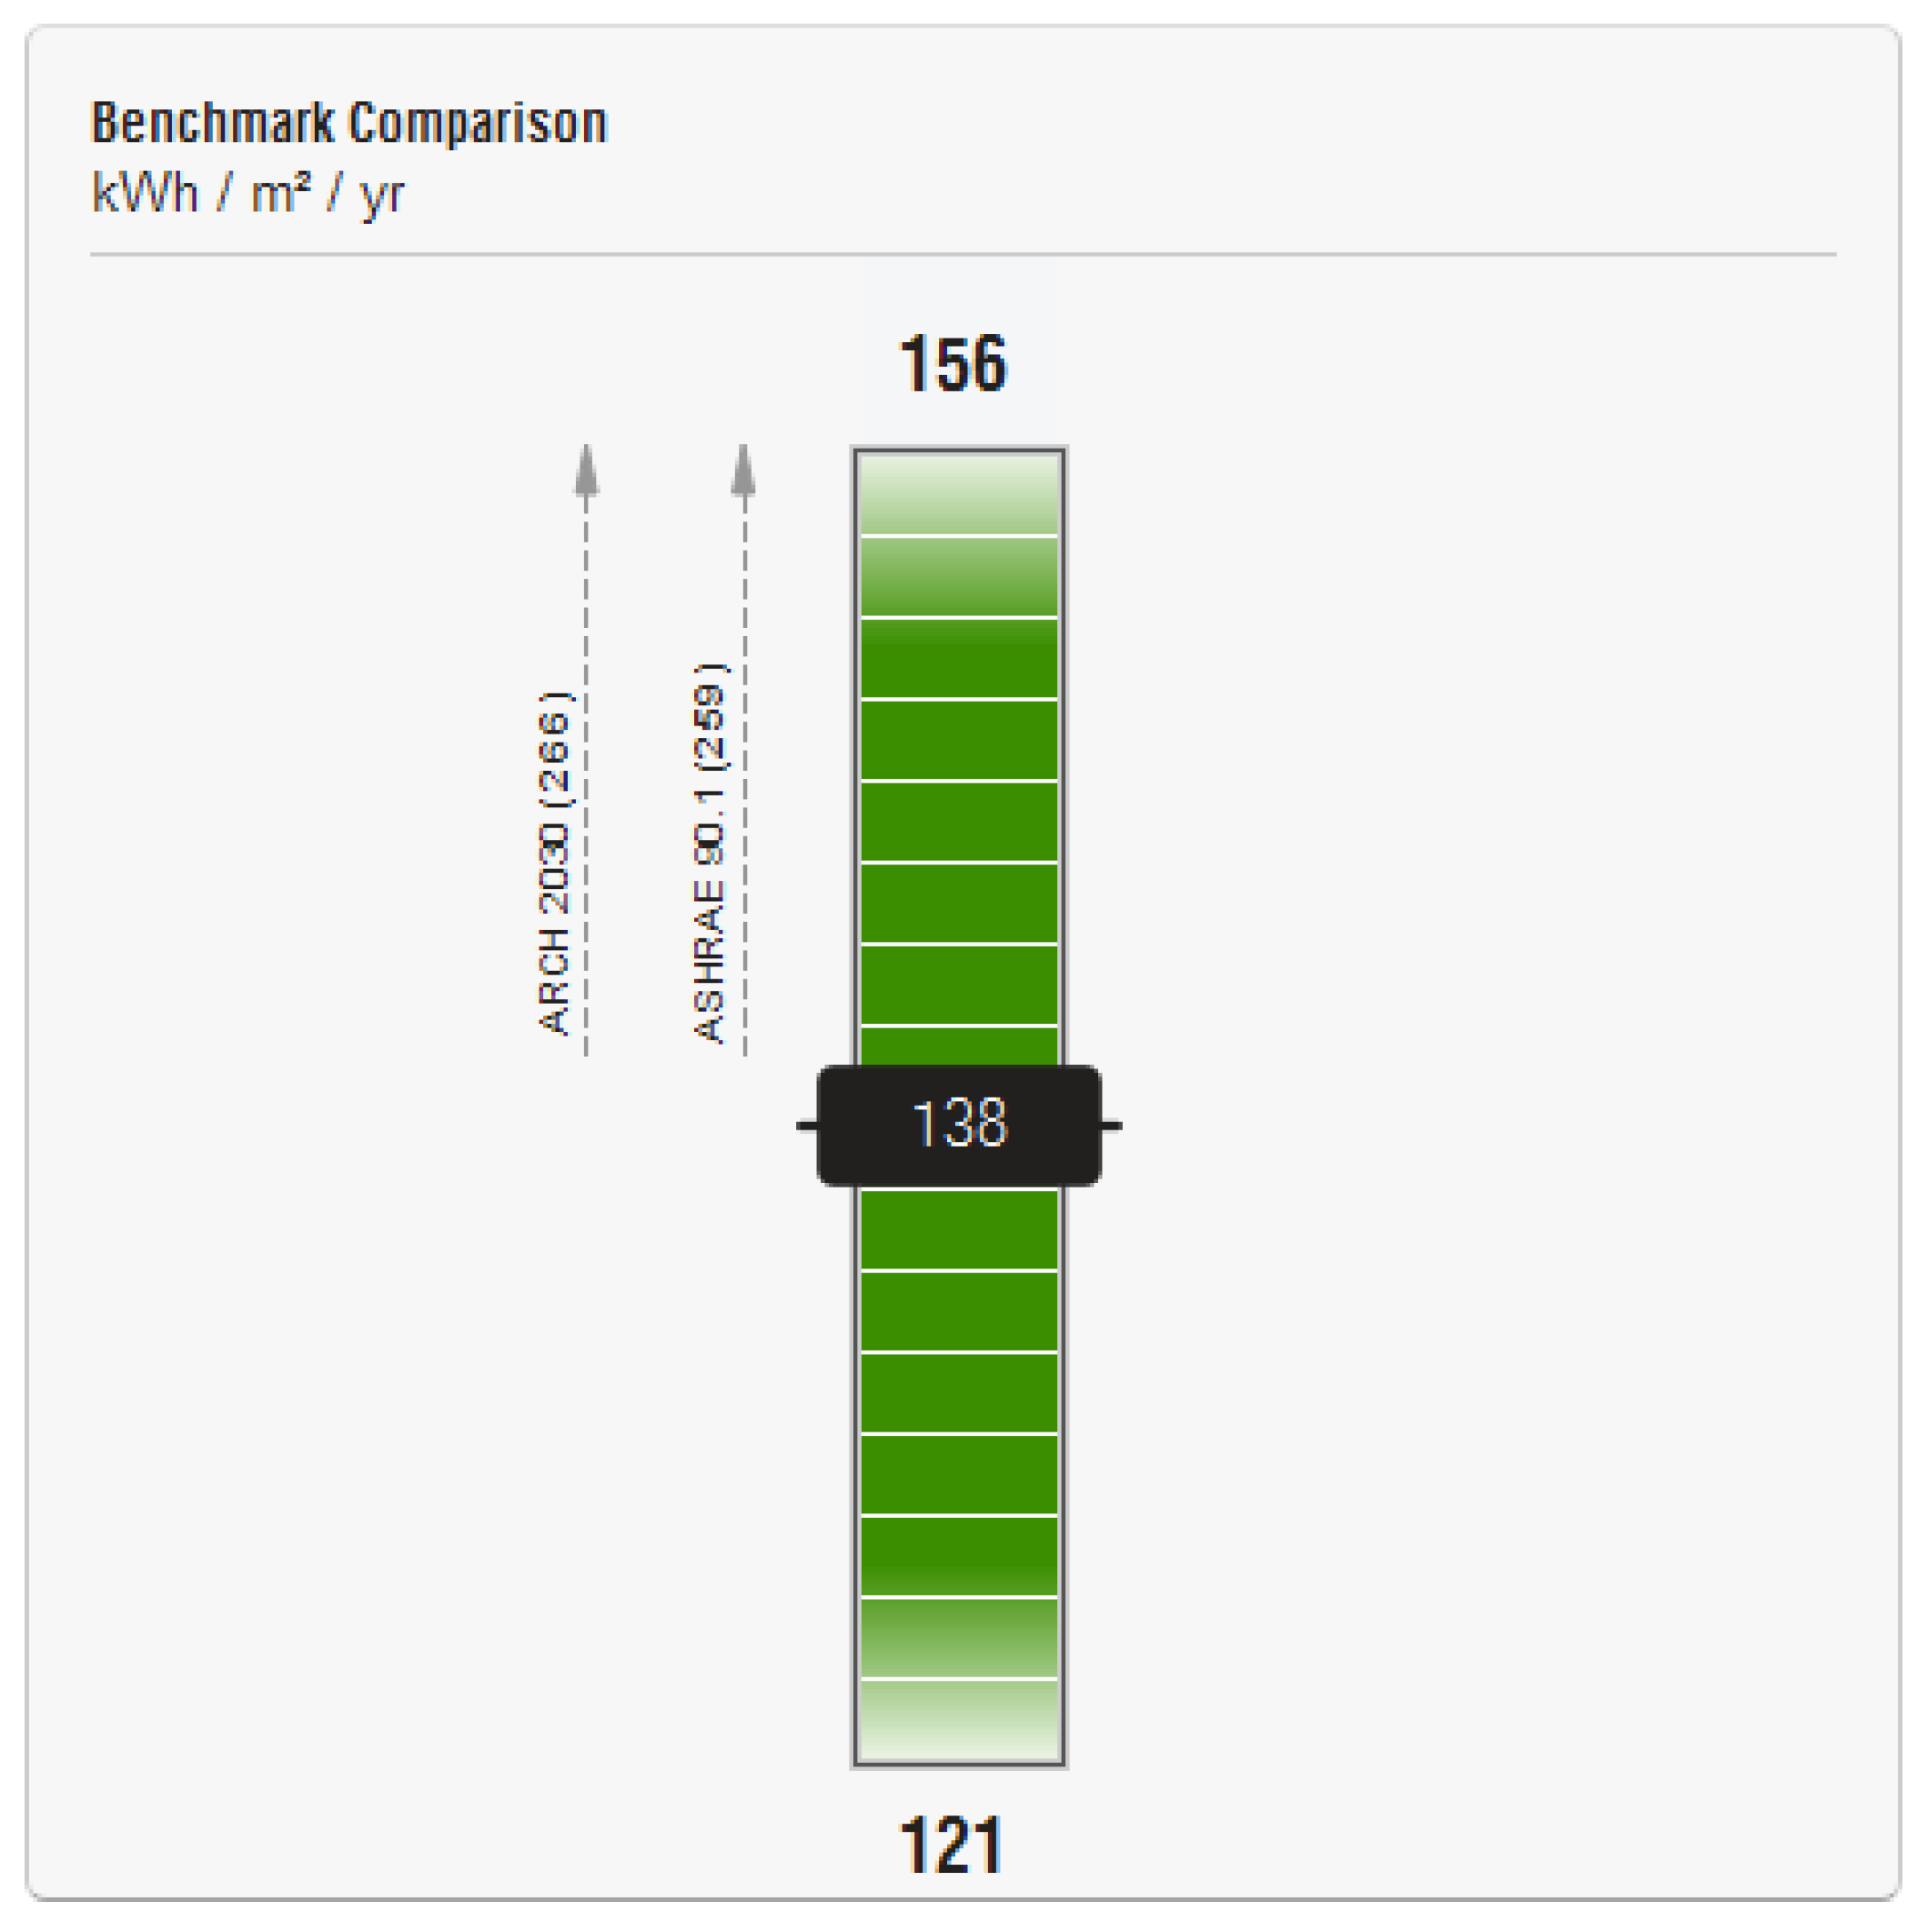
4.8. Simulated Joint Global Improvement of All the Proposed Alternatives Applied

In this section, all the best previously studied from Section 4.2, Section 4.3, Section 4.4, Section 4.5, Section 4.6 and Section 4.7 were combined, to obtain the total overall improvement of applying all the proposed measures.
The results obtained after applying the global improvement in the energy simulation were (Figure 28).
  • Average consumption: 138.17 kWh/(m2 year).
  • Average energy saving per m2: 120.94 kWh/(m2 year).
  • Total average energy saving (useful area 4908 m2): 593,573.52 kWh/year.
In this case, we continued selecting average values, as commented in the previous section.
With the proposed improvements, the total energy saving of 47% was achieved over the current situation.
In summary, we can graphically represent the different scenarios analyzed (Table 4) in the applied energy simulation (See Figure 29). This section shows the graph of the different improvement alternatives studied in the energy simulation, where you can see the savings of 47% of the overall improvement compared to the initial situation.
With the results shown, we can say that the BIM6D model allowed us to perform a comprehensive analysis of the impact of the rehabilitation, comparing the existing state with the future state in terms of energy and economic balance. That will enable us to assess all the improvements as a whole so that it will be possible to select alternatives of greater energy efficiency [70], less environmental impact and greater comfort for the users of the building, which in turn will lead to an improvement in the energy certification of the building [62].
It should be noted that the Treatment and Diagnostic Center, being an old building, does not have its own energy meters but shares the meters of energy supplies with the rest of the buildings that are part of the University Hospital of Jaén. It is, therefore, difficult to verify the consumption calculated in the energy simulation with the real consumption of the building. However, the energy consumption of all the buildings of the University Hospital of Jaén, in 2019, was 380 kWh/m2, the result obtained in the 259 kWh/m2 energy simulation would be admissible, taking into account that the analyzed building has a 12-h operating time since it does not house hospitalization, emergency department or intensive care unit that require 24-h operating hours and are housed in other buildings. Considering the above, it would be pertinent for future work to install meters or measuring equipment that would allow the actual consumption of the building to be obtained and verify the calculation performed by the simulation software.
It should be noted regarding the software used, that in the model used, no limitation was found as to the number of spaces or elements defined in the building, which, as already stated in the corresponding section, is 226 spaces, with 354 windows and 242 doors. It should also be noted, as mentioned in the limitations section of the study, that to propose energy efficiency improvements, they must be selected from a list that is predefined in the performance diagrams. However, it should be indicated in this regard, that this way of selecting the improvements allows the selecting and/or discarding in a very agile way. For example, in our BIM model, it was quickly observed that the most important improvement measures were those of HVAC, Plug-load, and lighting. In contrast, other measures, such as improving the insulation of the building envelope, meant fewer energy savings, which together with the economic cost, as well as the laborious execution, even more so in a hospital building, discouraged such measures of improvement in the energy demand of the building.
Finally, the 13% energy saving achieved with energy efficiency improvements in lighting (LED lighting and Daylighting and Occ. Control) is a highlight. These are measures which are easily applicable to hospital buildings since they do not interfere excessively in the hospital’s continuous activity, in addition to being short-term amortized investments compared to other measures to improve energy efficiency in hospital buildings [70].

5. Conclusions

With the results applied and analyzed in this work, it can be seen how the proposed methodology may become a powerful energy analysis and simulation tool. The applied methodology allows the analysis and energy simulation of the BIM 6D model of a modeled building. Therefore, we can simulate the most sustainable measures from the point of view of energy-saving and energy efficiency, assessing the potential of applying these measures either independently or as a global or joint application of such measures. On the other hand, the applied methodology allows us to rule out other less interesting and not so good a priori measures in a simulated way.
Consequently, we can affirm that the proposed methodology can become an effective tool to help in decision-making and to be considered when rehabilitating and modernizing a building from the point of view of energy efficiency and sustainability. In addition, it enables a tool for the analysis of the quantifiable criteria for evaluating the efficiency and sustainability of public buildings in public tenders for administrative contracting, for the award of public projects (whether new buildings and/or rehabilitation of buildings historical or other uses). Although it should be borne in mind that to use these models, in public procurement of works, the result shown should be able to be shown in an open standard, which currently translates this methodology into open BIM, such as, the IFC standard (Industry Foundation Classes) maintained by the BuildingSMART Alliance. This issue is being worked on diligently, both by software developers and by national and international public organizations.
We can indicate that, after analyzing the energy simulation of the case study used as a methodological test of the hospital building, and after carrying out the energy-saving measures of the Global or joint proposal of all the measures of energy saving and efficiency in BIM energy analysis software, an energy-saving of 47% was achieved from the current state, i.e., reducing consumption from a 50 years-old hospital center in half, with the consequent reduction in CO2 emissions, which translates into a more sustainable building. Further, the economic savings due to the reduction in energy consumption need to be considered. At this point, it is worth highlighting the value of interior and daylight in the hospital building, because, at present, it is one of the facilities with the best payback. With the proposed measures (LED + lighting control), an energy saving of 13% was achieved, which, in energy terms, would be 165,645 kWh/year in the BIM model. Further, regarding the improvement of lighting, this proposal can normally be carried out without the need to stop hospital activity, which makes this option highly recommended for these buildings.
These proposed energy-saving measures increase the sustainability of the building. If the project commences with the BIM model itself before materializing these improvements, the evaluation of aspects related to the green building certification systems, where among the most recognized, are LEED from the US, BREEAM of the United Kingdom, or DGNB from Germany, can be conducted. In this study, the software used allowed the calculation of two criteria of the LEED certification, which enabled the verification of the state of the BIM model. Considering the building’s 50 years’ of age, the results were not so far from the standards LEED as you might expect. If the blinds of the building were to be automated, a better correlation would be achieved. This simulation of natural light should be an objective way of evaluating awards in contracting public works.
Finally, it should be noted that the energy model studied with the BIM energy analysis software used is exportable to various formats, such as Open BIM, where an even more detailed energy and lighting analysis can be carried out. However, these studies would lose interoperability with the BIM energy model. This is a key field where researchers are currently focusing on BIM 6D and 7D.

Author Contributions

Conceptualization, F.J.M.-S. and M.J.H.-O.; methodology, F.J.M.-S. and M.J.H.-O.; software, F.J.M.-S.; validation, F.J.M.-S., J.T.-C. and M.J.H.-O.; formal analysis, F.J.M.-S. and M.J.H.-O.; investigation, F.J.M.-S., J.T.-C. and M.J.H.-O.; resources, F.J.M.-S., J.T.-C. and M.J.H.-O.; data curation, F.J.M.-S. and M.J.H.-O.; writing—original draft preparation, F.J.M.-S.; writing—review and editing, J.T.-C. and M.J.H.-O.; visualization, J.T.-C. and M.J.H.-O.; supervision, J.T.-C. and M.J.H.-O. project administration, J.T.-C.; funding acquisition, J.T.-C. and M.J.H.-O. All authors have read and agreed to the published version of the manuscript.

Funding

This research received no external funding.

Acknowledgments

We appreciate the generosity of the management of the University Hospital of Jaén belonging to the Andalusian Health Service for allowing us access to the data of the building and its facilities.

Conflicts of Interest

The authors declare no conflict of interest.

References

  1. Hermoso-Orzáez, M.J.; Terrados-Cepeda, J.; Valderrama-Zafra, J.M.; Orejón-Sánchez, R.D. BIM as a Didactic Tool in Project Engineering. The Methodological Experience of the 1st Master BIM-DGP in UJAEN. In Proceedings of the 23rd International Congress on Project Management and Engineering, Málaga, Spain, 10–12 July 2019; AEIPRO_IPMA, Ed.; Licensee AEIPRO: Malaga, Spain, 2019; Volume 1, pp. 1945–1956. [Google Scholar]
  2. Jin, Z.; Gambatese, J.; Liu, D.; Dharmapalan, V. Using 4D BIM to assess construction risks during the design phase. Eng. Constr. Arch. Manag. 2019, 26, 2637–2654. [Google Scholar] [CrossRef]
  3. Ariza-López, F.J.; Rodríguez-Avi, J.; Reinoso-Gordo, J.F.; Ariza-López, Í.A. Quality Control of “As Built” BIM Datasets Using the ISO 19157 Framework and a Multiple Hypothesis Testing Method Based on Proportions. ISPRS Int. J. Geo-Inf. 2019, 8, 569. [Google Scholar] [CrossRef] [Green Version]
  4. Boton, C.; Kubicki, S.; Halin, G. The Challenge of Level of Development in 4D/BIM Simulation Across AEC Project Lifecyle. A Case Study. Proc. Procedia Eng. 2015, 123, 59–67. [Google Scholar] [CrossRef]
  5. Candelario-Garrido, A.; García-Sanz-Calcedo, J.; Manuel, A.; Rodríguez, R. A quantitative analysis on the feasibility of 4D Planning Graphic Systems versus Conventional Systems in building projects. Sustain. Cities Soc. 2017, 35, 378–384. [Google Scholar] [CrossRef]
  6. Charehzehi, A.; Chai, C.; Yusof, A.M.; Chong, H.-Y.; Loo, S. Building information modeling in construction conflict management. Int. J. Eng. Bus. Manag. 2017, 9, 1–18. [Google Scholar] [CrossRef]
  7. Charef, R.; Alaka, H.; Emmitt, S. Beyond the third dimension of BIM: A systematic review of literature and assessment of professional views. J. Build. Eng. 2018, 19, 242–257. [Google Scholar] [CrossRef]
  8. Haagenrud, S.E.; Trinius, W.; Bjørkhaug, L.; Wix, J.; Huovila, P. EU-Project STAND-INN-Integration of Standards for Sustainable Construction into Business Processes Using BIM/IFC. In eWork and Ebusiness in Architecture, Engineering and Constructio N, Proceedings of the 7th European Conference on Product and Process Modelling; Zarli, A., Scherer, R., Eds.; CRC Press-Taylor & Francis Group: Sophia Antipolis, France, 2008; pp. 487–493. [Google Scholar]
  9. Eubim-Ttask Group. Manual for the Introduction of the BIM Methodology by the European Public Sector. Strategic Action in Favor of the Productivity of the Construction Sector: Drive Value Creation, Innovation and Growth; EU: Brussels, Belgium, 2016. [Google Scholar]
  10. Tang, S.; Shelden, D.R.; Eastman, C.M.; Pishdad-Bozorgi, P.; Gao, X. A review of building information modeling (BIM) and the internet of things (IoT) devices integration: Present status and future trends. Autom. Constr. 2019, 101, 127–139. [Google Scholar] [CrossRef]
  11. Hermoso-Orzáez, M.J.; Lozano-Miralles, J.A.; Lopez-Garcia, R.; Brito, P. Environmental Criteria for Assessing the Competitiveness of Public Tenders with the Replacement of Large-Scale LEDs in the Outdoor Lighting of Cities as a Key Element for Sustainable Development: Case Study Applied with Promethee Methodology. Sustainability 2019, 11, 5982. [Google Scholar] [CrossRef] [Green Version]
  12. Lindblad, H.; Guerrero, J.R. Client’s role in promoting BIM implementation and innovation in construction. Constr. Manag. Econ. 2020, 38, 468–482. [Google Scholar] [CrossRef] [Green Version]
  13. Habibi, S.; Obonyo, E.A.; Memari, A.M. Design and development of energy efficient re-roofing solutions. Renew. Energy 2020, 151, 1209–1219. [Google Scholar] [CrossRef]
  14. Mirzaei, A.; Nasirzadeh, F.; Jalal, M.P.; Zamani, Y. 4D-BIM Dynamic Time–Space Conflict Detection and Quantification System for Building Construction Projects. J. Constr. Eng. Manag. 2018, 144, 04018056. [Google Scholar] [CrossRef]
  15. Lozano-Lozano, A.; Hermoso-Orzáez, M.J.; Gago-Calderón, A.; De la Fuente, E.D.L.M.; Lozano-Miralles, J.A. Establishment of a Didactic Methodology for the Construction of a Model Bim 4D and 5D Developed from a Modeled Industrial Building in 3D. Cost Analysis and Simulated Execution Planning. In Proceedings of the 1th annual International Conference of Education, Research and Innovation (ICERI2018), Seville, Spain, 12–14 November 2018; pp. 7069–7078. [Google Scholar] [CrossRef]
  16. Hu, Z.; Zhang, J.; Deng, Z. Construction process simulation and safety analysis based on building information model and 4D technology. Tsinghua Sci. Technol. 2008, 13, 266–272. [Google Scholar] [CrossRef]
  17. Popov, V.; Juocevicius, V.; Migilinskas, D.; Ustinovichius, L.; Mikalauskas, S. The use of a virtual building design and construction model for developing an effective project concept in 5D environment. Autom. Constr. 2010, 19, 357–367. [Google Scholar] [CrossRef]
  18. Joannides, M.M.; Olbina, S.; Issa, R.R.A. Implementation of Building Information Modeling into Accredited Programs in Architecture and Construction Education. Int. J. Constr. Educ. Res. 2012, 8, 83–100. [Google Scholar] [CrossRef]
  19. Abanda, F.; Kamsu-Foguem, B.; Tah, J. BIM-New rules of measurement ontology for construction cost estimation. Eng. Sci. Technol. Int. J. 2017, 20, 443–459. [Google Scholar] [CrossRef]
  20. Park, J.; Cai, H. WBS-based dynamic multi-dimensional BIM database for total construction as-built documentation. Autom. Constr. 2017, 77, 15–23. [Google Scholar] [CrossRef]
  21. Yung, P.; Wang, X. A 6D CAD Model for the Automatic Assessment of Building Sustainability. Int. J. Adv. Robot. Syst. 2014, 11, 531–540. [Google Scholar] [CrossRef]
  22. Wu, I.-C.; Hsieh, S.-H. A framework for facilitating multi-dimensional information integration, management and visualization in engineering projects. Autom. Constr. 2012, 23, 71–86. [Google Scholar] [CrossRef]
  23. Silva, T.; Manta, R.; Teti, B.; Melhado, S.; Barkocebas-Junior, B.; Lafayette, K. BIM (8D) as a Management Tool in Occupational Safety: Perspectives for Use. In Proceedings of the Simpósio Brasileiro de Qualidade Do Projeto no Ambiente Construído; VI SBQP-Uberlandia: Uberlândia, Brazil, 2019; pp. 636–646. [Google Scholar]
  24. BuildingSMART Spanish Chapter. Available online: https://www.buildingsmart.es/bim/ (accessed on 24 April 2020).
  25. Hermoso-Orzáez, M.J.; García-Alguacil, M.; Terrados-Cepeda, J.; Brito, P. Measurement of environmental efficiency in the countries of the European Union with the enhanced data envelopment analysis method (DEA) during the period 2005–2012. Environ. Sci. Pollut. Res. 2020, 27, 15691–15715. [Google Scholar] [CrossRef]
  26. European Union. Directive 2012/27/EU of the European Parliament and of the Council of 25 October 2012 on energy efficiency, amending Directives 2009/125/EC and 2010/30/EU and repealing Directives 2004/8/EC and 2006/32/EC. Off. J. Eur. Community 2012, L315, 1–56. [Google Scholar]
  27. European Union. European Commission. Directive 2002/91/EC of the European Parliament and of the Council of 16 December 2002 on the energy performance of buildings. Off. J. Eur. Community 2002, L1, 65–71. [Google Scholar]
  28. Recast EP. Directive 2010/31/EU of the European Parliament and of the Council of 19 May 2010 on the Energy Performance of Buildings (Recast). Off. J. Eur. Union 2010, 18, 2010. [Google Scholar]
  29. EU Directive. 844 of the European Parliament and of the Council of 30 May 2018 Amending Directive 2010/31/EU on the Energy Performance of Buildings and Directive 2012/27/EU on Energy Efficiency; EU: Brussels, Belgium, 2018. [Google Scholar]
  30. Tolón-Becerra, A.; Lastra-Bravo, X.B.; Fernández-Membrive, V.J.; Flores-Parra, I. Opportunities in Spanish energy efficiency. Current situation, trends and potential in the building sector. Energy Procedia 2013, 1, 63–72. [Google Scholar] [CrossRef] [Green Version]
  31. Asl, M.R.; Zarrinmehr, S.; Bergin, M.; Yan, W. BPOpt: A framework for BIM-based performance optimization. Energy Build. 2015, 108, 401–412. [Google Scholar] [CrossRef]
  32. Wang, X.; Yung, P.; Lou, H.B.; Trujiens, M. An innovative method for project control in LNG project through 5D CAD: A case study. Autom. Constr. 2014, 45, 126–135. [Google Scholar] [CrossRef]
  33. Yule, S.; Flin, R.; Paterson-Brown, S.; Maran, N.; Rowley, D. Development of a rating system for surgeons’ non-technical skills. Med. Educ. 2006, 40, 1098–1104. [Google Scholar] [CrossRef]
  34. Li, D.H.; Yang, L.; Lam, J.C. Zero energy buildings and sustainable development implications—A review. Energy 2013, 54, 1–10. [Google Scholar] [CrossRef]
  35. Zhou, H.; Azar, E.R. BIM-based energy consumption assessment of the on-site construction of building structural systems. Built Environ. Proj. Asset Manag. 2019, 9, 2–14. [Google Scholar] [CrossRef]
  36. Zhan, S.; Chong, A.; Lasternas, B. Automated recognition and mapping of building management system (BMS) data points for building energy modeling (BEM). Build. Simul. 2020, 1–10. [Google Scholar] [CrossRef]
  37. Scherer, R.J.; Katranuschkov, P.; Baumgartel, K. Open eeBIM Platform for Energy-Efficient Building Design. In Ework and Ebusiness in Architecture, Engineering and Construction, Proceedings of the 11th European Conference on Product and Process Modelling (ECPPM), Limassol, Cyprus, 7–9 September 2016; Christodoulou, S.E., Scherer, R., Eds.; CRC Press: London, UK, 2016; pp. 387–395. [Google Scholar]
  38. D’Oca, S.; Ferrante, A.; Ferrer, C.; Pernetti, R.; Gralka, A.; Sebastian, R.; Op‘t Veld, P. Technical, Financial, and Social Barriers and Challenges in Deep Building Renovation: Integration of Lessons Learned from the H2020 Cluster Projects. Buildings 2018, 8, 174. [Google Scholar] [CrossRef]
  39. McAuley, B.; Behan, A.; McCormack, P.; Hamilton, A.; Rebelo, E.; Neilson, B.; Beckett, G.; Costa, A.A.; Carreira, P.; Likar, D.; et al. Delivering Energy Savings for the Supply Chain Through Building Information Modelling as a Result of the Horizon 2020 Energy BIMcert Project. In Sustainable Ecological Engineering Design; Springer: Cham, Switzerland, 2020; pp. 11–12. [Google Scholar]
  40. Piaia, E.; Maietti, F.; Di Giulio, R.; Schippers-Trifan, O.; Van Delft, A.; Bruinenberg, S.; Olivadese, R. BIM-based Cultural Heritage Asset Management Tool. Innovative Solution to Orient the Preservation and Valorization of Historic Buildings. Int. J. Arch. Heritage 2020, 1–24. [Google Scholar] [CrossRef]
  41. Galiano-Garrigós, A.; García-Figueroa, A.; Rizo-Maestre, C.; González-Avilés, Á. Evaluation of BIM energy performance and CO2 emissions assessment tools: A case study in warm weather. Build. Res. Inf. 2019, 47, 787–812. [Google Scholar] [CrossRef]
  42. Khanzadi, M.; Kaveh, A.; Moghaddam, M.R.; Pourbagheri, S.M. Optimization of Building Components with Sustainability Aspects in BIM Environment. Period. Polytech. Civ. Eng. 2019, 63, 93–103. [Google Scholar] [CrossRef] [Green Version]
  43. Lu, K.; Jiang, X.; Tam, V.W.; Li, M.; Wang, H.; Xia, B.; Chen, Q. Development of a Carbon Emissions Analysis Framework Using Building Information Modeling and Life Cycle Assessment for the Construction of Hospital Projects. Sustainability 2019, 11, 6274. [Google Scholar] [CrossRef] [Green Version]
  44. Gaglia, A.G.; Dialynas, E.N.; Argiriou, A.A.; Kostopoulou, E.; Tsiamitros, D.; Stimoniaris, D.; Laskos, K. Energy performance of European residential buildings: Energy use, technical and environmental characteristics of the Greek residential sector—Energy conservation and CO2 reduction. Energy Build. 2019, 183, 86–104. [Google Scholar] [CrossRef]
  45. Liu, S.; Ning, X. A Two-Stage Building Information Modeling Based Building Design Method to Improve Lighting Environment and Increase Energy Efficiency. Appl. Sci. 2019, 9, 4076. [Google Scholar] [CrossRef] [Green Version]
  46. Jamnický, M. Building Information Modeling with Static and Dynamic Daylight Analysis. Adv. Mater. Res. 2013, 855, 255–258. [Google Scholar] [CrossRef]
  47. Troncoso-Pastoriza, F.; Eguía-Oller, P.; Díaz-Redondo, R.P.; Granada-Álvarez, E. Automation in Construction Use of BIM data as input and output for improved detection of lighting elements in buildings. Autom. Constr. 2019, 106, 102852. [Google Scholar] [CrossRef]
  48. Amoruso, F.M.; Dietrich, U.; Schuetze, T. Integrated BIM-Parametric Workflow-Based Analysis of Daylight Improvement for Sustainable Renovation of an Exemplary Apartment in Seoul, Korea. Sustainability 2019, 11, 2699. [Google Scholar] [CrossRef]
  49. USGBC (United States Green Building Council). USGBC LEED v4 for Building Design and Construction. Available online: https://www.usgbc.org/resources/leed-v4-build (accessed on 24 April 2020).
  50. Romano, S.; Riediger, N. BIM as a tool for Green Building Certifications: An evaluation of the energy category of LEED, BREEAM and DGNB. J. Phys. Conf. Ser. 2019, 1425, 012612. [Google Scholar] [CrossRef] [Green Version]
  51. Jalaei, F.; Jalaei, F.; Mohammadi, S. An integrated BIM-LEED application to automate sustainable design assessment framework at the conceptual stage of building projects. Sustain. Cities Soc. 2020, 53, 101979. [Google Scholar] [CrossRef]
  52. AUTODESK. INSIGHT 360®®. Available online: https://insight.autodesk.com/oneenergy (accessed on 29 April 2020).
  53. Milyutina, M.A.; Mohammad, W.N.S.W.; Abdullah, M. Application of 6D Building Information Model (6D BIM) for Business-storage Building in Slovenia. In Proceedings of the World Multidisciplinary Civil Engineering-Architecture-Urban Planning Symposium—WMCAUS Autoría Conjunta del Libro: IOP Colección: IOP Conference Series-Materials Science and Engineering; IOP Publishing Ltd.: Prague, Czech Republic, 2017; Volume 1, pp. 202–210. [Google Scholar] [CrossRef]
  54. Radulovic, F.; Poveda-Villalón, M.; Vila-Suero, D.; Rodríguez-Doncel, V.; García-Castro, R.; Gomez-Perez, A. Guidelines for Linked Data generation and publication: An example in building energy consumption. Autom. Constr. 2015, 57, 178–187. [Google Scholar] [CrossRef]
  55. Fuentes-Bargues, J.L.; Gisbert, P.F.; González-Cruz, M.C. Analysis of Green Public Procurement of Works by Spanish Public Universities. Int. J. Environ. Res. Public Health 2018, 15, 1888. [Google Scholar] [CrossRef] [PubMed] [Green Version]
  56. Doulos, L.; Tsangrassoulis, A.; Topalis, F. Multi-criteria decision analysis to select the optimum position and proper field of view of a photosensor. Energy Convers. Manag. 2014, 86, 1069–1077. [Google Scholar] [CrossRef]
  57. AUTODESK®. 2020. Available online: http://usa.autodesk.com/adsk/servlet/pc/index?site (accessed on 29 April 2020).
  58. Chong, H.-Y.; Wong, J.S.; Wang, X. An explanatory case study on cloud computing applications in the built environment. Autom. Constr. 2014, 44, 152–162. [Google Scholar] [CrossRef] [Green Version]
  59. EnergyPlus. Copyright (c) 1996–2019, L.J. de S. de la U. de I. EnergyPlus. 2020. Available online: https://energyplus.net/ (accessed on 29 April 2020).
  60. DOE2.2. Available online: http://doe2.com/doe2/ (accessed on 29 April 2020).
  61. Choi, J.-W.; Jun, Y.-J.; Yoon, J.-H.; Song, Y.-H.; Park, K.-S. A Study of Energy Simulation Integrated Process by Automated Extraction Module of the BIM Geometry Module. Energies 2019, 12, 2461. [Google Scholar] [CrossRef]
  62. Li, Y.; Kubicki, S.; Guerriero, A.; Rezgui, Y. Review of building energy performance certification schemes towards future improvement. Renew. Sustain. Energy Rev. 2019, 113, 109244. [Google Scholar] [CrossRef]
  63. Roh, S.; Tae, S.; Kim, R. Developing a Green Building Index (GBI) Certification System to Effectively Reduce Carbon Emissions in South Korea’s Building Industry. Sustainability 2018, 10, 1872. [Google Scholar] [CrossRef] [Green Version]
  64. Di Giulio, R.; Turillazzi, B.; Marzi, L.; Pitzianti, S. Integrated BIM-GIS based design for high energy efficiency hospital buildings. TECHNE J. Technol. Archit. Environ. 2017, 13, 243–255. [Google Scholar] [CrossRef]
  65. Pérez-Cobos, S. Energy Certification of Existing Buildings. Criteria for the Identification of the Thermal Envelope, 1st ed.; Marcombo: Barcelona, Spain, 2013; ISBN 8426720560; ISBN-13 9788426720566. [Google Scholar]
  66. Serrano Lanzarote, B.; Soto Frances, L.; Ortega Madrigal, L.; Garcia-Prieto Ruiz, A. DTIE 18.01: Energy Rehabilitation of the Thermal Envelope of Buildings; ATECYR, Ed.; DTIE: Madrid, Spain, 2013; ISBN 978-84-95010-49-0. [Google Scholar]
  67. Doulos, L. Kontadakis A, Masias E.N, Sinou M, Tsangrasoulis A. Minimizing energy consumption for artificial lighting in a typical classroom of a Hellenic public school aiming for near Zero Energy Building using LED DC luminaires and daylight harvesting systems. Energy Build. 2019, 194, 201–217. [Google Scholar] [CrossRef]
  68. Woo, J.; Peterson, M.A.; Gleason, B. Developing a Virtual Campus Model in an Interactive Game-Engine Environment for Building Energy Benchmarking. J. Comput. Civ. Eng. 2016, 30, 600. [Google Scholar] [CrossRef]
  69. Forcael, E.; Nope, A.; García-Alvarado, R.; Bobadilla, A.; Rubio-Bellido, C. Architectural and Management Strategies for The Design, Construction and Operation of Energy Efficient and Intelligent Primary Care Centers in Chile. Sustainability 2019, 11, 464. [Google Scholar] [CrossRef] [Green Version]
  70. Montiel-Santiago, F.J.; Hermoso-Orzáez, M.J.; Terrados-Cepeda, J.; Paulo, B. Analysis and Energy Certification of an Andalusian Public Health Center. Comparative between the General Option and Simplified Procedures. Presented at the 5th Ibero-American Congress on Entrepreneurship, Energy, Environment and Technology—CIEEMAT, Portalegre, Portugal, 11–13 September 2019. Proceedings 2019, 38, 3. [Google Scholar] [CrossRef]
  71. Peña-García, A. Towards Total Lighting: Expanding the Frontiers of Sustainable Development. Sustainability 2019, 11, 6943. [Google Scholar] [CrossRef] [Green Version]
  72. Peña-García, A. Sustainability as the Key Framework of a Total Lighting. Sustainability 2018, 10, 4412. [Google Scholar] [CrossRef]
  73. Hermoso-Orzáez, M.J.; Calderón, A.G.; Rojas-Sola, J.I. Power Quality and Energy Efficiency in the Pre-Evaluation of an Outdoor Lighting Renewal with Light-Emitting Diode Technology: Experimental Study and Amortization Analysis. Energies 2017, 10, 836. [Google Scholar] [CrossRef]
  74. Welle, B.; Rogers, Z.; Fischer, M. BIM-Centric Daylight Pro fi ler for Simulation (BDP4SIM): A methodology for automated product model decomposition and recomposition for climate-based daylighting simulation. Build. Environ. 2012, 58, 114–134. [Google Scholar] [CrossRef]
  75. Department of Planning and Environment’s. NSW Solar Access Requirements in SEPP 65. Planning and Environment. Government (Australian). 2020. Available online: https://www.planning.nsw.gov.au/~/media/ (accessed on 29 April 2020).
  76. Kensek, K.M. Teaching visual scripting in bim: A case study using a panel controlled by solar angles. J. Green Build. 2018, 13, 113–138. [Google Scholar] [CrossRef]
  77. Sorgato, M.J.; Schneider, K.; Rüther, R. Technical and economic evaluation of thin-film CdTe building-integrated photovoltaics (BIPV) replacing façade and rooftop materials in of fi ce buildings in a warm and sunny climate. Renew. Energy 2018, 118, 84–98. [Google Scholar] [CrossRef]
Figure 1. General view of the building in the University Hospital of Jaén.
Sustainability 12 05731 g001
Figure 2. Architectural model of the building in REVIT software.
Sustainability 12 05731 g002
Figure 3. Building energy model in REVIT.
Sustainability 12 05731 g003
Figure 4. View of analytical spaces of the energy model of the building in REVIT.
Sustainability 12 05731 g004
Figure 5. View analytical surfaces of the energy model of the building in REVIT.
Sustainability 12 05731 g005
Figure 6. View of the building and result obtained on the INSIGHT 360 platform.
Sustainability 12 05731 g006
Figure 7. Result obtained in the energy simulation on the INSIGHT 360 platform for all possible cases of the building modeled in Building Information Modeling (BIM).
Sustainability 12 05731 g007
Figure 8. Result obtained on the INSIGHT 360 platform for the existing building modeled in BIM.
Sustainability 12 05731 g008
Figure 9. (a) Diagram with the selected HVAC (Heating Ventilation Air Conditioning) improvement in INSIGHT 360. (b) Result obtained on the INSIGHT 360 platform for the building after applying the air conditioning improvement.
Sustainability 12 05731 g009
Figure 10. (a) Diagram with the lighting improvement selected in INSIGHT 360. (b) Result obtained on the INSIGHT 360 platform for the building after the application of the lighting improvement.
Sustainability 12 05731 g010
Figure 11. (a) Diagram with the lighting improvement selected in INSIGHT 360. (b) Results which obtained the improvement consisted of replacing the current single glass windows with low-emissive double glass.
Sustainability 12 05731 g011
Figure 12. (a) Diagram with the improvement of the lighting system through regulation and control selected in INSIGHT 360. (b) Result obtained on the INSIGHT 360 platform after the application of the lighting control.
Sustainability 12 05731 g012
Figure 13. Daylight simulation. 3D view of the illuminance analysis in REVIT INSIGHT.
Sustainability 12 05731 g013
Figure 14. Daylight simulation both times (low, high, average) of 9/23. Low floor view of the illuminance analysis in REVIT INSIGHT.
Sustainability 12 05731 g014
Figure 15. Daylight simulation 9h. of 9/23. Low floor view of the illuminance analysis in REVIT INSIGHT.
Sustainability 12 05731 g015
Figure 16. Daylight simulation 15h. of 9/23. Low floor view of the illuminance analysis in REVIT INSIGHT.
Sustainability 12 05731 g016
Figure 17. Daylight simulation both times (low, high, medium) of 9/23. View of the third floor of the illuminance analysis in REVIT INSIGHT.
Sustainability 12 05731 g017
Figure 18. Simulation sDA view on the low floor of the building in REVIT INSIGHT.
Sustainability 12 05731 g018
Figure 19. Simulation ASE view on the low floor of the building in REVIT INSIGHT.
Sustainability 12 05731 g019
Figure 20. Daylight simulation both times (low, high, medium) of 9/23. View of the third floor of the LEED v4 EQc7 opt. 2 analysis in REVIT INSIGHT.
Sustainability 12 05731 g020
Figure 21. Daylight simulation 9 a.m. of 9/21. View of the third floor of the LEED v4 EQc7 opt. 2 analysis in REVIT INSIGHT.
Sustainability 12 05731 g021
Figure 22. Daylight simulation 3 p.m. of 9/21. View of the third floor of the LEED v4 EQc7 opt. 2 analysis in REVIT INSIGHT.
Sustainability 12 05731 g022
Figure 23. Simulation of solar access in REVIT INSIGHT. Third-floor view with hours of direct sun.
Sustainability 12 05731 g023
Figure 24. Simulation of solar access in REVIT INSIGHT. Third-floor view with hours by room.
Sustainability 12 05731 g024
Figure 25. (a) Diagram showing the improvement in installed electrical power selected in INSIGHT 360. (b) Result obtained on the INSIGHT 360 platform after applying the improvement in installed power.
Sustainability 12 05731 g025
Figure 26. (a) Diagram showing the improvement in electrical power installed with photovoltaic (PV) panels on the selected deck at INSIGHT 360. (b) Result obtained on the INSIGHT 360 platform after applying the PV power generation upgrade.
Sustainability 12 05731 g026
Figure 27. Analysis of photovoltaic installation in REVIT INSIGHT 360.
Sustainability 12 05731 g027
Figure 28. Result obtained on the INSIGHT 360 platform for the building after the global application of the proposed improvements.
Sustainability 12 05731 g028
Figure 29. Graph with the different scenarios analyzed for the building.
Sustainability 12 05731 g029
Table 1. Dimensions, properties, and aspects to be developed in the Building Information Modeling (BIM) model for buildings.
Dimensions BIMPropertiesAspects Developed in the Model
2D2D Basic DocumentationTraditional two-dimensional (2D) plans
Lines, planes images
3D3D three-dimensional modelGraphic documentation in three dimensions (3D)
Special geometric information
Objects with properties
3D visualization of the project
4DProgramming the Execution Plan (Deadlines)Simulation of Project phases
Installations Simulation
Design of the execution Plan
5DPlanning, Monitoring and Cost ControlBudget estimate of expenses
Measurements of materials and labor
Analysis of operating costs
6DSustainability and energy efficiencyEnergy analysis
Envelope variations and interactions
Analysis of simulations and energy efficient and environmentally sustainable proposals
7DFacility ManagementBIM Life Cycle Analysis (LCA) Strategies
BIM as built
Building Operations and Maintenance Plan Model
Logistical Control of the Project
Table 2. Characteristics of the building’s thermal envelope in the BIM model.
Building’s Thermal EnvelopeThickness (mm)Thermal Transmittance (W/m2 K)Solar Factor
Facade wall5500.93--
Roof3901.44--
Floor structure2502.27--
Basement floor2502.78--
Glass (windows)65.560.86
Table 3. Characteristics of the building’s thermals systems in the BIM model.
Thermal SystemGenerator EquipmentDistribution NetworkTerminal UnitsEnergy
HeatingWater Boiler (0.9 AFUE 1)WaterRadiatorsNatural gas
Ventilation and air coolingChiller (3.5 SEER 2)RefrigerantDuct systemElectricity
Hot sanitary waterWater Boiler (0.9 AFUE 1)Water--Natural gas
Note 1: AFUE (Annual Fuel Utilization Efficiency rating). Note 2: SEER (Seasonal Energy Efficiency Ratio).
Table 4. The results obtained in the different scenarios analyzed for the building.
ImprovementScenario NameConsumption (kWh/(m2 year)).Energy Saving (kWh/(m2 year)).
Existing buildingExisting building259.11-
Air conditioning systemHVAC198.0261.09
LED Lighting systemLED Lighting232.3126.8
Windows glassWindow Glass250.458.66
Lighting control systemDaylighting and Occ.C.252.166.95
Efficient electrical power Plug Load244.5714.54
Photovoltaic panels PV—Panels241.1018.01
Simulated global improvementEnergy Saving Package138.17120.94

