Contribution of Climate Extremes to Variation in Potato Tuber Yield in Prince Edward Island
by
 , , ,
, , ,
Junaid Maqsood
1 ,
,
Aitazaz A. Farooque
1,2,*, 
Xander Wang
2,
Farhat Abbas
1,*,
Bishnu Acharya
1 and 
Hassan Afzaal
1 1
Faculty of Sustainable Design Engineering, University of Prince Edward Island, Charlottetown, PE C1A4P3, Canada
2
School of Climate Change and Adaptation, University of Prince Edward Island, Charlottetown, PE C1A4P3, Canada
*
Authors to whom correspondence should be addressed.
Sustainability 2020, 12(12), 4937; https://doi.org/10.3390/su12124937
Submission received: 7 May 2020
/
Revised: 11 June 2020
/
Accepted: 12 June 2020
/
Published: 17 June 2020
Abstract
:Agricultural management practices are responsible for almost two-thirds of the variations in potato tuber yield. In order to answer the research question about the remaining variability of the tuber yield, we hypothesized that climate extremes partly explain the missing component of variations of the tuber yield. Therefore, this research attempts to bridge this knowledge gap in order to generate a knowledge base for future strategies. A climate extreme dataset of the Prince Edward Island (PEI) was computed by averaging the data of five meteorological stations. In detail, changing patterns of 20 climate extreme indices were computed with ClimPACT2 software for 30 years (1989-2018) data of PEI. Statistical significance of the trends and their slope values were determined with the Mann-Kendall test and Sen’s slope estimates, respectively. Average of daily mean temperature (TMm), mean daily minimum temperature (TNm) and the occurrence of continuous dry days (CDD), significantly increased by 0.77 °C, 1.17 °C and 3.33 days., respectively, during the potato growing seasons (May-October) of the past three decades. For this period daily temperature range (DTR), frost days (FD), cold days (TX10p), cold nights (TN10p) and warmest days (TXx) showed decreasing trends of −1.01 °C, −3.75 days, −5.67 days, −11.40 nights, and −2.00 days, respectively. The principal component analysis showed that DTR, TXx, CDD, and TNm were the main factors affecting seasonal variations of tuber yield. The multiple regression model attributed ~39% of tuber yield variance to DTR, TXx, CDD, and TNm. However, these indices explained individually 21%, 19%, 16%, and 4% variation to the tuber yield, respectively. The remaining variation in the tuber yield explained by other yield affecting factors. The information generated from this study can be used for future planning about agricultural management strategies in the Island, for example, the provision of water resources for supplemental irrigation of crops during dry months.
1. Introduction
The global mean surface temperature is expected to increase over the 21st century ranged from 1.5 °C for representative concentration pathways (RCP) 4.5 to more than 2 °C for RCP6.0 and RCP8.5 between 1850–1900 and 2081–2100 period [1]. The sample of over 70% of the global land area showed that climate indices related to daily minimum temperature were indicated significant warming changes as compared to the indices related to daily maximum temperature [2]. Precipitation indices showed significant trends towards wetter conditions throughout the 20th century and these changes in precipitation indices were heterogeneous as compared to temperature changes [3]. Climate change is expected to increase the air temperature, evapotranspiration rate, risk of intense rainstorms, and heatwaves associated with droughts [4].
Continuous dry days (CDD), daily temperature range (DTR), summer days (SU), warmest day (TXx), daily mean temperature (TMm), mean daily minimum temperature (TNm), heavy precipitation (R20mm), total precipitation (P_TOT) have significantly increased. However, TX10p, TN10p have decreased in different parts of the world [5,6,7,8,9,10]. Climate change in Canada is evident in the last few years, however, due to the large area, it is not uniform throughout the country. The warmer climate has been observed in many regions of Canada as the mean temperature increased by 1.5 °C during 1950–2010 [11]. Warming was higher in minimum temperature as compared to the maximum temperature and stronger during the nights in winter than during the day in summer [12,13].
Extreme heat events including very high temperature, hot nights (daily minimum temperature > 22 °C), hot days (daily maximum temperature > 30 °C), Summer days (daily maximum temperature > 25 °C) are increased. However, snow cover duration, frost days (daily minimum temperature < 0 °C), cold days (10% quantile of daily maximum temperature), and cold nights (10% quantile of daily minimum temperature) are decreased throughout Canada [14,15]. Extreme temperatures associated with the warm days (95% quantile of daily maximum temperature) and warm nights (95% quantile of daily minimum temperature) were expected to increase by 3.5–6.0 °C and 3.5–4.5 °C, respectively [16].
The increase in precipitation has been observed across Canada [17]. The temperature and precipitation changes have decreased the snow cover duration due to warmer spring temperatures [18]. Likewise, Prince Edward Island—the eastern Canadian province—faces seasonal warming, more extremely hot days and nights, fewer unusually cold days and nights, longer, more frequent and intense heatwaves, increased continuous dry days, changing precipitation pattern, increase in rainy days and decrease in snowy days and snow cover duration [19,20].
Agriculture is the major industry of Prince Edward Island. Over 40% of its total area consists of agricultural land [21]. Potato is one of the major exported agri-food products (among fruits, vegetables, and dairy products) on the Island. Potatoes, worth ~415 million dollars, were exported by the Island (86% of the total exported agri-food products) in 2018 [22]. The potato industry of Prince Edward Island contributes 10.8% to the gross domestic product (GDP) of the Island [23]. The potato production of Prince Edward Island is the highest of any province of Canada and a major contributor to the Island’s economy [24].
Uncertainties related to temperature represented a greater contribution to the climate change impact on crop yield and productivity when compared to the precipitation [25]. The temperature is the primary factor that affects the rate of crop production and there is high confidence that temperature extreme indices such as hot days, warm nights, heat waves, and droughts affect crop production [26,27]. The frequency of pest attacks and the diseases are also increased with an increase in temperature [28]. The impact of temperature on agriculture is of major significance since a 1 °C rise is linked to a 2.7% reduction in the growth of agricultural outputs [29]. Crop water stress increases due to droughts, floods, and waterlogging issues [30]. Different methods are used to find the relationships between crop yields and climate variables. Poudel and Shaw [31] and Mumo et al. [32] used a multiple regression model for accessing impacts of climatic variability on different crops (maize, rice, wheat, millet, and barley) in Nepal and Kenya and found out that climate variables were partially impacting the yield of these crops.
Potato is the most important non-grain crop in the world. It is very sensitive to climatic variability, and therefore, climate change and global warming will have a profound negative impact on potato production [33]. It performs ideally in cooler conditions and is vulnerable to high temperatures [34]. Even moderately high temperature drastically reduces tuber yield without substantially affecting the photosynthesis and total biomass production [35]. Hijmans [33] reported that with an increase in temperature between 1 to 1.4 °C, the tuber yield decreased by 18 to 32%. Over the next 100 years, a temperature increase of 3 to 4 °C has been projected for Atlantic Provinces [36], which can reduce the tuber yield of the island. Therefore, it is necessary to understand the potential impacts of climate change on potato production for future global food security strategies [28]. It is hypothesized that the future climate scenarios will have a negative impact on global potato yield by 2055 (−2 to −6%) but will have a larger impact by 2085 (−2 to −26%) depending upon the RCP as reported by Raymundo et al. [28].
Tuber yield depends on many factors like soil and water management practices, chemical and bio-fertilization, seed quality, soil moisture contents, slope, elevation, and supplement irrigation [37,38,39,40,41,42,43]. These parameters are individually responsible for most of the variation (22–66) % in the tuber yield. While factors for the remaining variations in potato tuber yield are unknown. We assumed that climatic extreme indices may be among the unknown parameters to explain the remaining variability of tuber yield. Literature reveals reports about climate extreme’s effect on crop yields in different growing regions and seasons but no in-depth study for the effects of climate extremes on tuber yield in Prince Edward Island has been reported. Therefore, the objective of this study was to explore the attribution of climate extreme indices of Prince Edward Island to its potato tuber yield for future agricultural strategies.
2. Materials and Methods
2.1. Study Area
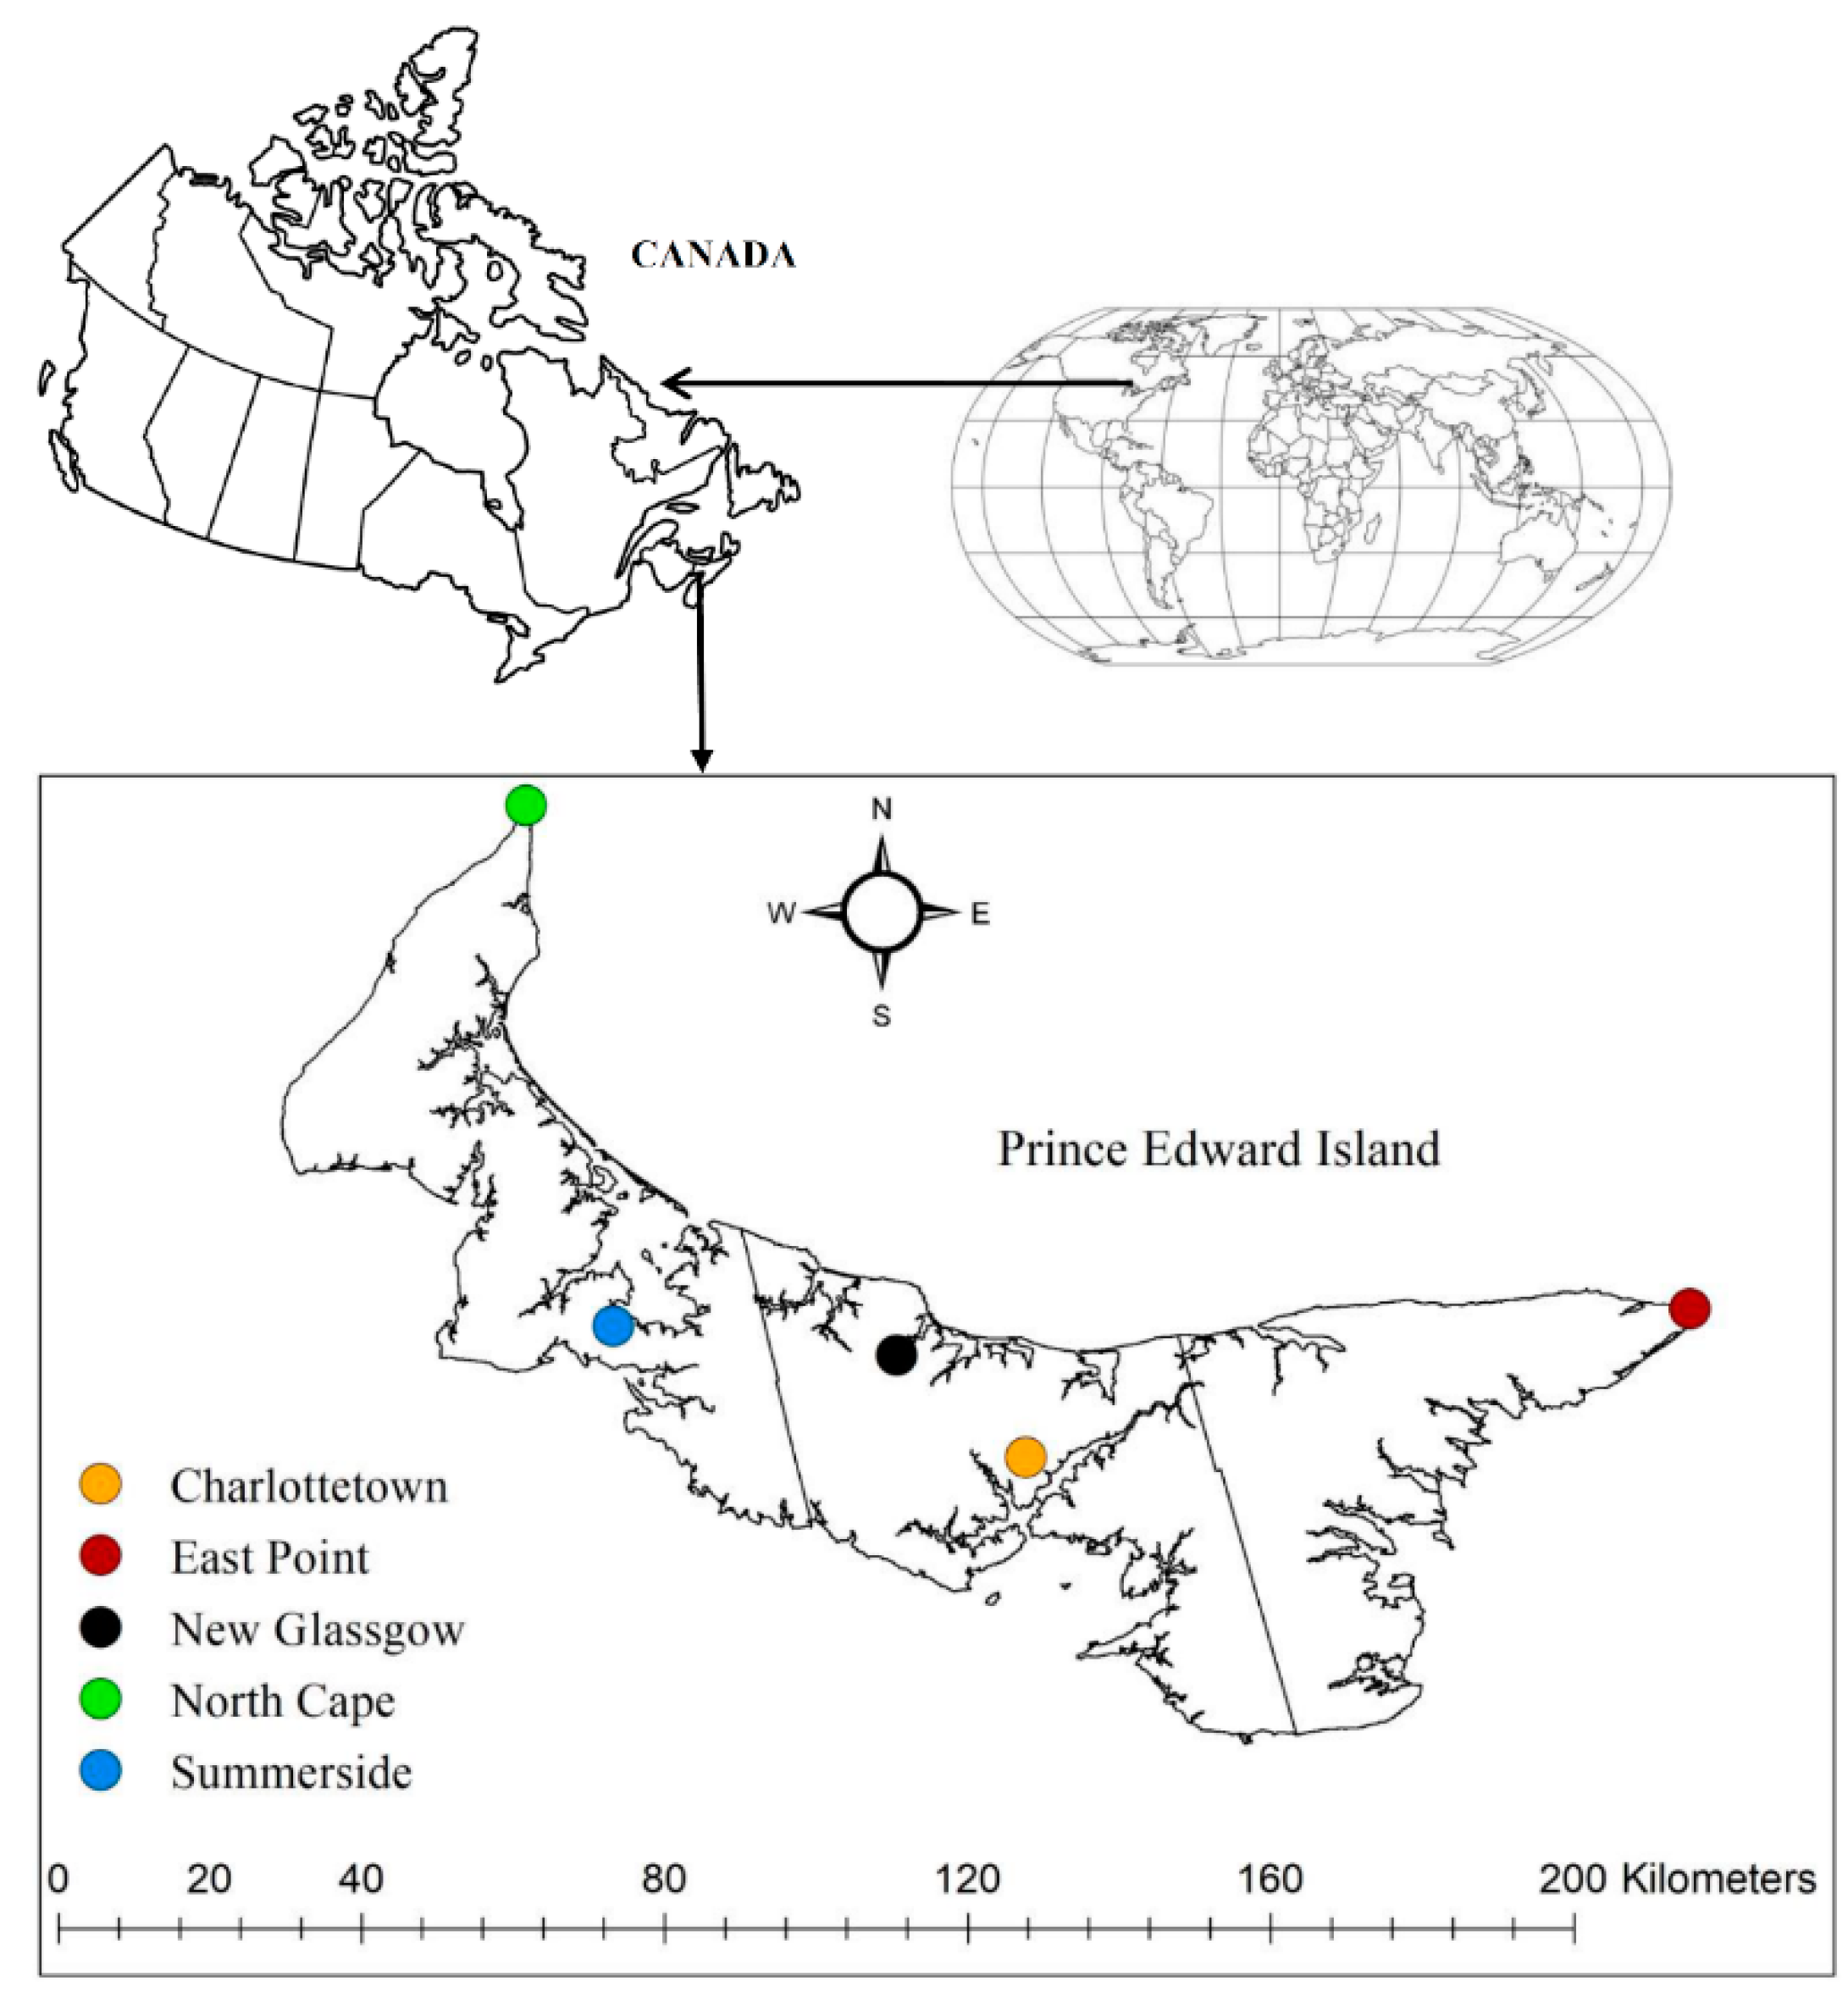
This study was conducted in Prince Edward Island, which is the eastern Canadian province (Figure 1). It is the smallest province with 225 km length and 3–65 km width with a curving geometry from North Cap to East Point. It lies between 46 to 47 °N latitude and 62 to 64 °W longitude. To the South and the West, the Northumberland Strait separates this island from mainland provinces of Nova Scotia and New Brunswick. Charlottetown is its provincial capital and its total area is 566,560 ha out of which 240,514 ha area consists of agricultural lands. The area of agricultural land used for potato cultivation is 34,803 ha, which has the largest share in Canada’s potato acreage [21]. Due to its location and the fertile soil, it has two nicknames “Garden of Gulf” and “Million Acre Farm”. Sometimes, it is also called Spud Island due to its significance in potato production. Its population was 155,318 as of April 1, 2019 [44].
The climate of Prince Edward Island is a mild maritime climate, which receives a significant impact from warm waters of the Gulf of St. Lawrence. Each year, Prince Edward Island gets about 290 cm of snow and 890 mm of rainfall. The average minimum temperature is −7 °C in January and the average maximum temperature is 19 °C in July [45]. The island has four seasons with varying temperature ranges: spring (8 to 22 °C), summer (20 to 34 °C), autumn (8 to 22 °C) and winter (−3 to −11 °C) [46]. Most of the agricultural land of the island is rain-fed as it receives the annual mean snowfall of 290 cm and the cold wind makes its winter temperature feel like −25 °C. In Prince Edward Island the potato crop lasts from May to October as all agricultural activities are performed during these six months. There are no agricultural activities in the remaining months due to snowstorms, snow cover, flooding, and windstorms.
2.2. Data Sources and Missing Values
Five meteorological stations (Figure 1) were selected for this study based on their random locations on the island, data quality, completeness, and length (1989–2018). The selected stations were East Point, Charlottetown, New Glasgow, Summerside, and North Cap. Daily total precipitation, maximum and minimum temperature data for the analysis period of 30 years (1989–2018) of the selected stations were collected from Environment Canada (Table 1). Average tuber yield data were also collected from statistic Canada for the analysis period (1989–2018).
A linear regression model was used to estimate the missing values of the data. One of the five stations (i.e., Summerside) had a large amount (~12%) of missing data. Ordinary least square method was used to fit a missing number between the observed data from the target station and neighboring stations. The neighboring highly correlated stations (R2 > 0.50) were selected to estimate the missing data. After selecting the most favorable station for filling the missing data, a linear regression model (Equation (1)) was used for estimating the missing values:
where, y = estimated data, β0 = y-intercept, β1 = slope, and X1 = neighboring station data
2.3. ClimPACT2
Climate extreme indices were calculated using the R-software package ClimPACT2 developed by Alexander and Herold (2016). It is based on the RClimDex software developed by Expert Team on Climate Change Detection and Indices (ETCCDI). Software and relevant documents of ClimPACT2 can be accessed from the website https://github.com/ARCCSS-extremes/climpact2. The data were checked for quality control prior to calculating extreme indices.
Nine tests were performed using ClimPACT2 to ensure the quality of the data including (i) identification of the missing and unrealistic values, (ii) identification of the potential outliers through interquartile technique, (iii) detection of four or more equal consecutive values, (iv) detection of temperature > 50 °C and precipitation > 200 mm per day, (v) detection of the temperature difference between two consecutive values equal to or higher than 20 °C, (vi) if the maximum temperature was lower than the minimum temperature, (vii) identification of the values that occurred more than once in the sample data, viii) how often each of the ten possible values after the decimal point (0.0 to 0.9) appeared, and (ix) identify maximum and minimum temperature values, with more than 4 standard deviations. Additional information about data quality control can be found in the user guide of ClimPACT2 software. Minimal errors were found in the data and eliminated.
2.4. Calculation of Climate Indices and Trend Analysis
Thirteen temperature and seven precipitation extreme indices, developed by ETCCDI, were calculated (Table 2).
Trends of the calculated indices were detected by non-parametric tests [47,48] and their changes per growing season were calculated by Sen’s slope estimates. The trends were calculated using MAKESENS [49], which uses two different approaches (s-test, z-test), to test the trends in the time series data, based on the number of observations. The MAKESENS uses an s-test for less than 10 observations and a z-test for more than 10 observations. Positive values of z or s indicate increasing trends while negative values represented decreasing trends.
2.5. Statistical Analysis
Minitab 18 (State College, Pennsylvania State University, PA: Minitab, INC.) was used in the calculations of principal component analysis (PCA), correlation matrix, and linear and multiple linear regression. The large datasets that are increasingly common and are often difficult to interpret are processed with PCA. It is a technique for reducing the dimensionality of large and common datasets to increase and simplify interpretability minimizing the information loss [50]. The climate extreme indices that showed significant trends were analyzed with PCA, which uses the correlation coefficient matrix and finds the minimum data set (MDS). Principal components (PCs) that explained, individually, at least 5% of the variation in the data and up to 85% of the cumulative variation [51] were selected to be the part of MDS. The first PC in the linear relationships was considered to have the largest percentage of total data variation and so on. Under each PC, all the variables (climate index) were given weights that represented the contribution of the specific climate index in the composition of the PC. Only highly weighted variables (absolute value within the 10% of the highest weight) were selected initially in MDS as the influential indicators [52,53]. In a single PC, if more than one variable had a high weight and were part of MDS then correlation coefficients were used to rule out their redundancy. For example, variables with correlation coefficient > 0.60 were regarded as redundant and were thus screened to be a part of MDS based on their weights [54]. However, the highly weighted variables with correlation coefficient < 0.60 were retained in the MDS [55].
Multiple regression was used to find the relationship between the climate extreme indices screened from PCA and the tuber yield. The significance of the relationship was tested using a t-test at a 95% confidence level. Equation (2) was used for accessing the impact of climatic variability on tuber yield:
where y is the average tuber yield, β0 is the y-intercept which represents a unit change of the dependent variable, X1, X2, … Xn are the climate extreme indices, and n is the number of climate indices.
Multicollinearity was tested using the variance inflation factor (VIF) on each climate index in the model to prevent associated complications or prevention of achieving the optimal set of explanatory variables.
3. Results
3.1. Estimation of Missing Values
The neighboring station’s data were regressed linearly to estimate missing values in the time-series data: i.e., TX: daily maximum temperature, TN: daily minimum temperature, and P: daily precipitation for various study years. Almost all the linear models used for estimation of missing data of TX, TN, and P had a good coefficient of determination (R2), and the filled data were considered reliable for further analysis.
3.2. Climate Extreme Indices and Their Trend
Values and nature of slope (minus sign showing negative slope) of trends of extreme indices for Prince Edward Island dataset and significance levels of the trends are presented in Table 3. There were significant decreases in TN10p (p < 0.001), TX10p (p < 0.05), TXx (p < 0.05), DTR (p < 0.05) and FD (p < 0.05). Over the 30 years of the study period, the cold nights decreased by 11.40 nights, cold days decreased by 5.67 days, warmest days decreased by 2.00 days, daily temperature range decreased by 1.01 °C and frost days decreased by 3.75 days. However, there was significant increase in TMm (p < 0.05), TNm (p < 0.01), and CDD (p < 0.01). The monthly mean of daily mean temperature increased by 0.77 °C, mean daily minimum temperature increased by 1.17 °C and consecutive dry days increased by 3.33 days over the 30 years of this study.
There were more significant trends in temperature-based indices than in precipitation-based indices reflecting that that temperature was the primary factor of climate change in the island over the study period. The research of Lobell and Burke [25] also showed that more changes occurred due to temperature as compared to the precipitation in various parts of the world. The results of precipitation extreme indices showed that continuous dry days significantly increased with the passage of time as confirmed by a decrease in total annual precipitation (Table 3). These results are contrary to the findings of Donat et al. [3] who revealed, after analyzing indices for 110 years (1901-2010), that precipitation indices showed significantly increasing trends in most of the areas in the world. Vincent et al. [14] and Wang et al. [12] also revealed similar results for Canada. Variations in temperature and extreme temperature events impact crop productivity [26]. Increased evapotranspiration from agriculture fields due to an increase in temperature may result in increased supplemental irrigation in rainfed areas such as Prince Edward Island.
3.3. Principal Components of Climate Indices
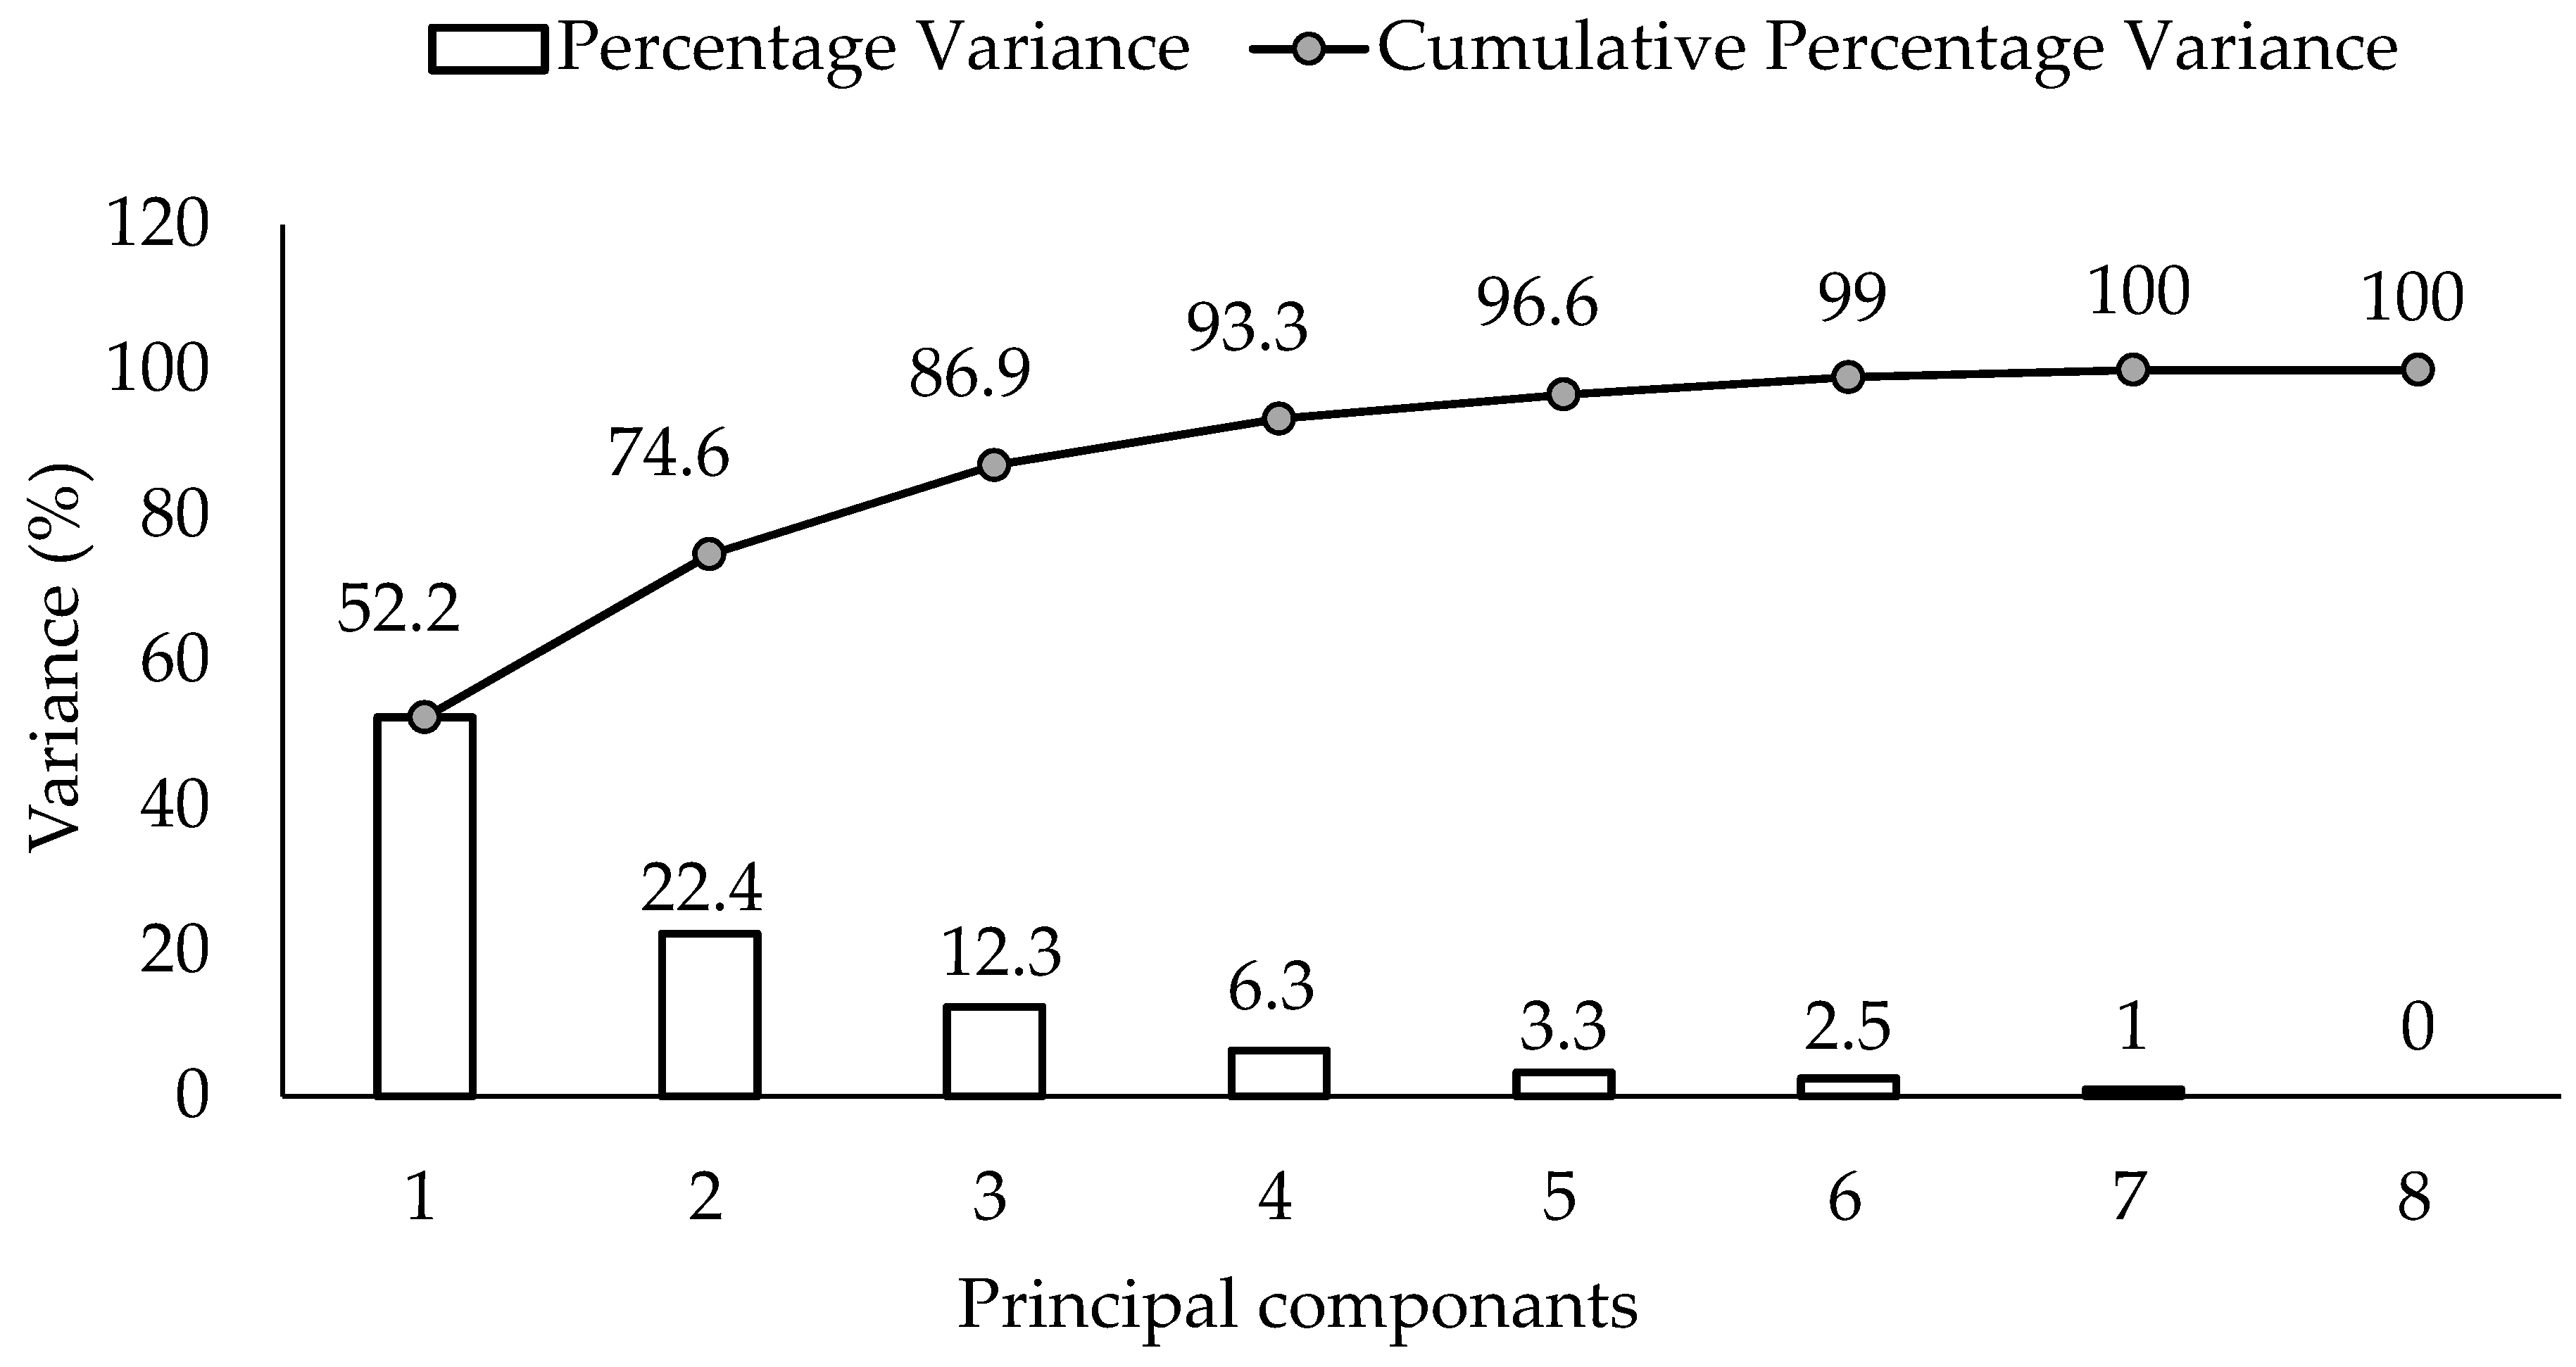
The indices that showed significant trends (Table 3) were used in PCA to find out their combined relation with the potato tuber yield. Since there were eight significantly varying indices; therefore, eight PCs were generated (Figure 2). First three PCs (PC1, PC2, and PC3) were selected as they individually explained more than 5% variance of the data and had cumulative variance (52.2%, 74.6%, and 86.9%) greater than 85% [51] as shown in (Figure 2) and (Table 4).
PC1 that explained a 52.2% variation in the data had TNm with the highest loading value (i.e., −0.48) followed by TN10p (−0.46), which lies within the scope of 10% of the highest value. Therefore, both TNm and TN10p were considered highly weighted factor loadings and considered initially for MDS [52,53]. In PC2, 22.4% variation of the data had been explained with TXx (−0.59) and DTR (−0.59) as highly weighted factor loadings initially considering TXx and DTR for MDS. PC3 explained 12.3% variation of the data with only CDD (−0.89) as highly weighted factor loading under it and considered initially for MDS.
Pearson’s correlation matrix (Table 5) was generated to check and reduce redundancy from the MDS. It was found that highly weighted factors (TNm and TN10p) of PC1 were highly correlated (0.91), therefore, TNm was retained in the MDS as it had the highest loading value (0.48) as compared to TN10p (0.46). Similarly, TXx and DTR were not highly correlated (0.52) which is why both were retained in the MDS for PC2. The index CDD was also retained in the MDS as it was the only highly weighted factor loading of PC3. The retained factor loadings (TNm, TXx, DTR, and CDD) in MDS were used in multiple regression for accessing their relationship with the tuber yield.
3.4. The Dominant Extreme Indices and Tuber Yield
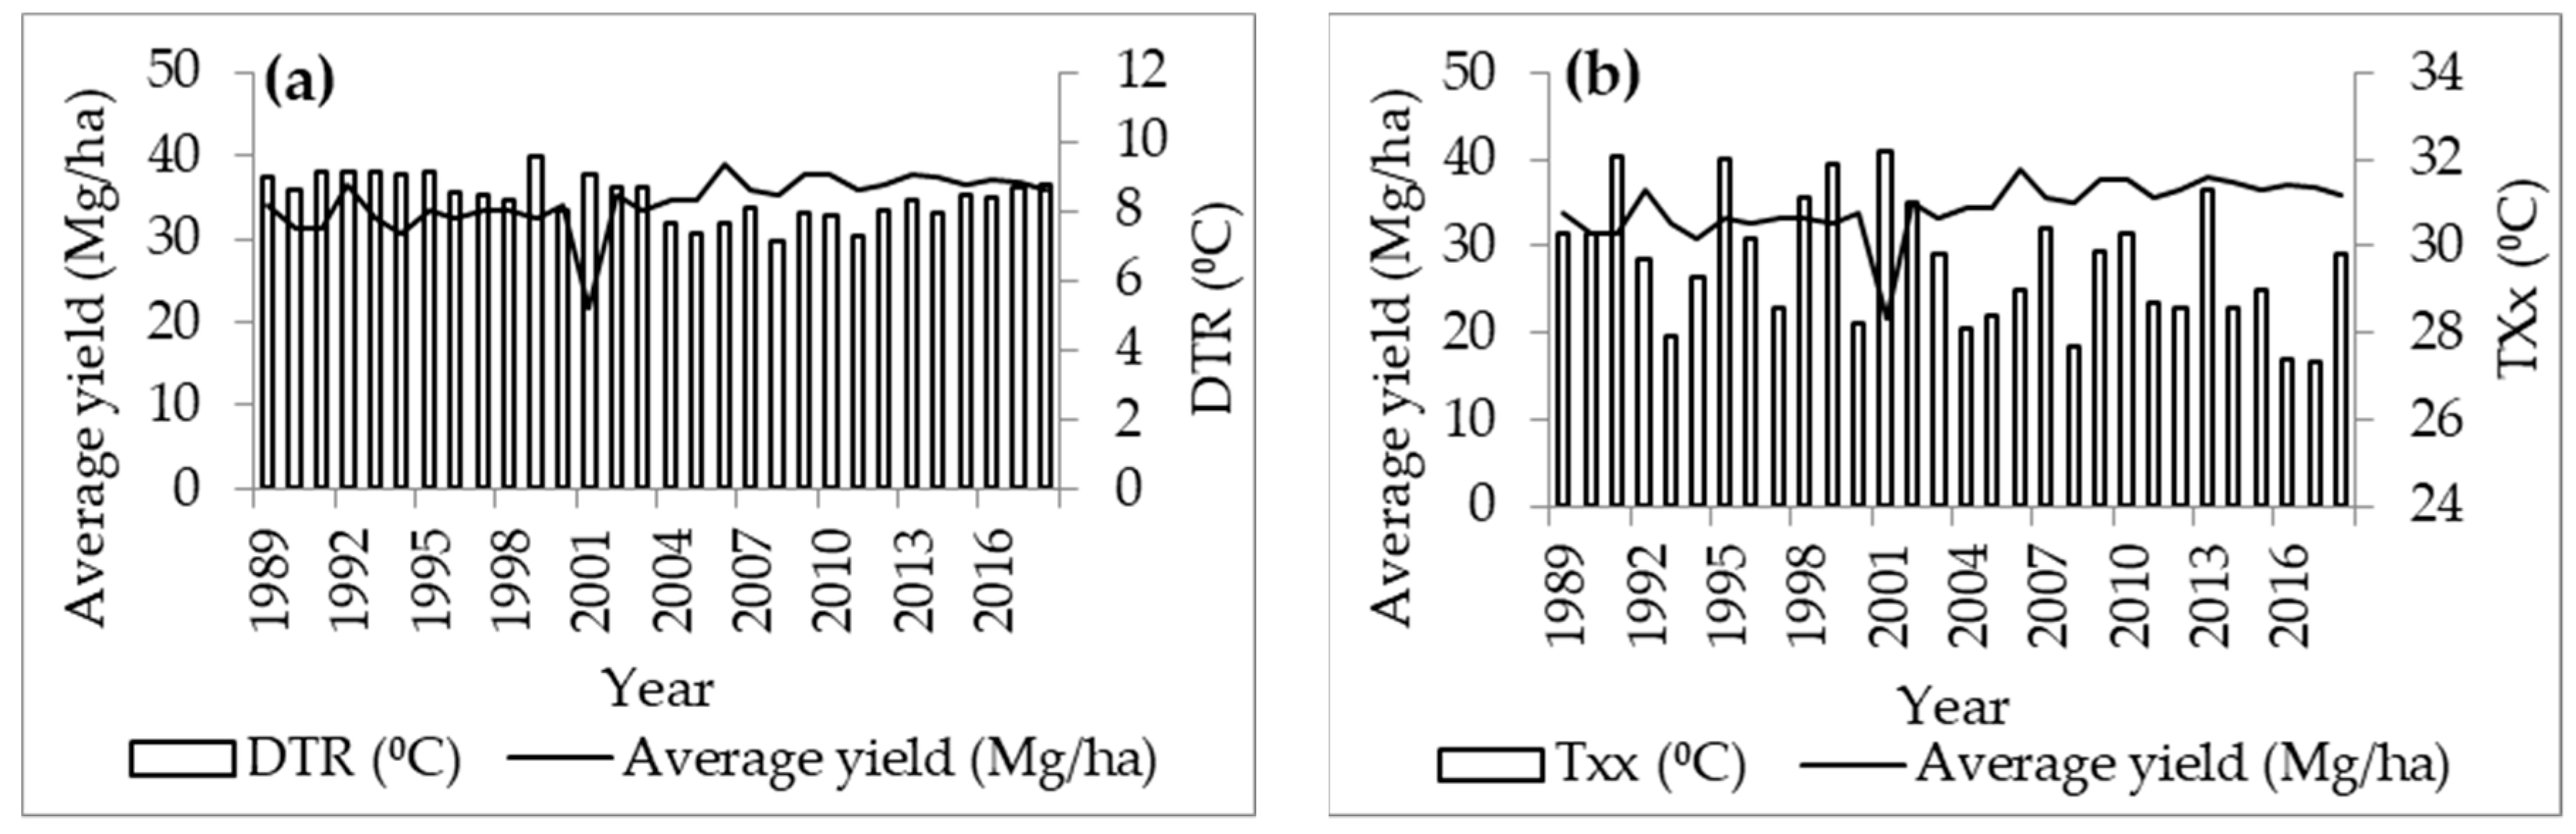
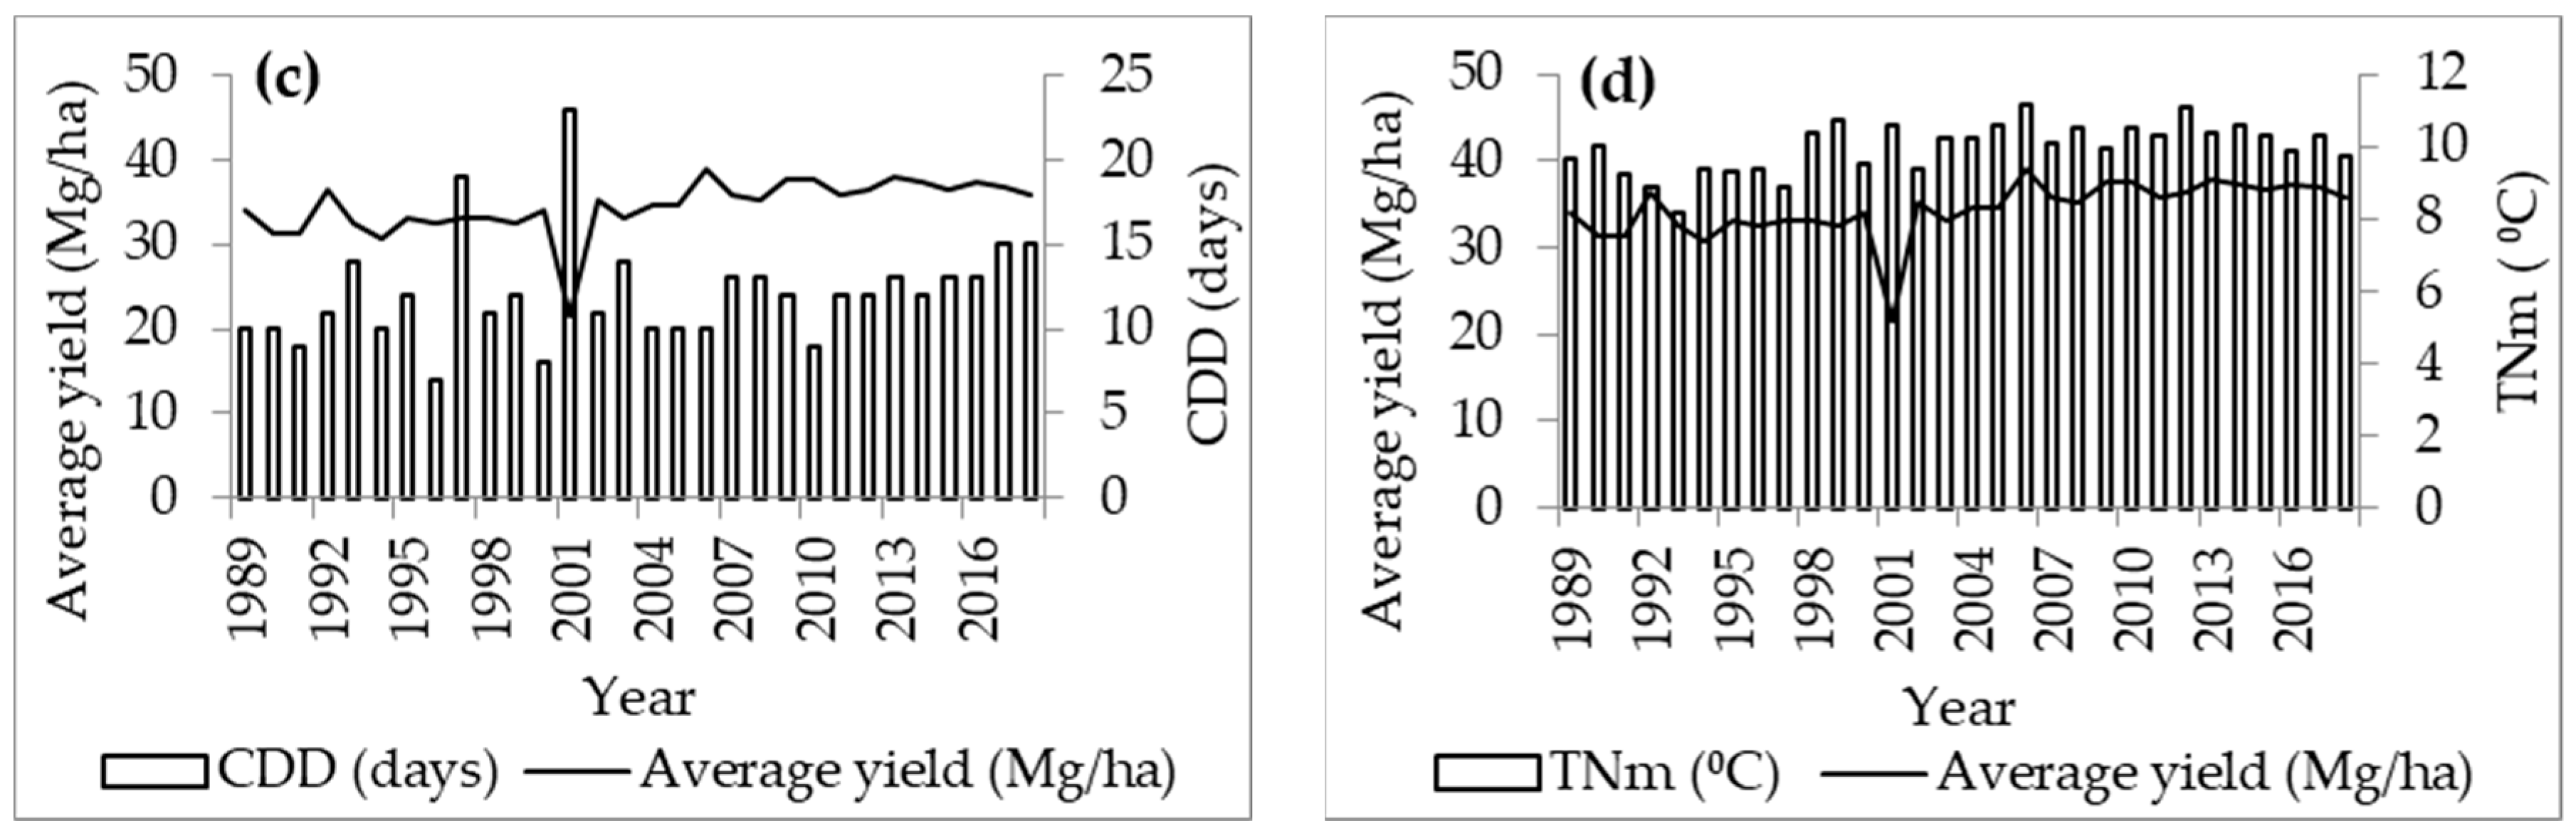
Based on PCA, the four indices including DTR, TXx, CDD, and TNm were among the dominant extreme indices that had significant trends and were shortlisted for MDS for the data of the 30 study years. These indices were plotted along with 30-year mean yield data of Prince Edward Island to relate variations in the shortlisted indices and tuber yield (Figure 3). There were visual relationships between the considered indices and tuber yield. For example, the lines of tuber yield data showed that the year 2001 was the problematic year as it had the lowest average tuber yield (21.59 Mg/ha) supported by the varying CDD (23 days) and TXx (32.2 °C), DTR (9.02 °C), and TNm (10.6 °C) to be the highest values in 2001 except for DTR, which had its highest value during 1999. Therefore, multiple linear regression was performed to find out the relation between these indices and the tuber yield while linear regression was performed to find out the individual relation of the climate index and the tuber yield.
Quantitative assessment of variations in tuber yield required the development of models that related yield, as the dependent variable, to the shortlisted climate extreme indices including DTR, TXx, CDD, and TNm. The regression equation (Equation (3)) was constructed to find relationships between tuber yield and the shortlisted climate extreme indices as:
where Yield is the Prince Edward Island’s 30-year averaged tuber yield and the rest of the indices are the same as defined in Table 2. With R2 of the model presented here was 0.39, the t-value of the regression model (i.e., 4.20) and a p-value of 0.000, it is concluded that the relationships shown in this model were allied significant at 5% level of probability. There was no multicollinearity as all the indices had a VIF less than 1.5 [32].
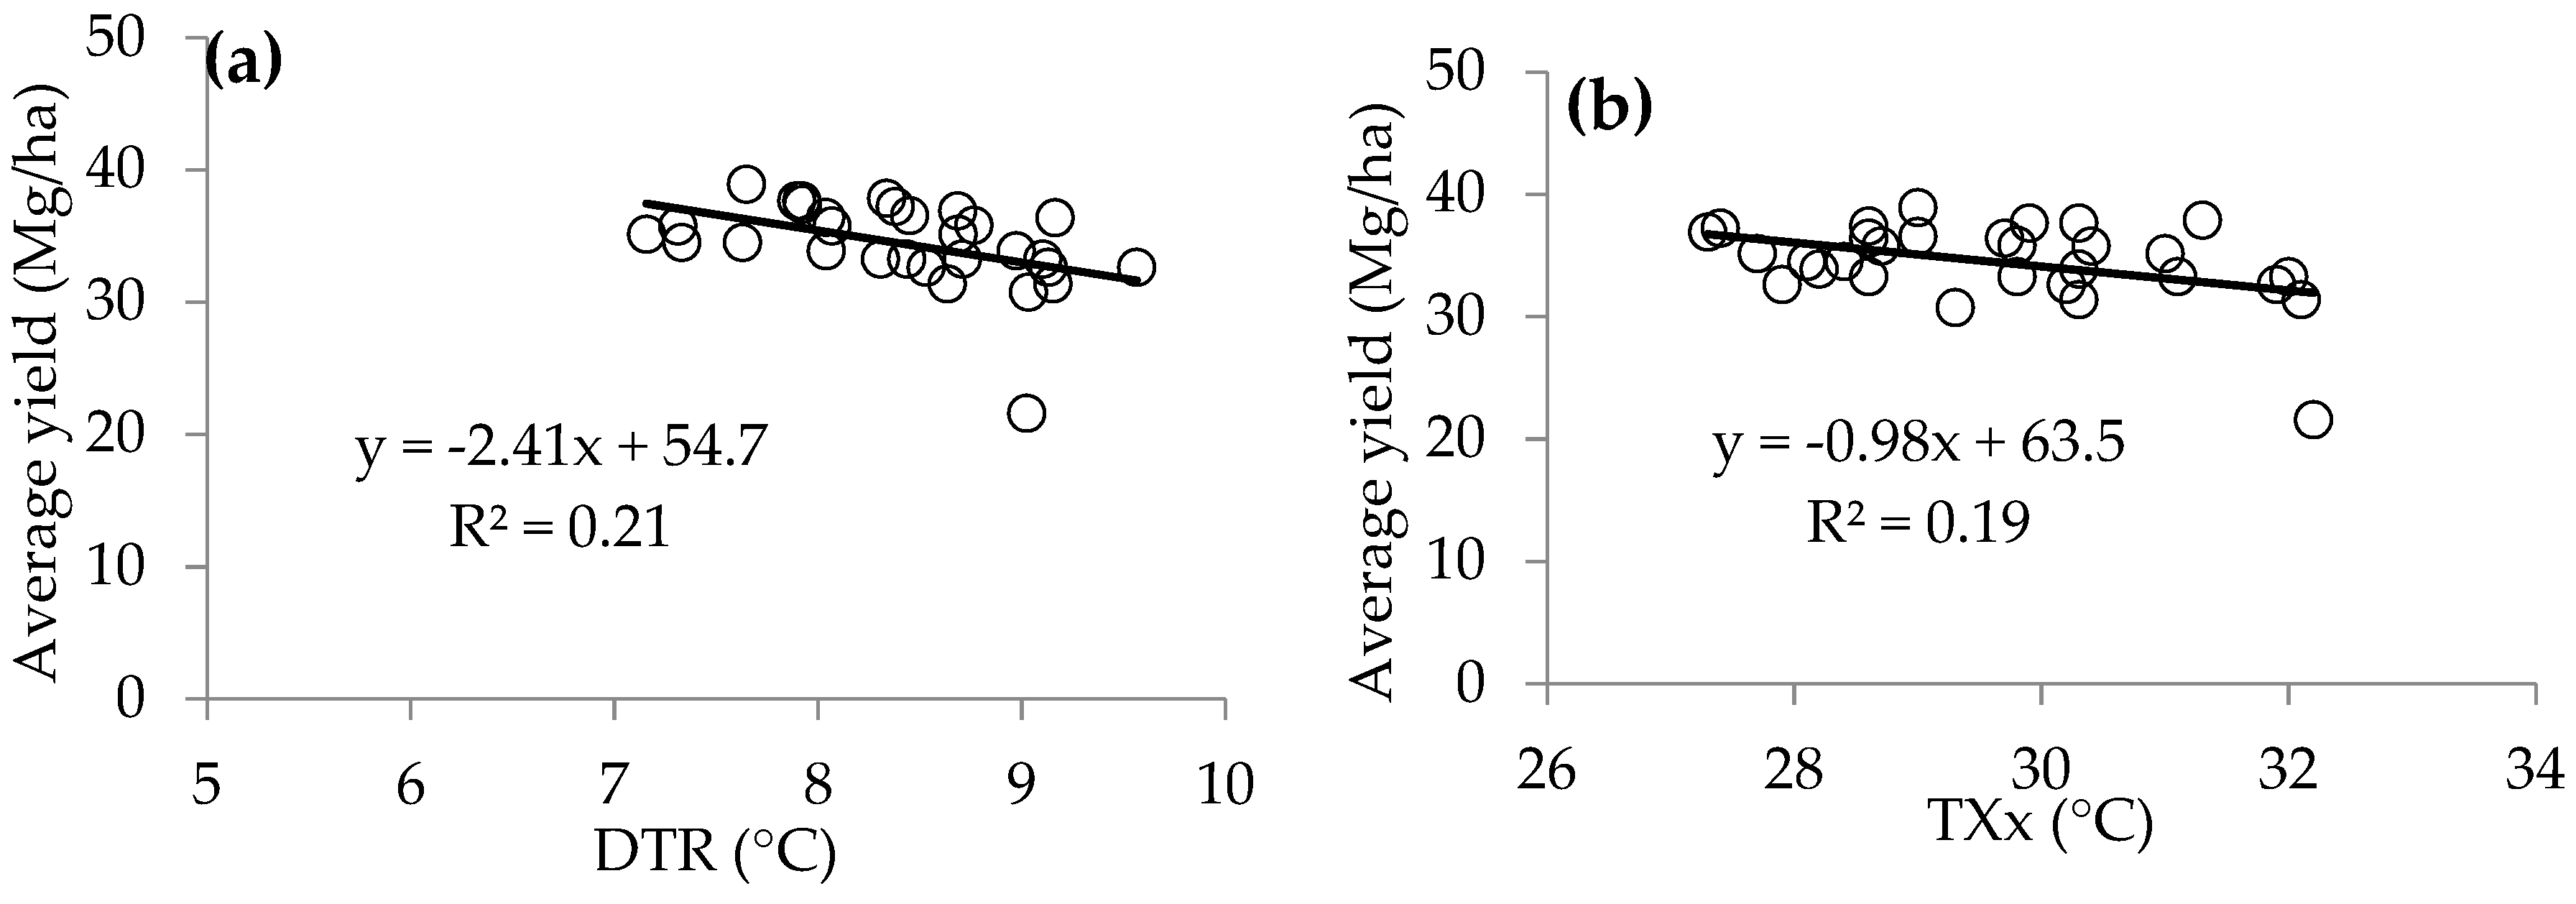
Further to it, the four shortlisted indices were accessed individually to check their contribution to variations in tuber yield. Daily temperature range accounted for only 21.3% of the total tuber yield changes (Figure 4a) reflecting that 78.7% of the variation in the tuber yield was explained by other factors that may include crop management practices, advanced technologies, other climate indices, seed selection, etc. The DTR displayed a linearly decreasing trend with average tuber yield and as illustrated in Equation (3), one-unit change in DTR will lead to a decrease of 0.760 Mg/ha of tuber yield.
The monthly maximum value of daily maximum temperature (warmest days) explained ~19% of the variation in tuber yield (Figure 4b), which means that ~81% of the variation in tuber yield was explained by other factors. It displayed a decreasing linear trend with the tuber yield. The regression equation (Equation (3)) showed that the one-unit change in TXx will lead to a tuber yield decrease of 0.777 Mg/ha. The reason is that the highest temperature for a longer period of time reduces the tuber yield due to drought resembling conditions as reported by Hatfield and Prueger [26].
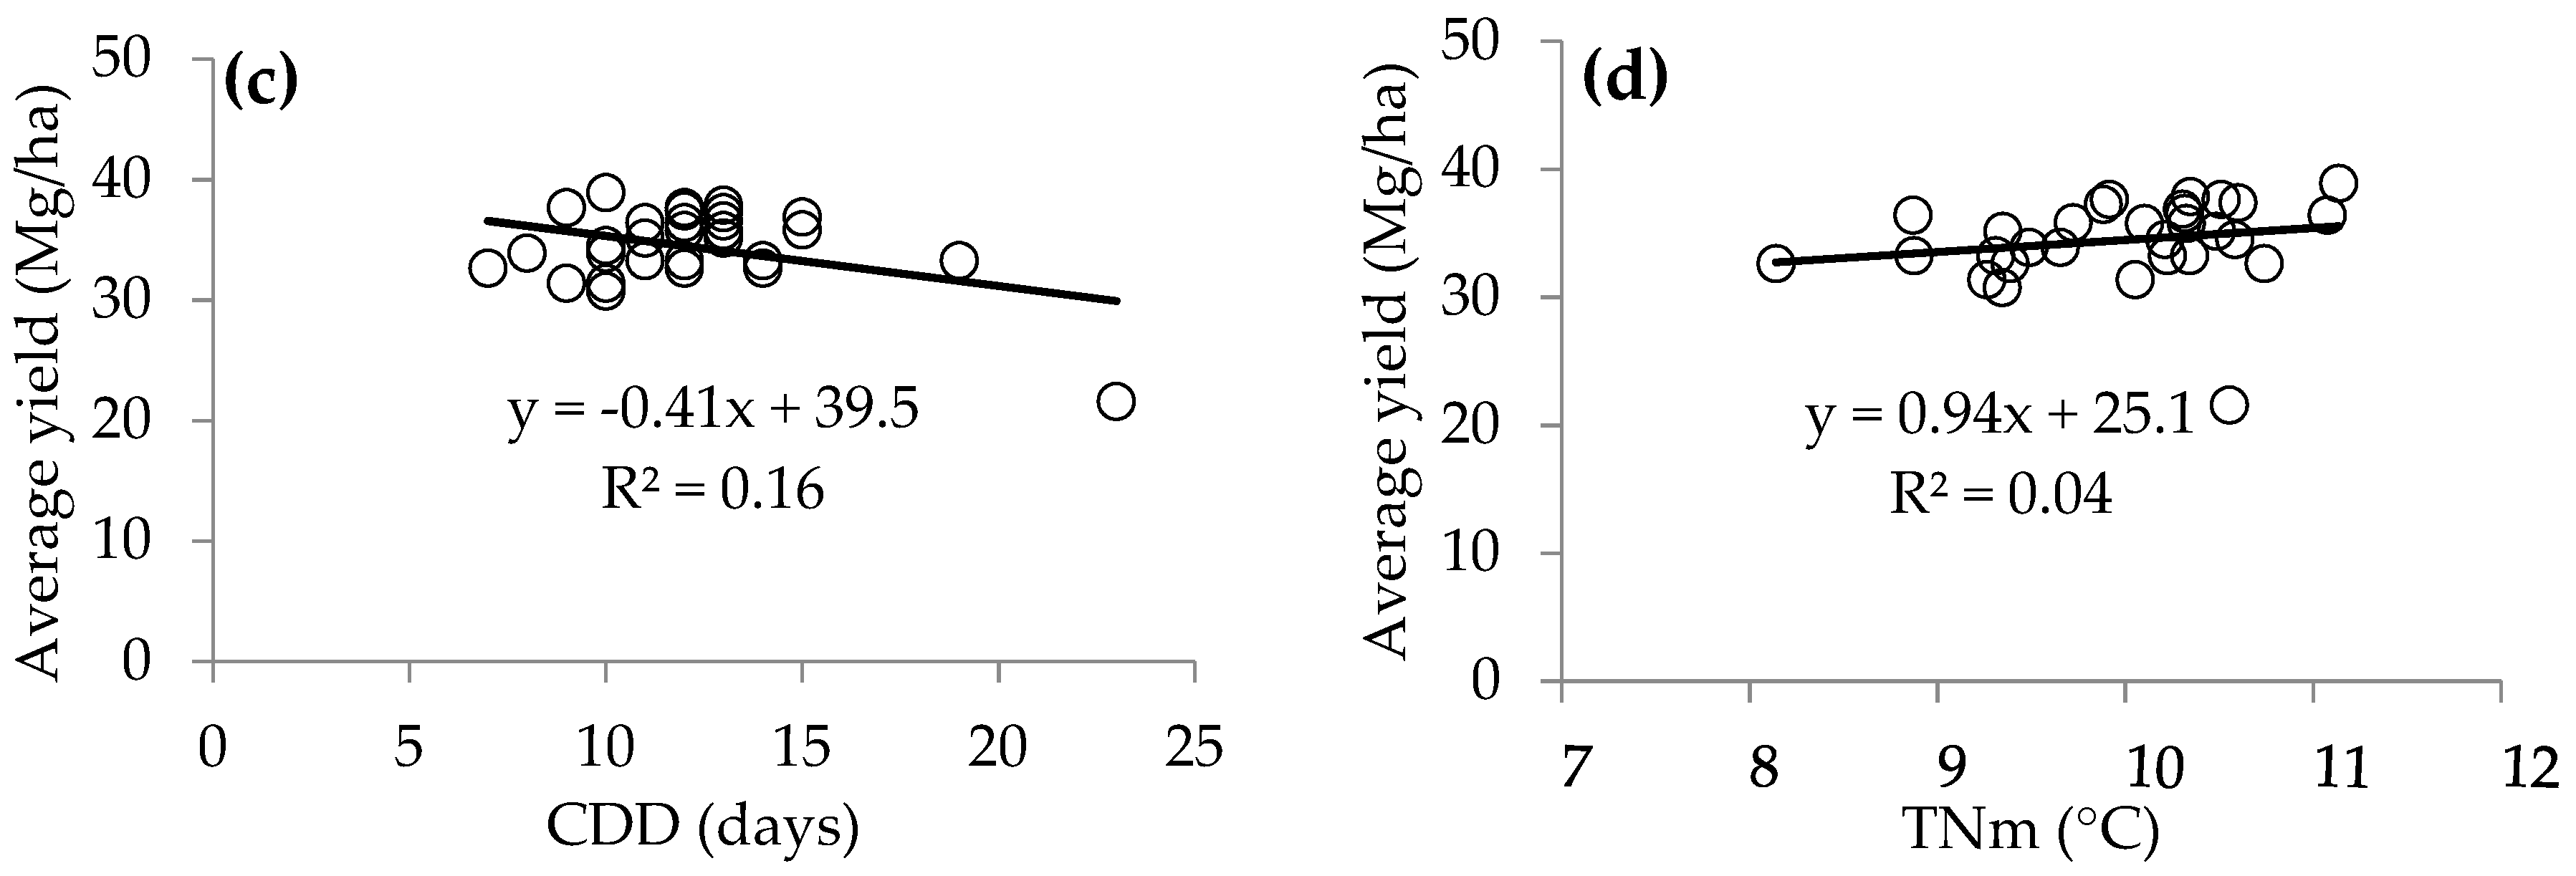
Continuous dry days, which displayed a linearly decreasing trend with average tuber yield, accounted for only ~16% of the total tuber yield changes, whereas ~84% of the variation in the tuber yield was explained by the other tuber yield affected parameters (Figure 4c). There was 0.378 Mg/ha reduction in tuber yield with a one-unit change in CDD. A prolonged period of CDD represents the drought conditions in which crops do not get the required water for their optimal growth especially in rain-fed agricultural areas, where rainwater is the only source for irrigation. Like other crops, the potato crop is also sensitive to drought conditions, which was also experienced and reported in the literature for different parts of the world by Peña-Gallardo et al. [56] and for Prince Edward Island by Afzaal et al. [38].
With ~96% of the variations in the tuber yield explained by the other factors, the variations in mean daily minimum temperature accounted for only ~4% of variations in the total tuber yield of the 30-year data of Prince Edward Island (Figure 4d). Having displayed a linearly decreasing trend with average tuber yield, the TNm’s one-unit change will lead to an increase of 0.610 Mg/ha of tuber yield.
4. Discussion
This study generates a knowledge base for future strategies about the contribution of climate extremes to variations in potato tuber yield in PEI. As the means of TMm, TNm, and CDD, significantly increased and the means of DTR, FD, TX10p, TN10p, and TXx decreased during the study period, it can be extracted from the results, and as also reported by Hijmans [33], the Prince Edward Island potato production is sensitive to climate extremes. Therefore, it is important to consider climate change while strategizing agriculture on the Island. The potato crop is highly sensitive to the high temperature and grows well in cooler conditions. A warmer climate is expected to be observed in different parts of the world in future and temperature has a negative impact on tuber yield as compared to the precipitation. Therefore, this study’s finding will help researchers to find out the climate indices and relate their relationship with the yield of other crops in other parts of the world.
Literature also reports that the tuber yield depends on many factors including climate changes that partially impact the crop yield [31]. The R2 value of 0.39 indicates that climate extreme indices account for only 39% of the tuber yield change, while 61% of the variation in tuber yield was explained by the other factors, such as better management practices, better seed, fertilization, precision agriculture technology, field topography, soil properties physical, chemical and hydrologic properties, supplement irrigation and others. Farooque et al. [37] found out that 57 to 66% variation in the tuber yield of New Brunswick and PEI was explained by soil moisture content. Zara et al. [43] found that the slope and elevation of agricultural fields explained 22 to 36% variation in the tuber yield of PEI and New Brunswick. Tuber yield also depends on the tuber seed quality, soil management practices, nitrate contents in the soil, fertilizer, and water management practices, chemical and bio-fertilization [39,40,41,42]. Field strategies for any crop, especially for potatoes, may be initiated from the outcome of this study for the management of crop cultivation on the island. Further modeling work, supported by neural networks, may highlight hotspots worth consideration for achieving optimal potato yield based on guidelines from more specific aspects of factors affecting potato cultivation on the Island.
Author Contributions
Conceptualization, J.M., A.A.F., and F.A.; methodology, J.M. and F.A.; software, J.M. and F.A.; validation, A.A.F. and X.W.; formal analysis, J.M., F.A., and H.A.; investigation, J.M. and F.A.; resources, A.A.F.; data curation, J.M., B.A., and H.A.; writing—original draft preparation, J.M. and A.A.F.; writing—review and editing; B.A. and X.W.; supervision, A.A.F.; project administration, A.A.F. and F.A.; funding acquisition, A.A.F. All authors have read and agreed to the published version of the manuscript.
Funding
This research was supported by the Natural Science and Engineering Research Council of Canada; grant number RGPIN-2017-05769.
Acknowledgments
The Precision Agriculture Team of the University of Prince Edward Island is acknowledged for support during this study.
Conflicts of Interest
The authors declare no conflict of interest.
References
- Tian, D.; Dong, W.; Zhang, H.; Guo, Y.; Yang, S.; Dai, T. Future changes in coverage of 1.5 °C and 2 °C warming thresholds. Sci. Bull. 2017, 62, 1455–1463. [Google Scholar] [CrossRef] [Green Version]
- Alexander, L.V.; Zhang, X.; Peterson, T.C.; Caesar, J.; Gleason, B.; Klein Tank, A.M.G.; Haylock, M.; Collins, D.; Trewin, B.; Rahimzadeh, F.; et al. Global observed changes in daily climate extremes of temperature and precipitation. J. Geophys. Res. Atmos. 2006, 111. [Google Scholar] [CrossRef] [Green Version]
- Donat, M.G.; Alexander, L.V.; Yang, H.; Durre, I.; Vose, R.; Dunn, R.J.H.; Willett, K.M.; Aguilar, E.; Brunet, M.; Caesar, J.; et al. Updated analyses of temperature and precipitation extreme indices since the beginning of the twentieth century: The HadEX2 dataset. J. Geophys. Res. Atmos. 2013, 118, 2098–2118. [Google Scholar] [CrossRef]
- Halimatou, A.T.; Traore, K.; Kyei-Baffour, N. Assessment of changing trends of daily precipitation and temperature extremes in Bamako and Ségou in Mali from 1961—2014. Weather Clim. Extrem. 2017, 18, 8–16. [Google Scholar] [CrossRef]
- Chisanga, C.; Phiri, E.; Chinene, V. Trends of extreme events in precipitation and temperature during the 1963—2012 period at Mt Makulu, Zambia. J. Sci. Res. Rep. 2017, 15, 1–19. [Google Scholar] [CrossRef]
- Ciupertea, A.F.; Piticar, A.; Djurdjevic, V.; Croitoru, A.-E.; Bartok, B. Future changes in extreme temperature indices in Cluj-Napoca, Romania. Aerul Si Apa Compon. Ale Mediu. 2017, 235–242. [Google Scholar] [CrossRef]
- Gamal, G. Future analysis of extreme temperature indices for sinai peninsula-egypt. Imp. J. Interdiscip. Res. 2017, 3, 1960–1966. [Google Scholar]
- Montero-Martínez, M.J.; Santana-Sepúlveda, J.S.; Pérez-Ortiz, N.I.; Pita-Díaz, Ó.; Castillo-Liñan, S. Comparing climate change indices between a northern (arid) and a southern (humid) basin in Mexico during the last decades. Adv. Sci. Res. 2018, 15, 231–237. [Google Scholar] [CrossRef]
- Shiferaw, A.; Tadesse, T.; Rowe, C.; Oglesby, R. Precipitation extremes in dynamically downscaled climate scenarios over the greater horn of Africa. Atmosphere 2018, 9, 112. [Google Scholar] [CrossRef] [Green Version]
- Mostafa, A.N.; Wheida, A.; El Nazer, M.; Adel, M.; El Leithy, L.; Siour, G.; Coman, A.; Borbon, A.; Magdy, A.W.; Omar, M.; et al. Past (1950–2017) and future (–2100) temperature and precipitation trends in Egypt. Weather Clim. Extrem. 2019, 26, 100225. [Google Scholar] [CrossRef]
- Vincent, L.A.; Wang, X.L.; Milewska, E.J.; Wan, H.; Yang, F.; Swail, V. A second generation of homogenized Canadian monthly surface air temperature for climate trend analysis. J. Geophys. Res. Atmos. 2012, 117. [Google Scholar] [CrossRef]
- Wang, X.L.; Feng, Y.; Vincent, L.A. Observed changes in one-in-20 year extremes of canadian surface air temperatures. Atmos. Ocean 2014, 52, 222–231. [Google Scholar] [CrossRef]
- Bonsal, B.R.; Zhang, X.; Vincent, L.A.; Hogg, W.D. Characteristics of daily and extreme temperatures over Canada. J. Clim. 2001, 14, 1959–1976. [Google Scholar] [CrossRef]
- Vincent, L.A.; Zhang, X.; Mekis, É.; Wan, H.; Bush, E.J. Changes in Canada’s climate: Trends in indices based on daily temperature and precipitation data. Atmos. Ocean 2018, 56, 332–349. [Google Scholar] [CrossRef] [Green Version]
- Vincent, L.A.; Mekis, É. Changes in daily and extreme temperature and precipitation indices for Canada over the twentieth century. Atmos. Ocean 2006, 44, 177–193. [Google Scholar] [CrossRef] [Green Version]
- Casati, B.; Yagouti, A.; Chaumont, D. Regional climate projections of extreme heat events in nine pilot Canadian communities for public health planning. J. Appl. Meteorol. Clim. 2013, 52, 2669–2698. [Google Scholar] [CrossRef]
- Mekis, É.; Vincent, L.A. An Overview of the Second Generation Adjusted Daily Precipitation Dataset for Trend Analysis in Canada. Atmos. Ocean 2011, 49, 163–177. [Google Scholar] [CrossRef] [Green Version]
- Brown, R.; Derksen, C.; Wang, L. A multi-data set analysis of variability and change in Arctic spring snow cover extent, 1967–2008. J. Geophys. Res. Atmos. 2010, 115. [Google Scholar] [CrossRef]
- Richards, W.; Daigle, R. Scenarios and Guidance for Adaptation to Climate Change and Sea Level Rise—NS and PEI Municipalities. Atlantic Climate Adaptation Solutions Association. 2011. Available online: https://www.princeedwardisland.ca/sites/default/files/publications/scenarios_and_guidance_for_adaptation_to_climate_change_and_sea_level_rise_-_ns_and_pei_municipalities.pdf (accessed on 22 March 2020).
- Climate Change and Island Agriculture. Government of Prince Edward Island. Available online: https://www.princeedwardisland.ca/en/information/communities-land-and-environment/climate-change-and-island-agriculture (accessed on 22 March 2020).
- Agriculture on PEI. Government of Prince Edward Island. Available online: https://www.princeedwardisland.ca/en/information/agriculture-and-land/agriculture-on-pei (accessed on 22 March 2020).
- Government of Prince Edward Island. PEI 2018 Agriculture and Agri-Food International Exports. 2018. Available online: https://www.princeedwardisland.ca/en/publication/pei-2018-agriculture-and-agri-food-international-exports (accessed on 22 March 2020).
- Macdonald, M. Potatoes: A Billion Dollar Industry for P.E.I. The Guardian. Available online: https://www.theguardian.pe.ca/news/local/potatoes-a-billion-dollar-industry-for-pei-95098/ (accessed on 29 April 2020).
- Prince Edward Island has the Largest Potato Crop in Canada. Available online: https://www150.statcan.gc.ca/n1/pub/95-640-x/2016001/article/14801-eng.htm (accessed on 26 April 2020).
- Lobell, D.B.; Burke, M.B. Why are agricultural impacts of climate change so uncertain? the importance of temperature relative to precipitation. Environ. Res. Lett. 2008, 3, 034007. [Google Scholar] [CrossRef]
- Hatfield, J.L.; Prueger, J.H. Temperature extremes: Effect on plant growth and development. Weather Clim. Extrem. 2015, 10, 4–10. [Google Scholar] [CrossRef] [Green Version]
- Qian, B.; Zhang, X.; Smith, W.; Grant, B.; Jing, Q.; Cannon, A.J.; Neilsen, D.; McConkey, B.; Li, G.; Bonsal, B.; et al. Climate change impacts on Canadian yields of spring wheat, canola and maize for global warming levels of 1.5 °C, 2.0 °C, 2.5 °C and 3.0 °C. Environ. Res. Lett. 2019, 14, 074005. [Google Scholar] [CrossRef]
- Raymundo, R.; Asseng, S.; Robertson, R.; Petsakos, A.; Hoogenboom, G.; Quiroz, R.; Hareau, G.; Wolf, J. Climate change impact on global potato production. Eur. J. Agron. 2018, 100, 87–98. [Google Scholar] [CrossRef]
- Dell, M.; Jones, B.F.; Olken, B.A. Temperature shocks and economic growth: Evidence from the last half century. Am. Econ. J. Macroecon. 2012, 4, 66–95. [Google Scholar] [CrossRef] [Green Version]
- Lobell, D.B.; Gourdji, S.M. The influence of climate change on global crop productivity. Plant Physiol. 2012, 160, 1686–1697. [Google Scholar] [CrossRef] [PubMed] [Green Version]
- Poudel, S.; Shaw, R. The relationships between climate variability and crop yield in a mountainous environment: A case study in Lamjung District, Nepal. Climate 2016, 4, 13. [Google Scholar] [CrossRef] [Green Version]
- Mumo, L.; Yu, J.; Fang, K. Assessing impacts of seasonal climate variability on maize yield in Kenya. Int. J. Plant Prod. 2018, 12, 297–307. [Google Scholar] [CrossRef]
- Hijmans, R.J. The effect of climate change on global potato production. Am. J. Potato Res. 2003, 80, 271–279. [Google Scholar] [CrossRef]
- Levy, D.; Veilleux, R.E. Adaptation of potato to high temperatures and salinity—A review. Am. J. Potato Res. 2007, 84, 487–506. [Google Scholar] [CrossRef]
- Singh, B.P.; Dua, V.K.; Govindakrishnan, P.M.; Sharma, S. Impact of climate change on potato. In Climate-Resilient Horticulture: Adaptation and Mitigation Strategies; Springer: Delhi, India, 2013; pp. 125–135. ISBN 9788132209744. [Google Scholar]
- Government of Canada. Climate Change in Prince Edward Island. 2017. Available online: http://www.gov.pe.ca/photos/original/eef_climatechan.pdf (accessed on 2 May 2020).
- Farooque, A.A.; Zare, M.; Abbas, F.; Bos, M.; Esau, T.; Zaman, Q. Forecasting potato tuber yield using a soil electromagnetic induction method. Eur. J. Soil Sci. 2019, 1–18. [Google Scholar] [CrossRef]
- Afzaal, H.; Farooque, A.A.; Abbas, F.; Acharya, B.; Esau, T. Precision irrigation strategies for sustainable water budgeting of potato crop in Prince Edward Island. Sustainability 2020, 12, 2419. [Google Scholar] [CrossRef] [Green Version]
- Guluma, A.D. Factors affecting potato (Solanum tuberosum L.) tuber seed quality in mid and highlands: A review. Int. J. Zambrut 2020, 7, 24–40. [Google Scholar]
- Nurmanov, Y.T.; Chernenok, V.G.; Kuzdanova, R.S. Potato in response to nitrogen nutrition regime and nitrogen fertilization. Field Crop. Res. 2019, 231, 115–121. [Google Scholar] [CrossRef]
- Wang, X.; Guo, T.; Wang, Y.; Xing, Y.; Wang, Y.; He, X. Exploring the optimization of water and fertilizer management practices for potato production in the sandy loam soils of Northwest China based on PCA. Agric. Water Manag. 2020, 237, 106180. [Google Scholar] [CrossRef]
- Kumar, N.; Prasad, V.; Pal Yadav, N. Effect of chemical fertilizers and bio fertilizers on flower yield, tuberous root yield and quality parameter on dahlia (Dahlia variabilis L.) cv. Kenya orange. J. Pharmacol. Phytochem. 2019, 8, 2265–2267. [Google Scholar]
- Zare, M.; Farooque, A.A.; Abbas, F.; Zaman, Q.; Bos, M. Trends in the variability of potato tuber yield under selected land and soil characteristics. Plant Soil Environ. 2019, 65, 111–117. [Google Scholar] [CrossRef] [Green Version]
- Quarterly Demographic Estimates, January to March 2019. Available online: https://www150.statcan.gc.ca/n1/pub/91-002-x/91-002-x2019001-eng.htm (accessed on 2 May 2020).
- Our Changing Climate. Government of Prince Edward Island. Available online: https://www.princeedwardisland.ca/en/information/communities-land-and-environment/our-changing-climate (accessed on 23 March 2020).
- Island Climate and Weather. Government of Prince Edward Island. Available online: https://www.princeedwardisland.ca/en/information/communities-land-and-environment/island-climate-and-weather (accessed on 23 March 2020).
- Mann, H.B. Nonparametric tests against trend. Econ. Soc. 1945, 245–259. [Google Scholar] [CrossRef]
- Kendall, M.G. Rank Correlation Methods; Charles Griffin & Co. Ltd.: London, UK, 1955; p. 196. [Google Scholar]
- Salmi, T.; Määttä, A.; Anttila, P.; Ruoho-Airola, T.; Amnell, T.; Maatta, A. Detecting Trends of Annual Values of Atmospheric Pollutants by the Mann-Kendall Test and Sen’s Slope Estimates: The Excel Template Application MAKESENS; Finnish Meteor. Institute: Helsinki, Finland, 2002; ISBN 9516975631. [Google Scholar]
- Armenise, E.; Redmile-Gordon, M.A.; Stellacci, A.M.; Ciccarese, A.; Rubino, P. Developing a soil quality index to compare soil fitness for agricultural use under different managements in the mediterranean environment. Soil Tillage Res. 2013, 130, 91–98. [Google Scholar] [CrossRef]
- Andrews, S.S.; Karlen, D.L.; Mitchell, J.P. A comparison of soil quality indexing methods for vegetable production systems in Northern California. Agric. Ecosyst. Environ. 2002, 90, 25–45. [Google Scholar] [CrossRef]
- Xian, X.; Pang, M.; Zhang, J.; Zhu, M.; Kong, F.; Xi, M. Assessing the effect of potential water and salt intrusion on coastal wetland soil quality: Simulation study. J. Soils Sediments 2019, 19, 2251–2264. [Google Scholar] [CrossRef]
- Mandal, U.K.; Warrington, D.N.; Bhardwaj, A.K.; Bar-Tal, A.; Kautsky, L.; Minz, D.; Levy, G.J. Evaluating impact of irrigation water quality on a calcareous clay soil using principal component analysis. Geoderma 2008, 144, 189–197. [Google Scholar] [CrossRef]
- Andrews, S.S.; Carroll, C.R. Designing a soil quality assessment tool for sustainable. Ecol. Soc. Am. 2001, 11, 1573–1585. [Google Scholar]
- Sánchez-Navarro, A.; Gil-Vázquez, J.M.; Delgado-Iniesta, M.J.; Marín-Sanleandro, P.; Blanco-Bernardeau, A.; Ortiz-Silla, R. Establishing an index and identification of limiting parameters for characterizing soil quality in Mediterranean ecosystems. Catena 2015, 131, 35–45. [Google Scholar] [CrossRef]
- Peña-Gallardo, M.; Vicente-Serrano, S.M.; Domínguez-Castro, F.; Beguería, S. The impact of drought on the productivity of two rainfed crops in Spain. Nat. Hazards Earth Syst. Sci. 2019, 19, 1215–1234. [Google Scholar] [CrossRef] [Green Version]
Figure 1.
Prince Edward Island placed along the Canadian and global maps showing the five weather stations considered as study sites of this research.
Figure 1.
Prince Edward Island placed along the Canadian and global maps showing the five weather stations considered as study sites of this research.

Figure 2.
Principle components with their percentage of variance and cumulative percentage variance.
Figure 2.
Principle components with their percentage of variance and cumulative percentage variance.

Figure 3.
Comparison between tuber yield and the most influential climate extreme indices in Prince Edward Island. (a–d) represent the relation between average tuber yield and daily temperature range (DTR), warmest days (TXx), continuous dry days (CDD), and mean of daily minimum temperature (TNm), respectively.


Figure 4.
The relation between tuber yield and the most significant climate extreme indices in Prince Edward Island. (a–d) represent the relation between average yield and daily temperature range (DTR), warmest days (TXx), continuous dry days (CDD), and mean daily minimum temperature (TNm) respectively.


Table 1.
Geographical coordinates and climatic parameters of all the selected stations in Prince Edward Island, Canada.
Table 1.
Geographical coordinates and climatic parameters of all the selected stations in Prince Edward Island, Canada.
| Stations | Lat. (°) | Long. (°) | Elev. (m) | Average P (mm) | Upper Threshold of TX (°C) | Lower Threshold of TN (°C) | Missing Data (%) |
|---|---|---|---|---|---|---|---|
| East point | 46.46 | −61.99 | 7.70 | 3.00 | 33.5 | −31.0 | 2.05 |
| Charlottetown | 46.23 | −63.17 | 13.7 | 3.19 | 33.0 | −29.8 | 0.78 |
| New Glasgow | 46.41 | −63.35 | 6.10 | 3.49 | 34.0 | −34.5 | 2.67 |
| Summerside | 46.44 | −63.84 | 12.2 | 2.69 | 33.7 | −28.0 | 12.3 |
| North cap | 47.06 | −64.00 | 7.60 | 2.97 | 33.2 | −33.0 | 2.16 |
Lat: latitude; Long: longitude; Elev: elevation; P: daily precipitation; TX: daily maximum temperature; TN: daily minimum temperature.
Table 2.
Names, identifications (abbreviations), indicators, definitions, and their units of the Expert Team on Climate Change Detection and Indices (ETCCDI)’s temperature and precipitation indices.
Table 2.
Names, identifications (abbreviations), indicators, definitions, and their units of the Expert Team on Climate Change Detection and Indices (ETCCDI)’s temperature and precipitation indices.
| Indices | ID | Indicator Name | Definition | Units |
|---|---|---|---|---|
| Temperature indices | TN10p | Cold nights | Percentage of days when TN < 10th percentile | % |
| TN90p | Warm nights | Percentage of days when TN > 90th percentile | % | |
| TX10p | Cold days | Percentage of days when TN < 10th percentile | % | |
| TX90p | Hot days | Percentage of days when TN > 90th percentile | % | |
| TXx | Warmest days | Maximum value of daily TX | °C | |
| TXn | Coldest days | Minimum value of daily TX | °C | |
| TNx | Warmest nights | Maximum value of daily TN | °C | |
| TNn | Coldest nights | Minimum value of daily TN | °C | |
| TMm | Mean TM | Mean daily mean temperature | °C | |
| TNm | Mean TN | Mean daily minimum temperature | °C | |
| DTR | Daily temperature range | Daily TX - Daily TN | °C | |
| FD | Frost days | Number of days when TN < 0 °C | Days | |
| SU | Summer days | Number of days when TX > 25 °C | Days | |
| Precipitation indices | CDD | Continuous dry days | Number of consecutive days, when P < 1.0 mm | Days |
| CWD | Continuous wet days | Number of consecutive days, when P ≥ 1.0 mm | Days | |
| Rx1day | Max 1-day P | Amount of P that fell in 1 day | mm | |
| Rx5day | Max 5-day P | Amount of total P that fell in 5 consecutive days | mm | |
| R10mm | No. of heavy P days | Count of days when P ≥ 10.0 mm | Days | |
| R20mm | Number of very heavy P days | Number of days when P ≥ 20.0 mm | Days | |
| P_TOT | Annual total wet-day precipitation | Sum of daily P when P ≥ 1.0 mm | mm |
TM: mean daily temperature; TX: daily maximum temperature; TN: daily minimum temperature; P: daily precipitation; P_TOT: total precipitation.
Table 3.
Changes in climate extreme indices based on 30 years of data (1989–2018) of months May-October for Prince Edward Island.
Table 3.
Changes in climate extreme indices based on 30 years of data (1989–2018) of months May-October for Prince Edward Island.
| Indices | Indices-ID | Definition | Trends | Units |
|---|---|---|---|---|
| Temperature Indices | TN10p | Cold nights | −11.40 *** | % |
| TN90p | Warm nights | 3.98 | ||
| TX10p | Cold days | −5.67 * | ||
| TX90p | Hot days | −2.38 | ||
| TXx | Warmest days | −2.00 * | °C | |
| TXn | Coldest days | 1.36 | ||
| TNx | Warmest nights | 1.07 | ||
| TNn | Coldest nights | 1.44 | ||
| TMm | Mean TM | 0.77 * | ||
| TNm | Mean TN | 1.17 ** | ||
| DTR | Daily temperature range | −1.01 * | ||
| FD | Frost days | −3.75 * | days | |
| SU | Summer days | −1.30 | ||
| Precipitation Indices | CDD | Continuous dry days | 3.33 * | days |
| CWD | Continuous wet days | 0.00 | ||
| R10mm | Number of heavy P days | 0.00 | ||
| R20mm | Number of very heavy P days | 0.00 | ||
| P_TOT | Annual total wet-day P | −27.0 | mm | |
| Rx1day | Max 1-day P | 5.18 | ||
| Rx5day | Max 5-day P | 9.52 |
* Significant at 0.05 level (95%); ** Significant at 0.01 level (99%); *** Significant at 0.001 level (99.9%). TM: mean daily temperature; TX: daily maximum temperature; TN: daily minimum temperature; P: daily precipitation; P_TOT: total precipitation.
Table 4.
Results of principal component analysis. The values shown in the bold text represent the factor loadings that were initially selected for MDS (minimum data set) based on the highly weighted factor loadings concept.
Table 4.
Results of principal component analysis. The values shown in the bold text represent the factor loadings that were initially selected for MDS (minimum data set) based on the highly weighted factor loadings concept.
| Variance and Factor Loadings | PC1 | PC2 | PC3 |
|---|---|---|---|
| Variance (%) | 52.2 | 22.4 | 12.3 |
| Cumulative variance | 52.2 | 74.6 | 86.9 |
| Eigenvector or factor loading | |||
| CDD (days) | 0.03 | −0.30 | −0.89 |
| TXx (°C) | 0.01 | −0.59 | 0.44 |
| DTR (°C) | −0.25 | −0.59 | 0.06 |
| FD (days) | −0.41 | −0.10 | −0.10 |
| TN10p (%) | −0.46 | −0.14 | −0.01 |
| TX10p (%) | −0.39 | 0.30 | 0.08 |
| TNm (°C) | 0.48 | 0.01 | 0.01 |
| TMm (°C) | 0.42 | −0.30 | 0.04 |
PC = Principal Component. TN10p: cold nights; TX10p: cold days; TXx: warmest days; TMm: mean of daily mean temperature; TNm: mean of daily minimum temperature; DTR: daily temperature range; FD: frost days; CDD: continuous dry days. The values bolded as well as underlined are the factor loadings that were considered retained in the MDS after removing redundancy under the scope of 10% of the highest value.
Table 5.
Pearson’s correlation coefficient for the climate extreme indices used to reduce redundancy of indices from MDS (minimum data set).
Table 5.
Pearson’s correlation coefficient for the climate extreme indices used to reduce redundancy of indices from MDS (minimum data set).
| Indices | TN10p (%) | TX10p (%) | TXx (°C) | TMm (°C) | TNm (°C) | DTR (°C) | FD (days) |
|---|---|---|---|---|---|---|---|
| TX10p (%) | 0.63 *** | 1.00 | |||||
| TXx (°C) | 0.07 | −0.22 | 1.00 | ||||
| TMm (°C) | −0.71 *** | −0.83 *** | 0.25 | 1.00 | |||
| TNm (°C) | −0.91 *** | −0.76 *** | −0.02 | 0.89 *** | 1.00 | ||
| DTR (°C) | 0.64 *** | 0.08 | 0.52 ** | −0.06 | −0.50 * | 1.00 | |
| FD (days) | 0.79 *** | 0.51 * | −0.03 | −0.60 *** | −0.74 *** | 0.50 * | 1.00 |
| CDD (days | 0.09 | −0.21 | 0.03 | 0.13 | 0.02 | 0.19 | 0.03 |
* Significant at the 0.05 level, ** Significant at the 0.01 level and *** Significant at the 0.001 level. TN10p: cold nights; TX10p: cold days; TXx: warmest days; TMm: mean of daily mean temperature; TNm: mean of daily minimum temperature; DTR: daily temperature range; FD: frost days; CDD: continuous dry days.
© 2020 by the authors. Licensee MDPI, Basel, Switzerland. This article is an open access article distributed under the terms and conditions of the Creative Commons Attribution (CC BY) license (http://creativecommons.org/licenses/by/4.0/).
Share and Cite
MDPI and ACS Style
Maqsood, J.; Farooque, A.A.; Wang, X.; Abbas, F.; Acharya, B.; Afzaal, H. Contribution of Climate Extremes to Variation in Potato Tuber Yield in Prince Edward Island. Sustainability 2020, 12, 4937. https://doi.org/10.3390/su12124937
AMA Style
Maqsood J, Farooque AA, Wang X, Abbas F, Acharya B, Afzaal H. Contribution of Climate Extremes to Variation in Potato Tuber Yield in Prince Edward Island. Sustainability. 2020; 12(12):4937. https://doi.org/10.3390/su12124937
Chicago/Turabian StyleMaqsood, Junaid, Aitazaz A. Farooque, Xander Wang, Farhat Abbas, Bishnu Acharya, and Hassan Afzaal. 2020. "Contribution of Climate Extremes to Variation in Potato Tuber Yield in Prince Edward Island" Sustainability 12, no. 12: 4937. https://doi.org/10.3390/su12124937
Note that from the first issue of 2016, this journal uses article numbers instead of page numbers. See further details here.