Grazing Management Influences Gut Microbial Diversity of Livestock in the Same Area
by
 ,
,
Pengfei Song
1,2 ,
,
Wen Qin
1,2,
YanGan Huang
1,
Lei Wang
1,
Zhenyuan Cai
1,3,* and
Tongzuo Zhang
1,3,* 1
Key Laboratory of Adaptation and Evolution of Plateau Biota, Northwest Institute of Plateau Biology, Chinese Academy of Sciences, 23th, Xinning Road, Xining 810001, China
2
College of Life Sciences, University of Chinese Academy of Sciences, Beijing 100049, China
3
Qinghai Provincial Key Laboratory of Animal Ecological Genomics, 23th, Xinning Road, Xining 810001, China
*
Authors to whom correspondence should be addressed.
Sustainability 2020, 12(10), 4160; https://doi.org/10.3390/su12104160
Submission received: 26 April 2020
/
Revised: 15 May 2020
/
Accepted: 17 May 2020
/
Published: 20 May 2020
(This article belongs to the Special Issue Sustainable Livestock Production)
Abstract
:The composition of gut microbiota is closely related to health and nutrition of livestock. Research on the interaction between gut microbiota in livestock and grazing management strategies is unfortunately sparse. By studying the compositions of gut microbiota in sheep and goats in a single, mixed grazing population under the control of herdsman, as well as those of free-range camels in the same area of Qaidam Basin, we found that the composition of gut microbiota between sheep and goats showed no significant difference. However, there were significant differences between mixed group and camels at α- and β-diversities. We speculate that grazing management can shape gut microbial diversity indirectly. Mixed grazing under the control of herdsman lead to similarities in the diversity of gut microbiota among different species and limit their diversities of gut microbiota, which is not conducive to healthy growth of the host. On the contrary, free-range grazing is better for the diversity of gut microbiota. In order to sustainably manage populations of livestock, gut microbiota analysis may prove to be an important indicator for evaluating the merits of different grazing management strategies. Our results lay a foundation to improve the health of livestock and grazing management.
1. Introduction
With the constant growth of the human population and continual improvements to quality of life, the worldwide demand for meat is also increasing daily [1]. Livestock production must therefore also increase, even in areas with limited land and human resources, where herdsmen face significant challenges to livestock management. Many factors are associated with the variations of gut microbiota. For livestock, differential management by herdsmen can lead to significant differences in gut microbiota composition [2]. Gut microbiota, in such cases, may be able to assist livestock in adapting to environmental variations, efficiently obtaining energy, and maintaining homeostatic balance [3]. As of yet, it is still unclear exactly how grazing management strategies interact with livestock gut microbiota, and which factor dominates this relationship.
Gut microbiota play important roles in host digestion, health, immunity, and adaptability to the environment [3,4,5]. Host-bacteria relationships, which include co-evolution, co-metabolites and mutualism, are influenced by intrinsic host traits like diet, genetics and behaviour, as well as extrinsic environmental factors, such as climatic conditions, habitat type and the human-induced shifts in land use [3,6,7]. Dietary variations, habitats and host genes are the main driving factors determining the changes in gut microbiota [8,9,10,11]. Dietary change is the main factor that affects the composition and function of gut microbiota, and the composition of gut microbiota in both humans and animals are affected by dietary changes [12]. Host genetics can influence the composition of gut microbiota [13,14]. The gut microbiota of different species can be different [14,15,16], and the gut microbiota in the same species has the similar composition [17]. Generally, gut microbiota compositions tend to be similar in sympatric species [18], in different environments, the relative influences of intrinsic and extrinsic factors may be different in determining gut microbiota [3].
At present, most research on livestock gut microbiota relates to how it affects the health and nutrition of the animals [19,20], and focuses mainly on farm-raised cattle, sheep, pigs and chickens [5,20,21,22,23]. The gut microbiota compositions of livestock have been found to differ significantly under different management systems, as changes in feeding or management patterns can lead to changes in gut microbiota, and changes in feeding patterns have been shown to have a greater impact than changes in feeding locations [2]. Grazing leads to changes in land use, which can cause variation on gut microbiota of small mammals indirectly, like Brandt’s voles (Lasiopodomys brandtii) which are also herbivores [24]. However, few studies have focused on grazing livestock, especially for different species in the same grazing area.
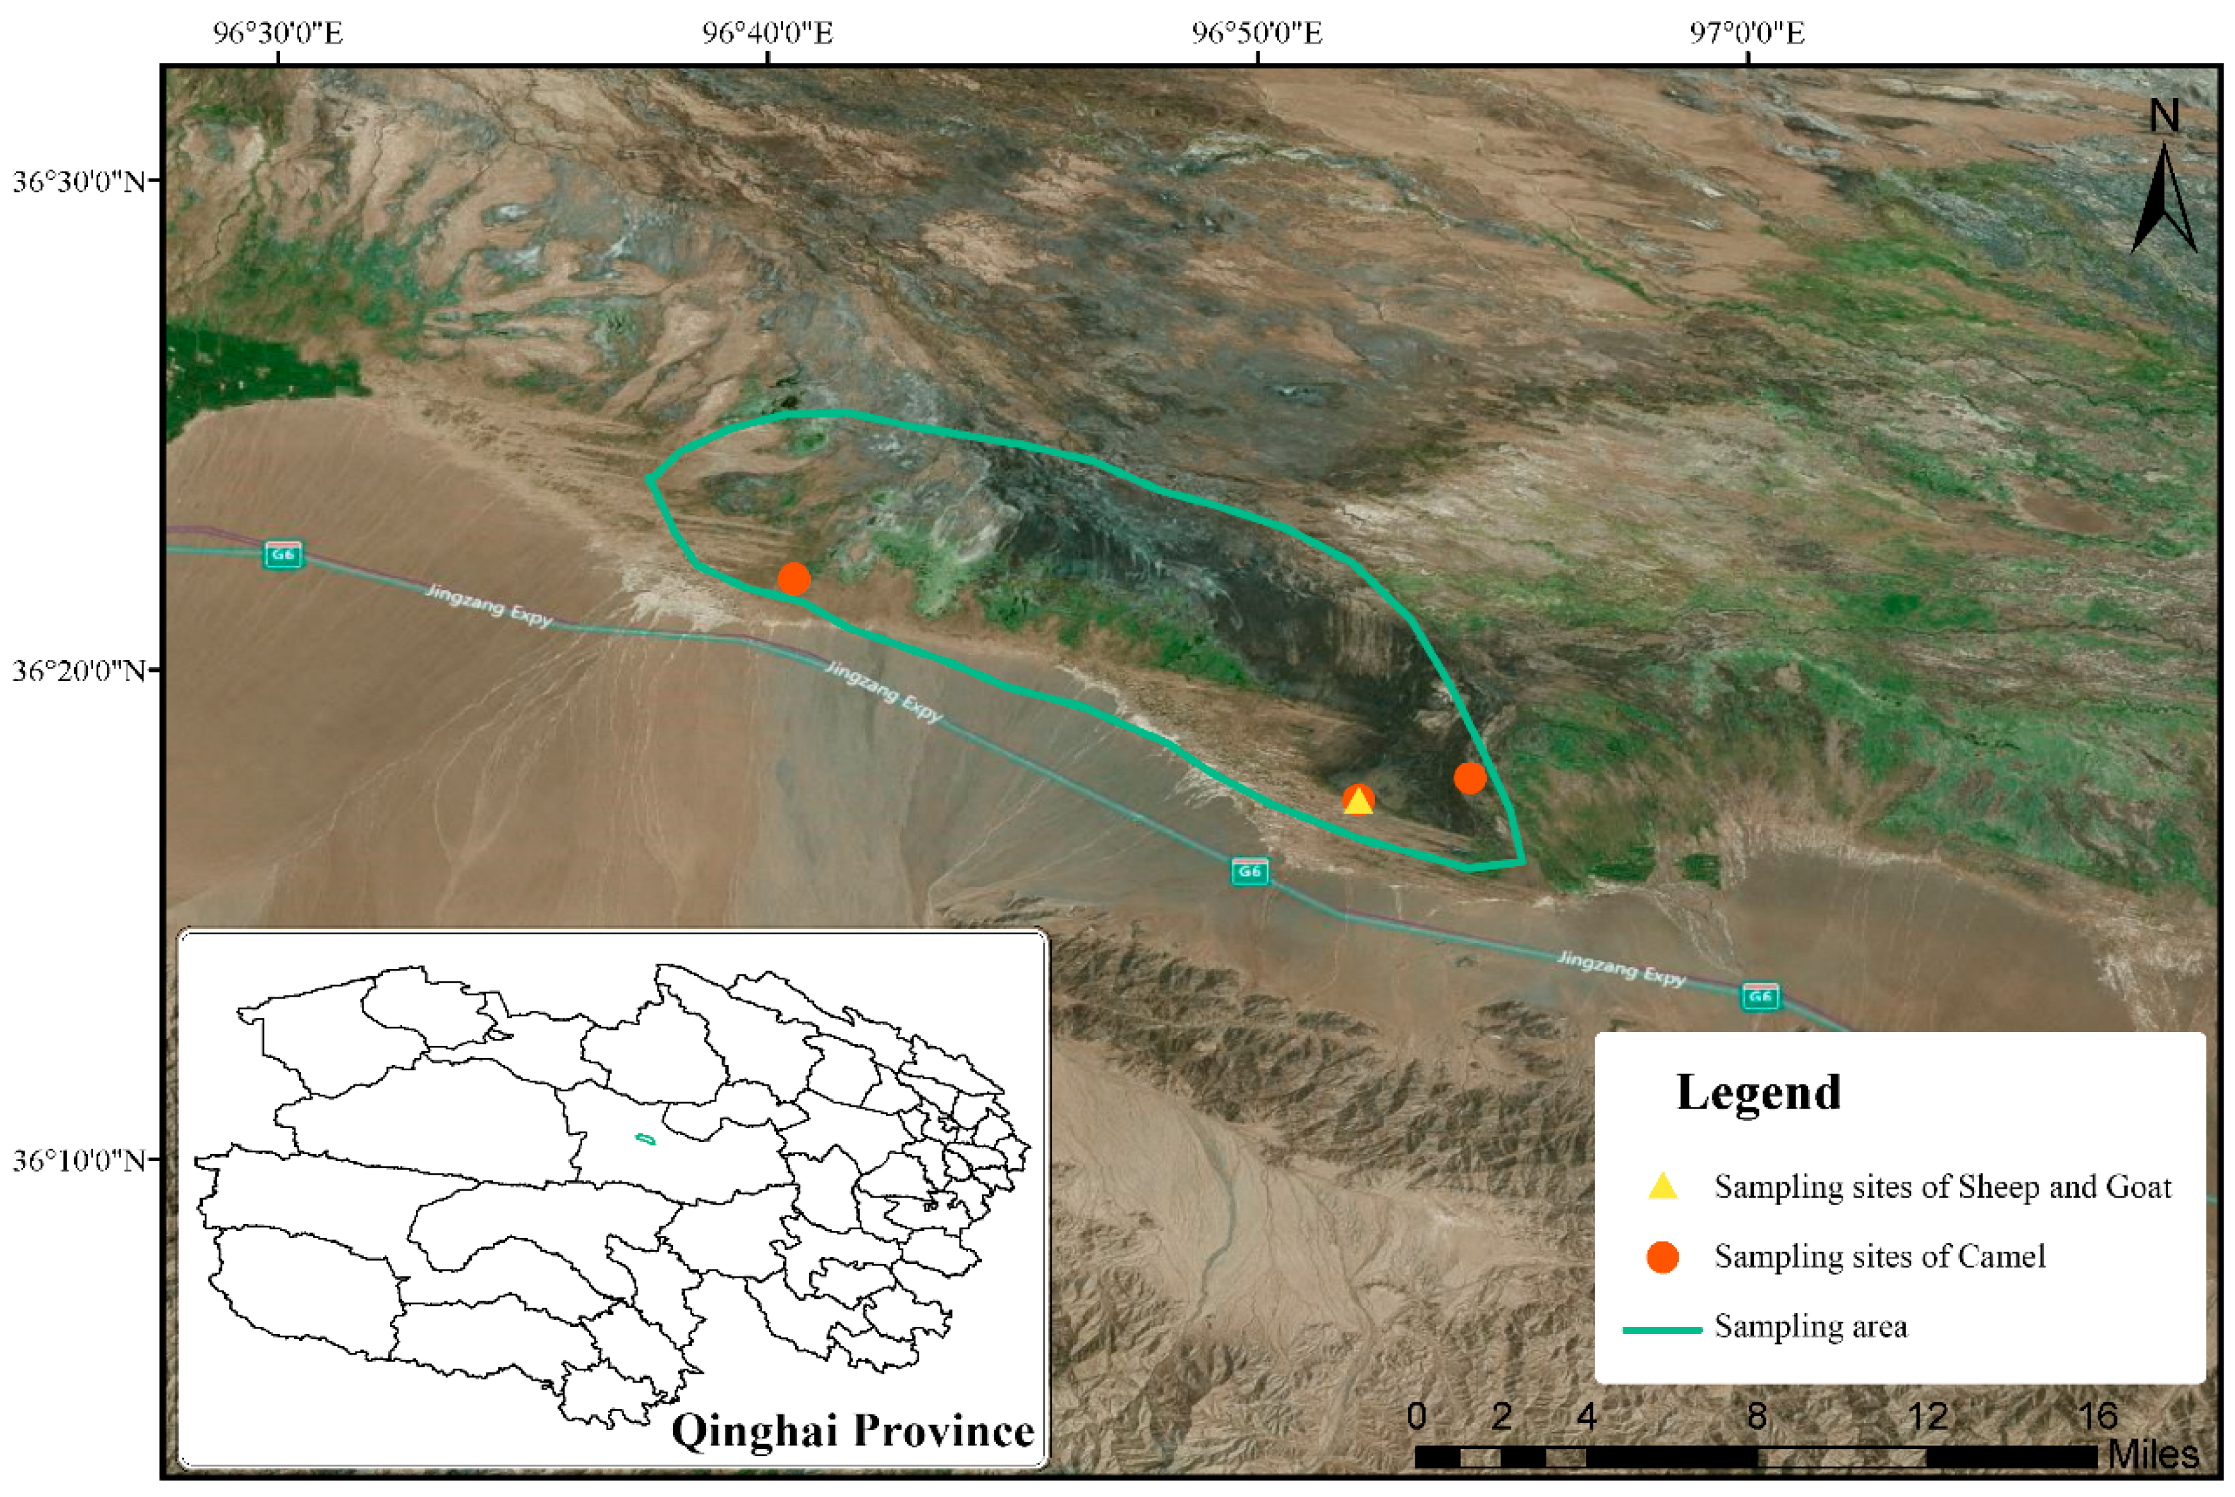
In Nuomuhong County (China), sheep (Ovis aries), goats (Capra hircus) and camels (Camelus bactrianus) are the main livestock animals sharing the grazing areas. Herdsmen in the region often adopt different grazing management strategies according to their animals’ sizes and habits. To facilitate management and prevent sheep and goats from being attacked by predators, herdsmen often raise sheep and goats together to form a mixed population, and there are no free-ranging sheep and goats. In the mixed group, sheep outnumber goats, which are raised as guides, so the mixed-group route will be guided by goats and goats will not be used for acquiring economic benefits directly. In addition, goats prefer to eat roots, which will cause serious damage to the pasture for the maintenance of grazing land resources, so the number of goats in a mixed group remained relatively low. The mixed group forage during the day under the supervision of herdsman and returned to the sheepfold before sunset. Because of reproductive isolation, sheep and goats do not produce hybrid offspring [25]. Camels are the only free-ranging livestock in our study area, they gather together and graze freely for two to three months, before returning to their pen. No supplementary food is typically provided for sheep, goats and camels.
The livestock in Nuomuhong County do not only keep the traditional grazing management strategies, but also adopt two different grazing management strategies (mixed and free-range groups), so the livestock and grazing managements are both typical in Nuomuhong County. Therefore, the mixed groups of sheep and goats and free-range camels are ideal populations for studying the effects of grazing management strategies on gut microbiota in a same area. Our research is representative for the management of livestock in Qaidam Basin. We aim to answer three main questions in this study. Firstly, are there significant differences in gut microbiota between sheep and goats in a mixed grazing population? Secondly, what are the similarities and differences between the compositions of gut microbiota between different grazing livestock populations under different grazing management strategies? Finally, is grazing management a dominant factor determining livestock gut microbiota variation?
As the first scientific study on the effects of mixed grazing and different grazing management strategies on livestock gut microbiota that we are aware of, we hope this work will lay a solid foundation for guiding the development of sustainable and effective grazing management strategies in the future.
2. Materials and Methods
2.1. Sampling Method
The area in solid line was our studying region (Figure 1). During the study period, the sheep and goats were taken out from the sheepfold every morning for foraging along the way and returned to the sheepfold before sunset. In our sampling area, sheep and goats were under the care of a professional shepherd. We followed the group and then collected the fresh fecal samples after the host defecated in the morning before grazing. The sampling site of sheep and goats was near their pen, and there was no distinct population of sheep and goats. Meanwhile, we followed the camel group and collected the fresh fecal samples after the host defecated to ensure that each sample was from a different individual. All the fecal samples from the camels were collected within a single day. Due to human interference, sheep and goats foraged in good quality pastures and camels foraged freely.
We collected 29 fresh fecal livestock samples from Nuomuhong County, in China’s Qinghai Province. Thirteen samples from sheep, three from goats and thirteen from camels were acquired in November and December, 2016. After collection, each fresh fecal sample was labelled, stored at −20 °C immediately, and then transferred to −80 °C for long-term storage. To avoid cross-contamination, every sample was collected using a polyethylene (PE) glove, which was then discarded. All animals were allowed to defecate naturally, without the use of any drugs such as laxatives, or intimidation.
2.2. DNA Extraction and Amplification
Total fecal DNA was extracted using the Cetyltrimethylammonium Bromide (CTAB) method. The purity and concentration of total extracted DNA was determined by agarose gel electrophoresis, after which we diluted the samples to 1 ng/μL with sterile water. We amplified the V3–V4 region of the 16S rDNA from fecal microbiota by Polymerase Chain Reaction (PCR), using primers 341F-806R (341F: 5′-CCTAYGGGRBGCASCAG-3′, 806R: 5′-GGACTACNNGGGTATCTAAT-3′). All the PCR reactions were carried out in 30 μL volumes containing 15 μL 2× Phusion Master Mix (New England Biolabs, USA), 3 μL Primer (2 μM), 10 μL Template DNA (1 ng/μL), and 2 μL Nuclease-free water for each sample. The PCR reaction cycles were done in a gradient thermal cycler (Bio-rad T100) under the following protocol: initial denaturation for 1 min at 98 °C, followed by 30 cycles of denaturation for 10 s at 98 °C, annealing for 30 s at 50 °C, elongation for 30 s at 72 °C, and a final extension at 72 °C for 5 min.
All PCR products were mixed 1:1 with 1× loading buffer and subjected to 2% agarose gel electrophoresis. We selected bright bands between 400–450 bp for further experiments. Selected bands were purified using a GeneJET Gel Extraction Kit (Thermo Scientific, Waltham, MA, USA). An Illumina TruSeq DNA PCR-Free Library Preparation Kit (Illumina, San Diego, CA, USA) was used to build sequencing libraries, according to the manufacturer’s recommendations. After being qualified, the library was sequenced on an Illumina HiSeq platform.
2.3. Data Analysis
Paired-end reads were merged by fast length adjustment of short reads (FLASH) software [26]. According to unique genetic barcodes, we were able to recognise the source samples of each paired-end read. Quantitative insights into microbial ecology (QIIME) software (Version 1.7.0) [27] was used to quality-control the reads, after which we used Uparse software [28] to count the richness of the operational taxonomic units (OTUs). Sequences with similarities of ≥ 97% were assigned the same OTU. The OTU with the highest abundance was chosen as a representative OTU for each sample. Meanwhile, singletons (appearing only once) were discarded in the Uparse software [28]. Taxonomic information was acquired by annotating the representative OTUs using the SSUrRNA database in SILVA [29] (http://www.arb-silva.de/) (threshold is 0.8~1) by the Mothur method [30]. Multiple protein sequence alignment (MUSCLE) software [31] was used for sequence alignment. The datasets analysed during the current study are available in the GenBank database repository at PRJNA560474 (https://dataview.ncbi.nlm.nih.gov/object/PRJNA560474).
R software (Version 2.15.3) was used to construct a rarefaction curve, a Rank abundance curve, and a species accumulation boxplot. At β-diversity, the unifrac distance and unweighted pair-group method with arithmetic mean (UPGMA) tree were calculated by QIIME (Version 1.7.0) [27]. Principal component analysis (PCA) (“ade4”, “ggplot2”) [32,33], principal coordinates analysis (PCoA) (“WGCNA”, “ggplot2”) [33,34], and nonmetric multidimensional scaling analysis (NMDS) were all done using R vegan package [35]. Analysis of similarities (ANOSIM) was also performed using the R vegan package (anosim function) [35]. Intergroup differences analysis including Metastats and Student’s t-test were also done in R [36]. Analysis of molecular variance (AMOVA) was done with the AMOVA function (Mothur) [30].
3. Results
3.1. Data Profile
Both the rarefaction curves and specaccum box plots reveal the relationship between sequence depth and sample size. The rarefaction curves (see as Supplementary Materials) tended to be smooth, and the specaccum box plots flattened out, indicating that with the increasing number of sequences and sample size, the observed species did not obviously increase, thus, the possibility of detecting new species was low (Figure S1).
We got a total of 2,352,127 reads, 1,859,294 of which qualified, the reads ranged from 44,618 to 86,191, about 64,114 reads per sample, and an average length of 411 bp. The Q20 and Q30 were all above 96%, and the average effective rate was about 76.56%. A total of 3160 OTUs were found, which were divided into 23 phyla, 146 families and 317 genera. A total of 1428 OTUs were shared by all three groups (sheep, goats and camels), 301 OTUs were specific to sheep, 32 OTUs were specific to goats and 546 OTUs were only found in camels. The OTUs belonging to sheep spanned 22 phyla, 109 families, and 229 genera; the ones form the goats were classified into 18 phyla, 85 families and 186 genera; and the camel OTUs had 21 phyla, 120 families and 254 genera.
3.2. Gut Microbiota Composition among Sheep, Goat and Camel
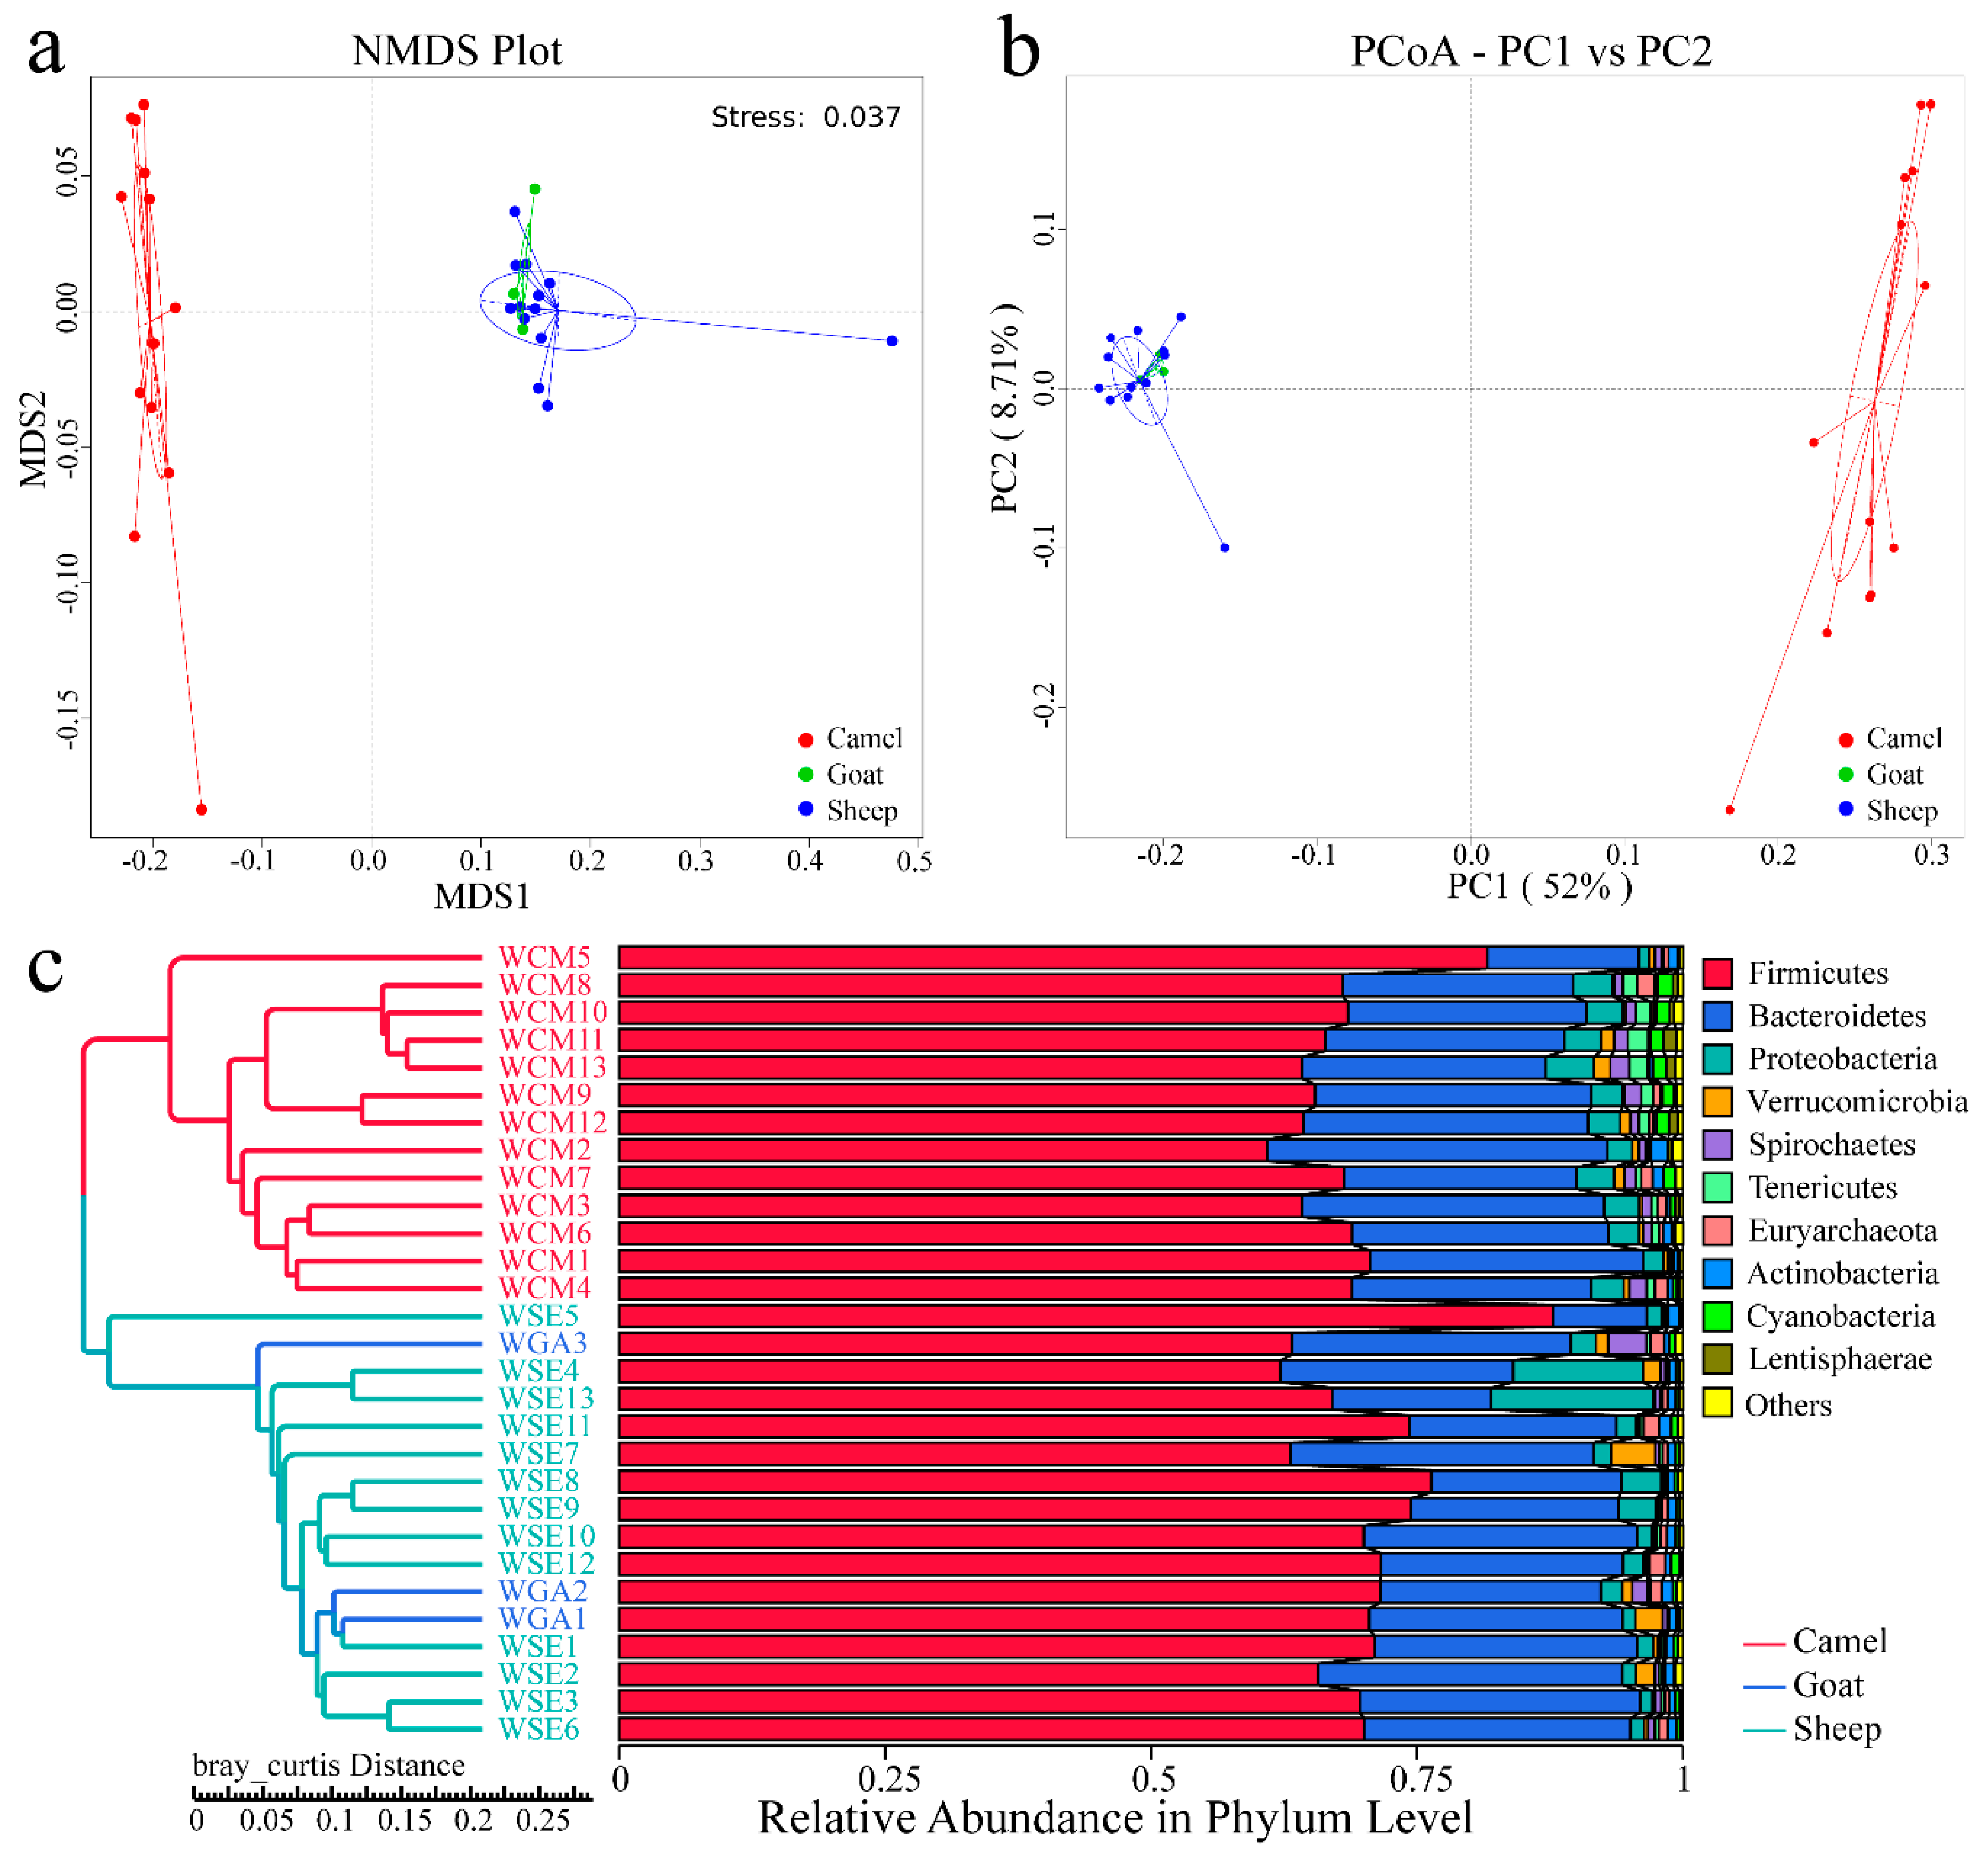
At the phylum level, we found three core phyla (relative abundance >1%, including the unclassified ones) in sheep, five core phyla in goats, four core phyla in camels and three core bacteria shared by all three groups. These latter are Firmicutes, Bacteroidetes and Proteobacteria. The sum relative abundance of Firmicutes and Bacteroidetes was above 92%. There were more sheep than goats in the mixed group, so we only compared sheep and camels, not goats and camels, in the following comparison. According to Metastats analysis, no core phyla showed any significant differences between sheep and goats (p > 0.05). Cyanobacteria, Spirochaetes, Tenericutes, Saccharibacteria, Lentisphaerae, Fibrobacteres and Fusobacteria all showed significant differences between sheep and camels (p < 0.05) (Table S1). The top 15 phyla in terms of relative abundance for these three species are shown in Figures S2a and S3a.
At the family level, Ruminococcaceae was the dominant family found in sheep, goats and camels, with relative abundances of 40.7108% ± 1.9589%, 41.1498% ± 1.7970% and 43.2516% ± 0.7252%, respectively. Four core families, Rikenellaceae, Lachnospiraceae, Christensenellaceae and Bacteroidaceae are all present in these three species. Ruminococcaceae and Lachnospiraceae are common gut microbiota in herbivores [37], associated with the metabolism of complex sugars and the degradation of complex plant material [11,37]. Fifteen core families were found in sheep, 14 core families in goats, 14 in camels and 10 core families were shared by all three groups (Table S2). According to our Metastats analysis, no significant differences were identified in the core families between the sheep and goats (p < 0.05), while four core families, Christensenellaceae, Bacteroidaceae, Peptococcaceae and Desulfovibrionaceae (not including the others) showed significant differences between sheep and camels (p < 0.05). The top 15 families in terms of relative abundance for these three species are shown in Figures S2b and S3b.
At the genus level, 20 core genera were found in sheep, 21 in goats, 16 in camels and eight core genera were shared by these three groups, including the others (Table S3). The seven identified core genera shared by these three groups were Ruminococcaceae_UCG-005, Christensenellaceae_R-7_group, Rikenellaceae_RC9_gut_group, Ruminococcaceae_UCG-010, Bacteroides, Eubacterium_coprostanoligenes_group, Ruminococcaceae_UCG-013. The dominant genus was Ruminococcaceae_UCG-005 in sheep and goats, which is a genus related to fibre digestion [38]. In camels, the dominant genus was Ruminococcaceae_UCG-010. The relative abundances of unclassified genera were 18.9416% ± 0.9927%, 17.9481% ± 0.3822% and 25.1416% ± 0.6255%, respectively, for these three species. No core genera showed significant differences between sheep and goats based on Metastats analysis, and only 10 core genera showed significant differences between sheep and camels (p < 0.05) namely, Ruminococcaceae_UCG-010, Ruminococcaceae_UCG-005, Eubacterium_coprostanoligenes_group, Christensenellaceae_R-7_group, Bacteroides, Alistipes (1.1554% ± 0.0720%, 2.7938% ± 0.1372%), Desulfovibrio (1.0712% ± 0.0916, 2.0174% ± 0.1398%), Romboutsia (3.2222% ± 0.9082%, 1.6316% ± 0.1541%) and Prevotellaceae_UCG-004 (3.0135% ± 0.3800%, 1.2248% ± 0.1060%). The top 15 genus in terms of relative abundance for these three species are shown in Figures S2c and S3c.
3.3. Intragroup and Intergroup Differences
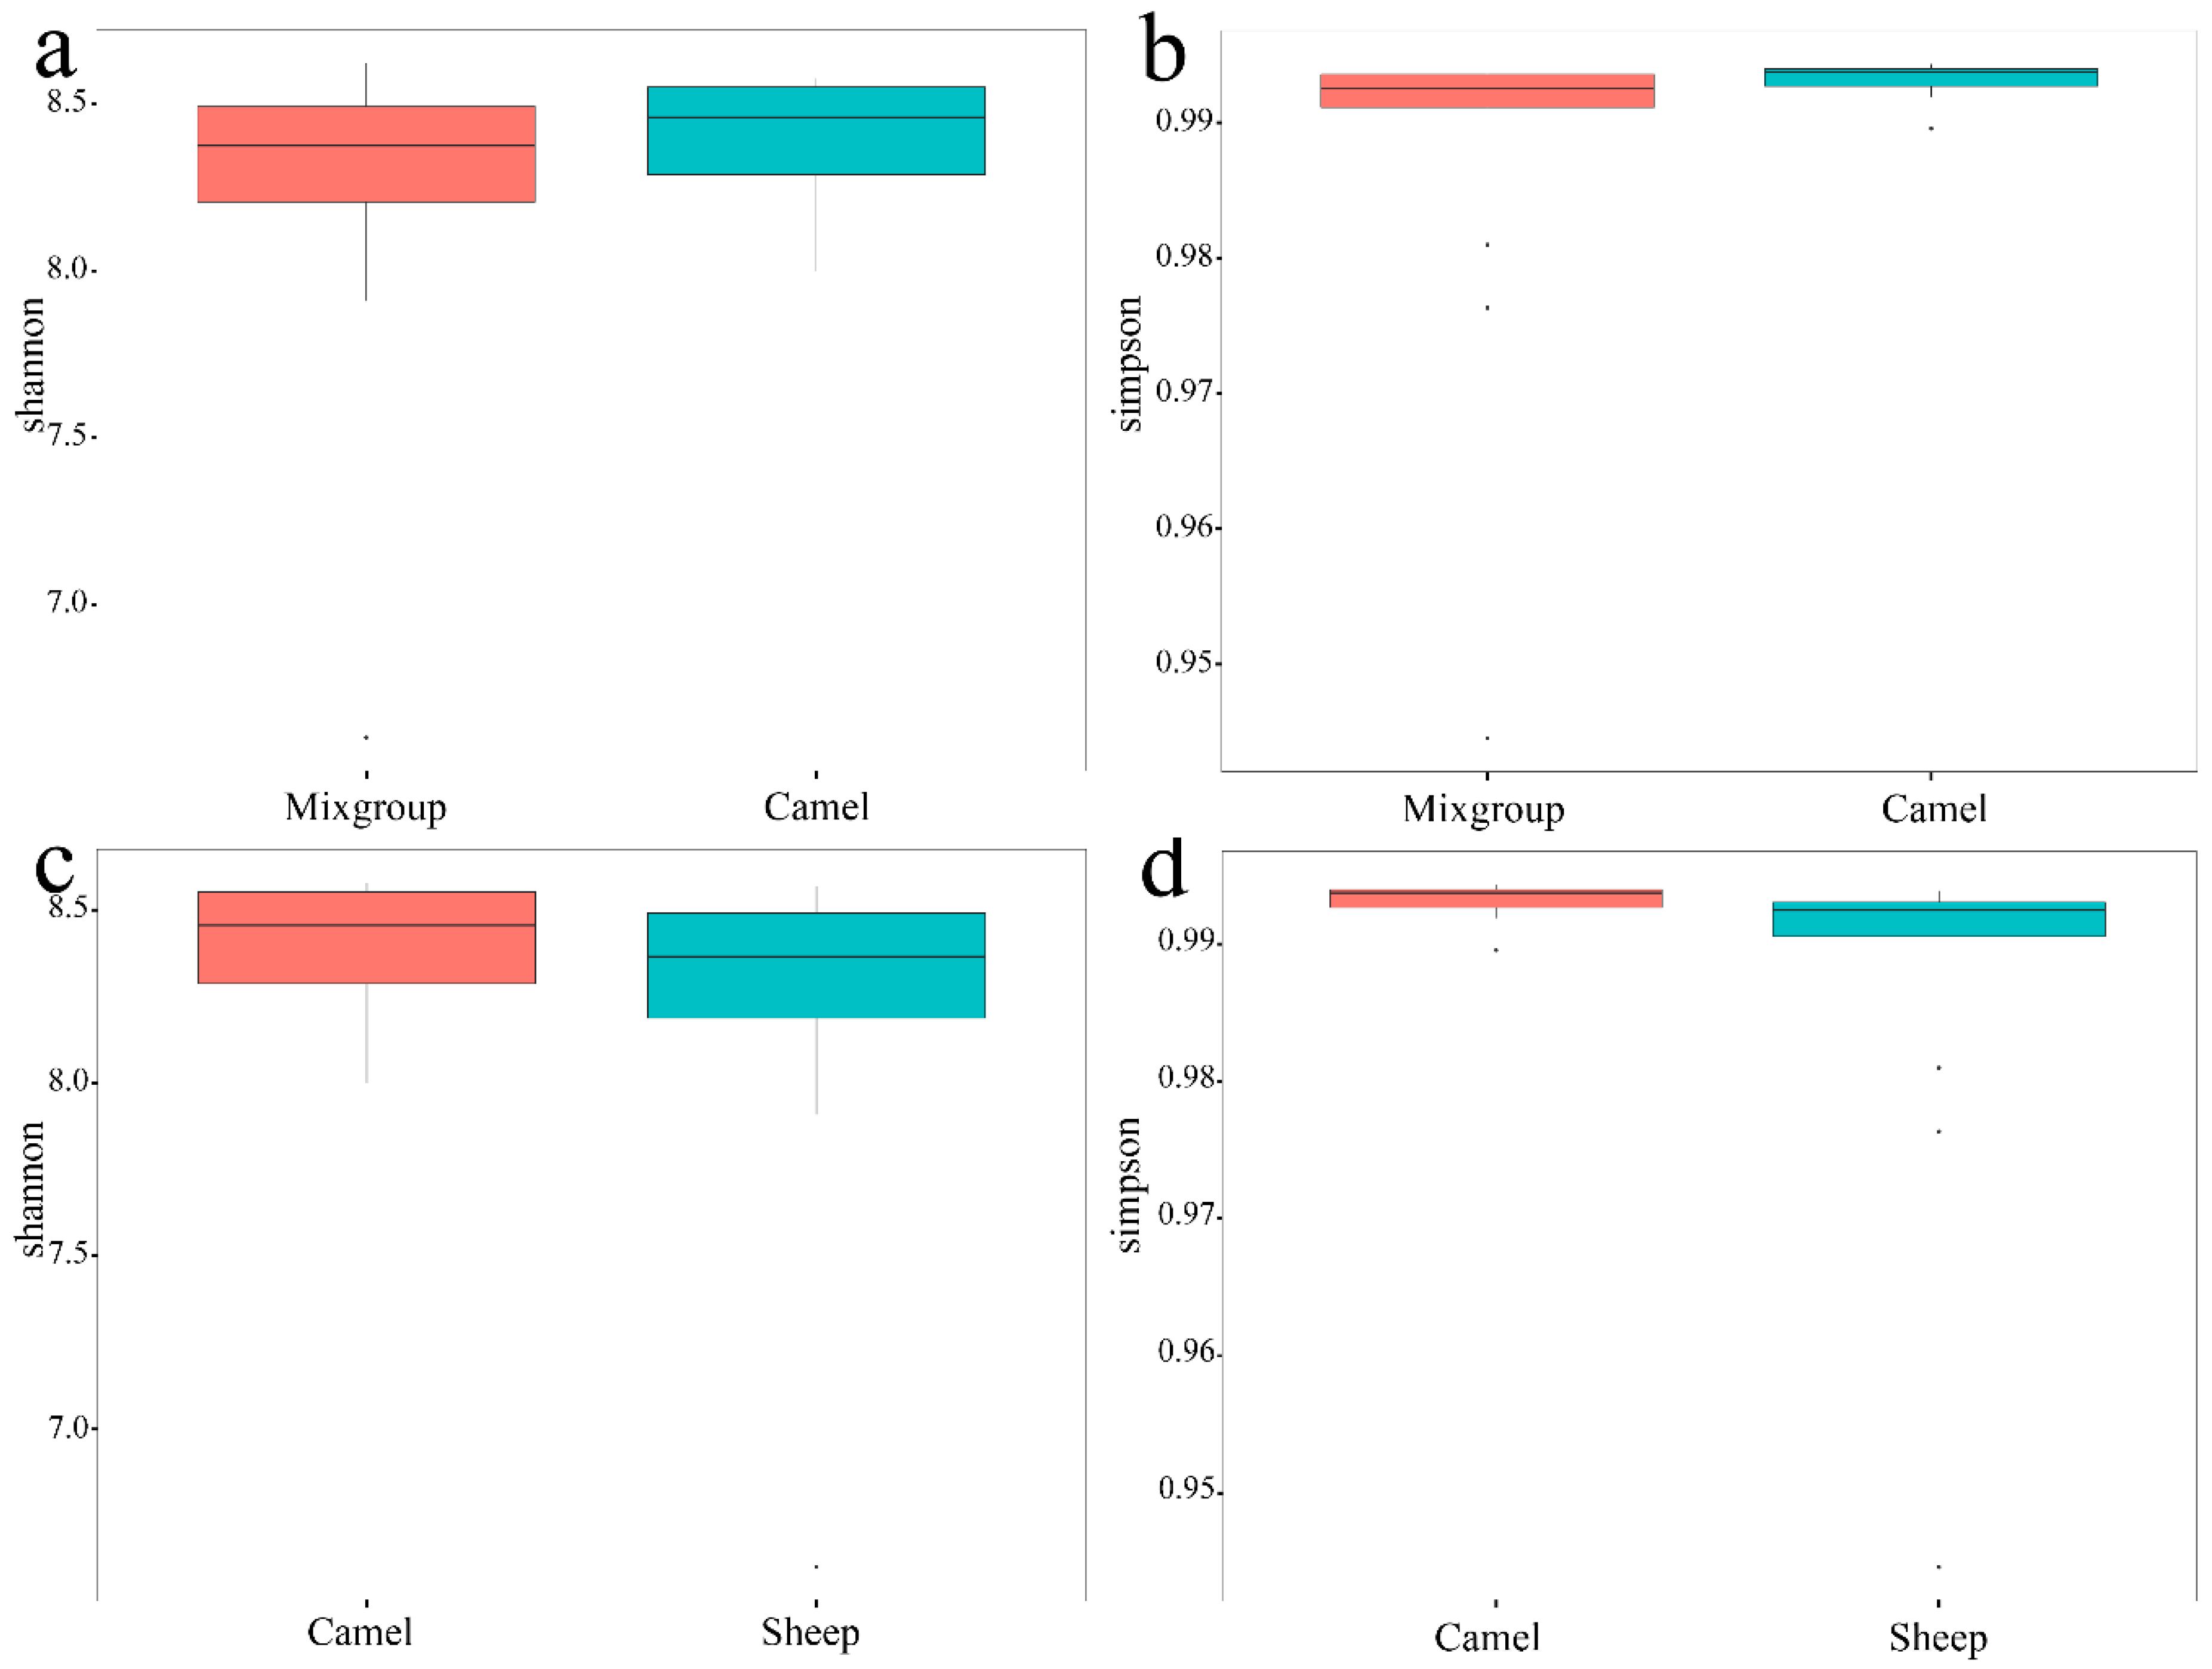
Since the sheep and goats were raised in a mixed group, we calculated the α-diversity of sheep and goats as a group. The mixed group of sheep and goats was less than camels in the Shannon index (mixed group = 8.375; camels = 8.460; p > 0.05) and the Simpson index (mixed group = 0.9925; camels = 0.9937; p < 0.05). Between sheep and camel, the α-diversity of the sheep was less than the camel in the Shannon index (sheep = 8.365; camels = 8.456; p > 0.05) and the Simpson index (sheep = 0.9925; camels = 0.9937; p < 0.05) (Figure 2). No significant difference was observed between sheep and goat based on the Shannon index (p > 0.05) and the Simpson index (p > 0.05). All analyses were based on Wilcoxon to avoid error caused by differences in sample size.
At the β-diversity level, from our NMDS (Figure 3a) and PCoA analyses (Figure 3b), we can see that sheep and goats grouped together, and showed clear separation from the camels. The UPGMA tree (Bray-curtis) also showed that camel samples clustered into one category, while sheep and goat samples clustered together (Figure 3c). Our AMOVA analysis showed significant differences between the three groups (p < 0.001), sheep and camels showed significant differences (p < 0.001), goats and camels also showed significant differences (p < 0.001), but no significant differences were found between sheep and goats (p = 0.271). ANOSIM analysis also indicated similar results, with the intragroup differences being greater than intergroup (R = −0.004748, p = 0.468) between sheep and goats, and different results between the other pairings. Between sheep and camels (R = −0.98, p = 0.001) and between goats and camels (R = 0.997, p = 0.003), the intergroup differences are both greater than the intragroup.
4. Discussion
4.1. Main Factors that Affect Gut Microbiota between Sheep and Goats in Mixed Group
Due to no free-grazing sheep and goats presents in Qaidam Basin, we did not compare the gut microbial diversity of sheep and goats under different grazing managements. However, our research is also representative and practical in the Qaidam Basin, because we compared the gut microbial diversity of the typical species, it is a foundation for the management of different species in the same area.
Host genomes, diets and environmental heterogeneities are usually the main factors affecting the composition of the gut microbiota [10,14,39,40]. According to Jiang et al. [41], sheep and goat are different species from different genera, and they do not cluster into one clade based on the phylogenetic tree [41]. This indicates that host genetics may not be as decisive a factor as previously thought. This result is consistent with the research of Martinson et al. [42], which also shows that genomes have no significant influence on the composition of the gut microbiota.
Environmental heterogeneities largely shape the diversity of the gut microbiota, limited environmental resources would limit the gut microbial diversity [37,40]. Sheep and goats raised in a mixed group in the Qaidam basin are subjected to almost identical environments under the control of herdsman, they live in a single population from birth to death, grazing on the same pastures, are in touch with same vegetation and soil, at the same time, sheep are intended to follow the goats while foraging, which also enhances the consistency of the gut microbial diversity between goats and sheep. Therefore, they showed no significant differences in their α-diversity and β-diversity.
Although the diets of sheep and goat are different, goats prefer shrubs and dwarf shrubs, while sheep prefer grasses based on Migongo-Bake et al. [43]. In our study, we found no significant difference in the composition of gut microbiota between sheep and goats raised in a mixed group. At present, no research related to the feeding habits of sheep and goats in a mixed group from Qaidam basin, so it is hard to tell what the role of diet is here. We speculate that, since sheep and goats graze on the same pasture, there is no environmental heterogeneity, so their diets will converge, but this still needs further study. In summary, we speculate that mixed grazing in the same environment leads to similar gut microbiota between sheep and goat.
4.2. Main Factors that Affect Diversity of Gut Microbiota between Mixed and Free-Range Groups
Sheep are the main livestock and outnumber goats in a mixed group, so we compared the gut microbial diversity between sheep and camels, and there are significant differences both at α-diversity and β-diversity levels. Generally, geographical distance, host genomes, diets and environmental heterogeneities are the main factors [10,14,39,40]. Among sheep and camels that live in the same area, gut microbiota compositions tend to be similar in sympatric species [18], so we speculate that geographical distance may have no influence on gut microbiota between sheep and camels. Meanwhile, although camel and sheep belong to Camelidae and Bovidae families, respectively, and they are distantly related [41], so, based on the result that there are no significant difference in gut microbiota diversity between sheep and goat, we speculate that host gene also may not be a dominant factor here.
Environmental heterogeneities are contributed to the gut microbial diversity [40]. The environmental heterogeneity has positive relationship with species diversity [44], which may benefit for the diversity of herbivores’ diets. The diets between sheep and camels are different, as camels prefer trees and shrubs, and sheep prefer grasses [43]. Due to human interference, sheep feed on grass pastures with better food quality and less plant species in winter, while camels are free to feed on plants in various habitats. According to Chu et al. [45], 11 plant species are edible for sheep, while 14 are edible for camels in the winter. We think the different grazing strategies will lead to a difference in environmental heterogeneities, free-range grazing will increase the environmental heterogeneities, which is a benefit for the diversification of food diversity; conversely, grazing under the control of the shepherds will lead to a reduction environmental heterogeneities. So, we think that the impacts of environmental heterogeneity on food diversity are complementary. Therefore, we believe that diet and environmental heterogeneities are responsible for the significant differences of gut microbial diversity between sheep and camels in the same area. Our research is also consistent with Grieneisen et al. [40], when considering four major factors (host behaviours, environments, genetics and geographical distance), at the same time, the results show that environmental variation is the dominant predictor of host-associated microbiomes. We speculate that although four factors may lead to significant differences in the gut microbial diversity of sheep and camels, environmental heterogeneity is the dominant factor [44], and the difference in environmental heterogeneity is mainly caused by the different grazing managements.
4.3. Effects of Gut Microbial Diversity on Host Health between Mixed and Free-Range Groups
The diversity of the gut microbiota is closely related to the host’s health, and decreases of the gut microbial diversity may lead to a loss of certain functions, which may subsequently lead to a lower resistance to infection [5,11]. The gut microbial diversity of the mixed group was found to be less than that of the free-ranging camel group at the α-diversity level, leading us to infer that mixed grazing may not be beneficial for the health of the sheep and goats. The bacteria Bacteroidaceae is related to the degradation of protein and polysaccharides [46], indicating that the diet quality of the sheep was better than that of the camels. The relative abundances of Spirochaetes, Peptococcaceae and Lachnospiraceae were significantly higher in the camel group. Spirochaetes are associated with acetate production [47], while Peptococcaceae and Lachnospiraceae are related to butyrate synthesis [48,49], all of which can provide energy to the host. Meanwhile, Lachnospiraceae can maintain gut homeostasis and prevent pathogenesis [48]. We speculate that camels can obtain energy via their gut microbiota, the higher gut microbial diversity is benefit to camels.
By comparing the gut microbiota between sheep and goats, we speculate that grazing management generates the gut microbiota of livestock and mix grazing would limit the gut microbial diversity, which is not beneficial for the health of the host. Due to camels being able to move freely, the environmental heterogeneity they are exposed to is higher than that of sheep and goats, which can be conducive to the improvement of gut microbial diversity, and can also be beneficial to the health of the host. So, we believe that free grazing management can benefit to the health of livestock indirectly, of which environmental heterogeneity is the dominant factor.
4.4. Suggestions on Improving Gut Microbial Diversity in Grazing Livestock
To improve the diversity of the gut microbiota in these livestock, and considering that sheep are vulnerable to wild predators, we suggest a few key changes, such as changing grazing grounds (not just changing pastures between winter and summer), making sure the livestock forage in a variety of habitats, feeding some different types of silage and intermingling sheep and goat individuals from different populations every year, for breeding, to maintain genetic diversity. The gut microbial diversity is closely associated with host health; thus, supervising variations in the gut microbiota by non-invasive methods has a great development prospect. We hope that some simple measures can be taken to promote the improvement of grazing management and maintain the balance of grass storage in the Qaidam Basin, while continuing to ensure the quantity and quality of livestock products.
5. Conclusions
There is a huge market for lamb throughout the Qinghai-Tibetan plateau, as it is one of the staple meats for the people in the region. Although mixed grazing under the control of herdsman may be a simple management strategy, it may not always be beneficial to the healthy growth of livestock. In the long run, mixed grazing may therefore not be a sustainable management strategy for animal husbandry. On the contrary, free grazing is conducive to the improvement of the gut microbial diversity and health of the camels. Although sheep and goats in the Qaidam Basin require the care of the herdsman, they are not suitable for free grazing, so we recommend that sheep and goats can be given some similar grazing strategies, such as improving their environmental heterogeneity and diet diversity to improve their gut microbial diversity and promote health. Our study analysed the gut microbial diversity of livestock between two different grazing management strategies in the Qaidam Basin, and laid the foundation for livestock health and management. However, our study only analysed the composition of the gut microbiota via 16S rRNA gene sequencing. As such, the dietary and gene structure of different populations requires further identification in the future.
Supplementary Materials
The following are available online at https://www.mdpi.com/2071-1050/12/10/4160/s1, Figure S1: Rarefaction curves and species accumulation boxplots, Figure S2: Top 15 bacteria in the gut microbiota of all samples, Figure S3: Top 15 bacteria in the gut microbiota of 3 species (sheep, goat, camel), Table S1: seven bacteria showed significant differences between sheep and camels at phylum level (p < 0.05), Table S2: the mean relative abundance of 10 core families shared by three groups of sheep, goat and camel at family level, Table S3: the mean relative abundance of 8 core genera shared by three groups of sheep, goat and camel at genus level.
Author Contributions
Conceptualization, T.Z. and Z.C.; methodology, P.S. and W.Q.; software, P.S.; formal analysis, P.S and W.Q.; investigation, W.Q., Y.H., Z.C. and L.W.; resources, W.Q., Y.H. and L.W.; data curation, P.S. and W.Q.; writing-original draft preparation, P.S. and W.Q.; writing-review and editing, P.S., Z.C. and T.Z.; visualization, P.S.; supervision, T.Z. and Z.C.; project administration, T.Z.; funding acquisition, T.Z. All authors have read and agreed to the published version of the manuscript.
Funding
This research was funded by the Strategic Priority Research Program of the Chinese Academy of Sciences, [XDA23060602; XDA2002030302]; National Key R&D Program of China [2017YFC0506405] and Qinghai Key R&D and Transformation Program [2019-SF-150].
Acknowledgments
Special thanks to the anonymous reviewers for their careful work and thoughtful suggestions that have helped improve this paper substantially.
Conflicts of Interest
The authors declare no conflict of interest. The funders had no role in the design of the study; in the collection, analyses, or interpretation of data; in the writing of the manuscript, or in the decision to publish the results.
References
- McDonald, C.K.; MacLeod, N.D.; Lisson, S.; Corfield, J.P. The Integrated Analysis Tool (IAT)—A model for the evaluation of crop-livestock and socio-economic interventions in smallholder farming systems. Agric. Syst. 2019, 176, 102659. [Google Scholar] [CrossRef]
- Dande, S.S.; Bhatt, V.D.; Patil, N.V.; Joshi, C.G. The camel faecal metagenome under different systems of management: Phylogenetic and gene-centric approach. Livest. Sci. 2015, 178, 108–118. [Google Scholar] [CrossRef]
- Menke, S.; Meier, M.; Mfune, J.K.; Melzheimer, J.; Wachter, B.; Sommer, S. Effects of host traits and land-use changes on the gut microbiota of the Namibian black-backed jackal (Canis mesomelas). FEMS Microbiol. Ecol. 2017, 93, fix123. [Google Scholar] [CrossRef] [PubMed]
- Zhang, H.; Sparks, J.B.; Karyala, S.V.; Settlage, R.; Luo, X.M. Host adaptive immunity alters gut microbiota. ISME J. 2015, 9, 770–781. [Google Scholar] [CrossRef]
- Li, C.; Wang, W.; Liu, T.; Zhang, Q.; Wang, G.; Li, F.; Li, F.; Yue, X.; Li, T. Effect of early weaning on the intestinal microbiota and expression of genes related to barrier function in lambs. Front. Microbiol. 2018, 9, 1431. [Google Scholar] [CrossRef] [Green Version]
- Ley, R.E.; Hamady, M.; Lozupone, C.; Turnbaugh, P.J.; Ramey, R.R.; Bircher, J.S.; Schlegel, M.L.; Tucker, T.A.; Schrenzel, M.D.; Knight, R.; et al. Evolution of Mammals and Their Gut Microbes. Science 2008, 320, 1647–1651. [Google Scholar] [CrossRef] [Green Version]
- Ley, R.E.; Lozupone, C.A.; Hamady, M.; Knight, R.; Gordon, J.I. Worlds within worlds: Evolution of the vertebrate gut microbiota. Nat. Rev. Microbiol. 2008, 6, 776–788. [Google Scholar] [CrossRef] [Green Version]
- Amato, K.R.; Yeoman, C.J.; Kent, A.; Righini, N.; Carbonero, F.; Estrada, A.; Gaskins, H.R.; Stumpf, R.M.; Yildirim, S.; Torralba, M. Habitat degradation impacts black howler monkey (Alouatta pigra) gastrointestinal microbiomes. ISME J. 2013, 7, 1344–1353. [Google Scholar] [CrossRef]
- Amato, K.R.; Leigh, S.R.; Kent, A.; Mackie, R.I.; Yeoman, C.J.; Stumpf, R.M.; Wilson, B.A.; Nelson, K.E.; White, B.A.; Garber, P.A. The gut microbiota appears to compensate for seasonal diet variation in the wild black howler monkey (Alouatta pigra). Microb. Ecol. 2015, 69, 434–443. [Google Scholar] [CrossRef] [PubMed]
- Turpin, W.; Espin-Garcia, O.; Xu, W.; Silverberg, M.S.; Kevans, D.; Smith, M.I.; Guttman, D.S.; Griffiths, A.; Panaccione, R.; Otley, A. Association of host genome with intestinal microbial composition in a large healthy cohort. Nat. Genet. 2016, 48, 1413. [Google Scholar] [CrossRef] [PubMed]
- Borbón-García, A.; Reyes, A.; Vives-Flórez, M.; Caballero, S. Captivity shapes the gut microbiota of Andean bears: Insights into health surveillance. Front. Microbiol. 2017, 8, 1316. [Google Scholar] [CrossRef] [PubMed] [Green Version]
- Hisada, T.; Endoh, K.; Kuriki, K. Inter-and intra-individual variations in seasonal and daily stabilities of the human gut microbiota in Japanese. Arch. Microbiol. 2015, 197, 919–934. [Google Scholar] [CrossRef] [PubMed] [Green Version]
- Khachatryan, Z.A.; Ktsoyan, Z.A.; Manukyan, G.P.; Kelly, D.; Ghazaryan, K.A.; Aminov, R.I. Predominant role of host genetics in controlling the composition of gut microbiota. PLoS ONE 2008, 3, e3064. [Google Scholar] [CrossRef] [PubMed] [Green Version]
- Crespo-Piazuelo, D.; Migura-Garcia, L.; Estellé, J.; Criado-Mesas, L.; Revilla, M.; Castelló, A.; Muñoz, M.; García-Casco, J.M.; Fernández, A.I.; Ballester, M. Association between the pig genome and its gut microbiota composition. Sci. Rep. 2019, 9, 8791. [Google Scholar] [CrossRef]
- Ding, J.; Dai, R.; Yang, L.; He, C.; Xu, K.; Liu, S.; Zhao, W.; Xiao, L.; Luo, L.; Zhang, Y. Inheritance and establishment of gut microbiota in chickens. Front. Microbiol. 2017, 8, 1967. [Google Scholar] [CrossRef]
- Yang, J.; Quan, J.; Cai, G.; Yang, M.; Zeng, Z.; Ding, R.; Xingwang, W.; Zhou, S.P.; Li, S.; Yang, H. Exploring the fecal microbial composition and metagenomic functional capacities associated with feed efficiency in commercial DLY pigs. Front. Microbiol. 2019, 10, 52. [Google Scholar]
- Xu, B.; Xu, W.; Li, J.; Dai, L.; Xiong, C.; Tang, X.; Yang, Y.; Mu, Y.; Zhou, J.; Ding, J. Metagenomic analysis of the Rhinopithecus bieti fecal microbiome reveals a broad diversity of bacterial and glycoside hydrolase profiles related to lignocellulose degradation. BMC Genom. 2015, 16, 174. [Google Scholar] [CrossRef] [Green Version]
- Moeller, A.H.; Suzuki, T.A.; Lin, D.; Lacey, E.A.; Wasser, S.K.; Nachman, M.W. Dispersal limitation promotes the diversification of the mammalian gut microbiota. Proc. Natl. Acad. Sci. USA 2017, 114, 13768–13773. [Google Scholar] [CrossRef] [Green Version]
- Wang, J.P.; Yoo, J.S.; Kim, H.J.; Lee, J.H.; Kim, I.H. Nutrient digestibility, blood profiles and fecal microbiota are influenced by chitooligosaccharide supplementation of growing pigs. Livest. Sci. 2009, 125, 298–303. [Google Scholar] [CrossRef]
- Singh, P.; Karimi, A.; Devendra, K.; Waldroup, P.W.; Cho, K.K.; Kwon, Y.M. Influence of penicillin on microbial diversity of the cecal microbiota in broiler chickens. Poult. Sci. 2013, 92, 272–276. [Google Scholar] [CrossRef]
- Kongsted, A.G.; Nørgaard, J.V.; Jensen, S.K.; Lauridsen, C.; Juul-Madsen, H.R.; Norup, L.R.; Engberg, R.M.; Horsted, K.; Hermansen, J.E. Influence of genotype and feeding strategy on pig performance, plasma concentrations of micro nutrients, immune responses and faecal microbiota composition of growing-finishing pigs in a forage-based system. Livest. Sci. 2015, 178, 263–271. [Google Scholar] [CrossRef]
- Xue, D.; Chen, H.; Chen, F.; He, Y.; Zhao, C.; Zhu, D.; Zeng, L.; Li, W. Analysis of the rumen bacteria and methanogenic archaea of yak (Bos grunniens) steers grazing on the Qinghai-Tibetan Plateau. Livest. Sci. 2016, 188, 61–71. [Google Scholar]
- Zhang, L.; Wu, W.; Lee, Y.-K.; Xie, J.; Zhang, H. Spatial heterogeneity and co-occurrence of mucosal and luminal microbiome across swine intestinal tract. Front. Microbiol. 2018, 9, 48. [Google Scholar] [CrossRef] [PubMed] [Green Version]
- Li, G.; Li, J.; Kohl, K.D.; Yin, B.; Wei, W.; Wan, X.; Zhu, B.; Zhang, Z. Dietary shifts influenced by livestock grazing shape the gut microbiota composition and co-occurrence networks in a local rodent species. J. Anim. Ecol. 2019, 88, 302–314. [Google Scholar] [CrossRef] [PubMed]
- Gray, A.P. Mammalian Hybrids. A Check-List with Bibliography; Commonwealth Agricultural Bureaux: Farnham Royal, Slough SL2 3BN, UK, 1972; ISBN 851981704. [Google Scholar]
- Magoč, T.; Salzberg, S.L. FLASH: Fast length adjustment of short reads to improve genome assemblies. Bioinformatics 2011, 27, 2957–2963. [Google Scholar] [CrossRef]
- Caporaso, J.G.; Kuczynski, J.; Stombaugh, J.; Bittinger, K.; Bushman, F.D.; Costello, E.K.; Fierer, N.; Pena, A.G.; Goodrich, J.K.; Gordon, J.I. QIIME allows analysis of high-throughput community sequencing data. Nat. Methods 2010, 7, 335. [Google Scholar] [CrossRef] [Green Version]
- Edgar, R.C. UPARSE: Highly accurate OTU sequences from microbial amplicon reads. Nat. Methods 2013, 10, 996. [Google Scholar] [CrossRef]
- Quast, C.; Pruesse, E.; Yilmaz, P.; Gerken, J.; Schweer, T.; Yarza, P.; Peplies, J.; Glöckner, F.O. The SILVA ribosomal RNA gene database project: Improved data processing and web-based tools. Nucleic Acids Res. 2013, 41, D590–D596. [Google Scholar] [CrossRef]
- Schloss, P.D.; Westcott, S.L.; Ryabin, T.; Hall, J.R.; Hartmann, M.; Hollister, E.B.; Lesniewski, R.A.; Oakley, B.B.; Parks, D.H.; Robinson, C.J. Introducing mothur: Open-source, platform-independent, community-supported software for describing and comparing microbial communities. Appl. Environ. Microbiol. 2009, 75, 7537–7541. [Google Scholar] [CrossRef] [Green Version]
- Edgar, R.C. MUSCLE: Multiple sequence alignment with high accuracy and high throughput. Nucleic Acids Res. 2004, 32, 1792–1797. [Google Scholar] [CrossRef] [Green Version]
- Dray, S.; Dufour, A.-B. The ade4 Package: Implementing the Duality Diagram for Ecologists. J. Stat. Softw. 2007, 22, 1–20. [Google Scholar] [CrossRef] [Green Version]
- Wickham, H. Ggplot2: Elegant Graphics for Data Analysis; Springer: New York, NY, USA, 2016; ISBN 978-0-387-98141-3. [Google Scholar]
- Langfelder, P.; Horvath, S. WGCNA: An R package for weighted correlation network analysis. BMC Bioinform. 2008, 9, 559. [Google Scholar] [CrossRef] [PubMed] [Green Version]
- Oksanen, J.; Blanchet, F.G.; Friendly, M.; Kindt, R.; Legendre, P.; McGlinn, D.; Minchin, P.R.; O’Hara, R.B.; Simpson, G.L.; Solymos, P.; et al. Vegan: Community Ecology Package. 2019. Available online: https://CRAN.R-project.org/package=vegan (accessed on 1 March 2020).
- White, J.R.; Nagarajan, N.; Pop, M. Statistical methods for detecting differentially abundant features in clinical metagenomic samples. PLoS Comput. Biol. 2009, 5, e1000352. [Google Scholar] [CrossRef] [PubMed]
- Schmidt, E.; Mykytczuk, N.; Schulte-Hostedde, A.I. Effects of the captive and wild environment on diversity of the gut microbiome of deer mice (Peromyscus maniculatus). ISME J. 2019, 13, 1293–1305. [Google Scholar] [CrossRef] [PubMed]
- Guan, Y.; Yang, H.; Han, S.; Feng, L.; Wang, T.; Ge, J. Comparison of the gut microbiota composition between wild and captive sika deer (Cervus nippon hortulorum) from feces by high-throughput sequencing. AMB Express 2017, 7, 1–13. [Google Scholar] [CrossRef] [Green Version]
- Hicks, A.L.; Lee, K.J.; Couto-Rodriguez, M.; Patel, J.; Sinha, R.; Guo, C.; Olson, S.H.; Seimon, A.; Seimon, T.A.; Ondzie, A.U. Gut microbiomes of wild great apes fluctuate seasonally in response to diet. Nat. Commun. 2018, 9, 1–18. [Google Scholar] [CrossRef] [Green Version]
- Grieneisen, L.E.; Charpentier, M.J.E.; Alberts, S.C.; Blekhman, R.; Bradburd, G.; Tung, J.; Archie, E.A. Genes, geology and germs: Gut microbiota across a primate hybrid zone are explained by site soil properties, not host species. Proc. R. Soc. B Biol. Sci. 2019, 286, 20190431. [Google Scholar] [CrossRef] [Green Version]
- Jiang, Z.G. Discrimination of Saiga Antelope Horn from Substitutes in “Lingyangjiao” Markets by Genetic Identification Technology. Mod. Chin. Med. 2013, 15, 548–551. [Google Scholar]
- Martinson, V.G.; Douglas, A.E.; Jaenike, J. Community structure of the gut microbiota in sympatric species of wild Drosophila. Ecol. Lett. 2017, 20, 629–639. [Google Scholar] [CrossRef]
- Migongo-Bake, W.; Hansen, R.M. Seasonal diets of camels, cattle, sheep, and goats in a common range in eastern Africa. J. Range Manag. 1987, 40, 76–79. [Google Scholar] [CrossRef]
- Tamme, R.; Hiiesalu, I.; Laanisto, L.; Szava-Kovats, R.; Pärtel, M. Environmental heterogeneity, species diversity and co-existence at different spatial scales. J. Veg. Sci. 2010, 21, 796–801. [Google Scholar] [CrossRef]
- Chu, H.J.; Jiang, Z.G.; Lan, W.X.; Wang, C.; Tao, Y.S.; Jiang, F. Dietary overlap among kulan Equus hemionus, goitered gazelle Gazella subgutturosa and livestock. Acta Zool. Sin. 2008, 54, 941–954. [Google Scholar]
- Li, Y.; Hu, X.; Yang, S.; Zhou, J.; Zhang, T.; Qi, L.; Sun, X.; Fan, M.; Xu, S.; Cha, M. Comparative analysis of the gut microbiota composition between captive and wild forest musk deer. Front. Microbiol. 2017, 8, 1705. [Google Scholar] [CrossRef] [Green Version]
- Lee, S.-H.; Park, J.-H.; Kang, H.-J.; Lee, Y.H.; Lee, T.J.; Park, H.-D. Distribution and abundance of Spirochaetes in full-scale anaerobic digesters. Bioresour. Technol. 2013, 145, 25–32. [Google Scholar] [CrossRef] [PubMed]
- McLellan, S.L.; Newton, R.J.; Vandewalle, J.L.; Shanks, O.C.; Huse, S.M.; Eren, A.M.; Sogin, M.L. Sewage reflects the distribution of human faecal L achnospiraceae. Environ. Microbiol. 2013, 15, 2213–2227. [Google Scholar] [CrossRef] [PubMed] [Green Version]
- Nam, J.-H.; Yun, Y.; Kim, H.-S.; Kim, H.-N.; Jung, H.J.; Chang, Y.; Ryu, S.; Shin, H.; Kim, H.-L.; Kim, W.-S. Rosacea and its association with enteral microbiota in Korean females. Exp. Dermatol. 2018, 27, 37–42. [Google Scholar] [CrossRef] [PubMed] [Green Version]
Figure 1.
Sampling sites in Nuomuhong County (China). The solid line in green is our study area.

Figure 2.
Comparison at α-diversity of mix-group (sheep and goat), camel and sheep based on the Shannon and Simpson indexes. (a,b) between mix-group (sheep and goat) and camels; (c,d) between camels and sheep.
Figure 2.
Comparison at α-diversity of mix-group (sheep and goat), camel and sheep based on the Shannon and Simpson indexes. (a,b) between mix-group (sheep and goat) and camels; (c,d) between camels and sheep.

Figure 3.
(a) Cluster analysis by Nonmetric Multi-Dimensional Scaling (NMDS); (b) Cluster analysis by Principal Component Analysis (PCA); (c) Bray-Curtis unweighted pair-group method with arithmetic mean (UPGMA) tree, different samples are represented by different colors. “WCM” means the camel samples, “WSE” means the Sheep samples, and “WGA” means the goat samples.

© 2020 by the authors. Licensee MDPI, Basel, Switzerland. This article is an open access article distributed under the terms and conditions of the Creative Commons Attribution (CC BY) license (http://creativecommons.org/licenses/by/4.0/).
Share and Cite
MDPI and ACS Style
Song, P.; Qin, W.; Huang, Y.; Wang, L.; Cai, Z.; Zhang, T. Grazing Management Influences Gut Microbial Diversity of Livestock in the Same Area. Sustainability 2020, 12, 4160. https://doi.org/10.3390/su12104160
AMA Style
Song P, Qin W, Huang Y, Wang L, Cai Z, Zhang T. Grazing Management Influences Gut Microbial Diversity of Livestock in the Same Area. Sustainability. 2020; 12(10):4160. https://doi.org/10.3390/su12104160
Chicago/Turabian StyleSong, Pengfei, Wen Qin, YanGan Huang, Lei Wang, Zhenyuan Cai, and Tongzuo Zhang. 2020. "Grazing Management Influences Gut Microbial Diversity of Livestock in the Same Area" Sustainability 12, no. 10: 4160. https://doi.org/10.3390/su12104160
Note that from the first issue of 2016, this journal uses article numbers instead of page numbers. See further details here.