Enterprise Sustainability: Economic Policy Uncertainty, Enterprise Investment, and Profitability


1
School of Economics, Lanzhou University, Lanzhou 730000, China
2
School of Management, Lanzhou University, Lanzhou 730000, China
3
Northwest Institute of Eco-Environment and Resources, Chinese Academy of Sciences, Lanzhou 730000, China
4
Key Laboratory of Remote Sensing of Gansu Province, Heihe Remote Sensing Experimental Research Station, Northwest Institute of Eco-Environment and Resources, Chinese Academy of Sciences, Lanzhou 730000, China
*
Author to whom correspondence should be addressed.
Sustainability 2020, 12(9), 3735; https://doi.org/10.3390/su12093735
Submission received: 8 April 2020
/
Revised: 25 April 2020
/
Accepted: 26 April 2020
/
Published: 5 May 2020
Abstract
:Under economic fluctuations, the sustainable development of enterprises is crucial. Currently, there are few studies on the interaction between economic policy uncertainty (EPU) and the sustainable development behavior of enterprises. Based on a panel vector autoregressive (PVAR) model, this paper explores the static and dynamic interactions among EPU, enterprise investment, and enterprise profitability and then analyzes regional heterogeneity in these factors. It finds that EPU has an inhibitory effect on the investment and profitability of enterprises, while the investment and profitability of enterprises also have an inhibitory effect on EPU. In addition, there are contribution differences and regional differences in the degrees of influence of the three factors. In the long run, EPU and the inhibition of enterprise investment and profitability are strongest in China’s central region. The results show that the stronger the certainty of economic policy, the more conducive this policy is to promoting enterprise investment behavior and improving enterprise profitability. Therefore, to ensure normal economic development, the government should limit changes in economic policy as much as possible; doing so is critical for promoting investment behavior and improving the profitability of enterprises.
1. Introduction
Coronavirus disease 2019 (COVID-19) has led to major uncertainty in the global economy, leading the International Monetary Fund (IMF) to lower the economic growth forecasts of all countries. The IMF forecasts that China’s actual economic growth rate will be 5.6% in 2020, which is 0.4 percentage points lower than the previous forecast of 6%. At the same time, the global growth rate is projected decrease by 0.1 percentage points to 3.2%. In the latest economic outlook report released by the Organisation for Economic Co-operation and Development (OECD) on 2 March, the forecast for world economic growth in 2020 was reduced significantly, from 2.9% to 2.4%. The report indicated that COVID-19 is causing the most serious challenge to the global economic belt since the 2008 financial crisis. Affected by the current situation, most enterprises are passively under pressure. The adjustment of national macroeconomic policy and the self-help of enterprises will greatly affect enterprise development.
In response to the current complex and changing global economic situation and the macroenvironment in which growth momentum is gradually slowing, governments in various countries are playing an active role in macrocontrol. Their involvement is critical for reversing the current economic development situation and steadily promoting domestic economic development. Especially since the financial crisis in 2008, the macrocontrol of government has played a significant role in economic stabilization. Relevant economic policies formulated by governments have helped boost global economic recovery. However, while reducing the downward pressure on the economy, governments have also increased the uncertainty of economic policies. In this regard, reports on the work of the Chinese government have repeatedly emphasized the need to maintain and improve the stability and sustainability of macroeconomic policies and to achieve smooth and balanced economic development through the coordination of these policies.
Economic policy uncertainty occurs when an economic body cannot predict exactly whether, when, and how the government will change its current economic policy [1]. Economic uncertainty has a significant impact on the behavior of a country’s economy and other market bodies. Since the financial crisis, compared with uncertainty in the real economy, economic policy has accounted for a relatively high proportion of economic uncertainty [2]. As the world’s second-largest economy, China’s economic policies play a decisive role in development. However, China’s future policy uncertainty will be more prominent in light of the occurrence of natural disasters and epidemic diseases, international multipolarization trends, and China’s domestic sustainable development strategies and reform tasks. Therefore, researchers are paying increasing attention to exploring the economic impact of economic policy uncertainty.
Enterprise behavior under economic policy uncertainty, especially investment decision making, has long been a focus of this field. This is because uncertainty in economic policies can produce many investment opportunities while simultaneously producing high risks, and company decisions to invest require a trade-off between waiting value and opportunity costs [3]. Following real option theory, which is used to study investment decision-making under an uncertain environment, researchers have found that uncertainty in economic policy increases the waiting value of investment opportunities, thereby inhibiting the current investment of enterprises [4,5,6]. In such studies, economic policy uncertainty is treated as an exogenous variable because it is a macroindicator. However, as an important part of the market, investment behavior directly changes economic growth and then influences the formulation of, and changes in, government policies. In other words, economic policy uncertainty not only may affect but also may be affected by the investment of enterprises.
In addition, according to the theory of resource dependence, enterprises need to absorb resources from and interact with the environment to achieve their goals in the process of development. Therefore, the uncertainty of business operations and the environment affect each other mutually, and as a major aspect of environmental uncertainty, economic policy uncertainty inevitably affects enterprise profitability. Profitability is also an important factor that enterprises consider when deciding whether to invest. Although it is difficult to consider uncertainty risk in an uncertain environment, profitability is rarely used as the main measurement index; however, it is a major factor in enterprises’ investment decisions. This means that enterprise investment is affected not only by economic policy uncertainty but also by profitability. Therefore, there may be a complex dynamic relationship among enterprise investment, enterprise profitability, and economic policy uncertainty. In previous studies, most researchers have simply analyzed the relationship among these three variables, but few studies have taken profitability into account in examining the relationship between economic policy uncertainty and investment. There is no doubt that economic policy uncertainty can affect the investment of enterprises, but what is the interaction among economic policy uncertainty, enterprise profitability, and enterprise investment? Do the investment activities and profitability of enterprises cause fluctuations in economic policy uncertainty? These questions are the focus of further exploration in this article.
According to geographical locations and economic development levels, China is divided into three regions: the eastern region, the central region, and the western region. Since the reform and opening up, China has deployed a strategy of unbalanced and coordinated development of regional economies. The country has experienced the rise of the Pearl River Delta, the rapid development of the Yangtze River Delta driven by the development of Pudong, the development of the west, the revitalization of the northeast, and the rise of the central region and the Bohai rim. These developments show that China’s regional economy has entered a phase of “multi-wheel drive” coordinated and interactive development. Due to the influences of the natural environment, geographical location, macroeconomic policy, regional economic policy, marketization degree, and participation in globalization, there are differences in economic development among different regions in China. The economies of provinces and regions on the eastern coast have developed rapidly due to their advantageous geographical location and policy inclination, but the development of regions in the central and western regions is relatively backward. Based on this, we further explore the relationship between EPU, profitability, and investment in the differences between the three regions.
Existing theories and empirical literature emphasize the relationship between economic policy uncertainty and enterprise investment based on real option theory. Real option theory involves the application of financial option ideas to the investment field. It is a way of thinking where enterprises make comprehensive assessments and actively adapt investment decisions and management processes to the conditions of uncertainty to reduce losses and maximize benefits [7]. In the process of development, enterprises adjust their investment strategies at any time according to their own changes and developments. The external environment determines the decision-making options of whether to increase investment, abandon investment, or maintain the status quo in the future. The cost of enterprise investment cannot be recovered under uncertain conditions. Thus, when evaluating enterprises’ investment decision making, we should consider not only the time value of the return of investment cash flow but also the time value of investment and the return from the reduction in uncertain information. In this way, we can evaluate the overall return on investment more comprehensively [8]. Real option theory is proposed to study the uncertainty faced by enterprises in their investment decision-making and management.
The theory of resource dependence focuses on the relationship between business operations and economic policies. This theory emphasizes that an enterprise needs to absorb resources from the surrounding environment for survival and that the enterprise depends on and interacts with the surrounding environment. Enterprises can not only adapt to the environment but also change their environment to adapt to their own actors. Since enterprises cannot reduce the uncertainty and interdependence of the larger social system, which includes the government, they try to reduce the impact of environmental uncertainty through other methods, such as changing the external economic environment by shaping government regulations and actively seeking to create a more favorable environment [9].
Regarding the relationship between economic policy uncertainty and enterprise investment, a large number of studies consider economic policy uncertainty as an exogenous variable to explore its impact on the investment decisions of enterprises. Some researchers think that economic policy uncertainty promotes the investment of enterprises. According to the Oi–Hartman–Abel effect of investment, enterprises have the ability to adjust their investment scale rapidly according to changes in the market, so enterprise management also shows the characteristics of risk pursuit. Enterprises focus on potential investment opportunities and profits to increase their current investment [10,11,12]. The growth option theory of investment analyzes the cost–benefit of investment behavior from the perspective of “good news” and “bad news” and emphasizes the principle of “good news”. This theory holds that the investment expenditures of enterprises increase with an increase in economic policy uncertainty; that is, the theory posits a positive growth option effect [13,14]. In the context of China’s system, between the “expected opportunity effect” and “risk-taking agency” problems caused by economic policy uncertainty, the “expected opportunity effect” is dominant; it improves the risk-taking of enterprises and makes them more likely to increase their investment [15]. Another study found that economic policy uncertainty increases the research and development (R&D) investment of enterprises [16,17]. The same conclusion was reached by Peng, Xu, and other authors [18,19].
Most research conclusions are that economic policy uncertainty restrains enterprise investment. The theory of the waiting option in investment emphasizes the influence of the “bad news” implied in uncertainty on enterprise investment, and it points out that enterprises choose a waiting time to obtain the maximum value of the waiting option when uncertainty rises [20]. The effect of uncertainty on the risk premium is that an increase in uncertainty increases investors’ expectations of the risk premium, which increases the financing costs of enterprises and then restrains their investment [21,22,23]. From the perspective of preventive saving motivation, a rise in uncertainty reduces the consumption of economic entities and accelerates the outflow of savings funds. This joint effect leads to a lack of effective demand in the market and a decline in the enterprise investment rate [24,25]. In selecting indicators of economic policy uncertainty, some scholars use changes in government [26] or local officials [4] to measure economic policy uncertainty and explore its inhibitory effect on enterprise investment; other scholars use the economic policy uncertainty index constructed by Baker et al. [2] to study how an improvement in economic policy uncertainty reduces enterprise investment [1,5,27,28,29].
Based on analyses of the impact of economic policy uncertainty on enterprise investment, researchers also discuss the regional differences in this impact. Due to the different types of investment, studies reach different conclusions. Research has found that enterprises’ financial investment [18] and technological innovation investment [30] and strategic emerging enterprises’ investment [31] are less affected by economic policy uncertainty in the eastern region, which has a better market environment and a higher degree of marketization. Examining the effect of economic policy uncertainty on the exit decisions of enterprises, Zhang et al. found that economic policy uncertainty has a smaller impact on regions with higher economic development levels [32]. Wang measured the proportion of capital expenditure to total assets and found that the real investment of enterprises in highly market-oriented areas was more restrained by policy uncertainty. Huang analyzed the impact of economic policy uncertainty on the macroeconomy and its regional differences from a macro perspective and found that investment in the eastern region, which has a high degree of marketization, was greatly affected by policy uncertainty in the short term; however, in the western region, which has a low degree of marketization, investment was more affected in the long term [33].
The investment and profitability of enterprises mutually affect each other. In the existing literature, there are relatively few studies that directly investigate the relationship between enterprise investment and profitability, and most studies have examined the impact of profitability and investment rates at the national level from a macro perspective. On the one hand, existing research has confirmed the law that capital pursues profit; that is, profitability has a significant impact on enterprise investment. Sun compared the profitability of China, the United States, and Japan and found that China’s investment rate is much higher than that of the other countries because of its high profitability [34]. When exploring the factors affecting enterprise investment, Zhang also found that profitability has a significant impact on enterprise investment [35]. On the other hand, profitability also fluctuates as companies increase or decrease their investment. Research by Huang shows that the profitability of China will increase in the short term due to the increase in investment, while in the long term, increased investment will reduce profitability [36]. Bai found that the investment rate has a significant negative effect on profitability. The conclusions of previous studies imply that there is an interaction between enterprise investment and profitability [37].
The relationship between economic policy uncertainty and enterprise profitability needs to be explored. There is no direct evidence to support this relationship in the existing literature. Studies have mostly discussed the impact of macroeconomic uncertainty, such as government subsidies and exchange rate changes, on profitability. Some studies have used US multinational companies as a sample to find that macroeconomic uncertainty and volatility negatively affect enterprise profitability. Demir also found that macroeconomic uncertainty and macroeconomic volatility have a significant negative impact on enterprise profitability [38]. Liu’s research found that enterprises seize investment opportunities generated by uncertain economic policies to undertake higher risks, and high risks bring high returns; thus, the profitability of enterprises inevitably changes. Other studies focus on the impact of government financial subsidies on the profitability of enterprises. Studies show that the government is willing to subsidize profitable enterprises because these subsidies can not only improve the allocation efficiency of government financial resources but also increase local financial revenue. For enterprises, obtaining government financial support not only improves disposable cash flow but also transmits a good signal of obtaining government support to the market, thereby further improving enterprise profitability [39].
In summary, the relationship between economic policy uncertainty and enterprise profitability has not been clarified in existing studies. However, because economic policy uncertainty is one of the causes of macroeconomic fluctuations, it can be inferred that economic policy uncertainty and corporate profitability are related and that this relationship requires further discussion. More importantly, as an important factor affecting enterprise investment, profitability should be considered in conjunction with economic policy uncertainty in studying the influences on enterprise investment.
A review of the existing research reveals that there are many studies on the combination of economic policy uncertainty, enterprise investment, and enterprise profitability, but few researchers have examined the interactive relationship among these three variables, and traditional models are insufficient in analyzing the dynamic transmission mechanism and paths among these variables. Therefore, first, this paper attempts to use the existing literature to explain the relationship among economic policy uncertainty, enterprise investment, and enterprise profitability. Then, the Chinese economic policy uncertainty index constructed by Baker et al. [2] is used to analyze this relationship. Due to the heterogeneity of the economic development level and degree of marketization between different regions in China, based on the above research, this paper also explores the regional differences in the relationship among economic policy uncertainty, enterprise investment, and enterprise profitability in the eastern, central, and western regions and tries to clarify the relationship between economic policy uncertainty and enterprise investment behavior in different regions.
The research contribution of this paper mainly lies in the following. First, theoretically, it focuses on the static and dynamic interaction among economic policy uncertainty, enterprise investment, and enterprise profitability, and the findings enrich the research results in the field of economic policy uncertainty. Most existing studies regard economic policy uncertainty as an exogenous variable without considering how enterprise investment impacts it, and only a few studies consider the direct relationship between enterprise profitability and economic policy uncertainty. Based on provincial panel data on China’s listed companies from 2003 to 2018, this paper uses a panel vector autoregressive (PVAR) model that not only confirms the interaction among the three variables but also more sensitively captures the time-varying characteristics of the variables and is effective in the analysis of economic phenomena. In practice, the conclusion of this paper has guiding significance for governments to play an effective role in guiding enterprise investment and improving enterprise profitability. That is, governments’ determination and issuance of policies should have a more long-term orientation, and frequent changes should be avoided. This approach would not only improve the investment and profitability of enterprises but also reduce the need for changing economic policies and achieve the stability of these policies. In addition, the results of regional heterogeneity analysis reveal contribution differences and regional differences in economic policy uncertainty and the impact of corporate investment and profitability. Therefore, the findings suggest that government policies should be adjusted in an orderly way in consideration of regional characteristics. Finally, the PVAR model is used to test the dynamic impact of economic policy uncertainty, enterprise investment, and enterprise profitability. This model effectively overcomes the endogeneity problem, and the sample is divided to further test the regional differences in the degree of interaction among the three examined factors.
2. Materials and Methods
We used the Holtz–Eakin [40] method, which extends a vector autoregressive (VAR) model applied to time series data to panel data and propose a PVAR model. In our empirical research, regression analysis is conducted according to the empirical research ideas provided by Love and Zicchino [41] and Abrigo and Love [42]. The PVAR model combines the advantages of panel data and traditional VAR models. It not only takes into account the unobservable heterogeneity among individuals, allowing all variables to be considered endogenous, but also overcomes the shortcomings of traditional VAR models that cannot perform panel data analysis. Moreover, this model can effectively reflect the dynamic interaction between variables through the impulse response function (IRF).
Therefore, based on theoretical analysis and existing research, the following PVAR models are established in this paper:
where subscript i = (1, 2, ..., n) represents n sample enterprises; t represents 63 quarters from the first quarter of 2003 to the third quarter of 2018, p refers to the lagging order; EPUit indicates the economic policy uncertainty of enterprise i in year t; INVit indicates the investment level of enterprise i in year t; ROAit indicates the profit of enterprise i in year t; β0 is the intercept; βj is the regression matrix coefficient; fi and di represent the fixed and time effects, respectively; and εit is a random disturbance term, which represents a standard white noise process.
The variables included in the above models are defined as follows and shown in Table 1:
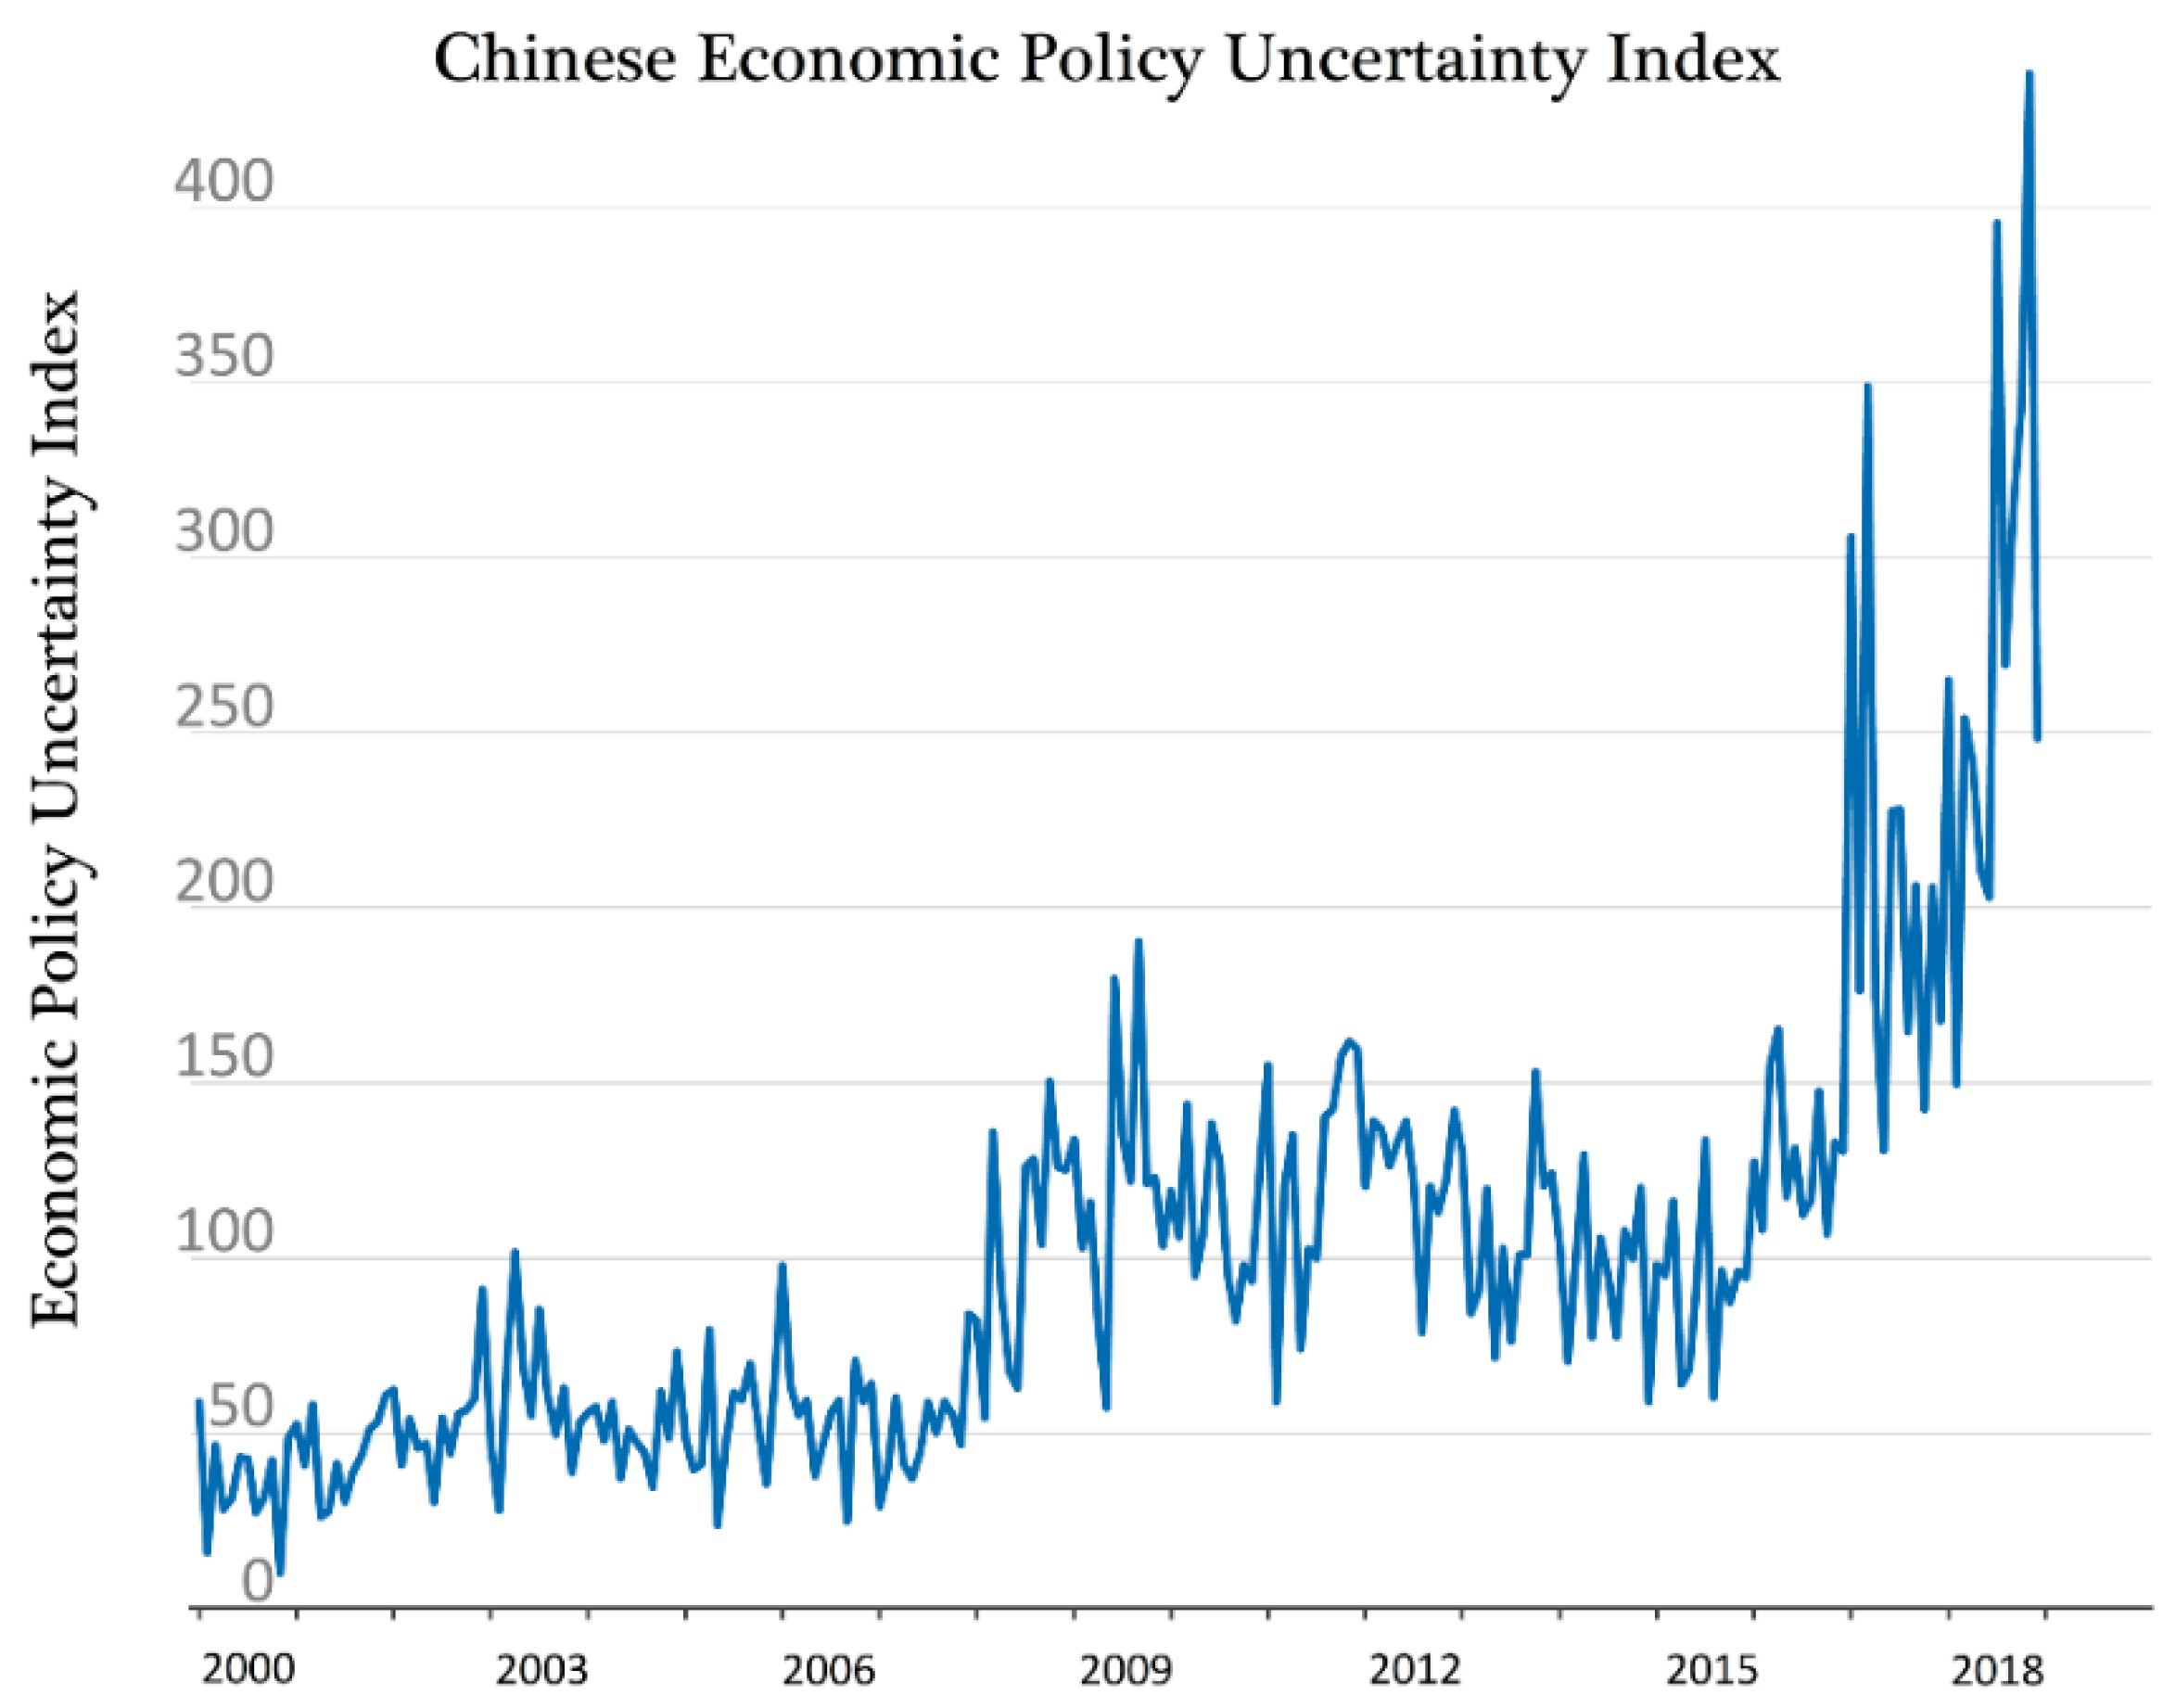
Economic policy uncertainty (EPU). For the measurement of economic policy uncertainty, the existing literature mainly uses indirect methods, such as the uncertainty of specific fiscal or monetary policy, the fluctuation of relevant indicators at the enterprise level or changes in government officials. We use the economic policy uncertainty index constructed by Baker et al. [2] to directly measure this factor. Chinese economic policy uncertainty index in 2000–2018 is shown in Figure 1. Calculated from data from the South China Morning Post, the index reports the uncertainty of China’s economic policy as a percentage of the total number of articles in the current month. This method of measuring economic policy uncertainty based on a news index has been widely used by researchers due to its high degree of fit with the trend of uncertain events over time. For consistency with the quarterly data structure of enterprises, the original monthly data of the EPU index are aggregated to obtain a quarterly EPU index. To match the meaning of the other two indicators, first-order difference processing is carried out to obtain the EPU index used in this paper.
Enterprise investment behavior (INV). Drawing on the work of Li Pei and Xiao [43], who used capital expenditure adjusted by total assets to measure the investment level of enterprises, INVit refers to the new investment expenditure of company i in year t; that is, the difference between the cash paid for an acquisition and construction of fixed assets, intangible assets and other long-term assets in year t and the net cash recovered from the disposal of fixed assets, intangible assets, and other long-term assets divided by the total assets.
Enterprise profitability (return on assets (ROA)). Profitability reflects the ability of an enterprise to obtain profits and is an evaluation of its operation. ROA refers to the earnings before interest and taxes (EBIT) corresponding to a unit asset and measures the ability of an enterprise to make use of all capital, including liabilities and all equity, to obtain income; that is, the ability of an enterprise to create value for both creditors and shareholders. The higher this ratio is, the more efficiently an enterprise uses all its capital and creates more value for all its creditors and shareholders.
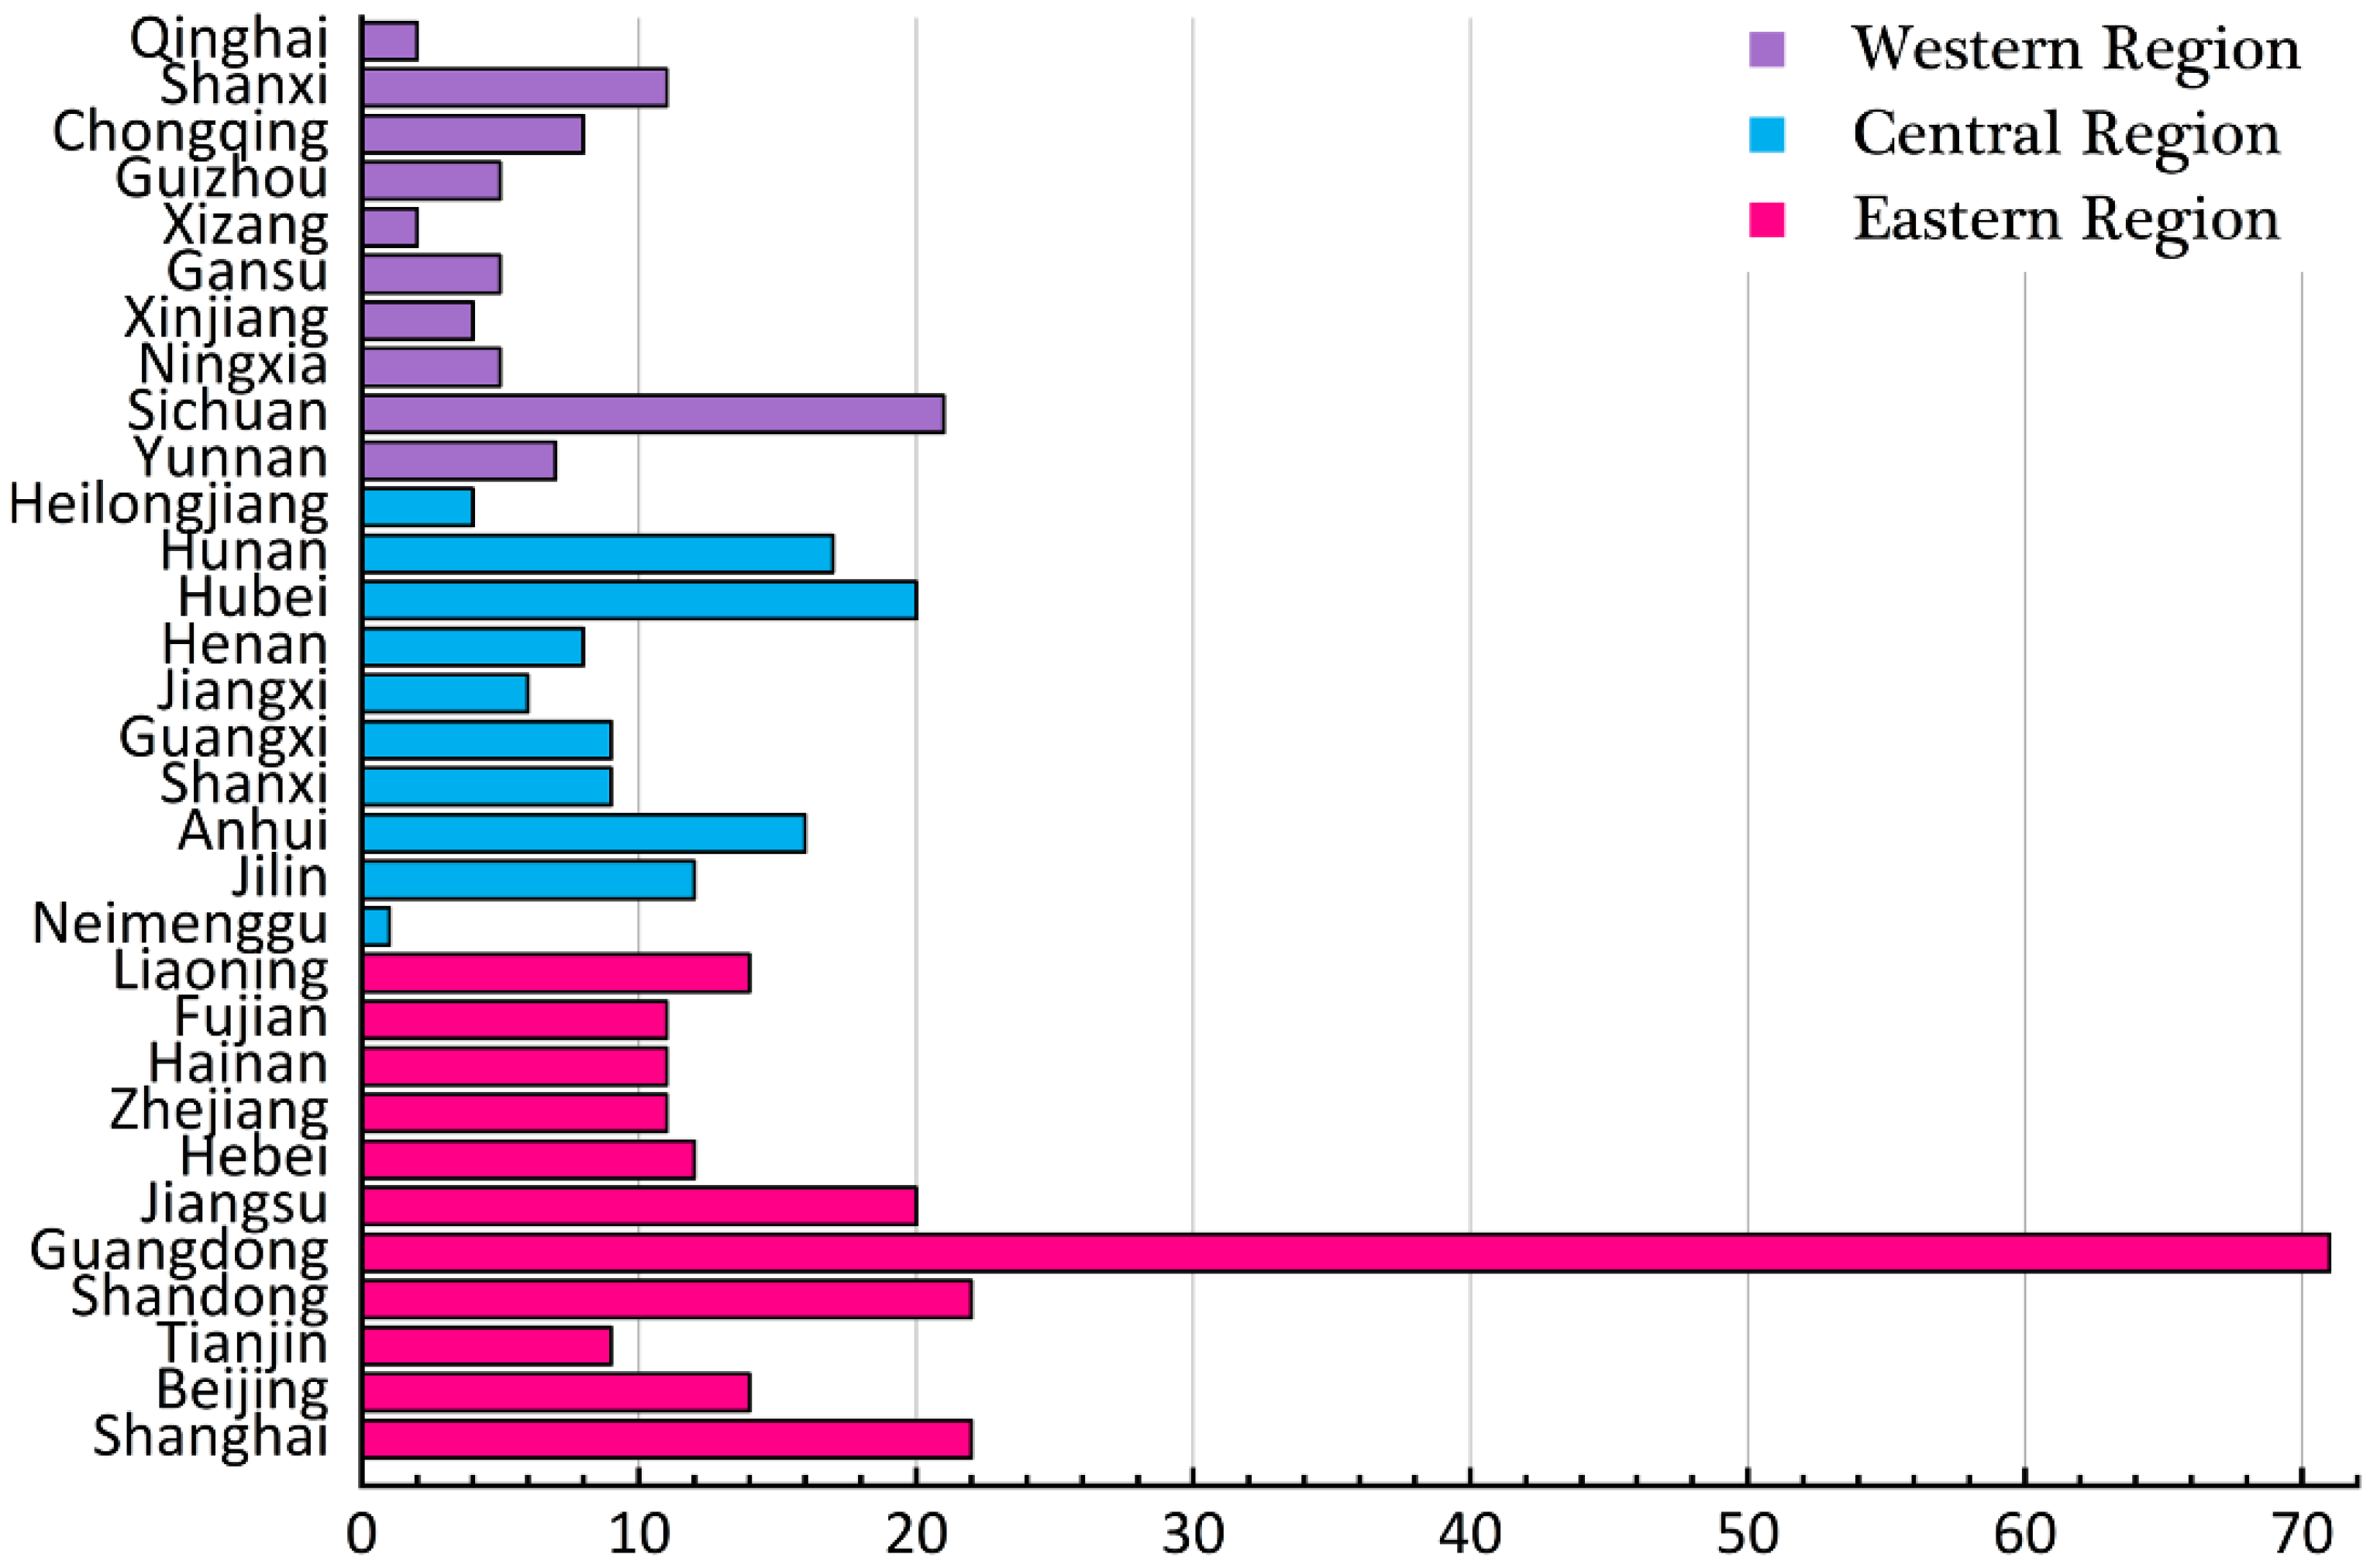
The sample companies used in this paper are all listed companies in Shanghai and Shenzhen, China. The sample period is from the first quarter of 2003 to the third quarter of 2018. To ensure the validity of the sample selection, the following rules are applied for the selection: (1) To avoid the influence of the particularity of the capital structure of financial companies, financial companies are excluded according to research practice. (2) Companies in the ST (Special treatment) and * ST categories are excluded. Due to the abnormal financial conditions of those companies, merger and reorganization issues are common, and their investment behavior is more susceptible to other external factors. (3) Companies missing major financial data are excluded. After the above-mentioned selection and balance panel data processing, the sample finally includes 389 companies and 24,507 company-quarter observations, which are distributed in three major regions and 31 provinces across the country, as shown in Figure 2.
Using the division method of the National Bureau of Statistics of China (according to the geographical location and economic development level) in combination with the division method used in existing research, this paper divides China into regions as follows: 11 coastal provinces, including Shanghai, Beijing, Tianjin, Shandong, Guangdong, Jiangsu, Hebei, Zhejiang, Hainan, Fujian and Liaoning, comprise the eastern region; 10 provinces, including Inner Mongolia, Jilin, Anhui, Shanxi, Guangxi, Jiangxi, Henan, Hubei, Hunan and Heilongjiang, comprise the central region; and 10 provinces, including Yunnan, Sichuan, Ningxia, Xinjiang, Gansu, Tibet, Guizhou, Chongqing, Shaanxi and Qinghai, comprise the western region. Due to data availability, this paper does not consider Hong Kong, Macao, or Taiwan.
The financial data in this paper mainly come from the Wind, CSMAR (China Stock Market Accounting Research), and RESSET databases. The EPU index was constructed by Baker et al. [2] To alleviate the influence of outliers on the empirical analysis, a 1% two-sided tail reduction process was carried out for the continuous variables at the financial level of enterprises.
After 1% double-tailing, Table 2 reports the mean values, standard deviations, quantile values, and other descriptive statistical results of INV and ROA for enterprise investment level and profitability in the whole sample and three regions. The results indicate that there are differences in the investment level and profitability of enterprises among regions in China, especially in the eastern region, where the values are significantly higher than the average values of the whole sample, the central region, and the western region. In addition, the standard deviation of the profitability of enterprises in the western region is higher than that in the eastern and central regions; however, the investment level of enterprises in different regions exhibits little difference. Since the descriptive statistics of the variables can only compare the differences in the panel data between regions, they cannot reflect the interactions between economic policy uncertainty and investment behavior and profitability of enterprises, which need to be specified in the empirical analysis.
3. Empirical Analysis
3.1. Model Selection and Test
Before the estimation of the PVAR model, to ensure the validity of the regression results and avoid spurious regression problems caused by the nonstationarity of the data, we needed to test the stability of the data. For robustness, we carried out four panel unit root tests—LLC (Levin-Lin-Chu), IPS (Im-Pesaran-Shin), HT (Harris-Tsavails), and ADF (Augmented Dickey-Fuller)–Fisher—for each region. An ADF test was carried out for the time-series EPU data, and the results are shown in Table 3. As observed, all variables reject the original hypothesis at a significance level of 1%. Therefore, it can be judged that the original sequence of each variable is a stationary variable, which meets the basic requirements for establishing a PVAR model.
Before the regression analysis of the PVAR model, it is necessary to determine the optimal lag order of the model. Compared with a traditional VAR model, the PVAR model introduced by panel analysis has a lower requirement for data length. As long as T ≥ m + 3 (T is the length of the time series, and m is the order of the lag), the parameters of the equation can be estimated; if T ≥ 2m + 2, the parameter of the lag term can be estimated in the steady state. For the PVAR model, the higher the lag order is, the stronger the interpretation ability of the model but the more the order of delay will affect the degrees of freedom. Therefore, it is necessary to select an appropriate lag order. In this paper, the optimal lag order of the model is determined according to the minimization principles of the modified Akaike information criterion (MAIC), the modified Bayesian information criterion (MBIC), and the modified Hannan–Quinn information criterion (MQIC). As shown in Table 4, when the PVAR model lag is 6th-order, the three major information criteria are small at the same time, so the optimal lag order for determining the full sample is 6th-order.
The Granger causality test is further used to analyze the causality among economic policy uncertainty, enterprise investment behavior, and enterprise profitability. The Granger causality test result is closely related to the selection of the lag order. As shown in Table 5, when the lag order is 6, the Granger cause of investment behavior is economic policy uncertainty and the profitability of the whole sample at the 1% significance level. This result shows that economic policy uncertainty and the change in the profitability of an enterprise can affect the investment behavior of the enterprise. In the interaction between economic policy uncertainty and the investment behavior and profitability of enterprises, when the lag order is 6, the investment behavior and profitability of enterprises in the whole country are the reasons for economic policy uncertainty at the 1% significance level, and the investment behavior and profitability of enterprises can cause changes in economic policy uncertainty to a certain extent. When the lag order is 6, the Granger cause of enterprise profitability is the uncertainty of investment behavior and economic policy at the 1% significance level. This is because the level of enterprise profitability is affected not only by the enterprise’s own investment behavior but also by the external environment, such as economic policy uncertainty.
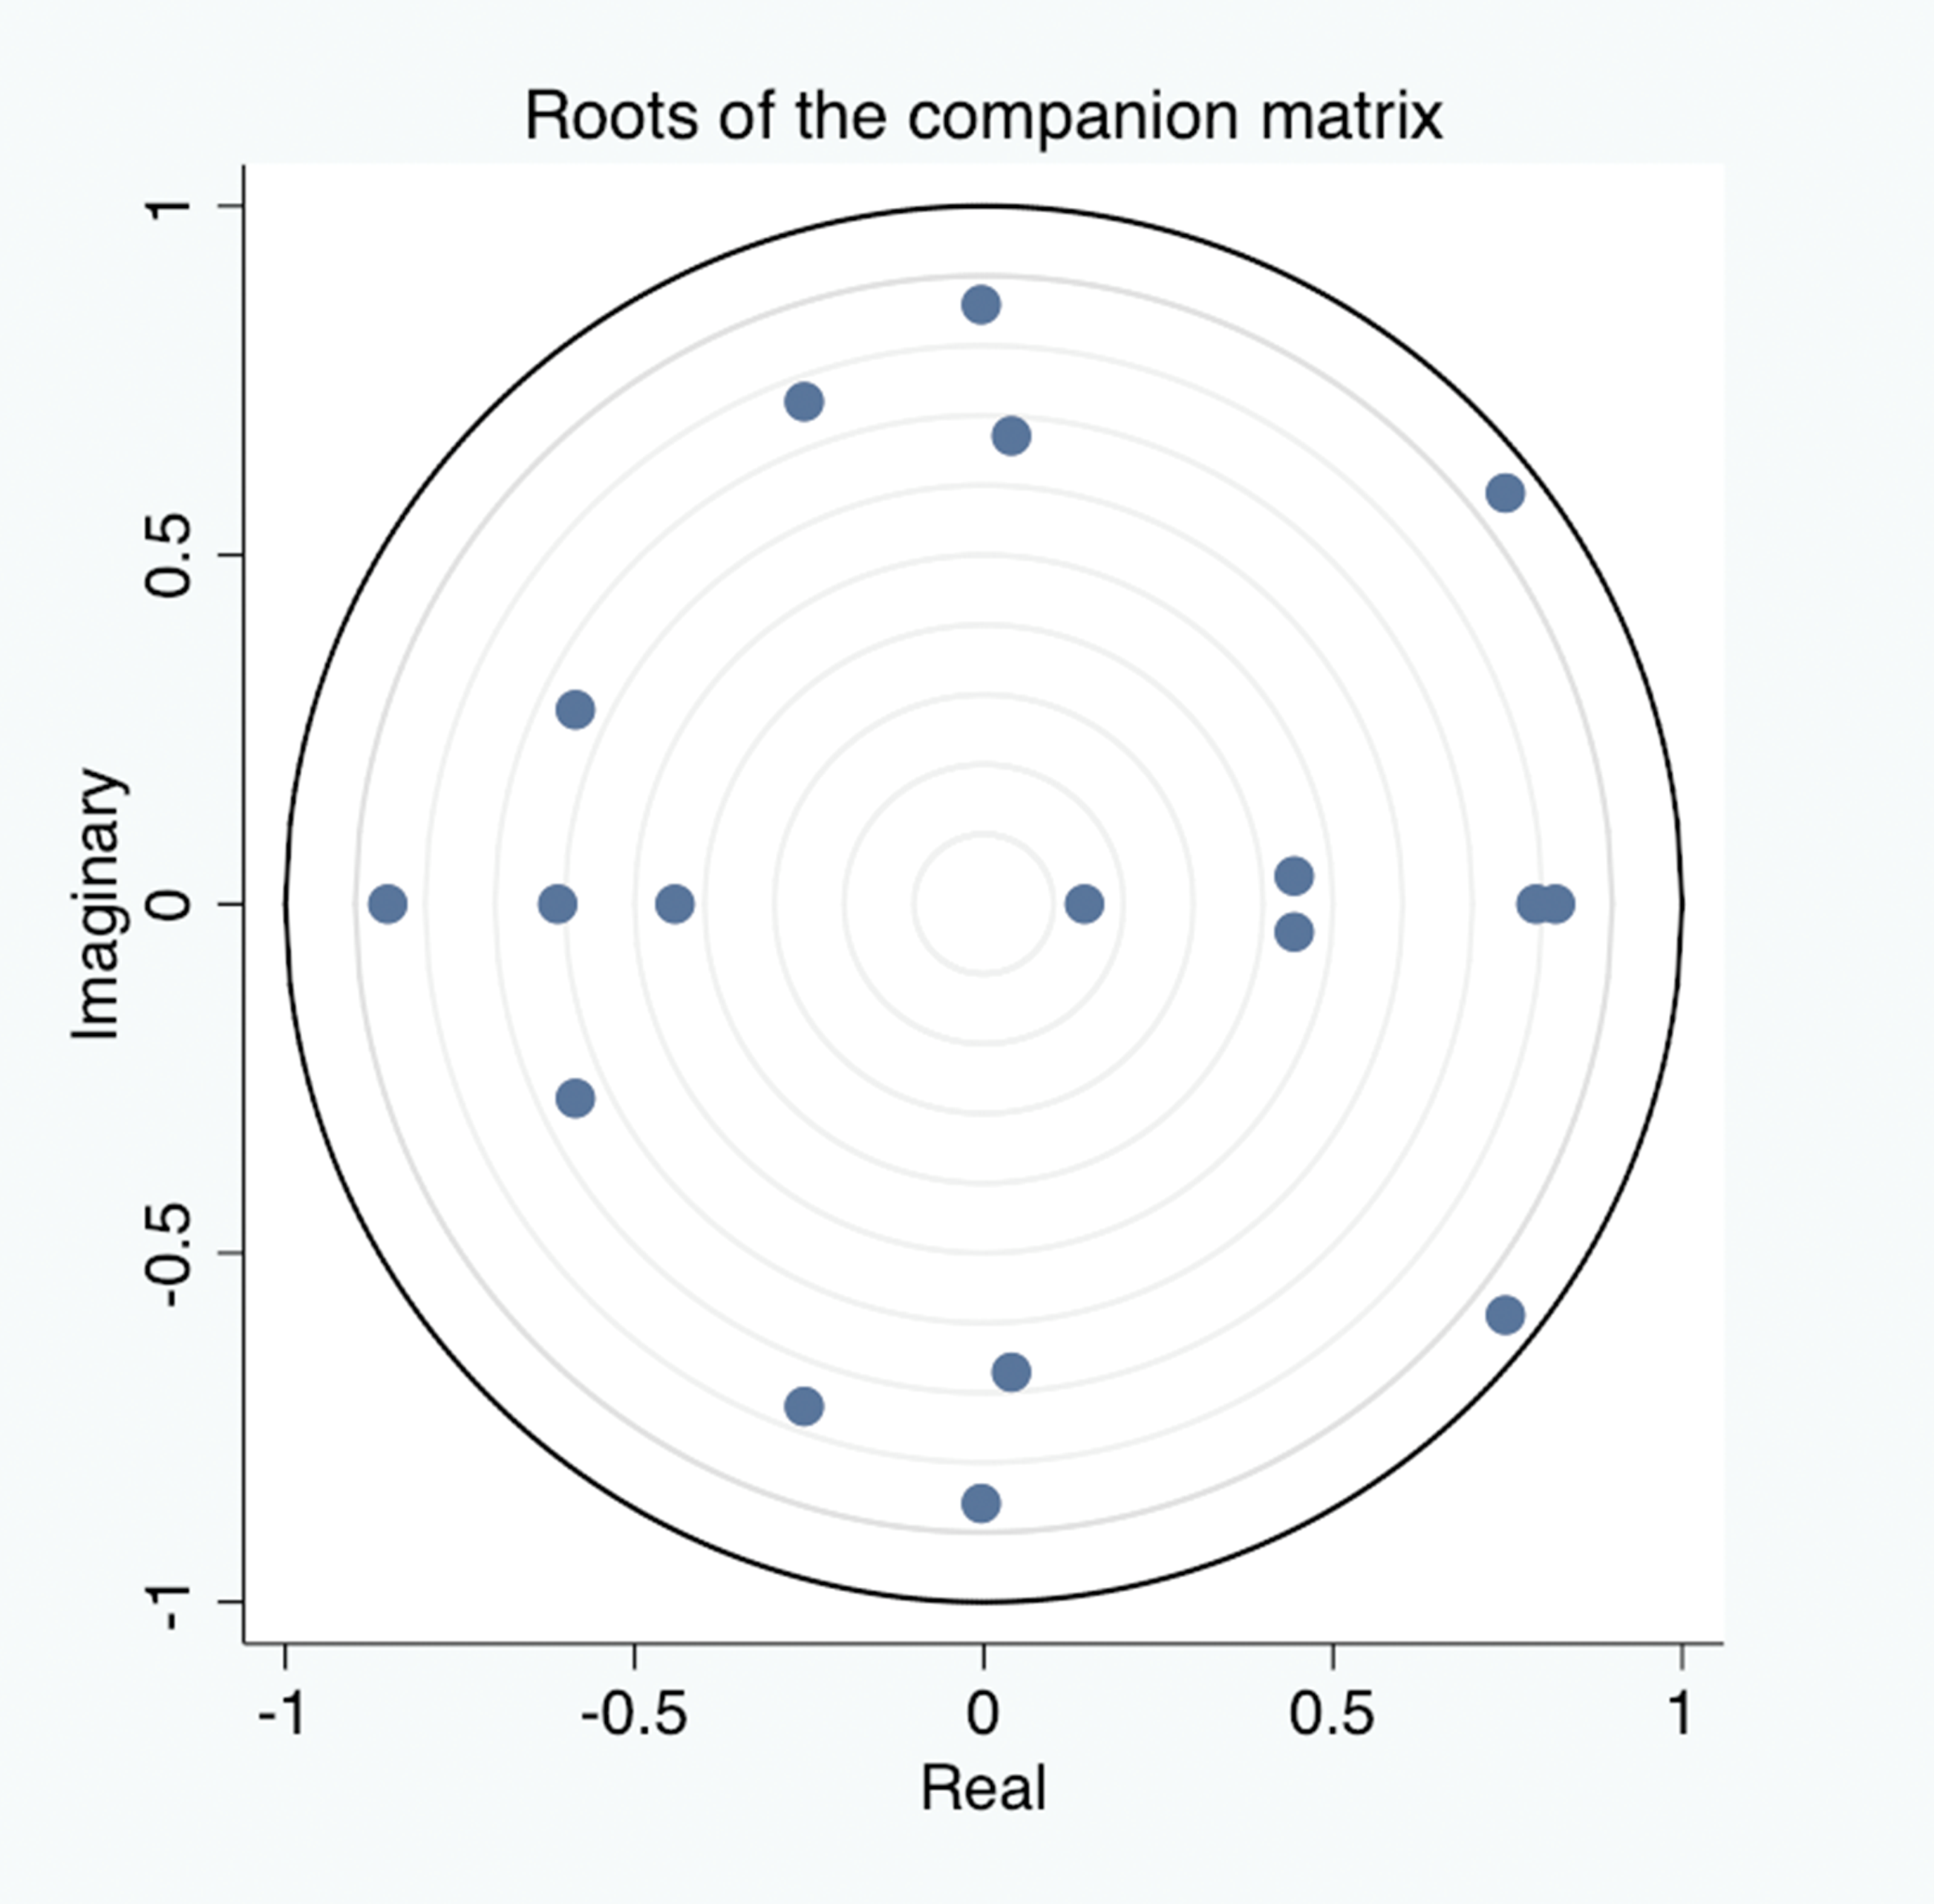
A panel autoregressive (AR) root test was performed on the constructed PVAR model to test the system stability of the entire model. According to Figure 3, the inverses of all root modes of the full sample model are located inside the unit circle; that is, the root modes are less than 1. The PVAR model meets the stability conditions and has strong stability. This model can further analyze the panel impulse response function and panel variance decomposition technology of the endogenous variables of the PVAR model.
3.2. PVAR Model Estimation Results
In Table 6, from the perspective of the variables themselves, the impact of 1–6 periods of EPU lags on the current period is significant at the level of 1%. Except for the positive impact of the variables with a 2-period lag on the current-period EPU, where the coefficient is relatively small, the other factors have a negative impact, with the coefficient of the lag period of 5 being the highest. The results show that economic policy uncertainty in an early stage has an important impact on economic policy uncertainty in the current period. The investment level INV with lags of 1–4 periods has a positive impact on the current investment at a significant level, while the investment variable with lags of 5–6 periods has a significant negative impact on the current investment INV. This indicates that the investment activities in the previous 1–4 periods, that is, in the past year, have a positive impact on the current investment, while the investment activities in the prior 5–6 periods, that is, more than 1 year ago, have a negative impact on current investment behavior. The variables with profitability lagging 1–5 periods have a significant positive impact on the current ROA variables, and the variables with 6 periods of lag have a significant negative impact on the current ROA variables. This indicates that the profitability of enterprises in the previous 1–5 periods has a positive effect on the current profitability.
Generally, past investment behavior and profitability play a role in promoting investment behavior and profitability in the current period in the short term; that is, an increase in investment or profitability in one year also increases that in the current period, and vice versa. However, the former EPU has a reverse effect on the current EPU; that is, the former EPU increases. After the economic environment is stabilized, the uncertainty of current economic policy weakens.
From the perspective of the relationships between the variables, the investment activity of a company lags 1–6 periods and has a negative impact on the current EPU at a significant level. Enterprise profitability lags 1–6 periods and has a negative impact on the current EPU at a significant level, indicating that the current EPU is restrained by the enterprise’s previous profitability.
EPU lags 1–6 periods, except that the lag-3 period has a positive impact on current enterprise investment activities. The EPU with other lags shows a negative correlation under the condition of the significance level, which indicates that previous economic policy uncertainty restrains current enterprise investment activities to a large extent. ROA with lags of 1–3 periods has no significant impact on the current investment activities. ROA with a lag of 4 periods has a positive impact on INV in the current period at a significant level, while ROA with lags of 5–6 periods changes to a state that has a negative impact on investment activities in the current period. In terms of the combination of the coefficient and significance level, the impact of previous profitability on the investment increase in the current period is relatively small; in lag period 4, this impact plays a promoting role, and in the other lag periods, it shows a slight inhibitory effect.
The impact of past economic policy uncertainty on the profitability of enterprises in the current period is shown as follows: the lag of EPU in three periods has a positive impact on the current ROA with a high level of significance, while the lag in four to five periods is not significant; the lag in other periods has a negative impact on the current ROA with a high level of significance, which shows that the impact of economic policy uncertainty on the profitability of enterprises in the current period has a strong restraining effect on most enterprises. This trend is similar to the impact of INV lag on the current ROA. The difference is that investment with a lag of 4 periods has a stronger promotion effect on current profitability, and the coefficient is far greater than the inhibition effect, although investment activities have a longer inhibition effect on current profitability.
Generally, the interaction among the three regions’ economic policy uncertainty, enterprise investment behavior and enterprise profitability is relatively consistent. In most cases, economic policy uncertainty and enterprise investment activity and profitability mutually restrain each other; that is, the stronger the economic policy uncertainty is in an early stage, the weaker the enterprise investment activity and profitability are in the current period. If economic policy is relatively stable, the investment activities and profitability of enterprises increase. Similarly, the lower the level of investment and profit of an enterprise in an early stage, the greater the change in economic policy in the current period and the greater the uncertainty of economic policy.
3.3. Impulse Response Analysis
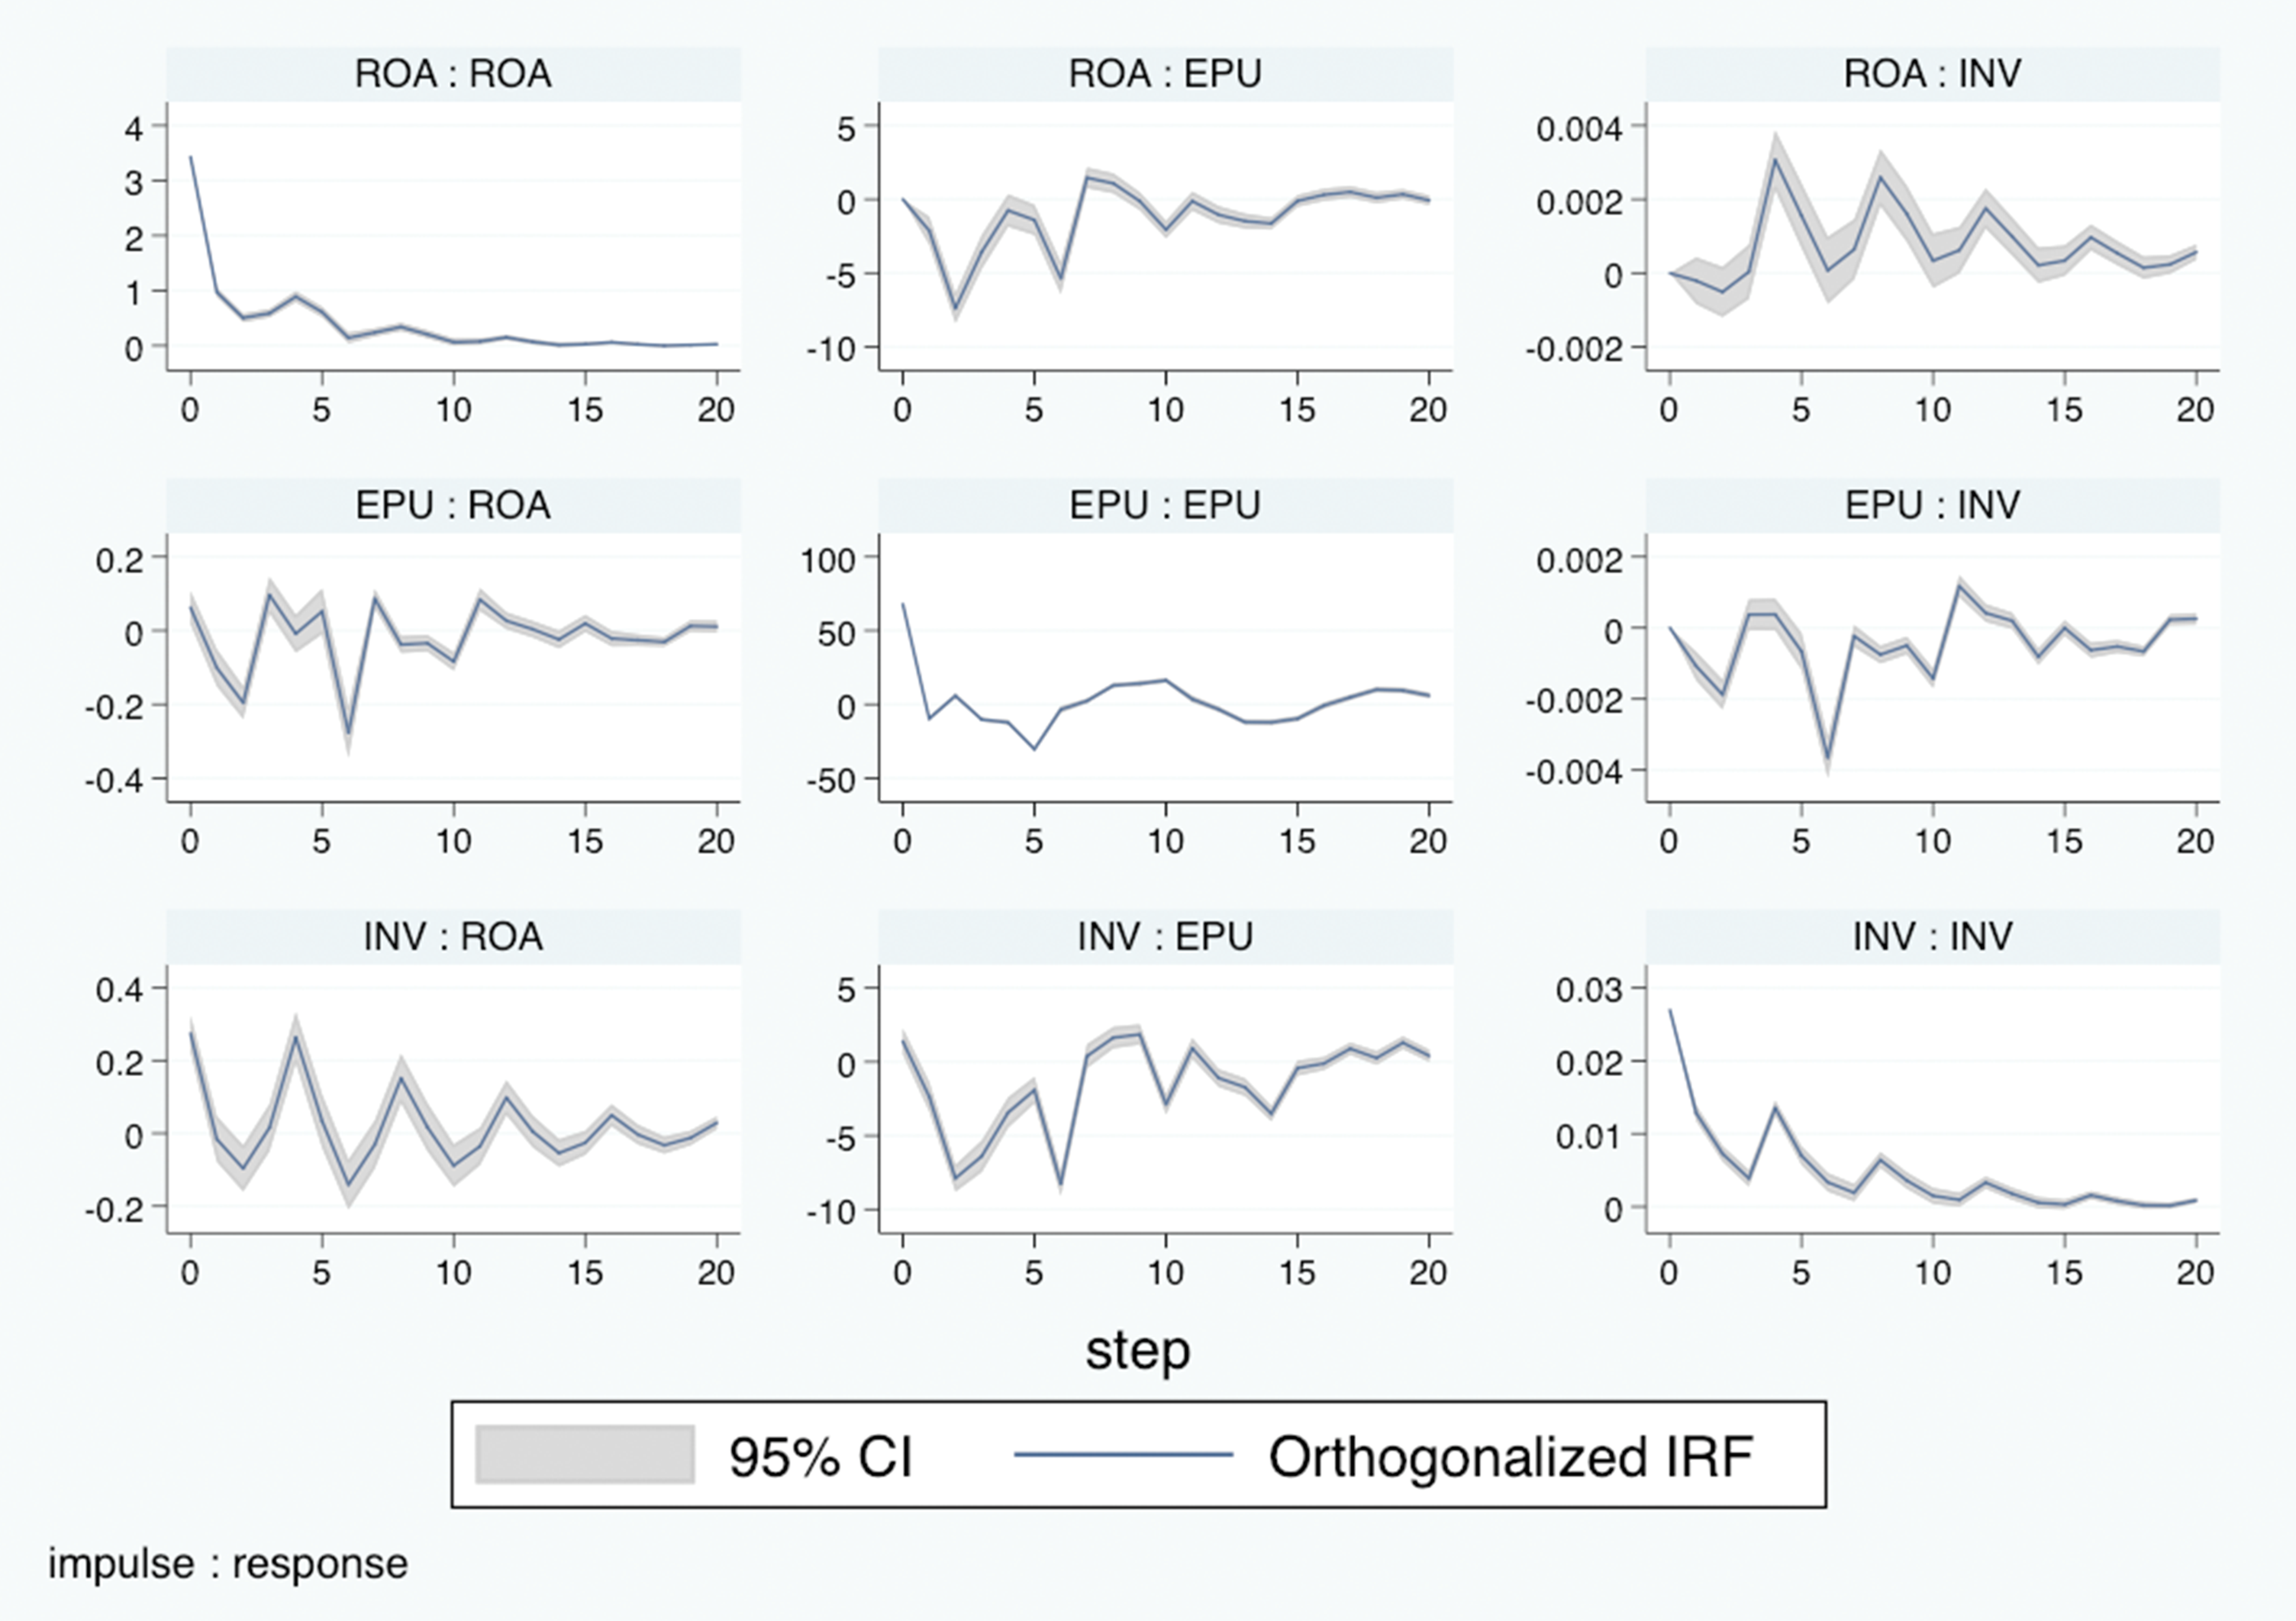
The estimation results of the PVAR model show the static interaction among economic policy uncertainty and the investment activity and profitability of enterprises. To describe the dynamic conduction mechanism and path of the three variables in the next 20 periods more intuitively, Monte Carlo simulation was used 300 times to obtain an orthogonal impulse response function diagram, and the results are shown in Figure 4. The impulse response function is used to describe the influence of a variable impacted by a unit standard deviation on the current and future values of the variable itself and other variables to investigate the dynamic relationships between the variables. In the figure, the horizontal axis represents the number of lag periods, the dashed curve represents the 95% confidence interval, and the middle curve represents the point estimates of the impulse response function.
The impulse response diagram of the whole sample shows that for the impact of the ROA variable of corporate profitability with a standard deviation, the EPU immediately has a negative impact, with a large range of fluctuations in the first six periods, where the second period reaches the maximum value, the fifth period tends to 0, and then there is a downward fluctuation. This shows that the profitability of enterprises has a negative impact on economic policy uncertainty, indicating that the profitability of enterprises has a restraining effect on economic policy uncertainty in the short term. For the impact of ROA, the response of corporate investment activities INV is in a state of volatility, especially in the first 10 periods, with a large range of volatility, but always shows a positive effect. This indicates that an increase in corporate profitability promotes corporate investment activity in the long term.
For the impact of EPU, the profitability of an enterprise immediately has a negative impact. There is a large downward trend in the second and sixth periods, the maximum value is reached in the sixth period, and then the trend tends to 0. In the whole impact response process, most of the periods are in a negative state. Therefore, economic policy uncertainty has a restraining effect on the profitability of an enterprise in the long term, but there is also a short period with a promotion effect. The impact of EPU on the INV of enterprise investment activities decreases to the maximum value in the sixth period, begins to produce small fluctuations, and then tends to a zero value in the twelfth period. This indicates that the long-term impact of economic policy uncertainty on the investment activity of enterprises is negative, and the inhibitory effect is the strongest one and a half years later.
The impact of corporate investment activity on profitability is relatively complex. This impact is reflected in the fluctuation around a value of 0 and tends to 0 after 16 periods, which indicates that corporate investment activity has a long-term impact on profitability, and the inhibitory and promoting effects alternate. For the impact of one standard deviation of enterprise investment activity, economic policy uncertainty immediately has a negative impact. It reaches the maximum in the second and sixth periods and tends to 0 after the 15th period. This indicates that the inhibition effect of enterprise investment activity on economic policy uncertainty is strongest in half a year or one and a half years, and the inhibition period is longer.
With regard to the impact response of the three variables themselves, they all show a positive response after the impact and tend to 0 in a relatively short period of time. This indicates that economic policy uncertainty, enterprise investment activity, and enterprise profitability are affected by their own short-term positive impacts.
According to the impulse response function diagram, economic policy uncertainty has an inhibitory effect on the investment activity and profitability of enterprises, and the investment activity and profitability of enterprises have a long-term inhibitory effect on economic policy uncertainty.
3.4. Impulse Response Analysis
To further measure the importance of economic policy uncertainty, corporate investment activity, and corporate profitability on their own and with other variables and to measure the contribution of each impact, the dynamic relationship among them is further analyzed by variance decomposition. The results are shown in Table 7.
In the decomposition results, the contributions of corporate investment activity and profitability to economic policy uncertainty show an upward trend in the first 16 periods (4 years) but then decrease; the degree to which economic policy uncertainty and corporate profitability explain corporate investment activity shows an obvious upward trend in the long run; and the contribution rates of economic policy uncertainty and enterprise investment activity to enterprise profitability also show a long-term upward trend. The specific decomposition results are as follows:
The contribution rates of corporate investment activity and profitability to economic policy uncertainty reach their maxima in the 16th period, with values of 2.95% and 1.59%, and then fall to 2.89% and 1.55% in the 20th period, respectively. The contributions of economic policy uncertainty and corporate profitability to corporate investment activity show a long-term upward trend; in the 20th period, the contribution rate of economic policy uncertainty to investment is 1.77%, and the degree of contribution of profitability to investment is 2.09%. The above decomposition data show that there is a small difference in the contribution factors of corporate investment activity such that profitability has a greater impact on corporate investment activity. Both the degrees of explanation of economic policy uncertainty and enterprise investment activity to enterprise profitability show a long-term upward trend. In the 20th period, the contribution rate of economic policy uncertainty to profitability is 1.14%, and the degree of explanation of investment activity to profitability is 1.48%. The results show that there are also differences in the contribution factors of corporate profitability, and the degree of contribution of investment activity to profitability is greater than that of economic policy uncertainty.
In general, there are contribution differences among economic policy uncertainty, enterprise investment activity, and enterprise profitability.
4. Analysis of Regional Heterogeneity
To further explore the differences in economic policy uncertainty, enterprise investment, and enterprise profitability in the eastern, central, and western regions of China, this paper analyzes the regional heterogeneity of the relationship among the three variables according to regional divisions on the basis of the previous analysis.
4.1. Selection of Lag Order and Model Test
According to Table 8, all variables required for the PVAR model analysis passed four panel unit root tests and were determined to be stationary variables.
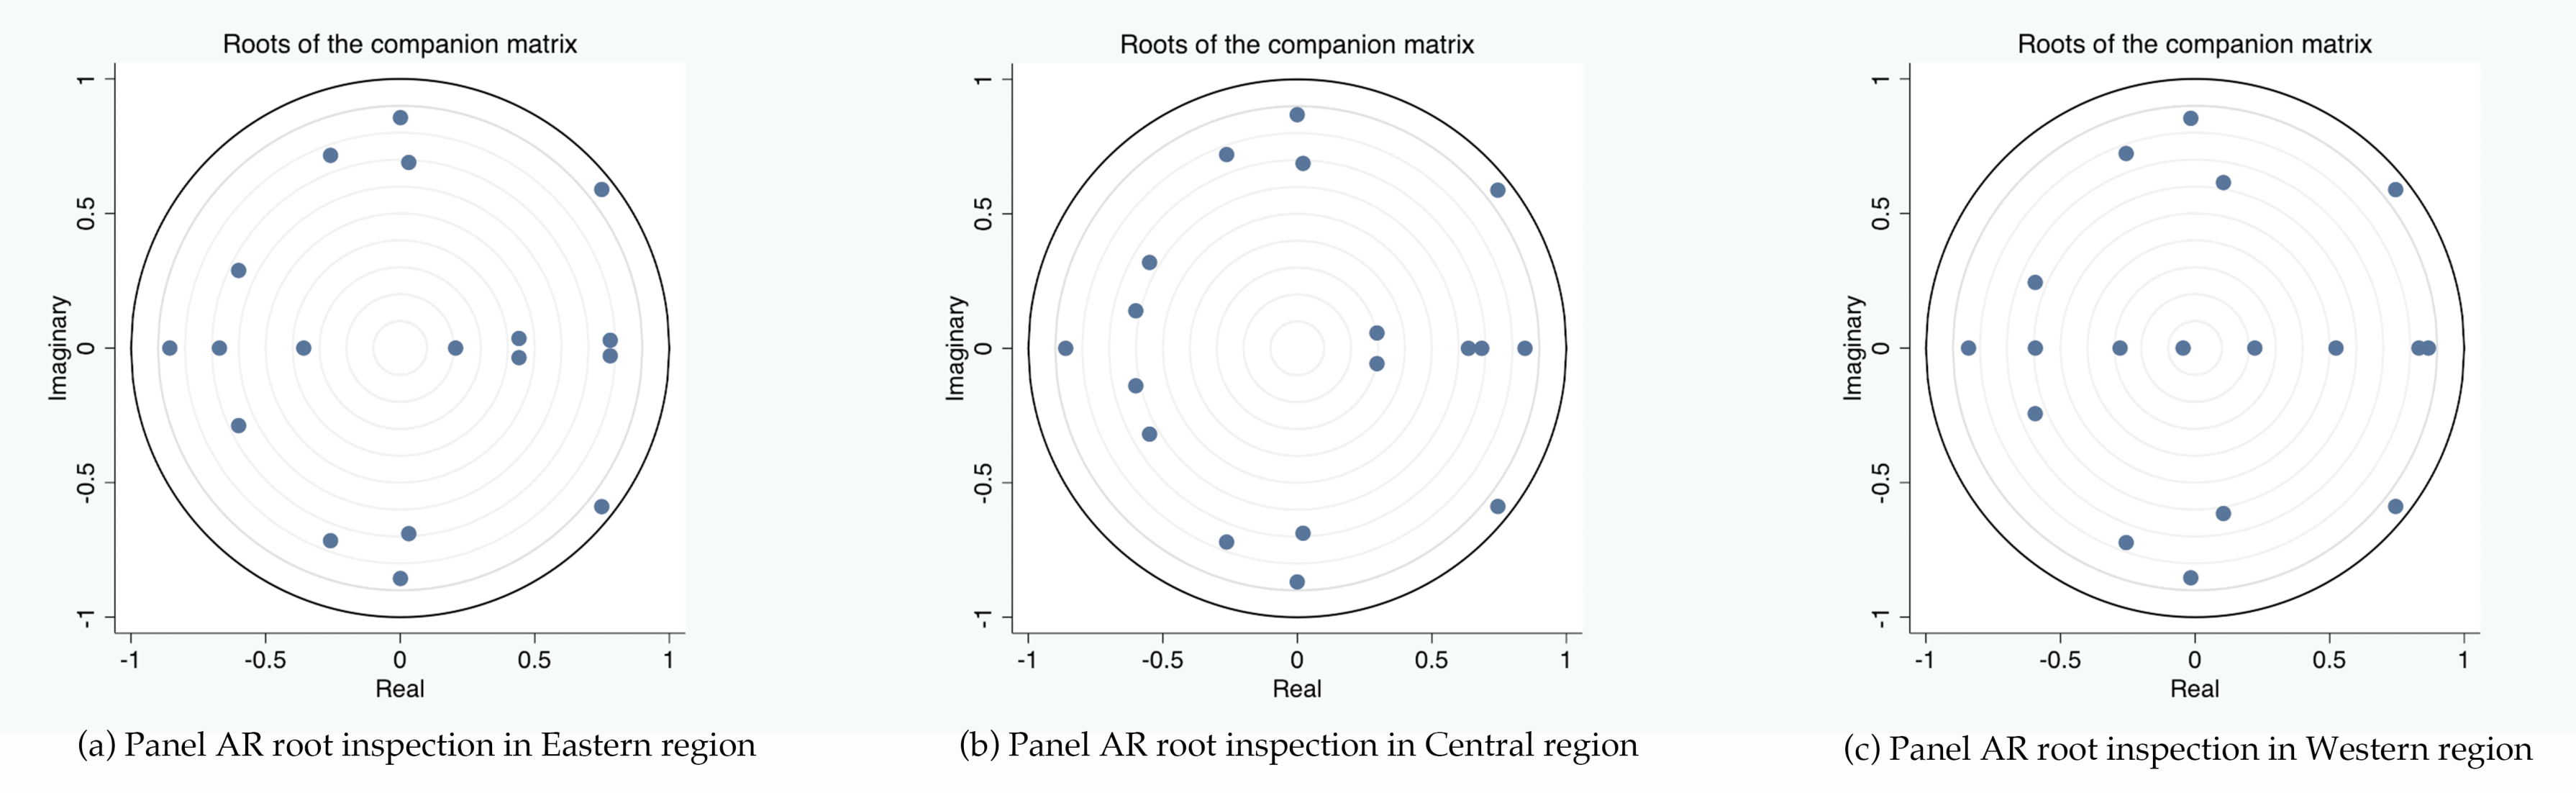
For the selection of the lag order, taking the eastern region as an example, the result shows that the best lag order of the PVAR model is 6; according to the same principle, the best lag order of the central region is 6, and the optimal lag order of the western region is 5. To make the empirical analysis of the three regions comparable, the optimal lag order of the western region is finally determined to be 6. Then, when the lag order is 6, there is Granger causality among the three variables in the eastern, central, and western regions at the 1% significance level; that is, economic policy uncertainty, enterprise investment behavior, and enterprise profitability interact, which provides the basis for the PVAR analysis below. In addition, as shown in Figure 5, the root modules of the PVAR models constructed for the three regions are all less than 1, and these models can be used for further model analysis, impulse response, and variance decomposition.
4.2. PVAR Model Estimation Results
From the perspective of the relationships between the variables, the variables of the investment activity of enterprises with lags of 1–6 periods have a negative impact on the current EPU at a significant level. The absolute value of the coefficient for the central region is larger than that for the eastern and western regions, indicating that EPU in the central region is more affected by the inhibition of the INV lag period. The ROA of enterprise profitability lags 1–6 periods; in the eastern and western regions, the impact on current EPU is negative at a significant level. The absolute value of the coefficient and the number of lag periods for the eastern region have a greater impact on the length than those of the other two regions, indicating that the current economic policy uncertainty in the eastern region is more restrained by an enterprise’s previous profitability.
EPU lags for 1–6 periods. Except for the positive effect of the lag-3 period on INV of current enterprise investment activity, EPU with other lag periods shows a negative correlation under the condition of the significance level, and the performance is more significant in the eastern region. This shows that previous economic policy uncertainty restrains current enterprise investment activity to a large extent, especially in the eastern region. Past economic policy uncertainty and enterprise profitability have a strong inhibitory effect on enterprise profitability in the current period. The performance of the central region is most significant among the three regions. The absolute value of the coefficient is greater than that of the eastern and western regions, regardless of whether it indicates a promoting or inhibitory effect.
Generally, the interaction among economic policy uncertainty, enterprise investment behavior, and enterprise profitability in the three regions is relatively consistent, showing mutual inhibition among the three, and the inhibitory effect for the central region is stronger than that for the eastern and western regions.
4.3. Impulse Response Analysis
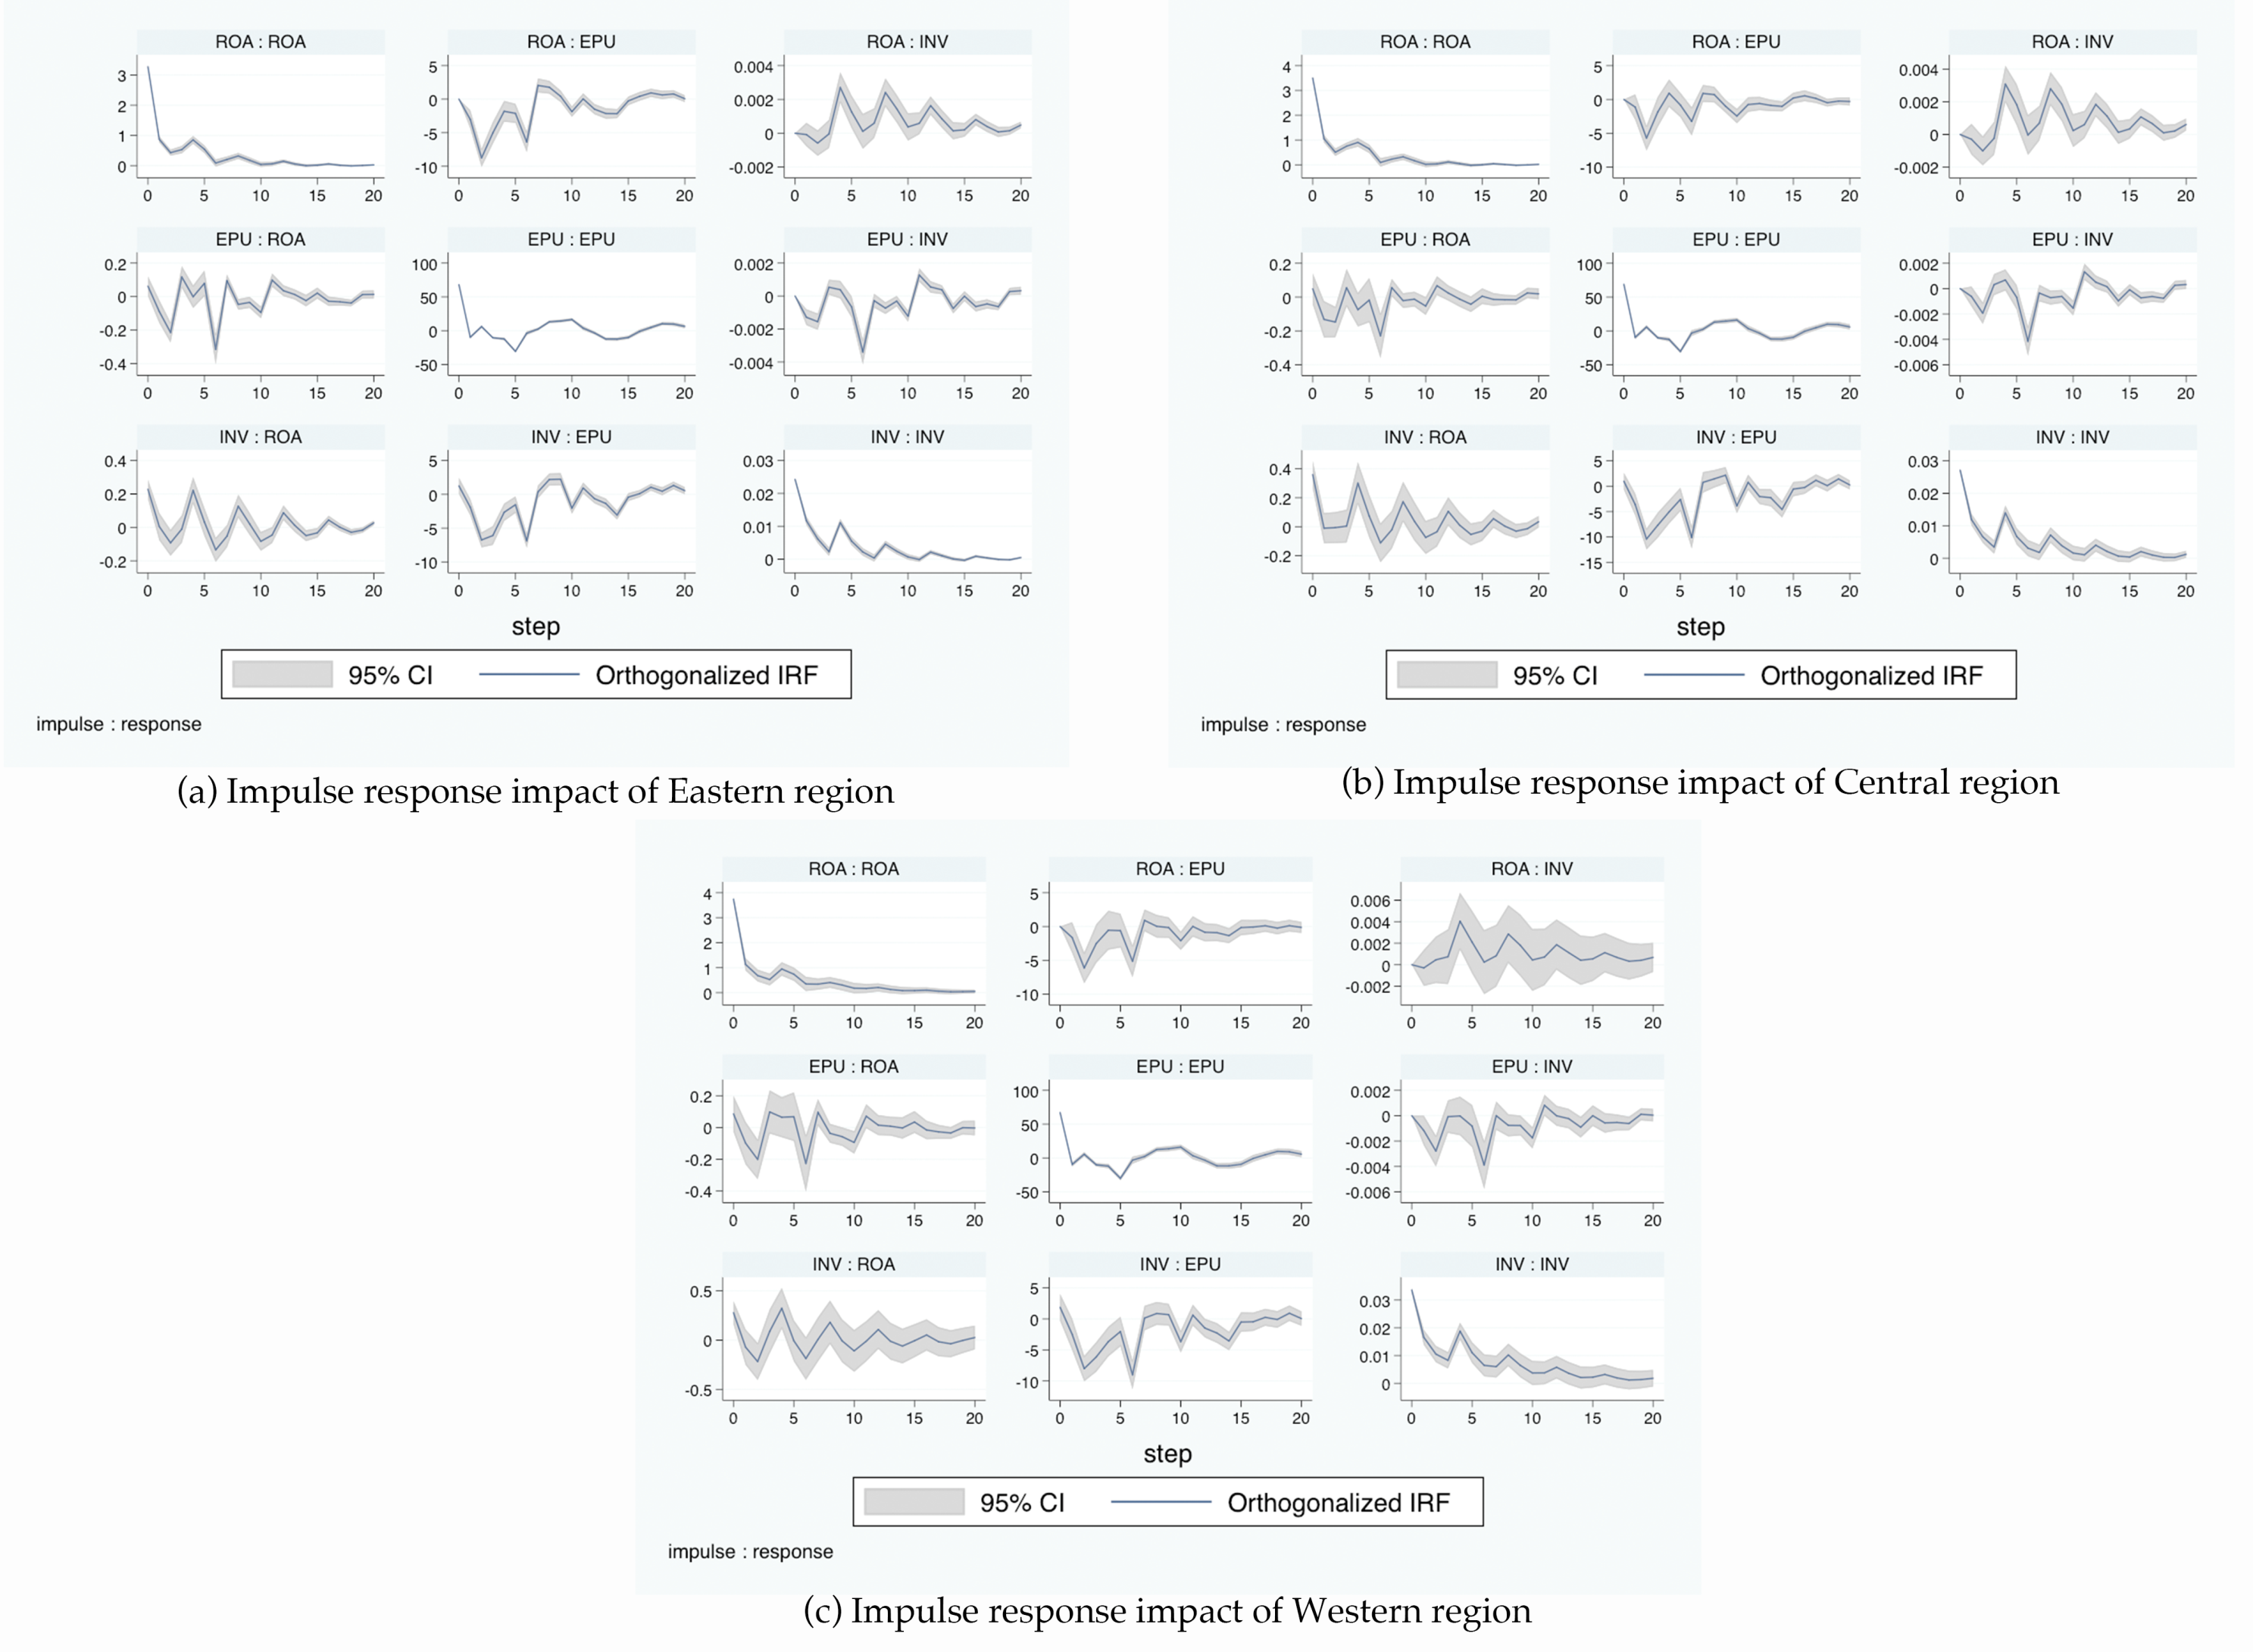
The three impulse response graphs of the eastern, central, and western regions show that for the impact of the ROA variable with a standard deviation, EPU immediately produces a negative impact. As shown in Figure 6, the point estimates of the eastern and western regions gradually tend to 0 starting from the sixth period, while those of the central region do not start to steadily trend to 0 until the tenth period. This shows that enterprise profitability has a negative impact on economic policy uncertainty; however, this impact is evident only in the first six periods, that is, one and a half years, for the eastern and western regions, which show that enterprise profitability can inhibit the production of economic policy uncertainty in the short term. In contrast, the central region has a longer-term inhibitory effect. For the impact of enterprise profitability, the response of corporate investment activity shows a positive effect, indicating that an increase in corporate profitability in the eastern, central, and western regions promotes corporate investment activity in the long term.
Economic policy uncertainty has an immediate negative impact on enterprise profitability. The impact response of the central region exhibits a negative impact for a longer time relative to that of the other two regions, which shows that the inhibitory effect of the central region on enterprise profitability is more obvious in the long term after the impact of economic policy uncertainty. Additionally, economic policy uncertainty immediately has a negative impact on enterprise investment activity with a standard deviation. In terms of the estimated values of the impact response points, the estimated values of the central region in the second period and the sixth period are larger than those of the other two regions. This finding indicates that the inhibitory effect of enterprise investment activity on economic policy uncertainty is the strongest in half a year or one and a half years, and the period of inhibition is longer. In addition, the central region’s economic policy uncertainty has a stronger inhibitory effect on enterprise investment activity than that of the other two regions.
In other words, economic policy uncertainty has an inhibitory effect on the investment activity and profitability of enterprises, while the central region exhibits a longer period of the inhibitory effect on enterprise profitability after the impact of economic policy uncertainty. The investment activity and profitability of enterprises also have a long-term inhibitory effect on economic policy uncertainty. Economic policy uncertainty in the central region is more restrained by the investment activity of enterprises.
4.4. Variance Decomposition
In Table 9, the decomposition results show that the contribution rates of enterprise investment activity and profitability to economic policy uncertainty in the eastern region reached their maxima in the 16th period, with values of 2.19% and 2.47%, respectively, and then dropped in the 20th period; the contribution rates of these two variables in the central region reached 4.78% and 0.8% in the 16th period and dropped to 4.69% and 0.79% in the 20th period, respectively. The contribution rate of enterprise investment activity to economic policy uncertainty in the western region increased to a maximum of 3.27% in the 16th period, while the contribution rate of profitability to economic policy uncertainty was 1.16% in the same period and began to decline in the later period. The results show that the two major factors of economic policy uncertainty exhibit contribution differences and regional differences. The key factor affecting EPU in the eastern region is corporate profitability, and the contribution rate is far higher than that in the other regions; the important factor in the central and western regions is corporate investment activity, and the INV contribution in the central region is significantly higher than that from the eastern and western regions.
The contributions of economic policy uncertainty and corporate profitability to corporate investment activity show a long-term upward trend in the eastern, central, and western regions. In the 20th period, the contributions of EPU to INV in the three regions are 2.13%, 2.22%, and 1.13%, respectively; the contributions of ROA to INV are 2.21%, 2.43%, and 1.70%, respectively. The above decomposition data show that there are small contribution differences and regional differences in the influencing factors of enterprise investment activity, among which profitability has a greater impact on enterprise investment activity, and the contribution in the central region is higher than that in the other regions. Additionally, EPU in the central region has a higher degree of influence on INV than that in the eastern and western regions.
The contributions of economic policy uncertainty and corporate investment activity to corporate profitability also show a long-term upward trend in the three regions. The contribution rates of EPU to ROA in the 20th period in the eastern, central, and western regions are 1.59%, 1.24%, and 0.9%, respectively; the degree of explanation of investment activity to profitability is 1.24%, 1.84%, and 1.79%, respectively. The results show that there are contribution differences and regional differences in the influencing factors of corporate profitability. The main influencing factor of corporate profitability in the eastern region is EPU, and its contribution rate is higher than that in the other regions; the key influencing factor in the central and western regions is corporate investment activity, and the contribution rate of INV in the central region is higher than that in the other two regions.
In general, there are contribution differences and regional differences in the impact of economic policy uncertainty, corporate investment activity, and corporate profitability. The interaction between EPU and ROA is stronger in the eastern region, while the interaction between EPU and INV is stronger in the central and western regions, and the mutual contribution value of EPU and ROA in the central region is higher than that in the other regions.
5. Conclusions and Suggestions
Based on sample data of 389 companies in 63 quarters from the first quarter of 2003 to the third quarter of 2018, this paper uses a PVAR model to estimate and the impulse response function to analyze the static and dynamic interactions and regional differences among economic policy uncertainty, enterprise investment activity, and enterprise profitability and decomposes the degrees of contribution of the three variables. The main conclusions are as follows:
- Economic policy uncertainty restrains the investment and profitability of enterprises. That is, the greater the uncertainty of economic policy, the lower the increase in investment and the lower the profitability of enterprises. Similarly, the lower the increase in investment or the lower the profitability of enterprises, the greater the uncertainty of economic policy.
- In the short term, enterprise profitability can promote investment, but in the long term, the inhibitory effect is more obvious. However, an increase in enterprise investment has no obvious characteristic trend for profitability, and the promoting and inhibitory effects alternate.
- There are contribution and regional differences in the impacts of the three factors. Among them, the interaction between economic policy uncertainty and enterprise profitability is strongest in the eastern region, while that between economic policy uncertainty and enterprise investment is strongest in the central region.
- The comprehensive analysis results show that in the long run, the central region exhibits a stronger restraint on economic policy uncertainty and corporate investment and profitability.
The main reasons for the above conclusions are as follows: (1) An enterprise’s investment decision depends on the real option theory. That is, an increase in economic policy uncertainty makes the enterprise more willing to wait for the most favorable investment opportunity, so the greater the uncertainty is, the greater the enterprise’s investment income. Additionally, enterprise investment decisions affect the adjustment of national policy in turn. For example, if enterprise investment is small, the country will adopt an appropriate policy adjustment to promote enterprise investment and stimulate market vitality. (2) For enterprises, the stability of the policy environment is more conducive to improving enterprise profitability; that is, the lower the uncertainty of economic policy, the higher the profitability. If enterprise profitability is too high, the government will also issue a corresponding policy adjustment to achieve stable market development. (3) For the regions, the regional differences caused by the natural environment, macro policies, marketization level, and industrial structure further affect the role of economic policy uncertainty and corporate investment and profitability among regions.
In light of the regional differences in economic policy uncertainty and the inhibition of corporate investment and profitability revealed by the analysis, we propose the following policy recommendations: (1) Since economic policy uncertainty restrains the investment and profitability of enterprises, the government should try to maintain the stability and continuity of macroeconomic policy so that companies can form reasonable expectations for national economic policy and plan their investments reasonably. (2) When facing an uncertain economic environment, enterprises should improve their own capacity building, gradually shift from relying on resources and energy-intensive industry to technological innovation, improve their core competitiveness and market competitiveness, and thus more effectively resist the impact of the economic environment. (3) There are great differences in the industrial structure among regions. On the one hand, there are differences in the inhibitory effect of enterprise investment, enterprise profitability, and economic policy uncertainty among regions, but on the other hand, this shows that there is a basis for adjusting the industrial structure in China. In the process of industrial structure adjustment, all regions should strive to complement each other’s advantages and avoid industrial convergence.
This paper focuses on the relationship among economic policy uncertainty, enterprise investment and profitability, and regional differences. The results of this study can be applied to study the sustainable development of enterprises. This study has not confirmed the specific reasons for the formation of regional differences among the three variables examined. Further research will examine whether the level of marketization and industrial structure are the reasons for the existence of the regional differences among these variables.
Author Contributions
Conceptualization, A.G. and F.Z.; methodology, A.G. and H.W.; software, H.W.; validation, S.L. and F.Z.; formal analysis, H.W. and S.L.; resources, A.G.; data curation, H.W.; writing—original draft preparation, H.W. and S.L.; writing—review and editing, A.G., F.Z., and C.H.; visualization, H.W. and S.L.; supervision, A.G., F.Z., and C.H.; project administration, A.G.; funding acquisition, F.Z. All authors have read and agreed to the published version of the manuscript.
Funding
This research was funded by the Strategic Priority Research Program of the Chinese Academy of Sciences (grant numbers XDA19040500 and XDA20100104); the National Natural Science Foundation of China (grant number 41571516); and the Fundamental Research Funds for the Central Universities (grant numbers 18LZUJBWYJ058 and 2019jbkyjd013).
Conflicts of Interest
The authors declare no conflicts of interest.
References
- Gulen, H.; Ion, M. Policy Uncertainty and Corporate Investment. Rev. Finan. Stud. 2016, 29, 523–564. [Google Scholar] [CrossRef]
- Baker, S.; Nicholas, B.; Steven, J.D. Measuring Economic Policy Uncertainty. Quart. J. Econ. 2016, 131, 1593–1636. [Google Scholar] [CrossRef]
- Bernanke, B.S. Irreversibility, Uncertainty, and Cyclical Investment. NBER Work. Pap. 1983, 98, 85–106. [Google Scholar] [CrossRef]
- Jia, Q.; Kong, X.; Sun, Z. Uncertainty and Corporate Investment Behavior: Empirical Evidence Based on the Turnover of Provincial Officials. J. Finan. Econ. 2013, 39, 81–91. [Google Scholar]
- Li, F.Y.; Yang, M.Z. Can Economic Policy Uncertainty Influence Corporate Investment? The Empirical Research by Using China Economic Policy Uncertainty Index. J. Finan. Res. 2015, 4, 115–129. [Google Scholar]
- Schwartz, E.S. Patents and R&D as Real Options. Econ. Notes 2004, 33, 23–54. [Google Scholar]
- Amram, M.; Kulatilaka, N. Real Options: Managing Strategic Investment in an Uncertain World; Oxford University Press: Oxford, UK, 1998. [Google Scholar]
- Chen, C.B.; Lin, T.T.; Chen, P.Y. Strategic Alliance and International Merger Evaluation Models Applying Real and Game Options. In Proceedings of the 9th Annual International Conference on Real Options Theory Meets Practice, Paris, France, 22–25 June 2005. [Google Scholar]
- Pfeffer, J.; Salancik, G. The External Control of Organizations: A Resource Dependence Perspective; Stanford University Press: Stanford, CA, USA, 2003. [Google Scholar]
- Abel, A.B. Optimal Investment under Uncertainty. Am. Econ. Rev. 1983, 73, 228–233. [Google Scholar]
- Hartman, R. The Effect of Price and Cost Uncertainty on Investment. J. Econ. Theory 1972, 5, 258–266. [Google Scholar] [CrossRef]
- Oi, W.Y. The Desirability of Price Instability under Perfect Competition. Econometrica 1961, 29, 58–64. [Google Scholar] [CrossRef]
- Bar-Ilan, A.; Strange, W.C. Investment Lags. Am. Econ. Rev. 1996, 86, 610–622. [Google Scholar]
- Segal, G.; Shaliastovich, I.; Yaron, A. Good and Bad Uncertainty: Macroeconomic and Financial Market Implications. J. Finan. Econ. 2015, 2, 369–397. [Google Scholar] [CrossRef] [Green Version]
- Liu, Z.Y.; Wang, C.F.; Peng, T.; Guo, J. Economic Policy Uncertainty and Corporate Risk Taking: Opportunities Seeking or Loss Aversion? Nankai Bus. Rev. 2017, 20, 15–27. [Google Scholar]
- Gu, X.M.; Chen, Y.M.; Pan, S.Y. Economic Policy Uncertainty and Innovation: Evidence from Listed Companies in China. Econ. Res. J. 2018, 53, 109–123. [Google Scholar]
- Atanassov, J.; Julio, B.; Leng, T. The Bright Side of Political Uncertainty: The Case of R&D. SSRN Work. Pap. 2015. [Google Scholar] [CrossRef]
- Peng, Y.C.; Han, X.; Li, J.J. Economic Policy Uncertainty and Corporate Financialization. China Ind. Econ. 2018, 1, 137–155. [Google Scholar]
- Xu, G.; Wu, W.Z. Will Economic Policy Uncertainty Inhibit the Financial Investment of Entity Enterprises. Con. Finan. Econ. 2018, 9, 114–123. [Google Scholar]
- McDonald, R.; Siegel, D. The Value of Waiting to Invest. Q. J. Econ. 1986, 101, 707–727. [Google Scholar] [CrossRef]
- Christiano, L.J.; Moto, R.; Rostagno, M. Financial Factors in Economic Fluctuations. ECB Work. Pap. 2010, 1192, 1–133. [Google Scholar]
- Arellano, C.; Bai, Y.; Kehoe, P. Financial Markets and Fluctuations in Uncertainty. Banque de France Work. Pap. 2014. [Google Scholar] [CrossRef] [Green Version]
- Gilchrist, S.; Sim, J.; Zakrajsek, E. Uncertainty, Financial Frictions, and Investment Dynamics. NBER Work. Pap. 2014, 20038, 1–59. [Google Scholar]
- Caroll, C.D.; Samwick, A.A. How Important Is Precautionary Saving? Rev. Econ. Stat. 1998, 80, 410–419. [Google Scholar] [CrossRef]
- Fernández-Vilaverde, J.; Guerón-Quintana, P.; Rubio-Ramírez, J.F.; Uribe, M. Risk Maters: The Real Efects of Volatility Shocks. Am. Econ. Rev. 2011, 101, 2530–2561. [Google Scholar] [CrossRef] [Green Version]
- Julio, B.; Yook, Y. Political Uncertainty and Corporate Investment Cycles. J. Finan. 2012, 67, 45–83. [Google Scholar] [CrossRef]
- Xu, T.Q.; Dong, Z.Y. Policy Uncertainty and Cooperate Investment: An Empirical Research Based on PSM-DID Approach. J. Cent. Univ. Finan. Econ. 2016, 12, 65–75. [Google Scholar]
- Wang, Y.; Chen, C.R.; Ying, S.H. Economic policy uncertainty and corporate investment: Evidence from China. Pac-Basin Finan. J. 2014, 26, 227–243. [Google Scholar] [CrossRef]
- Stein, L.C.D.; Stone, E. The Effect of Uncertainty on Investment, Hiring and R&D: Causal Evidence from Equity Options. SSRN Work. Pap. 2013. [Google Scholar] [CrossRef] [Green Version]
- Zhang, Q.X.; Feng, L. Macroeconomic Policy Uncertainty and Corporate Technological Innovation: Evidence from China’s Listed Companies. Mod. Econ. Sci. 2018, 40, 48–57. [Google Scholar]
- Jin, G.H.; Liu, Z.Y.; Hua, G.R. Policy Uncertainty and Corporate Investment: An Empirical Study on Strategic and Emerging Industry. Manag. Rev. 2016, 28, 3–16. [Google Scholar]
- Zhang, H.; Jiang, M.X.; Peng, B.Y. Economic Policy Uncertainty and Firm Exit Decisions: Theoretical and Empirical Analysis. J. Finan. Econ. 2018, 44, 116–129. [Google Scholar]
- Huang, N.; Guo, P. The Impact of Economic Policy Uncertainty on Macroeconomy and Its Regional Difference—Evidence from China with the Panel VAR Model. Finan. Econ. 2015, 6, 61–70. [Google Scholar]
- Sun, W.K.; Xiao, G.; Yang, X.K. Impact of Return on Capital on Investment Rate: A Comparative Study of China, the United States and Japan. J. World Econ. 2010, 33, 3–24. [Google Scholar]
- Zhang, Q.C.; Yang, D.C. Government Motivation or Capital Return Inducing—Empirical Analysis on Determinants of Regional Investment Behavior. J. Shanxi Univ. Finan. Econ. 2018, 40, 1–14. [Google Scholar]
- Huang, X.H.; Yang, J.; Xiao, M.Y. Capital Deepening, Technological Progress and Return on Capital: Based on U.S. Empirical Analysis. J. World Econ. 2012, 35, 3–20. [Google Scholar]
- Bai, Z.E.; Zhang, Q. Analysis of return on capital and its influencing factors in China. J. World Econ. 2014, 37, 3–30. [Google Scholar]
- Demir, F. Financialization and Manufacturing Firm Profitability under Uncertainty and Macroeconomic Volatility: Evidence from an Emerging Market. Rev. Dev. Econ. 2010, 13, 592–609. [Google Scholar] [CrossRef]
- Gao, Y.H.; Wan, D.F.; Cai, D. Can Government’s R&D Subsidies Play a Signal Transfer Role? Evidence from China’s High-Tech Industry. Sci. Manag. S.&T. 2012, 33, 5–11. [Google Scholar]
- Holtz-Eakin, D.W.N.; Rose, H.S. Estimating Vector Autoregressions with Panel Data. Econometrica 1988, 56, 1371–1395. [Google Scholar] [CrossRef]
- Love, I.; Zicchino, L. Financial Development and Dynamic Investment Behavior: Evidence from Panel VAR. Q. Rev. Econ. Finan. 2006, 2, 190–210. [Google Scholar] [CrossRef]
- Abrigo, M.R.M.; Love, I. Estimation of Panel Vector Autoregression in Stata: A Package of Programs. Work. Pap. 2016, 16, 778–804. [Google Scholar]
- Li, P.G.; Xiao, K. CEO tenure and firm capital investment. J. Finan. Res. 2012, 2, 127–141. [Google Scholar]
Figure 1.
Chinese economic policy uncertainty index.

Figure 2.
Number of sample companies in the three regions.

Figure 3.
Panel autoregressive (AR) root test of the full sample.

Figure 4.
Impulse response impact diagram of the whole sample.

Figure 5.
Panel AR root inspection in three regions.

Figure 6.
Impulse response impact figure of three regions.


Table 1.
Descriptions and calculation methods of variables.
| Variables | Description | Calculation Method |
|---|---|---|
| EPU | Economic policy uncertainty index | First-order difference arithmetic mean of the three months in the current quarter |
| INV | Enterprise investment level | (Cash paid for acquisition and construction of fixed assets, intangible assets, and other long-term assets – Net cash recovered from disposal of fixed assets, intangible assets, and other long-term assets)/Total assets |
| ROA | Enterprise profitability/return on assets | (Earnings before interest and taxes (EBIT)/Average total assets at the beginning and end of the period) × 100% |
Table 2.
Descriptive statistics of the whole sample and variables in the three regions.
| Variables | Whole Sample | Eastern Region | ||||||||
| Mean | Sd | p25 | p50 | p75 | Mean | Sd | p25 | p50 | p75 | |
| INV | 0.03 | 0.04 | 0.00 | 0.01 | 0.03 | 0.02 | 0.04 | 0.00 | 0.01 | 0.03 |
| ROA | 1.81 | 4.18 | 0.22 | 1.22 | 3.21 | 1.98 | 3.98 | 0.29 | 1.31 | 3.30 |
| Variables | CentralRegion | Western Region | ||||||||
| Mean | Sd | p25 | p50 | p75 | Mean | Sd | p25 | p50 | p75 | |
| INV | 0.03 | 0.04 | 0.00 | 0.01 | 0.04 | 0.03 | 0.05 | 0.00 | 0.01 | 0.04 |
| ROA | 1.62 | 4.32 | 0.17 | 1.15 | 3.15 | 1.57 | 4.56 | 0.10 | 1.07 | 2.96 |
Table 3.
Stationarity test of variables.
| Variables | LLC Test | IPS Test | HT Test | ADF−Fisher Test | ADF Test | Stationarity |
|---|---|---|---|---|---|---|
| whole sample | ||||||
| INV | −41.626 *** (0.000) | −55.663 *** (0.000) | 0.382 *** (0.000) | 1198.121 *** (0.000) | stationary | |
| ROA | −85.770 *** (0.000) | −79.926 *** (0.000) | 0.279 *** (0.000) | 1312.794 *** (0.000) | stationary | |
| EPU | −8.060 *** (0.000) | stationary |
Notes: The original hypothesis of the test methods is the existence of a unit root; *** indicate significance at the 1% levels.
Table 4.
Information criteria of the whole sample.
| Lag | CD | J | J p-Value | MBIC | MAIC | MQIC |
|---|---|---|---|---|---|---|
| 1 | 0.334 | 3921.117 | 0 | 3207.25 | 3777.117 | 3590.777 |
| 2 | 0.229 | 1815.578 | 0 | 1190.945 | 1689.578 | 1526.530 |
| 3 | 0.309 | 1082.917 | 2.2 × 10−191 | 547.517 | 974.917 | 835.1619 |
| 4 | 0.013 | 558.559 | 9.07 × 10−90 | 112.392 | 468.559 | 352.096 |
| 5 | −17.956 | 336.869 | 1.56 × 10−50 | −20.065 | 264.869 | 171.698 |
| 6 | 0.180 | 204.865 | 2.93 × 10⁻²⁹ | −62.835 | 150.865 | 80.987 |
| 7 | 0.662 | 200.325 | 8.63 × 10⁻³³ | 21.858 | 164.325 | 117.740 |
| 8 | 0.687 | 93.756 | 2.86 × 10⁻¹⁶ | 4.523 | 75.756 | 52.464 |
Table 5.
Granger causality test results of the whole sample.
| Equation | Excluded | Whole Sample Chi2 | df | Prob > Chi2 |
|---|---|---|---|---|
| EPU | INV | 803.511 | 6 | 0.000 |
| ROA | 368.096 | 6 | 0.000 | |
| ALL | 1401.466 | 12 | 0.000 | |
| INV | EPU | 262.763 | 6 | 0.000 |
| ROA | 110.332 | 6 | 0.000 | |
| ALL | 415.583 | 12 | 0.000 | |
| ROA | EPU | 282.085 | 6 | 0.000 |
| INV | 132.715 | 6 | 0.000 | |
| ALL | 520.959 | 12 | 0.000 |
Table 6.
PVAR model estimation results of the whole sample.
| EPUt | INVt | ROAt | |
|---|---|---|---|
| EPUt-1 | −0.141 *** (0.010) | −0.000 *** (0.000) | −0.002 *** (0.000) |
| EPUt-2 | 0.066 *** (0.009) | −0.000 *** (0.000) | −0.003 *** (0.000) |
| EPUt-3 | −0.140 (0.009) | 0.000 *** (0.000) | 0.002 *** (0.000) |
| EPUt-4 | −0.242 *** (0.010) | 0.000 (0.000) | −0.000 (0.000) |
| EPUt-5 | −0.485 *** (0.010) | −0.000 *** (0.000) | 0.001 (0.000) |
| EPUt-6 | −0.168 *** (0.015) | −0.000 *** (0.000) | −0.005 *** (0.001) |
| INVt-1 | −73.947 ** (18.966) | 0.477 *** (0.019) | −3.380 *** (1.210) |
| INVt-2 | −252.256 *** (18.337) | 0.043 *** (0.016) | −2.472 ** (1.166) |
| INVt-3 | −122.419 *** (18.473) | −0.013 (0.013) | 1.786 (1.285) |
| INVt-4 | −14.703 (16.933) | 0.410 *** (0.013) | 7.489 *** (1.211) |
| INVt-5 | 9.948 (14.275) | −0.175 *** (0.012) | −3.838 *** (1.134) |
| INVt-6 | −245.072 *** (14.114) | −0.037 ** (0.011) | −3.051 *** (0.941) |
| ROAt-1 | −0.619 *** (0.147) | −0.000 (0.000) | 0.283 *** (0.013) |
| ROAt-2 | −2.071 *** (0.151) | −0.000 (0.000) | 0.065 *** (0.010) |
| ROAt-3 | −0.650 *** (0.161) | 0.000 (0.000) | 0.105 *** (0.011) |
| ROAt-4 | 0.238 (0.152) | 0.000 *** (0.000) | 0.164 *** (0.013) |
| ROAt-5 | −0.229 * (0.137) | −0.000 * (0.000) | 0.036 *** (0.010) |
| ROAt-6 | −1.519 *** (0.146) | −0.000 *** (0.000) | −0.073 *** (0.009) |
Notes: The original hypothesis of the test methods is the existence of a unit root; ***, **, and * indicate significance at the 1%, 5%, and 10% levels, respectively.
Table 7.
Variance decomposition results for the whole sample.
| Impacted Variable | Number of Periods | Impact Variables of National Regional | ||
|---|---|---|---|---|
| EPU | INV | ROA | ||
| EPU | 1 | 1 | 0 | 0 |
| 2 | 0.9980 | 0.0010 | 0.0010 | |
| 6 | 0.9683 | 0.0195 | 0.0121 | |
| 12 | 0.9547 | 0.0293 | 0.0160 | |
| 16 | 0.9546 | 0.0295 | 0.0159 | |
| 20 | 0.9556 | 0.0289 | 0.0155 | |
| INV | 1 | 0.0004 | 0.9996 | 0 |
| 2 | 0.0011 | 0.9989 | 0.0000 | |
| 6 | 0.0040 | 0.9859 | 0.0100 | |
| 12 | 0.0165 | 0.9664 | 0.0171 | |
| 16 | 0.0170 | 0.9630 | 0.0200 | |
| 20 | 0.0177 | 0.9614 | 0.0209 | |
| ROA | 1 | 0.0004 | 0.0063 | 0.9933 |
| 2 | 0.0012 | 0.0059 | 0.9930 | |
| 6 | 0.0045 | 0.0105 | 0.9850 | |
| 12 | 0.0111 | 0.0137 | 0.9752 | |
| 16 | 0.0112 | 0.0145 | 0.9746 | |
| 20 | 0.0114 | 0.0148 | 0.9739 | |
Table 8.
Stationary test of variables.
| Variables | LLC Test | IPS Test | HT Test | ADF–Fisher Test | ADF Test | Stationarity |
|---|---|---|---|---|---|---|
| Eastern Region | ||||||
| INV | −41.626 *** (0.000) | −55.663 *** (0.000) | 0.382 *** (0.000) | 1198.121 *** (0.000) | Stationary | |
| ROA | −85.770 *** (0.000) | −79.926 *** (0.000) | 0.279 *** (0.000) | 1312.794 *** (0.000) | Stationary | |
| Central region | ||||||
| INV | −41.626 *** (0.000) | −55.663 *** (0.000) | 0.382 *** (0.000) | 1198.121 *** (0.000) | Stationary | |
| ROA | −85.770 *** (0.000) | −79.926 *** (0.000) | 0.279 *** (0.000) | 1312.794 *** (0.000) | Stationary | |
| Western Region | ||||||
| INV | −41.626 *** (0.000) | −55.663 *** (0.000) | 0.382 *** (0.000) | 1198.121 *** (0.000) | Stationary | |
| ROA | −85.770 *** (0.000) | −79.926 *** (0.000) | 0.279 *** (0.000) | 1312.794 *** (0.000) | Stationary | |
| EPU | −8.060 *** (0.000) | Stationary |
Notes: The original hypothesis of the test methods is the existence of a unit root; *** indicate significance at the 1% levels.
Table 9.
Variance decomposition results of the three regions.
| Impact Variable | Number of Periods | Eastern Region Impact Variable | Central Region Impact Variable | Western Region Impact Variable | ||||||
|---|---|---|---|---|---|---|---|---|---|---|
| EPU | INV | ROA | EPU | INV | ROA | EPU | INV | ROA | ||
| EPU | 1 | 1 | 0 | 0 | 1 | 0 | 0 | 1 | 0 | 0 |
| 2 | 0.9974 | 0.0006 | 0.0019 | 0.9973 | 0.0025 | 0.0003 | 0.9984 | 0.0011 | 0.0006 | |
| 6 | 0.9658 | 0.0149 | 0.0193 | 0.9609 | 0.0329 | 0.0062 | 0.9722 | 0.0199 | 0.0079 | |
| 12 | 0.9536 | 0.0219 | 0.0246 | 0.9451 | 0.0467 | 0.0082 | 0.9562 | 0.0321 | 0.0117 | |
| 16 | 0.9535 | 0.0219 | 0.0247 | 0.9441 | 0.0478 | 0.0080 | 0.9558 | 0.0327 | 0.0116 | |
| 20 | 0.9543 | 0.0215 | 0.0242 | 0.9452 | 0.0469 | 0.0079 | 0.9569 | 0.0319 | 0.0112 | |
| INV | 1 | 0.0003 | 0.9997 | 0 | 0.0002 | 0.9998 | 0 | 0.0008 | 0.9992 | 0 |
| 2 | 0.0018 | 0.9981 | 0.0001 | 0.0004 | 0.9995 | 0.0001 | 0.0010 | 0.9990 | 0.0001 | |
| 6 | 0.0047 | 0.9854 | 0.0099 | 0.0042 | 0.9840 | 0.0118 | 0.0039 | 0.9857 | 0.0104 | |
| 12 | 0.0194 | 0.9625 | 0.0181 | 0.0205 | 0.9595 | 0.0200 | 0.0110 | 0.9745 | 0.0146 | |
| 16 | 0.0203 | 0.9583 | 0.0214 | 0.0210 | 0.9558 | 0.0232 | 0.0110 | 0.9726 | 0.0163 | |
| 20 | 0.0213 | 0.9565 | 0.0221 | 0.0220 | 0.9538 | 0.0243 | 0.0113 | 0.9717 | 0.0170 | |
| ROA | 1 | 0.0004 | 0.0048 | 0.9948 | 0.0002 | 0.0104 | 0.9894 | 0.0006 | 0.0054 | 0.9940 |
| 2 | 0.0011 | 0.0045 | 0.9945 | 0.0015 | 0.0095 | 0.9889 | 0.0012 | 0.0053 | 0.9935 | |
| 6 | 0.0060 | 0.0083 | 0.9857 | 0.0032 | 0.0144 | 0.9824 | 0.0046 | 0.0133 | 0.9821 | |
| 12 | 0.0156 | 0.0114 | 0.9730 | 0.0072 | 0.0172 | 0.9756 | 0.0088 | 0.0170 | 0.9742 | |
| 16 | 0.0157 | 0.0122 | 0.9721 | 0.0073 | 0.0181 | 0.9746 | 0.0089 | 0.0177 | 0.9734 | |
| 20 | 0.0159 | 0.0124 | 0.9716 | 0.0074 | 0.0184 | 0.9742 | 0.0090 | 0.0179 | 0.9731 | |
© 2020 by the authors. Licensee MDPI, Basel, Switzerland. This article is an open access article distributed under the terms and conditions of the Creative Commons Attribution (CC BY) license (http://creativecommons.org/licenses/by/4.0/).
Share and Cite
MDPI and ACS Style
Guo, A.; Wei, H.; Zhong, F.; Liu, S.; Huang, C. Enterprise Sustainability: Economic Policy Uncertainty, Enterprise Investment, and Profitability. Sustainability 2020, 12, 3735. https://doi.org/10.3390/su12093735
AMA Style
Guo A, Wei H, Zhong F, Liu S, Huang C. Enterprise Sustainability: Economic Policy Uncertainty, Enterprise Investment, and Profitability. Sustainability. 2020; 12(9):3735. https://doi.org/10.3390/su12093735
Chicago/Turabian StyleGuo, Aijun, Haiqi Wei, Fanglei Zhong, Shuangshuang Liu, and Chunlin Huang. 2020. "Enterprise Sustainability: Economic Policy Uncertainty, Enterprise Investment, and Profitability" Sustainability 12, no. 9: 3735. https://doi.org/10.3390/su12093735
Note that from the first issue of 2016, this journal uses article numbers instead of page numbers. See further details here.