Green Building, Cost of Equity Capital and Corporate Governance: Evidence from US Real Estate Investment Trusts

Institute of International Management, National Cheng Kung University, Tainan City 701, Taiwan
*
Author to whom correspondence should be addressed.
Sustainability 2020, 12(9), 3680; https://doi.org/10.3390/su12093680
Submission received: 5 April 2020
/
Revised: 29 April 2020
/
Accepted: 30 April 2020
/
Published: 2 May 2020
(This article belongs to the Section Economic and Business Aspects of Sustainability)
Abstract
:Distinct from the existing literature, which mainly focuses on the impacts of green building practices on the owners’ benefits, this paper examines capital market participants’ perceptions of green building, specifically, the cost of equity capital. The study uses data regarding the United States Real Estate Investment Trusts (US REITs) from 2000 to 2016, employing a panel regression analysis and adopting a Price Earnings Growth (PEG) ratio model for the cost of equity capital estimation. We find a negative relationship between green building certification and the cost of equity capital. Our results encourage REITs to participate in green building certification and aim for higher green building rankings. In addition, we examine whether corporate governance could affect the intensity of green building practices in REITs. It is found that corporate governance practices implemented to align shareholders’ and managers’ interests, such as higher institutional holdings and a less dispersed ownership structure, positively impact firms’ resource allocation for green initiatives. The results suggest there could be mutual benefits for both economic profits and sustainable buildings.
1. Introduction
The pursuit of rapid economic growth has made people focus merely on economic profits, and neglect what may have thereby been sacrificed, for decades or even centuries. This has led to several severe consequences, such as environmental pollution, climate change, biodiversity loss, etc. The continually worsening situation has raised people’s awareness of how their activities can affect their surroundings and urged us to find innovative practices that could mutually benefit economic growth and environmental sustainability. This social phenomenon has led to the popularity of corporate social responsibility (CSR) in recent years. The concept of CSR is based on the assumption that social, environmental and economic perspectives should all be considered in the business operation process by stakeholders when coming up with investment decisions [1,2]. Thus, it can simply be defined as strategies that firms use to conduct their business in an ethical and society-friendly way.
The sustainability revolution is also occurring in the real estate sector. This paper specifically focuses on “green building” as the application of CSR in the environmental dimension. In fact, the CSR practices in real estate may play the most critical role in sustainable transformation, because building and construction comprise the world’s largest consumer of energy and producer of carbon dioxide (CO2) emissions (accounting for 36% of global final energy use and 39% of energy-related CO2 emissions) [3]. Hence, progress towards green buildings and construction is essential to sustainable transformation and has grown significantly and rapidly over the past 10 years, with the aim of supporting public health and well-being, as well as the economy and the environment [4]. As a result, it is believed that there will be a new wave of investment in the real estate sector in which sustainable building will be set as a top priority.
The increased environmental awareness in the real estate industry has created a demand for the growth of voluntary certification systems such as Leadership in Energy and Environmental Design (LEED), Energy Stars, etc. These rating agencies have been initiated by government organizations, aiming to assess the degree of environmental friendliness and energy efficiency of construction, so as to quantify the standard of building sustainability. This study focuses on LEED green certification because it is considered the most widely used green building rating system in the world. LEED was developed by the US Green Building Council (USGBC), and its certification has been evaluated as an internationally recognized symbol of sustainability achievements.
Besides the several major contributions green building makes to the environment, there is a growing concern about whether or not these certified buildings affect financial performance positively. Most of the previous studies have focused on how greenness affects the properties’ values. Green buildings have been found to generate higher premium rental rates and higher occupancy rates [5,6], longer economic lives [7], and higher profits for investors and developers [8]. Moreover, previous studies have found that real estate firms and Real Estate Investment Trusts (REITs) with green certification have higher stock returns [9] and lower operating expenditure [10]. Despite extensive research on this topic, the previous studies have mainly focused on the profits of the green building owners, e.g., on the accounting and market-based financial performance. So far, there is an absence of research examining capital market participants’ perceptions of green building, e.g., the cost of equity capital.
The cost of equity capital is defined as the return a company requires, in order to determine that an investment meets its capital return requirements, representing the compensation the market demands in exchange for owning the asset and bearing the risk of ownership. As a result, this indicator performs an important role in affecting corporate investment and financing decisions and is one of the substantial determinants of film value. Shleifer and Vishny [11] suggested that a lower cost of equity capital means that the savings can be retained or used in other investments. Accordingly, firms prefer a lower cost of equity. This research aims to provide an overview of how financial performance reacts to green building practices through the channel of the cost of equity capital.
Another question that we intend to answer in this research is whether there is a relation between corporate governance and the green building intensity of REITs. At present, there is still little understanding of the circumstances under which firms are more likely to invest resources in sustainable goals [12]. Since outside shareholders have difficulty evaluating the profitability of green infrastructure projects, managerial discretion is more likely to be responsible for such investment decisions. Managerial discretion is an important element of the corporate governance mechanism, and it has been suggested that better corporate governance results in higher firm valuation and performance [13,14,15], stock returns [16], and stock market liquidity [17]. Therefore, it is likely that the corporate governance mechanism could affect the green building practice intensity of REITs.
The ownership structure is one of the most important elements of the governance mechanism, as it can have an enormous impact on the incentives of managers, thereby affecting the efficiency of the firm [18]. It is assumed that firms’ strategies are conducted based on the motivations and benefits of the parties involved in formulating and making decisions in the firms. Meanwhile, the ownership structure is defined by the distribution of equity with regard to votes and capital, but also by the identity of the equity owners. Therefore, it would be interesting and significant to examine whether the ownership structure is the driving force behind the green building practice intensity of REITs. This research will focus on two proxies for ownership structure, namely, institutional holdings, and ownership concentration.
In short, through analyzing the United States Real Estate Investment Trusts (US REITs) in the period between 2000 and 2016, we conduct empirical studies to determine, firstly, whether or not green building practices can help improve the financial performance of REITs in terms of cost of equity, and secondly the relationship between corporate governance and green building implementation intensity. Our results do not merely fill the research gap in identifying the attributes that characterize green building in REITs, and their financial performance from the perspectives of capital market participants, providing beneficial implications for REIT investors, but also, and more importantly, should encourage green building practices due to the finding of mutual benefits in terms of economic profits.
The remainder of this research is organized as follows. Section 2 provides a review of the theory and literature in relation to green building implementation, cost of equity, and corporate governance. Section 3 discusses the methodology, including the selection of the sample, calculation of the variables, and formation of the regression equations. Section 4 presents the research results, and Section 5 concludes.
2. Literature Review
2.1. Green Building Implementation and Cost of Equity Capital
Green buildings are considered a part of the CSR strategy. Research into the impacts of green practices on financial performance can also be based on prior studies of the causal relationship between CSR and financial performance in terms of direct relationships, CSR is assumed to increase the expenditure of firms, while the benefits cannot be seen clearly in the financial statements. Despite the ongoing debate on CSR engagement, most studies have agreed that it has a positive relationship with financial performance [19,20], meaning that the more actively firms are involved in CSR activities, the better financial returns they can achieve. According to Renneboog et al. [21] and Chiang et al. [22], CSR activities could bring positive growth in long-term stock performance and other investment opportunities.
Much of the literature provides evidence that analysts and investors consider environmental performance when making investment decisions or analyses [23,24,25]. Firms with superior environmental performance can easily draw attention from consumers who take social outcomes into consideration, resulting in better support, and thus, better financial performance [19]. In financial literature, the definition of the cost of equity capital is the return that a firm pays its equity investors to compensate them for the risk they undertake by investing in the firm. Hence, the relationship between environmental performance and the cost of equity capital is affected, to some extent, by the risk perceived by the investors. In the context of the current market, under which consumers have a high level of social awareness, any social or environmental activities committed by firms enhance their public image [26], influencing the perceived risk profile of the firms in the capital markets [27] and thereby leading to a lower expected return and lower cost of equity capital accordingly. Another analytical study came up with the same result, supporting the idea that investors would presume there to be a lower risk, and therefore, accept a lower return on their investment in firms with better environmental performance [28]. Moreover, Reverte [29], El Ghoul et al. [30], and Goss and Roberts [23], focusing on the impact of CSR on the cost of equity capital, provided evidence that firms’ environmental performance could enhance firm value by reducing the cost of capital.
In recent years, an increasing number of studies on green building have been carried out. It has been found that green building certification leads to better financial performance and a higher future value of the property [9]. This is based on a positive relationship between green building certification and the occupancy rate of the building, rental prices, revenue values [31,32,33,34,35]. Given their lower energy consumption compared to ordinary buildings, green buildings will incur lower operational expenditure. Therefore, the REITs operating them should also incur lower operational expenditure [8].
An and Pivo [34] showed that loans on green buildings have slightly better terms than loans on non-green buildings and, more importantly, loans on sustainable buildings also carry less default risk. Moreover, it has been proven that there is, on average, a 6.6% higher return on investment (ROI) on LEED-certified buildings than on non-certified buildings [35]. In addition, it has been suggested that green portfolios are capable of generating higher returns than non-green portfolios and even did so in the crisis period between 2007 and 2009 [7].
This study specifically focuses on instrumental stakeholder theory, which implies that achieving stakeholder expectations may result in several competitive advantages, such as a good reputation, long-term relationships, or higher market value [36]. In this case, green building certification is a confirmation of REITs’ environmental performance, which has become a stakeholder demand under the current circumstances. Therefore, green building certification may result in long-term financial benefits for REITs. Given the prior research and theory, this study puts forward the following research hypotheses for testing:
Hypothesis 1 (H1):
LEED green building certification has a significant negative effect on REITs’ cost of equity capital.
2.2. Corporate Governance and Green Building Practice Intensity
Several theoretical academic works have found evidence that corporate governance could affect firms’ decision to go green. According to stakeholder theory, it shows that sustainable properties follow a “win–win” model, as green infrastructure not only provides value to the property’s owners but also makes a huge contribution to the community [37]. As a result, if green buildings can bring considerable benefits to firms, shareholders should promote corporate governance practices that strongly encourage managers to invest in them. In addition, the over-investment hypothesis, based on the agency theory of Jensen and Meckling [18], argues that an effective firm governance mechanism helps reduce the probability of over-investment by managers via the channel of CSR activities. Moreover, Cespa and Ceston [38] proposed a theoretical model regarding conflict of interest, claiming that firms engaging in CSR activities are not only able to increase profits but also be ethical and socially supportive. Consequently, if CSR can help increase a firm’s value, corporate governance should guide firms to get involved in CSR activities. In other words, it is expected that there should be a positive relation between corporate governance and CSR intensity.
In order to provide a better understanding of how the corporate governance mechanism can be linked to green building implementation intensity, this study empirically tests two previously examined proxies representing the corporate governance system, institutional ownership, and ownership concentration.
The ownership structure is considered a key element of the governance system, as it can affect how managers exhibit their control rights over the firm’s strategic decisions and, hence, impact on a firm’s operating efficiency. For example, the “convergence of interests” hypothesis of Jensen [39] suggests that managerial ownership helps align the interests of shareholders and managers. Accordingly, managers will have more motivation to make good decisions to improve firm value. Furthermore, it is argued that, when firms’ outstanding shares are overly dispersed across many individuals, minor shareholders, and institutions, and none of them hold substantial portions, they will have less motivation to put time and effort into controlling and evaluating managerial decisions [40]. The situation could change when ownership is more concentrated. Investors with large holdings, such as institutions, can manage to exercise control over the managers. Such shareholders have the potential to force managers to do what they want through two typical channels, namely trading their shares and voicing their disapproval. As a result, the ownership structure can be used to capture corporate governance effectively.
Increased institutional holdings and the concentration of institutional ownership reflects the growing dominance of this group in the capital market. Given their significant number of shares, they are capable of taking aggressive action, either directly or indirectly, to influence managerial discretion. Thus, they have more incentive to exert their monitoring ability in the governance mechanism. In addition, institutions are believed to be prudent investors due to their information-seeking ability. Thus, their direction of firm management can be thought to make sense. Earlier research has suggested a positive association between institutional ownership and firms’ corporate governance quality [41,42,43,44], meaning that higher institutional holdings imply a better corporate governance mechanism. Consequently, this study supports the idea that high institutional holdings are positively associated with a firm’s green building practice intensity.
Ownership concentration refers to the amount of stocks held by individual or large block shareholders who own at least 5% of the equity of a firm. A concentrated ownership structure implies a “convergence of interests” or “alignment effect”. Hence, a more concentrated ownership structure is supposed to align the incentives of owners and firms well, reducing management inefficiency and representing a better governance quality [45]. Following the alignment effect, less dispersed ownership leads to higher congruities in stakeholders’ interests, thus resulting in a more efficient governance mechanism. Thus, ownership concentration might comply with the alignment effect, representing better governance quality for REITs.
In a nutshell, regarding the relationship between the governance mechanism and green building implementation intensity, the levels of institutional ownership and ownership concentration can express the quality of corporate governance practices in terms of interest alignment. Therefore, this study posits the following hypothesis:
Hypothesis 2 (H2):
Corporate governance practice is significantly associated with REITs’ green building implementation intensity.
3. Methodology
3.1. Data
Green building certification data are obtained from the LEED official website, which provides the name of the building, type of building, and the score for its greenness level. For each building, we classify the REITs to which that building belongs. We first collect the list of buildings from each REIT annual report and match those buildings with the buildings from the LEED website to classify the buildings’ greenness levels. Finally, these data are used to calculate greenness scores at the REIT level.
All financial data, such as return on assets, total assets, market-to-book ratio, leverage, and others, were obtained through Datastream, along with the forecasted earnings per share and stock price needed to compute the cost of equity capital. Institutional ownership and the concentration ownership Herfindahl–Hirschman Index (HHI) were collected from Thomson Reuters institutional data. While the LEED program was initiated in 1998, the sample from its early stages is very limited, and thus, most of the existing literature starts the analysis from the 2000s. We follow Eichholtz et al. [10] who started their sample in 2000 and study the period from 2000 to 2016 in the US. The final sample consists of 107 US REITs with 1011 firm-year observations.
3.2. Variables
3.2.1. Cost of Equity Capital (CC)
It is suggested that the cost of equity capital represents the rate of return regarding the market’s perception of a firm’s riskiness [30], which means that, when the market sees a firm or portfolio as risky, a higher return will be expected. In contrast, when the market believes that a firm is doing well and has a lower risk, the return is expected to decrease, and there will be a lower cost of equity capital for the firm. We use the Price Earnings Growth (PEG) ratio method [46] to estimate the cost of equity capital since this method is applied in most of the prior studies and is proven to be consistent and risk-related to the cost of equity capital estimation [19,29,30,47]. The model adopted requires two years of forecasting [29,48,49]:
where epsi,t+2 is the two-year forecast of earnings per share, epsi,t+1 is the one-year forecast of earnings per share, and P0,i is the current stock price of the REIT.
3.2.2. Greenness Score
In order to identify the level of green building implementation intensity in the REITs, we create several proxies, denoted by G1, G2, G3, and GB. The greenness score measurements, G1, G2, and G3, were presented and developed by Eichholtz et al. [10]. The first variable, G1, refers to the percentage of buildings that are certified relative to the total number of buildings owned by REITi in year t. We utilize information from REITs’ annual reports to calculate the percentage of buildings certified by the LEED system:
The second measurement, G2, refers to the percentage of square feet of certified buildings to the total square feet of buildings owned by REITi in year t. Again, we use information from the REITs’ annual reports and the LEED certification. This variable gives a more detailed “greenness score”, than G1:
The third proxy, G3, uses the scores assigned by the LEED system to calculate the average greenness score over all the buildings owned by a REIT. The LEED assessment releases scores for properties based on six criteria: Sustainable sites, water efficiency, energy and atmosphere, materials and resources, indoor environmental quality, and innovation. The scores range from 40 to 100 points and lead to four certification types: Certified, silver, gold, and platinum. We utilize the LEED scores for properties, published on the official LEED website, to calculate the average LEED score for each REIT, according to the following formula:
Finally, to identify the LEED green building certification engagement of the REIT, GB is created as a dummy variable. It equals 1 if REITi has adopted at least one LEED certification in year t or 0 otherwise:
3.2.3. Institutional Ownership (IO) and Ownership Concentration (HHI)
Institutional ownership refers to the fraction of shares owned by large institutions such as mutual funds, pension funds, insurance companies, investment firms, and endowments. Ownership concentration refers to the amount of stock owned by large block shareholders that hold at least 5% of the equity of the firm. This paper uses the best known measure of ownership concentration, the Herfindahl–Hirschman Index or HHI [50]. The HHI is calculated as the sum of the squares of the ownership percentages of all equity holders that are greater than or equal to 5%. A larger value for this index indicates a higher level of concentration and the presence of fewer shareholders in the firm’s ownership structure and vice versa. HHI ranges from 0 to 1, according to the following formula:
where si is the ownership percentage of investor i, who owns at least 5% of the firm’s equity, n is the number of investors who own at least 5% of the firm’s equity.
3.2.4. Control Variables
In order to ensure that the green building certification affects the cost of equity capital as well as capturing the effect of corporate governance practices on the greenness score, the REIT’s return on assets (ROA) is controlled for the firm’s performance. ROA is calculated as the ratio of net income to total assets in a particular year, aimed at measuring the firm’s performance efficiency based on accounting data. This indicator is important since a higher return on the firm is perceived to mean a lower risk of investment. Thus, the shareholders would expect a lower cost of equity capital [51,52]. Therefore, it is expected that the ROA will have a negative relationship with the cost of equity capital. Besides this, firms with better financial performance are more likely to engage in CSR activities [53]. Accordingly, a higher value of ROA is expected to lead to a higher level of green building engagement.
Firm size is calculated by taking the natural log of a firm’s total assets. It is expected to have a negative relationship with the cost of equity capital as a larger firm is likely to be more able to generate a cash inflow, and thus perceived to be less risky [29]. Therefore, the investors would expect a lower return from a larger firm. In addition, larger firms can attract wider media attention and have broader analyst coverage, potentially reducing information asymmetry and resulting in a lower cost of equity capital [19,30,54]. On the other hand, evidence from previous studies on CSR suggests that small firms face several barriers to taking responsible actions, such as light pressure from the public and financial constraints. Hence, it is predicted that there will be a positive association between firm size and the intensity of green building practices.
Leverage is calculated by dividing total liabilities by total assets. When firms have higher leverage, there is a larger responsibility to pay off the debt, and the firm is exposed to higher risk leading the investors to expect a higher return on their investment [19,55,56]. At the same time, the leverage structure may influence investment choices because managerial opportunism may happen more easily when firms have a lot of cash in place [57]. Theoretically, obligations related to debt may help discourage potential over-investment. Agency theory predicts a positive association between leverage and CSR activities [58].
The market-to-book ratio is used to check the truthfulness of the stock price, that is, whether the stock is at the right price, overvalued, or undervalued. The ratio is calculated by dividing the market value by the equity book value. A value greater than 1 would refer to an overvalued condition, in which the actual value of the firm was lower than the stock price in the market, and vice versa. The market-to-book value is predicted to have a negative relation with the cost of equity capital [29]. In addition, as with ROA, a positive association would be expected between this ratio and green building practice intensity.
Beta represents the firm risk or the volatility of investment compared to the market. Its value is obtained from a regression of the firm’s excess stock return on the corresponding index excess return over 36 months, where the excess return is the monthly return minus the risk-free investment (one-month Treasury bill rate). The firm’s cost of equity, considered to be the expected return, is predicted to have a positive relationship with beta since higher firm risk should lead to a higher expected return [59]. Moreover, risk should be a barrier to investment for a firm. Thus, it is assumed that beta has a negative impact on green building engagement.
Return variability represents the volatility of the stock price return. This indicator is calculated from the annual standard deviation of the daily stock price return [47]. It is expected to have a positive relationship with the cost of equity capital and a negative association with sustainable building engagement since return variability acts similarly to beta [19]. The difference is that beta shows the volatility of firms related to the market condition, while return variability shows the volatility of the stock price itself. Therefore, it is seen as the risk of the firm, where a higher value of return variability represents a more volatile stock price.
Interest coverage refers to a firm’s ability to pay its interest expenses on outstanding debt, calculated by dividing the firm’s earnings before interest and taxes by the firm’s interest expenses. Including the interest coverage ratio as a control variable provides us with a better understanding of a firm’s financial status related to corporate riskiness and investment.
3.3. Empirical Model Specification
The paper is constructed of two main parts. First, we will examine the effect of LEED green building certification ownership on the cost of equity capital. The first model is as follows:
The second model investigates the relationship between ownership structure (as a proxy for corporate governance) and green building implementation intensity:
where CC is the cost of equity capital, Greenness scores stands for G1, G2, G3, and GB, IO is the institutional ownership, HHI stands for ownership concentration, ROA represents return on assets Size measures the REIT’s size, LEV stands for leverage, MBR is the market-to-book ratio, BETA represents the firm beta, RETVAR measures the return variability, and INT is interest coverage.
4. Empirical Results and Analysis
4.1. Descriptive Statistics Analysis
In Table 1, the greenness scores G1, G2, and G3 have mean values of 1.31%, 1.96%, and 0.79%, respectively. This means that only 1.31% of US REITs’ properties are green-certified infrastructures, and only 1.96% of the total building area is certified by LEED assessment. The average “greenness” score given by LEED across all properties of US REITs is 0.79%. The average value of the cost of equity capital (CC) is 11.79%. The independent variables for ownership have mean values of 0.77 and 0.07, for institutional ownership and ownership concentration, respectively. These imply that, on average, 77% of US REITs’ shares are held by institutions, while their ownership concentration is 7%. The latter value is relatively low, which is consistent with previous findings of an inverse association between ownership concentration and quality of legislation.
ROA is the ratio of net income to total assets, and the average value of this variable is 1.85%. This number is low because REITs consist of properties and other tangible assets, making their total asset value very high. In terms of leverage, the mean value of this variable is 53.09%. Since leverage is the ratio of total liabilities to total assets, it implies that the capital sources of REITs are well balanced between debt and equity. The mean value of the market-to-book ratio is 2.3, which implies that, in general, REITs are overvalued, or stocks are traded at a premium. The average beta value is 1.03, which indicates that these US REITs’ risk is similar to those of the market. In terms of return variability, the maximum value is 69.32%, which means that some REITs’ returns are very volatile. The minimum is only 2.23%, and the average only 7.58%, which can be considered less volatile. The interest coverage ratio has a mean value of 2.66.
4.2. Correlation Analysis
Table 2 shows the results of the correlation analysis. It can be seen that cost of equity capital has a negative correlation with the greenness variables. Thus, as the greenness of the REITs increases, that is, G1, G2, and G3 are higher, this leads to a decreased cost of equity capital. It can also be seen that the greenness scores are positively correlated with institutional holdings but negatively with ownership concentration. In terms of the control variables, no high correlation can be detected among the variables, implying there is no multicollinearity problem.
4.3. Analysis of Results
4.3.1. Green Building Certification’s Impact on Cost of Equity
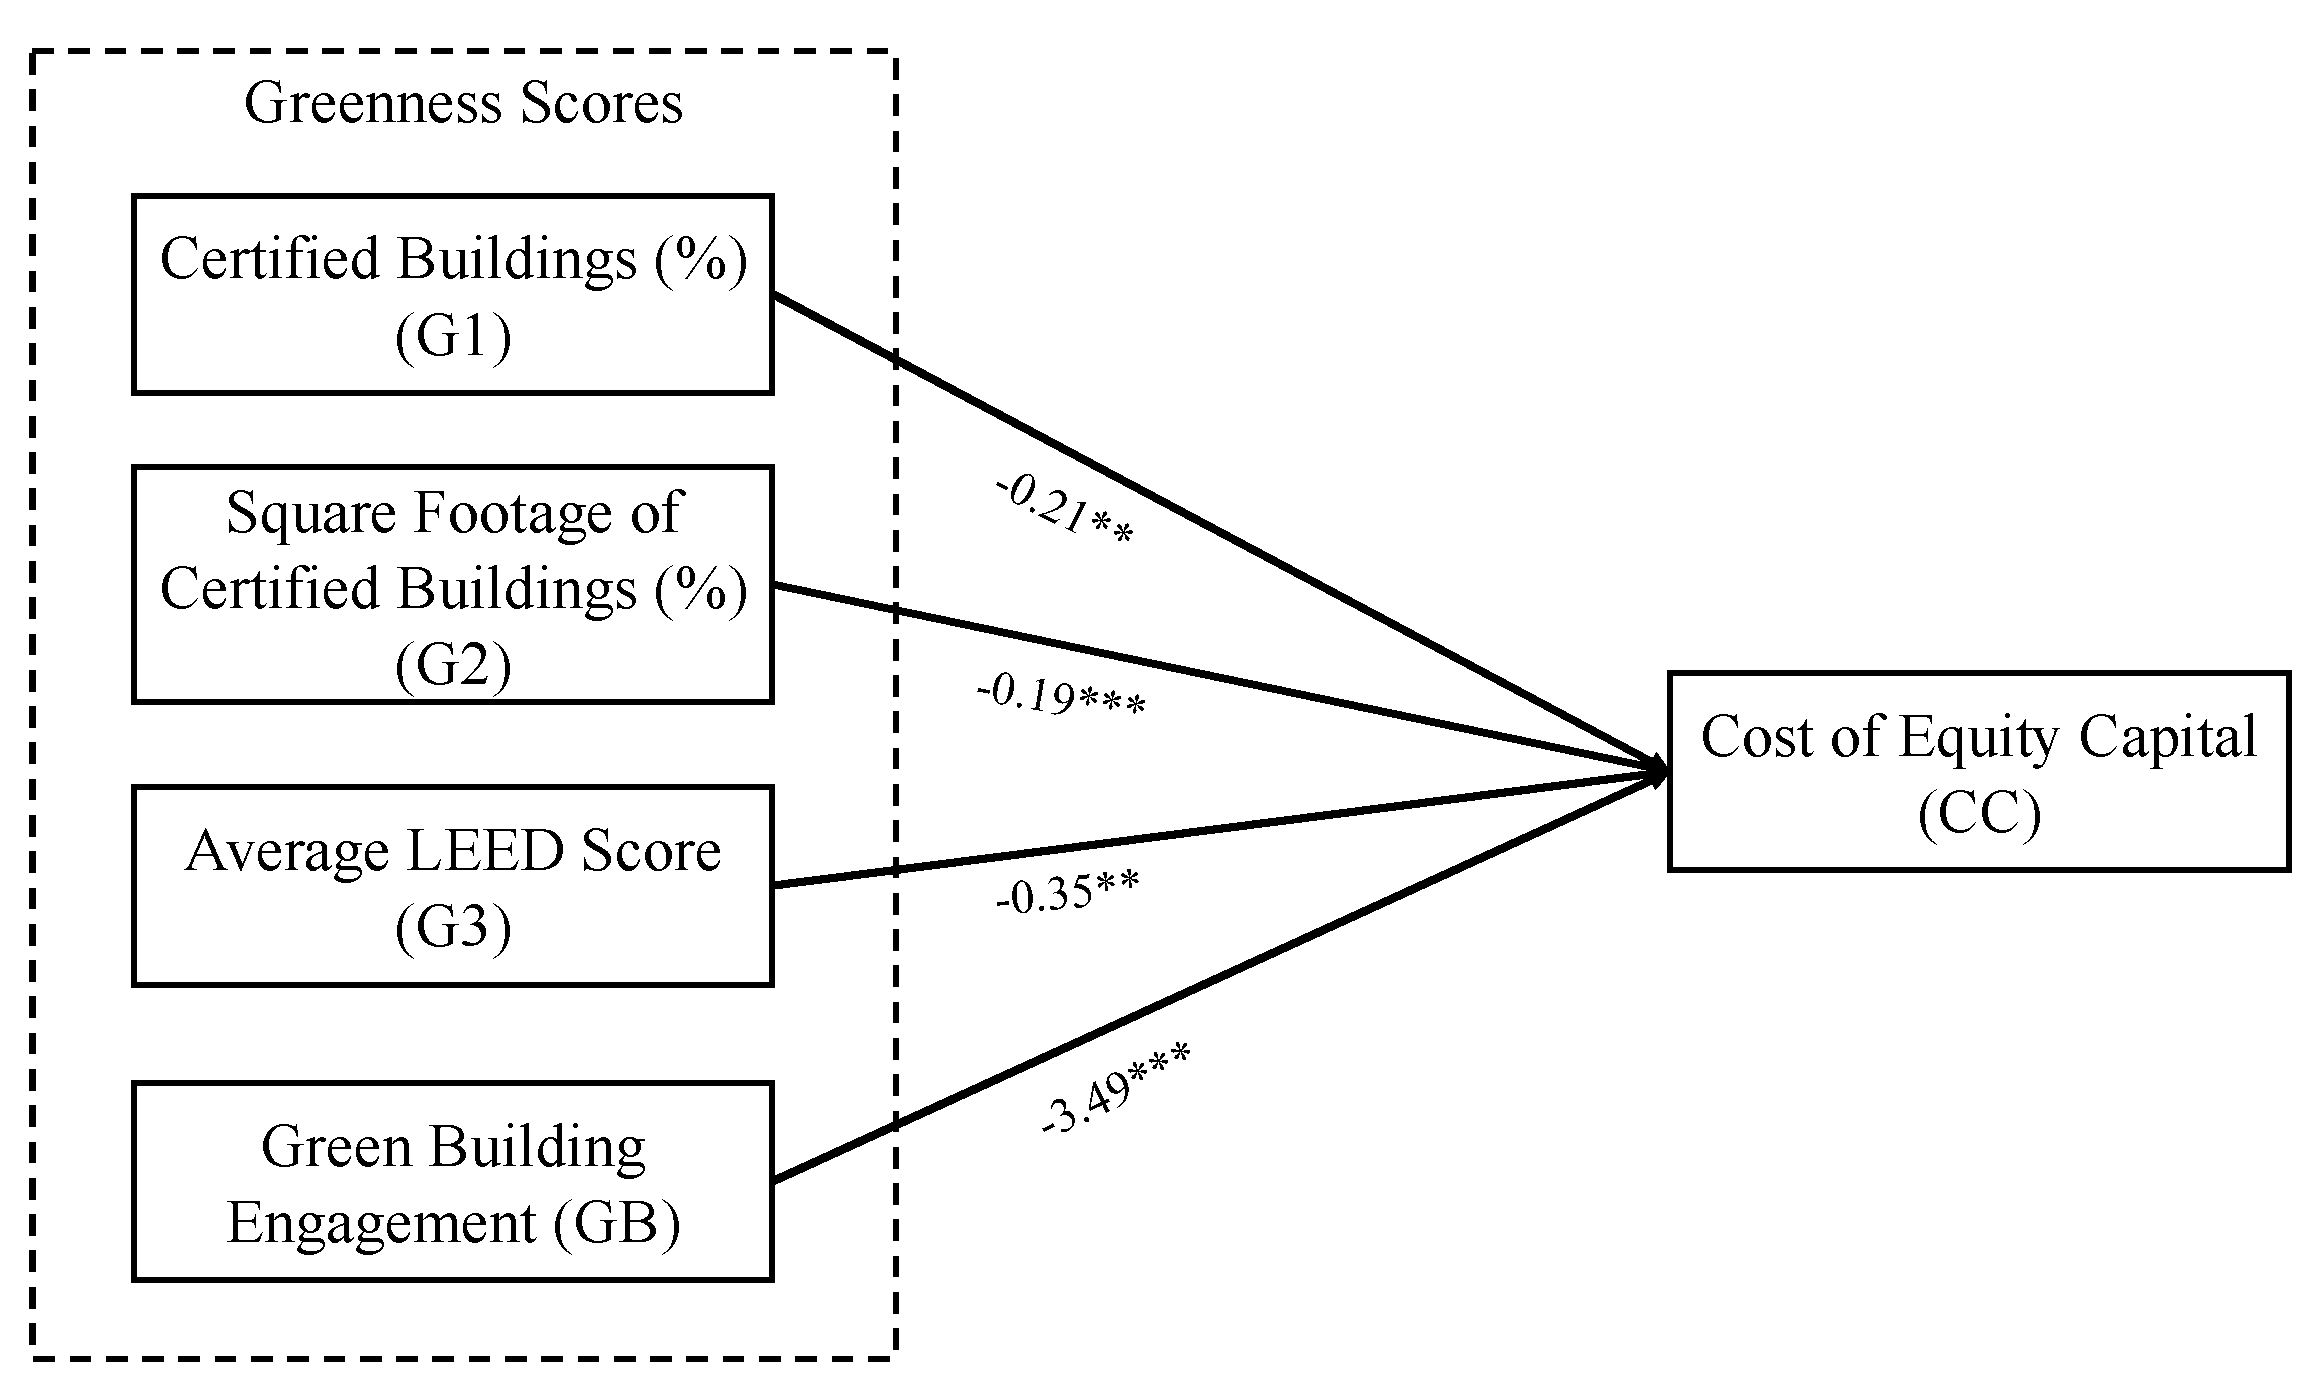
Table 3 presents the panel data regression results of examining the relationship between green building implementation and the cost of equity capital. The cost of equity capital is regressed on the four measures of greenness separately, controlling for fixed effects. Figure 1 presents the coefficient estimates of the greenness scores from the cost of equity capital regression. In all the estimations, it is documented that the greenness of the REITs is significantly and negatively related to the cost of equity capital, supporting hypothesis 1. In particular, higher levels of G1, G2, and G3 significantly reduce the cost of equity capital. For G1, it can be seen that the cost of equity capital will decrease by 0.21% when a REIT increases the percentage of its buildings that are certified by one percent. The same increase in the percentage of building area that is certified will reduce the cost of equity capital by about 0.19%. This shows that increasing either the percentage of certified buildings or the percentage area of certified buildings will result in a similar decrease in the cost of equity capital. When REITs have a higher level of LEED green building certification, this will lead to a decrease of 0.35% in the cost of equity capital. The coefficient on GB is also negatively significant. The value of 3.49 means that, when REITs gain LEED green building certification, it could lead to a decrease of 3.49% in the cost of equity, compared to if they have no certification.
These results imply that socially responsible investors, aware of REITs, do pay attention to green building certification. As there might be a short-term profit change due to the high cost of developing green buildings, socially responsible investors will take a long-term position in looking for intertemporal profits while also staying in alignment with their social and environmental values [60]. Our findings confirm the instrumental stakeholder theory, i.e., that, when a firm achieves stakeholder expectations, it will earn benefits. As there is a rapid rise in the social and environmental consciousness, this is increasing shareholders’ demand for socially responsible products. Moreover, since REITs’ environmental performance is manifested in green building certification, holding a higher level of certified green buildings will result in long-term financial benefits for REITs. Therefore, the current cost of equity capital expected by the shareholders will decrease when REITs have green building certification.
The implications of the findings for managers are twofold. The first comes from the result that REITs could enjoy up to a 3.49 percent decrease in the cost of equity capital when they have LEED green building certification. This could motivate REIT managers to hold such certification. The benefit obtained from REITs’ lower cost of equity capital due to green building engagement would enhance the REITs’ firm value. The second implication comes from the empirical result that REITs will experience a lower cost of equity capital when they become “greener”. This should further encourage managers to seek higher rankings in the green building rating system. Better green building practices here include an increasing number of certified buildings, an increase in certified area, or achieving a better level of LEED certification. Better green building practices will not only have a better impact on society and the environment but will also result in a lower cost of equity capital, and thus higher value, for the REITs.
In terms of control variables, the regression results, in general, show that REITs with better financial performance, as represented by ROA, have a lower cost of equity capital. This aligns with theories and previous studies showing that reported earnings affect stockholders’ expectations of returns [51,61]. The market-to-book ratio has a significantly negative effect on the cost of equity capital, as expected, as market value and risk are inherently inversely related [29,49]. Similarly, return variability, which represents the volatility of the firms’ stock price return, has a significantly positive effect on the cost of equity, due to the fact that the uncertainty of the future stock price of a firm could increase its risk and thereby lead to a higher cost of equity capital [19,47,62]. The interest coverage ratio also has a significantly positive impact on the cost of equity. This implies that REITs with a higher ability to cover their interest expenses are likely to have a higher cost of equity.
4.3.2. Effects of Corporate Governance Practices on Green Building Implementation Intensity
Table 4 presents the results of examining the effects of corporate governance practice on green building implementation intensity. We regress the greenness scores on the ownership variables (institutional ownership and ownership concentration), controlling for fixed effects. Figure 2 presents the coefficient estimates from the green building implementation intensity regression. All estimation results show that the ownership variables have a positively significant impact on the greenness scores, as expected. The results indicate that both institutional ownership and ownership concentration support LEED green building implementation, which supports hypothesis 2.
Institutional ownership is found to have a significant and positive impact on the likelihood of green building involvement. The results demonstrate that, with an increase in institutional holdings, REITs tend to own more green infrastructure. Since the fraction of equity that institutions hold in the market has been increasing, disposing of their shares has become difficult and costly. Growing awareness of this fact has meant that institutions put more effort into their long-term corporate investments. This is consistent with what previous studies have reported regarding the change in institutions’ behaviors.
Ownership concentration exhibits an identical positive relationship with the greenness scores. This implies an “alignment effect” in the US REIT sector, in that a higher level of concentration better aligns shareholders’ and managers’ interests. This finding is consistent with the literature on ownership concentration and the investor legislation protection mechanism. The result shows us that, with a decrease in the dispersion of ownership, the likelihood of green building involvement increases.
These findings show that REIT corporate governance practices implemented to align shareholders’ and managers’ interests have a positive effect on resource allocation to sustainable projects. These findings support the stakeholder theory, which implies that firms engage in CSR activities not only to bear profits but also to be ethical and socially supportive. Porter and Kramer [37] proposed a “win—win” model and argued that CSR activities were tool firms could use to create a competitive advantage. By understanding the conceptual links among internal and external stakeholders, managers could deal with conflicts and carry out the transactions with these stakeholders that are essential to obtaining firms’ general targets. In other words, stakeholder theory explains that managers use CSR to carry out their ethical and social duties for the external stakeholders and to tactically gain conventional firm targets for their shareholders. Therefore, in terms of the real estate sector, the pressure for green building from REITs’ shareholders shows us that, in addition to their major goal of profitability, corporations seem to be behaving more socially responsibly. This is probably directly due to firms’ financial motivations, or a desire to reduce irresponsible risk, but still shows good signs for the community in general. Under a higher level of institutional holdings and a more concentrated ownership structure, there is more incentive for these investors to exert their monitoring ability in the governance mechanism, representing a better governance quality for REITs, which increases their incentive to invest in green buildings.
In addition to the aforementioned theoretical contributions, there are several implications from our findings of a positive association between corporate governance and green building. First, the result suggests that good corporate governance encourages green building as a measure to enhance public relationships and, thereby, enhance the firm’s performance. In this sense, an effective control mechanism might provide a foundation for green building implementation. Therefore, the regulators, executives, and stakeholders could improve the corporate governance quality to facilitate green building implementation. Second, specifically from the shareholders’ perspective, the positive relationship between shareholder power, and especially the presence of institutional owners, and green building is consistent with the “superior investor” viewpoint. This suggests that green building is among the preferences of investor groups considered to be “prudent” in the equity market. This finding should provide useful information for potential investors, especially those lacking information about the market.
In terms of control variables, we find strong evidence that larger REITs tend to be involved more in green projects. The reason larger firms engage more in CSR is probably due to the higher risk of being publicly shown to be irresponsible. The market-to-book ratio is found to be negatively significantly associated with green projects. It can be observed that beta is significant in all models, but the direction of the effect is inconsistent. Beta has a negative relationship with green building certification in the models with G1, G2, and G3, but a positive one in the model with GB. Moreover, it is found that the interest coverage ratio also has a positive impact on green building involvement. A higher interest coverage ratio indicates that firms have enough profits to service their debt, but it may also mean they are not using their debt properly, and therefore need to invest in new products and technologies to stay ahead of the competition in the long term. Since green building practices are assumed to be a new trend of investment in the real estate sector, it would be reasonable for those REITs to be interested in implementing green building practices.
4.3.3. Robustness Check
We also test the robustness of the results of both models by using only those REITs which have the certification. This should highlight the effect of different certification levels on the cost of equity capital, as well as how corporate governance might affect each level of greenness for the LEED-certified REIT sample. This is important because the fraction of green buildings is relatively small among the sample of all US REITs.
Table 5 shows the results of the robustness test, which are consistent with what was observed in the model with all US REITs. In regards to the first test, G1, G2, G3, and GB can be seen to be statistically significantly and negatively related to the cost of equity capital, as expected. The results imply that an increase of 1% in the number of certified buildings could reduce the cost of equity capital by 0.21%, and an increase of 1% in a REIT’s certified building area could decrease the cost of equity capital by 0.18%. This implies that there is a higher impact on the cost of equity capital from the number of certified buildings than the square footage of certified buildings. Further, a one percent increase in G3, representing the greenness score of the REITs, would decrease the cost of equity capital by 0.35%. This indicates that, when REITs have a better level of green building certification, investors will expect a lower return. In this case, the investors are shown to not only look at ownership of green building certification but also at the greenness quality of the properties. This is aligned with previous studies that have found the greenness of properties in a REIT’s portfolio to matter, beyond simply having the certification [10], and also supports our first hypothesis.
In addition, in Table 6, we find that institutional holdings and ownership concentration are still significantly and positively linked to all of the greenness scores. The results of the estimations of the second model suggest that, with a 1% increase in institutional holdings, REITs own 0.11% more certified buildings, a 0.15% greater certified area, and their average LEED score increases by 0.06 units. A similar pattern is seen with ownership concentration. An increase of 1% in the concentration index means REITs own 0.12% more certified buildings, 0.16% more square footage of LEED-certified buildings, and see a rise in their average LEED score of 0.07 units. All coefficients of the ownership variables in the regression on the smaller sample are much greater than in the full sample. The results indicate that governance practices, proxied by both external governance from institutional holdings and internal governance through ownership concentration, implemented to align shareholders’ and managers’ interests, have a positive impact on the resources firms devote to green building implementation, thereby supporting our second hypothesis.
5. Conclusions
The growing awareness of environmental issues has led to the booming interest in green buildings. Thus, trying to understand whether or not, and if so how, green building practices could benefit both the economy and environment is important. Although numerous research works have been carried out, they have mainly focused on the profits of sustainable building owners, e.g., through accounting and market-based financial performance. It is still unclear whether green building practices can benefit capital market participants.
The empirical results of this study provide insights into the effect of green building certification on REITs’ financial condition, as well as the role corporate governance, specifically ownership structure, may play in promoting greenness. The first model of this study aims to unveil the effect of green building certification on the cost of equity capital. We find significantly negative relationships between the greenness of the REITs and the cost of equity capital, indicating that the participation of REITs in the LEED green building certification scheme significantly reduces REITs’ cost of equity capital. Apparently, this motivates REIT managers to join the LEED green building certification scheme. Although prior studies have suggested that green building involves higher costs during the development period [63], the savings obtained from the lower cost of equity capital for REITs would bring benefits from the development of green buildings. Another conclusion from the empirical results is that REITs will experience a lower cost of equity capital as they become “greener”. This should encourage managers not just to participate in LEED green building certification, but also to seek higher rankings in the green building rating system.
The second model emphasizes the effect of ownership structure, as an element of corporate governance, on green infrastructure implementation. We find evidence that corporate governance practices, measured by both institutional ownership and ownership concentration, have positive impacts on the amount of resources firms devote to green building. That is, with an increase in institutional holdings and a higher level of ownership concentration, REITs tend to own more green infrastructure. In other words, corporate governance practices implemented to align the interests of shareholders and managers positively affect green building adoption. This suggests that good corporate governance encourages green building as a way to build good public relations and thereby enhance firm performance. In this sense, an effective control mechanism might provide the foundation for green building implementation.
Author Contributions
Conceptualization, H.-C.H., V.C. and T.M.N.B.; methodology, H.-C.H., V.C. and T.M.N.B.; software, H.-C.H., V.C. and T.M.N.B.; validation, H.-C.H., V.C. and T.M.N.B.; formal analysis, H.-C.H., V.C. and T.M.N.B.; investigation, V.C. and T.M.N.B.; data curation, V.C. and T.M.N.B.; writing—original draft preparation, V.C., T.M.N.B. and H.-C.H.; writing—review and editing, H.-C.H.; visualization, H.-C.H.; supervision, H.-C.H.; project administration, H.-C.H.; funding acquisition, H.-C.H. All authors have read and agreed to the published version of the manuscript.
Funding
This research received no external funding.
Conflicts of Interest
The authors declare no conflict of interest.
References
- Freeman, R.E.; Reed, D.L. Stockholders and stakeholders: A new perspective on Corporate governance. Calif. Manag. Rev. 1983, 25, 88–106. [Google Scholar] [CrossRef]
- Wistanley, C.S.D. Stakeholding: Confusion or utopia? Mapping the conceptual terrain. J. Manag. Stud. 2001, 38, 603–626. [Google Scholar]
- REN21 Renewables Now. Available online: https://www.ren21.net/wp-content/uploads/2019/05/GSR2017_Full-Report_English.pdf (accessed on 31 March 2020).
- World Green Building Council. Available online: https://www.worldgbc.org/news-media/world-green-building-trends-2018-smartmarket-report-publication (accessed on 31 March 2020).
- Bond, S.A.; Devine, A. Certification matters: Is green talk cheap talk? J. Real Estate Financ. Econ. 2016, 52, 117–140. [Google Scholar] [CrossRef]
- Fuerst, F.; McAllister, P. Green noise or green value? Measuring the effects of environmental certification on office values. Real Estate Econ. 2011, 39, 45–69. [Google Scholar] [CrossRef]
- Eichholtz, P.; Kok, N.; Quigley, J.M. Doing well by doing good? Green office buildings. Am. Econ. Rev. 2010, 100, 2492–2509. [Google Scholar] [CrossRef] [Green Version]
- Pivo, G.; Fisher, J. Income, value, and returns in socially responsible office properties. J. Real Estate Res. 2010, 32, 243–270. [Google Scholar]
- Fuerst, F.; Gabrieli, T.; McAllister, P. A green winner’s curse? Investor behavior in the market for eco-certified office buildings. Econ. Model. 2017, 61, 137–146. [Google Scholar] [CrossRef] [Green Version]
- Eichholtz, P.; Kok, N.; Yonder, E. Portfolio greenness and the financial performance of REITs. J. Int. Money Financ. 2012, 31, 1911–1929. [Google Scholar] [CrossRef]
- Shleifer, A.; Vishny, R.W. Stock market driven acquisitions. J. Financ. Econ. 2003, 70, 295–311. [Google Scholar] [CrossRef] [Green Version]
- Lauesen, L.M. CSR in publicly owned enterprises: Opportunities and barriers. Soc. Responsib. J. 2011, 7, 558–577. [Google Scholar] [CrossRef]
- Chhaochharia, V.; Laeven, L. Corporate governance norms and practices. J. Financ. Intermed. 2009, 18, 405–431. [Google Scholar] [CrossRef]
- Saini, N.; Singhania, M. Corporate governance, globalization and firm performance in emerging economies. Int. J. Product. Perform. Manag. 2018, 67, 1310–1333. [Google Scholar] [CrossRef]
- Iqbal, S.; Nawaz, A.; Ehsan, S. Financial performance and corporate governance in microfinance: Evidence from Asia. J. Asian Econ. 2019, 60, 1–13. [Google Scholar] [CrossRef]
- Gompers, P.; Ishii, J.; Metricks, A. Corporate governance and equity prices. Q. J. Econ. 2003, 118, 107–156. [Google Scholar] [CrossRef] [Green Version]
- Chung, K.H.; Elder, J.; Kim, J.-C. Corporate governance and liquidity. J. Financ. Quant. Anal. 2010, 45, 265–291. [Google Scholar] [CrossRef]
- William, H.; Michael, J. Theory of the firm: Managerial behavior, agency costs and ownership structure. J. Financ. Econ. 1976, 3, 305–360. [Google Scholar]
- Dhaliwal, D.; Zhen, O.; Tsang, L.A.; Yang, Y.G. Corporate social responsibility disclosure and the cost of equity capital: The roles of stakeholder orientation and financial transparency. J. Account. Public Policy 2014, 33, 328–355. [Google Scholar] [CrossRef]
- Westermann, S.; Niblock, S.; Kortt, M. Corporate social responsibility and the performance of Australian REITs: A rolling regression approach. J. Asset Manag. 2018, 19, 222–234. [Google Scholar] [CrossRef] [Green Version]
- Renneboog, L.; Ter Horst, J.; Zhang, C. Socially responsible investments: Institutional aspects, performance, and investor behavior. J. Bank. Financ. 2008, 32, 1723–1742. [Google Scholar] [CrossRef]
- Chiang, K.C.H.; Wachtel, G.J.; Zhou, X. Corporate social responsibility and growth opportunity: The case of real estate investment trusts. J. Bus. Ethics 2017, 155, 463–478. [Google Scholar] [CrossRef]
- Goss, A.; Roberts, G.S. The impact of corporate social responsibility on the cost of bank loans. J. Bank. Financ. 2011, 35, 1794–1810. [Google Scholar] [CrossRef]
- Heinkel, R.; Kraus, A.; Zechner, J. The effect of green investment on corporate behavior. J. Financ. Quant. Anal. 2001, 36, 431–449. [Google Scholar] [CrossRef]
- Mackey, A.; Mackey, T.B.; Barney, J.B. Corporate social responsibility and firm performance: Investor preferences and corporate strategies. Acad. Manag. Rev. 2007, 32, 817–835. [Google Scholar] [CrossRef]
- Song, H.; Zhao, C.; Zeng, J. Can environmental management improve financial performance: An. empirical study of A-shares listed companies in China. J. Clean. Prod. 2017, 141, 1051–1056. [Google Scholar] [CrossRef]
- Starks, L.T. EFA keynote speech: “Corporate governance and corporate social responsibility: What do investors care about? What should investors care about?”. Financ. Rev. 2009, 44, 461–468. [Google Scholar] [CrossRef]
- Endrikat, J.; Guenther, E.; Hoppe, H. Making sense of conflicting empirical findings: A meta-analytic review of the relationship between corporate environmental and financial performance. Eur. Manag. J. 2014, 32, 735–751. [Google Scholar] [CrossRef]
- Reverte, C. The impact of better corporate social responsibility disclosure on the cost of equity capital. Corp. Soc. Responsib. Environ. Manag. 2012, 19, 253–272. [Google Scholar] [CrossRef]
- El Ghoul, S.; Guedhami, O.; Kwok, C.C.Y.; Mishra, D.R. Does corporate social responsibility affect the cost of capital? J. Bank. Financ. 2011, 35, 2388–2406. [Google Scholar] [CrossRef]
- Deng, Y.; Li, Z.; Quigley, J.M. Economic returns to energy-efficient investments in the housing market: Evidence from Singapore. Reg. Sci. Urban Econ. 2012, 42, 506–515. [Google Scholar] [CrossRef] [Green Version]
- Holtermans, R.; Kok, N. On the value of environmental certification in the commercial real estate market. Real Estate Econ. 2019, 47, 685–722. [Google Scholar] [CrossRef]
- Mangialardo, A.; Micelli, E.; Saccani, F. Does sustainability affect. Real estate market. Values? Empirical evidence from the office buildings market. in Milan (Italy). Sustainability 2018, 11, 12. [Google Scholar] [CrossRef] [Green Version]
- An, X.; Pivo, G. Green buildings in commercial mortgage-backed securities: The effects of LEED and energy star certification on default risk and loan terms. Real Estate Econ. 2020, 48, 7–42. [Google Scholar] [CrossRef]
- Burr, A.C. Studies Suggest More Gains for Green Building in 2009; CoStar Group: Washington, DC, USA, 2008. [Google Scholar]
- Donaldson, T.; Preston, L.E. The stakeholder theory of the corporation: Concepts, evidence, and implications. Acad. Manag. Rev. 1995, 20, 65–91. [Google Scholar] [CrossRef] [Green Version]
- Porter, M.E.; Kramer, M.R. The link between competitive advantage and corporate social responsibility. Harv. Bus. Rev. 2006, 84, 78–92. [Google Scholar]
- Cespa, G.; Cestone, G. Corporate social responsibility and managerial entrenchment. J. Econ. Manag. Strategy 2007, 16, 741–771. [Google Scholar] [CrossRef]
- Jensen, M.C. The modern industrial revolution, exit, and the failure of internal control systems. J. Financ. 1993, 48, 831–880. [Google Scholar] [CrossRef]
- Grossman, S.J.; Hart, O.D. The costs and benefits of ownership: A theory of vertical and lateral integration. J. Political Econ. 1986, 94, 691–719. [Google Scholar] [CrossRef] [Green Version]
- Chung, K.H.; Zhang, H. Corporate governance and institutional ownership. J. Financ. Quant. Anal. 2011, 46, 247–273. [Google Scholar] [CrossRef]
- Davis, E.P. Institutional investors, corporate governance and the performance of the corporate sector. Econ. Syst. 2002, 26, 203–229. [Google Scholar] [CrossRef]
- Gillan, S.L.; Starks, L.T. Corporate governance proposals and shareholder activism: The role of institutional investors. J. Financ. Econ. 2000, 57, 275–305. [Google Scholar] [CrossRef]
- McCahery, J.A.; Sautner, Z.; Starks, L.T. Behind the scenes: The corporate governance preferences of institutional investors. J. Financ. 2016, 71, 2905–2932. [Google Scholar] [CrossRef]
- Ciftci, I.; Tatoglu, E.; Wood, G.; Demirbag, M.; Zaim, S. Corporate governance and firm performance in emerging markets: Evidence from Turkey. Int. Bus. Rev. 2019, 28, 90–103. [Google Scholar] [CrossRef]
- Easton, P.D. PE ratios, PEG ratios, and estimating the implied expected rate of return on equity capital. Account. Rev. 2004, 79, 73–95. [Google Scholar] [CrossRef]
- Li, S. Does mandatory adoption of international financial reporting standards in the European union reduce the cost of equity capital? Account. Rev. 2010, 85, 607–636. [Google Scholar] [CrossRef]
- Botosan, C.A.; Plumlee, M.A. A re-examination of disclosure level and the expected cost of equity capital. J. Account. Res. 2002, 40, 21–40. [Google Scholar] [CrossRef]
- Lopes, A.B.; de Alencar, R.C. Disclosure and cost of equity capital in emerging markets: The Brazilian case. Int. J. Account. 2010, 45, 443–464. [Google Scholar] [CrossRef]
- Herfindahl, O. Concentration in the USA Steel Industry. Ph.D. Thesis, Columbia University, New York, NY, USA, 1950. [Google Scholar]
- Azizkhani, M.; Monroe, G.S.; Shailer, G. Audit partner tenure and cost of equity capital. Audit. A J. Pract. Theory 2013, 32, 183–202. [Google Scholar] [CrossRef]
- Francis, J.R.; Khurana, I.K.; Pereira, R. Disclosure incentives and effects on cost of capital around the world. Account. Rev. 2005, 80, 1125–1162. [Google Scholar] [CrossRef]
- Dhaliwal, D.S.; Li, O.Z.; Tsang, A.; Yang, Y.G. Voluntary nonfinancial disclosure and the cost of equity capital: The initiation of corporate social responsibility reporting. Account. Rev. 2011, 86, 59–100. [Google Scholar] [CrossRef]
- Bowen, R.M.; Chen, X.; Cheng, Q. Analyst coverage and the cost of raising equity capital: Evidence from underpricing of seasoned equity offerings. Contemp. Account. Res. 2008, 25, 657–700. [Google Scholar] [CrossRef]
- Ng, A.C.; Rezaee, Z. Business sustainability performance and cost of equity capital. J. Corp. Financ. 2015, 34, 128–149. [Google Scholar] [CrossRef]
- Sharfman, M.P.; Fernando, C.S. Environmental risk management and the cost of capital. Strateg. Manag. J. 2008, 29, 569–592. [Google Scholar] [CrossRef]
- Jensen, M.C. Agency costs of free cash flow, corporate finance, and takeovers. Am. Econ. Rev. 1986, 76, 323–329. [Google Scholar]
- Webb, E. Agency costs, leverage, and corporate social responsibility: A test of causality. Financ. Decis. 2005, 3, 1–19. [Google Scholar]
- Botosan, C.A.; Plumlee, M.A. Assessing alternative proxies for the expected risk premium. Account. Rev. 2005, 80, 21–53. [Google Scholar] [CrossRef]
- Bénabou, R.; Tirole, J. Individual and corporate social responsibility. Economica 2010, 77, 1–19. [Google Scholar] [CrossRef] [Green Version]
- Cao, Y.; Myers, J.N.; Myers, L.A.; Omer, T.C. Company reputation and the cost of equity capital. Rev. Account. Stud. 2015, 20, 42–81. [Google Scholar] [CrossRef]
- Luo, X.; Bhattacharya, C.B. The debate over doing good: Corporate social performance, strategic marketing levers, and firm-idiosyncratic risk. J. Mark. 2009, 73, 198–213. [Google Scholar] [CrossRef] [Green Version]
- Hwang, B.G.; Tan, J.S. Green building project management: Obstacles and solutions for sustainable development. Sustain. Dev. 2012, 20, 335–349. [Google Scholar] [CrossRef]
Figure 1.
Effect of green building certification on REITs’ cost of equity capital. Notes: *** p < 0.01; ** p < 0.05; * p < 0.10. Control variables are not shown for ease of presentation.
Figure 1.
Effect of green building certification on REITs’ cost of equity capital. Notes: *** p < 0.01; ** p < 0.05; * p < 0.10. Control variables are not shown for ease of presentation.

Figure 2.
Effect of corporate governance practices on green building implementation intensity. Notes: *** p < 0.01; ** p < 0.05; * p < 0.10. Control variables are not shown for ease of presentation.
Figure 2.
Effect of corporate governance practices on green building implementation intensity. Notes: *** p < 0.01; ** p < 0.05; * p < 0.10. Control variables are not shown for ease of presentation.


Table 1.
Descriptive statistics.
| Variables | Mean | Median | S.D. | Min | Max | N |
|---|---|---|---|---|---|---|
| G1 | 1.3145 | 0.0000 | 4.1673 | 0.0000 | 45.0000 | 1011 |
| G2 | 1.9601 | 0.0000 | 5.8788 | 0.0000 | 48.5787 | 1011 |
| G3 | 0.7932 | 0.0000 | 2.5271 | 0.0000 | 26.5250 | 1011 |
| GB | 0.2275 | 0.0000 | 0.4194 | 0.0000 | 1.0000 | 1011 |
| CC | 11.7965 | 8.7072 | 10.2007 | 0.0000 | 85.0812 | 1011 |
| IO | 0.7657 | 0.8522 | 0.2480 | 9.53E-06 | 1.0000 | 1011 |
| HHI | 0.0713 | 0.0521 | 0.0833 | 0.0224 | 1.0000 | 1011 |
| ROA | 1.8497 | 1.7380 | 2.8937 | −16.3811 | 30.5580 | 1011 |
| SIZE | 15.0837 | 15.0908 | 1.0578 | 11.9048 | 18.7093 | 1011 |
| LEV | 0.5309 | 0.5201 | 0.1652 | 0.0033 | 1.0821 | 1011 |
| MBR | 2.3005 | 1.7363 | 3.6512 | −6.2259 | 77.7728 | 1011 |
| BETA | 1.0305 | 0.9564 | 0.6387 | −1.0999 | 3.9142 | 1011 |
| RETVAR | 7.5837 | 5.8467 | 6.0000 | 2.2358 | 69.3270 | 1011 |
| INT | 2.6619 | 1.7430 | 9.2558 | 0.0000 | 274.9620 | 1011 |
This table presents the descriptive statistics of all the variables. G1 represents the percentage of buildings that are certified relative to the total number of buildings owned by REITi in year t. G2 represents the percentage of square feet of buildings that are certified relative to the total square feet of property owned by REITi in year t. G3 measures the average greenness score awarded by LEED divided by the number of properties owned by REITi in year t. GB is a dummy variable that takes the value 1 if the REIT has any LEED certification, and 0 otherwise. CC (cost of equity) is calculated based on the Price Earnings Growth (PEG) ratio method of Easton (2004). IO (institutional ownership) ranges from 0 to 1. HHI (ownership concentration) is calculated as the sum of the squares of the ownership percentages of all equity holders who hold at least 5% of the equity. ROA (return on assets) is calculated as the ratio of net income to total assets. SIZE (firm size) is calculated by taking the natural log of the firm’s total assets. LEV (leverage) is calculated by dividing the liabilities by the total assets. MBR (market-to-book ratio) is calculated by dividing the market value by the equity book value. BETA, representing the firm risk, is calculated by dividing the excess return on the stock by the excess return on the market. RETVAR (return variability) is calculated from the annual standard deviation of the daily stock price return. INT (interest coverage) is calculated by dividing earnings before interest and taxes by interest expense.
Table 2.
Correlation matrix.
| Correlation | G1 | G2 | G3 | CC | IO | HHI | ROA | SIZE | LEV | MBR | BETA | RETVAR | INT |
|---|---|---|---|---|---|---|---|---|---|---|---|---|---|
| G1 | 1 | ||||||||||||
| G2 | 0.8993 *** | 1 | |||||||||||
| G3 | 0.9965 *** | 0.9005 *** | 1 | ||||||||||
| CC | −0.1825 *** | −0.1867 *** | −0.1805 *** | 1 | |||||||||
| IO | 0.1318 *** | 0.1509 *** | 0.1375 *** | −0.0697 ** | 1 | ||||||||
| HHI | −0.0171 | −0.0312 | −0.019 | 0.0108 | −0.5908 *** | 1 | |||||||
| ROA | 0.0316 | −0.018 | 0.024 | −0.2115 *** | −0.0854 *** | −0.0339 | 1 | ||||||
| SIZE | 0.0461 | 0.0566 * | 0.0498 | 0.017 | 0.3776 *** | −0.1672 *** | −0.0722 ** | 1 | |||||
| LEV | −0.0985 *** | −0.1115 *** | −0.1061 *** | 0.0766 ** | −0.0269 | 0.0001 | −0.2904 *** | 0.2627 *** | 1 | ||||
| MBR | 0.0001 | −0.017 | −0.0058 | −0.1327 *** | −0.026 | 0.0456 | 0.0167 | −0.015066 | 0.1706 *** | 1 | |||
| BETA | −0.0368 | −0.0171 | −0.0346 | 0.1993 *** | 0.2127 *** | −0.0517 | −0.3482 *** | 0.0662** | 0.0861 *** | −0.0462 | 1 | ||
| RETVAR | −0.0869 *** | −0.0858 *** | −0.0867 *** | 0.27219 *** | 0.024693 | −0.01307 | −0.2713 *** | −0.0160 | 0.0836 *** | −0.1009 *** | 0.568 *** | 1 | |
| INT | −0.0072 | −0.0204 | −0.0075 | −0.0211 | −0.1001 *** | 0.0015 | 0.2051 *** | −0.1344*** | −0.2645 *** | −0.0228 | −0.1183 *** | −0.0504 | 1 |
This table presents the correlation matrix of the variables. G1 represents the percentage of buildings that are certified relative to the total number of buildings owned by REITi in year t. G2 represents the percentage of square feet of buildings that are certified relative to the total square feet of property owned by REITi in year t. G3 measures the average greenness score awarded by LEED divided by the number of properties owned by REITi in year t. CC (cost of equity) is calculated based on the Price Earnings Growth (PEG) ratio method of Easton (2004). IO (institutional ownership) ranges from 0 to 1. HHI (ownership concentration) is calculated as the sum of the squares of the ownership percentages of all equity holders who hold at least 5% of the equity. ROA (return on assets) is calculated as the ratio of net income to total assets. SIZE (firm size) is calculated by taking the natural log of the firm’s total assets. LEV (leverage) is calculated by dividing the liabilities by the total assets. MBR (market-to-book ratio) is calculated by dividing the market value by the equity book value. BETA, representing the firm risk, is calculated by dividing the excess return on the stock by the excess return on the market. RETVAR (return variability) is calculated from the annual standard deviation of the daily stock price return. INT (interest coverage) is calculated by dividing earnings before interest and taxes by interest expense. ***, **, and * indicate significance at the 1%, 5%, and 10% level, respectively.
Table 3.
Effect of green building certification on REITs’ cost of equity capital.
| Variables | Cost of Equity Capital (CC) | |||
|---|---|---|---|---|
| (1) | (2) | (3) | (4) | |
| G1 | −0.2105 ** | |||
| (0.0862) | ||||
| G2 | −0.1894 *** | |||
| (0.0561) | ||||
| G3 | −0.3493 ** | |||
| (0.1438) | ||||
| GB | −3.4896 *** | |||
| (0.9032) | ||||
| ROA | −0.2845 * | −0.3096 ** | −0.2870 * | −0.2932 * |
| (0.1526) | (0.1507) | (0.1530) | (0.1528) | |
| SIZE | −0.8073 | −0.7569 | −0.8035 | −0.4366 |
| (0.936) | (0.9164) | (0.9372) | (0.9549) | |
| LEV | 6.5877 | 6.5736 | 6.5193 | 5.5606 |
| (5.0183) | (4.9906) | (5.0196) | (4.8736) | |
| MBR | −0.1029 ** | −0.099 ** | −0.1011 ** | −0.0948 ** |
| (0.0455) | (0.0435) | (0.0453) | (0.0436) | |
| BETA | 0.5899 | 0.6149 | 0.5903 | 0.9810 |
| (0.8316) | (0.8256) | (0.8316) | (0.8583) | |
| RETVAR | 0.3679 *** | 0.3620 *** | 0.3680 ** | 0.3488 *** |
| (0.1248) | (0.1251) | (0.1248) | (0.1265) | |
| INT | 0.0257 ** | 0.0266** | 0.0256 ** | 0.0249 ** |
| (0.0109) | (0.0107) | (0.0108) | (0.0109) | |
| Constant | 18.0493 | 17.4439 | 18.0293 | 13.2620 |
| (14.8865) | (14.6156) | (14.890) | (15.2273) | |
| N | 1011 | 1011 | 1011 | 1011 |
| R-squared | 0.5814 | 0.5828 | 0.5813 | 0.5868 |
| Adj R-square | 0.5281 | 0.5298 | 0.5281 | 0.5343 |
| F-stat | 10.9156 | 10.9808 | 10.9135 | 11.1634 |
| Fixed effect | Yes | Yes | Yes | Yes |
This table presents the estimates of model 1 using panel data regression to investigate the effect of green certification practices on the cost of equity capital. CC (cost of equity capital) is calculated based on the Price Earnings Growth (PEG) ratio method of Easton (2004). G1 represents the percentage of buildings that are certified relative to the total number of buildings owned by REITi in year t. G2 represents the percentage of square feet of buildings that are certified relative to the total square feet of property owned by REITi in year t. G3 measures the average greenness score awarded by LEED divided by the number of properties owned by REITi in year t. GB is a dummy variable that takes the value 1 if the REIT has any LEED certification, and 0 otherwise. ROA (return on assets) is calculated as the ratio of net income to total assets. SIZE (firm size) is calculated by taking the natural log of the firm’s total assets. LEV (leverage) is calculated by dividing the liabilities by the total assets stated. MBR (market-to-book ratio) is calculated by dividing the market value by the equity book value. BETA is calculated by dividing the excess return on the stock by the excess return on the market. RETVAR (return variability) is calculated from the annual standard deviation of the daily stock price return. INT (interest coverage) is calculated by dividing earnings before interest and taxes by interest expense. ***, **, and * indicate significance at the 1%, 5%, and 10% level, respectively. The numbers in parentheses are robust standard errors.
Table 4.
Effect of corporate governance practices on green building implementation intensity.
| Variables | Greenness Scores | |||
|---|---|---|---|---|
| G1 | G2 | G3 | GB | |
| IO | 3.9128 * | 5.6883 ** | 2.3299 * | 0.4334 ** |
| (2.3103) | (2.77066) | (1.3981) | (0.1786) | |
| HHI | 5.9688 * | 8.4735 * | 3.7182 * | 0.9201 *** |
| (3.4270) | (4.3233) | (2.0461) | (0.3510) | |
| ROA | −0.0380 | −0.1690 | −0.0303 | −0.0039 |
| (0.0941) | (0.1614) | (0.0549) | (0.0071) | |
| SIZE | 1.7131 *** | 2.0199 *** | 1.0458 *** | 0.1858 *** |
| (0.5571) | (0.6609) | (0.3480) | (0.0499) | |
| LEV | −1.4618 | −1.6899 | −1.0650 | −0.3589 |
| (3.4972) | (4.2289) | (2.1328) | (0.2654) | |
| MBR | −0.0469 ** | −0.0326 | −0.0232 * | −0.0008 |
| (0.0239) | (0.0354) | (0.0133) | (0.0040) | |
| BETA | −0.4626 * | −0.4311 | −0.2769 * | 0.0766 ** |
| (0.2651) | (0.3404) | (0.1607) | (0.0346) | |
| RETVAR | −0.0265 | −0.0569* | −0.0161 | −0.0065 ** |
| (0.0195) | (0.0305) | (0.0118) | (0.0025) | |
| INT | 0.0118 * | 0.0185** | 0.0068* | 0.0006 |
| (0.0065) | (0.0083) | (0.0038) | (0.0010) | |
| Constant | −26.3466 *** | −31.3552 *** | −15.9665 *** | −2.8052 *** |
| (8.4251) | (9.8722) | (5.2067) | (0.7150) | |
| N | 1011 | 1011 | 1011 | 1011 |
| R-squared | 0.5312 | 0.5917 | 0.5428 | 0.5778 |
| Adj R-square | 0.4710 | 0.5392 | 0.4840 | 0.5236 |
| F-stat | 8.8185 | 11.2774 | 9.2388 | 10.6518 |
| Fixed effect | Yes | Yes | Yes | Yes |
This table presents estimates from model 2 using panel data regression to investigate the effect of corporate governance practices on green building implementation intensity. The dependent variables are G1, G2, G3, and GB. G1 represents the percentage of buildings that are certified relative to the total number of buildings owned by REITi in year t. G2 represents the percentage of square feet of buildings that are certified relative to the total square feet of property owned by REITi in year t. G3 measures the average greenness score awarded by LEED divided by the number of properties owned by REITi in year t. GB is a dummy variable that takes the value 1 if the REIT has any LEED certification, and 0 otherwise. The explanatory variables include IO and HHI. IO (institutional ownership) ranges from 0 to 1. HHI (ownership concentration) is calculated as the sum of the squares of the ownership percentages of all equity holders who hold at least 5% of the equity. ROA (return on assets) is calculated as the ratio of net income to total assets. SIZE (firm size) is calculated by taking the natural log of the firm’s total assets. LEV (leverage) is calculated by dividing the liabilities by the total assets stated. MBR (market-to-book ratio) is calculated by dividing the market value by the equity book value. BETA is calculated by dividing the excess return on the stock by the excess return on the market. RETVAR (return variability) is calculated from the annual standard deviation of the daily stock price return. INT (interest coverage) is calculated by dividing earnings before interest and taxes by interest expense. ***, **, and * indicate significance at the 1%, 5%, and 10% level, respectively. The numbers in parentheses are robust standard errors.
Table 5.
The effect of green building certification on REITs’ cost of equity capital. Sample of LEED-certified REITs.
Table 5.
The effect of green building certification on REITs’ cost of equity capital. Sample of LEED-certified REITs.
| US LEED Green Building Certified REITs | ||||
|---|---|---|---|---|
| Variables | Cost of Equity Capital | |||
| (1) | (2) | (3) | (4) | |
| G1 | −0.2102 ** | |||
| (0.0941) | ||||
| G2 | −0.1828 *** | |||
| (0.0619) | ||||
| G3 | −0.3462 ** | |||
| (0.1563) | ||||
| GB | −3.9585 *** | |||
| (0.8486) | ||||
| ROA | 0.0097 | −0.0326 | 0.0058 | 0.0073 |
| (0.0911) | (0.0930) | (0.0903) | (0.0975) | |
| SIZE | −1.2133 ** | −1.1547 ** | −1.2149 ** | −0.2803 |
| (0.5714) | (0.4831) | (0.57265) | (0.6526) | |
| LEV | 5.2691 | 5.3887 | 5.0958 | 2.1375 |
| (8.3085) | (8.2424) | (8.3296) | (7.3752) | |
| MBR | −0.0874* | −0.0852 * | −0.0854 * | −0.084 ** |
| (0.0493) | (0.0460) | (0.0490) | (0.0421) | |
| BETA | 1.2111 | 1.2545* | 1.2125 | 1.8915 ** |
| (0.7748) | (0.7372) | (0.7777) | (0.7616) | |
| RETVAR | 0.2592 *** | 0.2475 *** | 0.2593 *** | 0.2052 *** |
| (0.0775) | (0.0758) | (0.0775) | (0.0708) | |
| INT | −0.0049 | −0.0078 | −0.0082 | −0.0848 * |
| (0.0703) | (0.0626) | (0.0687) | (0.0509) | |
| Constant | 21.3302 ** | 20.6831 ** | 21.4507 ** | 10.02168 |
| (9.9547) | (8.9949) | 9.8858 | (12.24913) | |
| N | 471 | 471 | 471 | 471 |
| R-squared | 0.4216 | 0.4151 | 0.4525 | 0.4525 |
| Adj R-square | 0.3604 | 0.3532 | 0.3946 | 0.3946 |
| F-stat | 6.8847 | 6.7022 | 7.8068 | 7.8068 |
| Fixed effect | Yes | Yes | Yes | Yes |
This table presents the estimates of model 1 using panel data regression with LEED-certified US REITs as the sample, investigating the effect of green certification on the cost of equity capital. CC (cost of equity capital) is calculated based on the Price Earnings Growth (PEG) ratio method of Easton (2004). G1 represents the percentage of buildings that are certified relative to the total number of buildings owned by REITi in year t. G2 represents the percentage of square feet of buildings that are certified relative to the total square feet of property owned by REITi in year t. G3 measures the average greenness score awarded by LEED divided by the number of properties owned by REITi in year t. GB is a dummy variable that takes the value 1 if the REIT has any LEED certification, and 0 otherwise. ROA (return on assets) is calculated as the ratio of net income to total assets. SIZE (firm size) is calculated by taking the natural log of the firm’s total assets. LEV (leverage) is calculated by dividing the liabilities by the total assets stated. MBR (market-to-book ratio) is calculated by dividing the market value by the equity book value. BETA is calculated by dividing the excess return on the stock by the excess return on the market. RETVAR (return variability) is calculated from the annual standard deviation of the daily stock price return. INT (interest coverage) is calculated by dividing earnings before interest and taxes by interest expense. ***, **, and * indicate significance at the 1%, 5%, and 10% level, respectively. The numbers in parentheses are robust standard errors.
Table 6.
The effect of corporate governance practices on green building implementation intensity. Sample of LEED-certified REITs.
Table 6.
The effect of corporate governance practices on green building implementation intensity. Sample of LEED-certified REITs.
| US LEED Green Building Certified REITs | ||||
|---|---|---|---|---|
| Variables | Greenness Scores | |||
| G1 | G2 | G3 | GB | |
| IO | 11.1341 ** | 15.5185 ** | 6.6523 ** | 1.1208 *** |
| (5.1683) | (6.0647) | (3.1179) | (0.3723) | |
| HHI | 11.8174 ** | 15.9192 ** | 7.3063 ** | 1.6341 *** |
| (5.7283) | (7.1691) | (3.5118) | (0.5538) | |
| ROA | −0.0530 | −0.2818 | 3.5118 | −0.0006 |
| (0.1426) | (0.2158) | (0.0813) | (0.0107) | |
| SIZE | 4.5189 *** | 5.2794 *** | 2.7473 *** | 0.4263 *** |
| (1.0096) | (1.2525) | (0.6263) | (0.0740) | |
| LEV | −4.1059 | −4.6134 | −2.9407 | −1.0388 ** |
| (7.4113) | (8.4582) | (4.5515) | (0.4204) | |
| MBR | -0.0560 ** | -0.0519 | −0.0283** | −0.0021 |
| (0.0234) | (0.0356) | (0.0139) | (0.0036) | |
| BETA | −2.2109 *** | −2.4552 *** | −1.3330 *** | 0.0239 |
| (0.6810) | (0.7607) | (0.4039) | (0.0710) | |
| RETVAR | −0.0112 | −0.0681 | −0.0068 | −0.0122 *** |
| (0.0389) | (0.0635) | (0.0234) | (0.0036) | |
| INT | 0.0593 | 0.0518 | 0.0265 | −0.0166 *** |
| (0.0903) | (0.0602) | (0.0478) | (0.0035) | |
| Constant | −70.8656 *** | −83.3912 *** | −42.7595 *** | −6.3359 *** |
| (15.1394) | (18.2028) | (9.2997) | (1.0723) | |
| N | 471 | 471 | 471 | 471 |
| R-squared | 0.5839 | 0.6257 | 0.5970 | 0.5279 |
| Adj R-square | 0.5388 | 0.5851 | 0.5533 | 0.4767 |
| F-stat | 12.9361 | 15.4066 | 13.6548 | 10.3082 |
| Fixed effect | Yes | Yes | Yes | Yes |
This table presents estimates from panel data regressions using US LEED-certified REITs as the sample, investigating the effect of corporate governance practices on green building implementation intensity. The dependent variables are G1, G2, G3, and GB. G1 represents the percentage of buildings that are certified relative to the total number of buildings owned by REITi in year t. G2 represents the percentage of square feet of buildings that are certified relative to the total square feet of property owned by REITi in year t. G3 measures the average greenness score awarded by LEED divided by the number of properties owned by REITi in year t. GB is a dummy variable that takes the value 1 if the REIT has any LEED certification, and 0 otherwise. The explanatory variables include IO and HHI. IO (institutional ownership) ranges from 0 to 1. HHI (ownership concentration) is calculated as the sum of the squares of the ownership percentages of all equity holders who hold at least 5% of the equity. ROA (return on assets) is calculated as the ratio of net income to total assets. SIZE (firm size) is calculated by taking the natural log of the firm’s total assets. LEV (leverage) is calculated by dividing the liabilities by the total assets stated. MBR (market-to-book ratio) is calculated by dividing the market value by the equity book value. BETA is calculated by dividing the excess return on the stock by the excess return on the market. RETVAR (return variability) is calculated from the annual standard deviation of the daily stock price return. INT (interest coverage) is calculated by dividing earnings before interest and taxes by interest expense. ***, **, and * indicate significance at the 1%, 5%, and 10% level, respectively. The numbers in parentheses are robust standard errors.
© 2020 by the authors. Licensee MDPI, Basel, Switzerland. This article is an open access article distributed under the terms and conditions of the Creative Commons Attribution (CC BY) license (http://creativecommons.org/licenses/by/4.0/).
Share and Cite
MDPI and ACS Style
Hsieh, H.-C.; Claresta, V.; Bui, T.M.N. Green Building, Cost of Equity Capital and Corporate Governance: Evidence from US Real Estate Investment Trusts. Sustainability 2020, 12, 3680. https://doi.org/10.3390/su12093680
AMA Style
Hsieh H-C, Claresta V, Bui TMN. Green Building, Cost of Equity Capital and Corporate Governance: Evidence from US Real Estate Investment Trusts. Sustainability. 2020; 12(9):3680. https://doi.org/10.3390/su12093680
Chicago/Turabian StyleHsieh, Hui-Ching, Viona Claresta, and Thi Minh Ngoc Bui. 2020. "Green Building, Cost of Equity Capital and Corporate Governance: Evidence from US Real Estate Investment Trusts" Sustainability 12, no. 9: 3680. https://doi.org/10.3390/su12093680
Note that from the first issue of 2016, this journal uses article numbers instead of page numbers. See further details here.