Article

Biodiversity of Microorganisms Colonizing the Surface of Polystyrene Samples Exposed to Different Aqueous Environments

1
Winogradsky Institute of Microbiology, Research Center of Biotechnology, Russian Academy of Sciences, 119071 Moscow, Russia
2
Institute of Bioengineering, Research Center of Biotechnology of the Russian Academy of Sciences, 119071 Moscow, Russia
3
Federal State Unitary Enterprise “All-Russian Scientific Research Institute of Aviation Materials”, State Research Center of the Russian Federation, 105005 Moscow, Russia
*
Author to whom correspondence should be addressed.
Sustainability 2020, 12(9), 3624; https://doi.org/10.3390/su12093624
Submission received: 25 March 2020 / Revised: 28 April 2020 / Accepted: 29 April 2020 / Published: 30 April 2020

Abstract

:
The contamination of marine and freshwater ecosystems with the items from thermoplastics, including polystyrene (PS), necessitates the search for efficient microbial degraders of these polymers. In the present study, the composition of prokaryotes in biofilms formed on PS samples incubated in seawater and the industrial water of a petrochemical plant were investigated. Using a high-throughput sequencing of the V3–V4 region of the 16S rRNA gene, the predominance of Alphaproteobacteria (Blastomonas), Bacteroidetes (Chryseolinea), and Gammaproteobacteria (Arenimonas and Pseudomonas) in the biofilms on PS samples exposed to industrial water was revealed. Alphaproteobacteria (Erythrobacter) predominated on seawater-incubated PS samples. The local degradation of the PS samples was confirmed by scanning microscopy. The PS-colonizing microbial communities in industrial water differed significantly from the PS communities in seawater. Both communities have a high potential ability to carry out the carbohydrates and amino acids metabolism, but the potential for xenobiotic degradation, including styrene degradation, was relatively higher in the biofilms in industrial water. Bacteria of the genera Erythrobacter, Maribacter, and Mycobacterium were potential styrene-degraders in seawater, and Pseudomonas and Arenimonas in industrial water. Our results suggest that marine and industrial waters contain microbial populations potentially capable of degrading PS, and these populations may be used for the isolation of efficient PS degraders.

Graphical Abstract

1. Introduction

Polystyrene (PS) is a high-molecular-mass synthetic glassy polymer with a linear structure, which is produced industrially by styrene radical polymerization. PS is a physiologically safe and cheap thermoplastic, which is widely used for the production of disposable tableware, medical equipment, packaging, in the construction industry, etc. Out of 61.8 Mt of plastics produced in Europe in 2018, PS production accounted for ~18 Mt [1]. The large scale of PS production and its resistance to biodegradation results in the contamination of freshwater and marine ecosystems with this plastic [2,3,4,5]. In 2015, the global plastic pollution of the oceans was estimated to weigh between 93,000 and 236,000 metric tons [3]. These results are larger than the global estimates by Eriksen et al. [4] but account for ~1% of the plastic input to the ocean, which weighed 4.8–12.7 million metric tons in 2010 alone, according to Jambeck et al. [5]. A potential environmental risk of contamination of marine and freshwater ecosystems with plastics has been reported [6].
Recently, plastics as habitats for biofilm-forming microorganisms have been a focus of attention [7,8,9]. Plastics arriving into aquatic ecosystems are colonized by microbial biofilms, containing bacteria, algae, fungi, diatoms, and protozoa, which are embedded in the extracellular polymer matrix [10,11]. Biofilms enhance microbial activity; they protect microorganisms from UV-radiation, high salinity, heavy metals, and antibiotics [10,11,12]. The composition of biofilms formed on polymer substrates incubated in the North Sea [8], in the Pacific and Atlantic oceans [7], in the Baltic Sea [13,14,15], in the Mediterranean Sea [16], and in urban freshwater ecosystems [17] has been investigated. Specific microbial communities different from those of the ambient ocean water and from assemblages on natural seston were shown to form on plastic. These communities may be involved in plastic decomposition [14,16,18]. Since the available literature indicates the differences between microbial communities from marine and freshwater habitats, screening for potential plastic degraders specific to these habitats is required for their further biotechnological application.
PS is less susceptible to biodegradation [19,20] than the polymers with hydrolyzed functional groups in the main chain, such as polyethylene terephthalate [21]. Its degradation under natural conditions and the observed decrease in its molecular mass are caused by both biotic and abiotic factors [22]. The carbonyl groups (=C=O) resulting from UV irradiation or oxidation are considered more vulnerable to microbial attacks. The purified hydroquinone peroxidase (EC 1.11.1.7) from a lignin-degrading bacterium, Azotobacter beijerinckii HM121, decomposed PS in a two-phase system consisting of dichloromethane and water [23]. The application of whole cells, rather than purified enzymes, is, however, economically preferable. There are only a few reports on PS degradation by Actinomycetes, Arthrobacter, E. coli, Micrococcus, Pseudomonas, and Rhodococcus ruber strains [24,25,26].
PS degradation involves the colonization of its surface by a microbial community and the subsequent action of the presently unidentified exoenzymes, which degrade the polymer to oligomers and even to monomers [25,27]. Microbial communities or mixed cultures were shown to carry out a more efficient PS degradation than pure microbial cultures [28,29]. A promising PS-degrading strain, Exiguobacterium sp. YT2, was isolated from the guts of Tenebrio molitor L. larvae, which can feed on foamed PS [30].
A wide range of phylogenetically diverse aerobic bacteria can degrade styrene, the PS monomer [26]. Under oxic conditions, styrene is usually metabolized via side chain oxidation (the “upper pathway”) [31,32]. The key enzymes of this styrene-specific pathway are styrene monooxygenase (SMO; 1.14.14.11), which oxidizes styrene to styrene oxide, as well as styrene oxide isomerase (SOI, 5.3.99.7), which transforms it into phenylacetaldehyde. Phenylacetaldehyde dehydrogenase (PAD, 1.2.1.39) converts phenylacetaldehyde to phenylacetic acid, the major intermediate metabolite. Phenylacetic acid is then incorporated into other bacterial metabolic processes via a number of pathways. The functional genes encoding the enzymes of this pathway are organized in the sty-operon, in which styA/styB encodes the two-component styrene monooxygenase, styC encodes styrene oxide isomerase, and styD encodes phenylacetaldehyde dehydrogenase.
A less common pathway of aerobic styrene degradation begins with oxidation of the aromatic nucleus by styrene 2,3-dioxygenase (1.14.12.-) to styrene cis-glycol. This pathway is not specific to styrene and may be used for oxidation of other aromatic compounds, such as ethylbenzene, toluene, and phenol [33]. Anaerobic styrene degradation by microbial associations and members of the genus Enterobacter was also shown. However, the pathways of such degradation and the genetic aspects and enzyme systems involved are still insufficiently studied [34].
The goal of the present work was to investigate the phylogenetic diversity of prokaryotes in the biofilms formed on PS surfaces in aquatic media (industrial water and seawater). The putative bacterial community functional profiles were predicted using 16S rRNA amplicon data. In addition, we determined the potential capacity of detected bacteria for styrene degradation using in silico search for genetic determinants of styrene degradation in the genomes of phylogenetically related bacteria.

2. Materials and Methods

2.1. Incubation of PS Samples

The preparation of PS samples for incubation in aquatic media was carried out using the methods described previously [35]. PS samples (100 × 10 × 2 mm) were immersed into aquatic media near cities in different regions of Russia: Gelendzhik (near Cape Tonkiy, the Black Sea) and Ufa. The samples G10, G40, and G60 (the Marine group) were incubated in August-September 2018 in Black Sea salt water at 1-m depth for 10, 40, and 60 days, respectively. The average, maximal, and minimal temperatures of seawater in the area of Cape Tonkiy were 26.8, 26.0, and 27.8°C, respectively, in August and 25.1, 22.8, and 26.7 °C, respectively, in September 2018. The samples U10, U20, U40, and U60 (the Industrial group) were incubated for 10, 20, 40, and 60 days, respectively, at 14 to 27 °C in the block with recycling industrial water (the Ufaorgsintez petrochemical plant, Ufa). When microbial numbers in recycling water exceeded 105 cells/mL, 10% alkaline solution of sodium hypochlorite, an antiseptic widely used for water disinfection, was added to the block [36]. The samples U20, U40, and U60 were subjected to such treatment simultaneously (after 17 days of incubation). Then, the sample U20 was recovered, while the samples U40 and U60 were incubated further, to a total incubation time of 40 and 60 days, respectively.

2.2. Analytical Methods

The chemical composition of the waters was determined with a Biotronic ion chromatograph [37]. Alkalinity, total hardness, and total Fe2+/Fe3+ were determined with an Aquamerck alkalinity analytic kit, an Aquamerck Total Hardness kit, and an Iron Test kit (Merck, Darmstadt, Germany), respectively. The values of pH were determined using an Anion ionometer (Novosibirsk, Russia) with relevant electrodes. The determination of the chemical oxygen demand index was performed according to GOST 31859-2012 (Russian State Standard), following the standard procedures by the Russian Federation Gosstandart. The measurements were performed in three replicates.

2.3. Microbial Community Analysis

DNA Extraction: Microbial biomass was washed off the surface of PS specimens with ethanol (1:1, vol/vol) and filtered through membrane filters with 0.22-μm pores (Millipore, Temecula, CA, USA). The filters were then treated with a solution containing 0.15 M NaCl and 0.1 M Na2EDTA (pH 8.0), and used to isolate DNA. DNA was extracted using the Pure Link Microbiome DNA Purification KIT (Thermo Fisher Scientific, Bartlesville, OK, USA) according to the manufacturer’s recommendations.
High-Throughput Sequencing of 16S rRNA Gene Fragments and Their Analysis: DNA isolated from the biofilms grown on PS specimens was used to amplify the V3–V4 hypervariable region of the 16S rRNA gene with the universal Pro341F–Pro805R primer system described by Takahashi et al. [38]. The 16S rRNA gene fragments were amplified using 5× Taq Red buffer and HS Taq polymerase (Evrogen, Moscow, Russia). The reaction mixture contained 5 µL of each primer (6 µM concentration), 5 µL DNA solution, and 15 µL PCR mix (1 U polymerase, 0.2 mM of each dNTP, and 2.5 mM Mg2+). The DNA was amplified using the iCycler thermocycler model from Bio-Rad (Hercules, CA, USA). The PCR reaction conditions for DNA amplification were as recommended by Takahashi et al. [38]: initial denaturation at 98 °C for 2 min, followed by 35 cycles of annealing beginning at 65 °C and ending at 55 °C for 15 s, and elongation at 68 °C for 30 s. The annealing temperature was lowered 1 °C for every cycle until reaching 55 °C, and then used for the remaining cycles. Fragments of the 16S rRNA gene were amplified on the template of DNA isolated from each specimen in three replicates, which were subsequently combined and purified by electrophoresis in a 2% agarose gel using a Cleanup Standard gel extraction kit (Evrogen, Russia). High-throughput sequencing was performed using the MiSeq system (Illumina, San Diego, CA, USA) with a MiSeq Reagent Kit v3 (600 cycles) (Illumina), as recommended by the manufacturer.
The reads were further processed according to the following workflow, implementing suitable scripts from USEARCH v.10 [39]. Pair-end reads were demultiplexed (-fastx_demux), merged (-fastq_mergepairs), trimmed in order to remove the primer sequences (-fastx_truncate), and then quality-filtered (-fastq_filter). UNOISE3 [40] was used to generate zero radius operational taxonomic units (OTUs). Zero radius OTU is a term specific to analysis with UNOISE, referring to operational taxonomic units which were generated by an error correction algorithm as opposed to a sequence similarity clustering algorithm [41]. Raw merged read pairs were mapped back to OTUs using the -otutab command. Zero radius OTUs were submitted for taxonomic analysis in the SILVA database (SINA, https://www.arb-silva.de/aligner/, April 2020, version 1.2.11 [42], SILVA reference database release 138) using default settings. The OTUs that could not be assigned to the Bacteria or Archaea were discarded prior to the analyses. These OTUs were excluded manually based on the SILVA classification. The alpha-diversity and beta-diversity of the bacterial communities were estimated by -alpha_div and -beta_div workflows. Rarefaction curves were obtained using the -alpha_div_rare command. The beta-diversity of taxon abundance tables was visualized through the non-metric multidimensional scaling (NMDS) of Bray-Curtis distances using the “metaMDS” function in the R package Vegan version 2.5–6 (https://cran.ism.ac.jp/web/packages/vegan/vegan.pdf, 1 September 2019) [43]. Permutational ANOVA (PERMANOVA), using the PRIMER 7 PERMANOVA+ software [44], was applied to test for differences in microbial community composition (Bray-Curtis distances) between the studied locations, using a one-factor design with the site (Marine or Industrial group) as fixed factor and the incubation times as replicates. Venn diagrams were constructed using the online tool InteractiVenn [45].
The iVikodak software package [46] was applied to predict the functional characteristics of bacterial communities, using a phylogenetic analysis of the 16S amplicon data, generated from the studied samples. The list of genera for all 16S rRNA gene libraries based on the OTUs table (% of total reads for each library) was provided as input in iVikodak. The Global Mapper module was used for inferring functional profiles, and Local Mapper was used for predicting individual pathway enzyme profiles using the KEGG pathway database. Pathway exclusion cut-off (PEC) was set at 80 to strengthen the confidence of the data. Relevant heatmaps based on the results of the metabolic inference on genus level were constructed using the ClustVis [47] online resource (http://biit.cs.ut.ee/clustvis/, April 2020). The search for the genes of styrene degradation was carried out using the KEGG (https://www.genome.jp/kegg/pathway.html, release 94.0, 1 April 2020), PATRIC (https://www.patricbrc.org, version 3.6.3, September–December 2019), and NCBI (https://blast.ncbi.nlm.nih.gov/Blast.cgi, BLAST+ 2.10.0, 16 December 2019) online databases and services. The gene cluster of sty-operon in genomes was compared using the Gene Graphics tool [48].

2.4. Scanning Electron Microscopy (SEM)

The biofilms on the surface of PS samples were fixed, dehydrated, and coated with gold as described previously [49]. Bacterial biofilms and the surface of PS specimens were investigated using a VEGA 3 XMU scanning microscope (TESCAN, Brno, Czech Republic) and the ADVANCED AZTEC Energy system of energy dispersion microanalysis (including Inca Energy 350) based on an X-MAX 50 STANDARD EDS detector (Oxford Instruments Nano-Analysis, Oxford, UK) at an acceleration voltage of 2 kV.

2.5. Nucleotide Sequence Accession Numbers

The obtained libraries of 16S rRNA gene fragments from bacterial biofilms of PS specimens were deposited into the NCBI SRA database with the accession number SRR11344280–SRR11344287.

3. Results

3.1. Physicochemical Characteristics of Aqueous Environments

The total salinity and hardness of the recirculated water of the petrochemical plant were lower than in the seawater (Table 1). Temperature variations at the incubation sites in the marine basin were caused by diurnal fluctuations and were within the range of the temperatures for industrial recycling water. The chemical oxygen demand (COD) of industrial water decreased in the course of incubation from 103 to 72 mg O2/dm3, which indicated a gradual removal of harmful contaminants from the recycling water during this period. The seawater and industrial water samples were alkaline (pH 7.8–8.5).

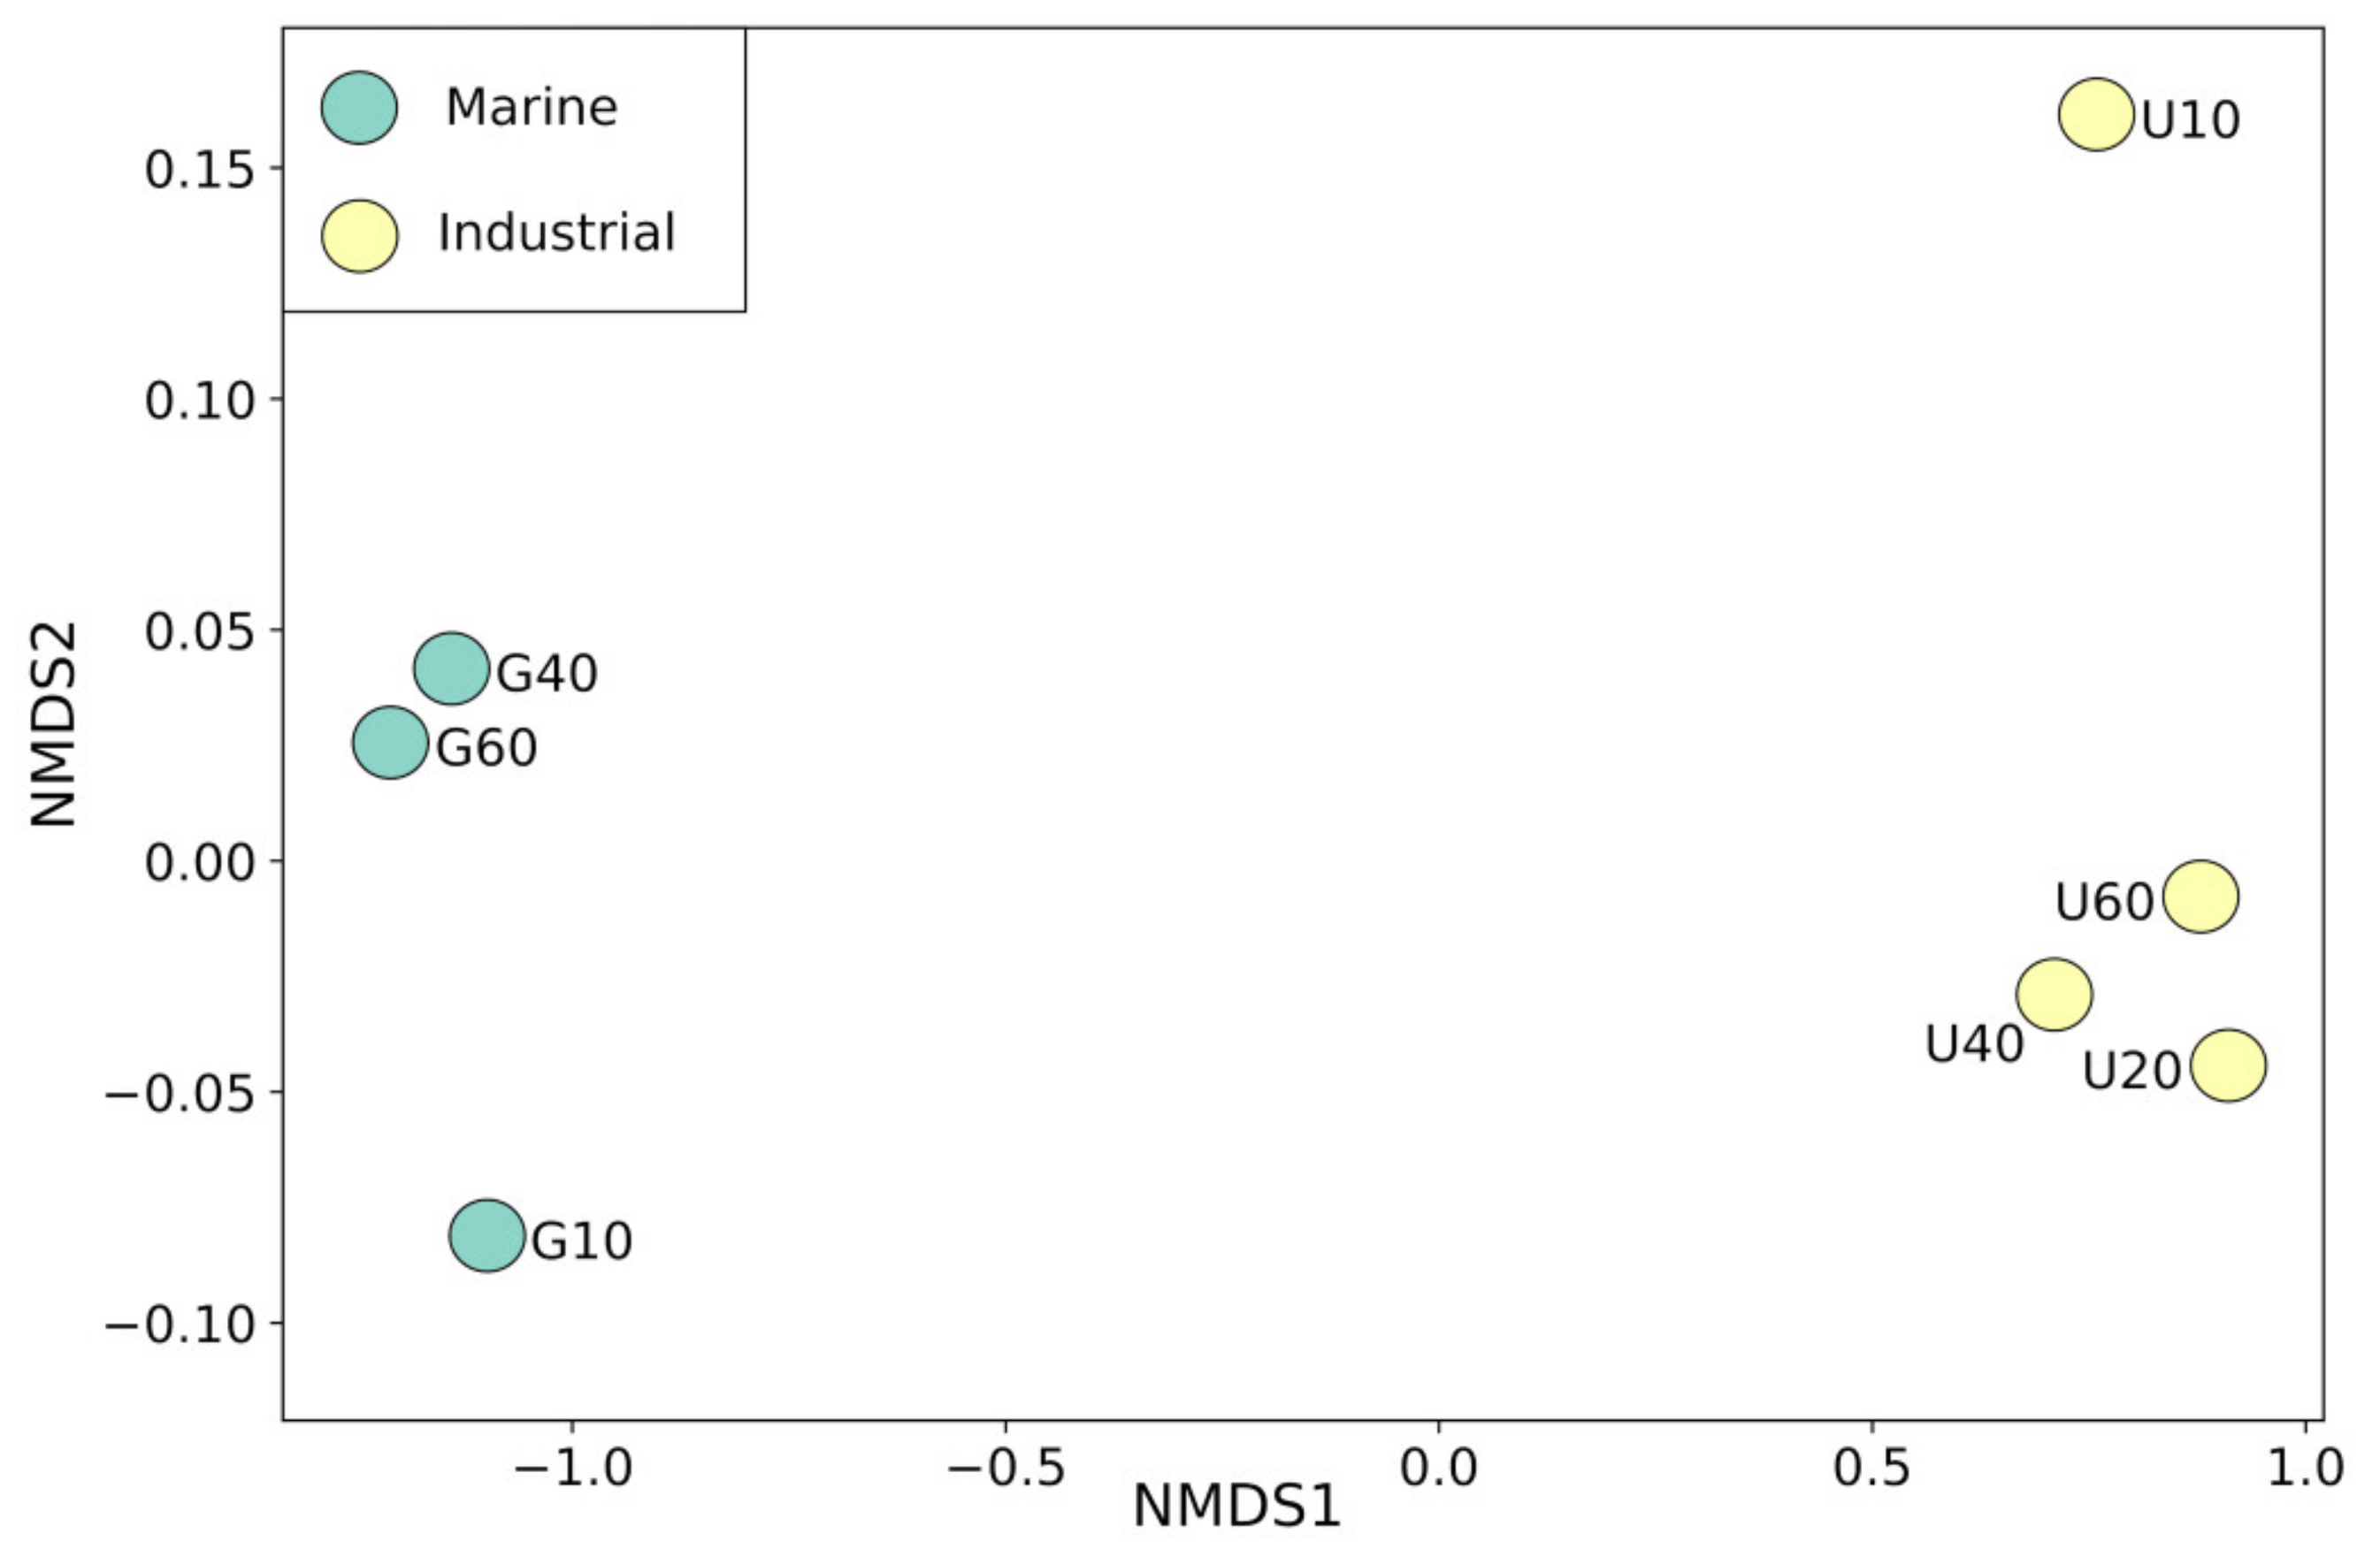
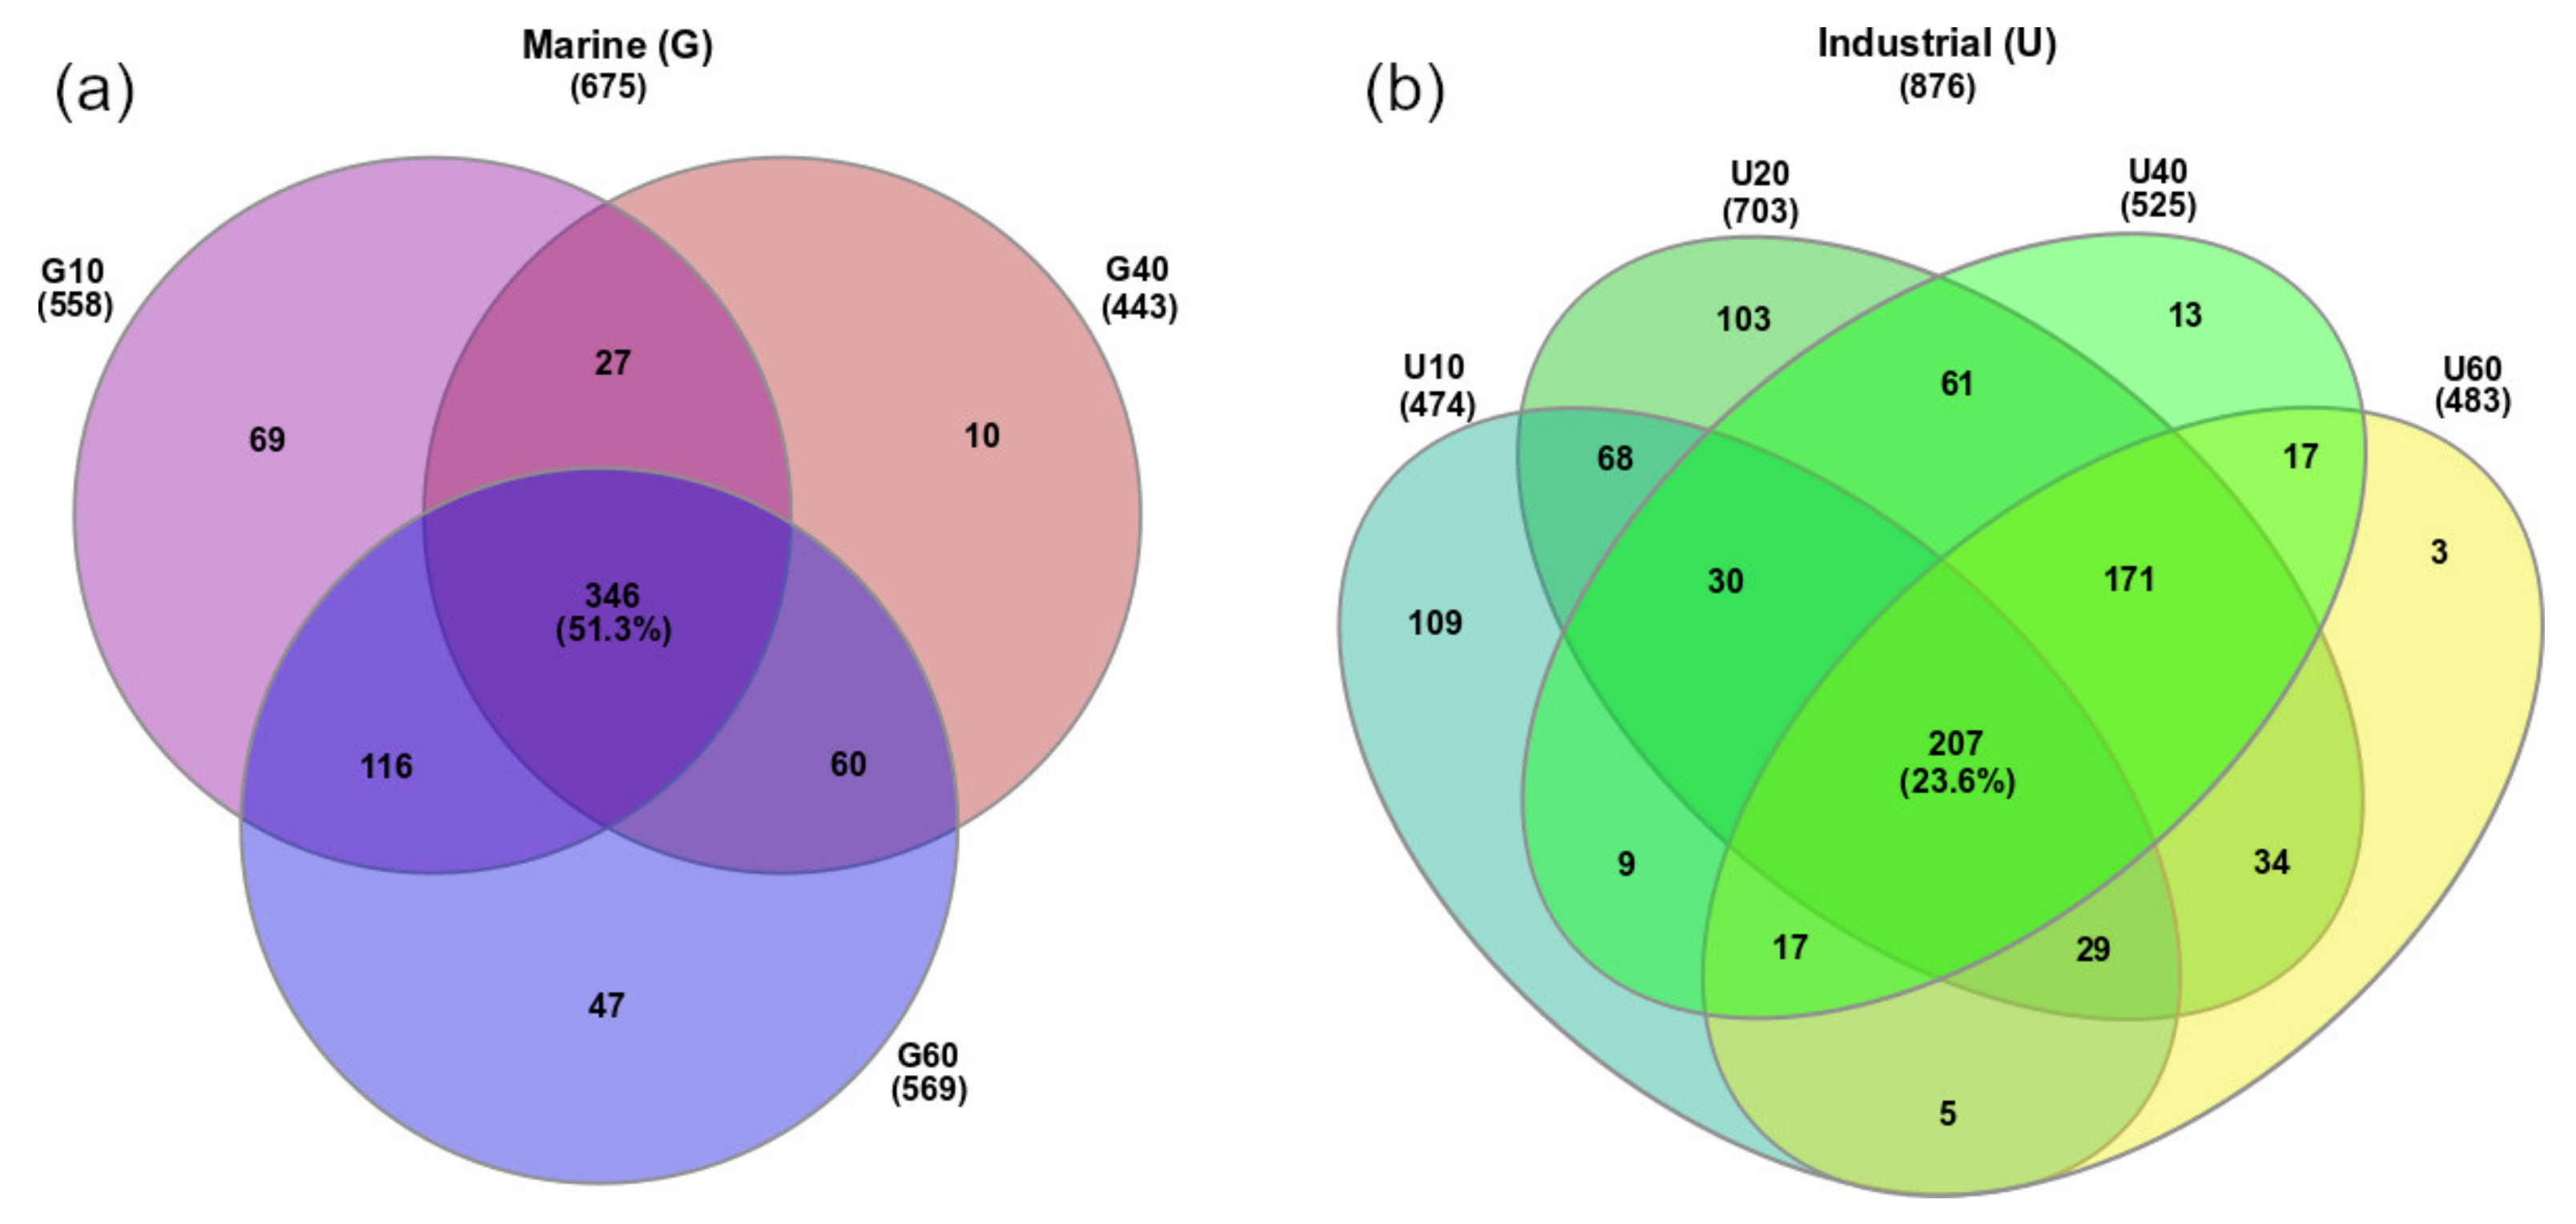
3.2. Analysis of Bacterial Diversity in Biofouling Colonizing PS Specimens in Aqueous Environments

High-throughput sequencing of the V3–V4 region of the 16S rRNA gene resulted in a total of 248,776 16S rRNA gene fragments (reads) for the libraries from seven samples of microbial biofilms growing on PS. For the molecular studies, we used only one PS specimen at each time of sampling. Thus, combining all samples across time within a site, we carried out a comparison between the two sites. The sequences were grouped into 1372 operational taxonomic units (OTUs). The numbers of detected OTUs, alpha diversity, and rarefaction curves data obtained after amplicon sequencing are presented in Appendix A, Figure A1. The rarefaction curves were saturated after 5–10 thousand reads, indicating that sufficient coverage was obtained in this study. Diversity indices for the libraries from both incubation sites are shown in Table 2.
For the libraries of the samples incubated in the Black Sea water (the Marine group) and in the industrial water (the Industrial group), the Shannon–Weaver indices were similar. Biofilms of the Industrial group had the lowest values of diversity indices and the highest value of the dominance index in sample U10. The highest diversity indices were found in sample U20, which was incubated for 20 days. The Shannon–Weaver and Simpson indices from the samples collected after antimicrobial chemical treatment decreased till the end of incubation. The comparison of the OTUs in the libraries using Venn diagrams gives a dynamic visual representation of changes in microbial diversity on PS in industrial water and seawater (Appendix A, Figure A2a,b). The analysis of beta-diversity using Bray–Curtis dissimilarity and multivariate analysis (PERMANOVA) revealed significant differences in the bacterial community structure of Marine and Industrial groups (Figure 1, PERMANOVA: 999 permutations, pseudo F = 3.62, p-value = 0.04).

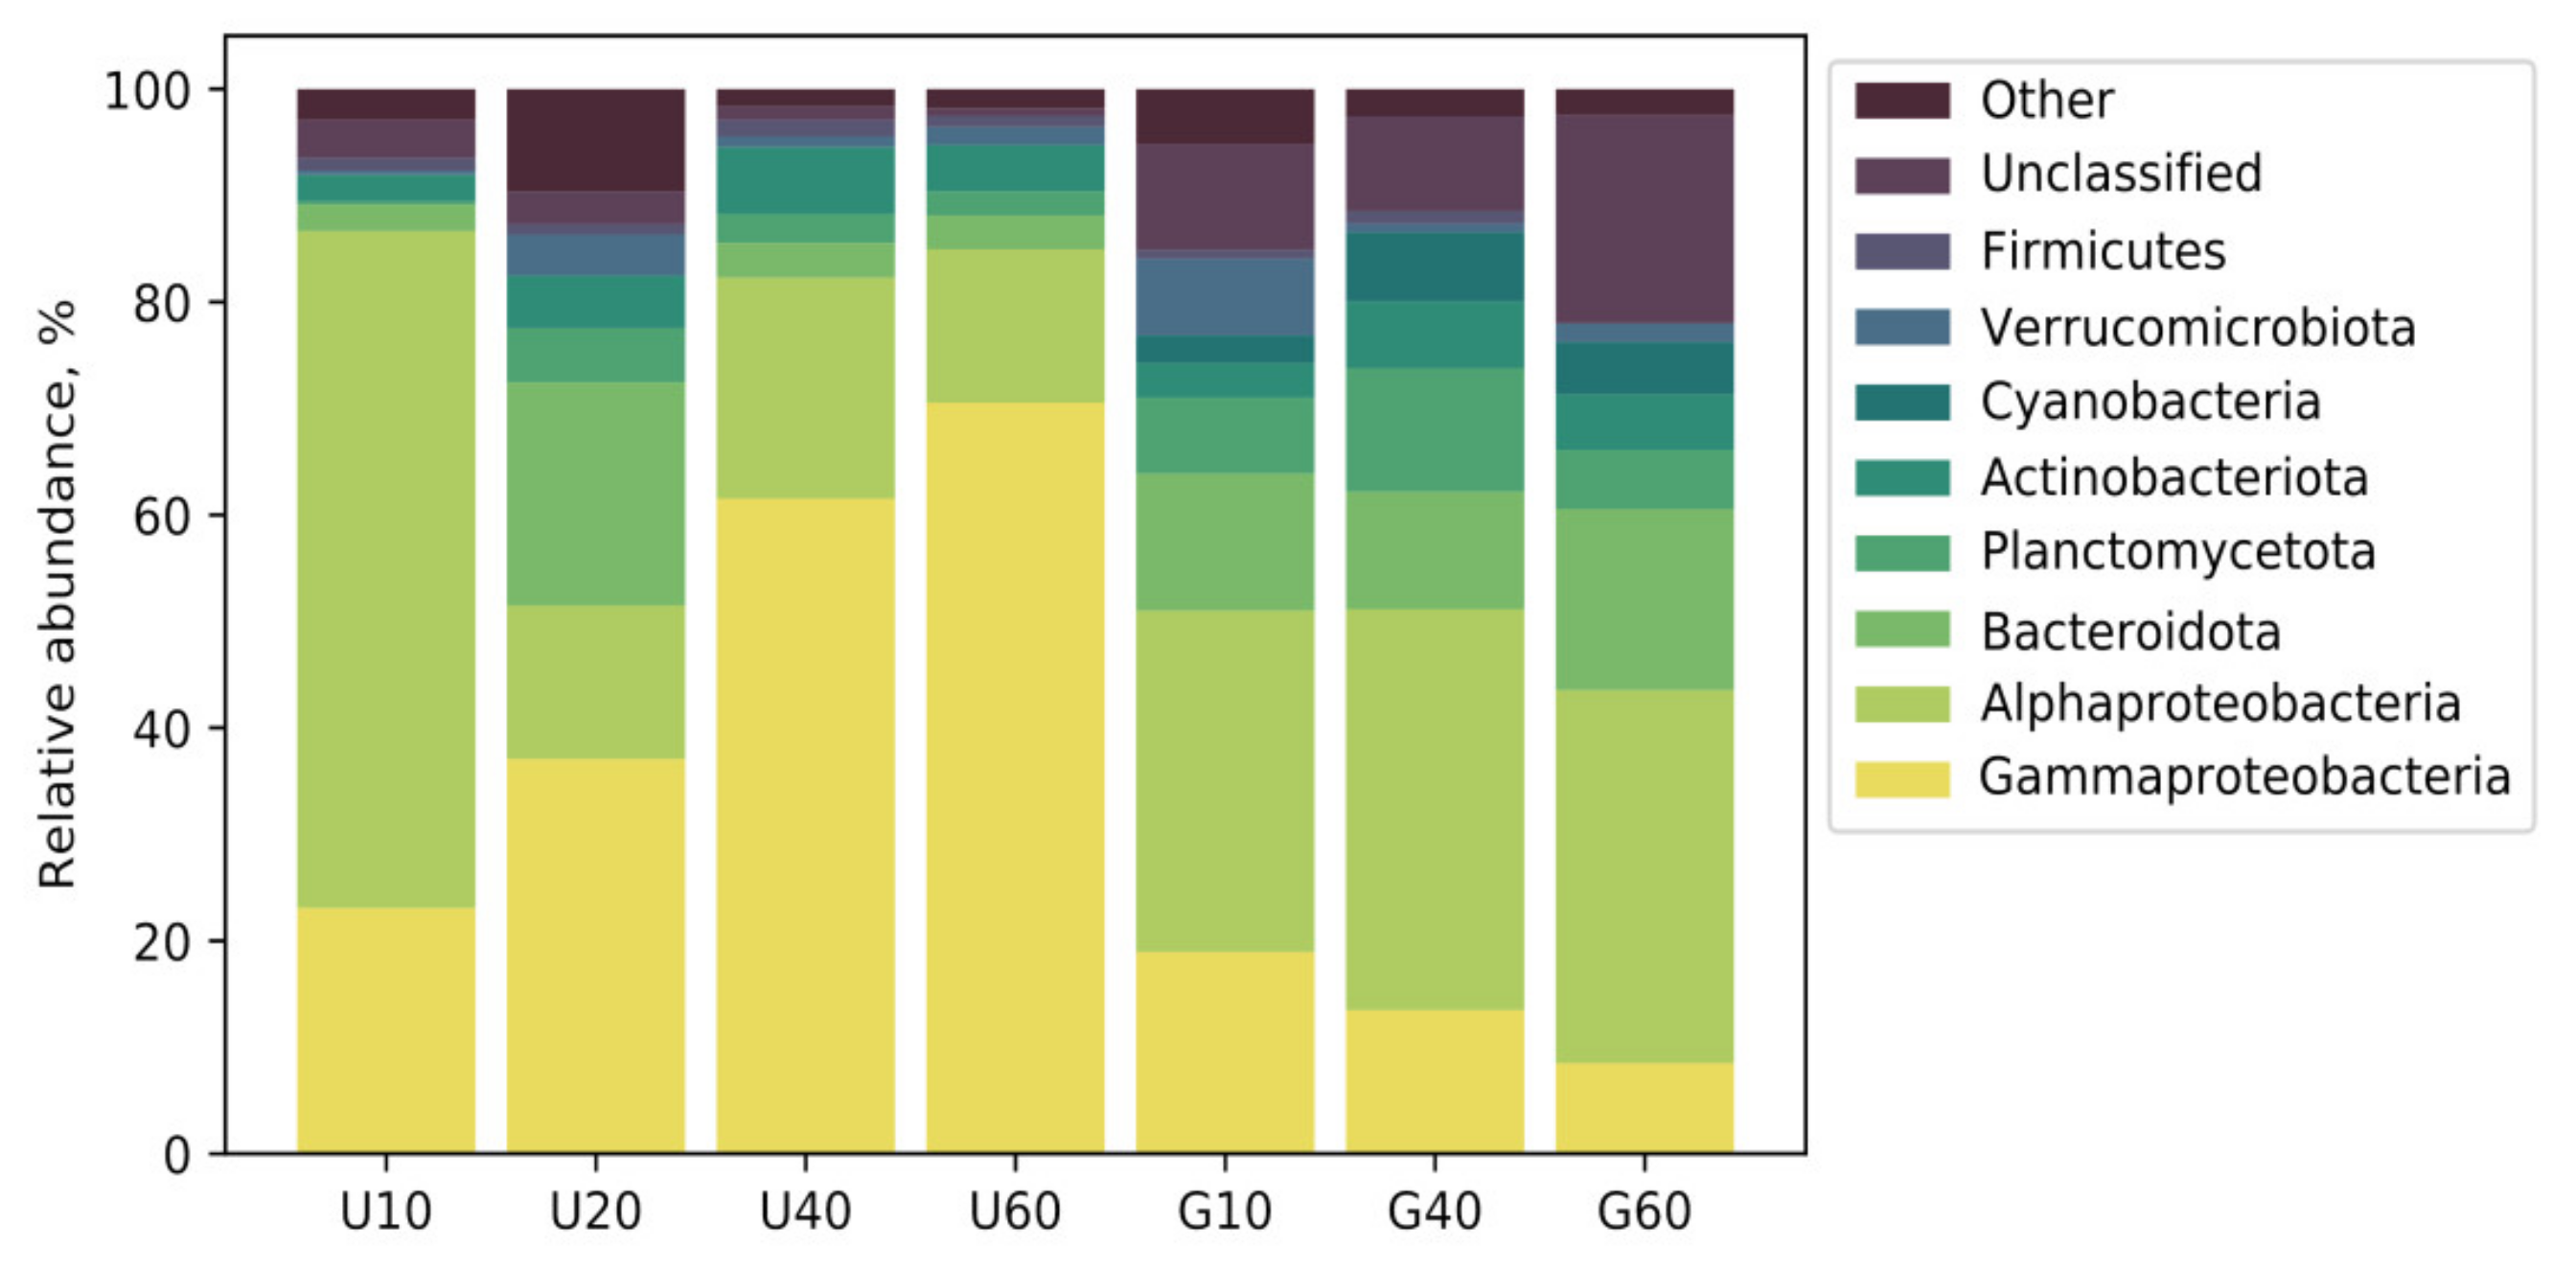
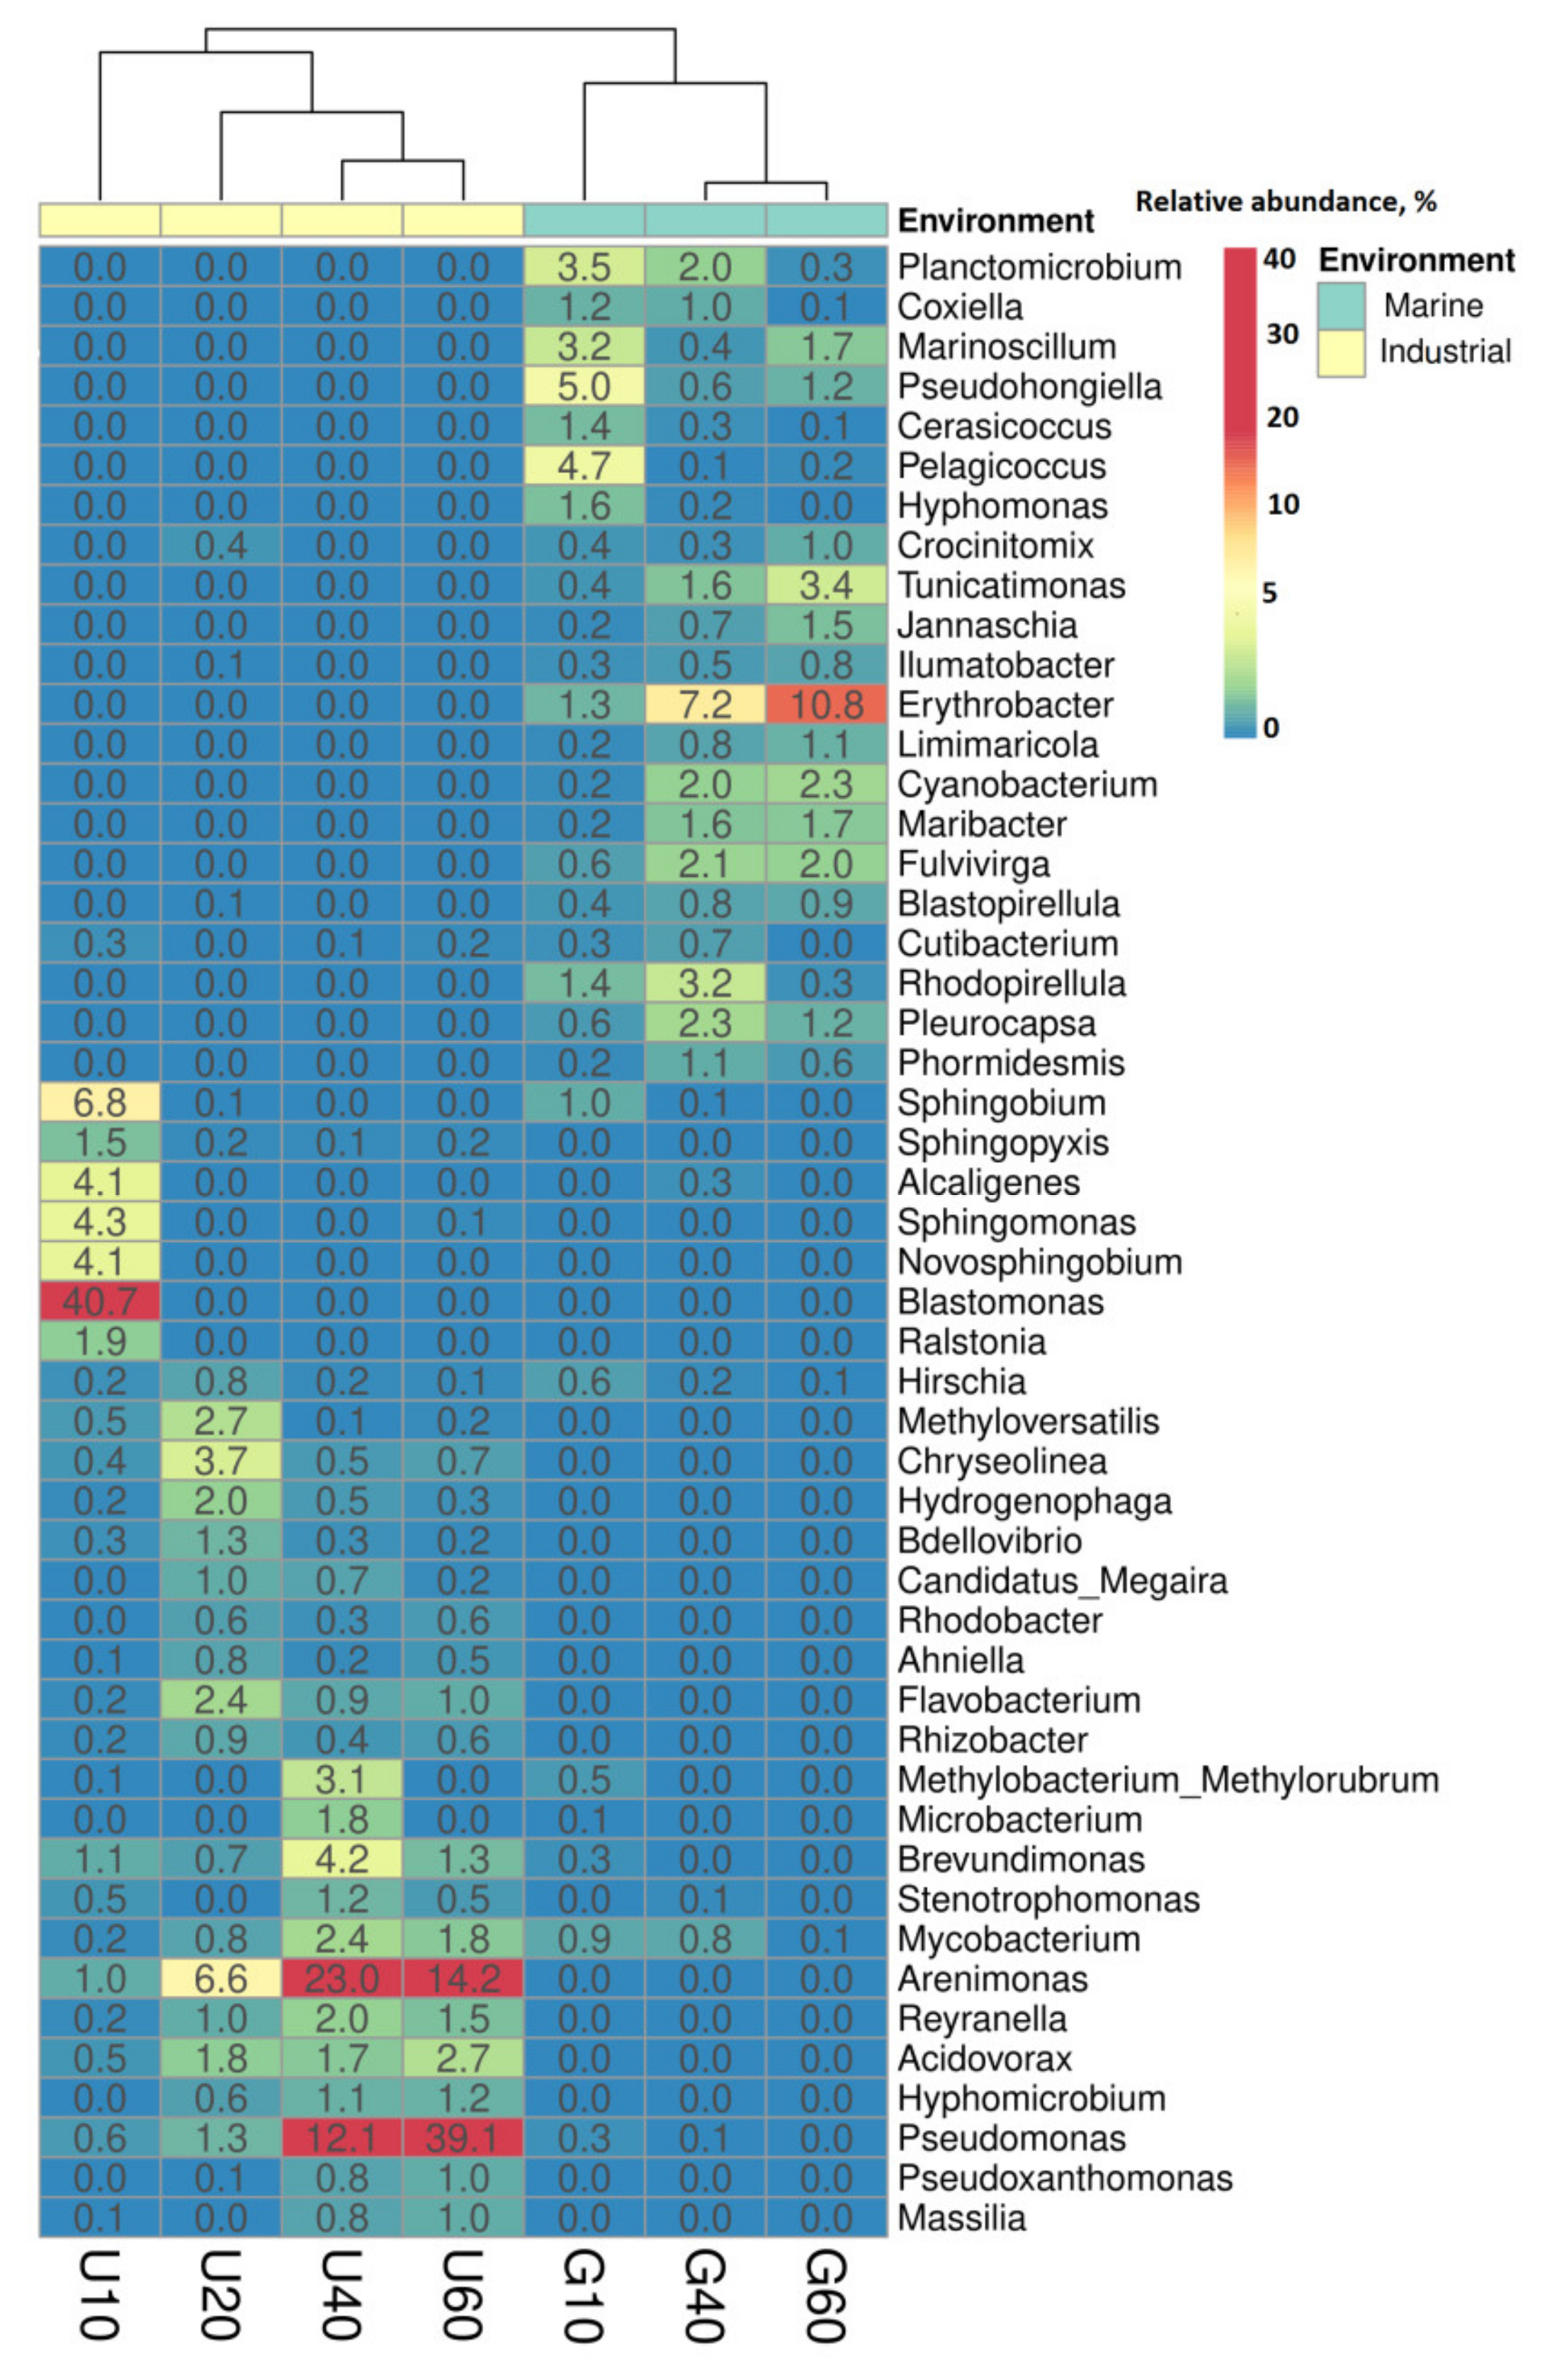
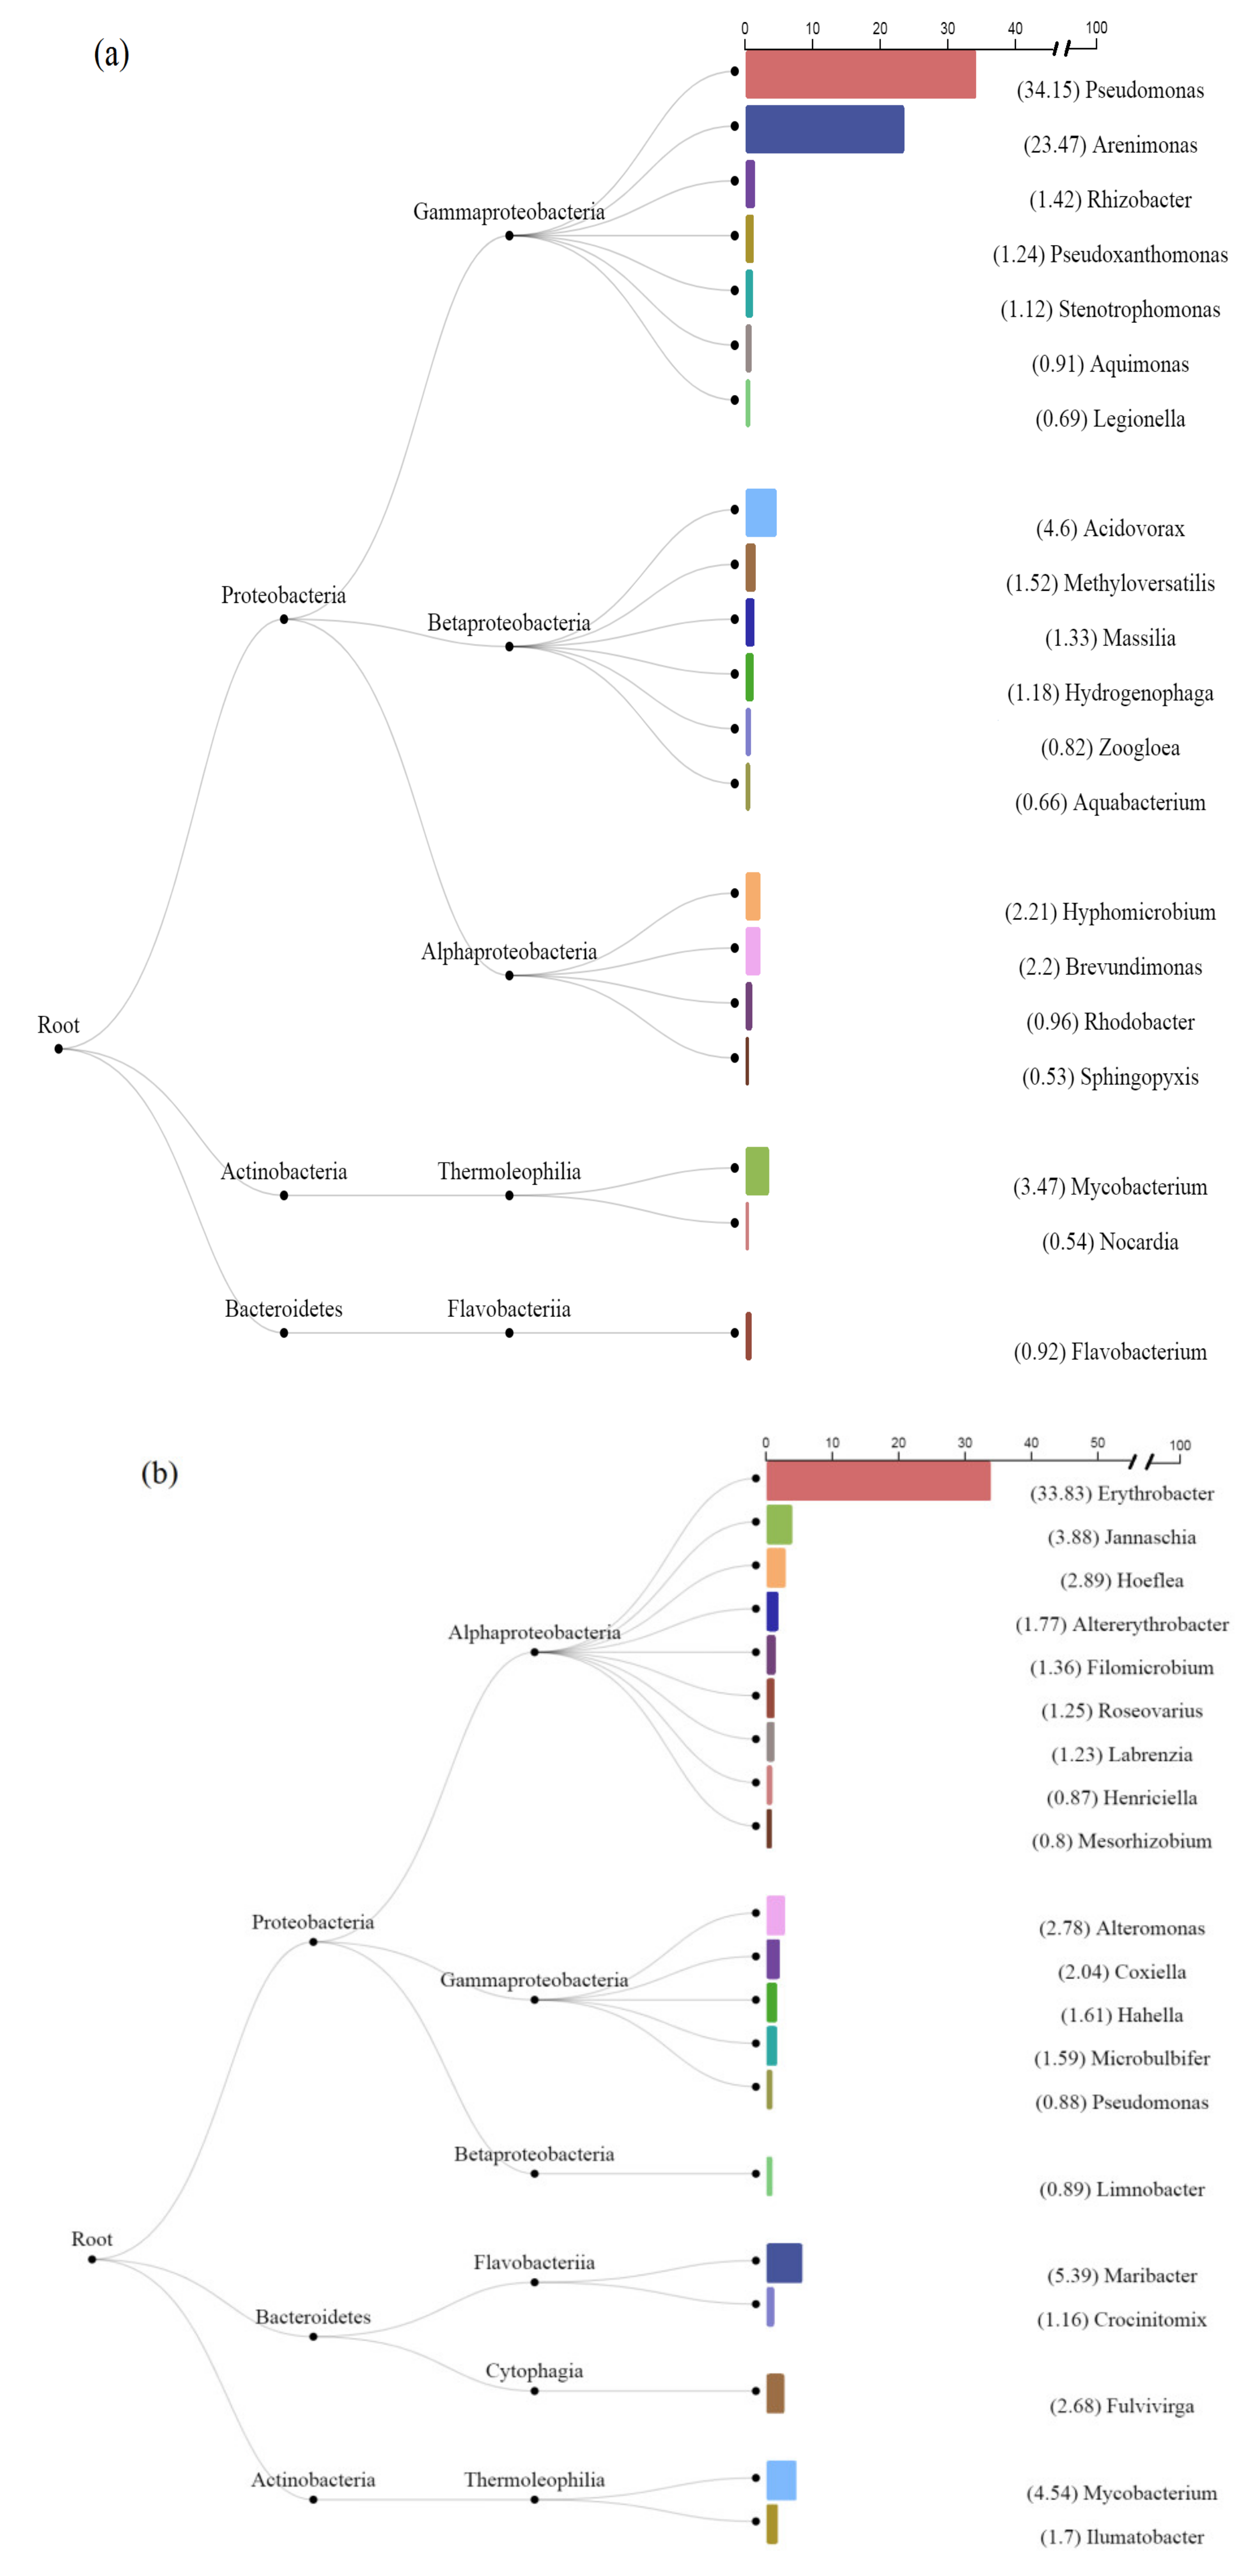
3.3. Prokaryotes Phylogenetic Diversity in Biofilms Formed on PS Samples

As a result of the high-throughput sequencing of the 16S rRNA genes, only members of the Bacteria domain were found in the studied biofilms, while Archaea were not detected. At the phylum/class level, the communities were dominated by members of Alphaproteobacteria (14.4–63.6% of the total number of sequences in the library), Gammaproteobacteria (8.5–70.5%), Bacteroidota (2.5–20.9%), Actinobacteriota (2.4–6.3%), Planctomycetota (0.3–11.6%), and Verrucomicrobiota (0.4–7.2%) (Figure 2; Appendix A, Table A1).
The taxonomic composition of the 50 most relative abundant genera varied both from group to group and between the libraries of each group (Figure 3; Appendix A, Table A1). In the U10, community bacteria of the genus Blastomonas (Alphaproteobacteria) (40.7%) predominated. In the course of longer incubation (samples U20–U60), the community composition changed in favor of members from the genera Chryseolinea (Bacteroidetes), Arenimonas, and Pseudomonas (Gammaproteobacteria). In the Marine group communities, during the incubation, the proportion of the genus Erythrobacter (Alphaproteobacteria) increased and that of the genera Pelagicoccus (Verrucomicrobiota), Pseudohongiella (Gammaproteobacteria), and Planctomicrobium (Planctomycetota) decreased.

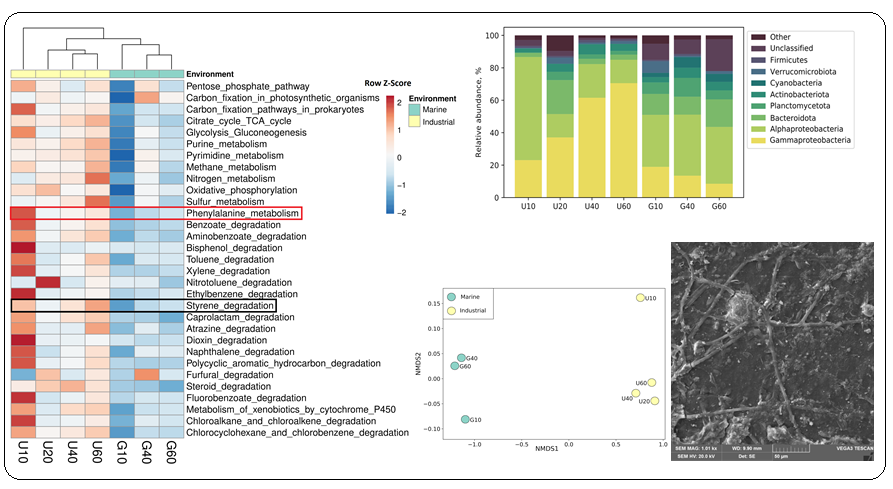
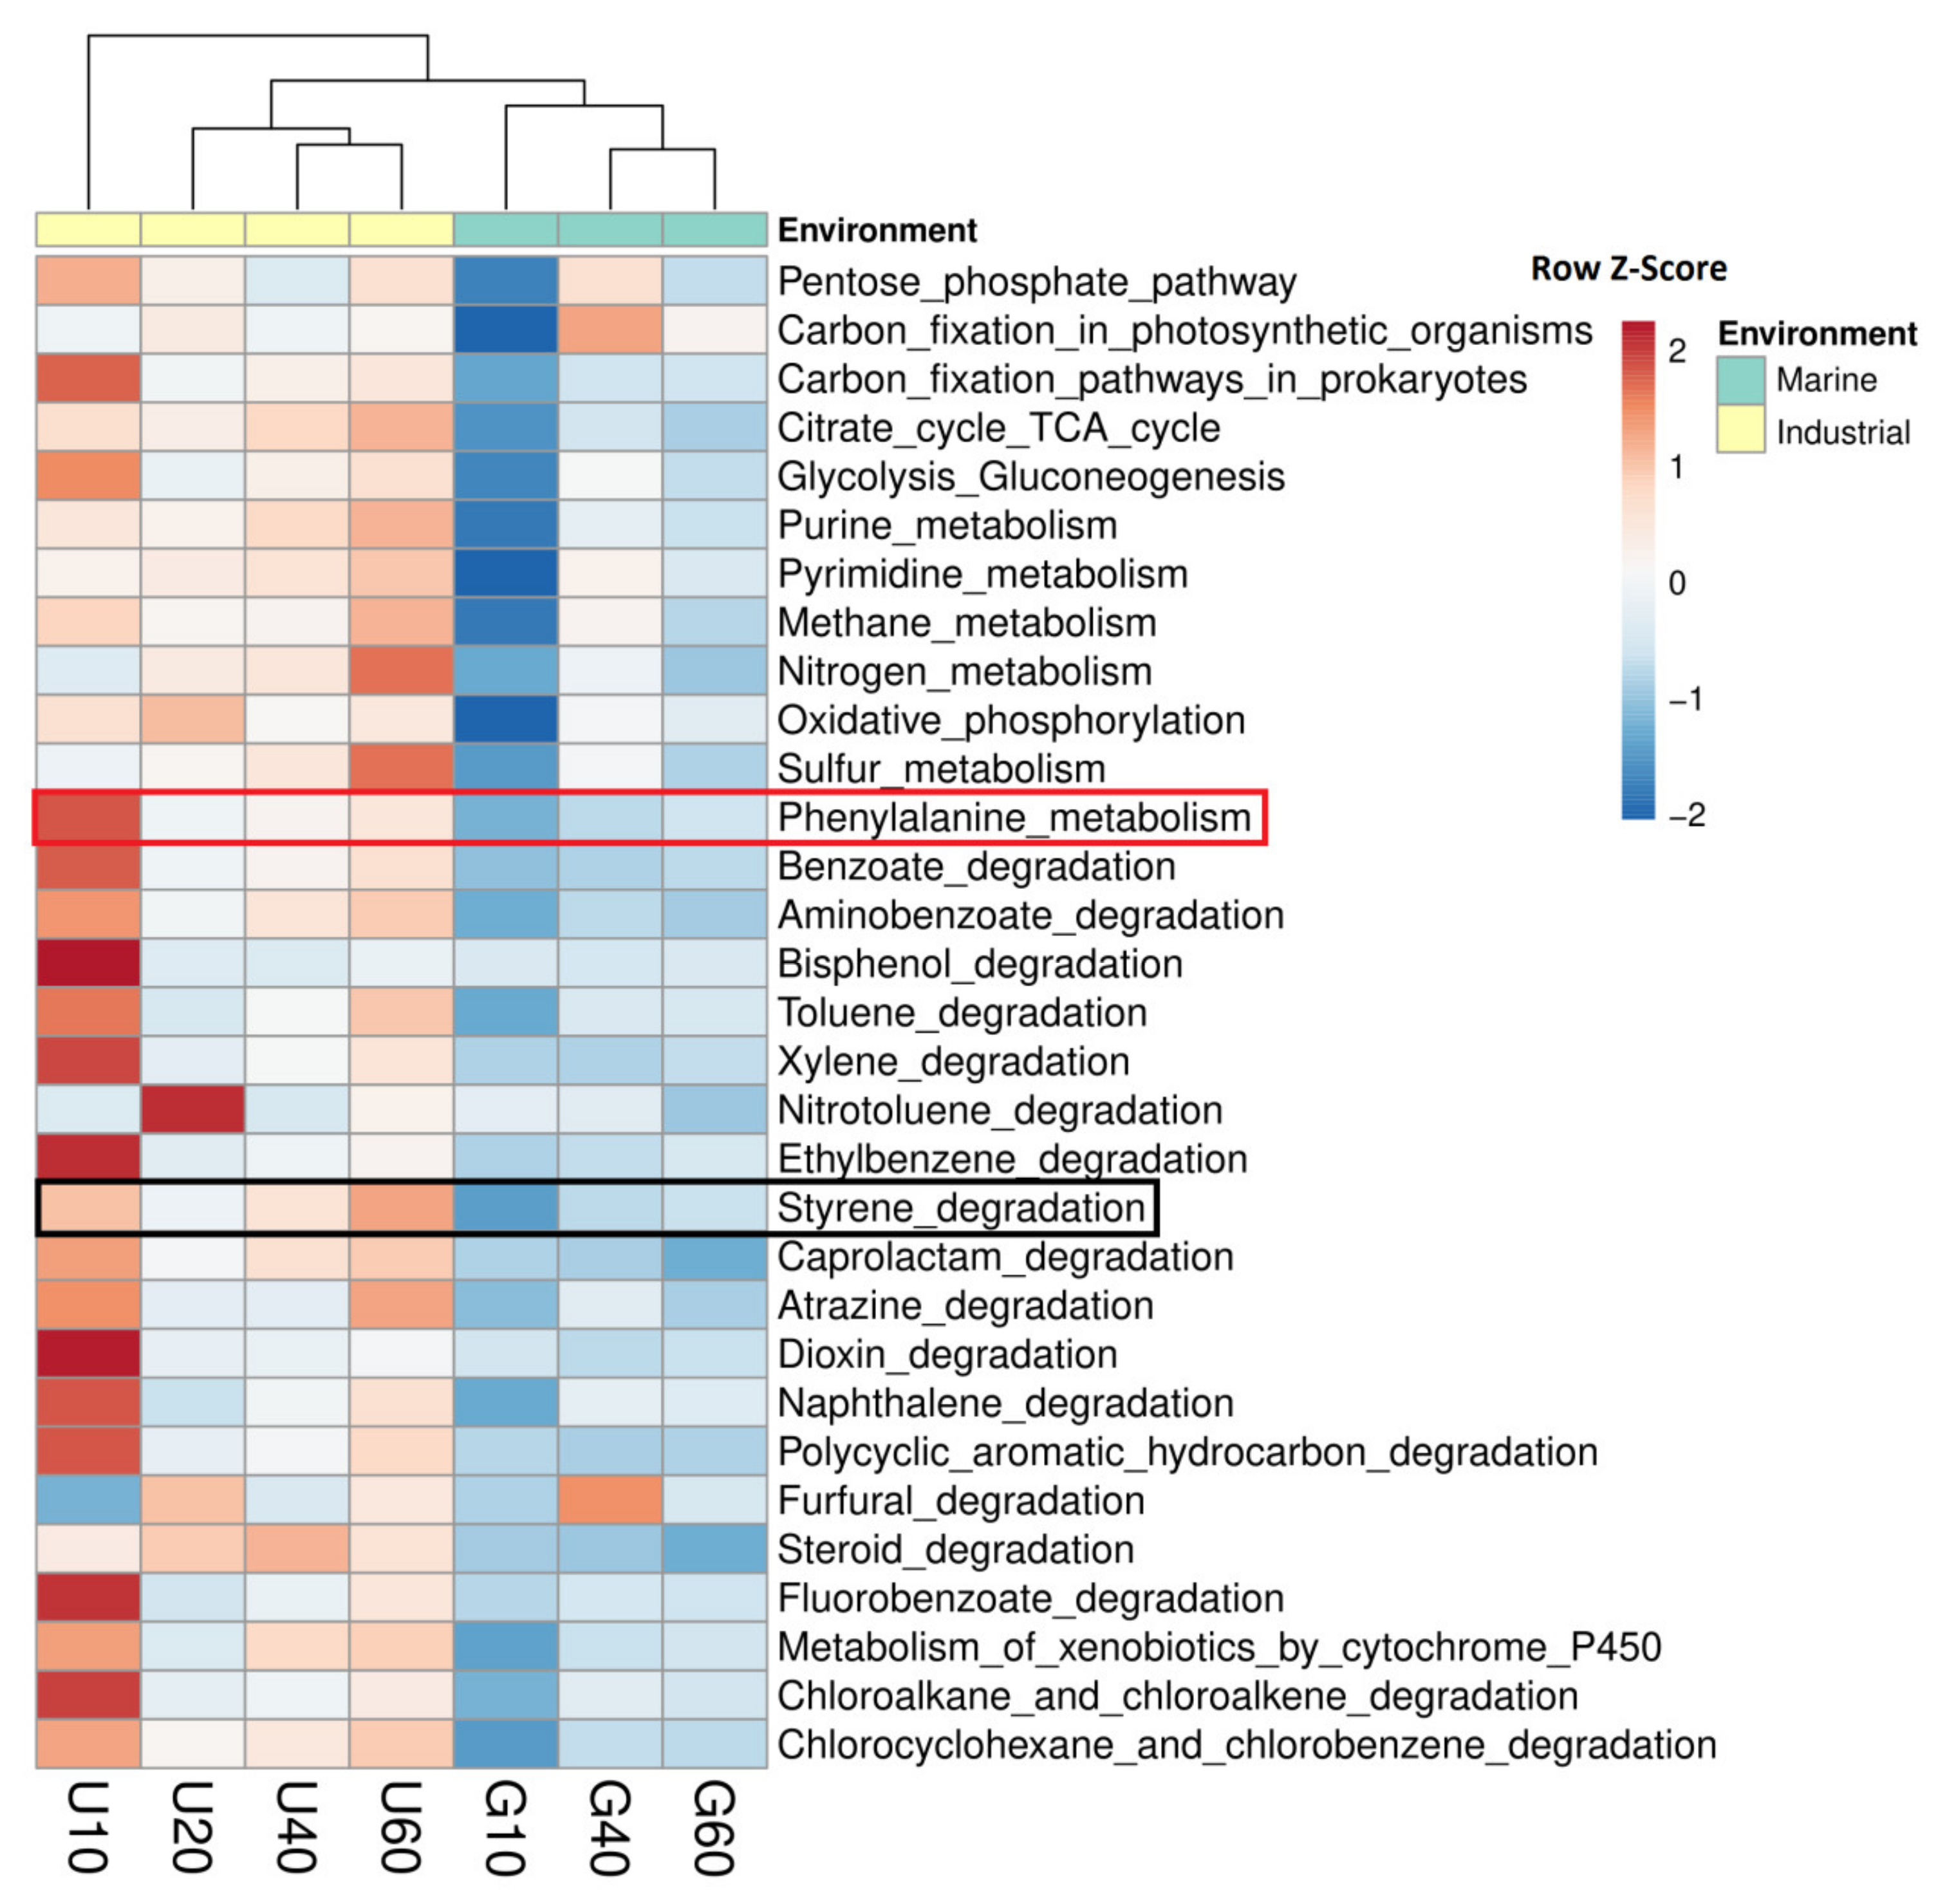
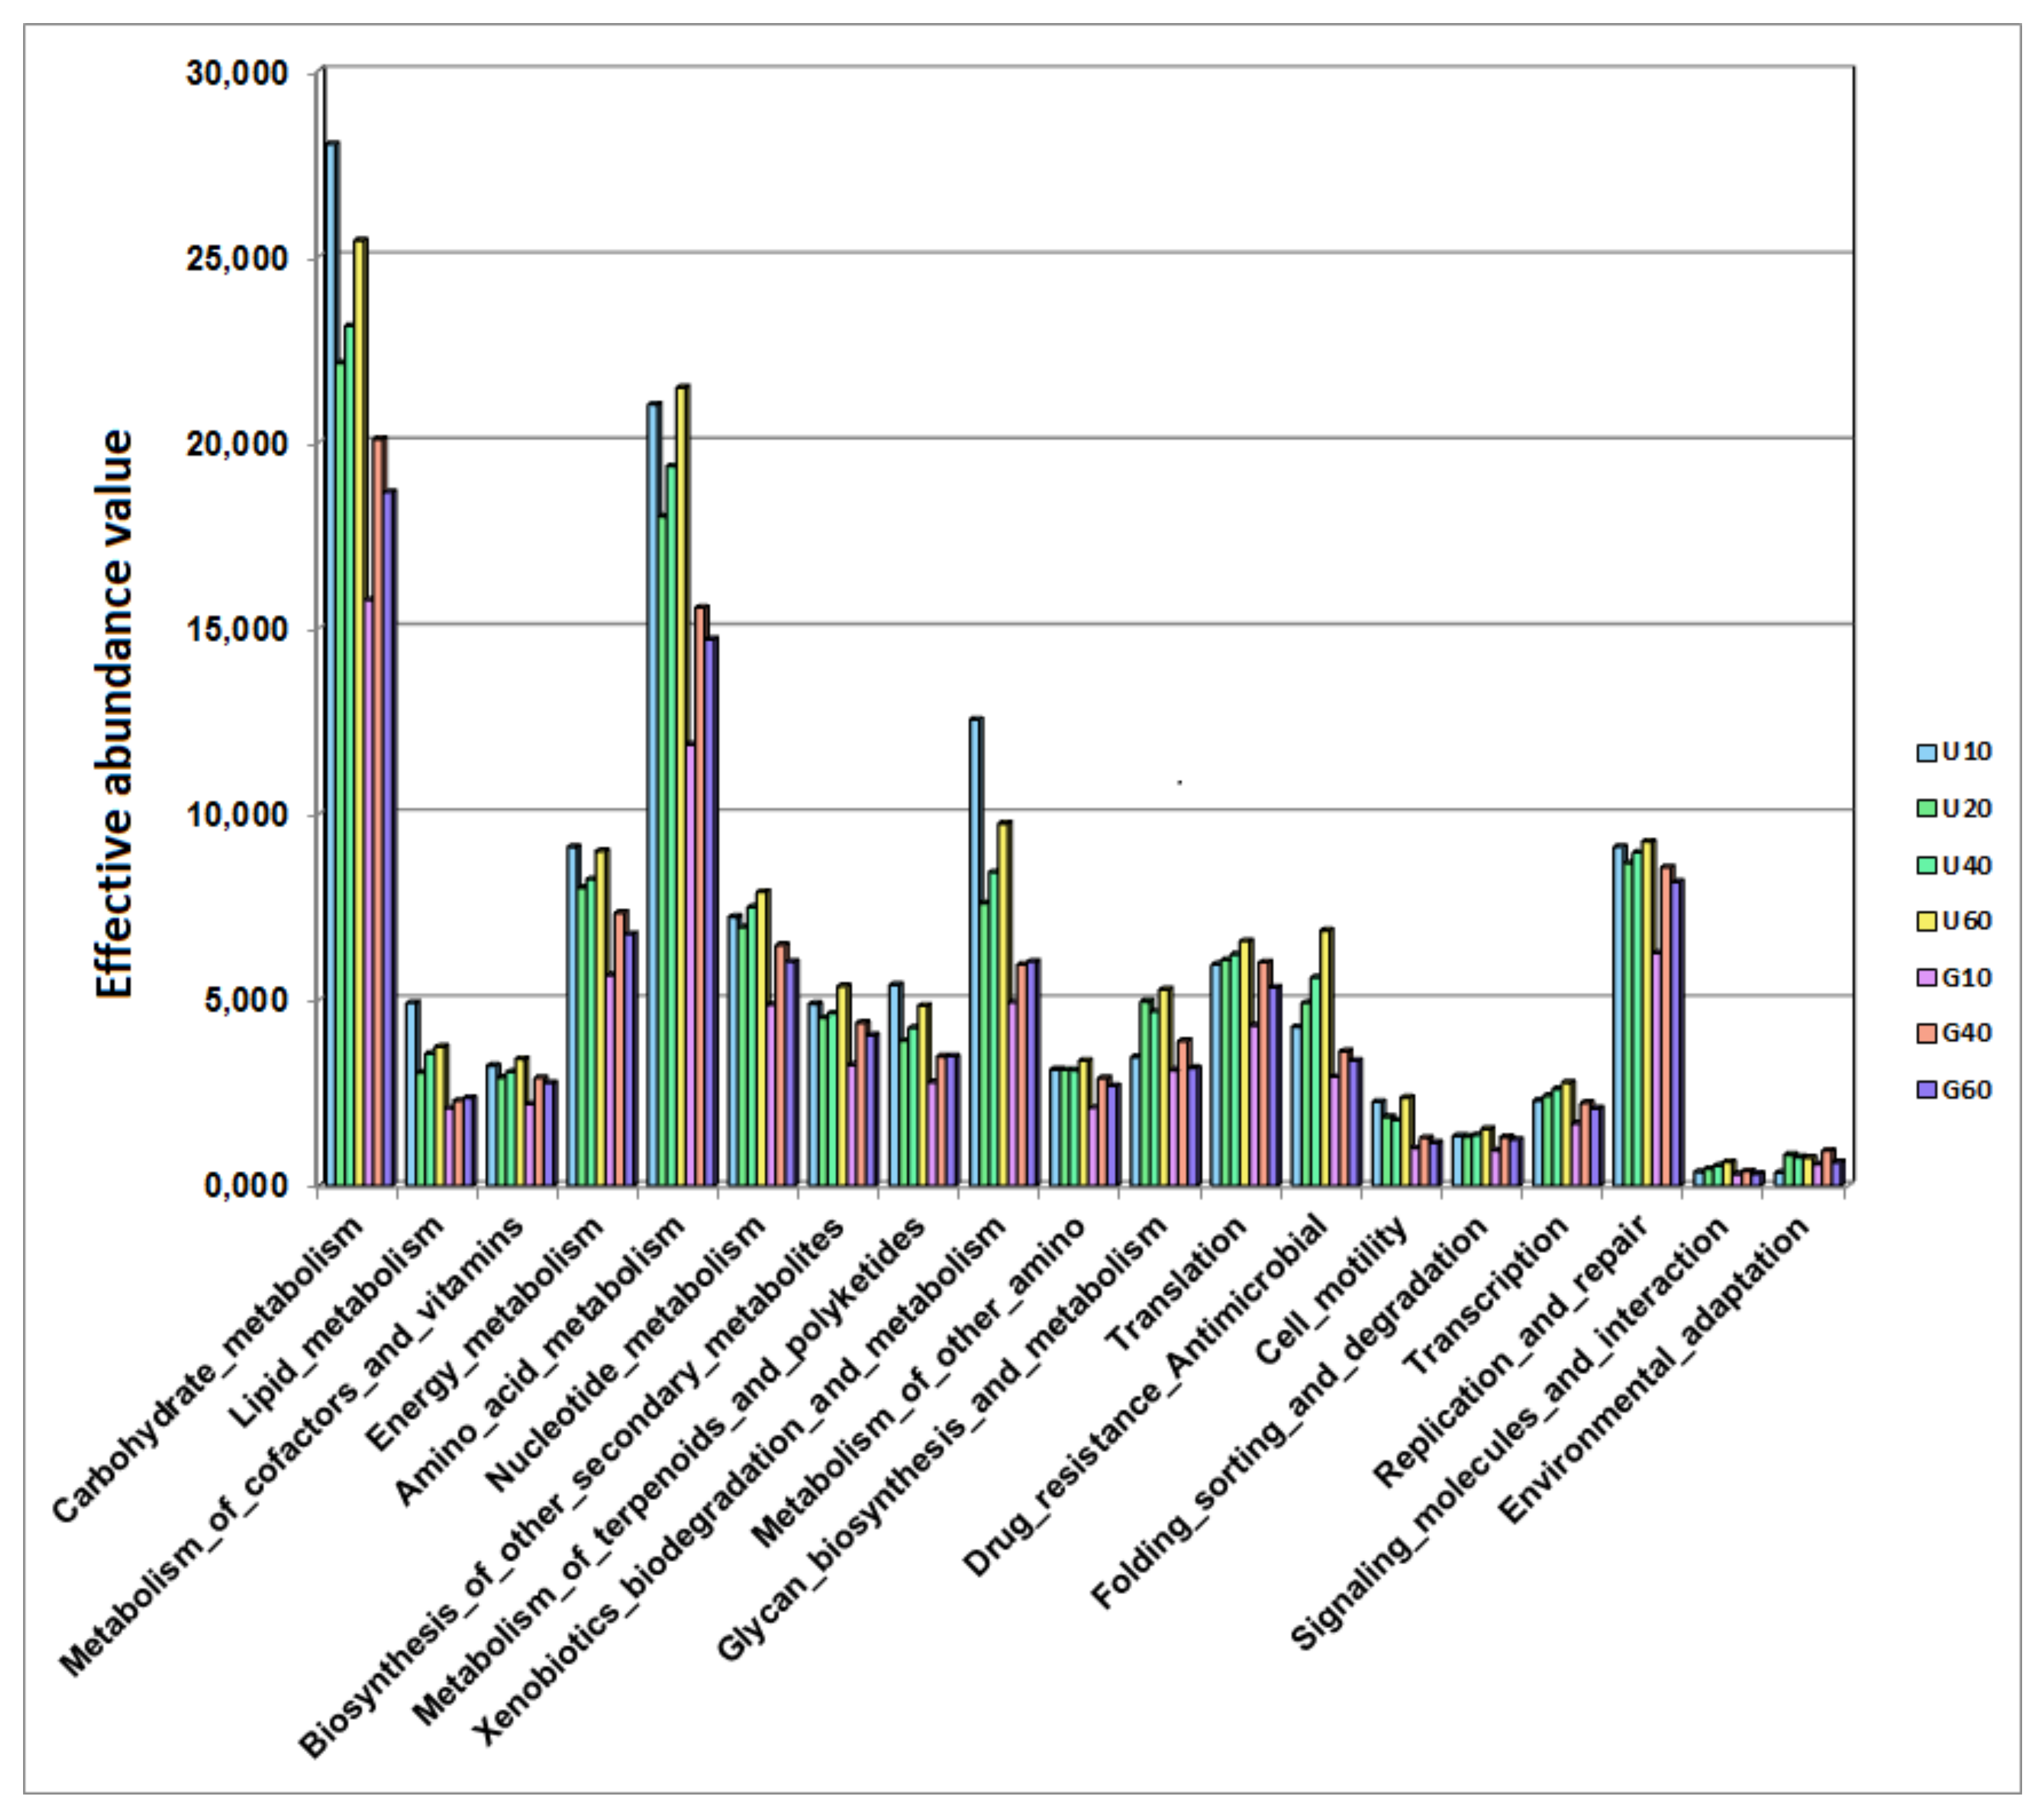
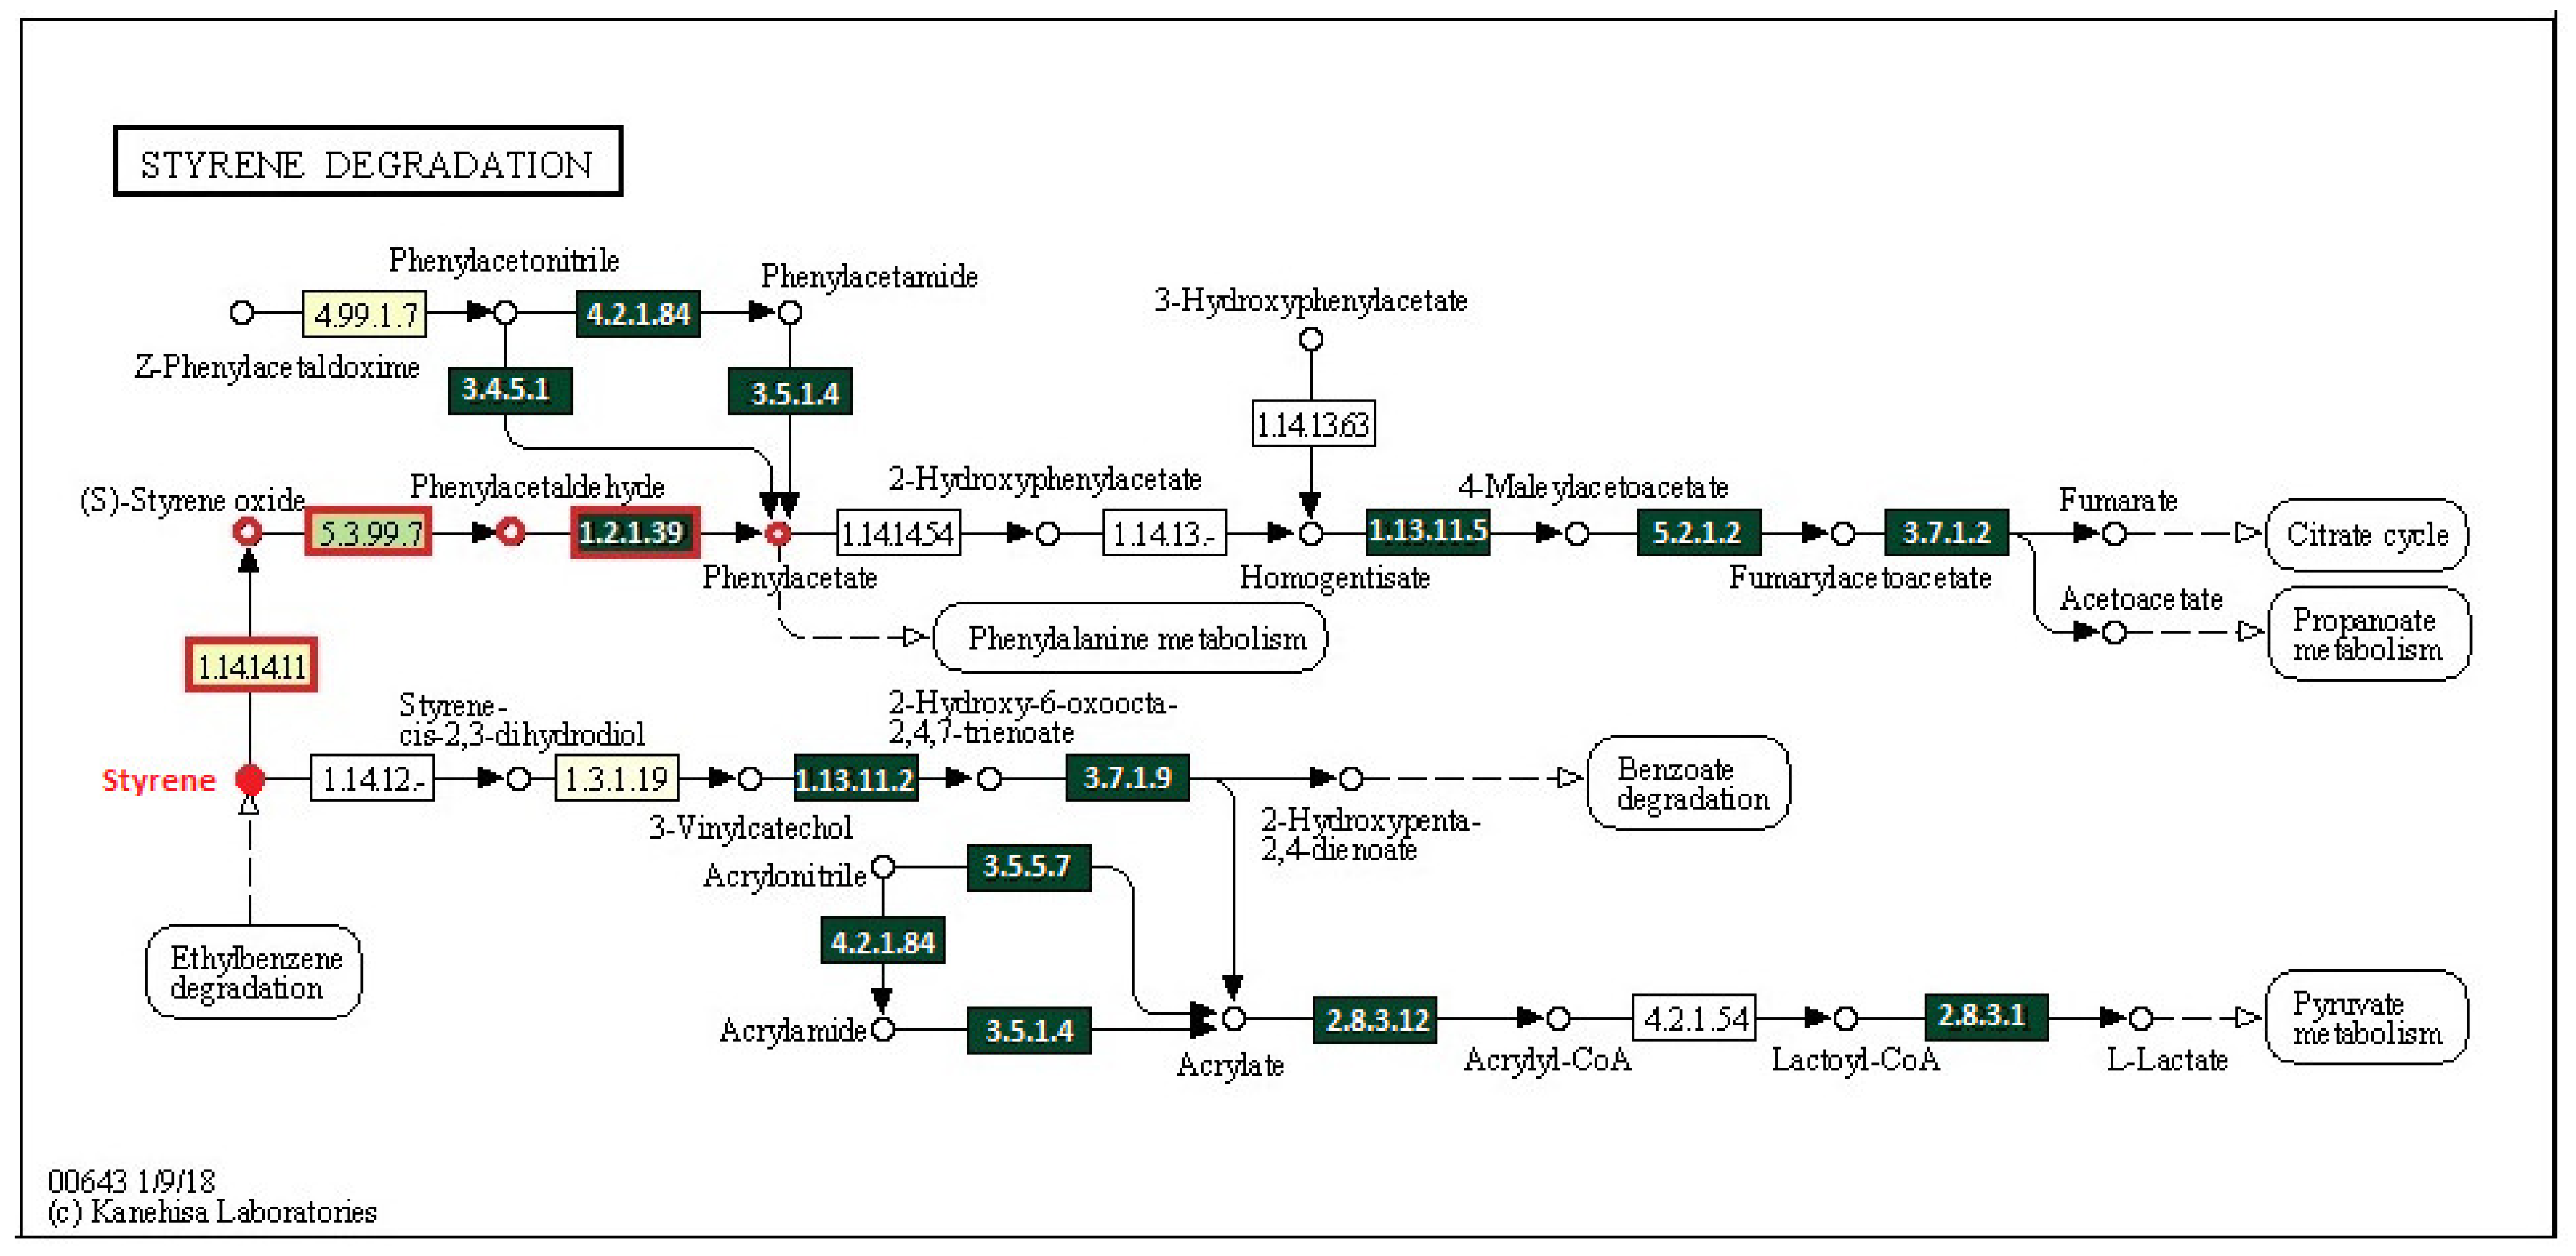
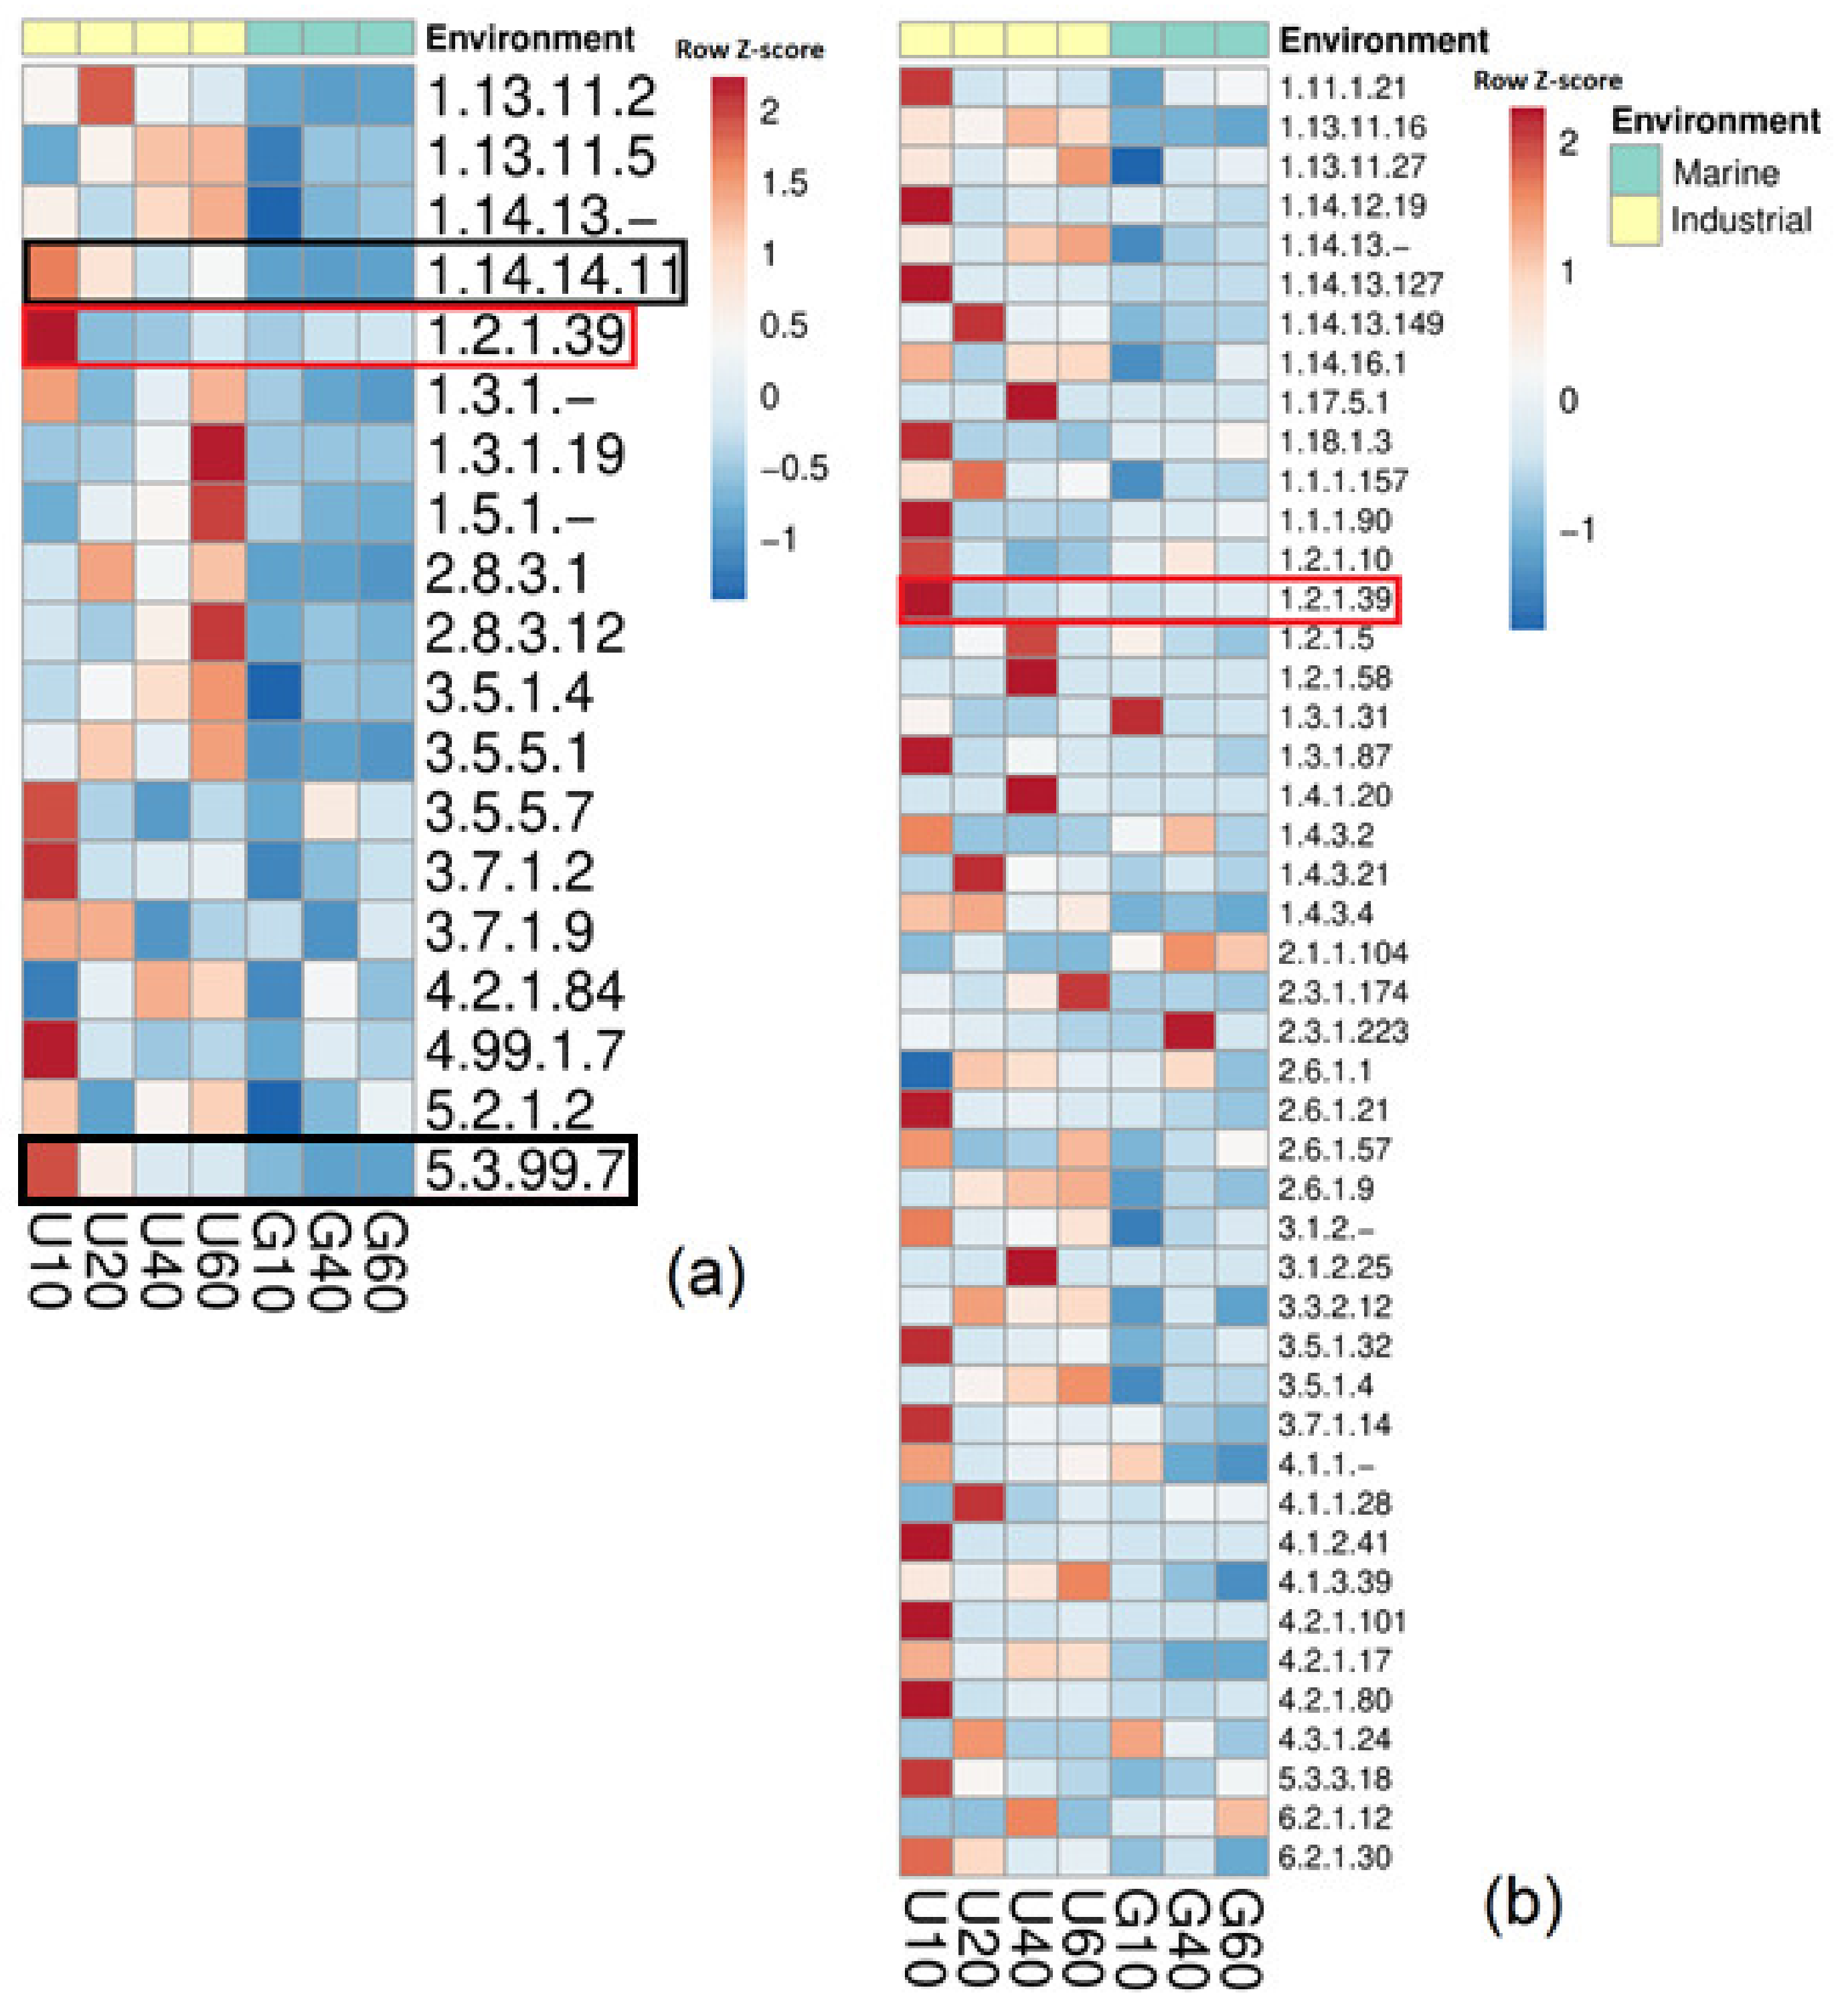
3.4. Potential Ability of the Studied Bacterial Communities to Degrade Styrene

Our results on bacterial phylogenetic diversity in the libraries were analyzed using the Global Mapper module of the iVikodak software in order to assess the potential contribution of the studied communities to the metabolic pathways.
Function abundance profiles for the studied communities are shown in Appendix A, Figure A3 and Figure 4. Carbohydrate metabolism, followed by amino acid metabolism, replication and repair, energy metabolism, and translation were revealed in all samples; however, xenobiotics biodegradation and metabolism were relatively pronounced in samples U10 and U60 (Appendix A, Figure A3). We found that the communities of the Industrial group (U10–U60) exhibited the highest potential functional diversity and ability to carry out most pathways of xenobiotic degradation, including the degradation of styrene, the PS monomer (“Styrene degradation”), and the incorporation of phenylacetic acid, the major metabolite of styrene degradation (“Phenylalanine metabolism”) (Figure 4).
The Local Mapper module of the iVikodak package was used to analyze the representation of the enzymes of the “Styrene degradation” pathway in members of the bacterial communities (Appendix A, Figure A4). This analysis predicted two key enzymes for aerobic styrene degradation in bacterial communities of the Industrial group, which were responsible for styrene catabolism to phenylacetaldehyde, as well as for phenylacetaldehyde dehydrogenase, which converts phenylacetaldehyde to phenylacetic acid, the key intermediate (“upper pathway”) (Appendix A, Figure A5a). Phenylacetaldehyde dehydrogenase was better represented, since it is not specific to styrene degradation and is also involved in phenylalanine metabolism (“Phenylalanine metabolism”) (Appendix A, Figure A5b). The program did not reveal the key enzyme of another pathway for styrene degradation, styrene 2,3-dioxygenase, catabolizing styrene conversion to styrene cis-2,3-dihydrodiol. The same iVikodak module may be used to assess the contribution of various bacterial taxa to the analyzed metabolic pathways. Members of the genera Pseudomonas, Arenimonas, and Acidovorax had the greatest functional potential for styrene degradation in the industrial water (Appendix A, Figure A6a), and those of Erythrobacter, Maribacter, and Mycobacterium in seawater (Appendix A, Figure A6b). The assignment of the genera to Betaproteobacteria, as shown in Appendix A, Figure A6 (iVikodak software), does not coincide with their affiliation to high taxon presented in Appendix A, Table A1, which was constructed using the SILVA database. This is the result of the application of the RDP classifier in iVikodak. The problems of differentiation among the higher taxa are, however, beyond the scope of the present work.

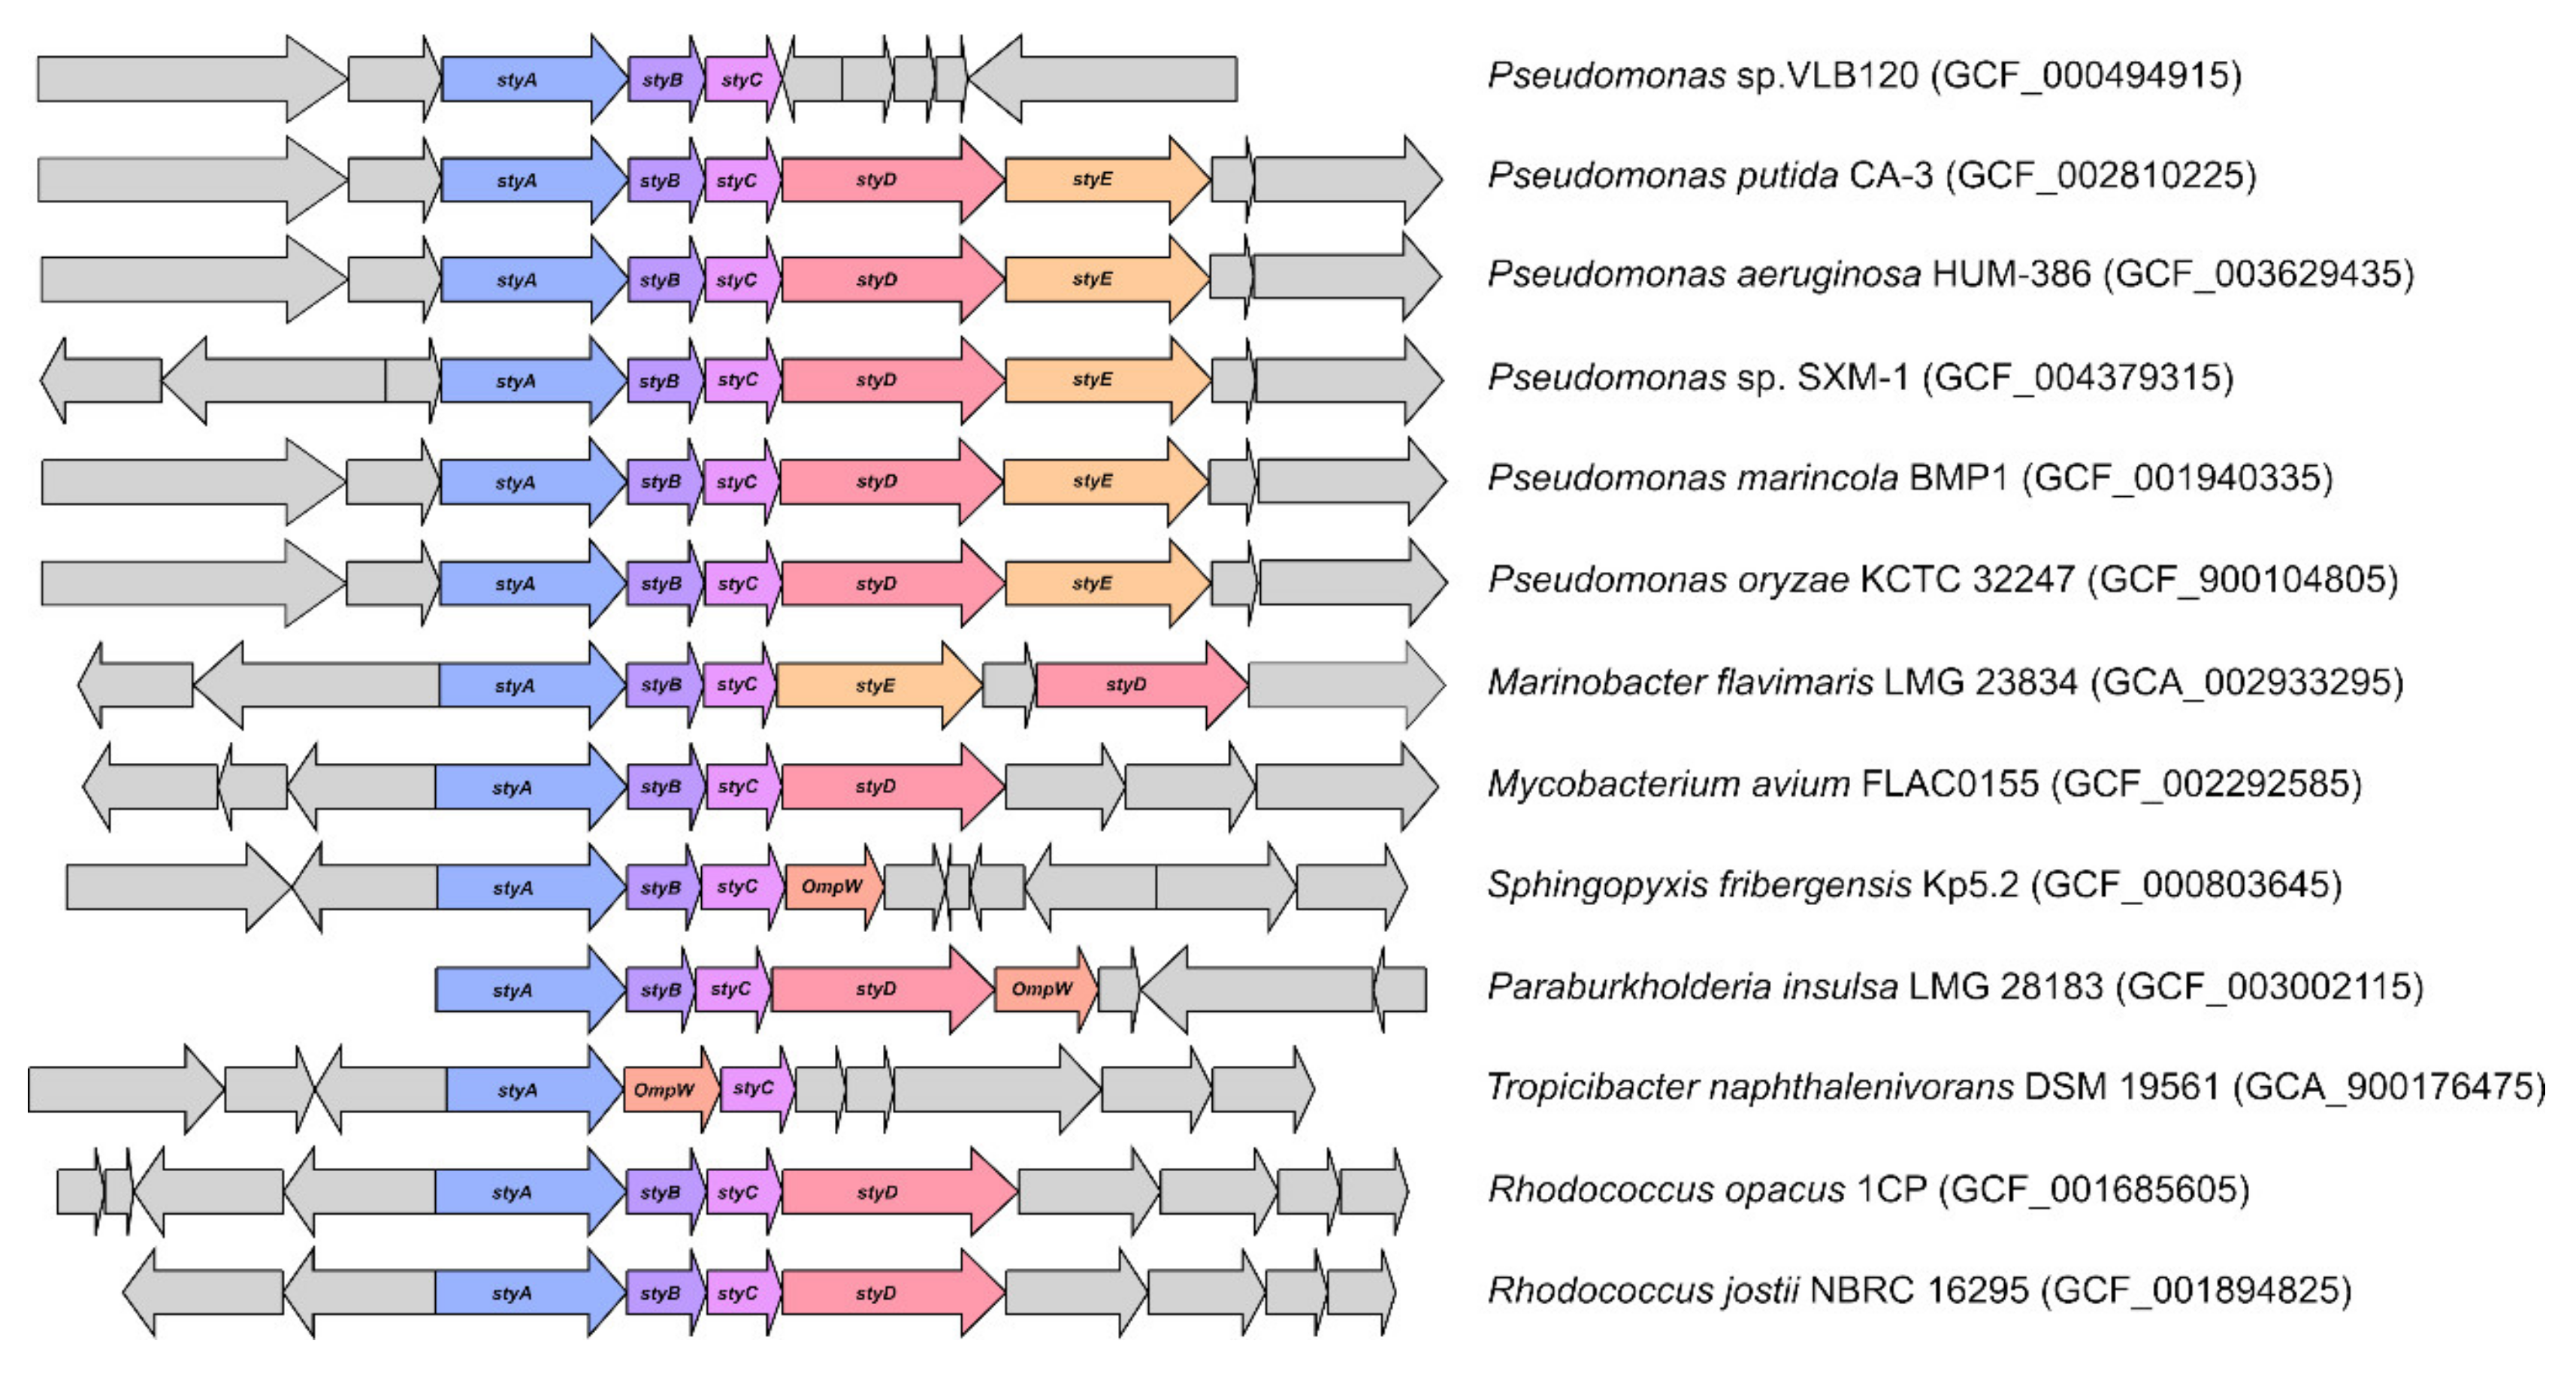
3.5. Identification of Bacteria Possessing sty-Operon Genes

In the “KEGG organisms in the NCBI taxonomy” database only a single styrene-degrading strain, Pseudomonas sp. VLB120 [50,51], was associated with SMO and SOI enzymes. Therefore, the genes of sty-operon of this strain were used for searching other bacterial genomes possessing the genes of sty-operon in the PATRIC genome database. The PATRIC protein families contain similar proteins believed to perform the same function. They come in two flavors—global families that spread across all genomes and local families restricted to a single genus. As a result of the comparison of global families for each gene of sty-operon, strains for which the presence of complete sty-operon was most likely were selected. Most of the selected strains belonged to the genus Pseudomonas. However, the styA gene as well as homologs of the styB and styC genes (although not always annotated) were also found in members of the genera Altererythrobacter, Amycolatopsis, Bradyrhizobium, Burkholderia, Glaciecola, Marinobacter, Marinobacterium, Mycobacterium, Nocardia, Panacagrimonas, Pseudorhodoplanes, Rhodococcus, Rhodopseudomonas, Sorangium, Sphingobium, Sphingopyxis, Tropicibacter, and Zavarzinia. Some reference strains belonging to these genera were chosen for further analysis of sty-operon (Appendix A, Figure A7). The 16S rRNA genes of these bacteria were used for detection of related OTUs with at least 99% homology in the libraries obtained. In addition, the identification of these OTUs was further verified using the BLAST module of the Genbank online platform. A total of 14 OTUs were revealed (Appendix A, Table A2). The taxonomic position and proportion of the OTUs potentially representing styrene-degrading bacteria varied for PS samples incubated in different aquatic environments. In the Industrial group, most OTUs belonged to the genera Pseudomonas (related to P. putida, P. aeruginosa, and P. stutzeri), Rhodococcus, Sphingopyxis, and Nocardia. In the Marine group, potential styrene degraders belonged to the genera Altererythrobacter, Mycolicibacterium, Pseudomonas, and Tropicibacter.

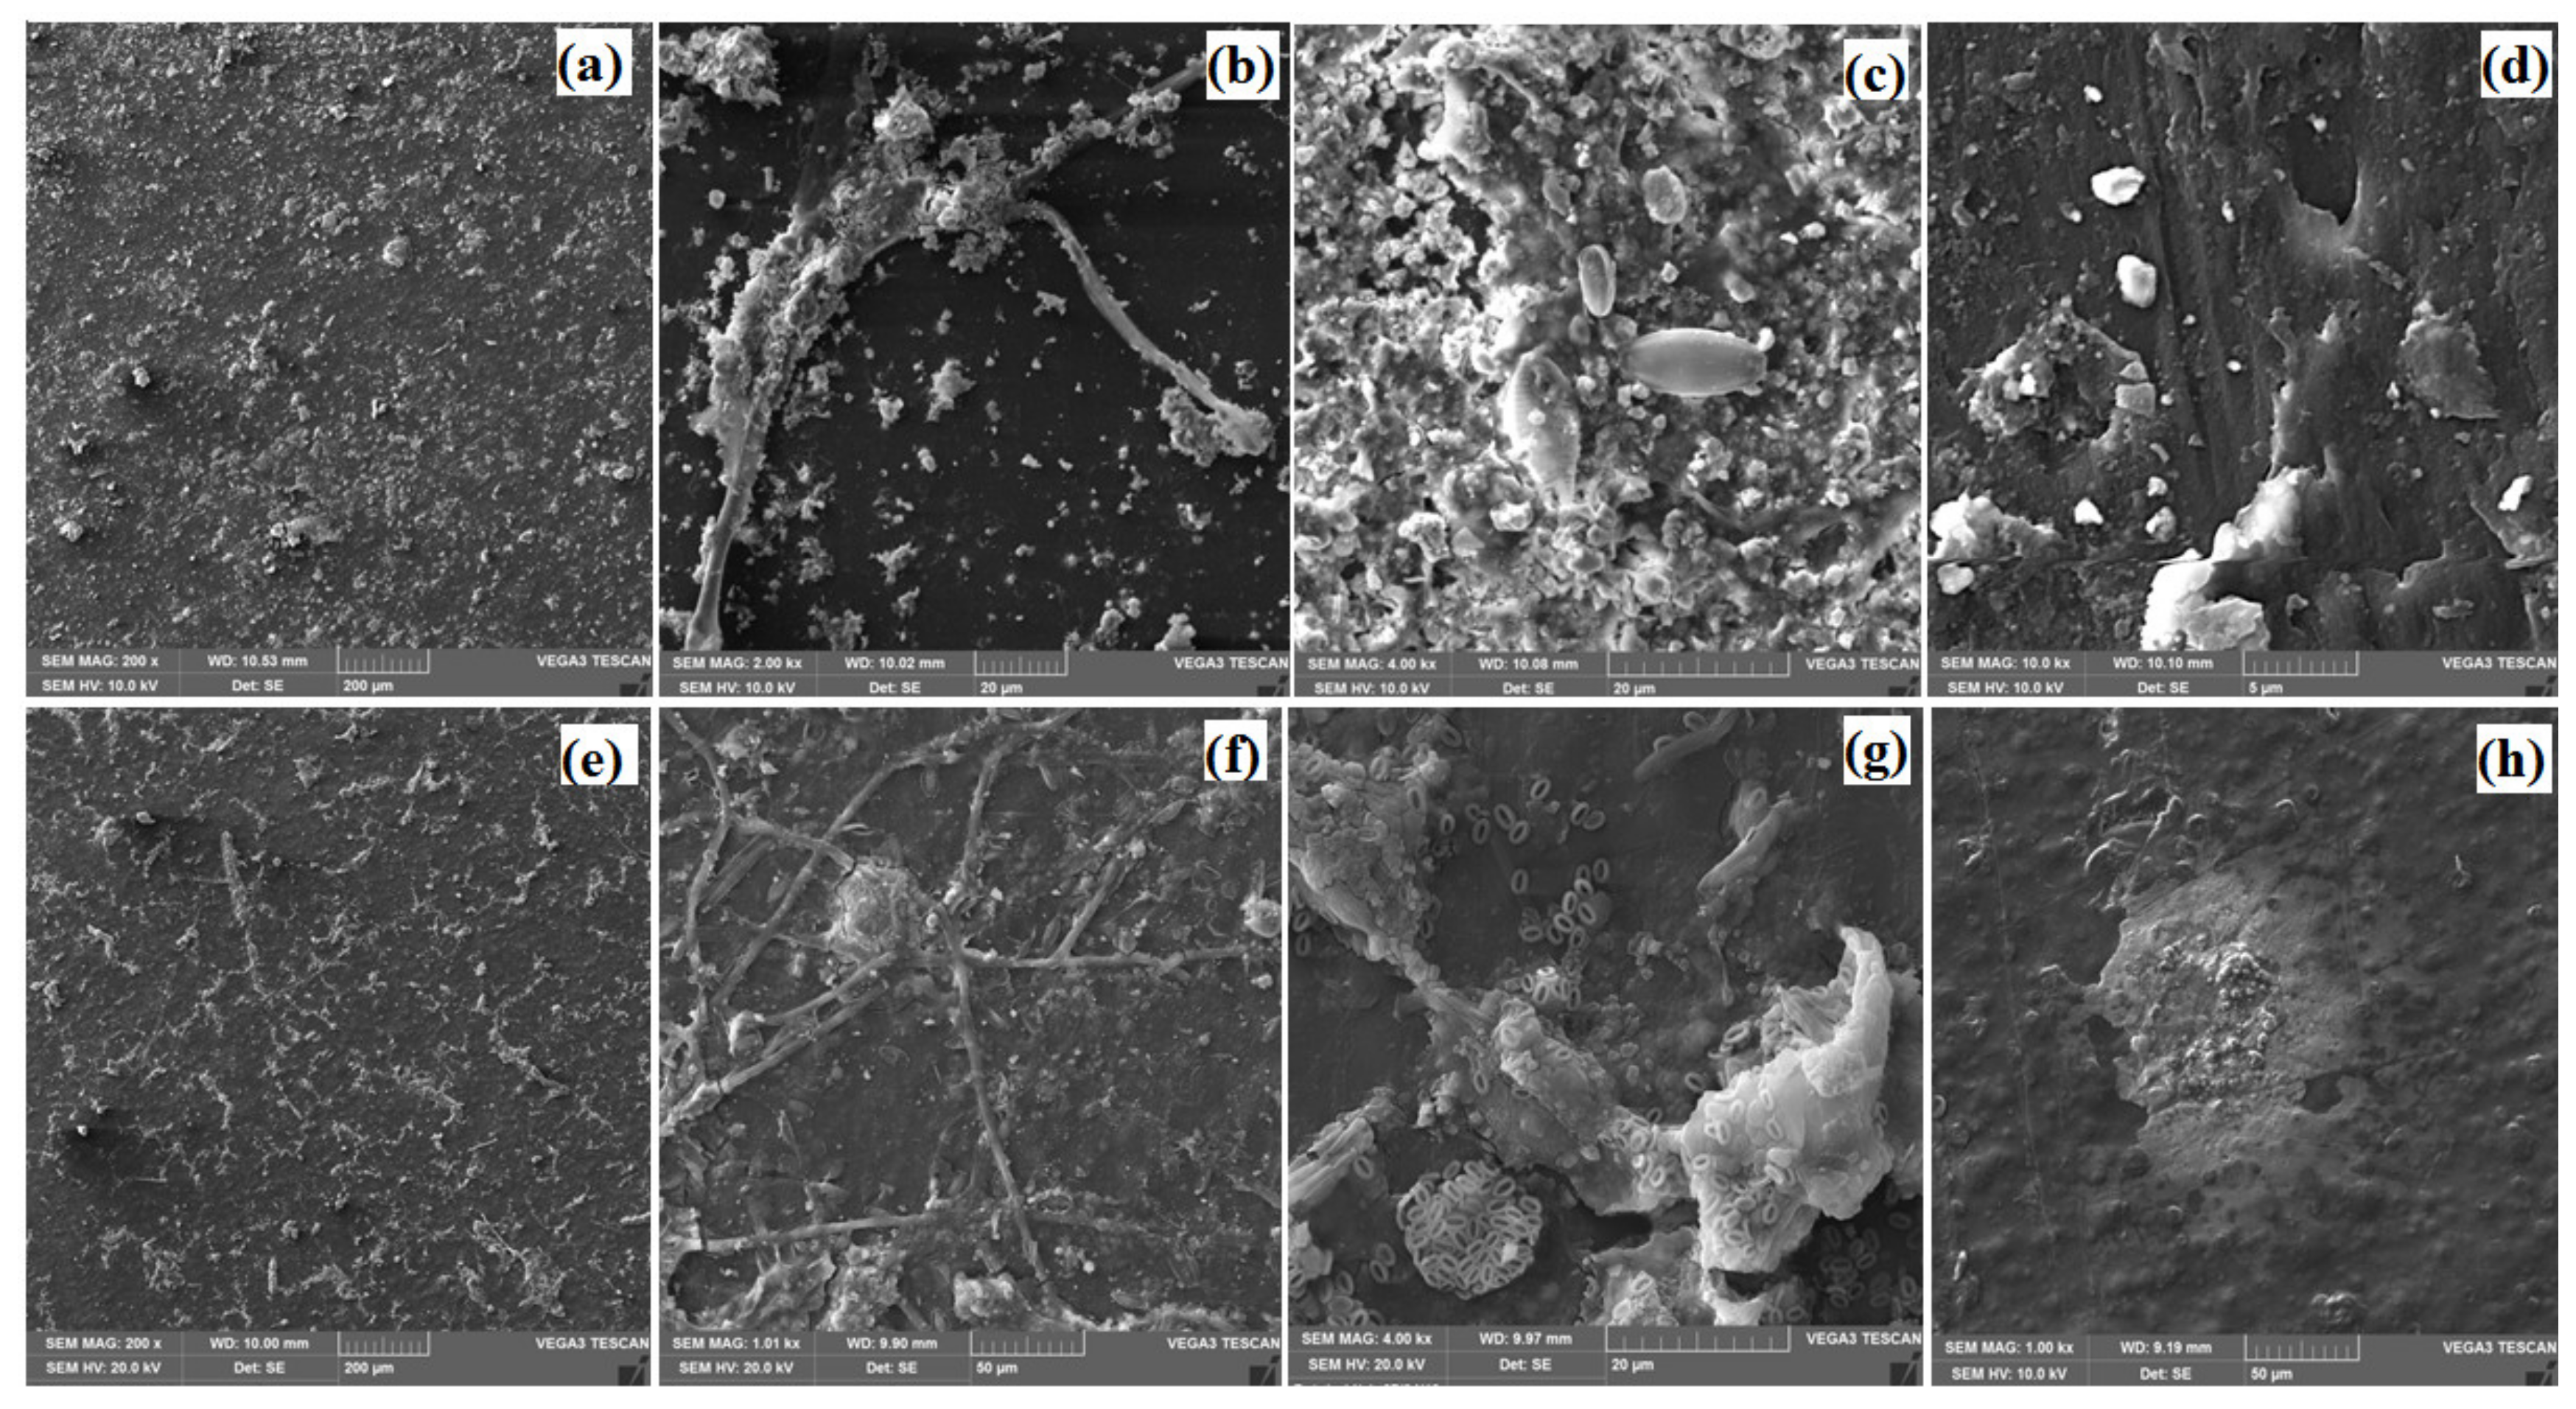
3.6. Microscopy of Bacterial Biofilms on PS

Microbial biofilms formed on PS samples incubated in marine and industrial environments and the samples with washed-off biofilms were studied by scanning electron microscopy. Microbial growth on the sample U10 (the Industrial group), which was incubated for the shortest time and was not subject to antimicrobial treatment, took the form of loose conglomerates of bacterial colonies with few structured microeukaryotes. Neither the biofilm nor the precipitates of calcium salts formed in mineralized water covered the entire surface of the sample, so that areas of clean PS could be seen (Appendix A, Figure 5a). The PS samples U40 and U60 were covered with biofilms due to long-term incubation (Appendix A, Figure 4c and Figure 5b). The local degradation of the PS surface may be seen on the photograph of the U60 sample with washed-off biofilm (Appendix A, Figure 5d).
The microbial biofilms on the Marine group samples were different from those of the Industrial group. The biofilm was more diverse, covering almost all the sample surface even at the early term of incubation (Appendix A, Figure 5e–g). Microeukaryotes morphologically similar to diatoms were present in biofilms (Appendix A, Figure 5g). The small-scale degradation of the PS surface was visible on the PS sample G60 with the longest time of incubation (Appendix A, Figure 5h).

4. Discussion

Microbial communities involved in the degradation of PS and other polymers are relatively poorly studied [13,23,27,52]. The investigation of microbial communities colonizing polymers in natural environments is a necessary step for further screening of efficient polymer degraders. In this study, we showed that PS samples exposed to seawater of the Black Sea and industrial water of a petrochemical plant were colonized by different bacterial communities with different potential functions. By scanning electron microscopy, biofilms were observed, as well as the local degradation of the PS surface after 60 days of incubation (Figure 5). Bacterial assemblages on PS samples were analyzed using 16S rRNA-gene amplicon sequencing and in silico functional characterization.
The differences revealed between the Marine and Industrial groups’ communities formed on PS samples may be caused by both environmental physicochemical parameters (aggressive petrochemical waste in industrial water and high salinity and UV radiation in seawater) and the effect of antimicrobial treatment of industrial water. Marine and industrial communities on PS samples were clustered separately (Figure 1). Members of the classes Alphaproteobacteria (Sphingomonadales), Bacteroidetes, and Gammaproteobacteria were the major groups in the studied biofilms on PS immersed in seawater (G10, G40, G60). Our results correlated with the published data. Members of Gammaproteobacteria, Alphaproteobacteria, and Bacteroidetes dominated also in natural marine biofilms and in biofilms on various plastic materials exposed in seawater [12,52,53,54]. Alphaproteobacteria were the key primary surface colonizers in marine environments [54,55,56,57]. Within the Alphaproteobacteria, different genera of Rhodobacteraceae [54] and Sphingomonadales (Altererythrobacter and Erythrobacter) [58] are often found in marine biofilms. These bacteria were also present in biofilms formed on polyethylene terephthalate (PET) samples exposed to the Black Sea water [35] and on PET and PS samples incubated in the Baltic Sea [14]. It was hypothesized in the latter work that Erythrobacter catabolizes not the polymer as such, but rather the associated polycyclic aromatic hydrocarbons sorbed from the aquatic environment. Bacteroidetes (mainly the Flavobacteria) were recognized as an important group of secondary surface colonizers in marine environments [59]. Planctomycetes (Rhodopirellula, Planctomicrobium) and Verrucomicrobia (Pelagicoccus) revealed in the studied G10–G60 samples are typical inhabitants of marine ecosystems. These bacteria are known to form associations with multicellular eukaryotes (macroalgae and invertebrates) [60]. It was suggested that bacteria inhabiting plastic surfaces in seawater possess the metabolic potential to degrade plastics and/or plastic-bound organic pollutants [8,16,18]. This conclusion was supported by the KEGG analysis of metagenomics data, which revealed a high xenobiotic degradation potential of plastic-associated communities in the North Pacific Gyre [61]. In seawater-exposed samples, physicochemical PS degradation due to UV radiation probably occurred as well. Polymer decomposition caused by physicochemical factors and the products of microbial metabolism at the first stages of incubation could promote the activity of bacterial strains able to use styrene in their metabolism.
Taxonomic analyses confirmed the specificity of the community structures formed on the PS samples incubated in industrial water compared to seawater. Alphaproteobacteria, Betaproteobacteria, Gammaproteobacteria, and Bacteroidetes predominated in Industrial PS samples (Figure 2). PS samples were first colonized by Alphaproteobacteria of the family Sphingomonadaceae, including members of the genera Blastomonas (40.7%), Sphingobium (6.8%), Sphingomonas (4.3%), and Novosphingobium (4.1%); their share decreased greatly with time (lower than 1%) (Figure 3; Appendix A, Table A1). Bacteria of the genus Blastomonas are known to produce adhesins in freshwater environments, forming biofilms together with other bacteria [62]. Although adhesion intensifies in the presence of bacteria producing adhesins and exopolysaccharides [63], this process is known to be weak and reversible [24] and results in a shift in the composition of biofilm microbial communities.
Hypochlorite treatment of industrial water, which was a part of the technological process, affected the community composition, as was evidenced by the community of the U10 PS sample (untreated with hypochlorite) occupying a separate position relative to the U20–U60 samples (Figure 1). However, the present work focused on the detection of potential styrene degraders in seawater and industrial water, rather than on the determination of hypochlorite’s effect on the community composition. Antimicrobial treatment of industrial water with sodium hypochlorite resulted in a shift in the composition of dominant bacteria to Arenimonas and Pseudomonas (Gammaproteobacteria), which were probably more resistant to the reagent. The cyclic formation and removal of biofilms resulted in a more intense physicochemical degradation of the polymer, which contributed to its biodegradation by microorganisms [36]. Moreover, the presence of other aggressive reagents in industrial water, which affected the polymer structure, probably also contributed to PS chemical degradation. At later stages of incubation of PS samples in industrial water, the community composition continued to change, which probably correlated with the enhanced biodegradation and accumulation of degrader strains in the biofilm.
Based on the 16S rRNA gene data, we predicted the functional profiles of the studied communities. Community composition differed between the industrial and marine sites, and there were concomitant variations in the functional potential. Although carbohydrate and amino acid metabolism was potentially high both in industrial and marine communities, the potential for the degradation of xenobiotics, including styrene, was at higher proportions in the industrial group (Figure 4; Appendix A, Figure A3–5). Our analysis of the genomic database indicates the presence of the sty-operon genes in the genomes of bacteria of the genera Pseudomonas, Mycobacterium, Nocardia, Rhodococcus, Marinobacterium, and Sphingopyxis, whose ability to degrade styrene was confirmed [26,53]. For a number of reference strains used in this work to search for similar sequences in our libraries, data are available not only on the ability to metabolize styrene, but also on the activity and structure of the relevant enzymes. This information exists for the strains Sphingopyxis sp. Kp5.2 [64], Rhodococcus opacus 1CP [65], P. putida CA-3 [66], Pseudomonas sp. LQ26 [67], Pseudomonas sp. VLB120 [50], and P. putida S12 [68]. It may be suggested that bacteria represented in our libraries by the OTUs with the highest similarity of their 16S rRNA gene sequences (>99–100%) to those of styrene-degrading reference bacteria (Appendix A, Table A2, Figure A7) are the most probable potential styrene degraders. In the industrial water, potential styrene degraders belonged to the genera Pseudomonas, Arenimonas, Acidovorax, and Mycobacterium, and in the seawater to the genera Erythrobacter, Maribacter, and Mycobacterium (Appendix A, Figure A6).
It is known that in several Pseudomonas strains the sty-operons are located on the chromosome and on a plasmid, and that in Sphingopyxis fribergensis Kp5.2 it is located only on the chromosome [26,64]. In Pseudomonas sp. VLB120, the chromosomal sty-operon is flanked by a mobile element and is probably involved in lateral transfer of the styABC genes (Appendix A, Figure A7). The lateral transfer of the genes of the sty-operon may promote the propagation of the styrene-degrading capacity in aquatic environments. The results indicate that the biofilms formed on PS and other plastics in seawater or in petrochemical-contaminated industrial water may be useful microbial resources for the isolation of efficient plastic degraders.

5. Conclusions

Plastic contamination is a worldwide problem and needs an effective solution. The biofilms formed on PS samples in marine and industrial aqueous environments contained different microbial communities. Members of Alphaproteobacteria, Gammaproteobacteria, and Bacteroidetes predominated in biofilms on PS in both aquatic habitats, while Planctomycetes were better represented in seawater. The studied marine and industrial communities on PS were particularly enriched in carbohydrate and amino acid metabolism pathways genes, while the genes of xenobiotic degradation and styrene degradation pathways were relatively enriched in bacterial assemblages in industrial water. Putative styrene-degrading bacteria belonging to the genera Pseudomonas, Arenimonas, Acidovorax, and Mycobacterium were detected in the industrial water PS biofilms, and bacteria of the genera Erythrobacter, Maribacter, and Mycobacterium in seawater PS biofilms. Future work should screen the capacity of these taxa for styrene degradation. These results suggest that marine and industrial waters contain microbial populations potentially capable of degrading PS specimens. The biofilms formed on PS samples incubated in seawater and industrial water may be used for the isolation of biotechnologically valuable PS-degrading bacterial strains.

Author Contributions

Conceptualization, A.L. and T.T.; formal analysis, T.T. and D.G.; investigation, D.S., D.G., and E.K.; methodology, T.T. and A.L.; project administration, A.L.; supervision, A.L. and T.N.; writing–original draft, T.T. and T.N.; writing–review & editing, T.N. All authors have read and agreed to the published version of the manuscript.

Funding

The research was partially funded by the Russian Foundation for Basic Research (grant no. 18-29-05033).

Acknowledgments

The authors are grateful to Abramova M.G. and Kireev D.M. (G.V. Akimov Gelendzhik Center Climatic Testing of VIAM, Russia) for the organization of our work in the Black Sea and to Golubev A.V. for supporting our work at the Ufaorgsintez petrochemical plant (Ufa, Russia). We are especially grateful to the reviewers for their comments, which resulted in the improvement of the article.

Conflicts of Interest

The authors declare no conflict of interest. The funders had no role in the design of the study; in the collection, analyses, or interpretation of data; in the writing of the manuscript, or in the decision to publish the results.

Appendix A

Table A1. Relative proportion of the phyla and genera of the Bacteria domain in the libraries 1 of the 16S rRNA gene sequences from the biofilms on PS samples incubated in seawater and industrial water.
Taxonomic Group, GenusIndustrial Marine
U10U20U40U60G10G40G60
Actinobacteriota2.454.886.264.333.256.275.23
  Rhodococcus0.010.011.190.040.040.000.01
  Microbacterium0.050.001.820.030.110.010.00
  Mycobacterium0.150.832.371.780.870.850.09
Alphaproteobacteria63.5714.4120.7614.4132.0737.6535.04
  Jannaschia0.000.000.000.000.180.651.53
  Hyphomonas0.010.030.040.021.560.190.03
  Limimaricola0.000.000.000.000.240.811.15
  Ca. Megaira0.031.020.740.220.030.000.02
  Erythrobacter0.030.030.030.001.267.2010.82
  Methylobacterium0.080.003.090.000.520.010.01
  Reyranella0.170.971.961.470.000.000.00
  Brevundimonas1.060.674.211.350.350.000.00
  Sphingopyxis1.510.170.130.170.010.000.01
  Novosphingobium4.120.020.000.010.020.000.00
  Sphingomonas4.290.000.000.120.000.000.01
  Sphingobium6.810.060.040.021.050.080.00
  Blastomonas40.740.040.000.010.010.040.03
  Hyphomicrobium0.020.611.091.200.010.000.00
Gammaproteobacteria23.0937.0861.5370.5418.9513.498.51
  Pseudomonas0.551.3112.1139.100.330.090.01
  Arenimonas1.026.5923.0414.170.020.000.00
  Hydrogenophaga0.191.980.550.300.000.000.03
  Stenotrophomonas0.460.011.220.520.040.140.00
  Methyloversatilis0.482.660.060.190.000.000.00
  Acidovorax0.471.821.732.750.000.000.00
  Dechloromonas1.270.100.010.100.000.000.00
  Ralstonia1.900.000.000.000.000.000.00
  Alcaligenes4.080.000.000.000.000.270.00
  Pseudohongiella0.010.000.000.005.020.651.17
  Coxiella0.000.000.000.001.160.990.08
Planctomycetota0.315.102.712.267.0911.595.54
  Rhodopirellula0.000.000.000.001.403.170.35
  Planctomicrobium0.000.040.000.003.542.010.25
Verrucomicrobiota0.393.821.001.667.180.801.70
  Pelagicoccus0.010.000.000.004.700.110.16
  Cerasicoccus0.010.000.000.001.390.310.10
Bacteroidota2.4920.953.263.1812.8911.0617.00
  Marinoscillum0.020.000.000.003.220.371.73
  Maribacter0.000.000.000.000.221.631.72
  Fulvivirga0.000.000.000.000.612.131.99
  Tunicatimonas0.010.000.000.000.421.563.38
  Taeseokella0.000.000.000.001.100.000.04
  Flavobacterium0.242.360.911.020.000.000.00
  Chryseolinea0.423.690.510.710.000.010.00
1 The taxonomic groups responsible for >1% of the total number of bacterial sequences in each library are listed.
Table A2. Proportion of sequences in the operational taxonomic units (OTUs) having >99% similarity to the 16S rRNA genes of the reference strains containing the sty-operon genes in their genomes.
OTUHit Taxon NameHit Strain NameAccession NumberSimilarity, %% of Total Reads in Each Library
MarineIndustrial
G10G40G60U10U20U40U60
OTU121Pseudomonas aeruginosaJCM 5962TBAMA010003161000.050.01000.010.031.69
OTU23P. putidaNBRC 14164TAP01307099.80000.0501.383.39
OTU4P. putidaNBRC 14164TAP0130701000000.070.017.9923.29
OTU46P. stutzeriATCC 17588TCP0028811000.220.080.010.060.020.045.81
OTU131Rhodococcus erythropolisNBRC 15567TBCRM010000551000000.0040.010.830.02
OTU867Sphingopyxis sp.113P3CP00945210000000.050.010.03
OTU167S. italicaSC13E-S71THE64805899.70.0100.010.590.0100.004
OTU550S. alaskensisRB2256TCP00035699.50000.010.050.060.04
OTU606S. fribergensisKp5.2TCP00912210000000.040.050.09
OTU362Mycolicibacterium hippocampiBFLP-6TFN4307361000.430.490.040.010.00400.004
OTU71Nocardia asteroidesNBRC 15531TBAFO0100000610000000.640.150.11
OTU66Altererythrobacter spongiaeHN-Y73TMG437235990.360.370.620000
OTU878Tropicibacter naphthalenivoransCECT 7648TCYSE01000022990.120.030.140000
OTU1301Marinobacter flavimarisSW-145TNR_02579999.60.018000000
Figure A1. Detected OTUs, alpha diversity, and rarefaction curves data obtained after amplicon sequencing of 16S rRNA genes of bacteria from PS samples incubated in seawater and industrial water.
Sustainability 12 03624 g0a1
Figure A2. Venn diagrams showing the number and proportion of shared and unique OTUs between the libraries of bacterial 16S rRNA genes on PS samples incubated in seawater (the Marine group, (a) and industrial water (the Industrial group, (b).
Sustainability 12 03624 g0a2
Figure A3. Functional characterization of microbial communities on PS samples using the KEGG pathway database.
Sustainability 12 03624 g0a3
Figure A4. Predicted enzyme profile for the “Styrene degradation” pathway in all samples of the Industrial and Marine groups. The graphs were generated with the KEGG Color mapper tool (http://www.genome.jp/kegg/tool/map_pathway3.html) using the Color Mapping files generated by the Local Mapper module of iVikodak. The color intensity indicates an average gene (enzyme) proportion across all samples. The styrene degradation pathway probably employed by the biofilm bacteria is marked in red.
Sustainability 12 03624 g0a4
Figure A5. Heatmap showing the clustering of PS samples based on the selected iVicodak-derived enzyme profiles of the “Styrene degradation” (a) and “Phenylalanine metabolism” (b) metabolic pathways. Specific enzymes of styrene degradation are marked in black; the enzyme catalyzing formation of phenylacetic acid, the main intermediate metabolite, is marked in red.
Sustainability 12 03624 g0a5
Figure A6. Dendrobar plots, highlighting the key contributing microorganisms (and their taxonomic lineage) involved in the “Styrene degradation” pathway in biofilms from PS samples incubated in industrial water (a) and seawater (b).
Sustainability 12 03624 g0a6
Figure A7. Comparison of the organization of the styABCD operon in bacterial genomes.
Sustainability 12 03624 g0a7

References

  1. PlasticsEurope. Plastics—The Facts 2019. An Analysis of European Plastics Production, Demand and Waste Data; PlasticsEurope: Brussels, Belgium, 2019; Available online: https://www.plasticseurope.org/application/files/1115/7236/4388/FINAL_web_version_Plastics_the_facts2019_14102019.pdf (accessed on 30 April 2020).
  2. Law, K.; Moret-Ferguson, S.; Goodwin, D.; Zettler, E.; DeForce, E.; Kukulka, T.; Proskurowski, G. Distribution of surface plastic debris in the eastern Pacific Ocean from an 11-year dataset. Environ. Sci. Technol. 2014, 48, 4732–4738. [Google Scholar] [CrossRef] [PubMed]
  3. Law, K.L. Plastics in the marine environment. Annu. Rev. Mar. Sci. 2017, 9, 205–229. [Google Scholar] [CrossRef] [PubMed] [Green Version]
  4. Eriksen, M.; Lebreton, L.C.M.; Carson, H.S.; Thiel, M.; Moore, C.J.; Borerro, J.C.; Galgani, F.; Ryan, P.G.; Reisser, J. Plastic pollution in the world’s oceans: More than 5 trillion plastic pieces weighing over 250,000 tons afloat at sea. PLoS ONE 2014, 9, e111913. [Google Scholar] [CrossRef] [Green Version]
  5. Jambeck, J.R.; Geyer, R.; Wilcox, C.; Siegler, T.R.; Perryman, M.; Andrady, A.; Narayan, R.; Law, K.L. Plastic waste inputs from land into the ocean. Science 2015, 347, 768–771. [Google Scholar] [CrossRef] [PubMed]
  6. Auta, H.S.; Emenike, C.U.; Fauziah, S.H. Distribution and importance of microplastics in the marine environment: A review of the sources, fate, effects, and potential solutions. Environ. Int. 2017, 102, 165–176. [Google Scholar] [CrossRef] [PubMed]
  7. Amaral-Zettler, L.A.; Zettler, E.R.; Slikas, B.; Boyd, G.D.; Melvin, D.W.; Morrall, C.E.; Proskurowski, G.; Mincer, T.J. The biogeography of the Plastisphere: Implications for policy. Front. Ecol. Environ. 2015, 13, 541–546. [Google Scholar] [CrossRef]
  8. Oberbeckmann, S.; Osborn, A.M.; Duhaime, M.B. Microbes on a bottle: Substrate, season and geography influence community composition of microbes colonizing marine plastic debris. PLoS ONE 2016, 11, e0159289. [Google Scholar] [CrossRef]
  9. Ivar do Sul, J.A.; Tagg, A.S.; Labrenz, M. Exploring the common denominator between microplastics and microbiology: A scientometric approach. Scientometrics 2018, 117, 2145–2157. [Google Scholar] [CrossRef]
  10. Costerton, J.W.; Geesey, G.G.; Cheng, K.J. How bacteria stick. Sci. Am. 1978, 238, 86–95. [Google Scholar] [CrossRef]
  11. de Carvalho, C.C.C.R. Marine biofilms: A successful microbial strategy with economic implications. Front. Mar. Sci. 2018, 5, 126. [Google Scholar] [CrossRef] [Green Version]
  12. Briand, J.-F.; Barani, A.; Garnier, C.; Réhel, K.; Urvois, F.; LePoupon, C.; Bouchez, A.; Debroas, D.; Bressy, C. Spatio-temporal variations of marine biofilm communities colonizing artificial substrata including antifouling coatings in contrasted French coastal environments. Microb. Ecol. 2017, 74, 585–598. [Google Scholar] [CrossRef] [PubMed]
  13. Kesy, K.; Oberbeckmann, S.; Kreikemeyer, B.; Labrenz, M. Spatial environmental heterogeneity determines young biofilm assemblages on microplastics in Baltic Sea mesocosms. Front. Microbiol. 2019, 10, 1665. [Google Scholar] [CrossRef] [PubMed] [Green Version]
  14. Oberbeckmann, S.; Kreikemeyer, B.; Labrenz, M. Environmental factors support the formation of specific bacterial assemblages on microplastics. Front. Microbiol. 2018, 8, 2709. [Google Scholar] [CrossRef] [PubMed] [Green Version]
  15. Ogonowski, M.; Motiei, A.; Ininbergs, K.; Hell, E.; Gerdes, Z.; Udekwu, K.I.; Bacsik, Z.; Gorokhova, E. Evidence for selective bacterial community structuring on microplastics. Environ. Microbiol. 2018, 20, 2796–2808. [Google Scholar] [CrossRef] [PubMed]
  16. Dussud, C.; Meistertzheim, A.L.; Conan, P.; Pujo-Pay, M.; George, M.; Fabre, P.; Coudane, J.; Higgs, P.; Elineau, A.; Pedrotti, M.L.; et al. Evidence of niche partitioning among bacteria living on plastics, organic particles and surrounding seawaters. Environ. Pollut. 2018, 236, 807–816. [Google Scholar] [CrossRef]
  17. Hoellein, T.; Rojas, M.; Pink, A.; Gasior, J.; Kelly, J. Anthropogenic litter in urban freshwater ecosystems: Distribution and microbial interactions. PLoS ONE 2014, 9, e98485. [Google Scholar] [CrossRef]
  18. Zettler, E.R.; Mincer, T.J.; Amaral-Zettler, L.A. Life in the “Plastisphere”: Microbial communities on plastic marine debris. Environ. Sci. Technol. 2013, 47, 7137–7146. [Google Scholar] [CrossRef]
  19. Zheng, Y.; Yanful, E.K.; Bassi, A.S. A review of plastic waste biodegradation. Crit. Rev. Biotechnol. 2005, 25, 243–250. [Google Scholar] [CrossRef]
  20. Krueger, M.C.; Seiwert, B.; Prager, A.; Zhang, S.W.; Abel, B.; Harms, H.; Schlosser, D. Degradation of polystyrene and selected analogues by biological Fenton chemistry approaches: Opportunities and limitations. Chemosphere 2017, 173, 520–528. [Google Scholar] [CrossRef]
  21. Webb, H.; Arnott, J.; Crawford, R.; Ivanova, E. Plastic degradation and its environmental implications with special reference to poly(ethylene terephthalate). Polymers 2013, 5, 1. [Google Scholar] [CrossRef] [Green Version]
  22. Wei, R.; Zimmermann, W. Microbial enzymes for the recycling of recalcitrant petroleum-based plastics: How far are we? Microb. Biotechnol. 2017, 10, 1308–1322. [Google Scholar] [CrossRef] [PubMed] [Green Version]
  23. Nakamiya, K.; Sakasita, G.; Ooi, T.; Kinoshita, S. Enzymatic degradation of polystyrene by hydroquinone peroxidase of Azotobacter beijerinckii HM121. J. Ferment. Bioeng. 1997, 84, 480–482. [Google Scholar] [CrossRef]
  24. Lyklema, J.; Norde, W.; van Loosdrecht, M.C.M.; Zehnder, A.J.B. Adhesion of bacteria to polystyrene surfaces. Colloids Surf. 1989, 39, 175–187. [Google Scholar] [CrossRef]
  25. Mor, R.; Sivan, A. Biofilm formation and partial biodegradation of polystyrene by the actinomycete Rhodococcus ruber. Biodegradation 2008, 19, 851–858. [Google Scholar] [CrossRef]
  26. Tischler, D. Microbial Styrene Degradation. SpringerBriefs in Microbiology; Springer: Berlin/Heidelberg, Germany, 2015; p. 108. [Google Scholar] [CrossRef]
  27. Ho, B.T.; Roberts, T.K.; Lucas, S. An overview on biodegradation of polystyrene and modified polystyrene: The microbial approach. Crit. Rev. Biotechnol. 2017, 38, 308–320. [Google Scholar] [CrossRef] [PubMed]
  28. Esmaeili, A.; Pourbabaee, A.A.; Alikhani, H.A.; Shabani, F.; Esmaeili, E. Biodegradation of low-density polyethylene (LDPE) by mixed culture of Lysinibacillus xylanilyticus and Aspergillus niger in soil. PLoS ONE 2013, 8, e71720. [Google Scholar] [CrossRef] [PubMed] [Green Version]
  29. Mukherjee, S.; Chowdhuri, U.R.; Kundu, P.P. Bio-degradation of polyethylene waste by simultaneous use of two bacteria: Bacillus licheniformis for production of bio-surfactant and Lysinibacillus fusiformis for bio-degradation. RSC Adv. 2016, 6, 2982–2992. [Google Scholar] [CrossRef]
  30. Yang, Y.; Yang, J.; Wu, W.-M.; Zhao, J.; Song, Y.; Gao, L.; Yang, R.; Jiang, L. Biodegradation and mineralization of polystyrene by plastic-eating mealworms: Part 2. Role of gut microorganisms. Environ. Sci. Technol. 2015, 49, 12087–12093. [Google Scholar] [CrossRef]
  31. Oelschlägel, M.; Zimmerling, J.; Tischler, D. A Review: The styrene metabolizing cascade of side-chain oxygenation as biotechnological basis to gain various valuable compounds. Front. Microbiol. 2018, 9, 490. [Google Scholar] [CrossRef]
  32. Mooney, A.; Ward, P.G.; O’Connor, K.E. Microbial degradation of styrene: Biochemistry, molecular genetics, and perspectives for biotechnological applications. Appl. Microbiol. Biotechnol. 2006, 72, 1–10. [Google Scholar] [CrossRef]
  33. Warhurst, A.M.; Fewson, C.A. Microbial metabolism and biotransformation of styrene. J. Appl. Bacteriol. 1994, 77, 597–606. [Google Scholar] [CrossRef] [PubMed]
  34. Grbić-Galić, D.; Churchman-Eisel, N.; Mraković, I. Microbial transformation of styrene by anaerobic consortia. J. Appl. Bacteriol. 1990, 69, 247–260. [Google Scholar] [CrossRef] [PubMed]
  35. Tourova, T.P.; Sokolova, D.S.; Nazina, T.N.; Laptev, A.B. Phylogenetic diversity of microbial communities from the surface of polyethylene terephthalate materials exposed to different water environments. Microbiology 2020, 89, 96–106. [Google Scholar] [CrossRef]
  36. Laptev, A.B.; Nikolaev, E.V.; Kurchev, E.V.; Goryashnik, Y.S. Features of biodegradation of thermoplastics based on polyesters in different climatic zones. Trudy VIAM 2019, 7, 84–91. (In Russian) [Google Scholar] [CrossRef]
  37. Bonch-Osmolovskaya, E.A.; Miroshnichenko, M.L.; Lebedinsky, A.V.; Chernyh, N.A.; Nazina, T.N.; Ivoilov, V.S.; Belyaev, S.S.; Boulygina, E.S.; Lysov, Y.P.; Perov, A.N.; et al. Radioisotopic, culture-based, and oligonucleotide microchip analyses of thermophilic microbial communities in a continental high-temperature petroleum reservoir. Appl. Environ. Microbiol. 2003, 69, 6143–6151. [Google Scholar] [CrossRef] [Green Version]
  38. Takahashi, S.; Tomita, J.; Nishioka, K.; Hisada, T.; Nishijima, M. Development of a prokaryotic universal primer for simultaneous analysis of Bacteria and Archaea using next-generation sequencing. PLoS ONE 2014, 9, e105592. [Google Scholar] [CrossRef] [Green Version]
  39. Edgar, R.C. Search and clustering orders of magnitude faster than BLAST. Bioinformatics 2010, 26, 2460–2461. [Google Scholar] [CrossRef] [Green Version]
  40. Edgar, R.C. UNOISE2: Improved error-correction for Illumina 16S and ITS amplicon sequencing. BioRxiv 2016, 081257. [Google Scholar] [CrossRef] [Green Version]
  41. Edgar, R.C.; Flyvbjerg, H. Error filtering, pair assembly and error correction for next-generation sequencing reads. Bioinformatics 2015, 31, 3476–3482. [Google Scholar] [CrossRef] [Green Version]
  42. Pruesse, E.; Peplies, J.; Glöckner, F.O. SINA: Accurate high-throughput multiple sequence alignment of ribosomal RNA genes. Bioinformatics 2012, 28, 1823–1829. [Google Scholar] [CrossRef]
  43. Oksanen, J.; Blanchet, F.G.; Friendly, M.; Kindt, R.; Legendre, P.; McGlinn, D.; Minchin, P.R.; O’Hara, R.B.; Simpson, G.L.; Solymos, P.; et al. Community Ecology Package. R Package. Version 2.5–6. 2019. Available online: https://cran.ism.ac.jp/web/packages/vegan/vegan.pdf (accessed on 1 September 2019).
  44. Anderson, M.J.; Gorley, R.N.; Clarke, K.R. PERMANOVA+ for PRIMER. Guide to Software and Statistical Methods; PRIMER-E: Plymouth, UK, 2008. [Google Scholar]
  45. Heberle, H.; Meirelles, G.V.; Da Silva, F.R.; Telles, G.P.; Minghim, R. InteractiVenn: A web-based tool for the analysis of sets through Venn diagrams. BMC Bioinform. 2015, 16, 169. [Google Scholar] [CrossRef] [PubMed]
  46. Nagpal, S.; Haque, M.M.; Singh, R.; Mande, S.S. iVikodak—A Platform and standard workflow for inferring, analyzing, comparing, and visualizing the functional potential of microbial communities. Front. Microbiol. 2019, 9, 3336. [Google Scholar] [CrossRef] [PubMed] [Green Version]
  47. Metsalu, T.; Vilo, J. ClustVis: A web tool for visualizing clustering of multivariate data using Principal Component Analysis and heatmap. Nucleic Acids Res. 2015, 43, W566–W570. [Google Scholar] [CrossRef] [PubMed]
  48. Harrison, K.J.; Crécy-Lagard, V.D.; Zallot, R. Gene Graphics: A genomic neighborhood data visualization web application. Bioinformatics 2018, 34, 1406–1408. [Google Scholar] [CrossRef] [PubMed]
  49. Syranidou, E.; Karkanorachaki, K.; Amorotti, F.; Repouskou, E.; Kroll, K.; Kolvenbach, B.; Corvini, P.F.-X.; Fava, F.; Kalogerakis, N. Development of tailored indigenous marine consortia for the degradation of naturally weathered polyethylene films. PLoS ONE 2017, 12, e0183984. [Google Scholar] [CrossRef] [Green Version]
  50. Otto, K.; Hofstetter, K.; Röthlisberger, M.; Witholt, B.; Schmid, A. Biochemical characterization of StyAB from Pseudomonas sp. strain VLB120 as a two-component flavin-diffusible monooxygenase. J. Bacteriol. 2004, 186, 5292–5302. [Google Scholar] [CrossRef] [Green Version]
  51. Kohler, K.A.; Ruckert, C.; Schatschneider, S.; Vorholter, F.J.; Szczepanowski, R.; Blank, L.M.; Niehaus, K.; Goesmann, A.; Puhler, A.; Kalinowski, J.; et al. Complete genome sequence of Pseudomonas sp. strain VLB120 a solvent tolerant, styrene degrading bacterium, isolated from forest soil. J. Biotechnol. 2013, 168, 729–730. [Google Scholar] [CrossRef]
  52. Lee, O.O.; Chung, H.C.; Yang, J.; Wang, Y.; Dash, S.; Wang, H.; Qian, P.-Y. Molecular techniques revealed highly diverse microbial communities in natural marine biofilms on polystyrene dishes for invertebrate larval settlement. Microb. Ecol. 2014, 68, 81–93. [Google Scholar] [CrossRef]
  53. Pu, W.; Cui, C.; Guo, C.; Wu, Z.L. Characterization of two styrene monooxygenases from marine microbes. Enzym. Microb. Technol. 2018, 112, 29–34. [Google Scholar] [CrossRef]
  54. Elifantz, H.; Horn, G.; Ayon, M.; Cohen, Y.; Minz, D. Rhodobacteraceae are the key members of the microbial community of the initial biofilm formed in Eastern Mediterranean coastal seawater. FEMS Microbiol. Ecol. 2013, 85, 348–357. [Google Scholar] [CrossRef] [Green Version]
  55. Dang, H.; Lovell, C.R. Microbial surface colonization and biofilm development in marine environments. Microbiol. Mol. Biol. Rev. 2016, 80, 91–138. [Google Scholar] [CrossRef] [PubMed] [Green Version]
  56. Slightom, R.N.; Buchan, A. Surface colonization by marine roseobacters: Integrating genotype and phenotype. Appl. Environ. Microbiol. 2009, 75, 6027–6037. [Google Scholar] [CrossRef] [PubMed] [Green Version]
  57. Wagner-Döbler, I.; Biebl, H. Environmental biology of the marine Roseobacter lineage. Annu. Rev. Microbiol. 2006, 60, 255–280. [Google Scholar] [CrossRef] [PubMed] [Green Version]
  58. Catão, E.C.P.; Pollet, T.; Misson, B.; Garnier, C.; Ghiglione, J.-F.; Barry-Martinet, R.; Maintenay, M.; Bressy, C.; Briand, J.-F. Shear stress as a major driver of marine biofilm communities in the NW Mediterranean Sea. Front. Microbiol. 2019, 10, 1768. [Google Scholar] [CrossRef]
  59. Salta, M.; Wharton, J.A.; Blache, Y.; Stokes, K.R.; Briand, J.F. Marine biofilms on artificial surfaces: Structure and dynamics. Environ. Microbiol. 2013, 15, 2879–2893. [Google Scholar] [CrossRef]
  60. Izumi, H.; Sagulenko, E.; Webb, R.I.; Fuerst, J.A. Isolation and diversity of planctomycetes from the sponge Niphates sp., seawater, and sediment of Moreton Bay, Australia. Antonie Leeuwenhoek 2013, 104, 533–546. [Google Scholar] [CrossRef]
  61. Bryant, J.A.; Clemente, T.M.; Viviani, D.A.; Fong, A.A.; Thomas, K.A.; Kemp, P.; Karl, D.M.; White, A.E.; DeLong, E.F. Diversity and activity of communities inhabiting plastic debris in the North Pacific Gyre. mSystems 2016, 1, e00024-16. [Google Scholar] [CrossRef] [Green Version]
  62. Rickard, A.H.; Gilbert, P.; Handley, P.S. Influence of growth environment on coaggregation between freshwater biofilm bacteria. J. Appl. Microbiol. 2004, 96, 1367–1373. [Google Scholar] [CrossRef]
  63. Limoli, D.; Jones, C.; Wozniak, D. Bacterial extracellular polysaccharides in biofilm formation and function. Microbiol. Spectr. 2015, 3, 3. [Google Scholar] [CrossRef] [Green Version]
  64. Oelschlägel, M.; Zimmerling, J.; Schlömann, M.; Tischler, D. Styrene oxide isomerase of Sphingopyxis sp. Kp5.2. Microbiology (UK) 2014, 160, 2481–2491. [Google Scholar] [CrossRef]
  65. Tischler, D.; Kermer, R.; Gröning, J.A.D.; Kaschabek, S.R.; van Berkel, W.J.H.; Schlömann, M. StyA1 and StyA2B from Rhodococcus opacus 1CP: A multifunctional styrene monooxygenase system. J. Bacteriol. 2010, 192, 5220–5227. [Google Scholar] [CrossRef] [PubMed] [Green Version]
  66. O’Connor, K.; Buckley, C.M.; Hartmans, S.; Dobson, A.D. Possible regulatory role for nonaromatic carbon sources in styrene degradation by Pseudomonas putida CA-3. Appl. Environ. Microbiol. 1995, 61, 544–548. [Google Scholar] [CrossRef] [PubMed] [Green Version]
  67. Lin, H.; Qiao, J.; Liu, Y.; Wu, Z.-L. Styrene monooxygenase from Pseudomonas sp. LQ26 catalyzes the asymmetric epoxidation of both conjugated and unconjugated alkenes. J. Mol. Catal. B Enzym. 2010, 67, 236–241. [Google Scholar] [CrossRef]
  68. Gassner, G.T. The styrene monooxygenase system. Methods Enzymol. 2019, 620, 423–453. [Google Scholar] [CrossRef]
Figure 1. Non-metric multidimensional scaling (NMDS) plot based on the Bray–Curtis similarity coefficients of marine and industrial bacterial communities. Points closer to one another in ordination space are more similar than those apart.
Sustainability 12 03624 g001
Figure 2. Relative proportion of bacterial 16S rRNA gene sequences from the PS samples presented at the phylum/class level. The taxa constituting at least >1% in each library are listed.
Sustainability 12 03624 g002
Figure 3. Heatmap of the distribution of 50 most relative abundant genera in the libraries of the 16S rRNA gene sequences from PS specimens. The representation of the genus was calculated by dividing the sequence proportions by the total sequence count in each library. Columns are clustered using correlation distance and average linkage.
Sustainability 12 03624 g003
Figure 4. The heatmap showing the clustering of PS samples based on the relative percentage of iVikodak-derived bacterial community functional profiles. The later analyzed styrene and phenylalanine metabolic pathways are marked.
Sustainability 12 03624 g004
Figure 5. Scanning electron microscope (SEM) images of biofilms on PS specimens after 10 days (U10, a), 40 days (U40, b), and 60 days (U60, c) of incubation in industrial water, and SEM image showing the surface modifications of specimen U60 after removal of the biofilm (d). SEM images of biofilms on PS specimens after 10 days (G10, e), 40 days (G40, f), and 60 days (G60, g) of incubation in seawater, and SEM image showing the surface modifications of specimen G60 after removal of the biofilm (h).
Sustainability 12 03624 g005
Table 1. Chemical composition of seawater and industrial water used for incubation of polystyrene (PS) samples.
Habitat, SpecimenTotal Salinity, mg/LpH Water Temperature, °CTotal Hardness, mg-eq/LTotal Iron, mg/LAlkalinity, mg-eq/kgCOD 1, mg O₂/dm3
Industrial Water
U1010988.5 ± 0.124.0–27.013.80.456.4101
U20 11008.5 ± 0.121.5–25.512.60.376.5103
U409188.4 ± 0.119.0–23.09.80.214.372
U606768.1 ± 0.114.0–18.06.70.612.490
Black Sea 2, G10, G40, G6018,6007.8 ± 0.126.8–25.166.9Nd 3NdNd
1 COD, chemical oxygen demand.2 All data on the seawater, except water temperature, were obtained at the beginning of the incubation period.3 Nd, no data.
Table 2. Diversity indices in the 16S rRNA gene libraries of bacterial communities on the surface of PS specimens exposed to water environments.
ParameterLibraries of 16S rRNA Gene Fragments
IndustrialMarine
U10U20U40U60G10G40G60
Duration of exposure, days10204060104060
Number of sequences (reads)29,46656,40537,55229,54627,24324,26144,303
Number of OTUs474703525483558443569
Shannon‒Weaver diversity index (H)3.55.74.64.15.24.35.2
Inverse Simpson diversity index (1/S)8.1138.932.617.168.514.054.6
Evenness (H/Hmax)0.560.870.720.670.820.710.81
Berger‒Parker dominance index (D)0.320.040.100.190.060.210.09

