Ammonia Emission Factors and Uncertainties of Coke Oven Gases in Iron and Steel Industries


1
Climate Change and Environment Research Center, Sejong University, Seoul 05006, Korea
2
Department of Cooperate Course for Climate Change, Sejong University, Seoul 05006, Korea
3
Department of Climate and Environment, Sejong University, Seoul 05006, Korea
*
Author to whom correspondence should be addressed.
Sustainability 2020, 12(9), 3518; https://doi.org/10.3390/su12093518
Submission received: 2 April 2020
/
Revised: 23 April 2020
/
Accepted: 23 April 2020
/
Published: 25 April 2020
(This article belongs to the Section Environmental Sustainability and Applications)
Abstract
:In this study, uncertainties related to NH3 concentration, emission factor, and emission factor estimation in the exhaust gas of the steel sintering furnace using COG (coke oven gas) among the by-product gas generated in steel production was estimated to identify the missing source. By measuring the NH3 concentration in the exhaust gas of steel sintering furnace using COG, a concentration between 0.02 and 0.12 ppm was found, with an average concentration of 0.06 ppm, confirming the emissions of NH3. Using this measurement of the NH3 concentration, an NH3 emission factor of 0.0061 kg NH3/ton was derived. The uncertainty of the developed NH3 emission factor of the sintering furnace using COG was analyzed using a Monte Carlo simulation. Consequently, the uncertainty range of NH3 emission factor of the sintering furnace using COG was derived to be −11.4% to +12.89% at the 95% confidence level. According to the results of this study, NH3 emissions occur from the use of COG, yielding values higher than the NH3 emission factor resulting from the use of LNG(liquefied natural gas) in combustion facilities. It should be recognized that it is a missing emission source and the corresponding emission should be calculated.
1. Introduction
The recent PM 2.5 concentration level in Korea was 24 µg/m3 as of 2018. Korea’s average PM 2.5 concentration in 2018 was ranked as the 27th highest in the world, according to a survey of 3000 cities in 73 countries by Air Visual, an air-quality monitoring company. When only considering OECD (Organization for Economic Cooperation and Development) countries, average PM 2.5 concentration in 2018, Korea exhibits the second poorest air quality after Chile (24.9 µg/m3), with a PM 2.5 level twice as high as that of major developed countries such as France(13.2 µg/m3), Japan(12.0 µg/m3), the United Kingdom(10.8 µg/m3), and the United States (9.0 µg/m3) [1].
One of the main causes of this problem is the increase in secondary fine dust generation materials, and the factors contributing to the generation of secondary fine dust include NOx, SOx, VOCs, and NH3 [2,3,4,5]. Among the air pollutants, Korea is managing NOx and SOx abundances in accordance with the air pollution total amount system, and measuring air pollution in real time through the air pollution measurement network [6,7,8]. However, NH3 is mainly managed in terms of its odor, and measurements are not performed in real time. In addition, studies related to NH3 emission sources are insufficient.
According to previous studies, the analysis change in Korea PM 2.5 concentration of the air pollutant reduction; through an air quality model, it was revealed that NH3 emission reduction provided the greatest potential for reducing the PM 2.5 concentration of all pollutants in Korea [9,10].
In Korea, the emission factor provided by the United States Environmental Protection Agency (US EPA) or CO-oRdination d’INformation Environnementale AIR(CORINAIR) from the European Environmental Agency, is used for the estimation of ammonia emissions. In addition, there are many unknown sources of pollution [11,12,13]. Accordingly, the importance of related studies is increasing, addressing issues such as missing sources associated with NH3 generation and the development of NH3 emission factors that reflect the situation in Korea.
Recently, renewable energy sources have been used as a component of the recent measures to reduce air pollution and greenhouse gas emissions. In the steel industry, Coke Oven Gas (COG), Blast Furnace Gas (BFG), and Linz–Donawitz Gas (LDG), which are discharged from the steel production process, are being recycled as energy sources in the process and power generation [14,15,16,17].
Among the NH3 emission sources of steel mills in Korea, emissions for the sintering furnace currently refer to the US EPA 1994 value, and the NH3 emission factor is applied only to the fuel sources such as coal, petroleum, and liquefied natural gas (LNG) used in the sintering furnace. However, for the by-product gases (COG, BFG, LDG) recently used in the steel production process, NH3 emission calculation and emission factor development are not being properly performed. Therefore, this study aims to identify the missing source by estimating the uncertainty related to NH3 concentration, emission factor, and emission factor calculation in the exhaust gas of the steel-sintering furnace, using COG among the by-product gases used in the steel production process.
2. Materials and Methods
2.1. Selection of Objective Facilities
In this study, NH3 samples were collected to confirm the NH3 concentrations at the COG gas outlets of the sintering furnaces in steel mills. The types of fuel and number of samples collected in the target facilities are shown in Table 1. The sample collection at target facility was conducted more than 3 times, and 10 samples were collected. The steel company’s COG composition was found to be the highest, with 52.92% H2 and the second-highest with 21.65% CH4.
2.2. Ammonia Analysis at Iron and Steel Production Facility
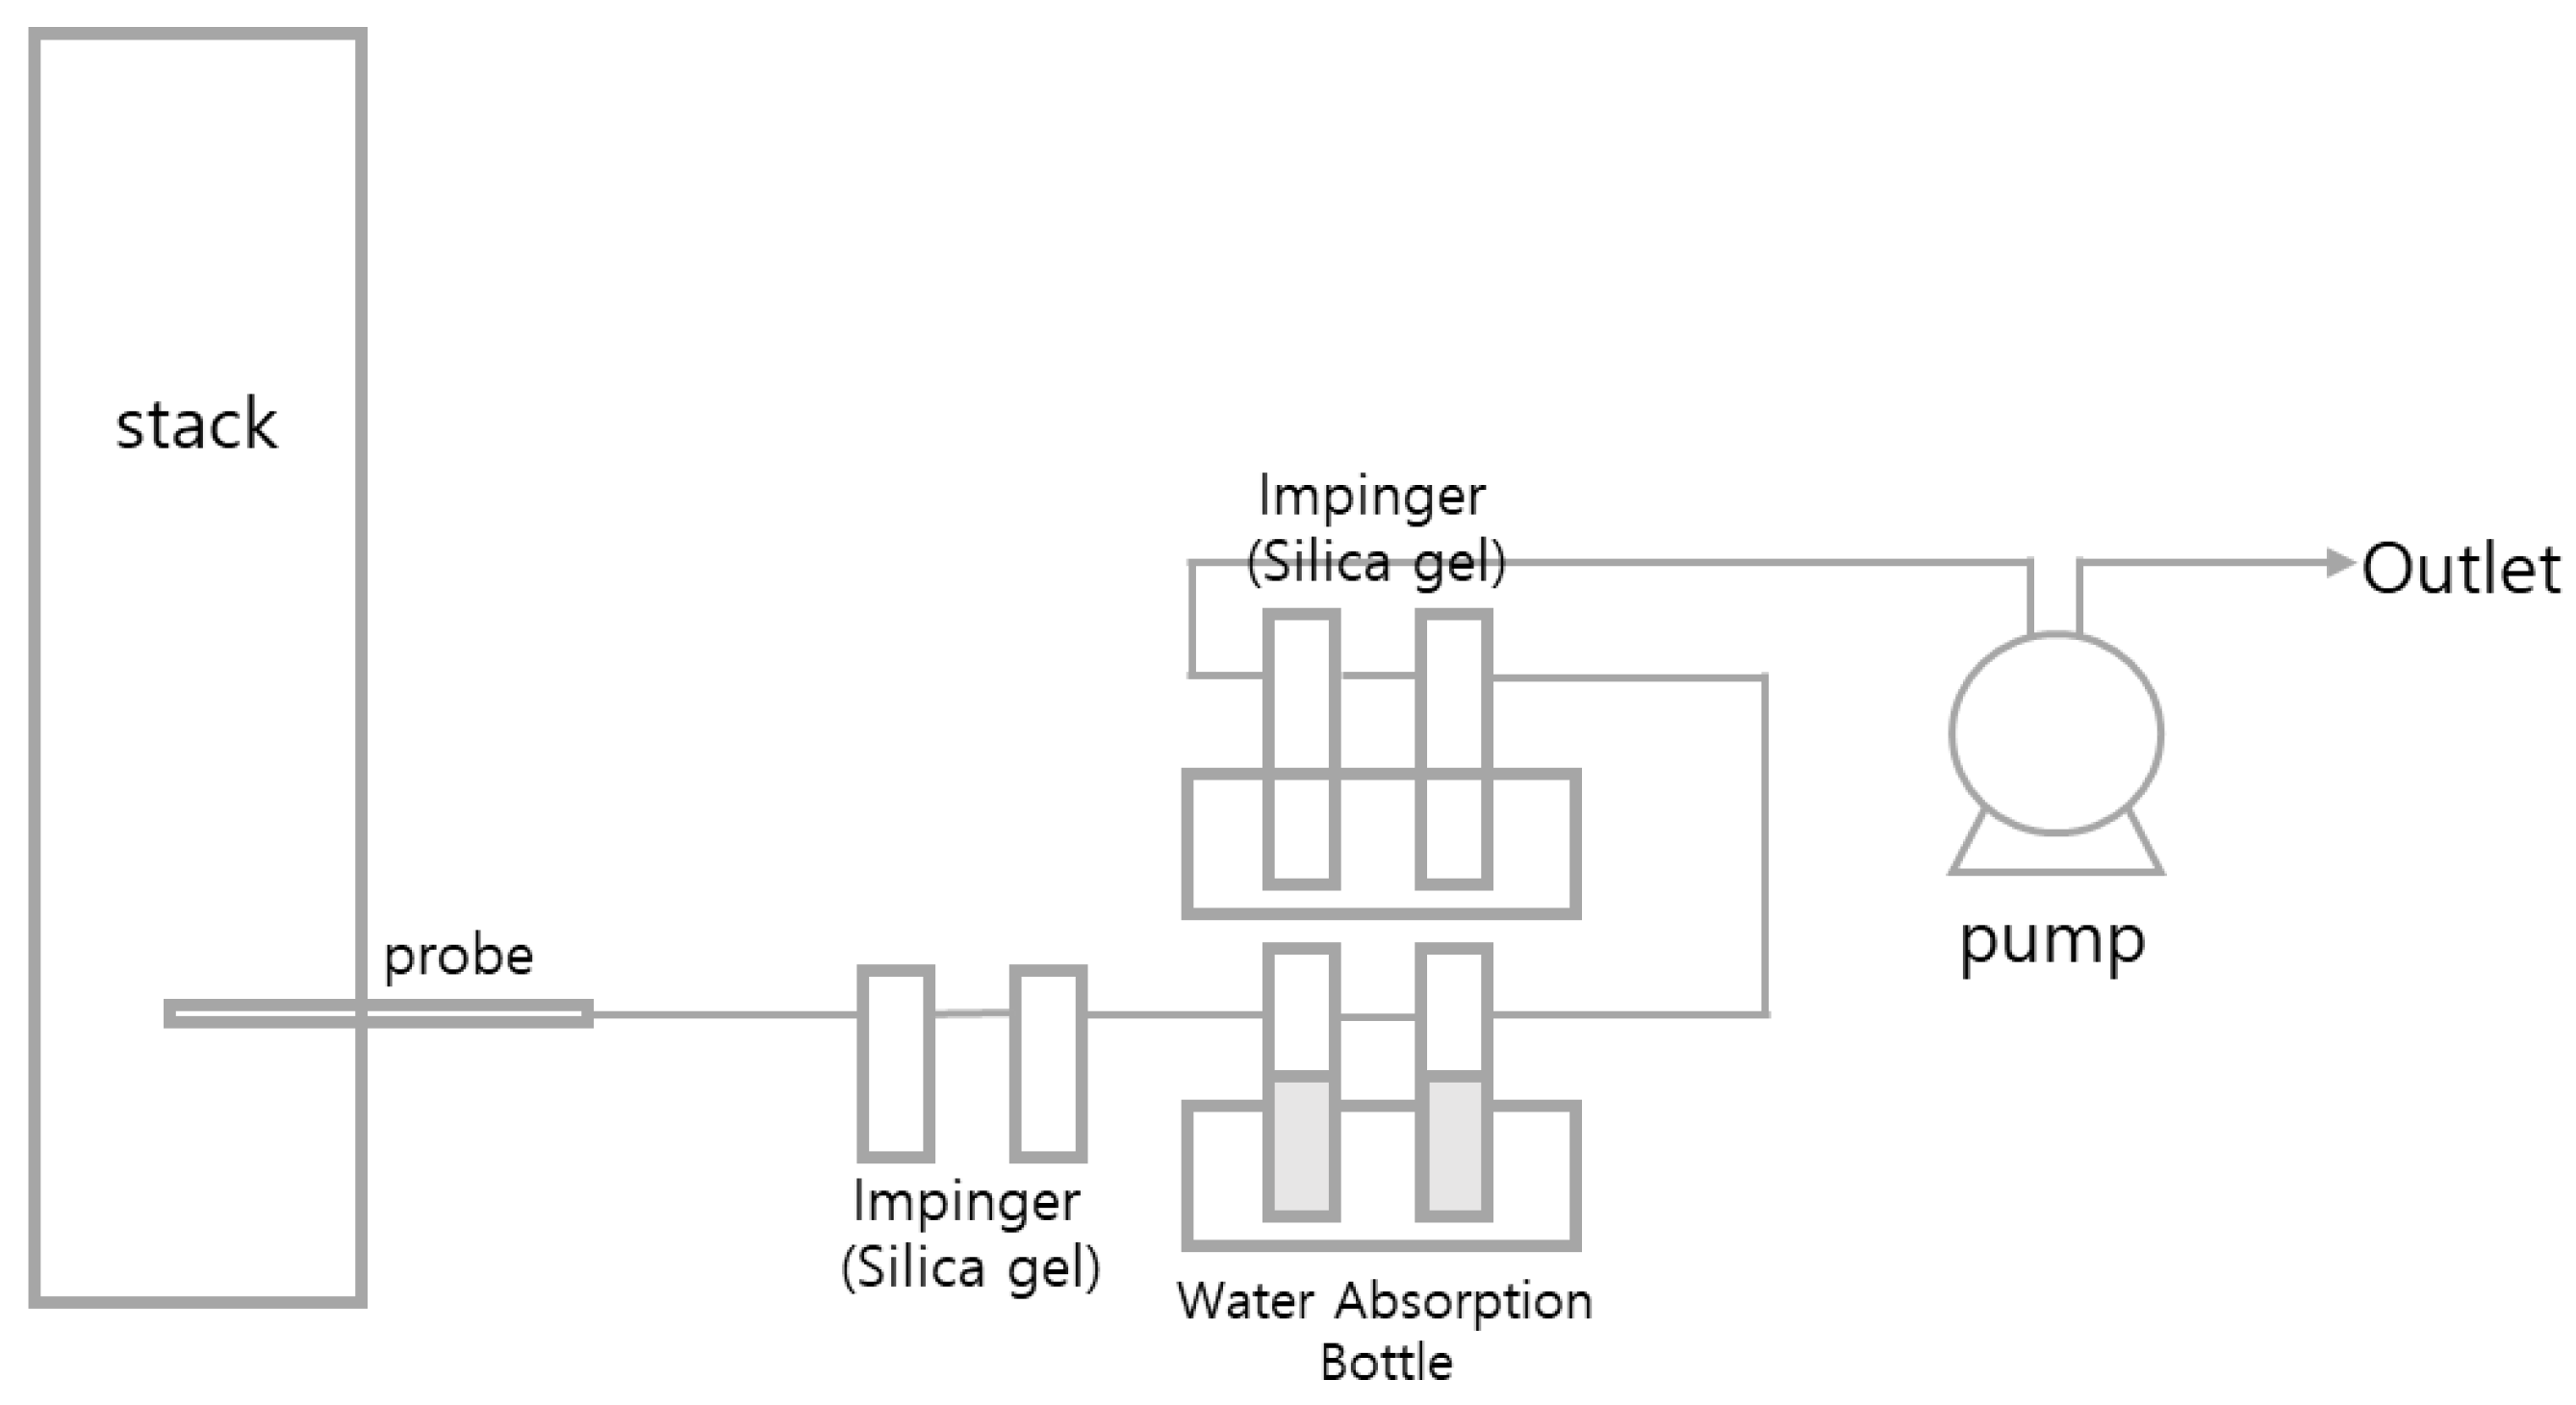
To measure the NH3 emission concentration at the sintering furnace COG gas outlets, the indophenol method was used in this study among the methods suggested for the measurement of NH3 emissions in the odor process test method and air pollution process test method of Korea [18]. The indophenol method is a method for estimating the NH3 content by measuring the absorbance of indophenols produced by the reaction with ammonium ions when sodium hypochlorite and phenol-sodium nitroprusside solutions are added to the sample solutions for analysis. For the NH3 sample collection, NH3 absorption solution (total 50 mL of boric acid solution for absorption) was added in two 50 mL volumetric flasks and flowed through 80 L of exhaust gas at 4 L/min for approximately 20 min using a mini-pump (SIBATA MP-ΣNⅡ, Japan). To remove the moisture contained in the gas discharged from the exhaust gas outlet of the sintering furnace, a desiccator bottle containing silica gel was connected in front of the NH3 sample collection device. The schematic for NH3 sample collection is shown in Figure 1. The absorptivity of the absorption solution used to collect NH3 at 640 nm wavelength was measured by through spectrophotometry (Shimadzu 17A, Japan). The accuracy of the spectrophotometry equipment is 0.5% of reading, and the linearity test results using ammonia standard samples 0.0009 mM/L, 0.0022 mM/L, 0.0134 mM/L, 0.0538 mM/L, and 0.0627 mM/L, R2 values showed high linearity with 0.9992.
2.3. Development of NH3 Emission Factor
The NH3 emission factor calculation is shown in Equation (1). The flow data needed for the development of the NH3 emission factor of sintering furnaces using COG in steel mills were taken from the CleanSYS data of the target facility, and the flow rate was measured by the daily integrated flow data. CleanSYS is an air pollution measurement network managed by the Ministry of Environment of Korea and measures air pollutants such as NOx, SOx, and PM, and the flow rate and temperature of the exhaust gas in real-time. In the case of COG fuel usage, data from the target facility were used.
where is emission factor (ton NH3/m3); is NH3 concentration in exhaust gas (ppm); is molecular weight of NH3 (constant) = 17.031 g/mol; is one mole ideal gas volume in standardized condition (constant) = 22.4 × 10⁻³ m3/mol; is daily accumulated flow rate (Sm3/day) (based on dry combustion gas); and is the daily fuel consumption (m3/day).
2.4. Uncertainty Analysis by Monte Carlo Simulation
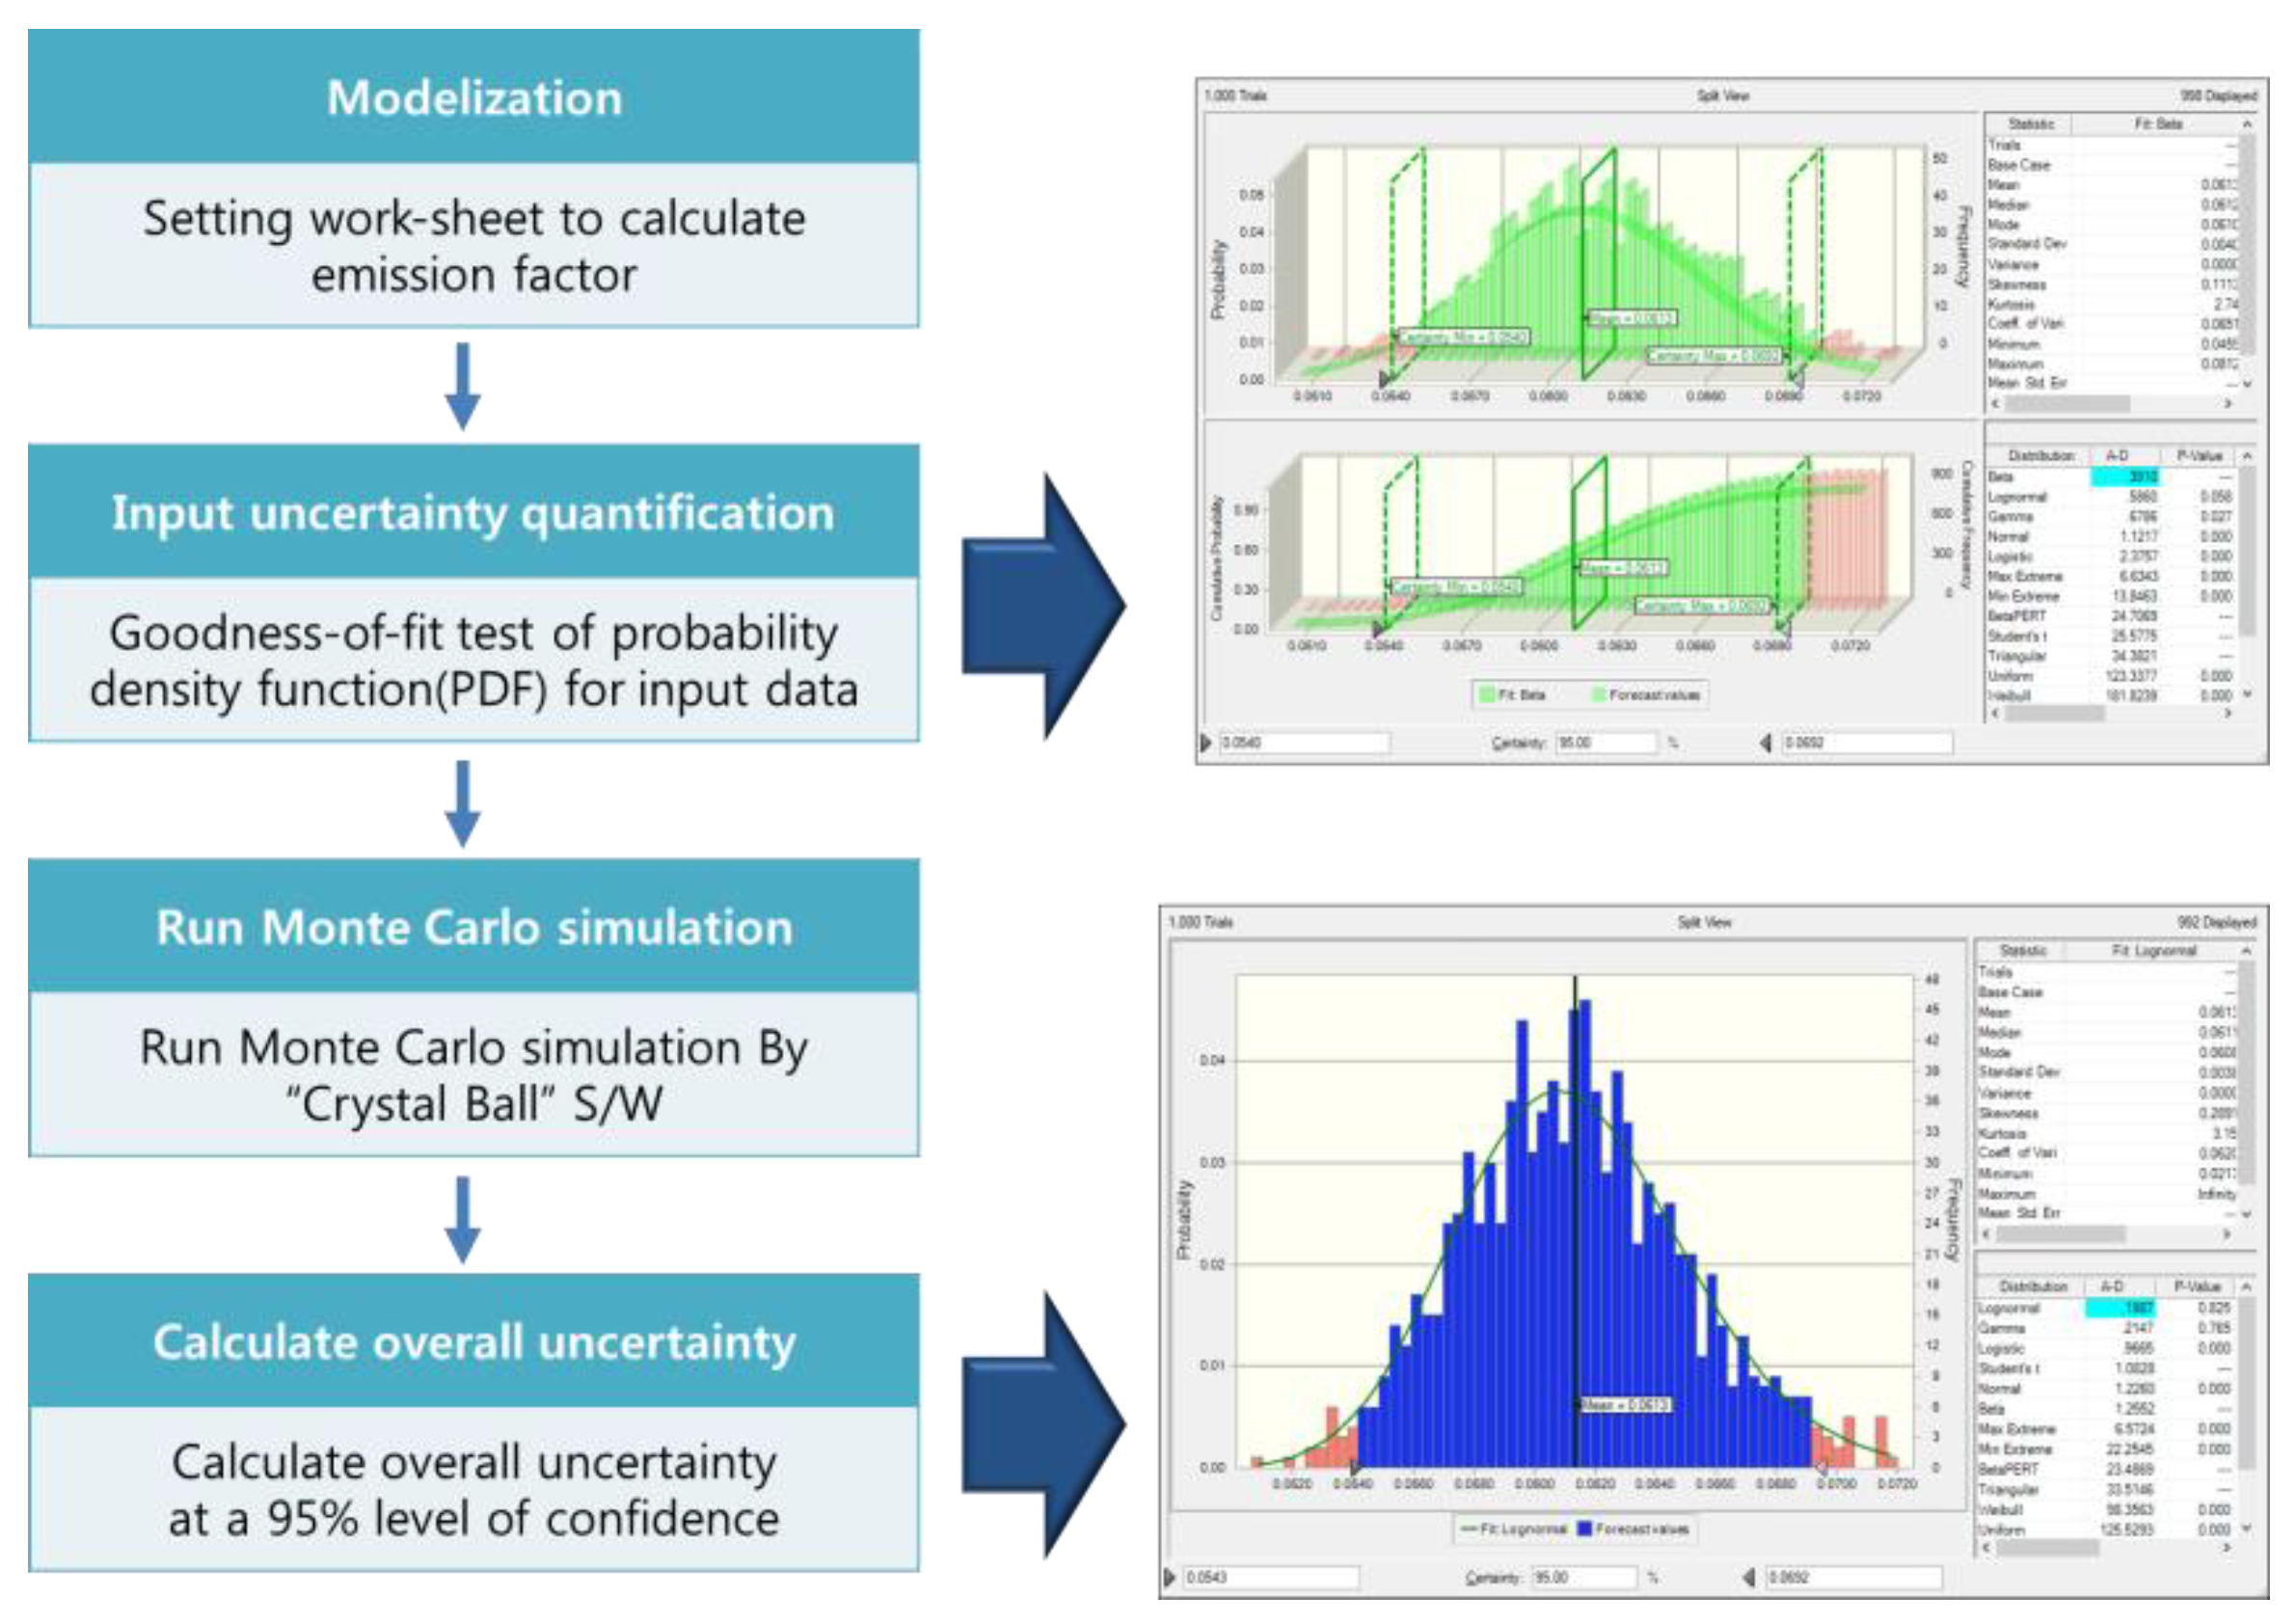
In this study, Monte Carlo simulation was used for the uncertainty analysis of the NH3 emission factor of the sintering furnace using COG from the steel works. Monte Carlo simulation is a method used to analyze uncertainties from the probability density function through the generation of random numbers. It is widely used for uncertainty analysis in the environmental science, especially for greenhouse gas [19,20]. Monte Carlo simulation can be analyzed in four stages, as shown in Figure 2. The first step is the selection of the model and the construction of the NH3 emission factor calculation worksheet. Second, the probability density functions of the input variables required for the development of the NH3 emission factor were tested through a suitability test. The significance level for hypothesis testing was selected at 95%, and each probability density function was calculated through a conformity test of data such as the NH3 emission concentration and the emission flow needed for NH3 emission factor development. The third step is to perform a Monte Carlo simulation, and a random sampling simulation was performed using the Monte Carlo simulation software, ver. 11.1.2.4 (Oracle Crystal ball, Oracle, Redwood City, California). The fourth step is to calculate the uncertainty range of the 95% confidence interval through the simulation results.
3. Results and Discussion
3.1. NH3 Emission Concentration at Iron and Steel Production Facility
For the NH3 concentration analysis, the sintering furnace of a steel production facility was visited three times, and 10 samples were collected. The NH3 concentration analysis results are shown in Table 2. As a result of this a using COG in the steel production facility, the concentration range was measured between 0.02 ppm and 0.12 ppm, and the average concentration was 0.06 ppm. The standard deviation of the NH3 concentration was 0.04 ppm. The daily average concentration was 0.05 ppm in the first and 0.07 ppm in the second and third days, so the concentration difference by daily average was not large.
3.2. NH3 Emission Factor at Iron and Steel Production Facility
The NH3 emission factor of the sintering furnace using COG in the steel production facility was developed by combining the NH3 concentration measured in this study with data received from the measurement facility, and the results are shown in Table 3. The development result of the NH3 emission factor of the sintering furnace using COG in the steel production facility was 0.0061 ton NH3/m3.
Currently, Korea’s national statistics do not apply an NH3 emission factor depending on COG usage, and there is no comparable data as no relevant overseas studies were found. Therefore, to confirm the level of the developed emission factor value, we compared it with the LNG-applied NH3 emission factor from the EPA among the emission factors currently applied to sintering furnaces in Korean steel mills. By comparison, the value was about 20% higher than the EPA emission factor, which is 0.0051 ton NH3/m3.
Based on these results, it is necessary to develop NH3 emission factors according to the use of COG, and they should be included in the NH3 inventory as a missing source.
3.3. Uncertainty of the NH3 Emission Factor at the Iron and Steel Production Facility
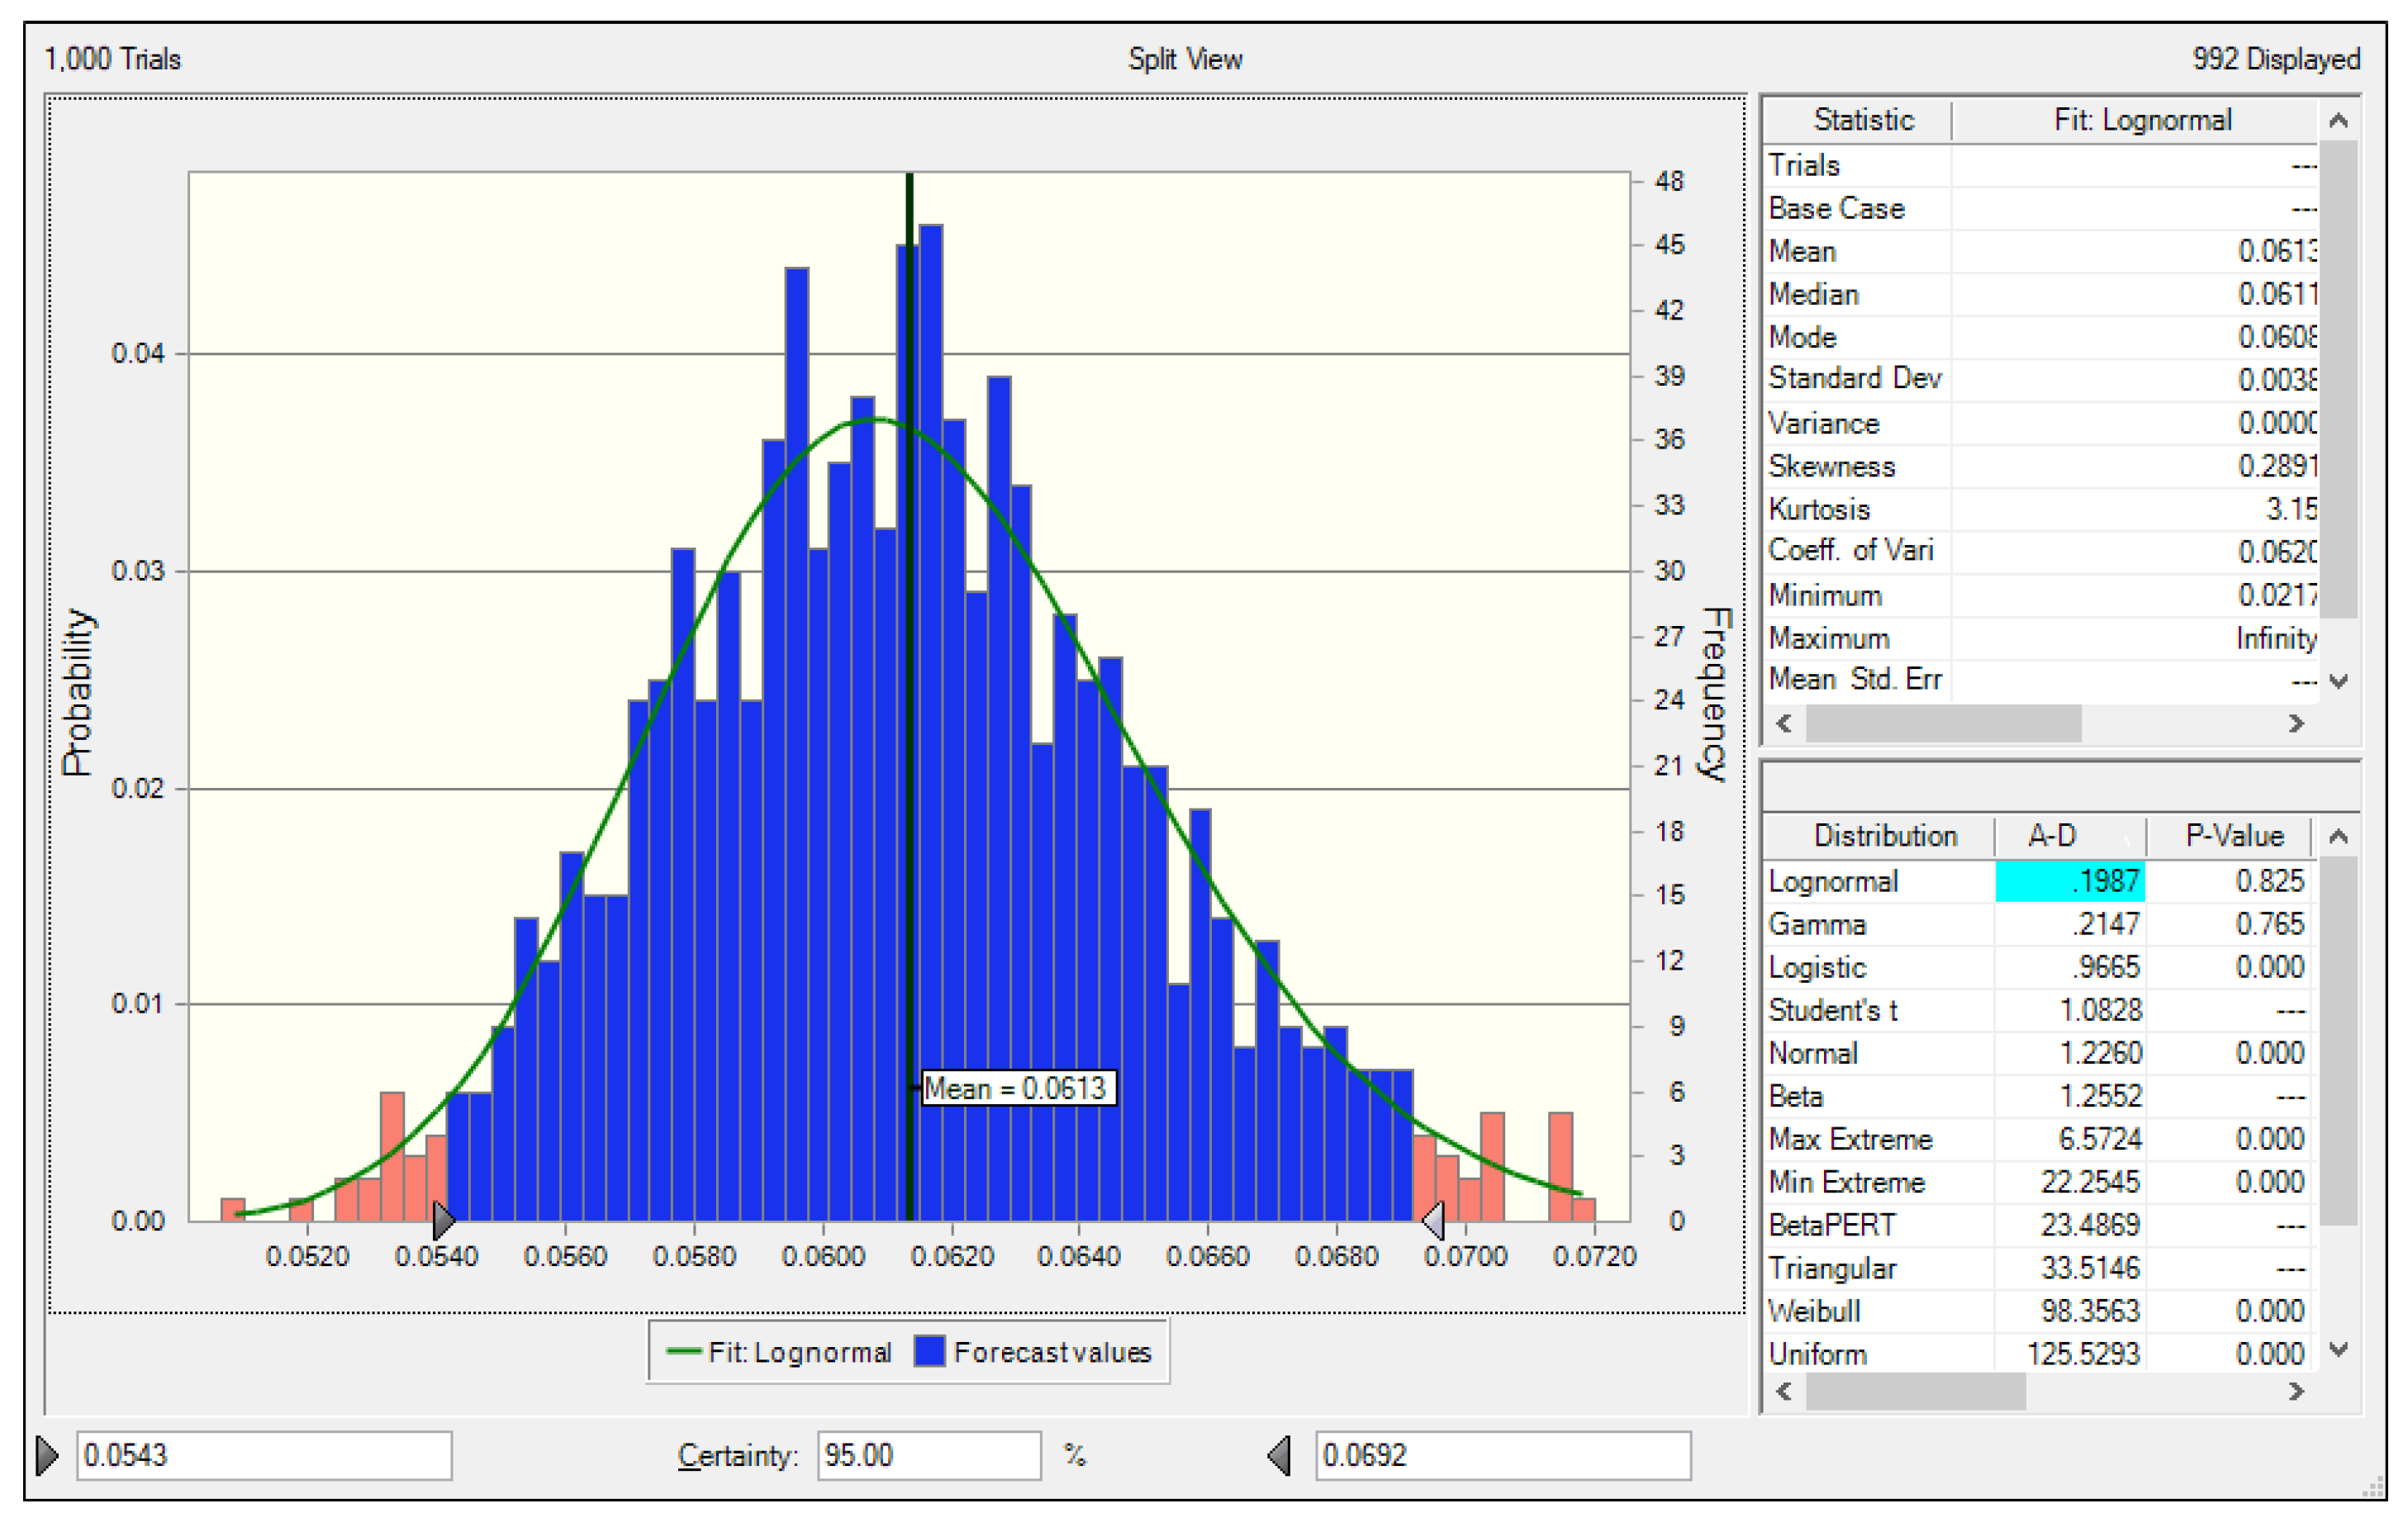
The Monte Carlo simulation developed in this study was used to estimate the uncertainty of the NH3 emission factor in the sintering furnace using COG in the steel production facility, and the calculation results are shown in Figure 3.
The probability density function of the NH3 emission factor developed in this study was analyzed with a log-normal distribution. The analysis result was an average of 0.0613 ton NH3/m3, and at the 95% confidence level, the bottom 2.5% corresponded to 0.0543 ton NH3/m3, whereas the top 97.5% corresponded to 0.0692 ton NH3/m3. The uncertainty range for the NH3 emission factor calculated using this value was analyzed to range from −11.4% to +12.89% at the 95% confidence level. As the NH3 uncertainty is not currently presented in numerical values or ranges, the comparison of related cases is difficult. However, greenhouse gases are presented in terms of uncertainty range and value.
When comparing the uncertainty of the NH3 emission factor of the steel production facility in this study with the Intergovernmental Panel on Climate Change(IPCC)greenhouse gas uncertainty range level, the value is lower than ±25%, which is the uncertainty range for the basic emission factor of steel production facilities proposed by the 2006 IPCC Guidelines. The uncertainty of Korean air pollutants is being evaluated by using the rank method, as suggested by the US EPA, and is being evaluated by experts [21,22]. Air pollutants such as greenhouse gases can be evaluated quantitatively if a range of uncertainty is provided.
4. Conclusions
Korea’s PM 2.5 concentration level was 24 µg/m3 in 2018, the second poorest air quality, after Chile among the OECD countries. One of the causes is due to the secondary fine dust generation materials, and NH3 is one of the main secondary PM 2.5 generation factors. If inventory reliability is improved and managed properly, it may contribute to the reduction of PM 2.5.
As the by-product gas generated in the steel industry has recently been utilized as a means for reducing greenhouse gases and air pollution, NH3 emissions can occur from by-product gas combustion. Currently, there are only a few studies on NH3 emissions from the use of by-product gas, and no relevant statistics have been collected. Therefore, in this study, uncertainties related to NH3 concentration, emission factor, and emission factor estimation in the exhaust gas of the steel sintering furnace using COG among the by-product gas generated in steel production was estimated in order to identify the missing source.
By measuring the NH3 concentration in the exhaust gas of the steel sintering furnace using COG, a concentration between 0.02 ppm and 0.12 ppm was found, with an average concentration of 0.06 ppm, confirming the emission of NH3. Using this measurement of the NH3 concentration, an NH3 emission factor of 0.0061 ton NH3/m3 was derived. Comparing the developed COG NH3 emission factor with the LNG NH3 emission factor obtained by using the EPA, the value was approximately 20% larger than the EPA’s emission factor (0.0051 ton NH3/m3), indicating the need for the development of an NH3 emission factor for the use of COG.
The uncertainty of the developed NH3 emission factor of the sintering furnace using COG was analyzed using a Monte Carlo simulation. Consequently, the uncertainty range of the NH3 emission factor of the sintering furnace using COG was derived to be −11.4% to +12.89% at the 95% confidence level. Comparing the uncertainty of the NH3 emission factor with the IPCC greenhouse gas uncertainty range level, it is found to be lower than ±25%, which is the uncertainty range for the basic emission factor of the steel production facility. In Korea, the uncertainty of air pollutants is evaluated by using the rank method based on expert opinion from the US EPA. If the uncertainties of air pollutants are presented in the same way as the uncertainty ranges of greenhouse gases, we can quantitatively evaluate the uncertainties of air pollutants.
According to the results of this study, NH3 emissions occur from the use of COG, yielding values higher than the NH3 emission factor resulting from the use of LNG in combustion facilities, thus, there is the possibility of a missing source. Therefore, it is necessary to develop emission factors by measuring the NH3 concentrations in more facilities and for other by-product gas fuels in order to establish statistics related to the use of by-product gas fuels.
In addition to by-product gas, discovering and supplementing missing emission sources related to NH3 emissions would significantly improve the reliability of the NH3 inventory in Korea. Furthermore, if the reliability of NH3 inventory were improved, it would be of great help in establishing PM 2.5 reduction policies.
In the case of Korea, studies on ammonia that contribute to the secondary generation of PM 2.5, which had been insufficient in related studies, have been conducted recently as the problem of PM 2.5 has become serious. Recently, studies have been conducted to evaluate the ammonia emission factor and the uncertainty of bituminous coal-fired power plants, and these studies have developed an emission factor of ammonia generated by steel companies among the ammonia emission sources and quantitatively calculated the uncertainty. In addition, in the case of COG, even though ammonia is currently being discharged, it is necessary to collect related activity data and establish an inventory related to emissions. In addition to this study, if studies on ammonia emission sources that country-specific emission factors of Korea are conducted in the future, it is believed that inventory reliability and quantitatively evaluated uncertainty data can be collected.
Author Contributions
Conceptualization, E.-C.J.; methodology and writing—original draft preparation, S.K.; Analysis, Y.-J.H.; Data curation, S.-D.K. All authors have read and agreed to the published version of the manuscript.
Funding
This work is supported by Korea Ministry of Environment (MOE) and Korea Environment Corporation.
Acknowledgments
This work is financially supported by Korea Ministry of Environment (MOE) as Graduate School specialized in Climate Change.
Conflicts of Interest
The authors declare no conflict of interest.
References
- IQAir AirVisual. 2018 World Air Quality Report Region & City PM2.5 Ranking; IQAir AirVisual: Goldach, Switzerland, 2019. [Google Scholar]
- Zhao, W.; Hopke, P.K. Source apportionment for ambient particles in the San Gorgonio wilderness. Atmos. Environ. 2004, 38, 5901–5910. [Google Scholar] [CrossRef]
- Gibson, M.D.; Pierce, J.R.; Waugh, D.; Kuchta, J.S.; Chisholm, L.; Duck, T.J.; Hopper, J.T.; Beauchamp, S.; King, G.H.; Franklin, J.E.; et al. Identifying the sources driving observed PM2.5 temporal variability over Halifax, Nova Scotia, during BORTAS-B. Atmos. Chem. Phys. 2013, 13, 7199–7213. [Google Scholar] [CrossRef] [Green Version]
- Ahmad, M.; Cheng, S.; Yu, Q.; Qin, W.; Zhang, Y.; Chen, J. Chemical and source characterization of PM2.5 in summertime in severely polluted Lahore, Pakistan. Atmos. Res. 2020, 234, 104715. [Google Scholar] [CrossRef]
- Agarwal, A.; Satsangi, A.; Lakhani, A.; Kumari, K.M. Seasonal and spatial variability of secondary inorganic aerosols in PM2.5 at Agra: Source apportionment through receptor models. Chemosphere 2020, 242, 125–132. [Google Scholar] [CrossRef] [PubMed]
- Environmental Preservation Association. POLICY & ISSUES Environment column: Air Pollutant Total Management System. Environ. Inf. 2015, 416, 2–5. [Google Scholar]
- Rhee, V.A. Reveiw of the Special Act on the Seoul Metropolitan Air Improvement: The Total Mass emissions Managements and the Tradable Permit Programs. Public Law J. 2007, 8, 255–280. [Google Scholar]
- Moon, T.H.; Hur, J.W. Linking the Total Pollution Load Management System (TPLMS) and the Total Industrial Site Volume Control System (ISVCS) in the Capital Region, Korea. J. Korea Plan. Assoc. 2009, 44, 19–30. [Google Scholar]
- Wu, Y.; Gu, B.; Erisman, J.W.; Reis, S.; Fang, Y.; Lu, X.; Zhang, X. PM2.5 pollution is substantially affected by ammonia emissions in China. Environ. Pollut. 2016, 218, 86–94. [Google Scholar] [CrossRef] [Green Version]
- Kim, S.T.; Bae, C.H.; Kim, B.U.; Kim, H.C. PM2.5 Simulations for the Seoul Metropolitan Area: (I) Contributions of Precursor Emissions in the 2013 CAPSS Emissions Inventory. J. Korean Soc. Atmos. Environ. 2017, 33, 139–158. [Google Scholar] [CrossRef] [Green Version]
- Battye, R.; Battye, W.; Overcash, C.; Fudge, S. Development and Selection of Ammonia Emission Factors Final Report; U.S. Environmental Protection Agency: Washington, DC, USA, 1994.
- NIER (National Institute of Environmental Research in Korea). 2016 National Air Pollutants Emission; National Institute of Environmental Research in Korea: Incheon, Korea, 2019.
- European Environment Agency. EMEP/EEA Air Pollutant Emission Inventory Guidebook 2019; European Environment Agency: Copenhagen, Danmark, 2019. [Google Scholar]
- Ahn, Y.G. Improving Sustainable Competitiveness in Preparation for a Circular Economy: The Case of Posc. Towards the Circular Economy: What it means to the Steel Industry. Asian Steel Watch 2018, 5, 14–23. [Google Scholar]
- Tran, K.C.; Harp, G.; Sigurbjörnsson, O.; Bergins, C.; Buddenberg, T. Carbon Recycling for Converting Coke Oven Gas to Methanol for the Reduction of Carbon Dioxide at Steel Mills; MefCO2: Auderghem, Belgium, 2016. [Google Scholar]
- Hu, Z.; He, D.; Feng, K.; Liu, P.; Jia, Y. Optimal Design Model of the Energy Systems in Iron and Steel Enterprises. Appl. Sci. 2019, 9, 4778. [Google Scholar] [CrossRef] [Green Version]
- Li, L.; Li, H.J. Forecasting and optimal probabilistic scheduling of surplus gas systems in iron and steel industry. J. Cent. South Univ. 2015, 22, 1437–1447. [Google Scholar] [CrossRef]
- Ministry of Environment in Korea. Standard Methods for the Measurements of Air Pollution; Ministry of Environment in Korea: Sejong Si, Korea, 2019.
- Law, A.M.; Kelton, W.D. Simulation Modeling and Analysis; McGRAW-HlLL International Editions: New York, NY, USA, 1991. [Google Scholar]
- Winiwarter, W.; Rypdal, K. Assessing the uncertainty associated with national greenhouse gas emission inventories: A case study for Austria. Atmos. Environ. 2001, 35, 5425–5440. [Google Scholar] [CrossRef]
- Emission Inventory Improvement Program. Technical Report Series Volume 6, Evaluating the Uncertainty of Emission Estimates; U.S. Environmental Protection Agency: Washington, DC, USA, 1996.
- Kim, J.; Jang, Y.K. Uncertainty Assessment for CAPSS Emission Inventory by DARS. J. Korean Soc. Atmos. Environ. J. 2013, 30, 26–36. [Google Scholar] [CrossRef] [Green Version]
Figure 1.
Schematic of the field setup for ammonia sampling at Iron and Steel Production facility.

Figure 2.
Process of the Monte Carlo simulation for estimating the uncertainty of the emission factor.
Figure 2.
Process of the Monte Carlo simulation for estimating the uncertainty of the emission factor.

Figure 3.
Process of the Monte Carlo simulation for estimating the uncertainty of the NH3 emission factor at Iron and Steel Production facility.
Figure 3.
Process of the Monte Carlo simulation for estimating the uncertainty of the NH3 emission factor at Iron and Steel Production facility.


Table 1.
Characteristics of the investigated Iron and Steel Production facility.
| Site | Fuel Type | Sampling |
|---|---|---|
| Iron and Steel Production facility A | Coke oven gas | 10 |
| Coke oven gas composition | % | |
| CO | 7.29 | |
| CO2 | 2.12 | |
| H2 | 52.91 | |
| N2 | 5.85 | |
| O2 | 0.06 | |
| H2S | 0.05 | |
| NH3 | 0.01 | |
| CH4 | 21.65 | |
| CmHn | 2.21 | |
| C2H4 | 1.46 | |
| C2H6 | 0.49 | |
| C3H6 | 0.11 | |
| C6H6 | 0.15 |
Table 2.
NH3 concentration of the investigated Iron and Steel Production facility.
| Sampling | NH3 Concentration (ppm) | Day Average NH3 Concentration (ppm) | |
|---|---|---|---|
| 1st | 1 | 0.07 | 0.05 |
| 2 | 0.07 | ||
| 3 | 0.02 | ||
| 2nd | 1 | 0.02 | 0.07 |
| 2 | 0.07 | ||
| 3 | 0.05 | ||
| 4 | 0.12 | ||
| 3rd | 1 | 0.02 | 0.07 |
| 2 | 0.07 | ||
| 3 | 0.12 | ||
| Mean | 0.06 | ||
| SD (Standard Deviation) | 0.04 | ||
Table 3.
NH3 emission factor of the investigated iron and steel production facility.
| NH3 Emission Factor of COG (This Study) ton NH3/m3 | NH3 Emission Factor of LNG (US EPA, 1994) ton NH3/m3 |
|---|---|
| 0.0061 | 0.0051 |
© 2020 by the authors. Licensee MDPI, Basel, Switzerland. This article is an open access article distributed under the terms and conditions of the Creative Commons Attribution (CC BY) license (http://creativecommons.org/licenses/by/4.0/).
Share and Cite
MDPI and ACS Style
Kang, S.; Hong, Y.-J.; Kim, S.-D.; Jeon, E.-C. Ammonia Emission Factors and Uncertainties of Coke Oven Gases in Iron and Steel Industries. Sustainability 2020, 12, 3518. https://doi.org/10.3390/su12093518
AMA Style
Kang S, Hong Y-J, Kim S-D, Jeon E-C. Ammonia Emission Factors and Uncertainties of Coke Oven Gases in Iron and Steel Industries. Sustainability. 2020; 12(9):3518. https://doi.org/10.3390/su12093518
Chicago/Turabian StyleKang, Seongmin, Yoon-Jung Hong, Seong-Dong Kim, and Eui-Chan Jeon. 2020. "Ammonia Emission Factors and Uncertainties of Coke Oven Gases in Iron and Steel Industries" Sustainability 12, no. 9: 3518. https://doi.org/10.3390/su12093518
Note that from the first issue of 2016, this journal uses article numbers instead of page numbers. See further details here.