1. Introduction
The increasing concern over issues related to energy security, climate change, global warming, environmental degradation, and the depletion of fossil fuels represent a threat to Europe and the whole world, propelling the need to make systemic changes to a shift towards a more sustainable economy [
1]. Furthermore, the report of the Second UN Environment Conference states that approximately seven million people worldwide die from air pollution every year [
2].
Moreover, the agenda of the European Union (EU) stresses the importance of sustainable development as a means of development, capable of improving living conditions, developing better conditions for companies, and increasing countries’ competitiveness [
3].
To this extent, government policies must urgently implement sustainable transportation, waste management strategies [
4,
5,
6,
7,
8,
9], sustainable tourism [
10,
11], and develop low-carbon economies [
8]. Concerning the latter, the increasing interest in renewable energy is also due to Europe’s dependency on foreign energy sources and to the recent concerns over the volatility of the price of crude oil [
8].
Moreover, we are currently witnessing an ongoing debate over how to balance the relationships between human health, environmental concerns, and economic development [
12,
13,
14].
In this regard, in December 2019 the European Commission presented the European Green Deal, which establishes that the European Union needs to transform itself into a resource-efficient and competitive economy with zero net emissions of greenhouse gases by 2050, and its economic growth should detach itself from resources use. The main objective is to boost the efficient use of resources by moving to a clean, circular economy, and, consequently, stopping climate change, cutting pollution, and improving the health of population [
12].
Moreover, European Union member countries launched, at the beginning of 2005, the CO
2 emissions trading scheme. Setting environmental taxes is very useful for two reasons. First, they represent an incentive for companies to research and invest in more environmentally friendly technologies, or to deploy fewer resources. Secondly, the increased fiscal revenue resulting from higher tax collection can be used to reduce taxes on labor, savings, and capital, thereby favoring higher investment in environmental conservation [
13].
Health, the main proxy for which is life expectancy at birth, certainly represents one of the key indicators of a population’s well-being and the economic development of a country [
14]. Some factors, such as industrialization and modernization, have allowed life expectancy to improve considerably. According to some scholars, economic development leads to reductions in the impact on the environment. Thus, the search for economic growth would also have the positive effect of improving sustainability [
9]. Furthermore, many past studies suggest that development reduces infant mortality and increases life expectancy throughout the world [
9,
15].
Research on the economic factors influencing human health have flourished recently [
3,
12,
16,
17], whereas the literature on the relationships between health, renewable energy consumption, and socio-economic factors is rather poor. The International Energy Agency [
17] underlined the importance of the promotion of clean energy globally, pointing out that all countries can dispose of at least one renewable energy source, the development of which requires significant investment, creating job opportunities and improving new technologies. Mazur [
18] analyzed energy consumption and various human well-being indicators for a sample of high-income nations from 1980 to 2006, but he registered a higher life expectancy independent of the increase or decrease in per capita energy consumption levels.
According to Firebaugh and Beck [
19], economic development reduces infant mortality and increases life expectancy worldwide. However, Brady et al. [
10] highlight that the effects of development registered a moderate reduction over time in less developed nations, and Preston [
20] emphasizes that economic development is not the only factor influencing changes in human well-being.
The Stern Report [
21], commissioned by the UK Treasury, revealed the negative impacts that climate change may have on health and economic growth. It stated that the average temperature of greenhouse gases would rise in the next 50 years by between 2 °C and 3 °C, posing a threat to human life with regards to access to water, food production, land use, environment, and health. In regard to health, accelerating global warming is expected to worsen the impact of diseases such as malaria and malnutrition, mainly affecting poor countries [
22,
23,
24]. Furthermore, it increases the formation of ozone, which has negative effects on respiratory and cardiovascular health and favors the intensification of heat waves [
24], which contribute to increasing numbers of heart attacks. Moreover, increasing sea levels [
25,
26] have negative effects on population health and crops, causing changes in nutrition and increased instances of infectious diseases.
Fossil fuels, as is well known, are the main source of air pollutants, and many papers have shown their damaging effects on human health, including cardiovascular and respiratory diseases. To this extent, Pablo-Romero et al. [
27] reviewed the exploitation of renewable energy sources. They highlighted that the direct result of the use of renewables is the reduction of fossil fuels and of related air pollutant emissions, generating positive effects on human health.
Some of the studies that analyzed the impact of climate change on health [
28,
29] show that it has the worst effect in societies characterized by exiguous resources, little technology, and inadequate infrastructure. Historically, indeed, higher temperatures have reduced economic growth mainly in poor countries, with a noticeable effect on agriculture, industry, and political stability [
22]. In particular, a study [
30] shows that greenhouse gas emissions by fossil electricity generation have the highest impact on human health, whereas nuclear and renewables technologies have a noticeable lower one. Therefore, since the use of fewer pollutant energies leads to a decrease in emissions, it follows that there will result a reduction of diseases, consequent lower economic costs to society, and less dependence on fossil fuels in third countries.
Since understanding the relationship between renewable energy consumption and health is crucial, and, given the poor scientific literature on their bilateral relationship, the main purpose of our study is to evaluate this, thereby filling this gap in knowledge. All nations share the same fight against climate change and environmental degradation, but not all EU member states start from the same position [
12]; thus, we identified twelve countries sharing common features: Austria, Belgium, Finland, France, Germany, Greece, Ireland, Italy, the Netherlands, Portugal, Spain, and Sweden. They have in common that they are historical members, energy importers, and among the richest countries in the EU. Naturally, the drivers of climate change and biodiversity loss are not limited to European borders; thus, the EU should also use its influence to mobilize its neighbors to join in its efforts [
31].
We explored the link between some proxy variables for renewable energy consumption, government policy, the market, general public awareness, lobbying activity, the dependence on third countries, and health, spanning the period from 1990 to 2015. Specifically, our analysis shows the importance of adopting a stringent policy for the development of renewable energy consumption and its influence over other social factors, rather than the existence of causal relationships between health and renewable energy consumption for the analyzed countries. This kind of analysis has a great importance for policy-makers. Further, a deeper understanding of these relationships can create a more effective decision-making process.
The remainder of this paper is organized as follows.
Section 2 describes the data, the methodology used, and the econometric specification, estimating the impact of the variables of interest. The empirical results are presented in
Section 3.
Section 4 summarizes the main findings of the study, and the final Section outlines our conclusions.
2. Materials and Methods
The main purpose of this study was to investigate the role that socio-technical factors can play in the transition to a renewable-energy-based economy in a group of 12 European countries (Austria, Belgium, Finland, France, Germany, Greece, Ireland, Italy, the Netherlands, Portugal, Spain, and Sweden) that are energy importers. For this purpose, we used annual data from 1990 to 2015. Given that the process of transition to a renewable-energy economy is a dynamic one, we tried to use the longest time span possible. Our empirical strategy uses a Panel Vector Auto Regression (PVAR) technique. In the wake of the work of Sung & Park [
1,
32], this methodology combines the traditional VAR approach, in which all the variables in the system are endogenous, with the panel data approach, which allows to borrow strength from the cross-sectional dimension and focus on bidirectional effects.
In
Table 1 the name, definition, and source of the raw variables are presented.
The first variable is renewable energy consumption (REC), which is measured by the percentage contribution of renewables to total energy generation. It proxies the degree of transition to a renewable-energy economy [
1].
EPS (Environmental Policy Stringency Index) represents government policy, since it is used as an indicator of the stringency of environmental regulations. It proxies pressure exercised by government, and, since it is a mighty force, it is able to promote change [
1].
This composite index does not only include market-based instruments, but also non-market-based ones. The first component contains market-based instruments such as taxes, trading schemes, and feed-in tariffs. The second instead includes government expenditure in R&D for renewable technologies, or the emissions limit standards for greenhouse effect gases [
1].
CO
2 is a proxy for general public awareness, and it is measured in metric tons of emissions per capita. Greenhouse gases consists of water vapor, carbon dioxide, methane, ozone, nitrous dioxide, chlorofluorocarbons, and hydrofluorocarbons, which are directly responsible for global warming and climate change. Thus, it is essential to act as swiftly as possible to reduce these kind of emissions [
1].
GDP is an indicator of the economic growth of a country and is an important factor affecting both CO
2 emissions and REC. Thus, in their analysis, Durmuşoğlu et al. [
33] assumed that GDP is a key factor to development. Indeed, economic growth has an important effect on many indexes, and is undoubtedly essential to achieving sustainable development.
According to the Kuznets curve hypothesis [
34,
35,
36,
37], pollution increase is linked to income at low income levels. At a higher income level, instead, a turning point is reached, and further growth leads to lower pollution levels [
37]. Some researchers [
38,
39], on the contrary, state that the relationship between development and pollution is monotonically rising.
Many studies have analyzed the relationship between REC and GDP, concluding that there is a relationship between them. Sadorsky [
40] has shown that increasing GDP has a positive and statistically significant impact on REC. In the long term, a 1% increase in per capita income is related to an increase in per capita REC by approximately 3.5%.
Apergis et al. [
41] have analyzed the long-run causality between REC and GDP using the Canning and Pedroni [
42] long-run causality test, finding a strong bidirectional causality. Renewable energy has a crucial role with regards to economic growth, which, in turn, increases the use of renewable energy sources. Also Sebri et al. [
43], examining this relationship, found a bidirectional causality between variables.
In their analysis, Bakirtas et al. [
44,
45] found a long-run cointegration between renewable energy and economic growth and a causality from economic growth to renewable energy.
Özşahin et al. [
45,
46] found a positive long-run relationship between REC and economic development and Inglesi-Lotz [
47] found a statistically significant positive effect of REC on economic growth. Menyah et al. [
48], exploring the causal relationship between CO
2 emissions, REC, nuclear energy consumption, and GDP, found a causality from economic growth to REC. Tugcu et al. [
49] have analyzed the long-run and causal relationships between REC, non-renewable energy consumption, and economic growth, finding that both REC and non-REC are important for economic growth.
Lin et al. [
50] have examined the relationship between REC and economic growth in China, finding a bi-directional long-term causality between them. This indicates that the growing economy of China is favorable to boosting the development of the renewable energy sector, which, in turn, increases economic growth. Ocal and Aslan [
51] found that REC has a negative impact on GDP, and that there is unidirectional causality from economic growth to REC. In their study, Ben-Sahla et al. [
52] detected the presence of a bi-directional causality between GDP and REC. It positively impacts GDP and, in turn, is positively affected by GDP. This suggests that REC exerts negative effects on CO
2 emissions; thus, the promotion of renewable energy in developing countries may reduce the use of non-renewable energy consumption. Furthermore, it appears that REC positively impacts the GDP, and CO
2 emissions negatively affect REC, and that the latter is only affected by GDP.
The variable electricity production from oil, gas, coal, and nuclear sources (OGCN) instead relates to lobbying pressure, and is measured as the percentage contribution of traditional energy sources, such as oil, gas, coal, and nuclear, to overall electricity generation. Lobbying power is directly proportional to the contributions of traditional energy sources, which discourage the development of the renewable energy sector. For this reason, the contributions of traditional energy sources lend themselves well as proxies for the power exerted by their relevant interest groups.
Net energy imports (IMP) proxy a country’s dependency on energy imported from third countries, and can be measured by the ratio of imported energy to the total energy supply. The relevance of this factor lies in the fact that a higher import dependency should induce investments in a country’s own renewable resources, increasing the contribution of renewables to the total energy supply [
9].
Life expectancy at birth (LIFE) proxies health. It denotes the average number of years that a newborn infant is likely to live, assuming that prevailing patterns of mortality at the moment of its birth remain unchanged throughout its life [
9].
The data on REC, CO2, GDPc, OGCN, IMP and LIFE were extracted from the World Development Indicator database of World Bank, whereas the data on EPS were obtained from the Organisation for Economic Co-operation and Development (OECD).
The existing literature, especially on renewable energy, has contributed to the discussion on the roles and interactions of factors and has helped us to determine and focus upon the main identified factors and determine the relationships between them. By proposing a systematic panel approach, we identified the importance of each factor and defined its influence.
The use of percentage values was due to the fact that they are capable of removing distortions produced by country size.
Following the recent empirical literature, Love and Zicchino [
53] proposed an estimator that allows for the presence of stationary endogenous variables and unobserved individual heterogeneity. The specification of the PVAR model used in this empirical analysis follows the specification of Equation (1):
where
represents the vector of stationary variables in our analysis,
denotes the vector of deterministic fixed effects,
is a square matrix polynomial in the lag operator, and
is the random error term.
Integration within the EU has induced closer ties among member states, so that variations in the energy sector of a country may influence that of others. As a consequence, cross-national endogenous interactions must be taken into account.
Interdependencies among variables may take three forms [
54]:
- (1)
Dynamic interdependencies spanning over time, due to the presence of the lagged variables on the right-hand side of the model.
- (2)
Within-countries interdependencies, arising as the elements of may affect each other at the national level.
- (3)
Between-countries interdependencies, arising as the elements of may affect each other across the national borders.
The descriptive statistics of the variables are presented in
Table 2.
Macroeconomic variables are usually characterized by non-stationarity, and this may affect the econometric analysis of time series and panels since the use of non-stationary variables gives spurious results. When the variables in the model are non-stationary, the first-difference transformation may be used to overcome this problem. The first step of the empirical analysis was to examine the stationarity of the different series using various unit root tests. Two classes of test allow the investigation of the presence of a unit root. The first-generation unit root tests are based on the hypothesis of cross-sectional independence between panel units; among others, we have the Levin, Lin and Chu (LLC) tests [
55], the Im, Pesaran and Shin (IPS) tests [
56,
57], and the Fisher’s type tests [
58]. The main limitation of these tests is that they are all constructed under the assumption that the individual time series in the panel are cross-sectionally independently distributed, while, on the contrary, a large amount of literature provides evidence of the co-movements between economic variables, and, as argued by Banerjee et al. [
59], panel unit root tests may be biased if the panel units are cross-cointegrated. To overcome this difficulty, a second generation of unit root tests has been proposed that relax the assumption of cross-sectional independence, allowing for a variety of dependence across the different units; among others, we have the Pesaran tests, based on the Cross-Sectional Augmented Dickey–Fuller [
60].
To analyze the order of the integration of our variables, the IPS tests, the Maddala and Wu (MW) tests, and the Pesaran tests were used. All tests were characterized by a null hypothesis that assumes a unit root. The results of these panel unit root tests are shown in
Table 3 (variables in levels) and
Table 4 (variables in first differences). At conventional levels of significance, the results show that all variables were non-stationary in levels, since the null hypothesis is usually not rejected. However, all the selected variables were stationary after the first difference: all the series were integrated of order one I(1).
Table 5 shows the results of the cointegration tests developed by Westerlund [
61]. The null hypothesis of these tests is the absence of cointegration. The G
τ and G
α statistics test whether cointegration exists for at least one panel unit. The P
τ and P
α statistics test whether cointegration exists for the panel as a whole. To take account of cross-section interdependence the robust
p-value was computed through bootstrapping with 100 replications. As shown by the robust
p-value, the null hypothesis of no cointegration cannot be rejected by all four tests. Therefore, the empirical properties of the variables examined require estimation in first differences, since no cointegration relationships exist between the (non-stationary) variables (in level).
The correlation matrix and the Variance Inflation Factor (VIF) have been analyzed to check the presence of collinearity and multicollinearity. The correlation matrix and the VIF statistics are reported in
Table 6 (dREC has been considered as dependent variable). Given the low correlation values and the low VIF and mean VIF values, we can conclude that collinearity and multicollinearity were not a concern.
Before the PVAR estimation, the last preliminary step was the lag order selection. Selecting the appropriate number of lags is crucial for PVAR: too few lags fail to capture the system’s dynamics, leading to omitted variable bias; too many lags cause a loss of degrees of freedom, with consequent over-parameterization. The results can be seen in
Table 7. The Hansen’s J statistics test the null hypothesis that the model specification is over-identified, or, in other words, that the included instruments were valid instruments and that they were uncorrelated with the error term, while the excluded instruments were correctly excluded [
62]. After passing the Hansen’s J test, following the econometric literature, the optimal lag length should be the one that minimizes the moment model selection criteria developed by Andrews and Lu (2001): Moment Bayesian Information Criterion (MBIC), Moment Akaike’s Information Criterion (MAIC), and Moment Hannan and Quinn Information Criterion (MQIC). These criteria are very similar to the maximum likelihood-based information criteria AIC, BIC and HQIC. Based on the three model selection criteria by Andrews and Lu (2001), a first-order PVAR was the preferred model.
The deterministic fixed effects
in Equation (1) were removed by applying the first difference transformation. This procedure, however, may generate the well-known Nickell bias [
63], due to the correlation between the first-differenced lag and the first-differenced error term (both depend on
). In this context, estimating the dynamic panel equation by OLS will produce biased and inconsistent estimates [
64]. To overcome this problem, we used forward mean-differencing, also known as the Helmert procedure [
53,
65]. This procedure removes the forward mean from each observation, i.e., the mean of all the future observations available for each unit and available years. As a result, the orthogonality between transformed variables and lagged regressors was preserved. The system may thus be estimated by the Generalized Method of Moments (GMM), with the lags of the regressors as instrumental variables.
3. Results and Discussion
The PVAR was estimated using one lag and with the GMM-style option [
36], which replaces the missing values with zeroes and is capable of producing more efficient estimates. The first-order PVAR results are listed in
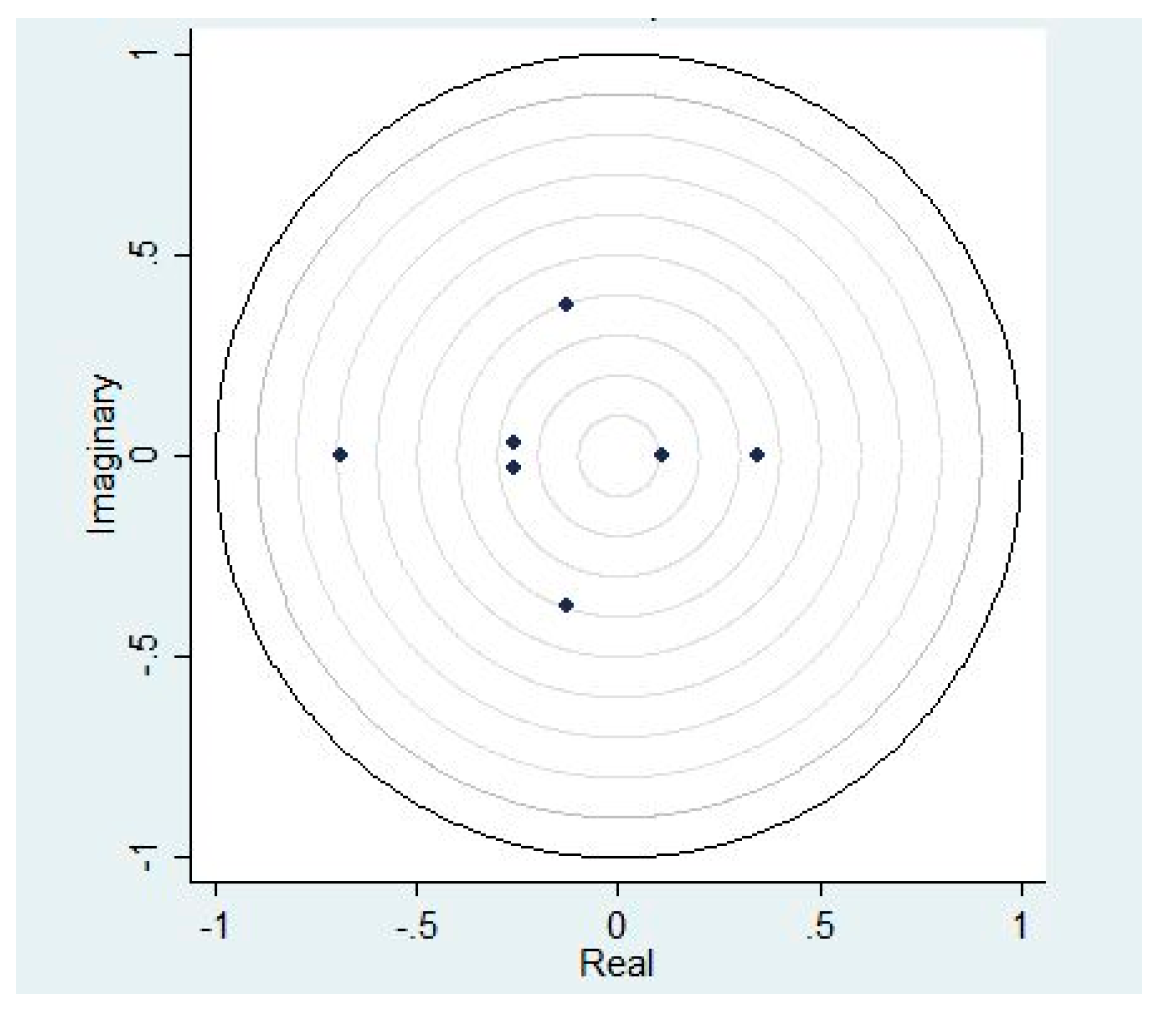
Table 8. The stability of the PVAR was checked and confirmed since the eigenvalues are strictly less than 1 (see
Table 9).
Figure 1 shows that none of the roots are outside of the unit circle, indicating that the PVAR model is stable; this also indicates that our variables are stationary [
66].
After the first-order PVAR estimation and its stability check, we performed the Granger causality test [
67], based on the Wald test. The null hypothesis is the absence of Granger causality. The results of the Granger causality test are shown in
Table 10. The presence of endogeneity is confirmed by the blocks of exogeneity analysis (ALL).
For the examined group of countries,
Table 8 shows that a more stringent environmental policy should have a positive direct effect on REC and could be used by policy-makers to stimulate the transition to a renewable-energy economy. Based on the estimations, an increase in EPS would also generate a reduction of both OGCN and CO
2 emissions. The decrease in OGCN, in turn, seems not to generate a positive effect on REC, likely due to its relatively low weight in such economies (higher energy importers). In other words, this result does not necessarily mean that traditional energy sources are not important for the improvement of REC; rather, the effects of those factors are not sufficiently large to influence REC.
An increase in EPS can also produce a decrease in GDPc at first. Therefore, policy-makers should make significant efforts to develop instruments that can synergistically support the environment and market expansion, to further promote the transition to a renewable-energy-based economy. The analysis, however, shows that positive bidirectional casual relationships between GDPc and REC exist for this group of countries. First, an increase in GDPc can generate an increase in the demand for energy, including from renewable sources; second, an increase in the consumption of energy from renewable sources, perhaps generated by policy stringency, can subsequently generate an increase in GDPc. Apergis et al. [
68] have also documented a positive effect of REC on GDPc. This result is the opposite of the finding of Fei et al. [
69], who highlight a negative relationship between REC and GDPc.
Markets may have a significantly positive effect in promoting sustainability and the transition to a renewable-energy economy. This implies that policy-makers should encourage the economy to be renewable-friendly by promoting the renewable energy technology sector. The promotion of the consumption of renewable energy could be very important for guaranteeing market competitiveness and for creating better opportunities for potential investors.
A decrease in CO2 seems to generate an increase in REC. If positive results in the reduction of CO2 emissions are achieved, there will be further improvement in people’s behaviour, thus generating an increase in REC. Hence, to support this, policy measures should also be directed towards promoting public awareness and emphasize the role of REC in achieving a sustainable growth for society. Furthermore, this study shows that there is a dynamic effect (path dependence), demonstrating that the input of REC and GDPc observed in previous periods generate effects on it in the present period. From a political-economy perspective, the results suggest that public awareness as well as the market (competitive) forces should be involved in promoting the transition to a renewable-energy economy. However, an increase in REC could cause a lightening in policy stringency (moreover EPS does not show a path dependence). This means that, to support REC, the political efforts in the social system must be consistently preserved.
Our findings show that, as expected, there is a negative causal relationship between REC and CO2 for the examined group of countries. The results imply that the transition to renewable-energy economies should mitigate the carbon dioxide emissions and their negative consequences in terms of global warming and climate change. In addition, an increase in the consumption of energy from renewable sources should cause a reduction in OGCN and IMP, in this case favouring a substitution effect compared to traditional sources and imported energy.
Finally, this study found that LIFE has a significant direct influence on REC, which in turn positively influences LIFE. This means that individual well-being and public awareness could stimulate a greater demand for energy from renewable sources. Moreover, an increase in REC should in turn favour the improvement of public health. Hence, policy-makers should implement a combination of policy instruments to promote sustainable development within society and public awareness about the essential transition to renewable-energy economies, keeping in mind that those efforts need time and are a dynamic process. Particularly, national governments are called to affect public awareness by working in schools, training institutions, and universities. In this sense, it is reasonable that policy-makers start to implement actions to develop and assess knowledge, skills, and attitudes on climate change and sustainable development, providing supporting materials and facilitating the exchange of good practices.
The variance decomposition and the impulse response functions resulting from the PVAR model are shown below. Particularly,
Table 11 reports the variance decomposition, which allows the assessment of the relative importance of shocks in one variable on fluctuations in other variables over time. The forecast error variance decomposition followed the Cholesky decomposition and were performed using 1000 Monte Carlo simulations for 10 periods. The Cholesky decomposition assumes that series that come earlier in the ordering affect the following variables contemporaneously, as well as with a lag, whereas the series listed successively in the VAR order affect those listed first only through their lags. The variables that appear earlier in the system are thus considered to be more exogenous. The table shows that each variable is mainly influenced by its lag. Unsurprisingly, each variable depends closely on its history.
Table 11 shows that each variable is primarily influenced by its lag (with the exception of OGCN). Specifically, REC is mainly determined by EPS (19.7%) and LIFE (15.7%) on average during a 10-year period, while OGCN is mostly influenced by shocks in EPS (22.4%).
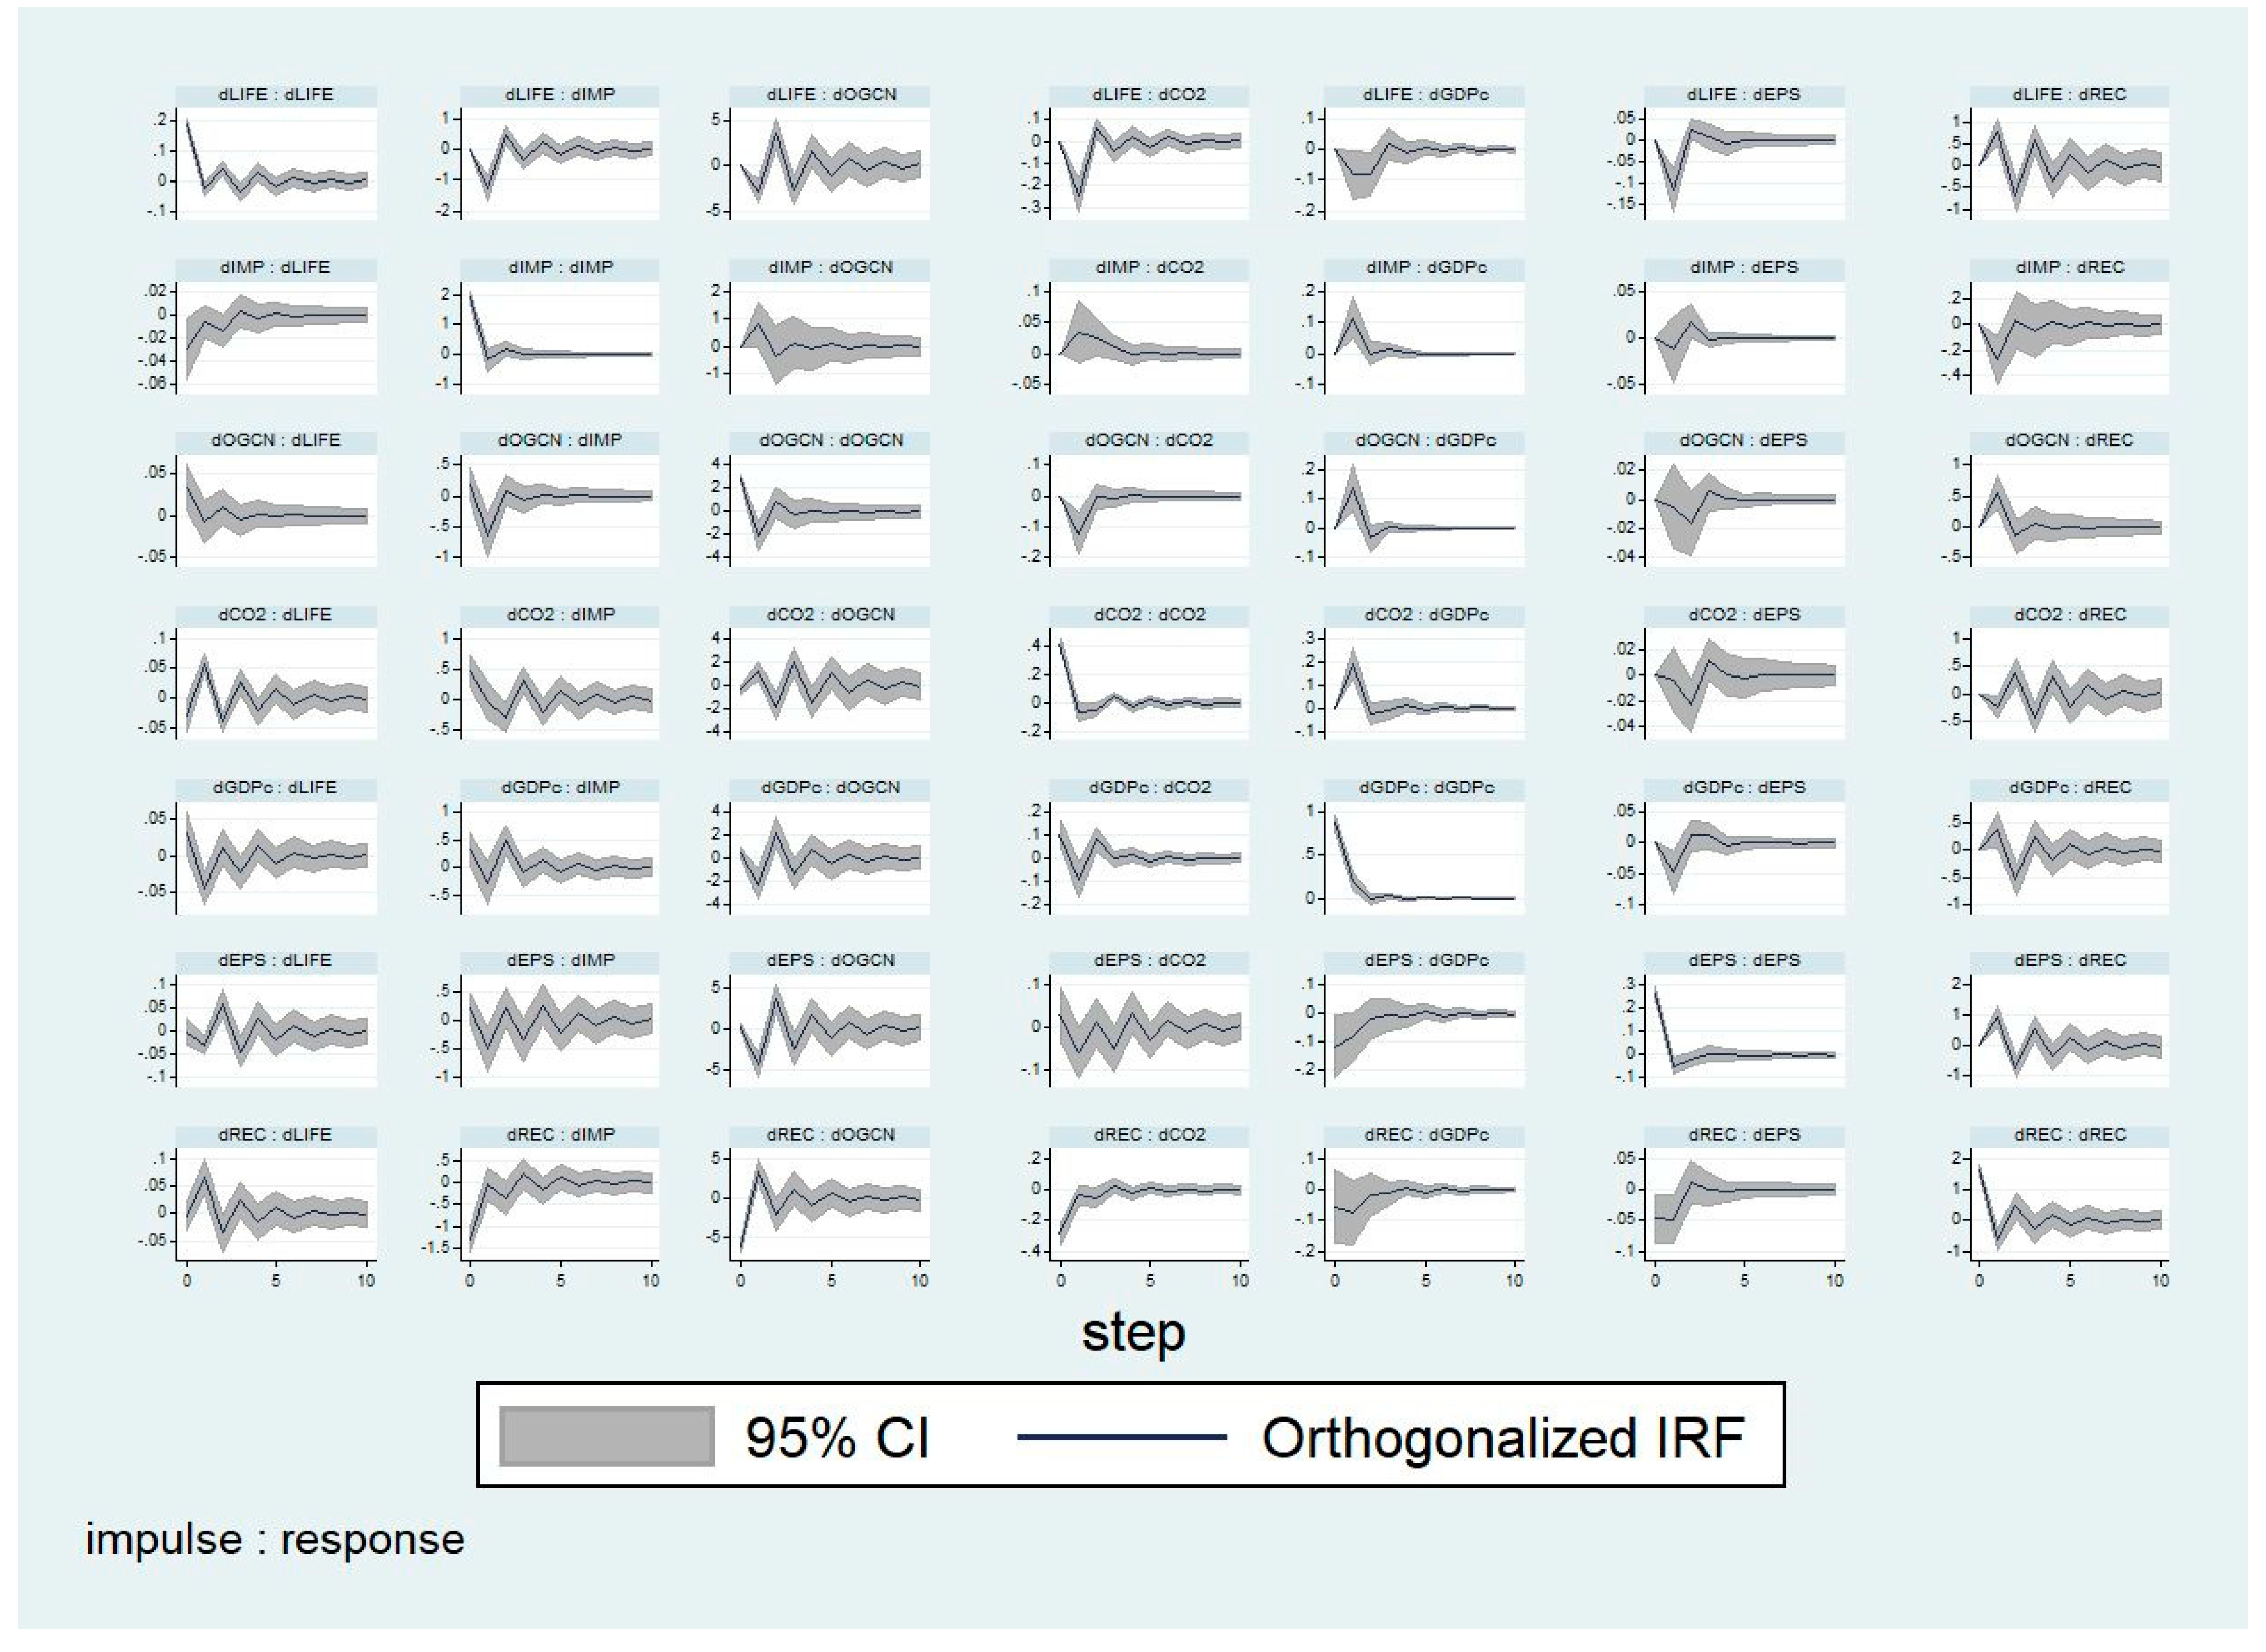
The impulse response functions (
Figure 2) illustrate the reaction of one variable to the shocks in another variable in the system, while holding all other shocks equal to zero (a Gaussian approximation based on a 200 Monte Carlo simulation was used to estimate the impulse response functions, which in this case also followed the Cholesky decomposition).
Specifically, when a positive shock is exerted on EPS in the current stage, REC and OGCN exhibit positive and negative responses during the early periods, respectively.
4. Conclusions
This study investigated the relationship between REC, social factors, and health in a group of 12 European countries selected on the basis of common characteristics, such as being historical members, importers, and among the richest countries in the EU. Since the process of transition to a renewable-energy economy is a dynamic one, we tried to use the longest time span possible, namely using annual data from 1990 to 2015. We used a PVAR technique that combines the traditional VAR approach, which treats all the variables in the system as endogenous, with the panel data approach, which allows to borrow strength from the cross-sectional dimension and focus on bidirectional effects. We can draw the following conclusions from our study.
First, we found that the implementation of a more stringent environmental policy has positive direct effects on REC. On the contrary, a decreasing use of OGCN seems not to generate a positive effect on REC; indeed, since the analyzed countries are high energy importers, this factor is not strong enough.
We also found that a more stringent environmental policy is linked to a reduction of OGCN and, consequently, of CO2 emissions. Since, at least initially, a reduction of per capita GDP is also registered, governments should try to simultaneously support both the environment and market expansion.
Another finding is the existence of a positive bidirectional causal relationship between GDPc and REC. Indeed, at the beginning, an increasing per capita GDP is linked to an increase in the demand for energy in general; then, an increase in REC, maybe generated by a stringent policy, can subsequently generate an increase in per capita GDP. Markets may have a significant positive effect in boosting the transition to a renewable-energy economy. Thus, in order to guarantee their competitiveness and to create better investment opportunities, policy-makers should promote the sector related to renewable energy technology.
We also, predictably, found that lower levels of CO
2 seem to be linked to a higher REC. To this end, policy-makers should promote public awareness of the importance of the role of REC in achieving sustainable growth. Within this framework, the European Commission recently presented the European Green Deal [
12], main goals of which are to stop climate change, cut pollution, and improve the health of population through an efficient use of resources.
Furthermore, we found a path dependence between REC and GDPc, since the input of REC and GDPc observed in previous periods generate effects on it in the present period. This highlights that, to boost the transition to a renewable-energy economy, it is necessary to involve both public awareness and market forces.
A higher REC could lead to a less need for a stringent policy. Furthermore, since EPS does not show a path dependence, constant political efforts should be made to support REC.
As expected, the result demonstrated the existence of a negative causal relationship between REC and CO2. The transition to clean economies should reduce CO2 levels and, consequently, global warming and climate change. Moreover, an increasing REC should be linked with a reduction in OGCN and IMP.
Finally, another important finding is that LIFE has a significant direct influence on REC, which in turn positively influences it. This means that individual well-being and public awareness could generate a greater demand for renewable energy.
Moreover, an increased REC should in turn improve public health, and is expected to generate significant implications on the macroeconomic environment, too, influencing the employment rate and overall economic development [
70]. Society is increasingly demanding environment-friendly businesses. The development of regulations, by imposing sustainable criteria, could limit the discretion of companies in order to protect the environment and the cycle of waste [
71,
72,
73], water [
74], and emissions [
10,
75].
The novelty of our work lies in the fact that the literature on this topic is quite limited and the methodology adopted is rather new. Furthermore, the results on the relationship between renewable energy consumption and health are very interesting.
It may be argued that life expectancy is a poor variable to synthesize health, and that it is a long-term proxy, but there is no availability of a sufficiently long series associated with health.
Since the model could be extended to other clusters, this kind of analysis has a great potential for policy-makers. In addition, they are expected to gain from the resulting empirical findings [
76]. Hence, they should promote sustainable development and public awareness about the essential transition to renewable-energy economies, not forgetting that those efforts need time and are a dynamic process.
Particularly, governments should raise public awareness by implementing informative campaigns in schools, training institutions, and universities, providing supporting materials to develop and assess knowledge, skills, and attitudes on climate change and sustainable development.


