Article

Assessing the Effectiveness of Using Recharge Wells for Controlling the Saltwater Intrusion in Unconfined Coastal Aquifers with Sloping Beds: Numerical Study

by
Asaad M. Armanuos
1,
Nadhir Al-Ansari
2 and
Zaher Mundher Yaseen
3,*
1
Irrigation and Hydraulics Engineering Department, Civil Engineering Department, Faculty of Engineering, Tanta University, 31512 Tanta, Egypt
2
Civil, Environmental and Natural Resources Engineering, Lulea University of Technology, 97187 Lulea, Sweden
3
Sustainable Developments in Civil Engineering Research Group, Faculty of Civil Engineering, Ton Duc Thang University, Ho Chi Minh City, Vietnam
*
Author to whom correspondence should be addressed.
Sustainability 2020, 12(7), 2685; https://doi.org/10.3390/su12072685
Submission received: 17 February 2020 / Revised: 26 March 2020 / Accepted: 27 March 2020 / Published: 29 March 2020

Abstract

:
Groundwater systems are considered major freshwater sources for many coastal aquifers worldwide. Seawater intrusion (SWI) inland into freshwater coastal aquifers is a common environmental problem that causes deterioration of the groundwater quality. This research investigates the effectiveness of using an injection through a well to mitigate the SWI in sloping beds of unconfined coastal aquifers. The interface was simulated using SEAWAT code. The repulsion ratios due to the length of the SWI wedge (RL) and the area of the saltwater wedge (RA) were computed. A sensitivity analysis was conducted to recognize the change in the confining layer bed slope (horizontal, positive, and negative) and hydraulic parameters of the value of the SWI repulsion ratio. Injection at the toe itself achieved higher repulsion ratios. RL and RA declined if the injection point was located remotely and higher than the toe of the seawater wedge. Installation at the toe achieved a higher RL in positive sloping followed by horizontal and negative slopes. Moreover, the highest value of RA could be reached by injecting at the toe itself with a horizontal bed aquifer, followed by negative and positive slopes. The recharge well is confirmed as one of the most effective applications for the mitigation of SWI in sloping bed aquifers. The Akrotiri case study shows that the proposed recharging water method has a significant impact on controlling SWI and declines in both SWI wedge length and area.

1. Introduction

Seawater intrusion (SWI) is counted as a significant environmental problem, as about 80% of the world’s population exists in coastal areas and depends on regional aquifers for their freshwater [1,2]. Groundwater systems in coastal regions are under threat from SWI. The abstraction of groundwater, climate change drivers, the rise in sea levels, and changes in land use are the main parameters that cause changes in the condition of coastal aquifers and, as a result, the SWI [3]. Coastal aquifers across the world are considered very vulnerable to the SWI problem [4]. The sea level rise accelerates the extent of the SWI in these aquifers. Published reports from the Intergovernmental Panel on Climate Change (IPCC) confirmed that by the end of the current century, the rise in sea level will be in the range of 0.52 to 0.98 m [5]. Different strategies were suggested by [6,7,8] to control or prevent SWI in the coastal aquifers. These approaches may be summarized into: (1) minimization of abstraction from groundwater [9,10], (2) artificial recharge wells and artificial recharge through spreading basins [11], (3) regional injecting of freshwater in the coastal zone to maintain the volume of freshwater storage [12,13,14], (4) saltwater abstraction along the coastal zone [15], (5) artificial barriers construction [16,17,18], (6) optimum abstraction [19,20,21,22], (7) combination techniques [14,23,24], and (8) land reclamation. The following define different techniques to mitigate and prevent SWI in the coastal aquifers. Guymon (1980) introduced the approach of using freshwater injection through groundwater wells to control and prevent SWI in coastal aquifers [25]. Bruington and Seares (1965) presented the impact of using a well recharge facility to control the extent of SWI in Los Angeles County, California [26]. Hunt (1985) developed a steady-state solution for the location of the freshwater–saltwater wedge interface dependent on the implementation of one system of single or multiple freshwater recharge wells in the case of confined and unconfined aquifers [27]. As a result of the increased practical efficiency and functionality, the prevention and control of SWI by using underground hydraulic barriers has attracted more publicity than the design of the physical barriers for groundwater engineering interference [28,29]. The major common types of underground hydraulic barriers implicate the artificial barrier (freshwater barrier), abstraction of saline or brackish water along the coastal areas (abstraction saltwater barrier), or a combination of the two approaches [30]. Using freshwater recharge and abstraction barriers is considered the most efficient method of mixed barriers [23,31]. Luyun et al. (2011) implemented experimental tests and SEAWAT simulations to investigate the impact of the position and applicability of recharge wells to control SWI in unconfined aquifers [11]. The results indicated that the most effective SWI repulsion ratio can be achieved in the case of installation of the recharge wells and injection of the freshwater at the SWI wedge toe. Allow (2012) used SEAWAT code to build a three-dimensional finite difference model of the Damsarkho aquifer, Syria [32]. The results of the simulation confirmed that using freshwater injecting wells or an underground flow barrier would both introduce an effective approach to control and prevent SWI in the Damsarkho aquifer. Armanuos et al. (2019) investigated the effectiveness of two combination techniques to control and retreat the saltwater intrusion through experimental and numerical study [14]. A sandbox model was implemented to study the effect of freshwater injection through a well after embedment of a barrier wall, in addition to the embedment of the barrier wall after injection of freshwater through a well, as well as two-combination methods. The results confirmed that the combination techniques achieved exceptional repulsion of SWI using the barrier wall or the recharge well as separate methods. Motallebian et al. (2019) presented an additional approach for controlling SWI in coastal aquifers using a recharge system canal [33]. The results confirmed that using the recharge canals achieves a reduction in the extent of the SWI. The highest repulsion ratio that can be achieved in the case of the recharge canal is near to the SWI wedge toe. Lu et al. (2016) developed an analytical solution based on the approximation of Dupuit–Forchheimer to describe the SWI in sloped confined and unconfined coastal aquifers [34]. The results revealed that the SWI interface is determined in respect of the geometric properties of the bottom confining layer.
As mentioned above, previous research did not consider the effectiveness of using recharge wells in sloping unconfined coastal aquifers and considered only unconfined aquifers with horizontal bed slopes, whereas the majority of coastal aquifers have a bottom confining layer with a sloping bed. The main objectives of this research were to study the impact of using a recharge well on controlling the SWI in sloping unconfined coastal aquifers. The Section 2 of this manuscript shows the description of the numerical simulation procedures, the numerical simulation aspect of the current research, including the different parameters used in the simulation. The Section 3 deals with the study on the impact of recharge well on controlling SWI. The model results and analyses for the sensitivity of each hydraulic parameter on controlling SWI in sloping unconfined coastal aquifers using a recharge well are also presented. In addition, this section presents the numerical application of using a recharge well to control SWI in the Akrotiri coastal aquifer, Cyprus. Finally, the conclusions are presented, which summarizes the main contributions of this research. Some future research works related to the numerical aspects of this study and on-field investigation are then recommended.

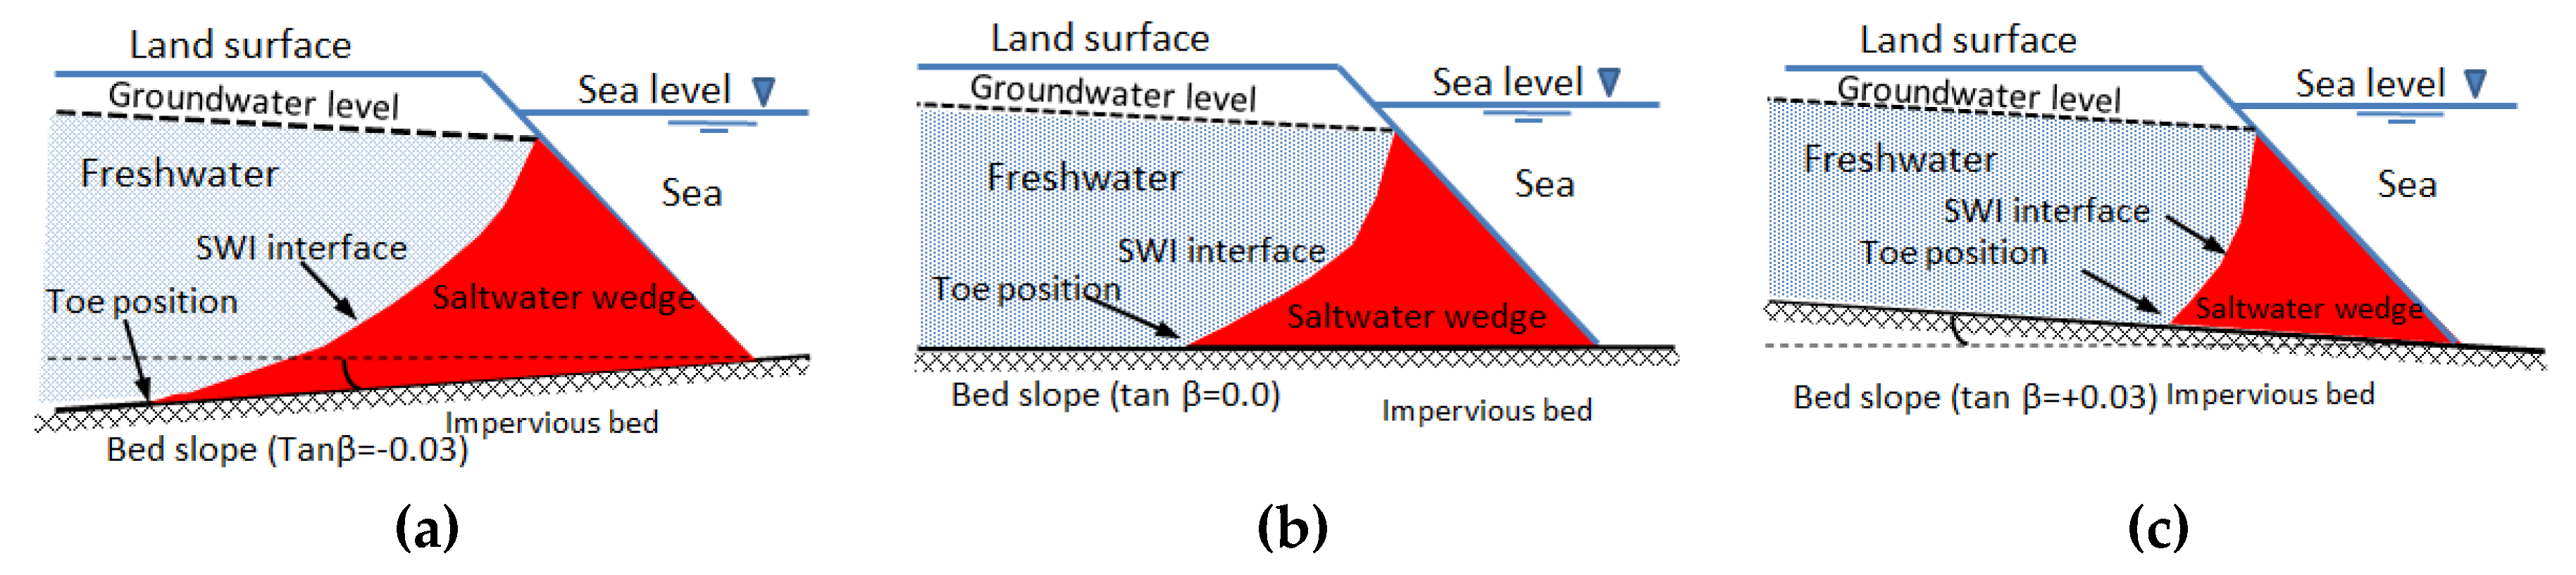
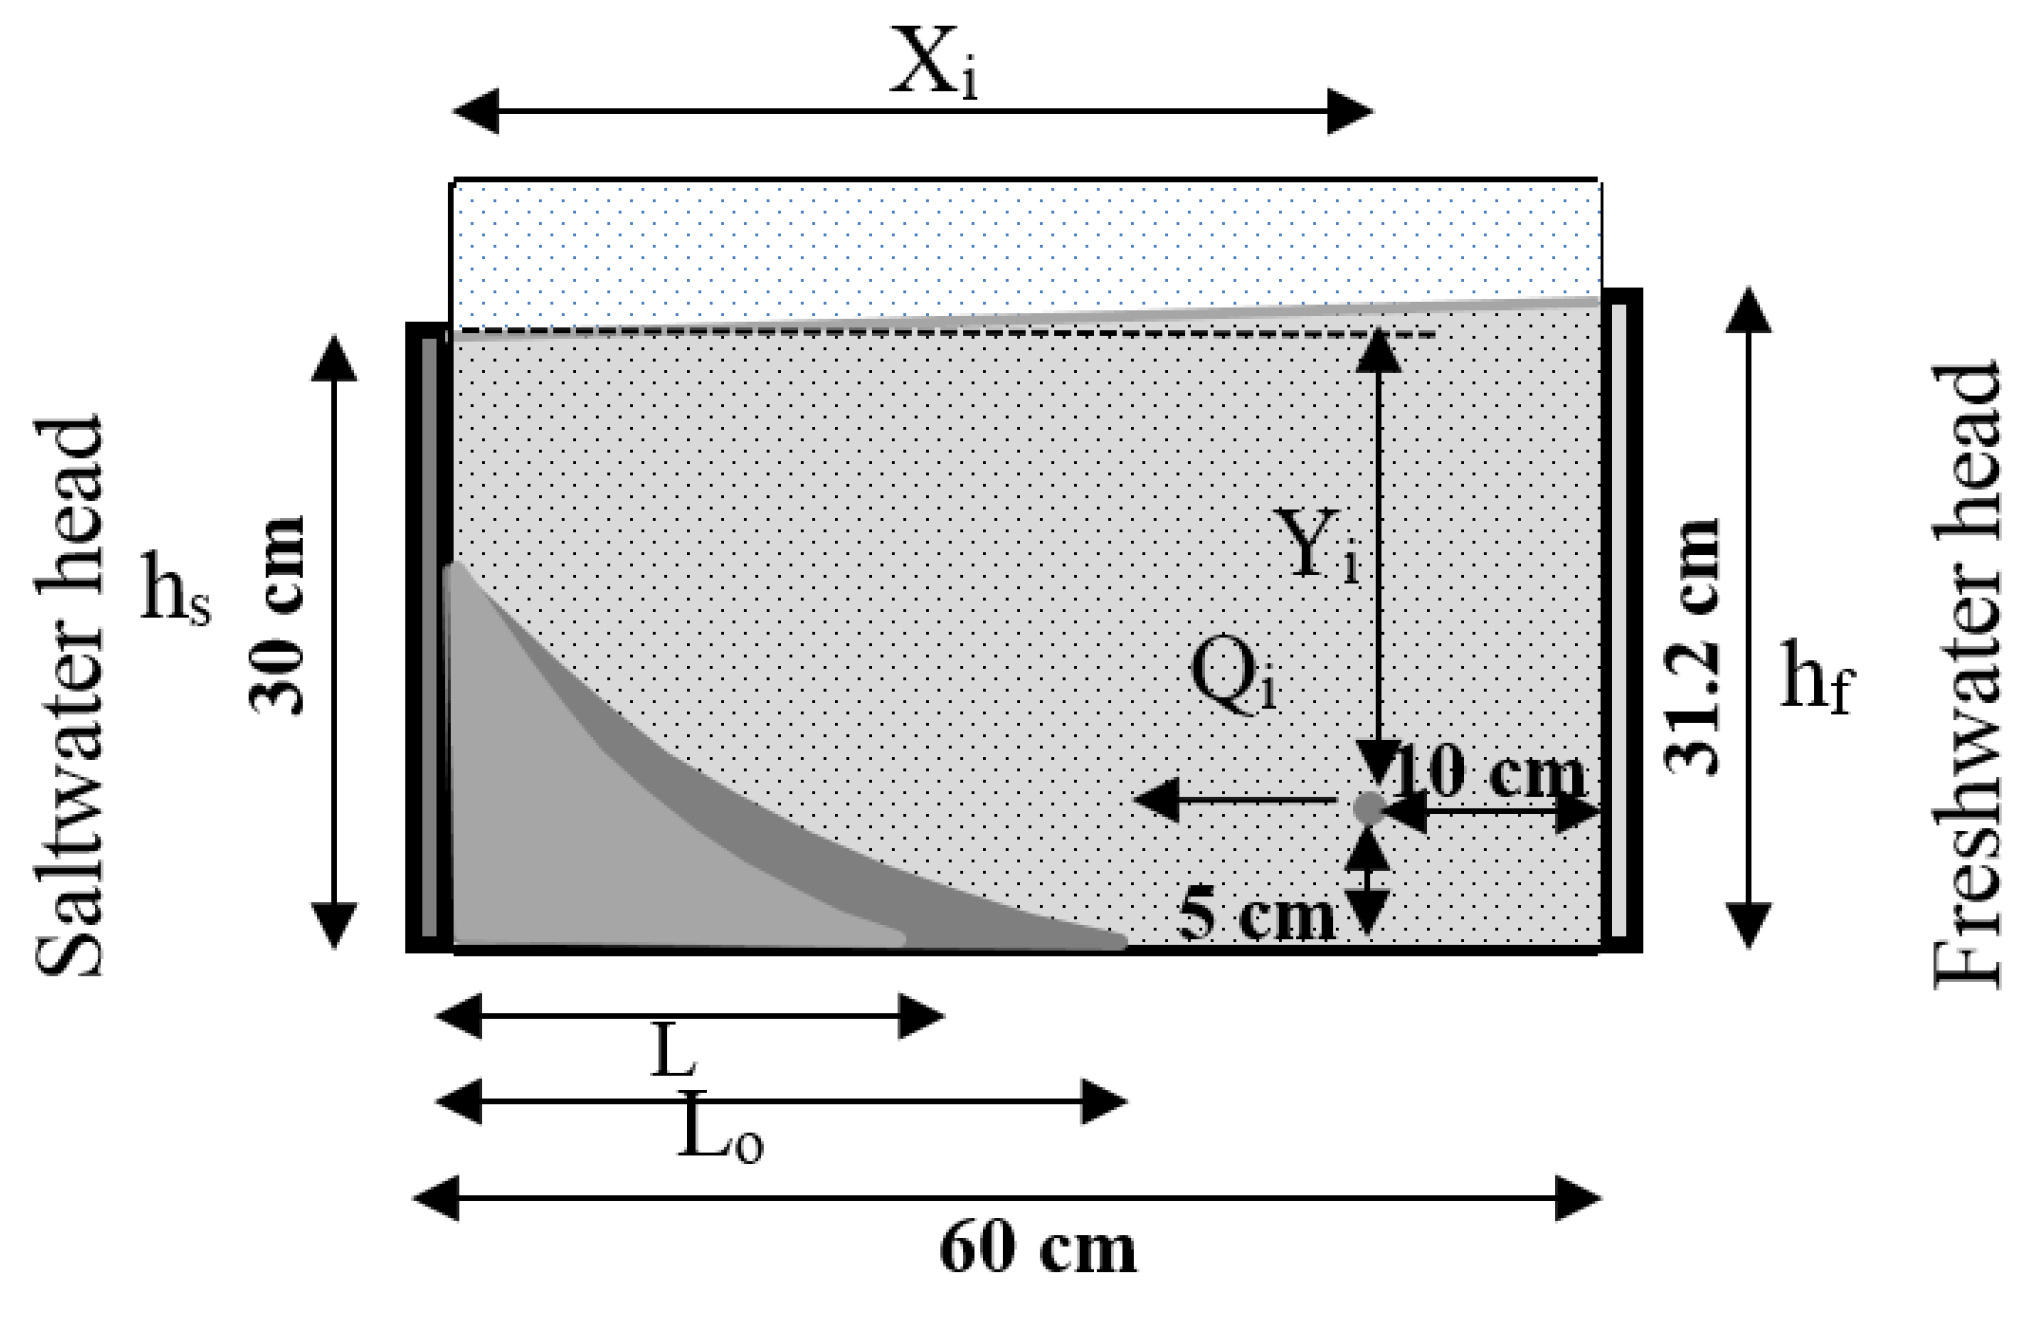
2. Materials and Methods

The SEAWAT code has been extensively implemented for the simulation of SWI (e.g., [11,14,16,33,35]). The finite difference SEAWAT code was used by Guo and Langevin (2002) to simulate the impact of using a recharge well to prevent and control the SWI in sloping unconfined coastal aquifers [36]. Figure 1 shows a conceptual model for SWI in a sloping unconfined aquifer. SEAWAT is a program that associates both MODFLOW and MT3DMS. The code is applied to solve the coupled equations of groundwater flow and the contaminant transport. SEAWAT applies variable density groundwater flow calculations. SEAWAT is commonly used for solving different experimental problems, for example [37,38]. In this study, the dimensions of the experimental unconfined aquifer used by [11] were used to explore the impact of using a recharge well to control SWI in a sloping bed unconfined coastal aquifer. The dimensions of the built model domain were 60 cm in the horizontal and 35 cm in the vertical coordinates, as displayed in Figure 2. The cell dimensions were set at Δx =Δy = 0.50 cm. For all simulation cases, the dispersivity in the longitudinal and transverse directions were set to be equal to 1 and 0.1 mm, respectively, whereas three bed slopes (tan β) were considered: 0.0 (horizontal), 0.03 (positive sloping), and −0.03 (negative sloping). The saltwater head (hs) was adjusted to be equal to 30.0 cm, and the freshwater head (hf) was adjusted in a range from 30.80 to 31.30 cm with an interval of 0.10 cm. The freshwater and saltwater densities of the freshwater and the seawater boundaries were adjusted to 1000 and 1025 kg/m3, respectively, with freshwater and saltwater concentration equal to 0.0 and 35,000 mg/L, respectively. The initial aquifer medium concentration was adjusted to 0.0 mg/L. The hydraulic conductivity value for the unconfined aquifer was 1.31 cm/s in x, y, and z directions as the aquifer was supposed to be homogenous and isotropic. The porosity value was 0.40. The definitions of problem parameters are presented in Table A1, and the input parameters of numerical simulations are introduced in Table A2. The SEAWAT model was run for two periods, firstly steady state and secondly for transient state. Injection through a recharge well was applied after steady state of the SWI wedge was reached. Firstly, the model was run for two experimental tests by [11] for steady-state condition and injection of freshwater at the rate Qi/Q = 0.2. The SEAWAT model was calibrated by comparing the experimental saltwater wedge with the numerical one. The simulation of SWI using the recharge well as a countermeasure was repeated for different positions of injection points located outside the SWI wedge in order to detect the position of the maximum repulsion ratio. The simulation was repeated for different ratios of injection rates in order to attain the maximum repulsion ratio value. The repulsion ratio of SWI was calculated in respect of two reference values, the length of the SWI wedge and the area of the SWI wedge. A sensitivity analysis was performed through groups of simulations in order to study the effectiveness of variations of sloping bed, location of injection well, saltwater density, hydraulic conductivity, and hydraulic gradient on the achieved repulsion ratio, as shown in Table A3.

3. Results and Discussion

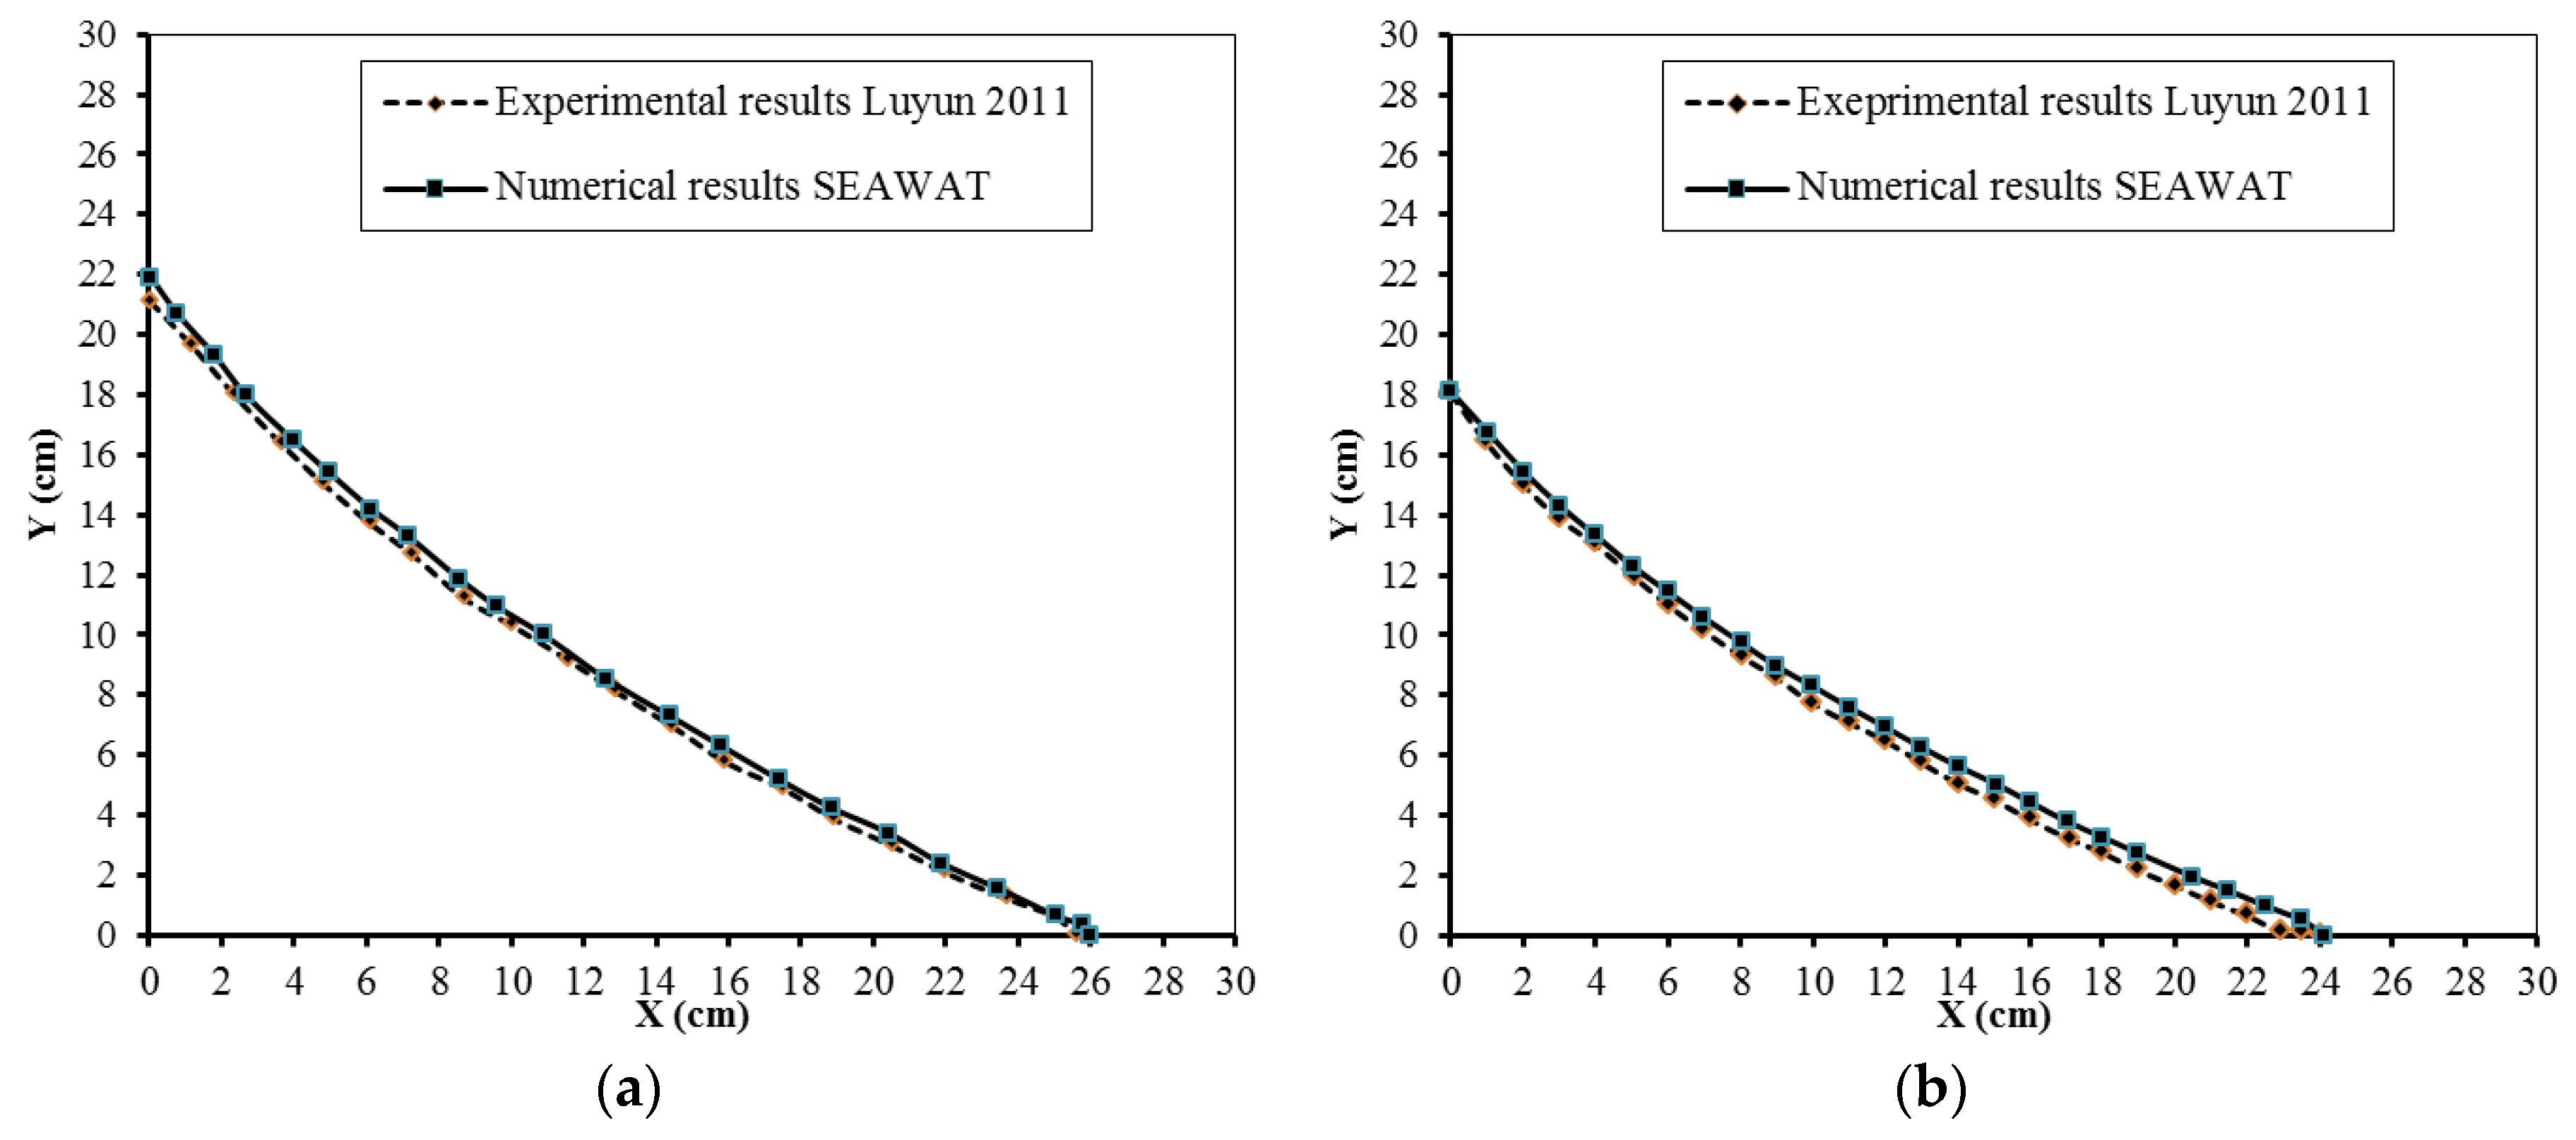
3.1. Model Calibration

Figure 3 displays the comparison between the experimental results of saltwater intrusion by [11] with the numerical one by SEAWAT model. The comparison confirmed a good agreement between the two results. In the steady state, the saltwater wedge length was equal to 25.5 and 26 cm for experimental and numerical results, respectively, with difference=0.50 cm. Moreover, in regard to Qi/Q = 0.2, it was equal to 23.9 and 24.10 cm for experimental and numerical results, respectively, with a difference of 0.20 cm. The injection points were distributed and separated by 10 cm in both horizontal and vertical directions. The injection points were distributed in the vicinity of the SWI toe; one point was at the toe position, five points were to its left, and nine points were located to the right from the toe position, and the total number of tested injection points was 15 points. At each point, the achieved repulsion ratio R was computed according to the SWI wedge length and SWI wedge area. Surfer software was used to interpolate the repulsion ratio contour lines with equal repulsion values.

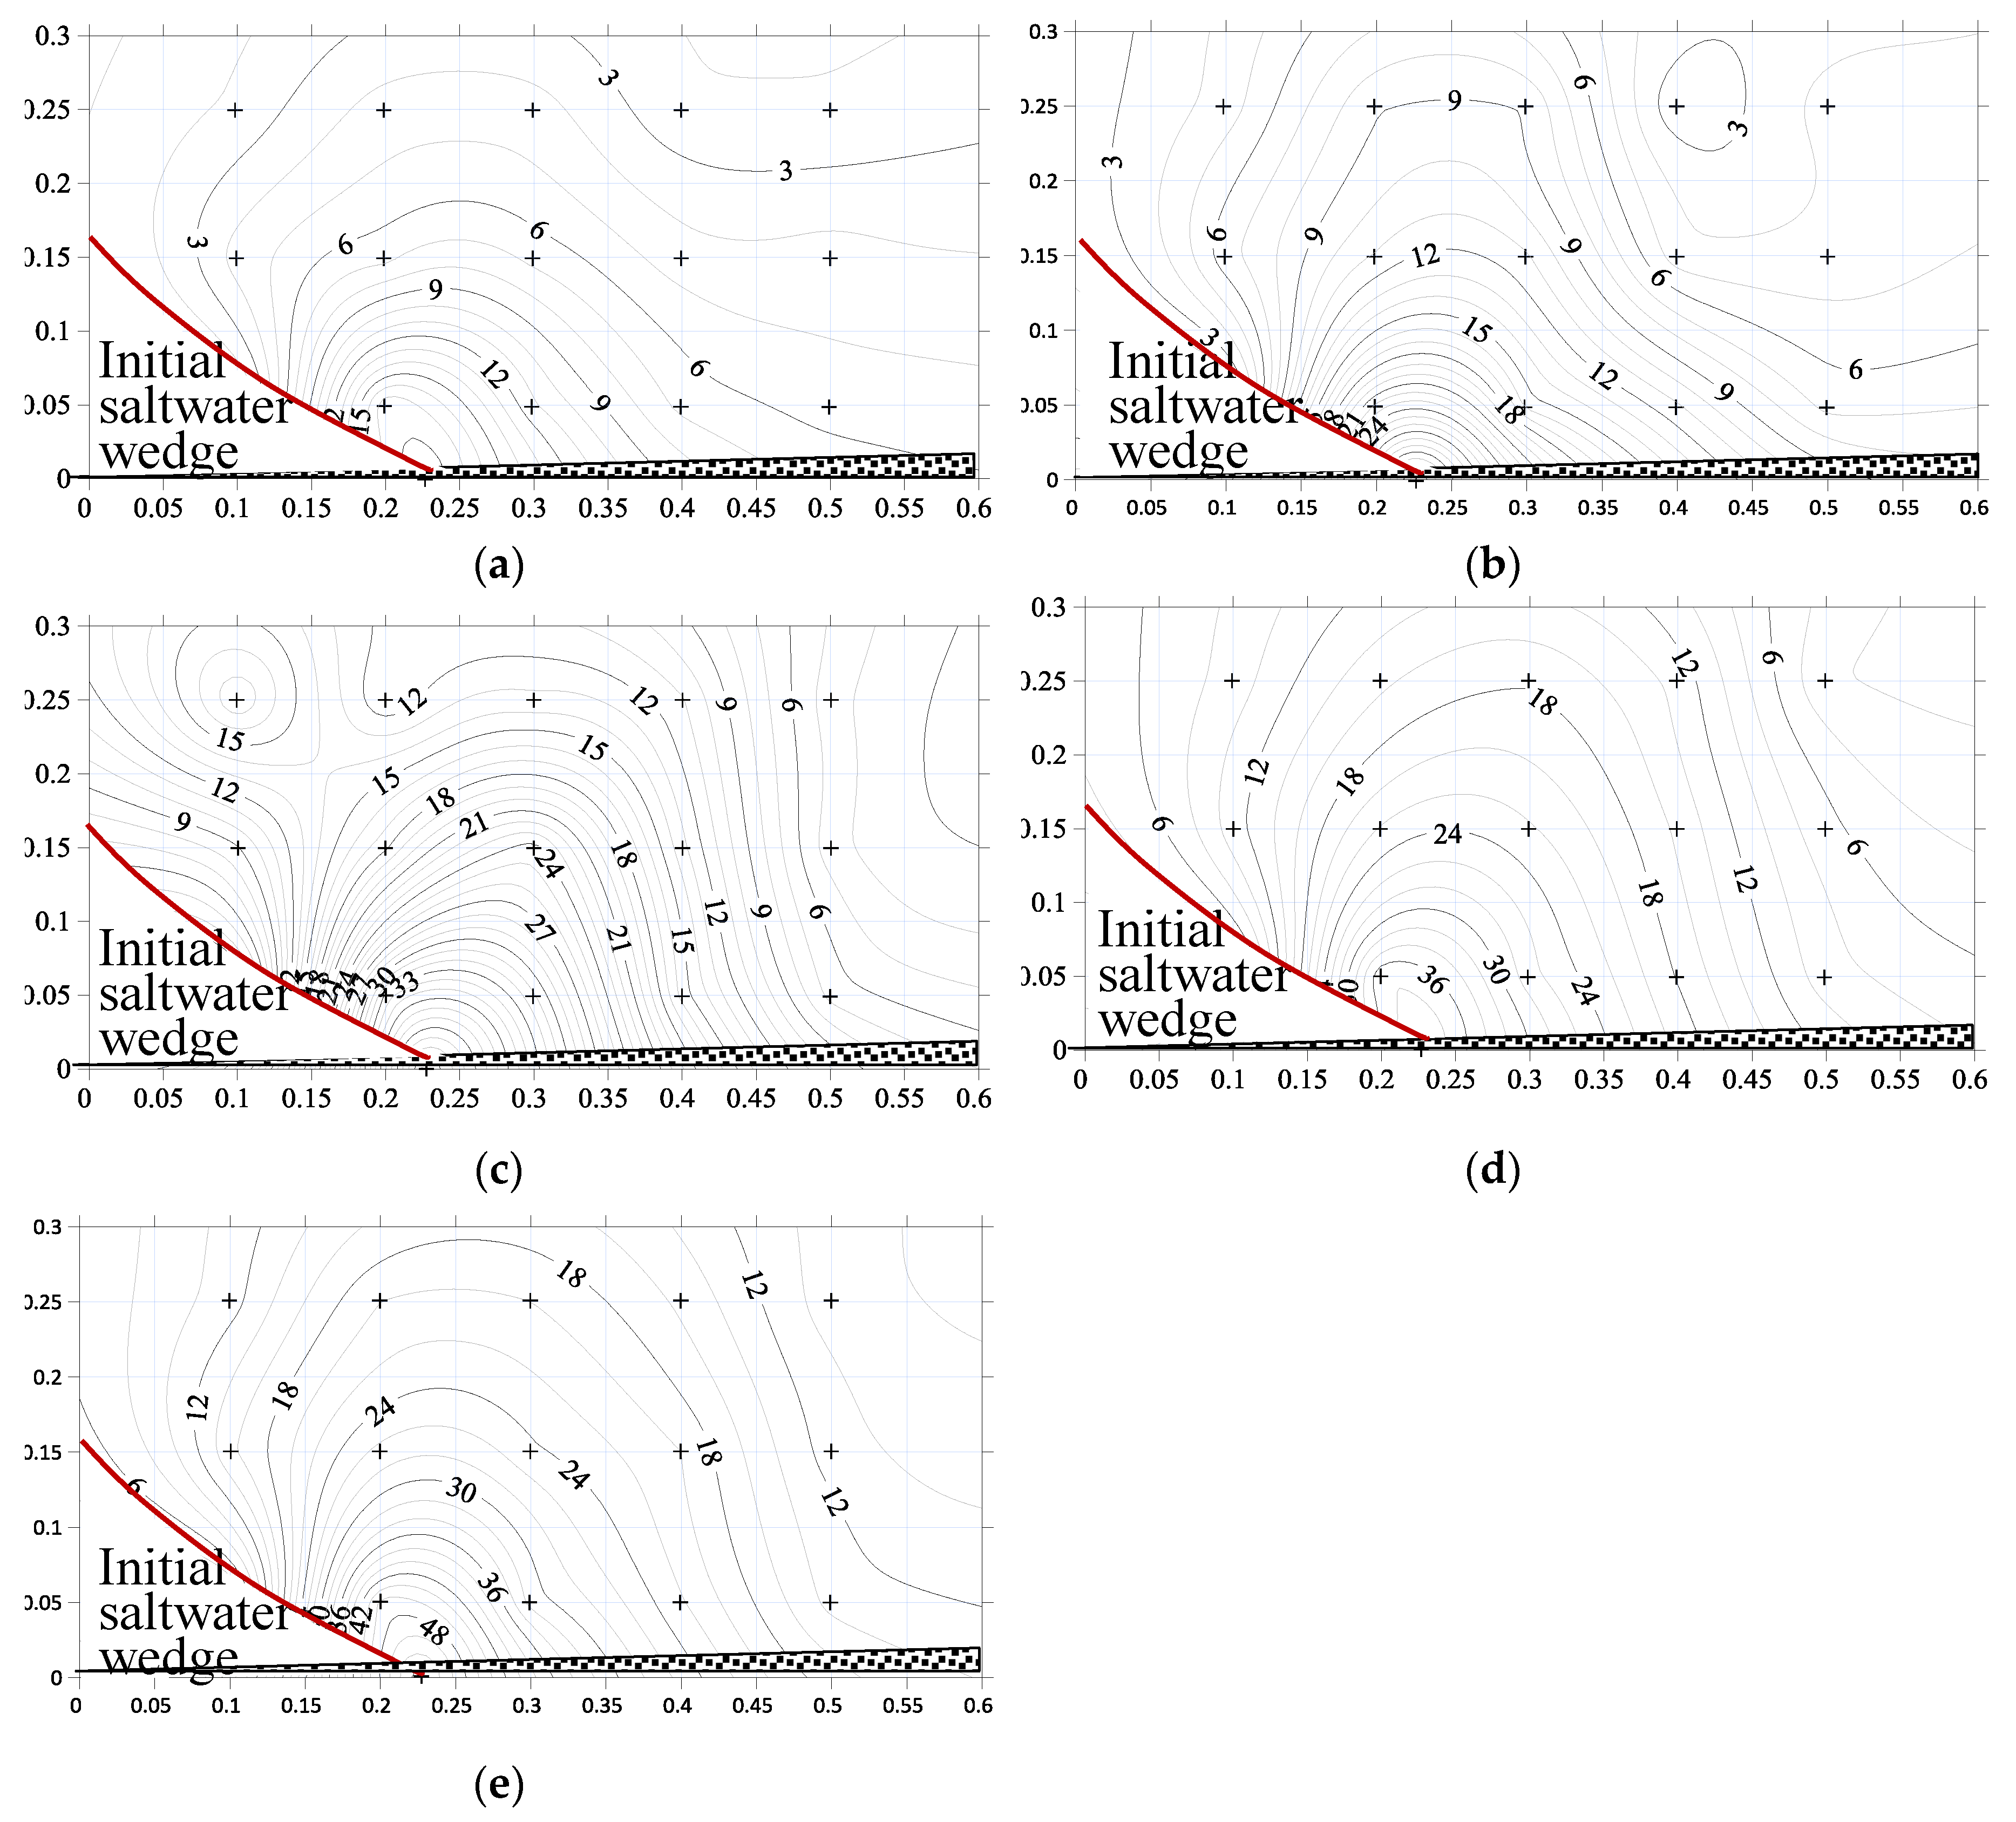
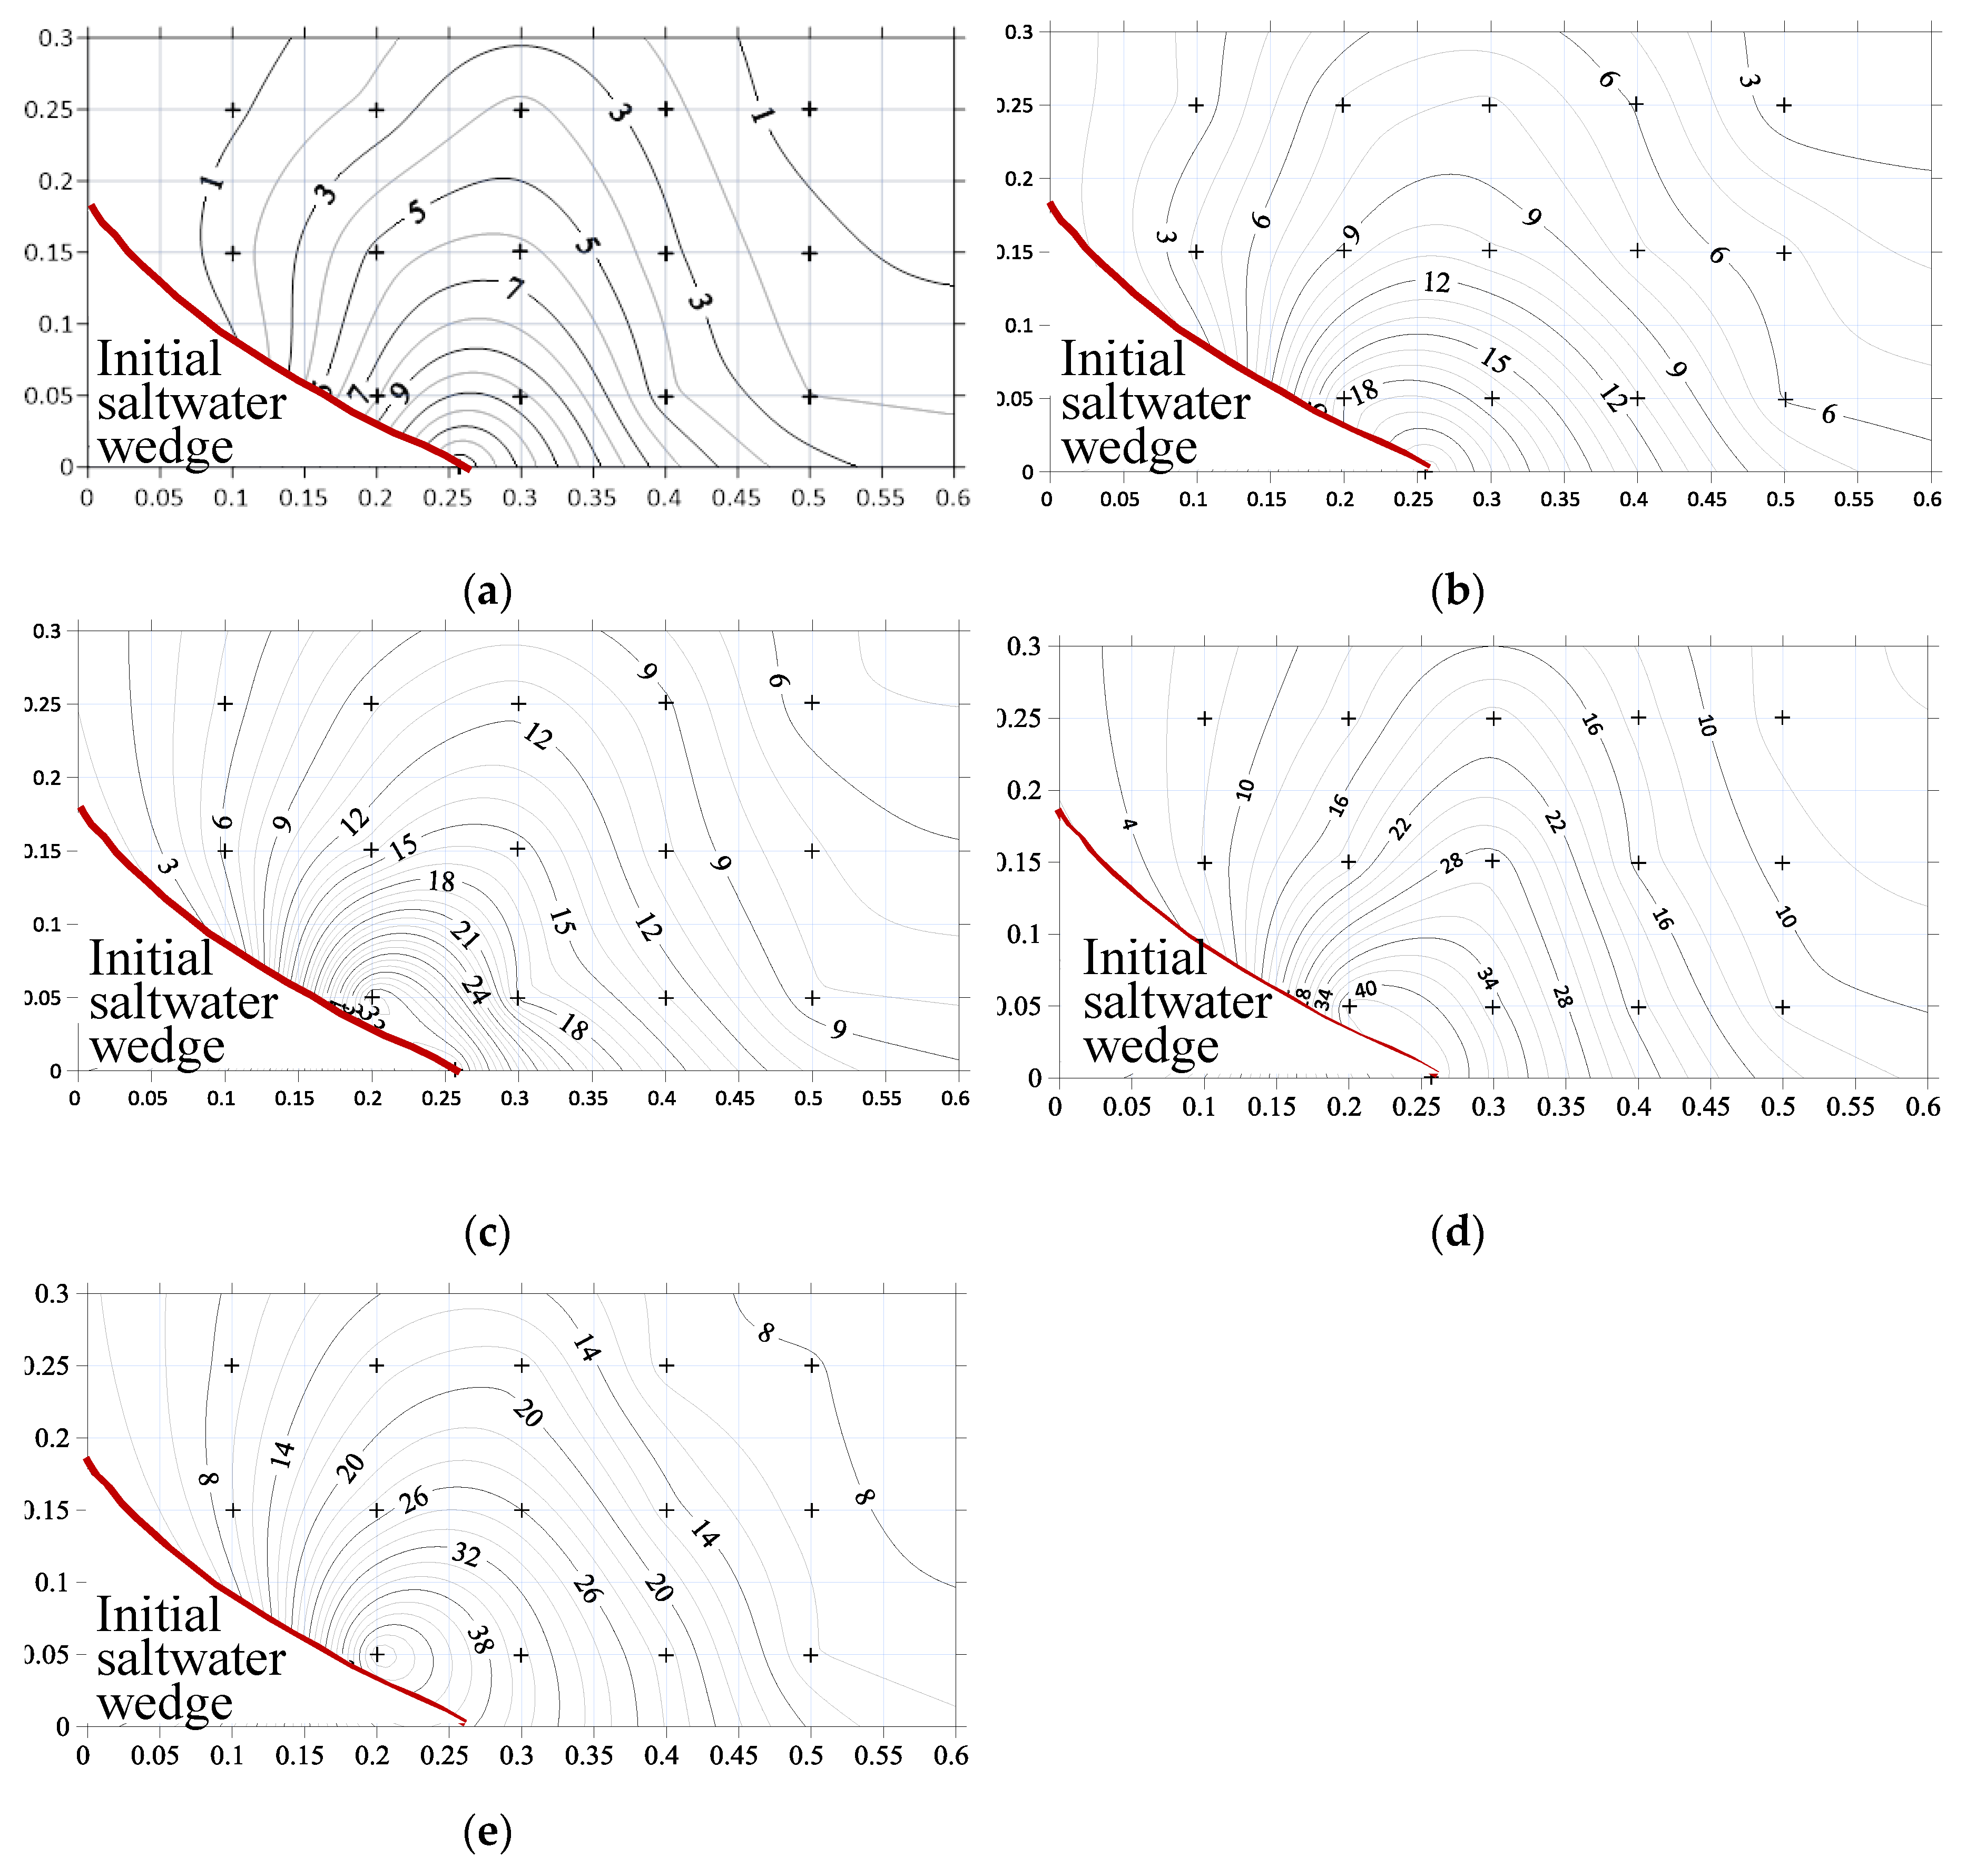
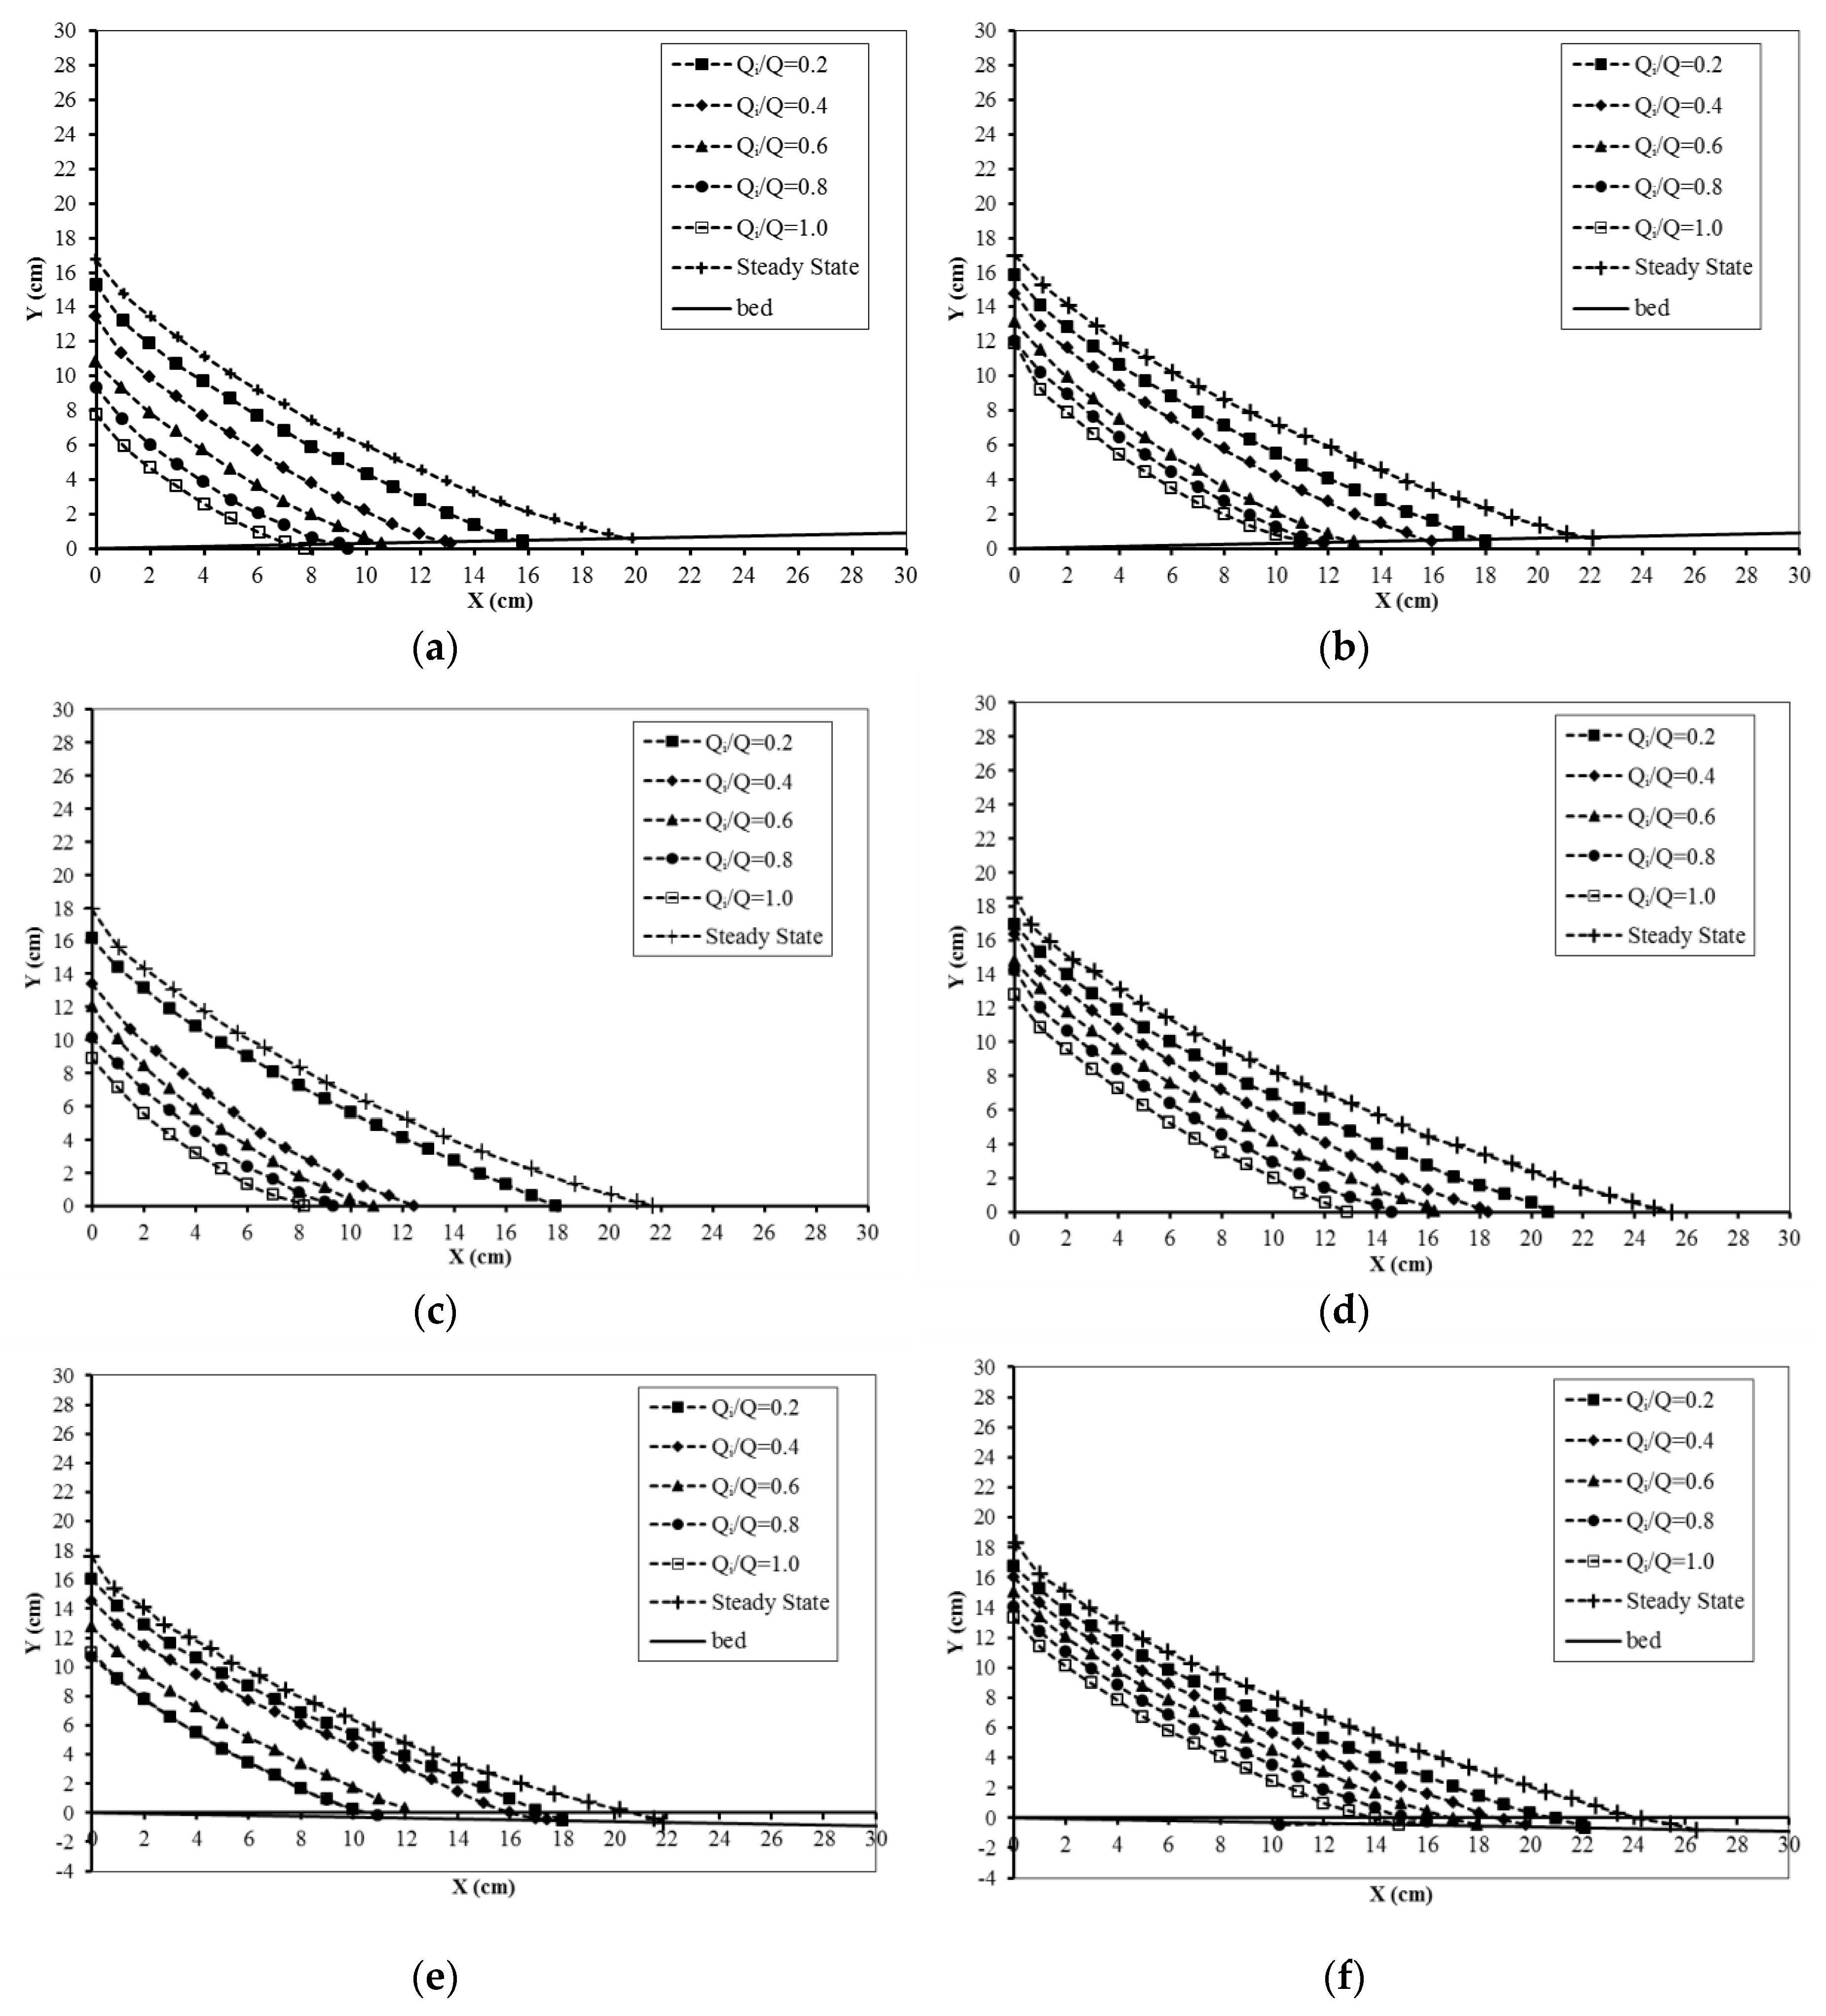
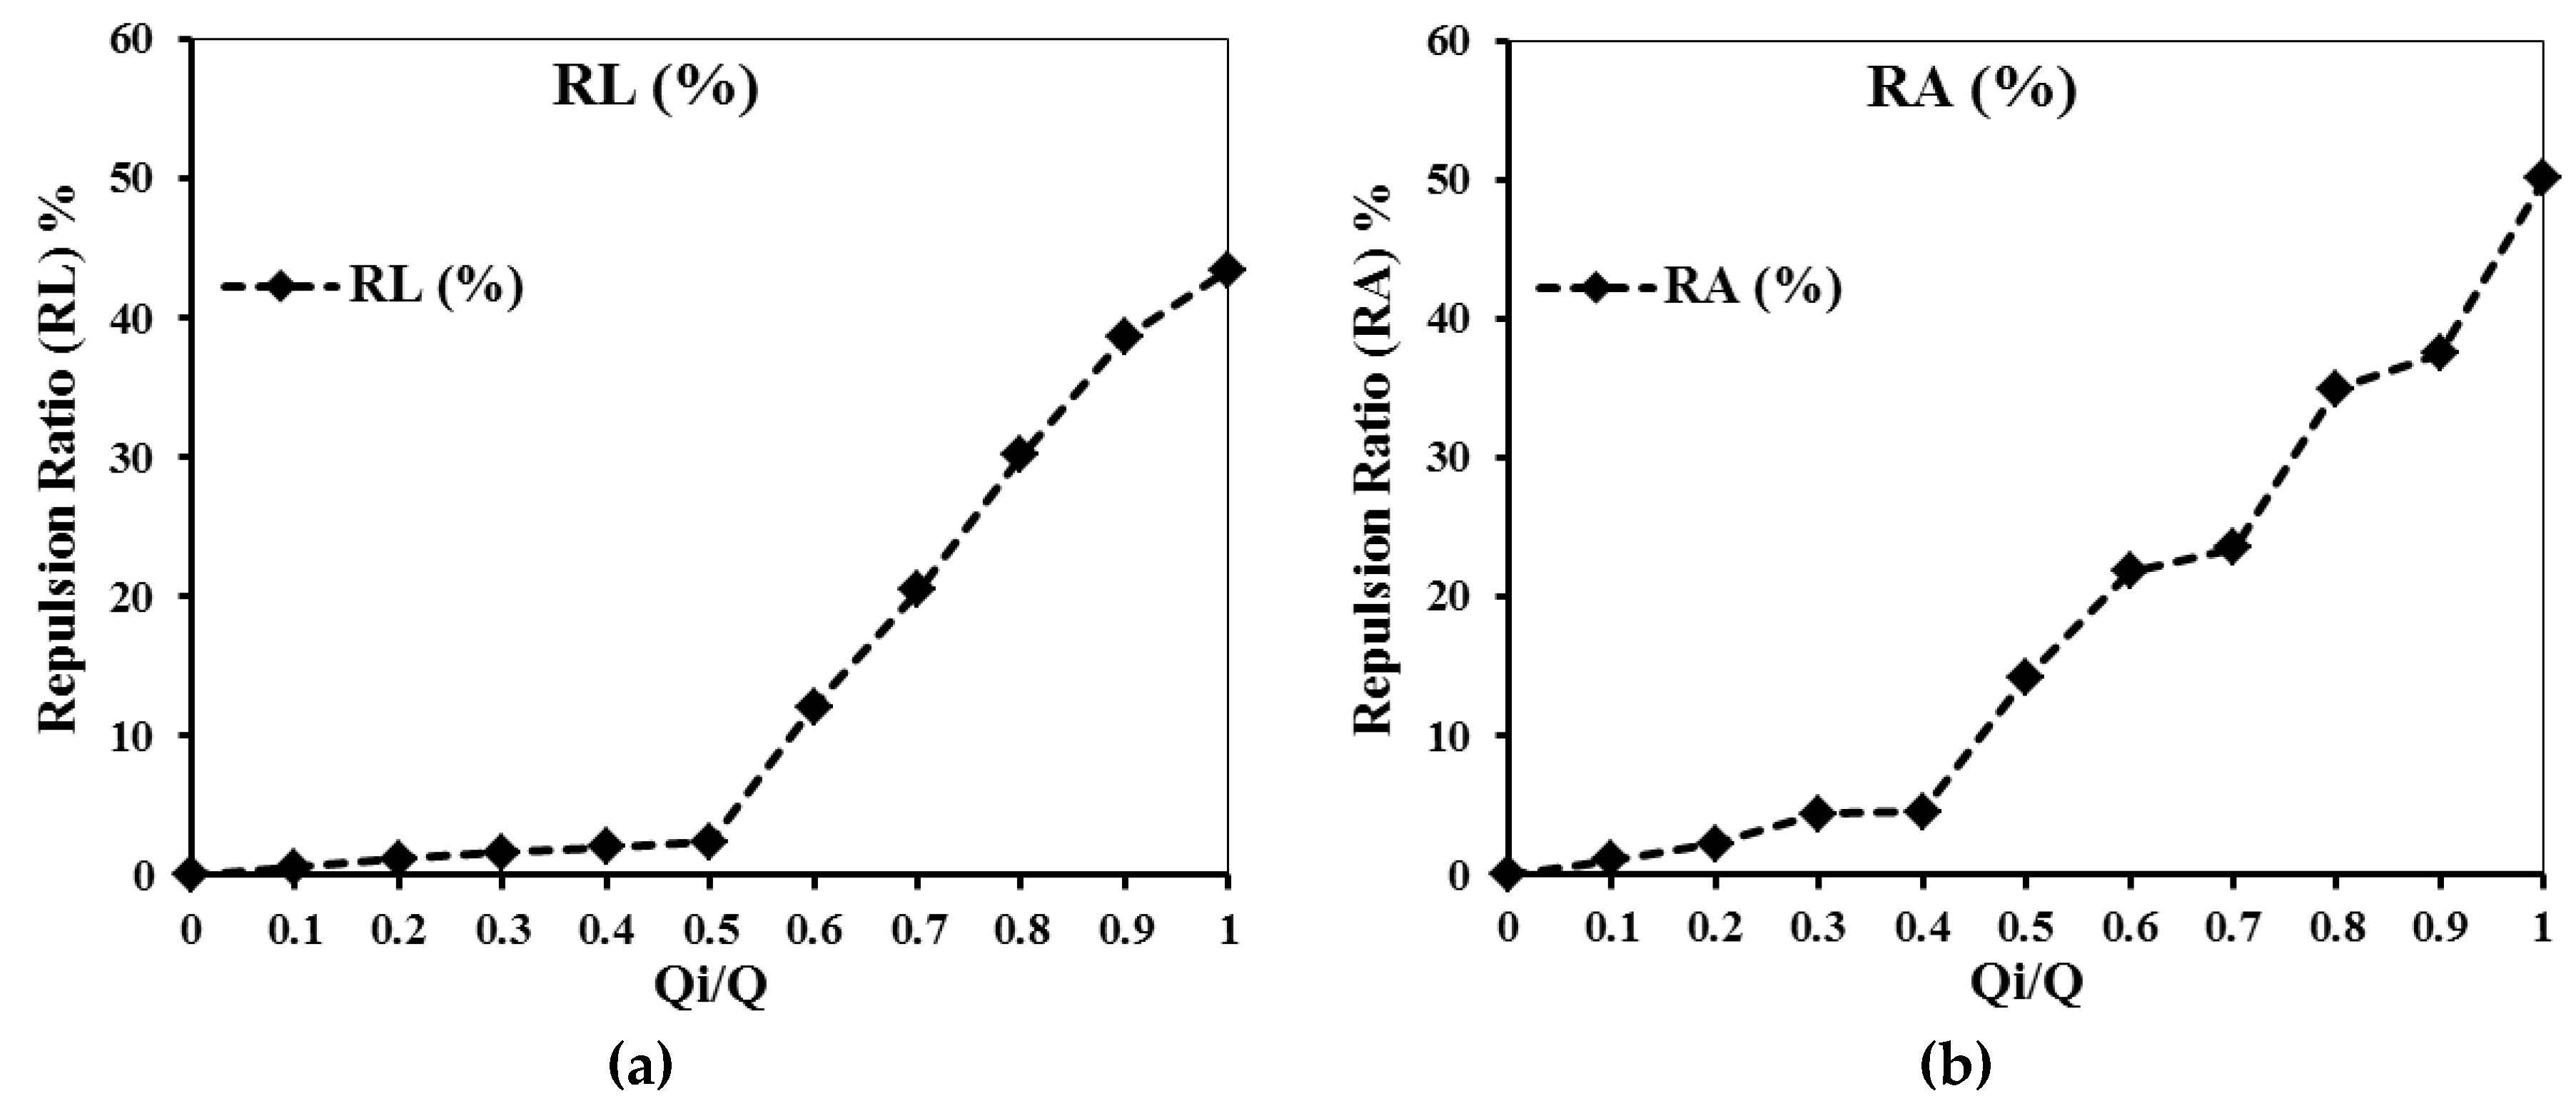
3.2. Effectiveness of Slope, Location, and Injection Rate on Repulsion Ratio in Regard to SWI Wedge Length (RL)

Figure 4, Figure 5, and Figure 6 show the tested locations of freshwater injection points in regard to the steady-state initial SWI wedge for different three bed slopes (tan β = 0.0, 0.03, and −0.03), respectively. Five injection ratio rates (Qi/Q) were tested: 10%, 20%, 30%, 40%, and 50%. Cross marks indicate the injection point locations. The results confirmed that the maximum repulsion ratio in regard to the SWI wedge length could be achieved by injecting freshwater at the toe position for the horizontal, negative, and positive sloping beds. Injecting the freshwater at the toe itself introduced a hydraulic barrier originating from the aquifer bottom that forced the saltwater to retreat. In respect of the aquifer sloping bed, injection of freshwater at toe position achieved the highest RL in the positive slope, followed by the horizontal and negative slope. The value of RL increased with the increase of the rate of injecting freshwater where the presented flow forced the saltwater to attenuate back to the saltwater side. The maximum values of RL were equal to 18.9%, 34.6%, 40%, 43.4%, and 55.1% with Qi/Q of 10%, 20%, 30%, 40%, and 50%, respectively, in the positive case, whereas it was equal to 16%, 23.8%, 35.5%, 43.8%, and 502% in the horizontal bed and finally equal to 16.4%, 26.4%, 39.1%, 41.8%, and 43.6% in the negative case. Injecting freshwater just above the toe position and to the left at y = 5 cm and x = 20 cm achieved a slightly lower repulsion ratio compared with toe position, whereas the injection points in the right of SWI toe at y = 5 cm and x = 30 cm achieved lower R than at the toe itself and to the left. The achieved repulsion ratio decreased when the injecting point was located farther from or higher than the SWI toe position.

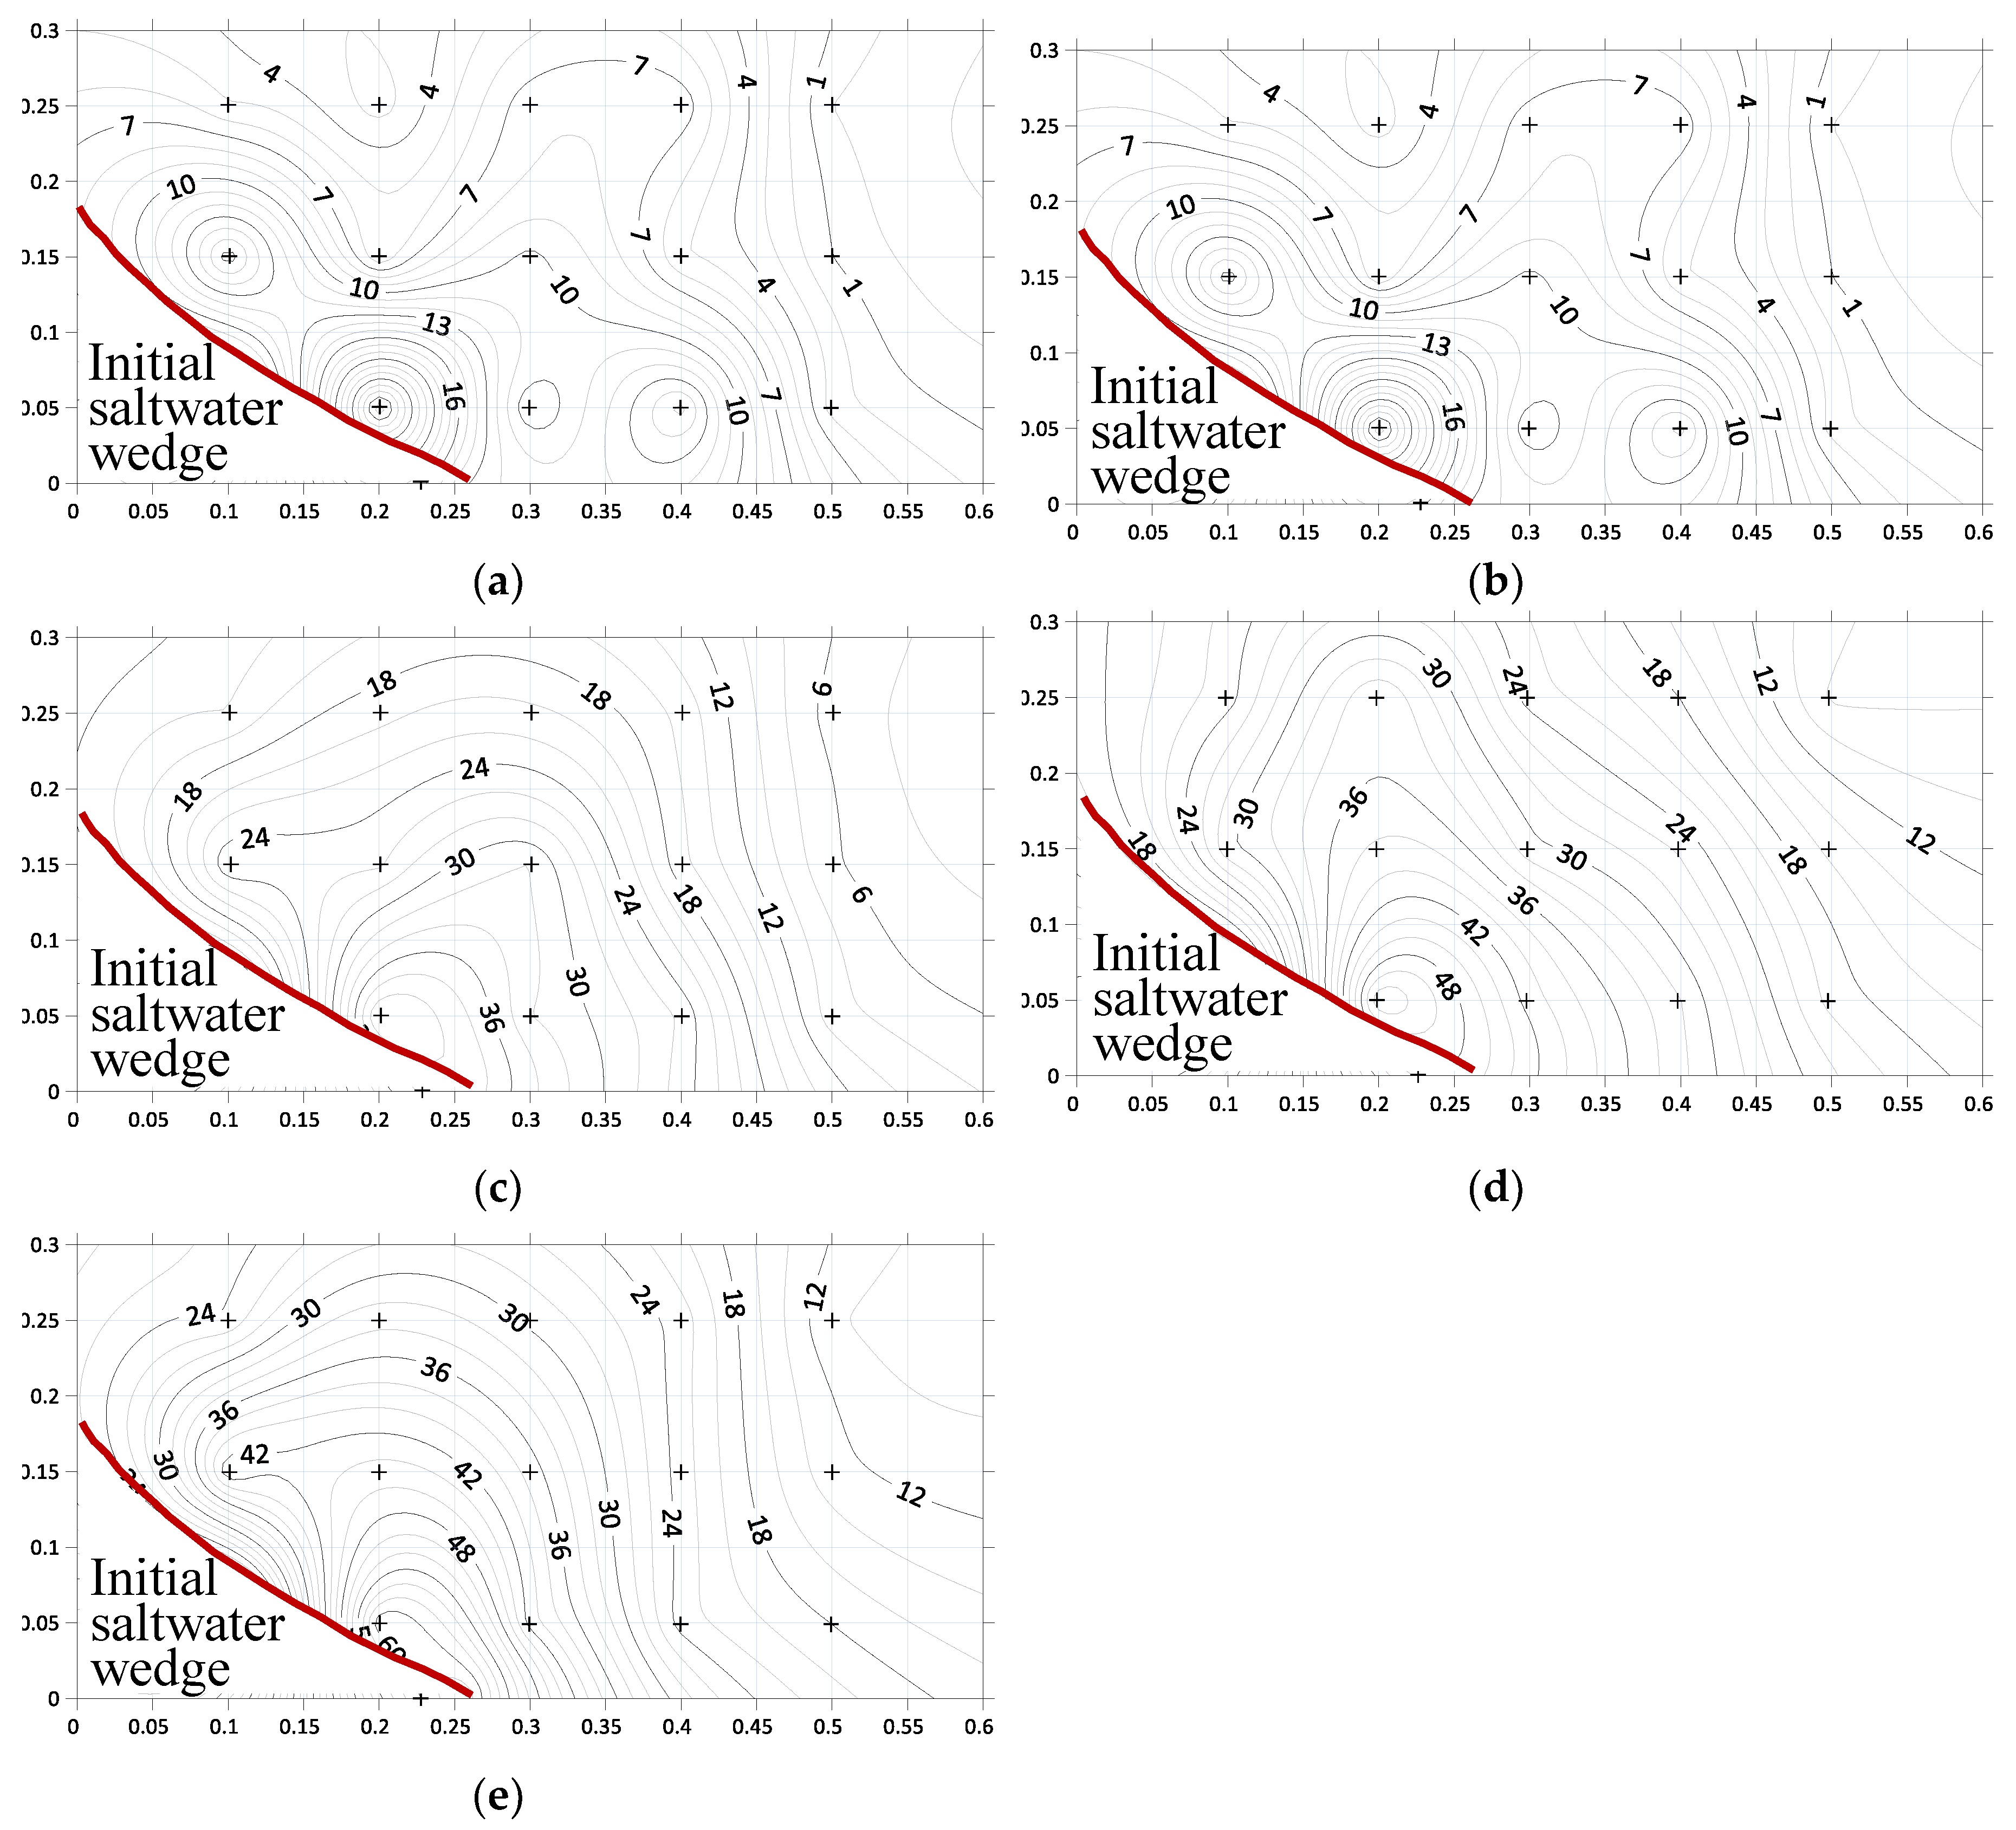
3.3. Effectiveness of Slope, Location, and Injection Rate on Repulsion Ratio in Regard to SWI Wedge Area (RA)

In this part, the repulsion ratio was computed in respect of the initial area of SWI wedge at the steady-state condition and before starting the freshwater injection. Figure 7, Figure 8, and Figure 9 present the achieved R in regard to decreasing the area of the SWI wedge. Five injection ratio rates (Qi/Q) in each case were tested: 10%, 20%, 30%, 40%, and 50% for three different confining layer bed slopes (tan β = 0.0, 0.03, and −0.03). The results showed that the maximum RA could be achieved through injecting freshwater at the toe position for the horizontal, negative, and positive sloping beds. A hydraulic barrier emerged from the aquifer bottom with the injection of the freshwater at the toe position itself and diverted the intruding saltwater. In respect of the aquifer sloping bed, injection of freshwater at the toe position achieved the highest RA in a horizontal aquifer, followed by negative and positive slopes. The computed values of RA in respect of area increased with the increasing rate of freshwater injection as the flow force introduces more saltwater to attenuate back to the saltwater side and decrease the area of the saltwater wedge. The maximum values of R equaled 39.7%, 45.6%, 54.4%, 60.3%, and 66% with Qi/Q of 10%, 20%, 30%, 40%, and 50%, respectively, in the positive case, whereas it equaled 13.2%, 27.4%, 39.7%, 47.4%, and 64.1% in the horizontal bed and finally equaled 29.6%, 40.7%, 44.4%, 55.6%, and 63.0% in the negative case. Injecting freshwater just above the toe position and to the left at y = 5 cm and x = 20 cm and at the right of the SWI toe at y = 5 cm and x = 30 cm achieved a repulsion ratio lower than the toe position. The achieved repulsion ratio decreased where the injecting point was located farther from or higher than the SWI toe position.

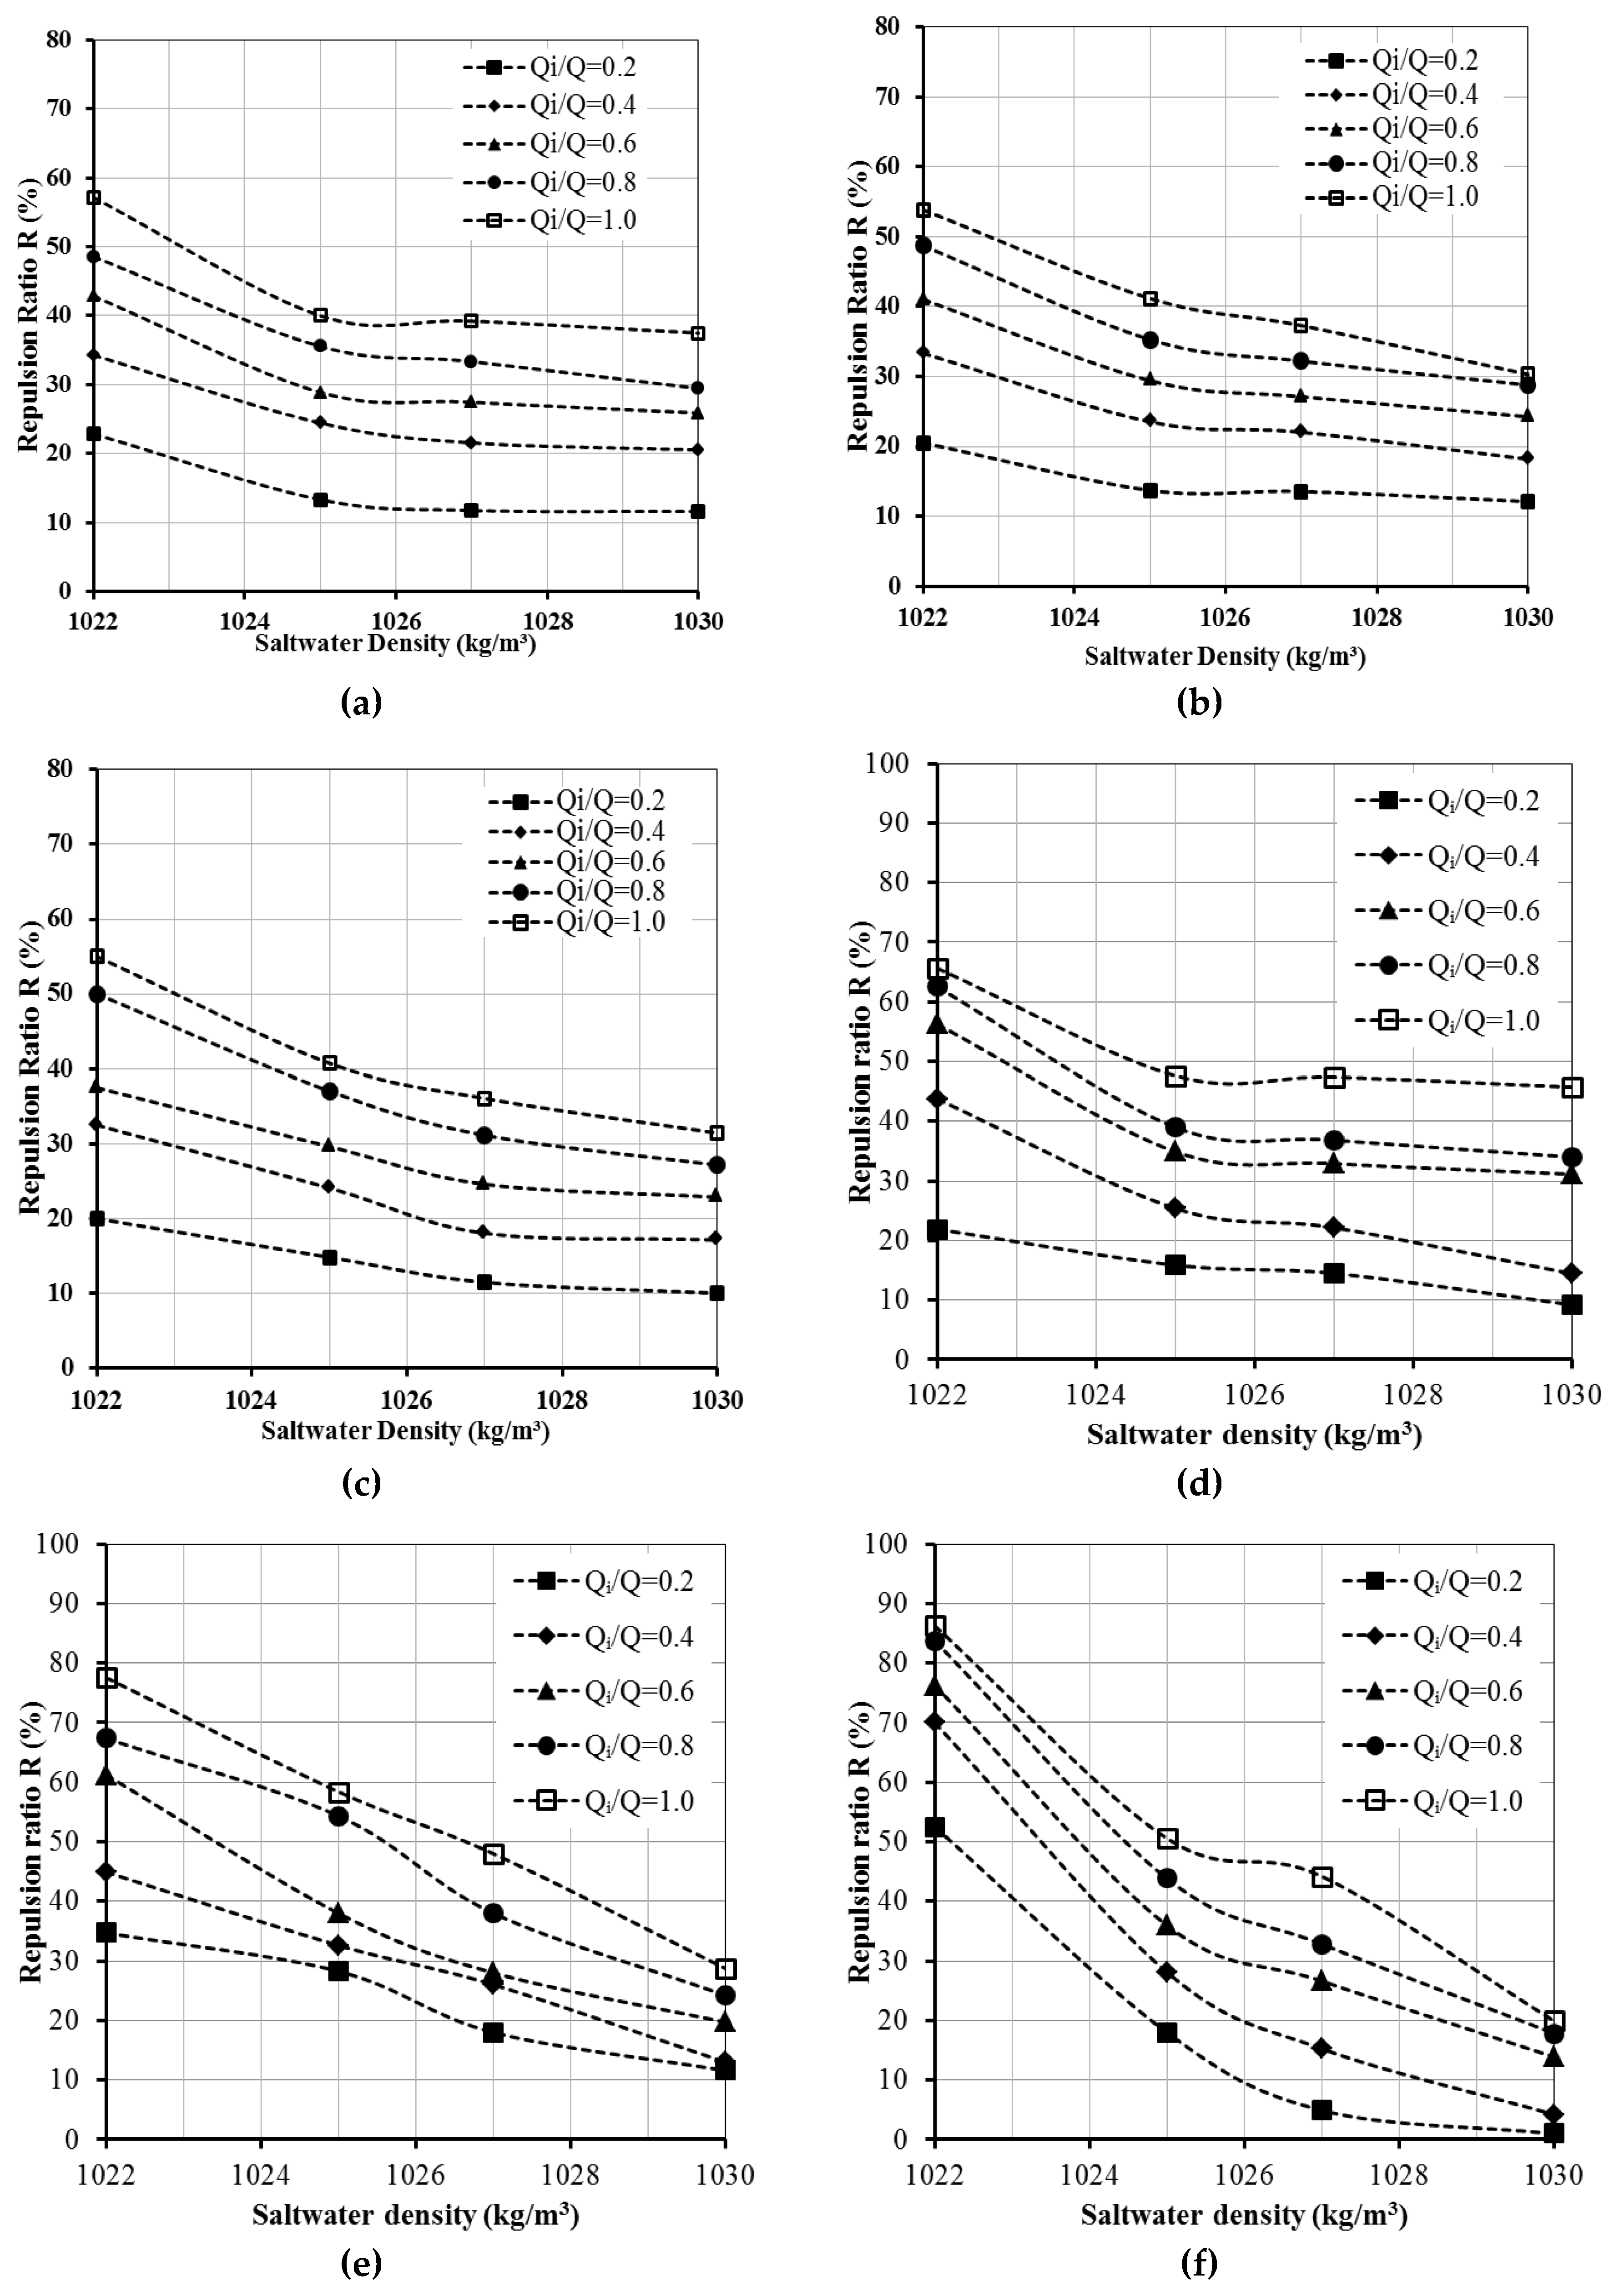
3.4. Effectiveness of Saltwater Density on Repulsion Ratios (RL) and (RA)

The effectiveness of seawater density on the repulsion ratios was studied for four different values of saltwater density, which were: 1022, 1025, 1027, and 1030 kg/m3 with corresponding saltwater concentrations equal to 30,000, 35,000, 37,500, and 40,000 mg/L, respectively. It was tested for six different values of injection rate ratios (Qi/Q) with a fixed location of freshwater injection at the toe position, K = 1.31 cm/s, i = 1.1/60, and for three different sloping beds’ tan (β) values, as shown in Figure 10. The saltwater intruded more into the freshwater with the increase of saltwater density and decrease of the computed repulsion ratios RL and RA. Figure 8a–c show the computed repulsion ratio with respect to the length of the SWI wedge for different bed sloping (tan β = 0.0, 0.03, and −0.03, respectively). Moreover, Figure 8c–e present the repulsion ratio for the same cases in regard to the SWI wedge area. In respect of the aquifer bed slope, the computed RL in regard to SWI length in the positive slope achieved the highest percentage followed by horizontal and negative slopes (Figure 10a–c). On the other hand, in regard to the SWI area, the higher achieved values of RA were observed in the case of negative bed sloping followed by the horizontal and positive bed sloping aquifer (Figure 10c–e). Moreover, RL values decreased from 42.8% to 25.9% with Qi/Q = 0.6, whereas the values of saltwater density increased from 1022 to 1030 kg/m3 with tan (β) = 0.03; this value decreased from 23.6% to 0.0% and from 37.5% to 22.9% in the case of tan (β) = 0.0 and -0.02, respectively. In addition, the achieved RA decreased from 76.25 to 13.90 with the change of saltwater density from 1022 to 1030 kg/m3 with the negative bed sloping aquifer, while it decreased from 61.2% to 19.7% and from 56.25% to 31.1% considering the horizontal and negative sloping bed aquifers, respectively.

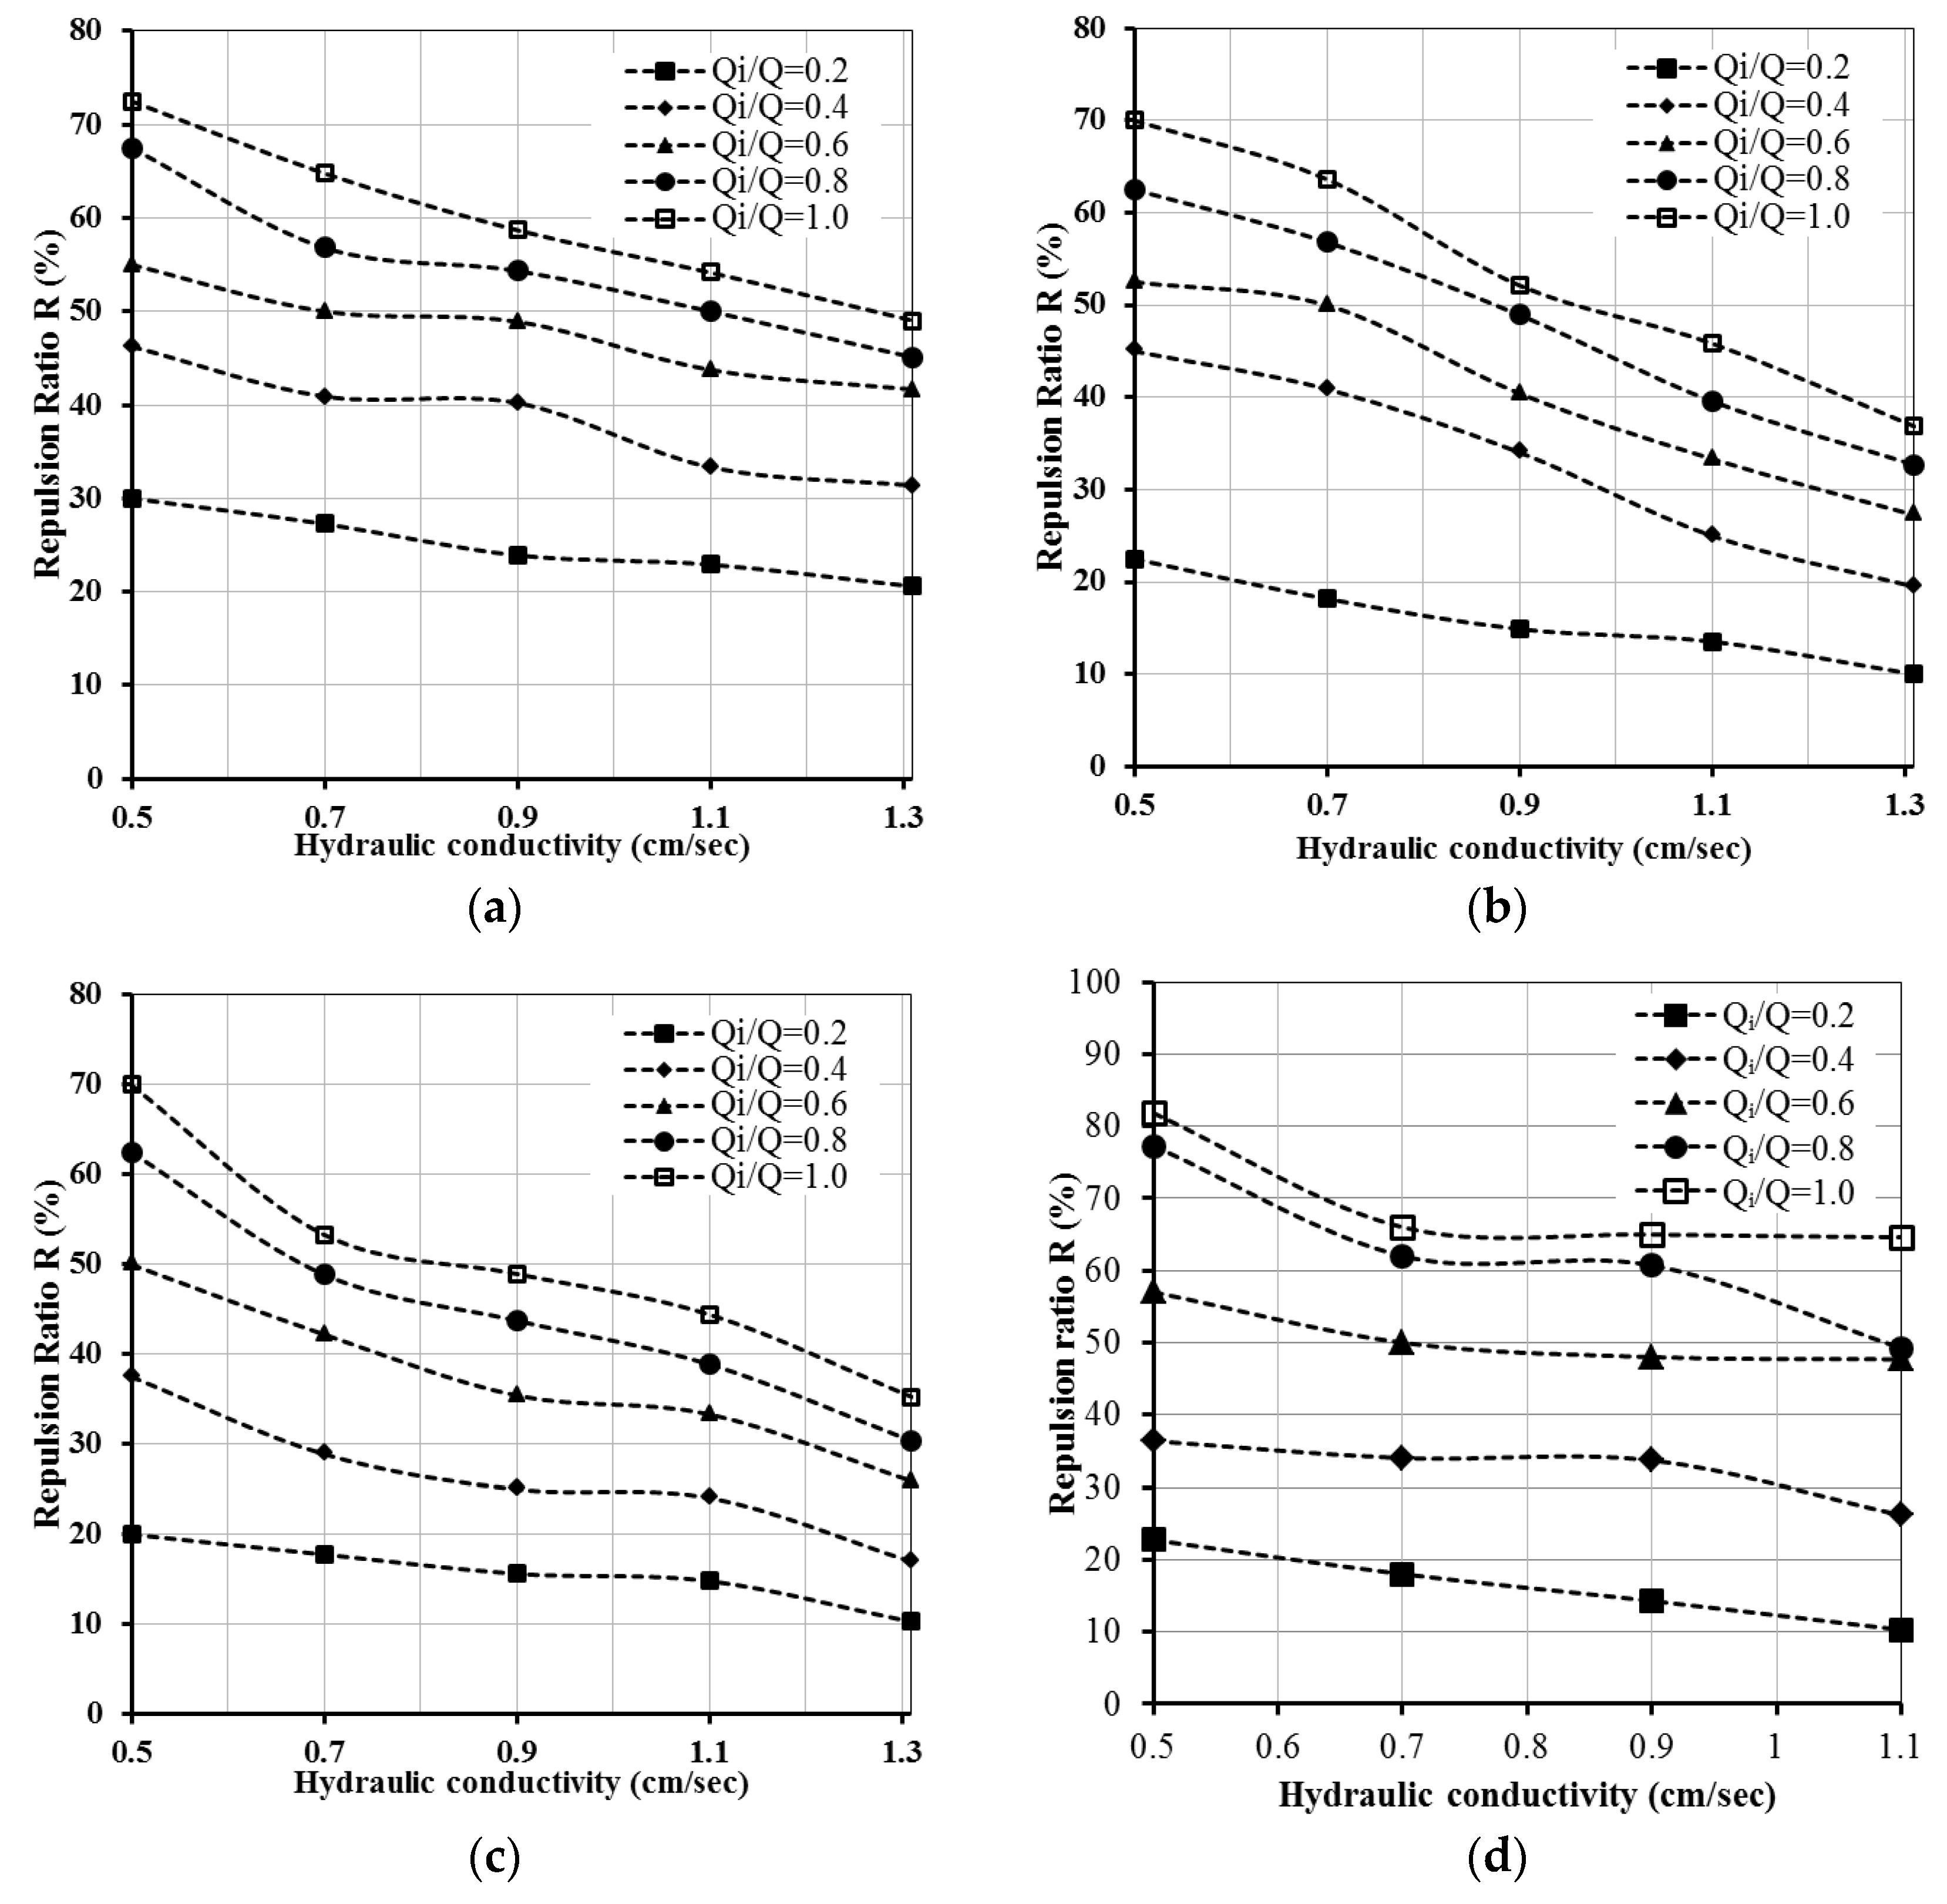
3.5. Effectiveness of Hydraulic Conductivity on Repulsion Ratios (RL) and (RA)

The effect of changing hydraulic conductivity (K) on the computed ratios RL and RA was investigated for five different values of K (0.5, 0.7, 0.7, 1.1, and 1.31 cm/s) (Figure 11) with a fixed position of injection at the toe position, ρs=1025 kg/m3, saltwater concentration=35,000 mg/L, and i = 1.1/60. This was explored for six changed injection rate ratios (Qi/Q = 0.2, 0.4, 0.6, 0.8, and 1.0) and three cases of bed aquifer slopes tan (β), which were 0.03, 0.0, and −0.03. Increasing the value of hydraulic conductivity (K) led to intrusion of the saltwater more inland into the freshwater aquifer and reduction of the values of RL and RA. Figure 11a–c explain the achieved repulsion ratio with respect to the length of the SWI wedge (RL) for different bed sloping (tan β = 0.0, 0.03, and −0.03, respectively). Moreover, Figure 11c–e show the computed repulsion ratio (RA) for the same cases in regard to the SWI wedge area. In regard to the values of aquifer bed slopes (tan β), injecting freshwater through a well in the unconfined aquifer with the positive sloping bed achieved the highest values of RL and RA followed by horizontal and negative slopes. Injection of freshwater with a high Qi/Q ratio and low values of K increased the values of RL and RA; in addition, the saltwater wedge attenuated back to the seawater side. With Qi/Q = 0.6, the ratio RL reduced from 55% to 41.70% with an increase in the value of K from 0.5 to 1.31 cm/s with tan (β) = 0.03; moreover, RL declined from 52.5% to 27.25% and from 50.0% to 25.9% for tan (β) of 0.0 and −0.03, respectively. In addition, the achieved RA was reduced from 57.0% to 47.0% with the increase of the value of K from 0.5 to 1.31 cm/s in the case of the positive bed sloping aquifer, while it declined from 56.25% to 26.70% and from 50.0% to 25.4% in the negative and horizontal sloping bed aquifers, respectively.

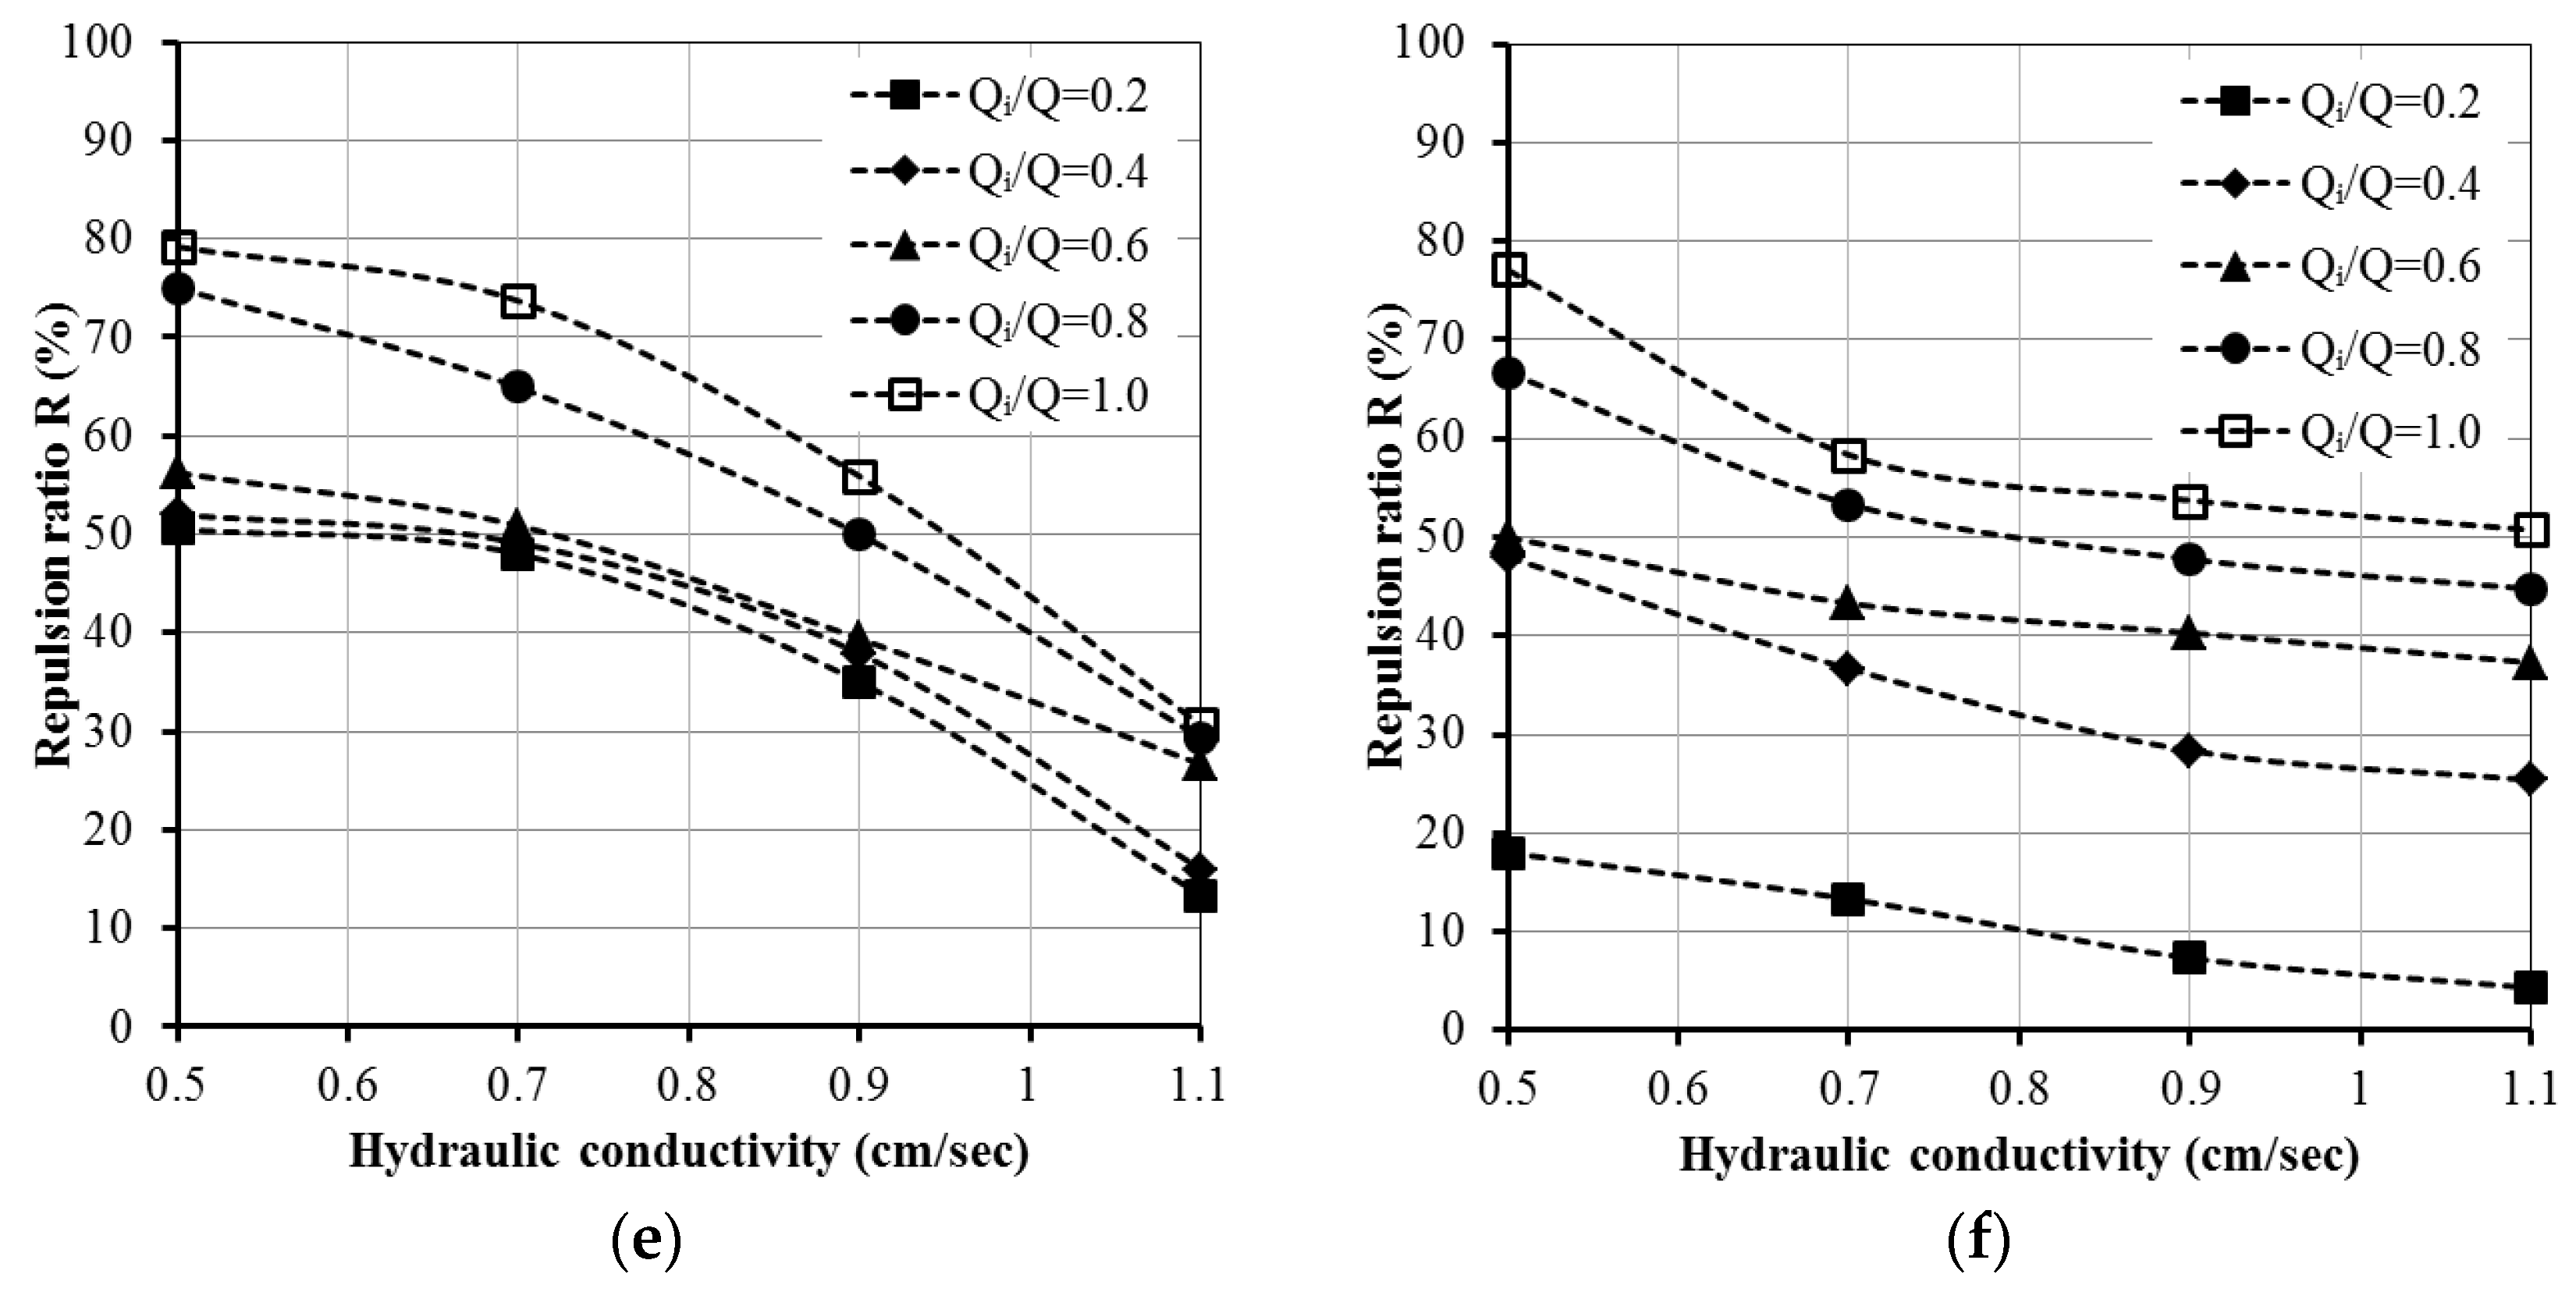
3.6. Effectiveness of Hydraulic Gradient on Repulsion Ratios (RL) and (RA)

The impact of the hydraulic gradient (i) on the computed repulsion ratio (RL) and (RA) was examined for six different hydraulic gradient values (0.8/60, 0.9/60, 1.0/60, 1.1/60, 1.2/60, and 1.3/60). This was explored with a fixed location of an injection point at the toe itself, with K=1.31 cm/s, ρs = 1025 kg/m3, and saltwater concentration=35,000 mg/L, and for six injection rate ratios, Qi/Q = 0.2, 0.4, 0.6, 0.8, and 1.0 (Figure 12), according to three bed slope tan (β) values of the unconfined aquifer. Increasing the hydraulic gradient force caused the saltwater wedge to retreat back and raised the repulsion ratio values RL and RA. The achieved RL in respect of the SWI wedge length in the positive sloping aquifer was considered as the highest percentage followed by horizontal and negative slopes. Increasing i from 0.80/60 to 1.3/60 led to an increase in the value of RL from 13.3% to 40.25% with tan (β) = −0.03, while it increased from 13.18% to 38.46% and from 17.90% to 38.50% with tan (β) = 0.0 and 0.03, respectively. In respect of the SWI area, the achieved value of RA in the negative slope was more than the positive and horizontal slopes. Increasing Qi/Q combined with increasing the value of hydraulic gradient (i) forced the SWI wedge to move farther back to the seawater side. Increasing i from 0.80/60 to 1.3/60 led to an increase in the value of RA from 10.5% to 44.90% with tan (β) = −0.03, while it increased from 14.12% to 54.40% and from 11.70% to 40.80% with tan (β) = 0.0 and 0.03, respectively.

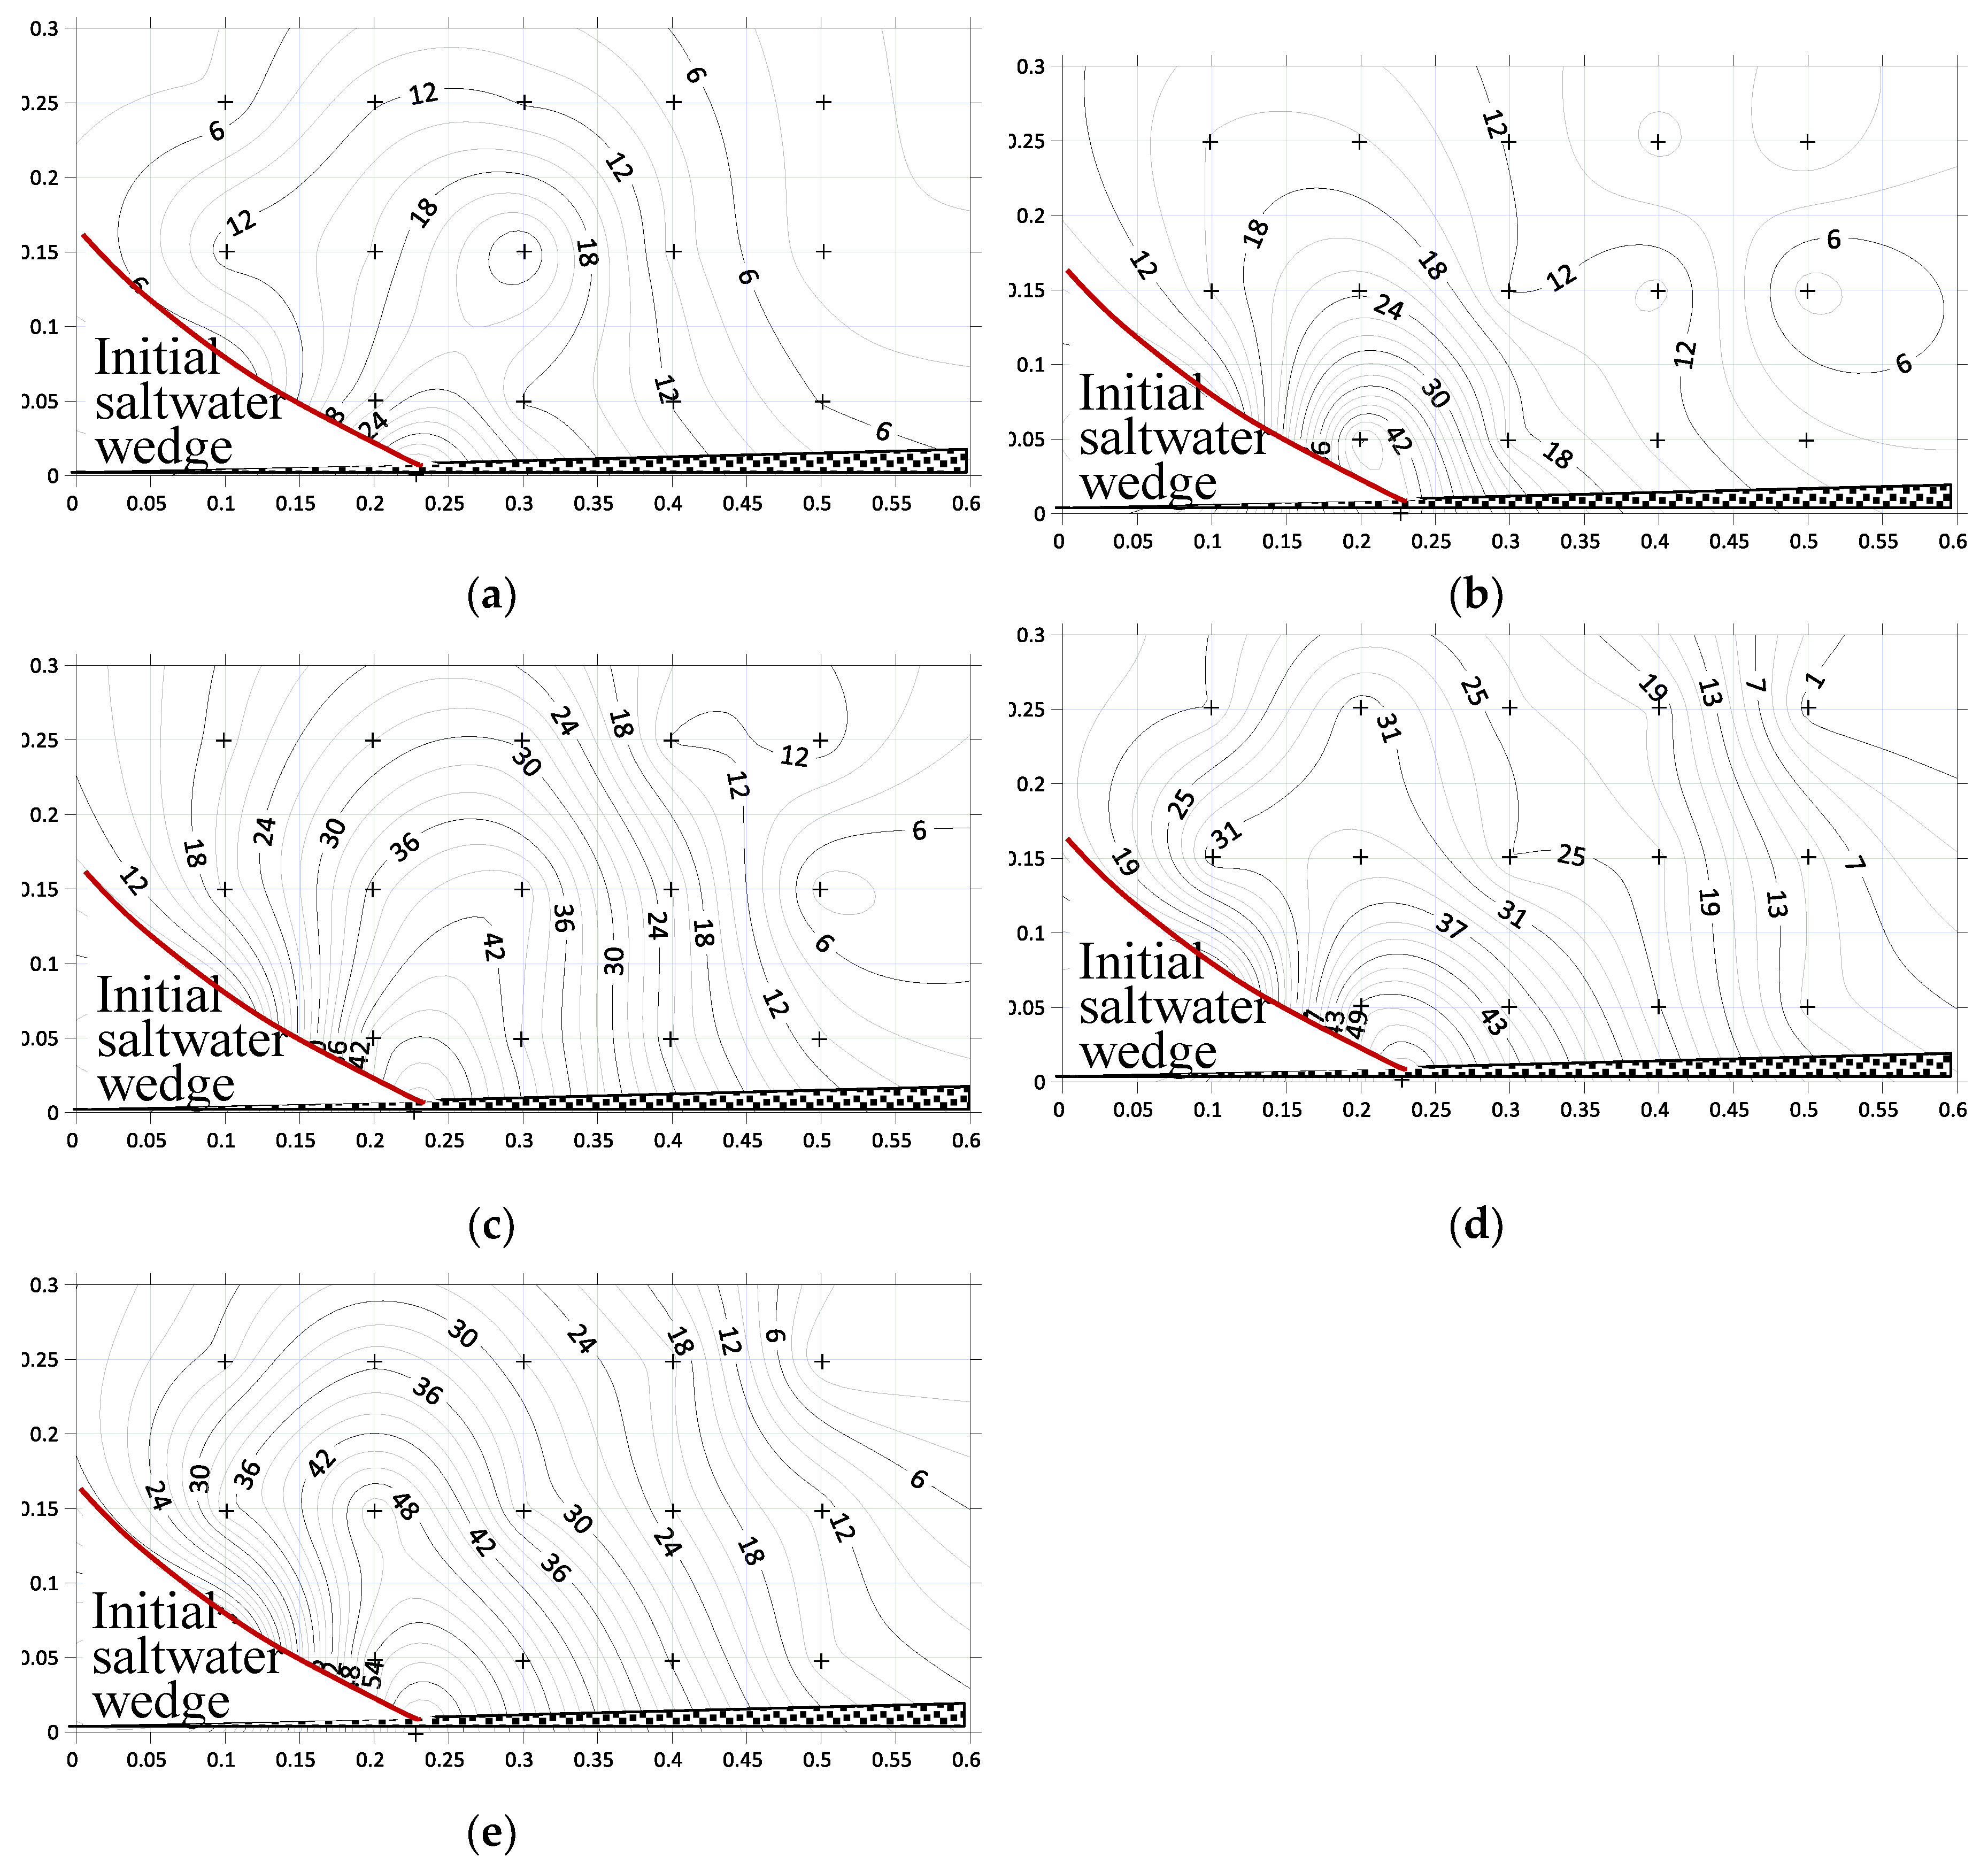
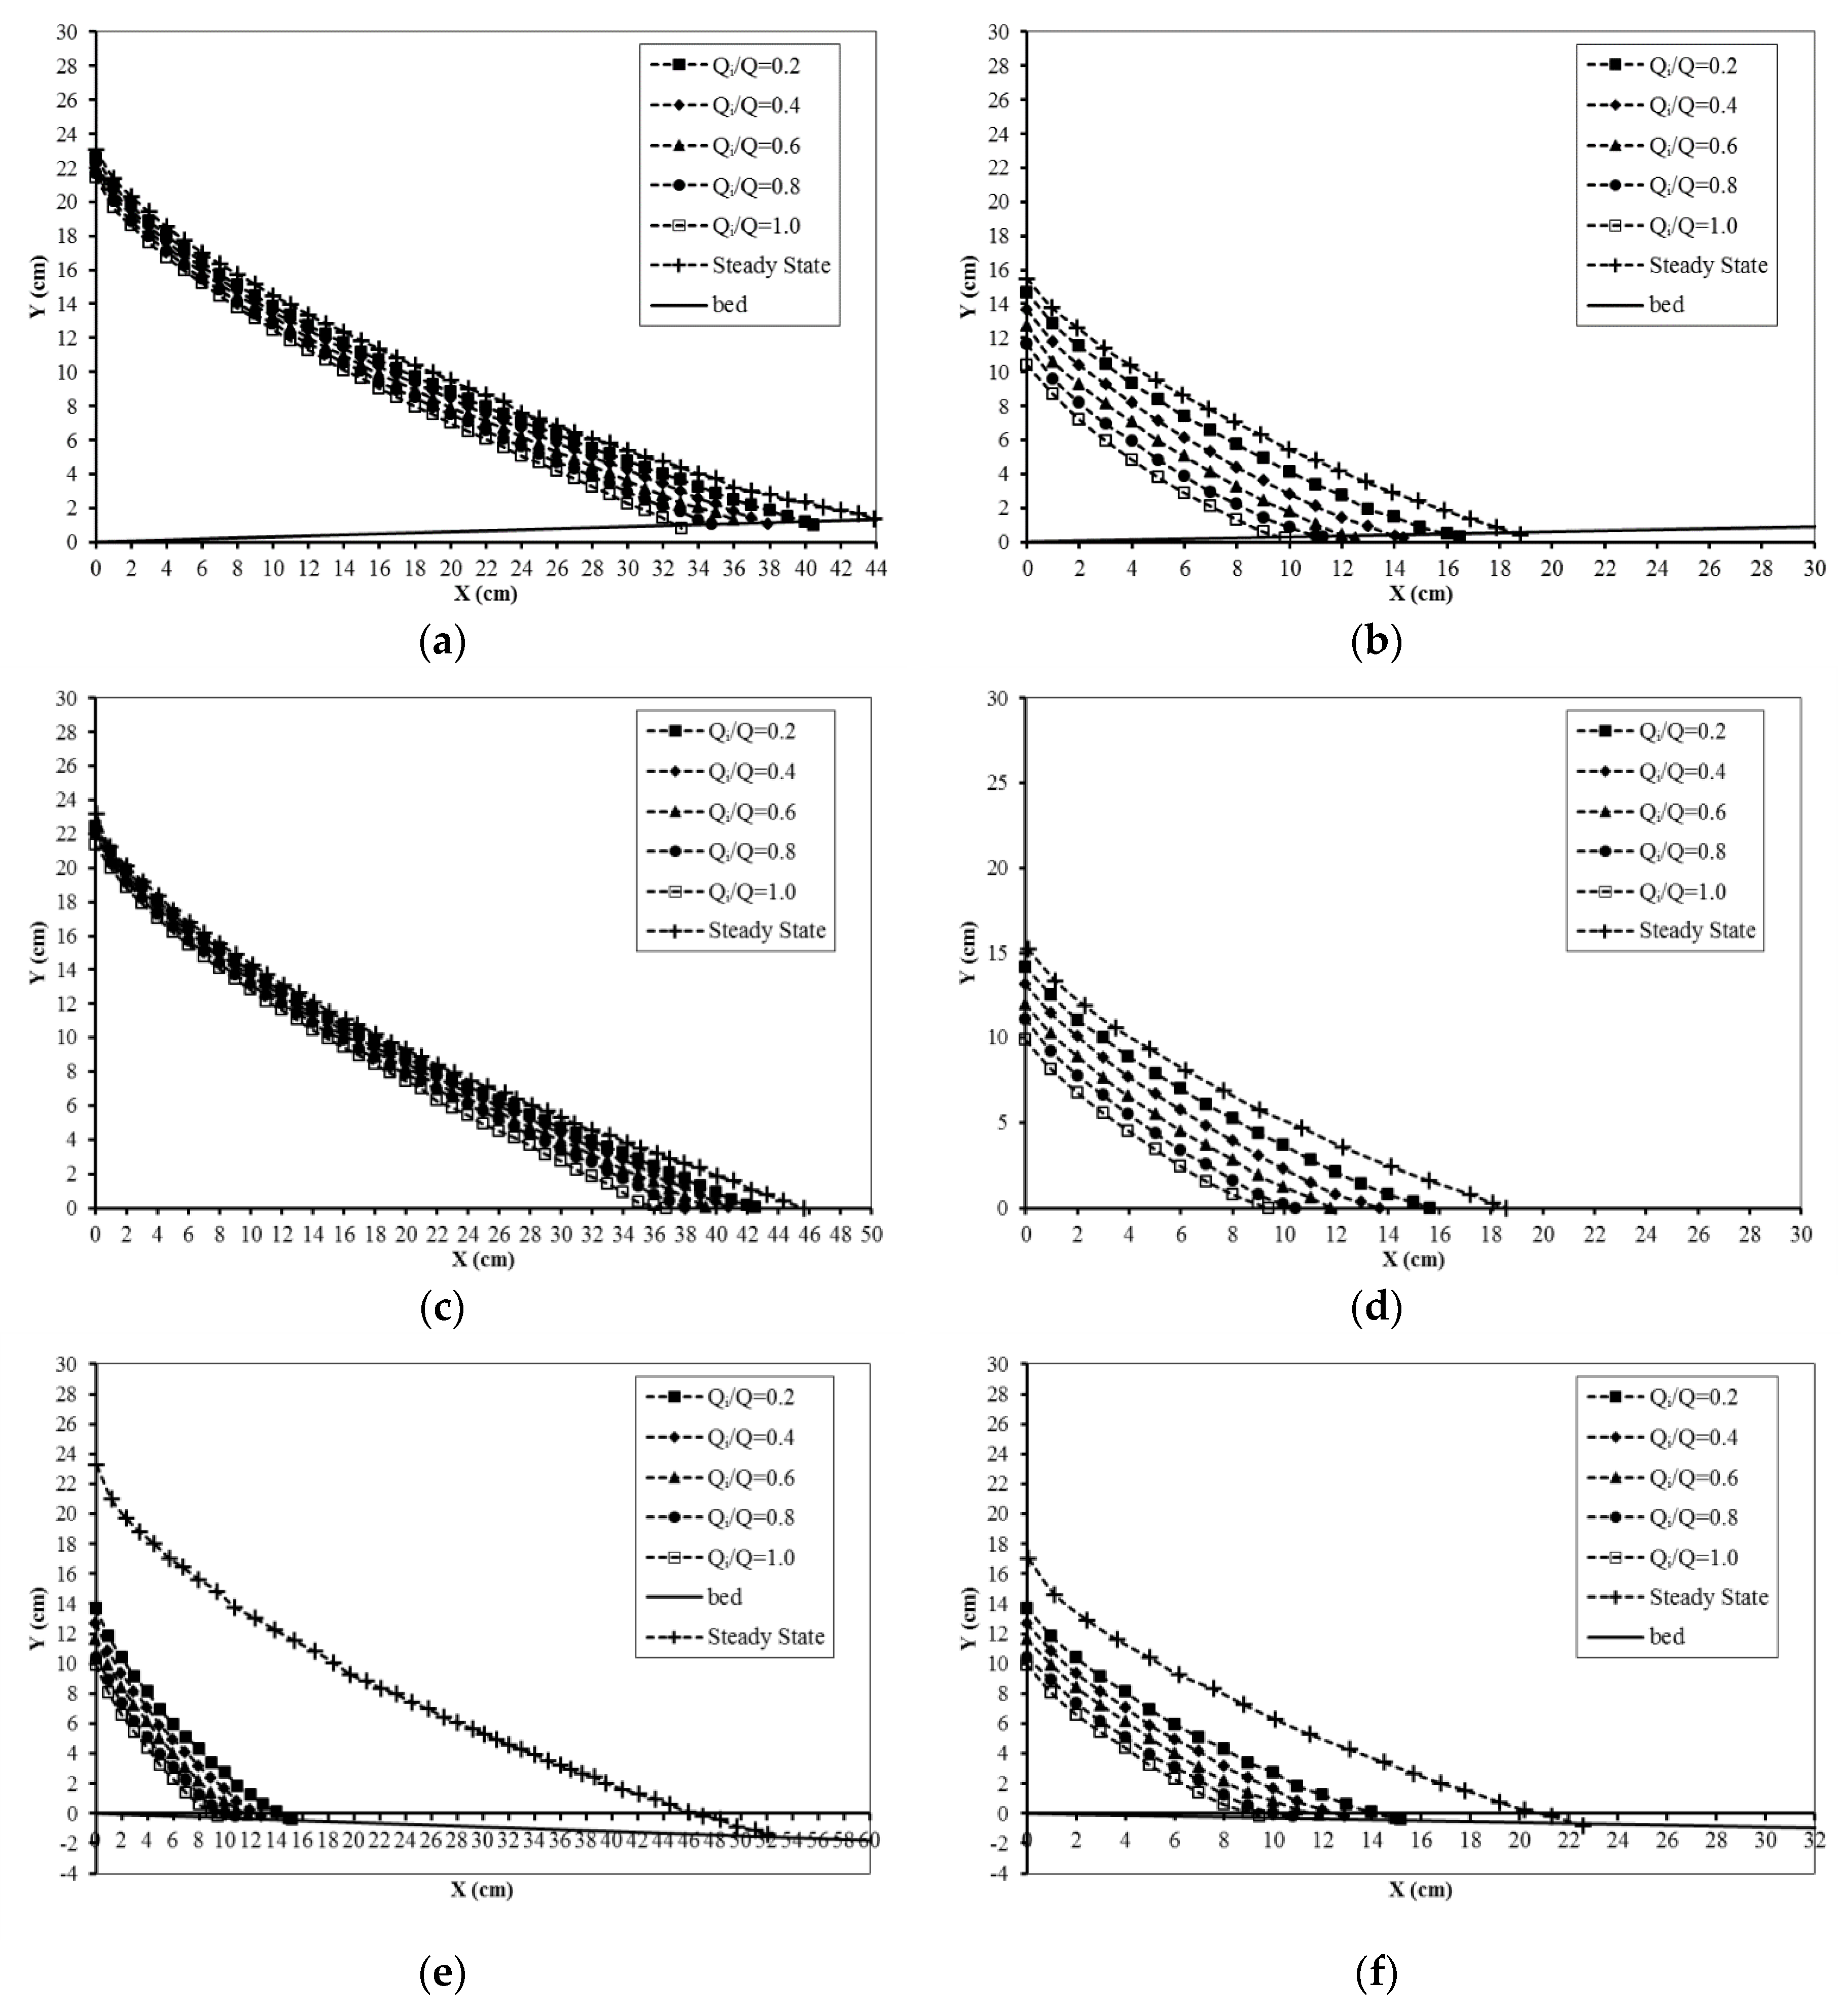
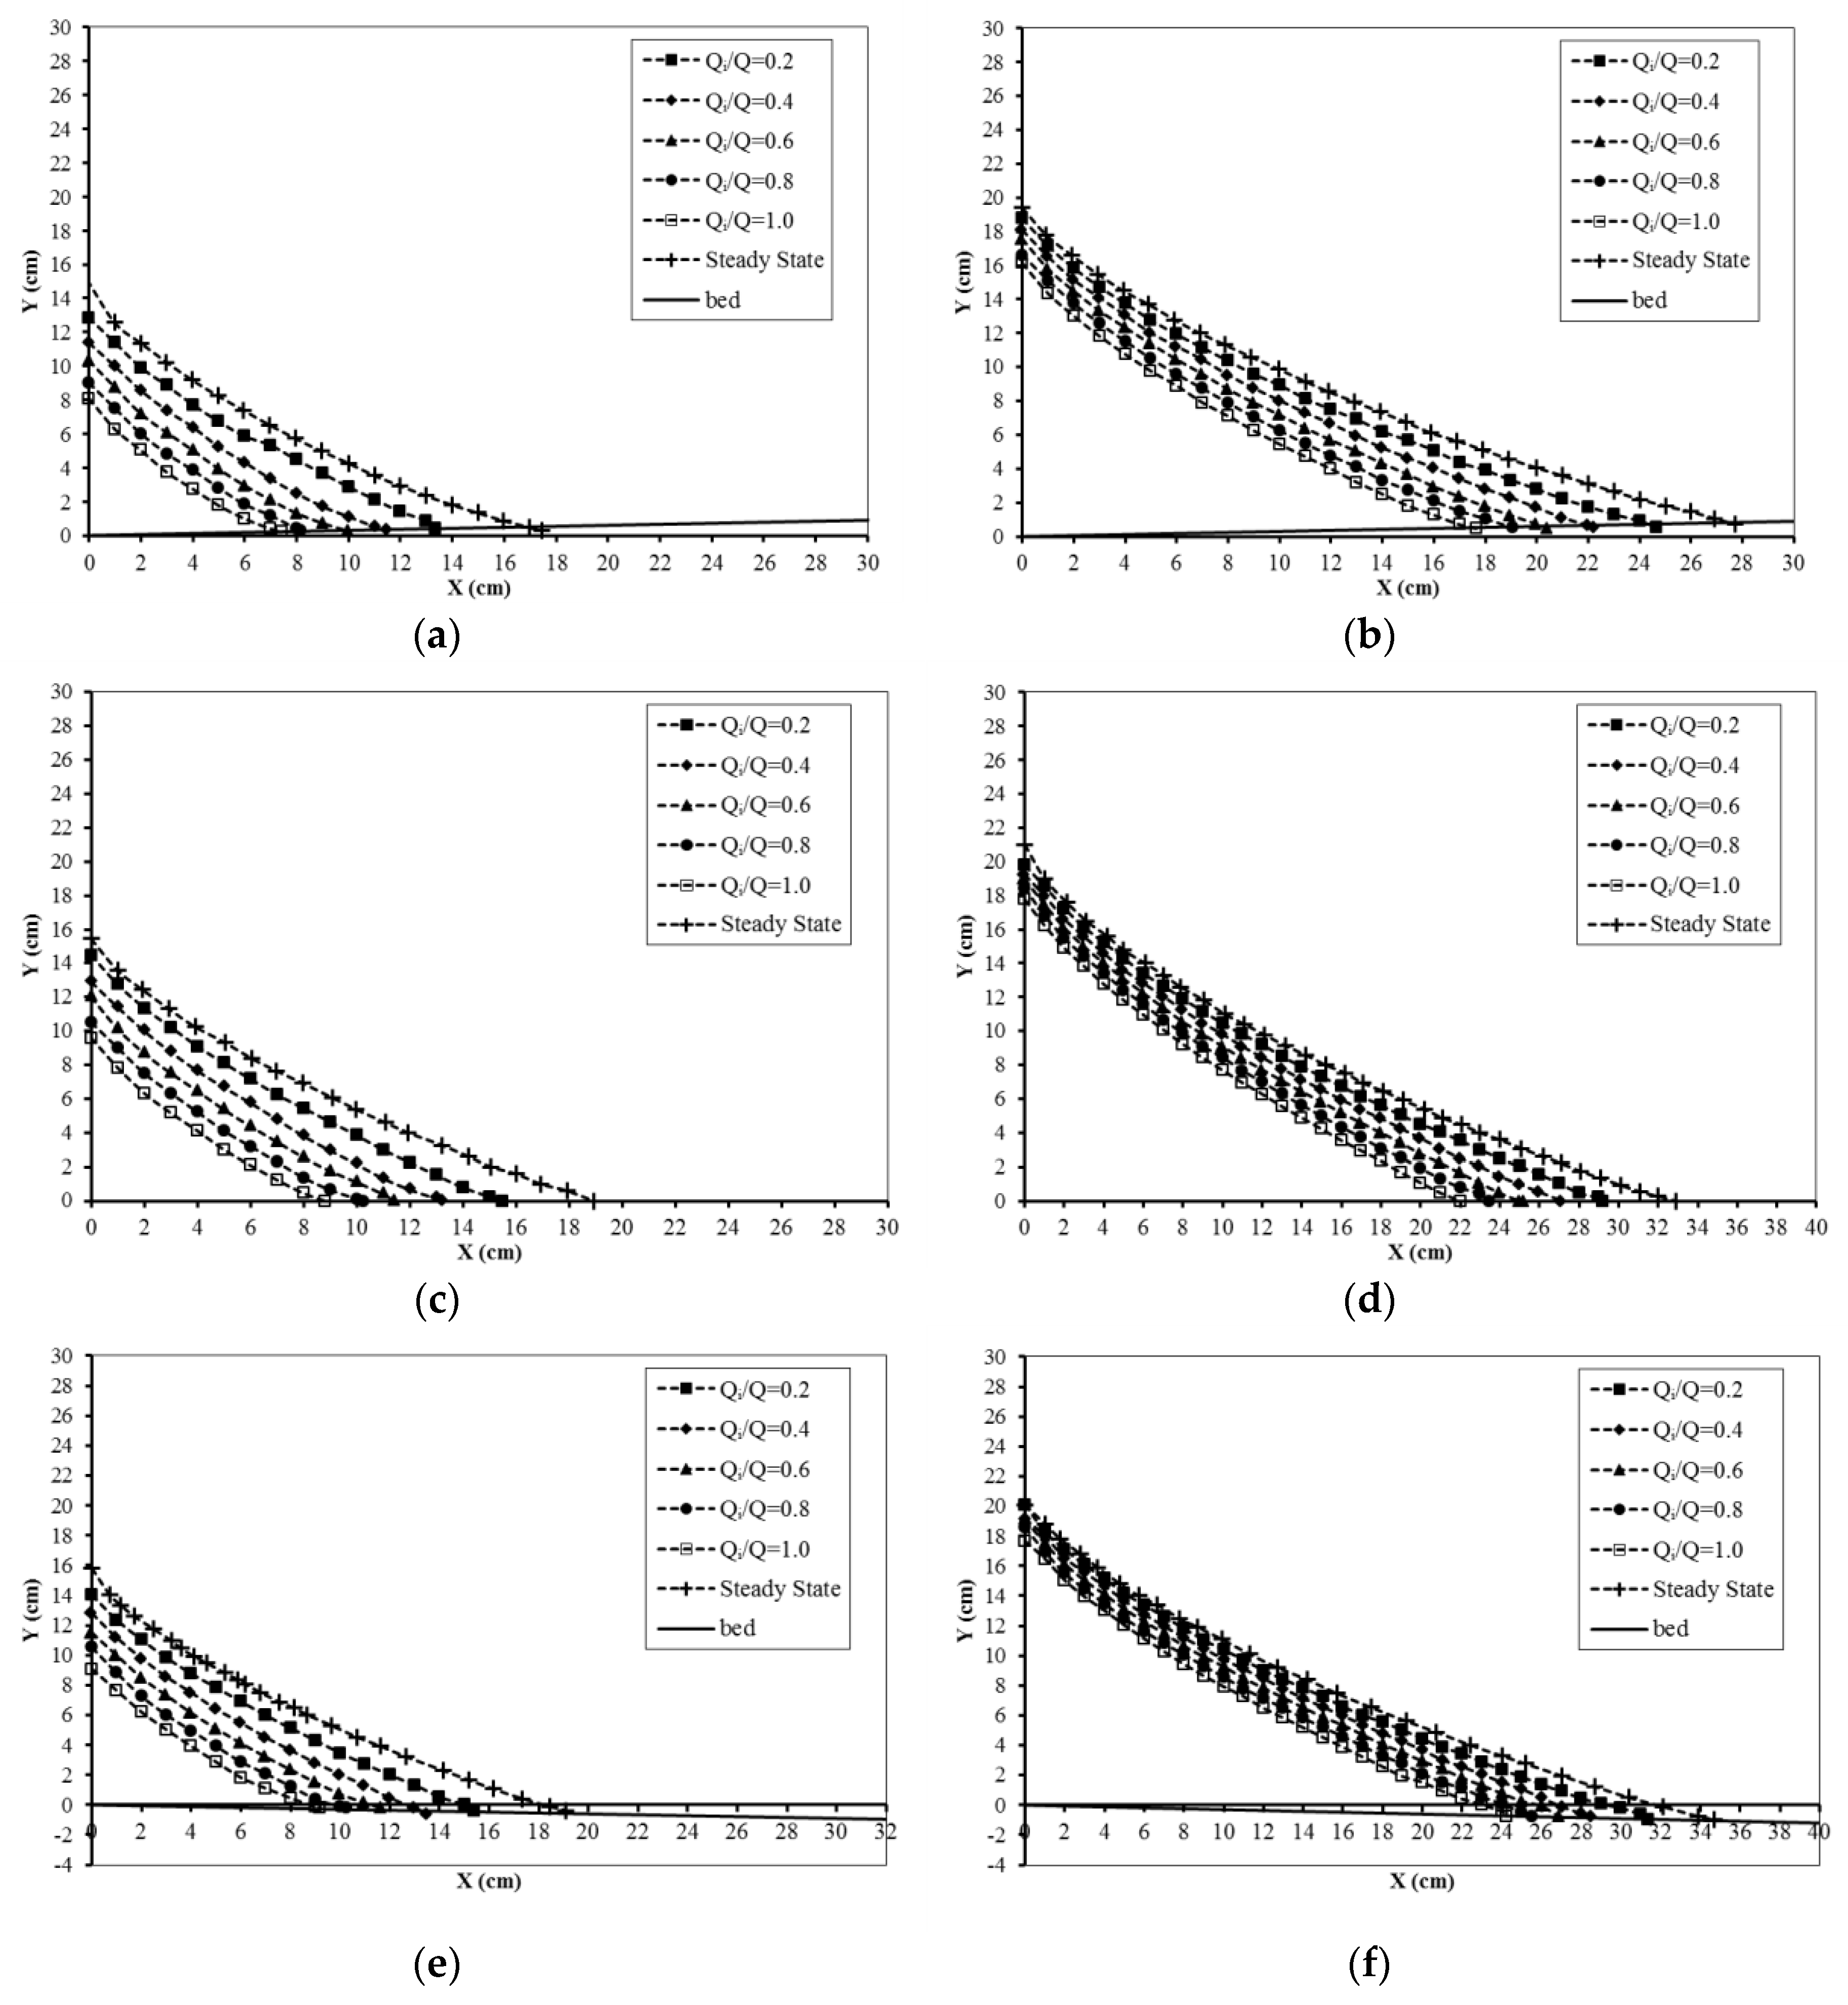
3.7. Retreating Saltwater Wedge for Different Hydraulic Conductivity

Figure 13 presents the retreat of the saltwater wedge after an injection of freshwater through a well at the toe position with different rates in regard to the steady-state initial saltwater wedge considering the change of K. This is presented as an example for K = 0.7 cm/s and K = 1.1 cm/s for different sloping beds of tan β = 0.03, 0.0, and −0.03. The figures confirm that increasing the flow rates forced further retreatment of saltwater and a reduction in both the area of the SWI wedge and the length. The achieved values of RA in the case of K=0.7 cm/s were higher than K = 1.1 cm/s. In the case of tan β = −0.03 and K = 0.7 cm/s, the highest values of RA were achieved; the area of the SWI wedge was reduced from 120 to 105.6 cm2 (RA = 12.00%) with Qi/Q = 0.2 and reached 60 cm2 (RA = 50.0%) with Qi/Q = 0.6. This value, in the case of the horizontal bed sloping aquifer, declined from 136.8 to 70.72 cm2 (RA = 48.30%) with Qi/Q = 0.2 and declined further to reach 67.2 cm2 (RA = 50.88%) with Qi/Q = 0.6. Moreover, with respect to the negative sloping bed, the SWI area reduced from 144 cm2 to 124.8 cm2 with Qi/Q = 0.2 and RA = 13.33% and declined further to reach 86.4 cm2 with RA = 40% and Qi/Q = 0.6.

3.8. Retreating Saltwater Wedge for Different Hydraulic Gradients

Figure A1 presents the return of the saltwater wedge after freshwater injection at the toe position with different flow rates with regard to the steady-state initial saltwater wedge taking into account the variations of the hydraulic gradient. This is presented as an example for head difference = 0.8 cm and 1.3 cm for three different sloping beds of tan β = 0.03, 0.0, and −0.03. The figures prove that increasing Qi/Q causes the saltwater to retreat farther and decreases both the length of the SWI wedge and the wedge area. The computed values of RA in the case of head difference = 1.3 cm were higher than 0.80 cm. In the case of aquifers with tan β = 0.03, with head difference = 1.3 cm, the SWI wedge area reduced from 150 to 117 cm2 (RA = 22.0%) with Qi/Q = 0.2 and reached 88.8 cm2 (RA = 40.8%) with Qi/Q = 0.6. These values, in the case of the horizontal unconfined aquifer, declined from 163.2 to 127.2 cm2 (RA = 22.05%) with Qi/Q = 0.2 and declined more to reach 74.4 cm2 with Qi/Q = 0.6 (RA = 54.4%). Furthermore, RA scored the highest values with regard to the negative sloping bed, and the SWI area reduced from 165.6 to 97.83 cm2 with Qi/Q = 0.2 with RA = 40.92% and declined more to reach 91.20 cm2 achieving RA = 44.92% with Qi/Q = 0.60.

3.9. Retreating Saltwater Wedge for Different Saltwater Density

Figure A2 displays the retreating SWI wedge concerning the steady-state initial saltwater wedge after installing a freshwater injection through the well at the toe position with five different flow rates taking into account the changing of saltwater density. This was introduced as an example for saltwater density = 1022 and 1030 kg/m3 for three different sloping beds of tan β = 0.03, 0.0, and −0.03. The figures demonstrate that increasing the value of Qi/Q, the saltwater receded farther, and the length of the SWI wedge and the corresponding wedge area both declined. The calculated values of RA in the case of saltwater density =1022 kg/m3 were higher than 1030 kg/m3. In the case of tan β = 0.03 and saltwater density=1022 kg/m3, the area of SWI wedge was reduced from 76.8 to 60.00 cm2 (RA = 21.87%) with Qi/Q = 0.2 and reached 33.6 cm2 (RA = 56.25%) with Qi/Q = 0.6. This value, in the case of the horizontal bed sloping aquifer, declined from 117.6 to 76.8 cm2 (RA = 34.7%) with Qi/Q = 0.2 and declined further to reach 45.6 cm2 (RA = 61.20%) with Qi/Q = 0.6. Moreover, RA with respect to the negative sloping bed achieved the highest values, and the SWI area was reduced from 192 to 91.2 cm2 where Qi/Q = 0.2 and RA= 52.55% and declined more to reach 45.6 cm2 with RA = 76.25% and Qi/Q = 0.6.
The numerical simulations with SEAWAT through different injection locations confirmed that more effective values of the SWI repulsion ratio (RL and RA) can be reached if a recharge well is installed near the SWI wedge toe. The application of a recharge well becomes less effective and lower repulsion ratios (RL and RA) were achieved if one installed a recharge well higher and away from the toe of SWI wedge compared with recharging at toe itself. By applying a recharge well near the SWI toe, the created corresponding hydraulic pressure becomes very effective to retreat SWI; the hydraulic pressure minimizes when installed farther and higher from the SWI toe. Increasing the recharge rate Qi/Q overcomes the effect of density and achieves recharge flux enough to attenuate the saltwater. Recharging water through a well can increase the dispersion and can successfully repel the intruded saltwater with the created hydraulic barrier. Onsite, a shorter screen length of recharge well is recommended and can be used as long as the well is directly installed near the toe of the SWI wedge.
Prior to the actual onsite investigations, field scale numerical analyses of the actual field scenarios were considered. The aquifer heterogeneity would result in different SWI wedge and repulsion ratios than those introduced in the findings of this research and should be considered by researchers in future studies. The application of all study results to the actual field scenarios depends on the accurate prediction of the extent of SWI and the location of the SWI toe; as a result, the significance of onsite monitoring and investigation should be emphasized. The results from this study will support in future management, planning, and design of artificial recharge well facilities to control SWI. It should be mentioned that these findings and conclusions of this research are only valid for homogenous and isotropic coastal aquifers. It should also be noted that this research is for a 2-dimensional analysis for controlling SWI with a single freshwater injection well. Onsite, a series of closely spaced groundwater wells is usually installed parallel to the aquifer coast as the hydraulic barrier formation depends on the well spacing. It is assumed, in this study, that the groundwater recharge well spacing is close enough in order to generate a uniform hydraulic barrier parallel to the coast. Furthermore, in this research, the recharge well used is located outside the initial SWI wedge. Freshwater recharge through groundwater wells may be achieved directly within the intruding SWI wedge.

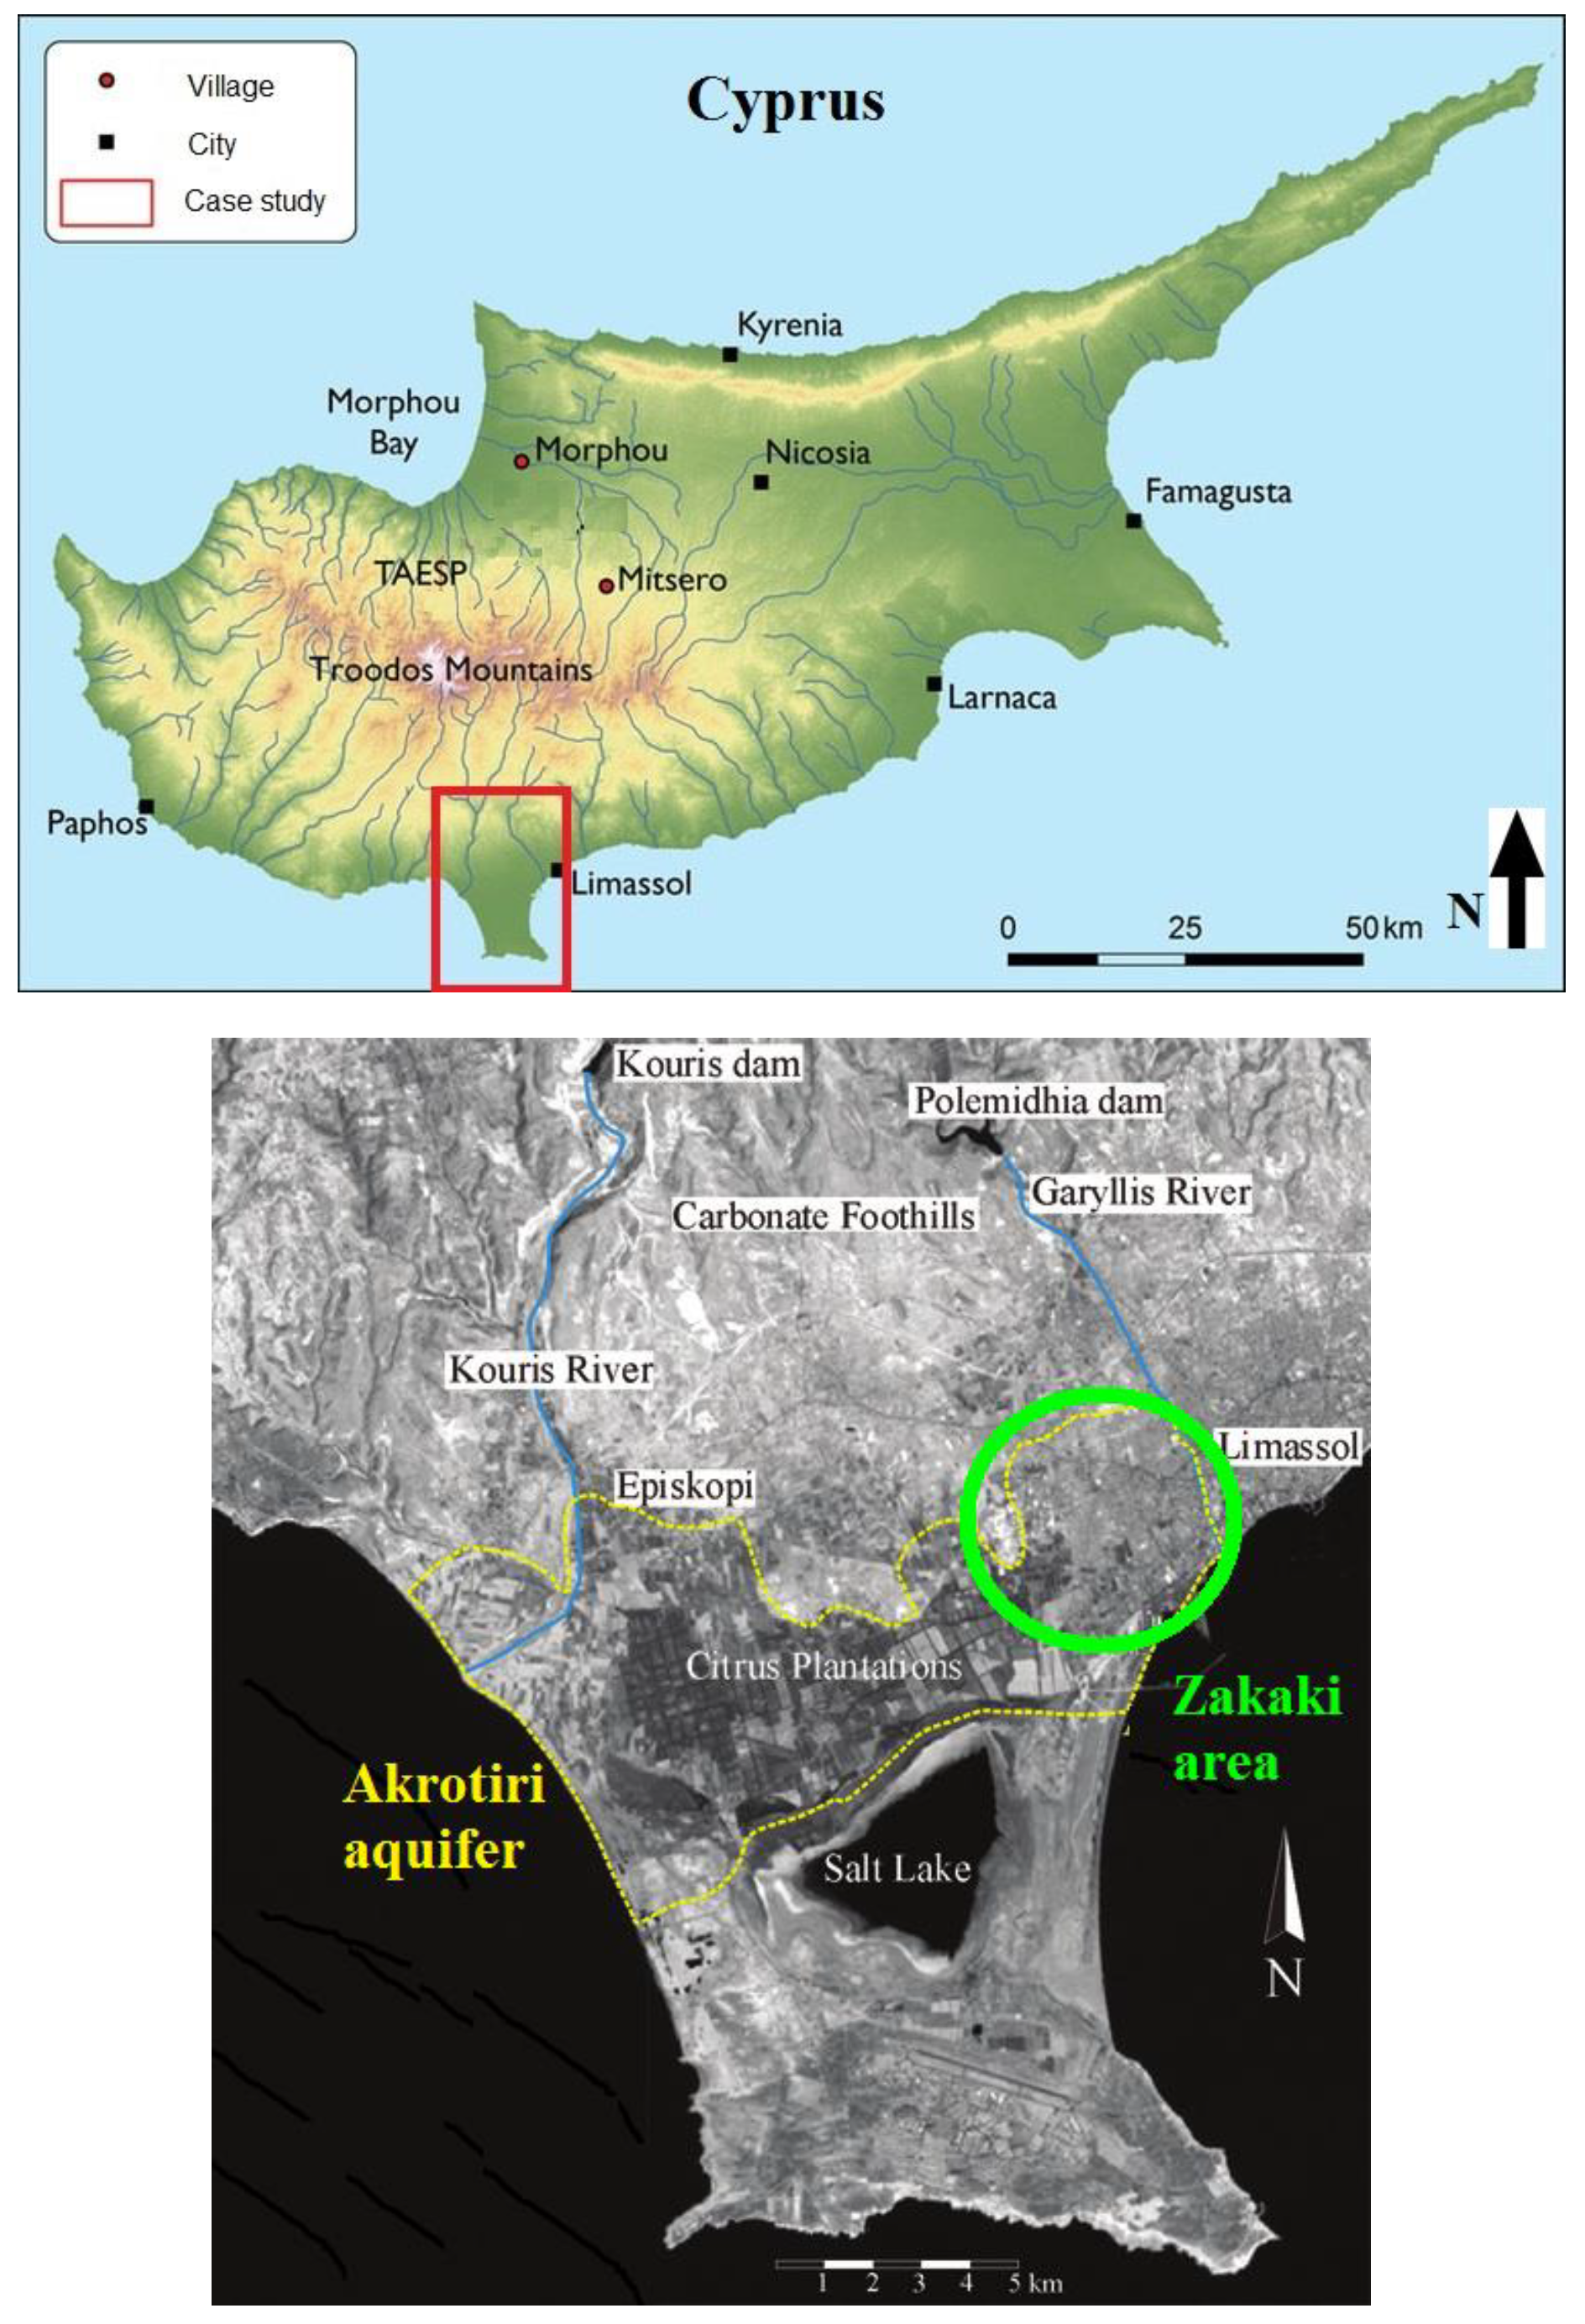
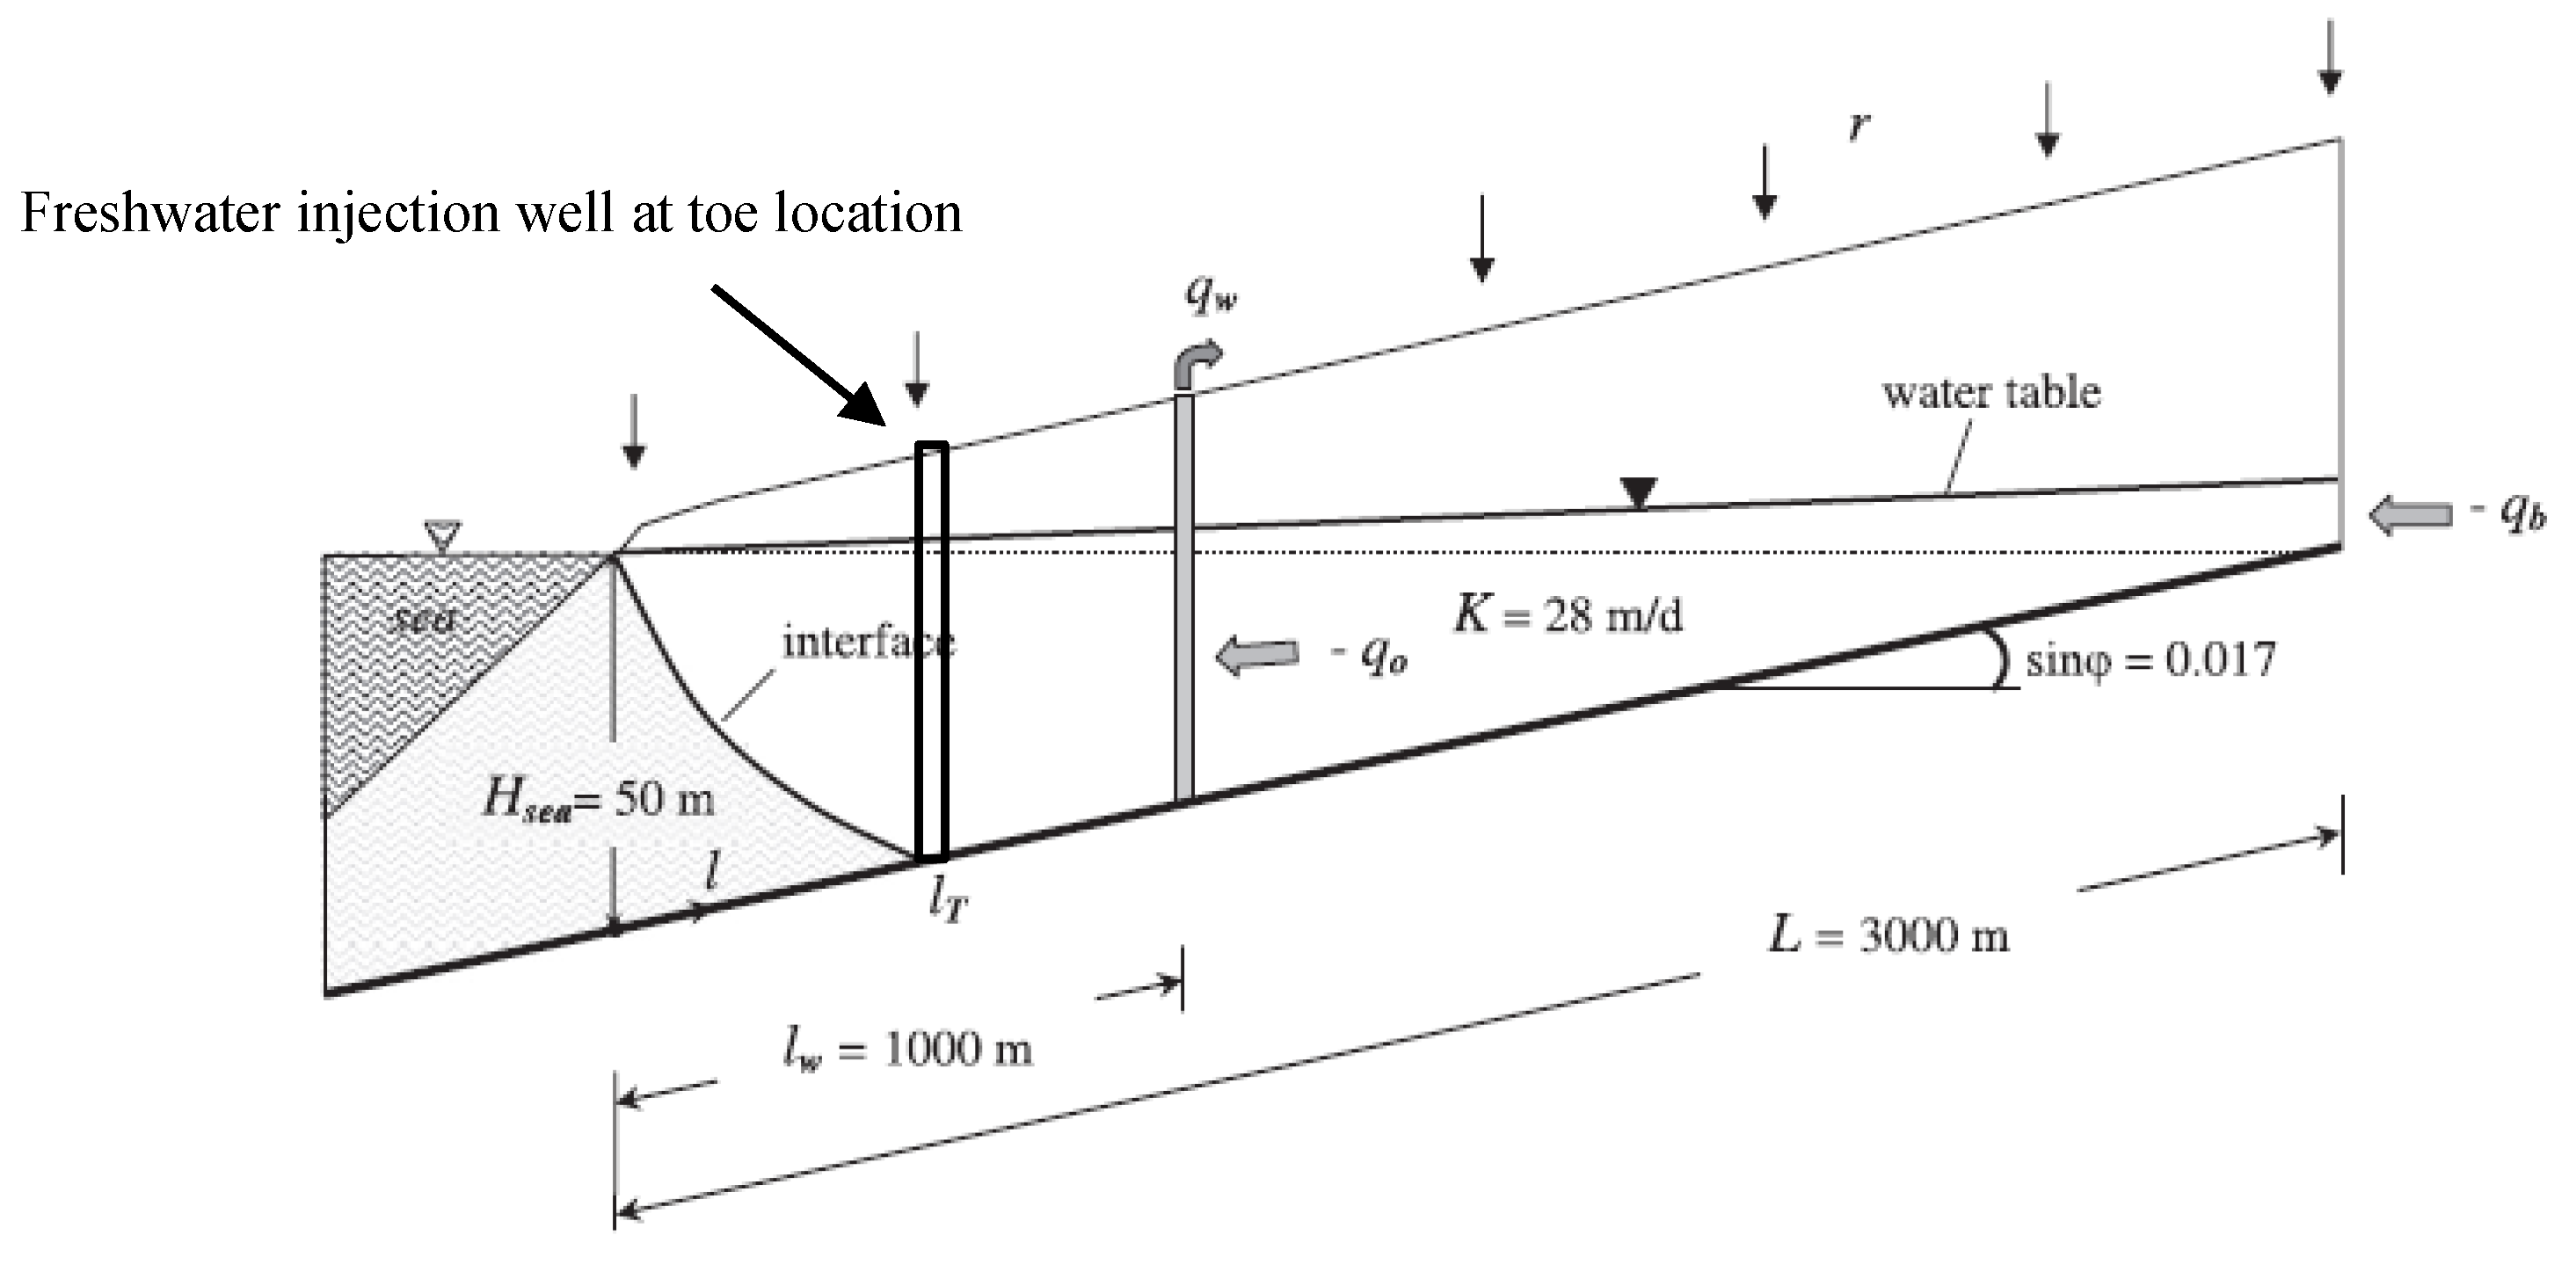
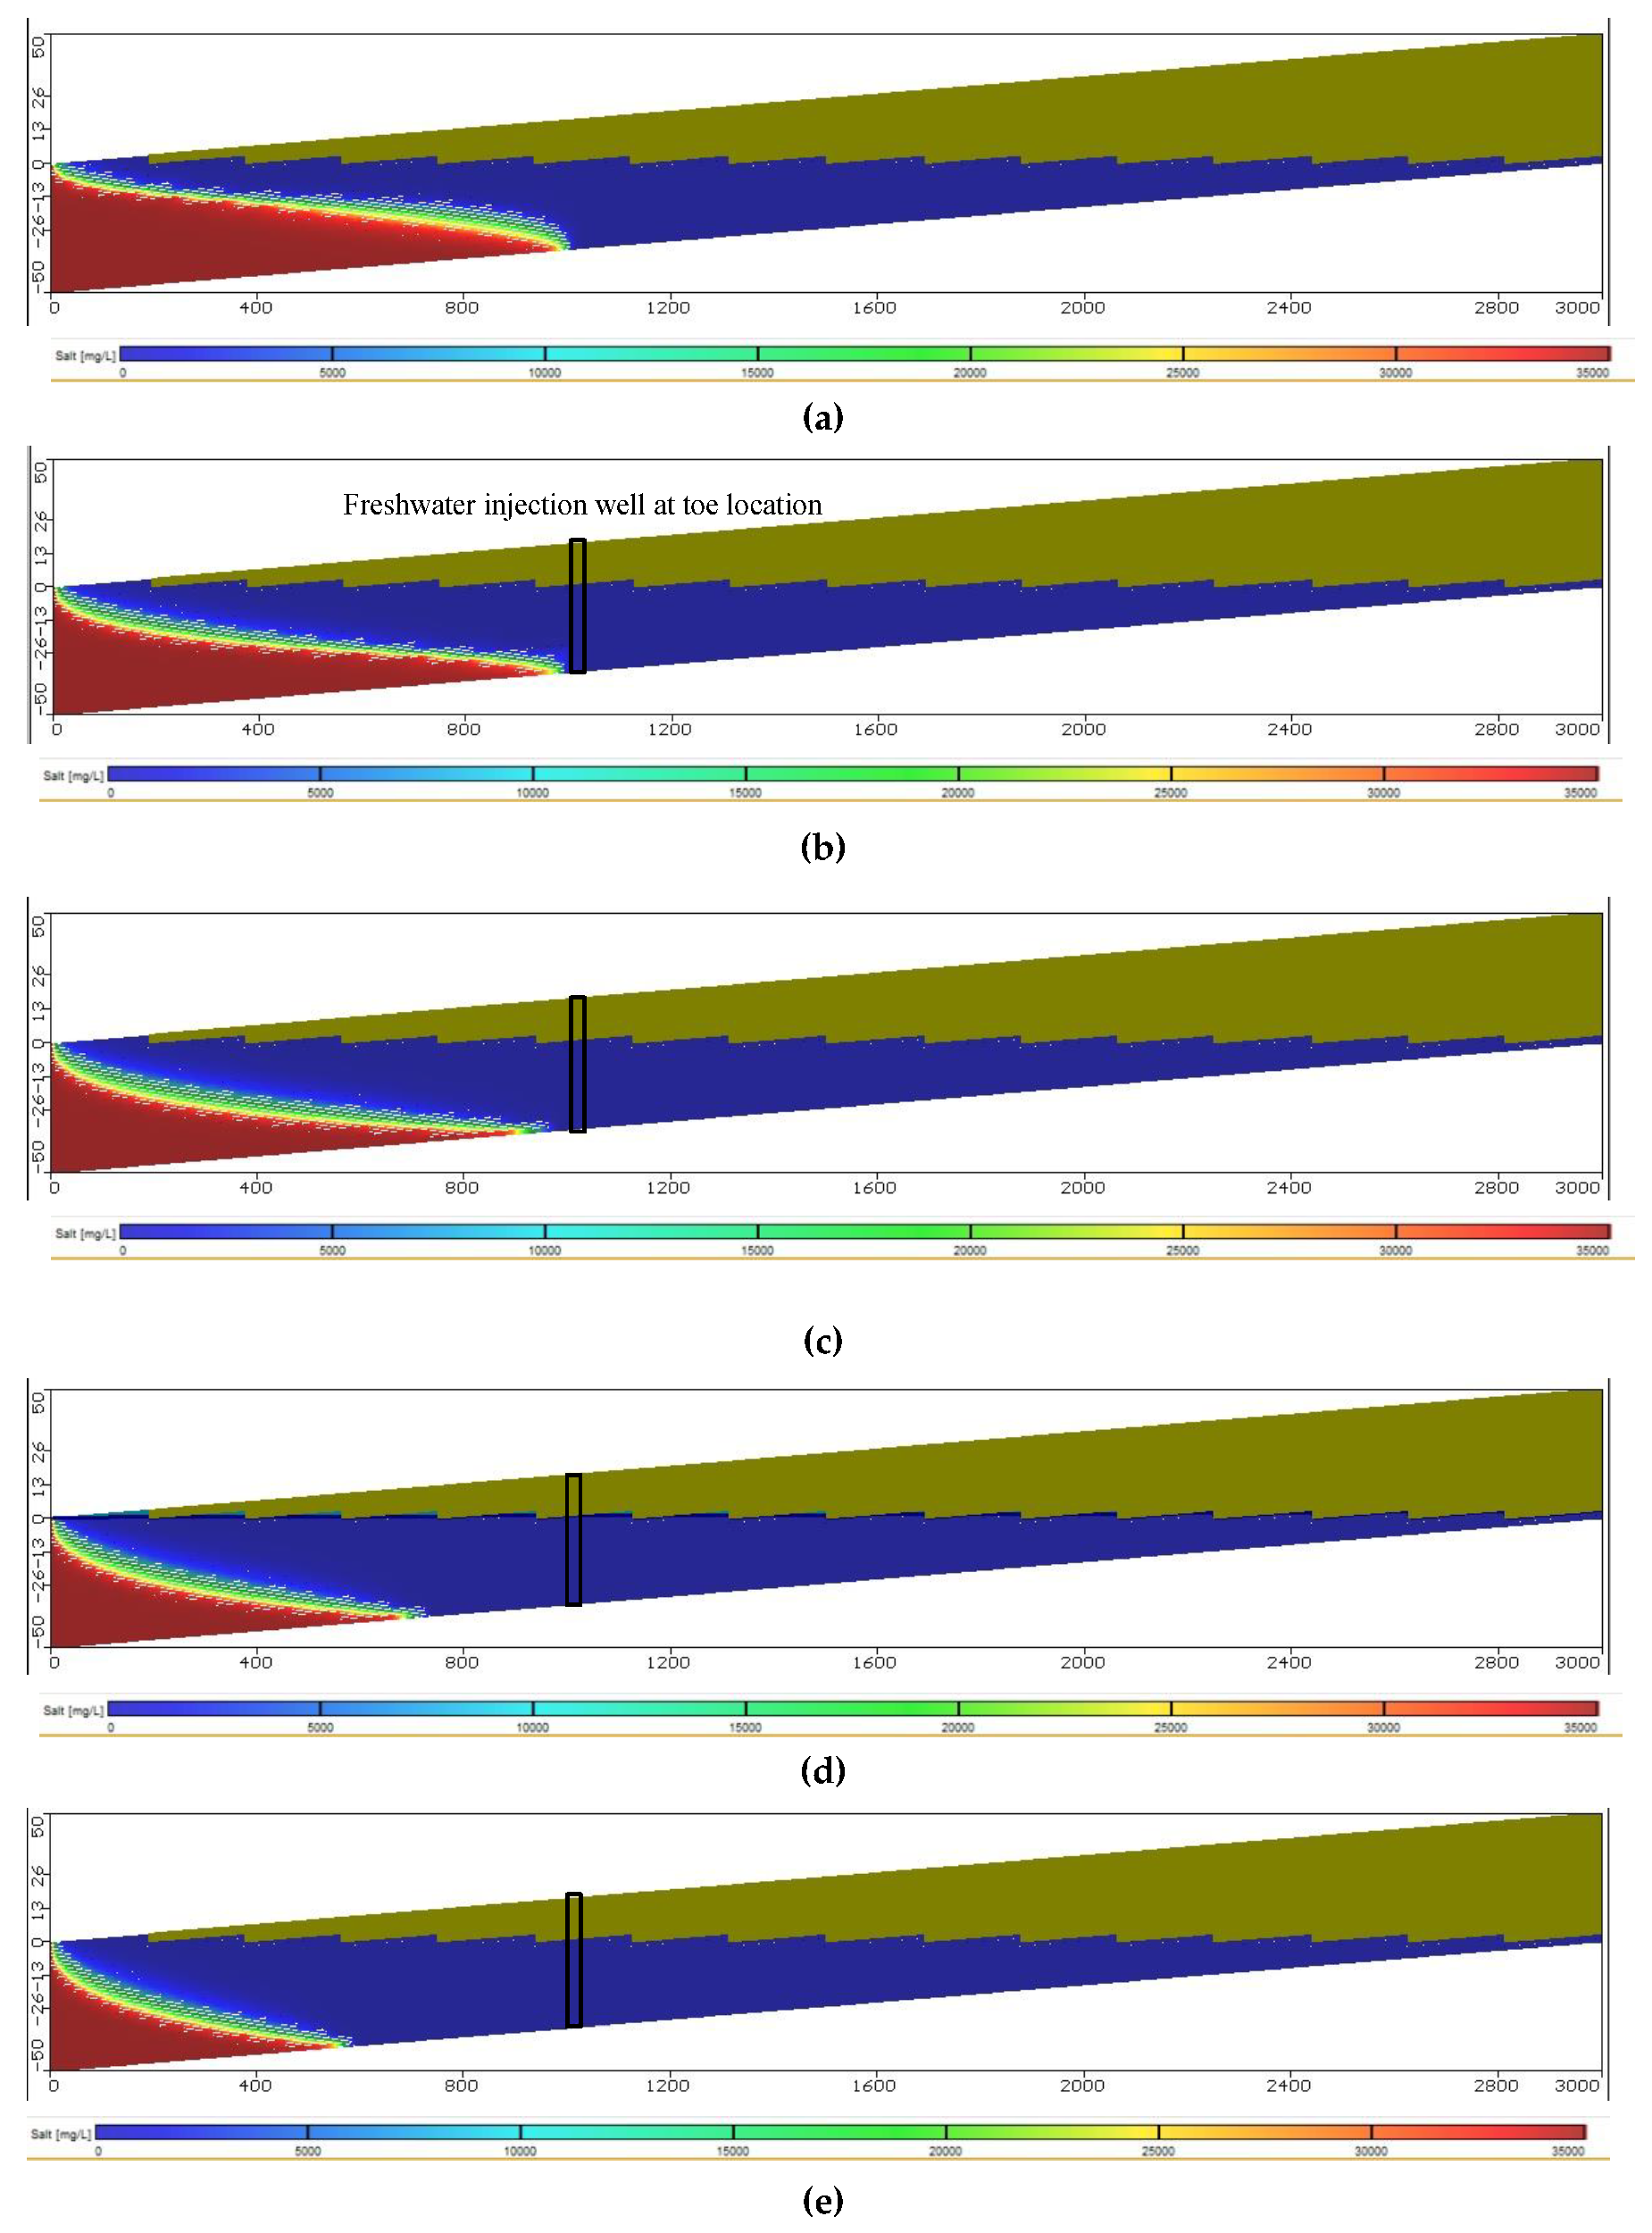
3.10. Case Study: the Akrotiri Coastal Aquifer, Cyprus

SEAWAT code was implemented in this research to simulate the SWI in the Akrotiri coastal aquifer, Cyprus, as well as the applicability of recharging water to control SWI. SEAWAT code was used to build a three-dimensional model of the Akrotiri coastal aquifer, Cyprus. Figure A3 shows the map of the Akrotiri coastal aquifer, Cyprus, [39]. Figure A4 presents the profile concept of the Akrotiri aquifer, Cyprus. The length of the model domain was equal to 3000 m with depth 100 m. The cell dimension of the model was set to 6 × 6 m in the X and Z axis. The height of saltwater equaled 50 m, the bed slope equaled 1.7%, and the rate of recharge equaled 83 mm/year. Table A4 presents the hydraulic parameters of the Akrotiri coastal aquifer, Cyprus, [39] and the SEAWAT numerical model data inputs. The hydraulic conductivity was set to 28 m/day, the specific yield equaled 0.2, and the freshwater and saltwater density equaled 988 and 1024 kg/m3, respectively. The model was run for the steady-state condition, for r=83 mm/year, and the flow inland boundary was 314 m3/year/m. The SWI wedge length equaled 990 m in the steady-state condition compared to 984.6 m in [39]. The results of SWI at the steady-state condition showed a good comparison between SEAWAT and the predicted value. After reaching the steady state, the model was tested for different recharging water rates through the well located at the toe position with Qi/Q ranging from 0.1 to 1.0. Figure A5 shows the saltwater intrusion distribution by the SEAWAT model for the Akrotiri coastal aquifer, Cyprus, at steady-state condition, recharging with rates Qi/Q = 0.4, Qi/Q = 0.6, Qi/Q = 0.8, and Qi/Q = 1.0.
Injection of water through the recharge well installed in the toe location of the Akrotiri coastal aquifer, Cyprus, caused the saltwater intrusion to retreat and increased the volume of freshwater in the aquifer. The results shown in Figure 14 and Figure A5 demonstrate that increasing the value of Qi/Q caused further saltwater recession and a decline in both the length of the SWI wedge and the corresponding wedge area. Figure 14a shows the relation between the repulsion ratio RL and Qi/Q with the recharging well installed at the toe position of the Akrotiri coastal aquifer, Cyprus. It can be stated that with the increase in the ratio of Qi/Q, the repulsion ratio increased. High values of RL were achieved with higher ratio rates of Qi/Q. The results confirmed that with Qi/Q below 50%, the lowest repulsion ratio of SWI could be achieved. Increasing Qi/Q from 0.1 to 1.0 led to an increase in the value of RL from 2.41% to 43.40%. The SWI length decreased from 990 m at the steady-state condition and reached 875, 792, 696, 612, and 563 m with Qi/Q equal to 0.5, 0.6, 0.7, 0.8, 0.9, and 1.0, respectively. The maximum repulsion ratio was achieved by recharging water with rate Qi/Q = 1.0. In respect of the SWI area, the achieved value of RA in the Akrotiri coastal aquifer, Cyprus, increased with a higher water recharge rate than Qi/Q = 0.4. Increasing the Qi/Q recharging rate forced the SWI wedge in the Akrotiri coastal aquifer, Cyprus, to move farther back to the seawater side. Increasing the Qi/Q from 0.4 to 1.0 led to an increased value of RA from 4.52% to 50.1%. The repulsion ratio of SWI RA was equal to 14.24%, 21.84%, 23.53%, 34.93%, 37.47%, and 50.10% for recharging water through wells with Qi/Q equal to 0.5, 0.6, 0.7, 0.8, 0.9, and 1.0, respectively. About more than half of the SWI wedge area in the Akrotiri coastal aquifer, Cyprus, was retreated with Qi/Q = 1.0, while recharging with the same ratio (Qi/Q = 1.0), forced the SWI in the Akrotiri coastal aquifer, Cyprus, to attenuate back from 990 to 563 m. The results of this research on the Akrotiri coastal aquifer, Cyprus, confirmed that recharging water through wells has a significant impact on controlling saltwater intrusion in a sloping unconfined coastal aquifer.

4. Conclusions

In this study, numerical simulations were performed using a SEAWAT model to study the impact of location and the applicability of recharge wells for controlling SWI in sloping unconfined coastal aquifers. The experimental dimensions of [11] were used considering three different sloping beds of the unconfined aquifer: horizontal, positive, and negative. The study investigated the effectiveness of recharge wells located outside the SWI wedge. The results confirmed that the repulsion ratio considering length RL and the area RA increased with the increase of the recharge rate ratios. Different injection locations were tested through numerical simulations. Further effective SWI repulsion ratios RL and RA were reached through recharging at the toe position. The repulsion ratios decreased if the injection point was located farther away from the toe position and higher than it. Injecting freshwater at the toe position created a hydraulic barrier from the aquifer bottom that forced the seawater to retreat farther. In respect of the sloping bed, injecting recharge water at the toe position achieved the highest RL in the positive unconfined aquifer followed by horizontal and negative slopes. On the other hand, the highest RA was achieved by injecting at the toe itself in the case of the horizontal aquifer, followed by negative and positive sloped aquifers. The seawater intruded more with the increase of the saltwater density, and as a consequence, the computed RL and RA decreased. Increasing (K) forced the saltwater to move more into the freshwater and decreased the values of RL and RA. The saltwater toe length decreased with the increase of the hydraulic gradient and led to raised RL and RA. The application of recharge wells is considered an effective method for controlling and mitigation of SWI in sloping unconfined coastal aquifers. Application of recharging water at the toe location in the Akrotiri coastal aquifer, Cyprus, achieved higher RL and RA with increased Qi/Q. Increasing Qi/Q to equal 1.0 led to a decrease of the SWI length from 990 to 563 m and also decreased the SWI area of the Akrotiri coastal aquifer, Cyprus, by more than half (50.1%).
The results from this research will help in future management, planning, and design considerations of artificial recharge well facilities to mitigate and control SWI in sloping unconfined coastal aquifers. The application of all research results to the actual onsite scenarios depends on the accurate prediction of the SWI extent and the location of the SWI toe; as a result, the significance of field monitoring and investigation should be emphasized. Our findings in the current study highlight the significant impact of recharging wells on controlling the SWI wedge in sloping bed aquifers. More research might be required that apply recharge wells on real cases considering the different characteristics of coastal aquifer properties and boundary conditions. Future studies should include the effect of tidal waves and the aquifer heterogeneity in controlling saltwater intrusion in sloping unconfined coastal aquifers.

Author Contributions

Conceptualization, Zaher Mundher Yaseen, A.M.A., and N.-A.A.; Data curation, A.M.A.; Formal analysis, Z.M.Y., A.M.A., and N.-A.A.; Investigation, Z.M.Y. and A.M.A.; Methodology, A.M.A.; Project administration, Z.M.Y.; Resources, A.M.A.; Software, A.M.A.; Supervision, N.-A.A.; Validation, A.M.A.; Writing—original draft, Z.M.Y., A.M.A., and N.-A.A.; Writing—review & editing, Z.M.Y., A.M.A., and N.-A.A. All authors have read and agreed to the published version of the manuscript.

Conflicts of Interest

The authors declare no conflict of interest.

Appendix A

Table A1. Parameter definitions.
ParameterDefinition
dDepth of unconfined coastal aquifer
LaLength of unconfined coastal aquifer
LoThe initial SWI wedge length
LThe SWI wedge after installing recharge well as a countermeasure
RLThe SWI repulsion ratio due to saltwater wedge length R=(Lo-L)/Lo
AoArea of saltwater wedge at steady state
AArea of saltwater wedge after installing the freshwater injection as a countermeasure
RAThe SWI repulsion ratio due to saltwater wedge length R=(Ao-A)/Ao
XiFreshwater recharge well distance
Xi/LoBarrier wall distance ratio
diDepth of recharge well
Tan (β)Bed sloping of unconfined coastal aquifer
di/dRecharge well depth ratio
QFlow rate
QiRecharge well rate
Qi/QRecharge well rate ratio
hsSaltwater head
hfFreshwater head
iHydraulic gradient
ρfFreshwater density
ρsSaltwater density
KHydraulic conductivity of unconfined coastal aquifer
Table A2. Input parameters for numerical simulation.
Input ParameterValues
Domain length60 cm
Domain height35 cm
Porosity0.40
Freshwater head31.20 cm
Saltwater head30.00 cm
Aquifer length60 cm
Freshwater density1000 kg/m3
Saltwater density1025 kg/m3
Freshwater concentration0.0 mg/l
Saltwater concentration35000 mg/l
Hydraulic conductivity1.31 cm/s
Longitudinal dispersivity1.0 mm
Transverse dispersivity0.1 mm
Molecular diffusion coefficient1 × 10−6 cm2/s
Cell size0.50 × 0.50 cm
Solution of the flow equation
Matrix solution techniquesPCG
Head convergence value1 × 10-7 m
Flow convergence value1 × 10-7 m/day
Advection termTVD
Courant number0.10
Dispersion and source termsGCG
Concentration convergence value1 × 10−7
Table A3. Tested numerical simulation range of effect of changing hydraulic parameter on repulsion ratio. R.
ParameterRange
Bed slope: tan (β)Negative slope: −0.03
Horizontal slope: 0.0
Positive slope: 0.03
Hydraulic conductivity K0.50, 0.70, 0.90, 1.10, and 1.31 cm/s
Saltwater head hs30.00 cm
Freshwater head hf30.80, 30.90, 31.00, 31.00, 31.20, and 31.30 cm
Hydraulic gradient i0.013 (0.80/60), 0.015(0.90/60), 0.016 (1.0/60), 0.018 (1.10/60), 0.02 (1.20/60), and 0.022 (1.30/60)
Saltwater density ρs1022, 1025, 1027, and 1030 kg/m3 with saltwater concentration equals
30,000, 35,000, 37,500, and 40,000 mg/L, respectively
Recharge wall depth ratio db/d5/30, 15/30, 25/30, and 30/30
Recharge well distance ratio Xb/Lo10/Lo, 20/ Lo, 30/ Lo, 40/ Lo, 50/ Lo, and toe position
Recharge well rate ratio Qi/Q0.10, 0.20, 0.30, 0.40, 0.50, 0.60, 0.80, and 1.0
Table A4. Hydraulic parameters of the Akrotiri coastal aquifer, Cyprus, (Koussis et al. 2012) and numerical model input.
ParameterValue
Impervious aquifer base slopeSin (β) = 0.017, tan (β) =0.0170025=1.70025%
Inland boundary inflow314 m3/year/m
Hydraulic conductivity28 m/day
Mean aquifer yield0.20
Aquifer length3000 km
Aquifer depth at coast50 m
Pumping location (Lw) 1000 m
Pumping rate375 m3/year/m
Natural recharge82 mm/year
Sloping aquifer toe location Lt (m)984.6 m
Freshwater density 988.275 kg/m3
Saltwater density1024 kg/m3
Solute concentration base100 mg/L
Freshwater concentration0.0 mg/L
Saltwater concentration35,000 mg/L
Longitudinal dispersivity2 m
Transverse dispersivity2 m
Cell dimension6x6 m
Aquifer width1 m
Figure A1. Retreating saltwater wedge: different hydraulic gradient and injection rates in positive unconfined aquifer (a): 0.80 and (b) 1.3 cm, (c), (d) in horizontal aquifer and (e) and (f) in negative aquifer.
Sustainability 12 02685 g0a1
Figure A2. Retreating saltwater wedge: different saltwater density and injection rates in positive unconfined aquifer (a) 1022 and (b) 1030 kg/m3, (c) and (d) in horizontal aquifer, and (e) and (f) in negative aquifer.
Sustainability 12 02685 g0a2
Figure A3. Map of the Akrotiri coastal aquifer, Cyprus [39].
Sustainability 12 02685 g0a3
Figure A4. Profile concept of the Akrotiri aquifer, Cyprus [39].
Sustainability 12 02685 g0a4
Figure A5. Saltwater intrusion distribution by SEAWAT model for the Akrotiri coastal aquifer, Cyprus: (a) steady state, (b) Qi/Q = 0.4, (c) Qi/Q = 0.6, (d) Qi/Q = 0.8, and (e) Qi/Q = 1.0.
Sustainability 12 02685 g0a5

References

  1. Barlow, P.M. Ground-Water Resources for the Future: Atlantic Coastal Zone; US Geological Survey, US Department of the Interior: Washington, DC, USA, 2000.
  2. Ma, J.; Zhou, Z.; Guo, Q.; Zhu, S.; Dai, Y.; Shen, Q. Spatial Characterization of Seawater Intrusion in a Coastal Aquifer of Northeast Liaodong Bay, China. Sustainability 2019, 11, 7013. [Google Scholar] [CrossRef] [Green Version]
  3. Sebben, M.L.; Werner, A.D.; Graf, T. Seawater intrusion in fractured coastal aquifers: A preliminary numerical investigation using a fractured Henry problem. Adv. Water Resour. 2015, 85, 93–108. [Google Scholar] [CrossRef]
  4. Aziz, S.A.; Zeleňáková, M.; Mésároš, P.; Purcz, P.; Abd-Elhamid, H. Assessing the Potential Impacts of the Grand Ethiopian Renaissance Dam on Water Resources and Soil Salinity in the Nile Delta, Egypt. Sustainability 2019, 11, 7050. [Google Scholar] [CrossRef] [Green Version]
  5. IPCC, W. Working Group I Contribution to the IPCC Fifth Assessment Report: Climate Change 2013: The Physical Science Basis, Summary for Policymakers; IPCC: Cambridge, UK; New York, NY, USA, 2013. [Google Scholar]
  6. Todd, D.K. Ground Water Hydrology; John Wiley & Sons: New York, NY, USA, 1959; p. 525. [Google Scholar]
  7. van Dam, J.C. Exploitation, Restoration and Management. In Seawater Intrusion in Coastal Aquifers—Concepts, Methods and Practices; Kluwer Academic Publishers: Dordrecht, The Netherlands, 1999; pp. 7–125. [Google Scholar]
  8. Oude Essink, G.H.P. Improving fresh groundwater supply—Problems and solutions. Ocean Coast. Manag. 2001, 44, 429–449. [Google Scholar] [CrossRef]
  9. Mantoglou, A. Pumping management of coastal aquifers using analytical models of saltwater intrusion. Water Resour. Res. 2003, 39. [Google Scholar] [CrossRef]
  10. Mantoglou, A.; Papantoniou, M. Optimal design of pumping networks in coastal aquifers using sharp interface models. J. Hydrol. 2008. [Google Scholar] [CrossRef]
  11. Luyun, R.; Momii, K.; Nakagawa, K. Effects of Recharge Wells and Flow Barriers on Seawater Intrusion. Ground Water 2011, 49, 239–249. [Google Scholar] [CrossRef]
  12. Vandenbohede, A.; Van Houtte, E.; Lebbe, L. Groundwater flow in the vicinity of two artificial recharge ponds in the Belgian coastal dunes. Hydrogeol. J. 2008. [Google Scholar] [CrossRef]
  13. Vandenbohede, A.; Lebbe, L.; Van Houtte, E. Artificial recharge of fresh water in the Belgian coastal dunes. In Proceedings of the 20th Salt Water Intrusion Meeting (SWIM-20), Naples, FL, USA, 23–27 June 2008; pp. 282–285. [Google Scholar]
  14. Armanuos, A.M.; Ibrahim, M.G.; Mahmod, W.E.; Takemura, J.; Yoshimura, C. Analysing the Combined Effect of Barrier Wall and Freshwater Injection Countermeasures on Controlling Saltwater Intrusion in Unconfined Coastal Aquifer Systems. Water Resour. Manag. 2019, 33, 1265–1280. [Google Scholar] [CrossRef]
  15. Lu, C.; Werner, A.D.; Simmons, C.T.; Robinson, N.I.; Luo, J. Maximizing Net Extraction Using an Injection-Extraction Well Pair in a Coastal Aquifer. Groundwater 2013. [Google Scholar] [CrossRef]
  16. Luyun, R.; Momii, K.; Nakagawa, K. Laboratory-scale saltwater behavior due to subsurface cutoff wall. J. Hydrol. 2009, 377, 227–236. [Google Scholar] [CrossRef]
  17. Mahesha, A. Conceptual Model for the Safe Withdrawal of Freshwater from Coastal Aquifers. J. Environ. Eng. 2009, 135, 980–988. [Google Scholar] [CrossRef]
  18. Kaleris, V.K.; Ziogas, A.I. The effect of cutoff walls on saltwater intrusion and groundwater extraction in coastal aquifers. J. Hydrol. 2013, 476, 370–383. [Google Scholar] [CrossRef]
  19. Mantoglou, A.; Papantoniou, M.; Giannoulopoulos, P. Management of coastal aquifers based on nonlinear optimization and evolutionary algorithms. J. Hydrol. 2004. [Google Scholar] [CrossRef]
  20. Ataie-Ashtiani, B.; Ketabchi, H. Elitist continuous ant colony optimization algorithm for optimal management of coastal aquifers. Water Resour. Manag. 2011, 25, 165–190. [Google Scholar] [CrossRef]
  21. Pool, M.; Carrera, J. A correction factor to account for mixing in Ghyben-Herzberg and critical pumping rate approximations of seawater intrusion in coastal aquifers. Water Resour. Res. 2011, 47. [Google Scholar] [CrossRef]
  22. Ketabchi, H.; Ataie-Ashtiani, B. Evolutionary algorithms for the optimal management of coastal groundwater: A comparative study toward future challenges. J. Hydrol. 2015, 520, 193–213. [Google Scholar] [CrossRef]
  23. Abd-Elhamid, H.F.; Javadi, A.A. A Cost-Effective Method to Control Seawater Intrusion in Coastal Aquifers. Water Resour. Manag. 2011, 25, 2755–2780. [Google Scholar] [CrossRef]
  24. Javadi, A.; Hussain, M.; Sherif, M.; Farmani, R. Multi-objective Optimization of Different Management Scenarios to Control Seawater Intrusion in Coastal Aquifers. Water Resour. Manag. 2015. [Google Scholar] [CrossRef] [Green Version]
  25. Guymon, G.L. Hydraulics of groundwater. Adv. Water Resour. 1980, 3, 193. [Google Scholar] [CrossRef]
  26. Bruington, A.E.; Seares, F.D. Operating a sea water barrier project. J. Irrig. Drain. Div. 1965, 91, 117–140. [Google Scholar]
  27. Hunt, B. Some analytical solutions for seawater intrusion control with recharge wells. J. Hydrol. 1985, 80, 9–18. [Google Scholar] [CrossRef]
  28. Werner, A.D.; Bakker, M.; Post, V.E.A.; Vandenbohede, A.; Lu, C.; Ataie-Ashtiani, B.; Simmons, C.T.; Barry, D.A. Seawater intrusion processes, investigation and management: Recent advances and future challenges. Adv. Water Resour. 2013, 51, 3–26. [Google Scholar] [CrossRef]
  29. Pool, M.; Carrera, J. Dynamics of negative hydraulic barriers to prevent seawater intrusion. Hydrogeol. J. 2009, 18, 95–105. [Google Scholar] [CrossRef]
  30. Silliman, S.E.; Borum, B.I.; Boukari, M.; Yalo, N.; Orou-Pete, S.; McInnis, D.; Fertenbaugh, C.; Mullen, A.D. Issues of sustainability of coastal groundwater resources: Benin, West Africa. Sustainability 2010, 2, 2652–2675. [Google Scholar] [CrossRef] [Green Version]
  31. Hussain, M.S.; Javadi, A.A.; Ahangar-Asr, A.; Farmani, R. A surrogate model for simulation–optimization of aquifer systems subjected to seawater intrusion. J. Hydrol. 2015, 523, 542–554. [Google Scholar] [CrossRef] [Green Version]
  32. Allow, K.A. The use of injection wells and a subsurface barrier in the prevention of seawater intrusion: A modelling approach. Arab. J. Geosci. 2012, 5, 1151–1161. [Google Scholar] [CrossRef]
  33. Motallebian, M.; Ahmadi, H.; Raoof, A.; Cartwright, N. An alternative approach to control saltwater intrusion in coastal aquifers using a freshwater surface recharge canal. J. Contam. Hydrol. 2019, 222, 56–64. [Google Scholar] [CrossRef]
  34. Lu, C.; Xin, P.; Kong, J.; Li, L.; Luo, J. Analytical solutions of seawater intrusion in sloping confined and unconfined coastal aquifers. Water Resour. Res. 2016, 52, 6989–7004. [Google Scholar] [CrossRef]
  35. Abdoulhalik, A.; Ahmed, A.A. The effectiveness of cutoff walls to control saltwater intrusion in multi-layered coastal aquifers: Experimental and numerical study. J. Environ. Manag. 2017, 199, 62–73. [Google Scholar] [CrossRef] [Green Version]
  36. Guo, W.; Langevin, C.D. User’s Guide to SEAWAT: A Computer Program for Simulation of Three-Dimensional Variable-Density Ground-Water Flow; US Geological Survey Techniques of Water Resources Investigations 6-A7; US Geological Survey: Tallahassee, FL, USA, 2002; ISBN 0607992573.
  37. Simpson, M.J.; Clement, T.P. Improving the worthiness of the Henry problem as a benchmark for density-dependent groundwater flow models. Water Resour. Res. 2004, 40. [Google Scholar] [CrossRef]
  38. Simpson, M.J.; Clement, T.P. Theoretical analysis of the worthiness of Henry and Elder problems as benchmarks of density-dependent groundwater flow models. Adv. Water Resour. 2003, 26, 17–31. [Google Scholar] [CrossRef]
  39. Koussis, A.D.; Mazi, K.; Destouni, G. Analytical single-potential, sharp-interface solutions for regional seawater intrusion in sloping unconfined coastal aquifers, with pumping and recharge. J. Hydrol. 2012, 416, 1–11. [Google Scholar] [CrossRef]
Figure 1. Conceptual model of saltwater intrusion in sloping bed unconfined aquifer: (a). Negative, (b). Horizontal, and (c). Positive.
Sustainability 12 02685 g001
Figure 2. Model dimension.
Sustainability 12 02685 g002
Figure 3. Comparison between saltwater wedge for model calibration: (a) steady state and (b) injection through well Qi/Q = 0.2.
Sustainability 12 02685 g003
Figure 4. Repulsion ratio of seawater intrusion in positive sloping bed unconfined aquifer (tan β = 0.03) based on location of injection points for different injection rate ratios Qi/Q: (a) 10%, (b) 20%, (c) 30%, (d) 40%, and (e) 50%.
Sustainability 12 02685 g004
Figure 5. Repulsion ratio of seawater intrusion in horizontal sloping bed unconfined aquifer (tan β = 0.0) based on location of injection points for different injection rate ratios Qi/Q: (a) 10%, (b) 20%, (c) 30%, (d) 40%, and (e) 50%.
Sustainability 12 02685 g005
Figure 6. Repulsion ratio of seawater intrusion in negative sloping bed unconfined aquifer (tan β = −0.03) based on location of injection points for different injection rate ratios Qi/Q: (a) 10%, (b) 20%, (c) 30%, (d) 40%, and (e) 50%.
Sustainability 12 02685 g006
Figure 7. Repulsion ratio of seawater intrusion in horizontal sloping bed unconfined aquifer (tan β = 0.0) based on location of injection points for different injection rate ratios Qi/Q: (a) 10%, (b) 20%, (c) 30%, (d) 40%, and (e) 50%.
Sustainability 12 02685 g007
Figure 8. Repulsion ratio of seawater intrusion in positive sloping bed unconfined aquifer (tan β = 0.03) based on location of injection points for different injection rate ratios Qi/Q: (a) 10%, (b) 20%, (c) 30%, (d) 40%, and (e) 50%.
Sustainability 12 02685 g008
Figure 9. Repulsion ratio of seawater intrusion in positive sloping bed unconfined aquifer (tan β = −0.03) based on location of injection points for different injection rate ratios Qi/Q: (a) 10%, (b) 20%, (c) 30%, (d) 40%, and (e) 50%.
Sustainability 12 02685 g009
Figure 10. Repulsion ratio (RL) for different saltwater density and injection rates in (a) positive, (b) horizontal, and (c) negative sloping aquifer and RA for different saltwater density and injection rates in (d) positive, (e) horizontal, and (f) negative sloping aquifer.
Sustainability 12 02685 g010
Figure 11. Repulsion ratio (RL) for different hydraulic conductivity and injection rates in (a) positive, (b) horizontal, and (c) negative sloping aquifer and RA for different hydraulic conductivity and injection rates in (d) positive, (e) horizontal, and (f) negative sloping aquifer.
Sustainability 12 02685 g011aSustainability 12 02685 g011b
Figure 12. Repulsion ratio (RL) for different head difference and injection rates in (a) positive, (b) horizontal, and (c) negative sloping aquifer and (RA) for different head difference and injection rates in (d) positive, (e) horizontal, and (f) negative sloping aquifer.
Sustainability 12 02685 g012aSustainability 12 02685 g012b
Figure 13. Retreating saltwater wedge: different hydraulic conductivity and injection rates in positive unconfined aquifer (a) 0.70 cm/s and (b) 1.1 cm/s, (c) and (d) in horizontal aquifer, and (e) and (f) in negative aquifer.
Sustainability 12 02685 g013
Figure 14. Correlation between injection freshwater rate (Qi/Q) with (a) seawater intrusion (SWI) repulsion ratio length (RL) and (b) SWI repulsion ration area (RA) for injection at the toe location in the Akrotiri coastal aquifer, Cyprus.
Sustainability 12 02685 g014

