Analysis of the Behaviors of Polish Consumers in Relation to Food Waste


Department of Food Gastronomy and Food Hygiene, Institute of Human Nutrition Sciences, Warsaw University of Life Sciences—SGGW, Nowoursynowska 159C St., 02-776 Warsaw, Poland
*
Author to whom correspondence should be addressed.
Sustainability 2020, 12(1), 304; https://doi.org/10.3390/su12010304
Submission received: 3 December 2019
/
Revised: 20 December 2019
/
Accepted: 27 December 2019
/
Published: 30 December 2019
(This article belongs to the Special Issue Food Security and Sustainable Rural Development: Exploiting Potential Functional Foods with High Health-Impact as an Example of Biodiversity Integration and Conservation)
Abstract
:Food waste occurs at all stages of the food chain, but it is households in developed countries that have the largest share in the production of food waste. In order to develop and implement effective programs to combat consumers throwing away food, the factors that determine food waste in a household must first be known. The purpose of this study was to assess the risk of food waste by Polish consumers and identify the effect of demographics on the respondents’ behavior related to food management. The results show that factors such as age, gender, place of residence, and education influence consumer behavior in terms of food management at home. It was found that young people and those with university-level education were more likely to buy unplanned products and waste food. The causes of the risk of wasting food were identified and their frequency determined. The most common causes for the risk of food waste include food being spoiled, missing the expiry date, and failure to arrange food in cabinets according to the expiry date. Bread was the most frequently wasted product, especially by young respondents.
1. Introduction
With the dynamic developmental changes and the universal globalization of food markets, what remains a constant value for humans is satisfying the basic physiological needs, understood, among others, as the right to free access to safe food. In developed countries, the supply of food exceeds demand. Changes in lifestyle are also observed in the direction of the spreading idea of consumerism and the increasing popularity of nutritionally irrational behaviors.
As Abdelradi [1] claims, there is no commonly agreed definition of food losses and food waste (FLW). In the global literature, the terms “food waste” and “food losses” are variously defined [2,3,4,5,6]. One definition describes food waste as the surplus of traded food leads to its waste in the stages of retail sale, catering and households, which is understood as a reduction in the weight of food that was destined for consumption by humans [7].
Food waste occurs in all stages of the food chain, but it is households in developed countries that have the largest share in the production of food waste. According to the FUSIONS report “Food waste data set for EU-28,” the 28 EU countries generated ca. 87.6 million tonnes of food waste in 2012 (±13.7 million tonnes), of which households are responsible for approximately 53% [4]. Based on EUROSTAT data from 2006, significant differences in food waste production by households can be observed between the then 27 EU countries. This range was from 25 kg/person/year to 133 kg/person/year. In Poland, there was 54 kg of food waste per person/per year [6].
In 2011, the European Commission also set the goal of reducing food waste by half by 2020 [8]. In 2011, the European Commission also set the goal of reducing food waste by half by 2020 [4]. In accordance with Goal Target 12.3 of the United Nations General Assembly, the amount of global food loss and waste in retail and consumption should be halved by 2030 [9]. Reducing food waste, especially at the level of consumers, is considered to be one of the most important actions necessary to improve the quality of the natural environment [10,11] as well as food security [12]. As noted by Romani et al. [13], consumers are not only aware of the problems associated with food waste but also see their active role in preventing it. The analysis by Schanes et al. [14] showed that it is necessary to raise consumers’ awareness of the social and environmental consequences of food waste. As Kosseva and Webb [15] correctly note, reducing food waste in developed countries is a major challenge, as it involves changing consumer attitudes and behaviors. In order to achieve this goal, research is of key importance to help diagnose the factors that lead to food waste.
According to Russell et al. [16], research of consumer behaviors in terms of food waste is less popular than researching the amount of food wasted. Although in recent years many studies have been published with a specific focus on consumer behavior [13,17,18,19], but, as Bravi et al. [17] suggest, the existing literature still shows potential limits, especially research on household food waste.
Nevertheless, the key element is to identify the factors that influence the level of food waste in households [20]. A good understanding of the factors determining food waste in households [21] will allow for the development and implementation of effective educational programs addressed to consumers, which will help reduce this detrimental phenomenon. Therefore, food waste is an important subject for scientists, practitioners, and decision-makers interested in consumers’ nutritional preferences.
According to Stancu et al. [22], routines related to planning, shopping, and reuse of leftovers are the main drivers of food waste. Using a shopping list helps to make purchasing a planned activity [18]. In addition, meal planning helps to avoid excessive shopping, caused by, among other factors, marketing promotions [13]. However, the important role of cooking skills should be emphasized, which play an important role in food provisioning [23]. Generally, planning routines, especially checking inventories, can also contribute to lower food waste [24].
Another important aspect of the issue which Romani et al. [13] draw attention to is proper storage practices. Such practices are associated with consumer knowledge concerning storage conditions [25]. According to Bravi et al. [17], improper food management in the home positively affects the frequency of household food waste. Cooking excessive amounts can make food inedible if is improperly stored and/or not used in new meals [26,27,28]. Older people are generally more skilled and experienced in using leftovers [25,29,30]. Acknowledgement that food is thrown away seems to be indirectly related to the respondent’s age, as can be found in the Waste & Resources Action Programme (WRAP) Report [31]. However, it should be emphasized that, in addition to sociodemographic features (e.g., age, gender, place of residence), psycho-social factors also affect food waste. Ajzen [32] showed that the theory of planned behavior can help predict and explain consumer intentions and behavior. The Theory of Planned Behavior was developed by Stancu et al. [22] to explain the intention not to waste food.
Although the number of studies of food waste at the household stage has increased in recent years, e.g., in Europe as well as in the United States, to date, there have been no studies on this subject conducted on a representative sample in Poland. Only a few studies are available, which were conducted on a small sample.
The goal of this study was to assess the risk of food waste by Polish consumers and to identify how demographic factors (age, gender, place of residence, education) influence the behavior of respondents in relation to food waste.
2. Materials and Methods
2.1. Sample Collection
The survey was conducted in February and March 2019, among a group of 1115 adult consumers using computer-assisted personal interviews (CAPI). The selection of the sampling from the address survey of Central Statistical Office in Poland fulfilled the condition of representativeness of the general population of Polish people older than 18 years in terms of gender, age, and the size of the place of residence. In the first phase of sample selection, territorial stratification was carried out taking into account 16 voivodships and six size classes of localities. For the localities identified in the previous stage, addresses were randomly selected from the TERYT register, i.e., the National Official Register of the Territorial Division of the Country, kept by Statistics Poland [33]. In the final phase, demographic features (gender and age) were adjusted for each locality size class.
The detailed sociodemographic characteristics of respondents and abbreviations used in text are presented in Table 1.
2.2. Questionnaire
The study was conducted using a specially designed questionnaire, which consisted of two sections. The first section contained questions on consumer behavior in relation to food. This part of the questionnaire included questions regarding frequency, where most answers used a 5-degree scale with boundary terms ranging from “always” to “never.” These were related to such things as checking cabinets/refrigerator before shopping, preparing a shopping list, purchasing unplanned products, shopping in bulk, and purchasing products with a very short expiry date, preparing meals at home, handling food at home, the method of serving meals, using elements of previously served meals in other meals. These topics were selected on the basis of the literature [13,18,23], which shows that these aspects affect food waste in households.
In the question concerning the frequency of buying food products, a 5-degree scale was applied: every day, every other day on average, 1–2 times a week on average, 1–2 times a month on average, less frequently than once a month, I do not buy. In the case of the two questions concerning the frequency of throwing away food products and meals, the answers were based on a 4-degree scale (often—sometimes—rarely—never). When asked about the types of food products purchased and the reasons for throwing food away, respondents could indicate several answers. The question on the relevance of the expiry date on the packaging, a 5-degree scale was used, from “definitely agree” to “definitely disagree.”
The scale was deliberately differentiated and adapted to the type of question. In the question regarding the frequency of discarding food, the scale was reduced by one point (the answer “never” was eliminated), as it was assumed that no one would buy good items with the intent to throw them away daily.
The second section contained questions concerning the demographic and social affiliation of respondents: gender, age, residency (place of origin), education level.
2.3. Statistical Analysis
As there were no normal distributions, the analysis of the differentiation of answers was based on a quantitative scale depending on sociodemographic features was performed using:
- Mann–Whitney’s U-test—differentiation of results depending on gender,
- Kruskal–Wallis test—differentiation of results depending on age, education, and place of residence.
To find out whether the metric features differentiate the answers to the questions based on the qualitative-dichotomous scale, calculations were performed using the chi-quadratic independence test. For the interpretation of statistically significant correlations, the percentage occurrence of indications in a given response category was used by comparison of segments of respondents. On the basis of the test probability p-value, the decision was made to reject or accept the null hypothesis on the influence of a socio-demographic feature on the examined factor.
In order to verify the dependence between two independent factors, the chi-quadratic independence test was applied.
All tests were done using Statistica software version 12.1 PL (StatSoft, Krakow, Poland).. Significance was identified when p < 0.05.
3. Results
3.1. Estimation of the Risk of Wasting Food Products by Polish Consumers
The clear majority of respondents declared that they throw away food due to spoilage (65.2%) and having missed the expiry date (42%). Nearly a quarter of the respondents wasted food because they prepared too much of it (26.5%) or bought too much (22.2%). Missing the expiry date depended on the place of residence (p = 0.000) and education (p = 0.019), while preparing too much food depended on the place of residence (p = 0.000). A higher percentage of persons with secondary and university-level education wasted food because they missed the expiry date than did persons with other levels of education (P:30.1%; BV:39.3%; S:45.7%; H:42.5%). On the other hand, the highest percentage of residents of cities with over 500,000 inhabitants declared that they missed the expiry date. Food wasted due to preparing too much of it was the most common among residents of cities of between 200,000 and 500,000 residents
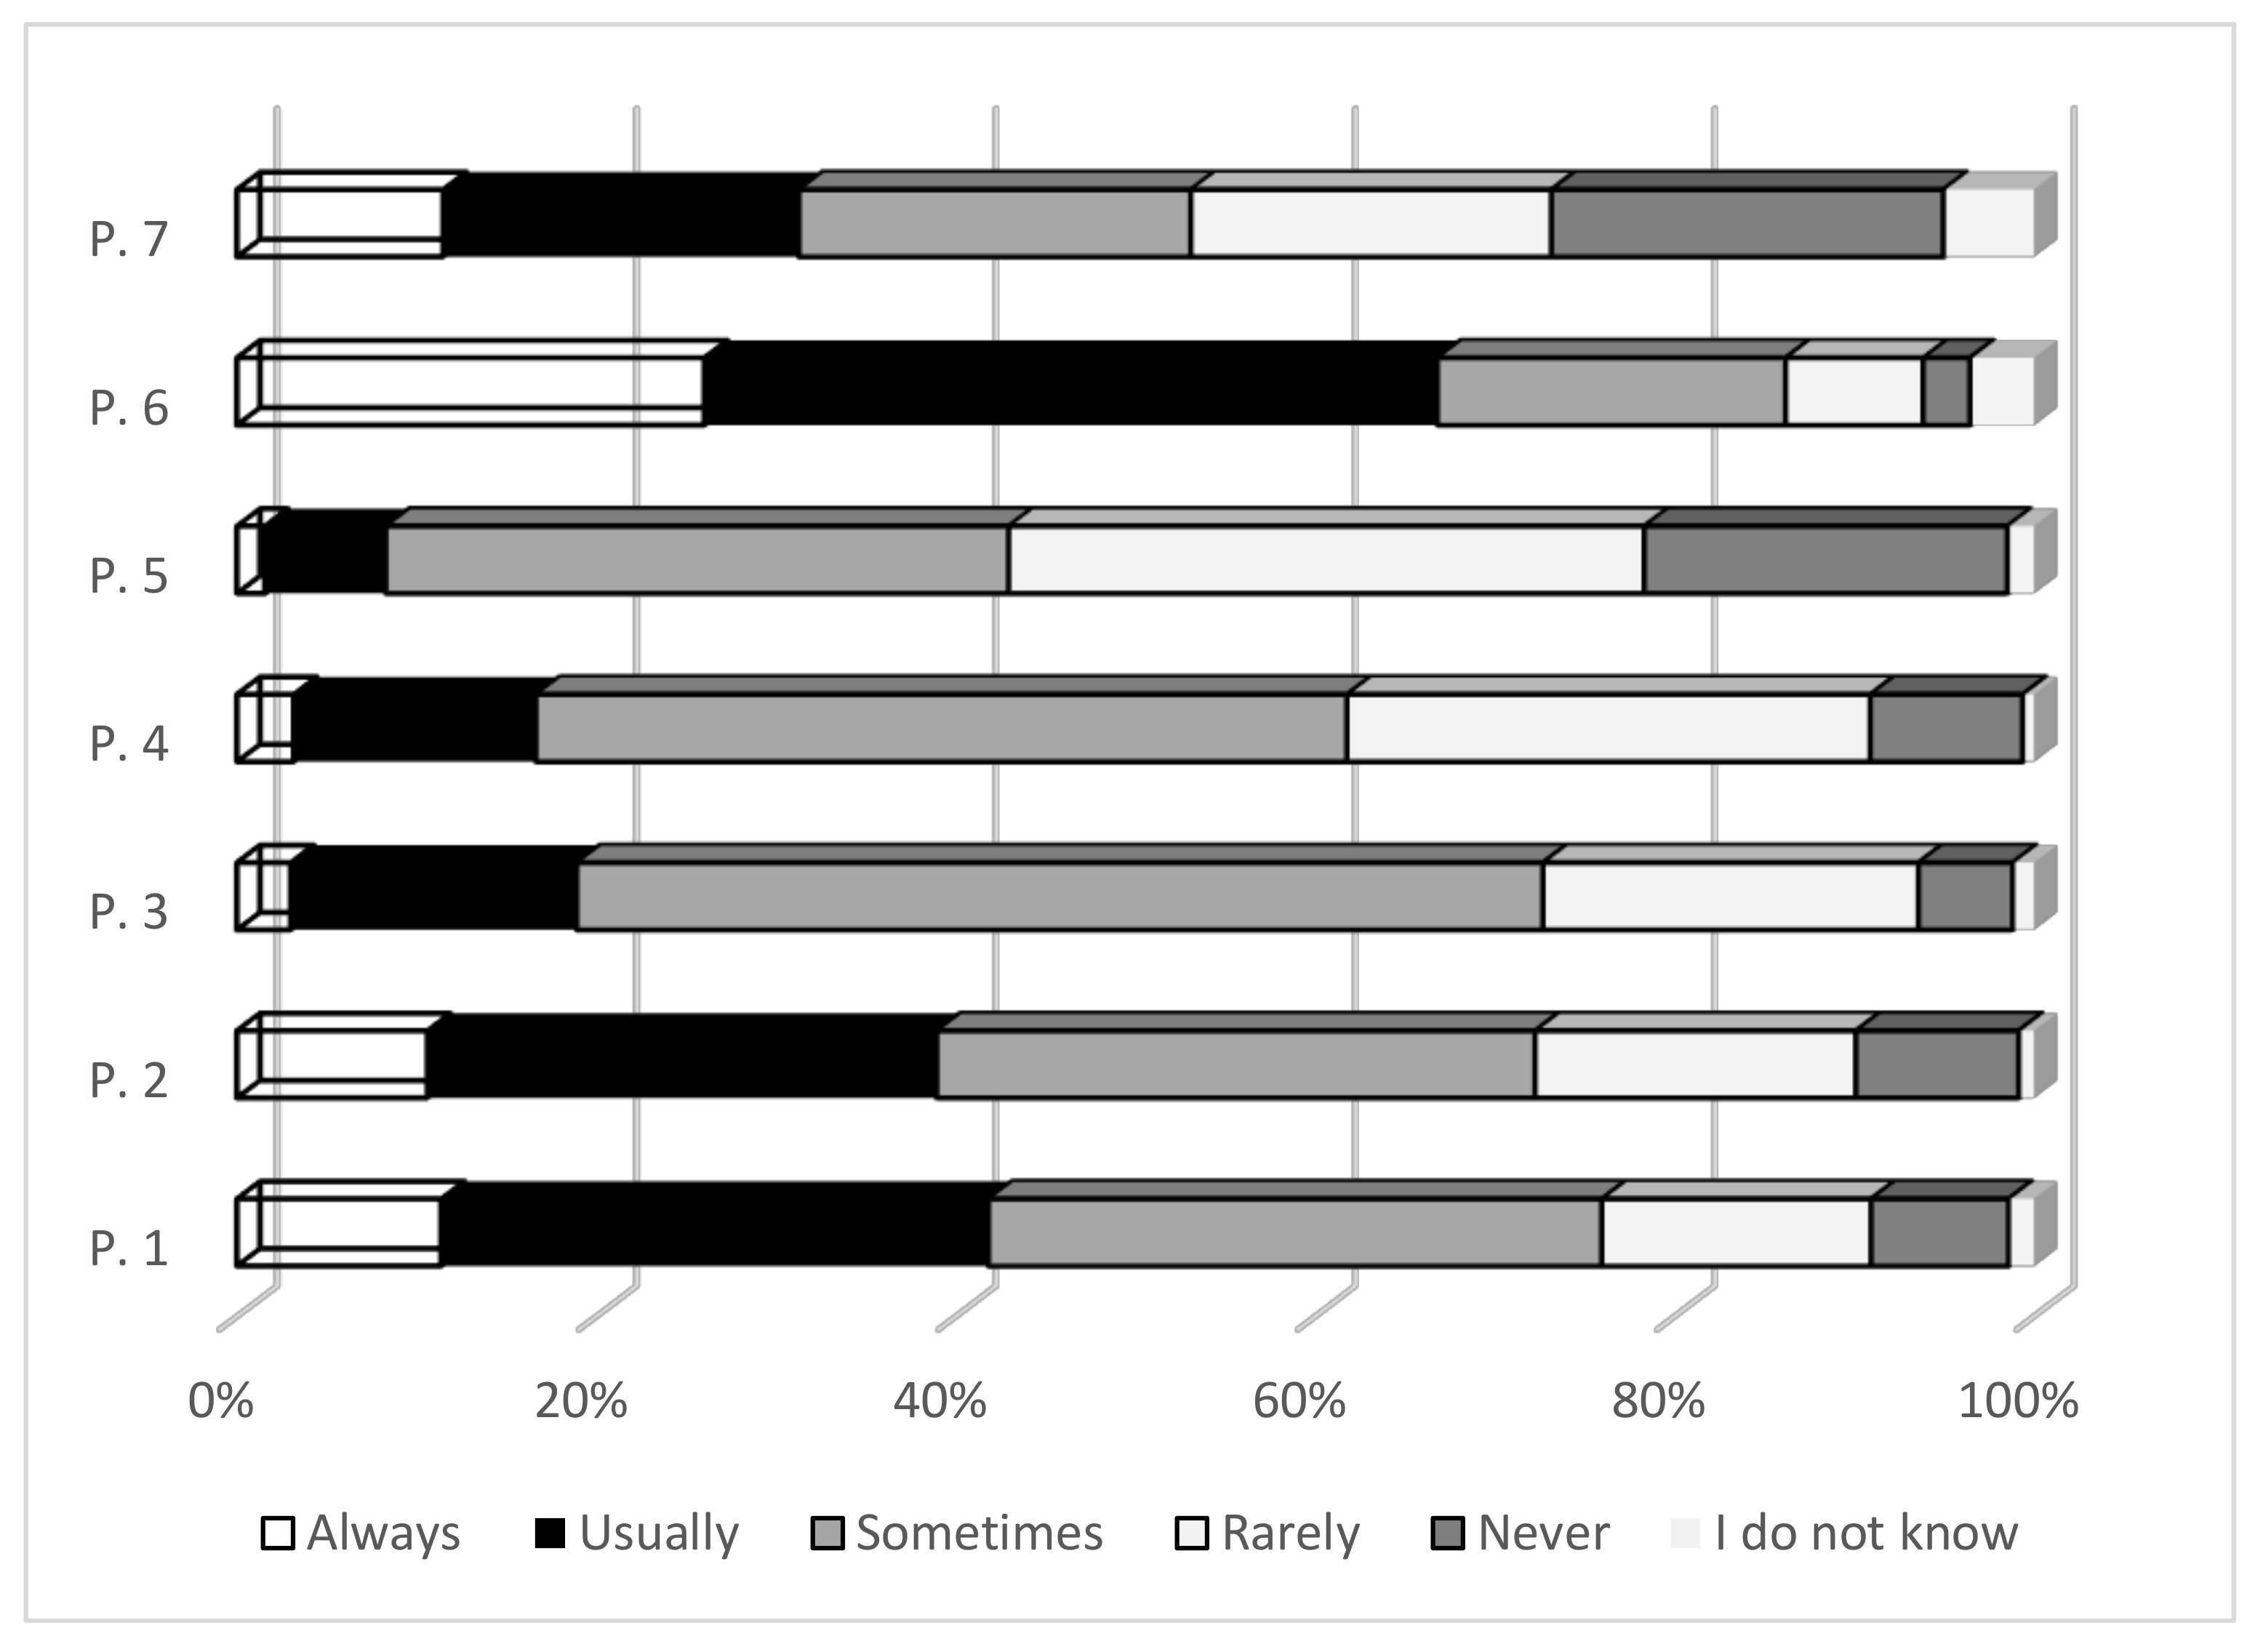
Nearly a quarter of consumers declared that they did not really check their household inventory or make a shopping list before shopping (answers “never” and “rarely”) (Figure 1). One in five respondents “always” or “usually” bought products they did not plan to buy. A relatively small percentage of respondents declared that they “always” or “usually” bought food in bulk or with a very short shelf life at a reduced price.
A correlation was found between purchasing products with a very short expiry date at a reduced price and the significance of the expiry date on the packaging (p = 0.0005). For the respondents who bought such products more often, the information regarding the expiry date on the packaging was more important. The vast majority of respondents (92.1%) declared that such information was “important and rather important” for them. The influence of the place of residence (p = 0.025) and education (p = 0.007) was observed. This piece of information was definitely “significant” and “rather important” for more people with university-level education than for others and for residents of large cities, than for others.
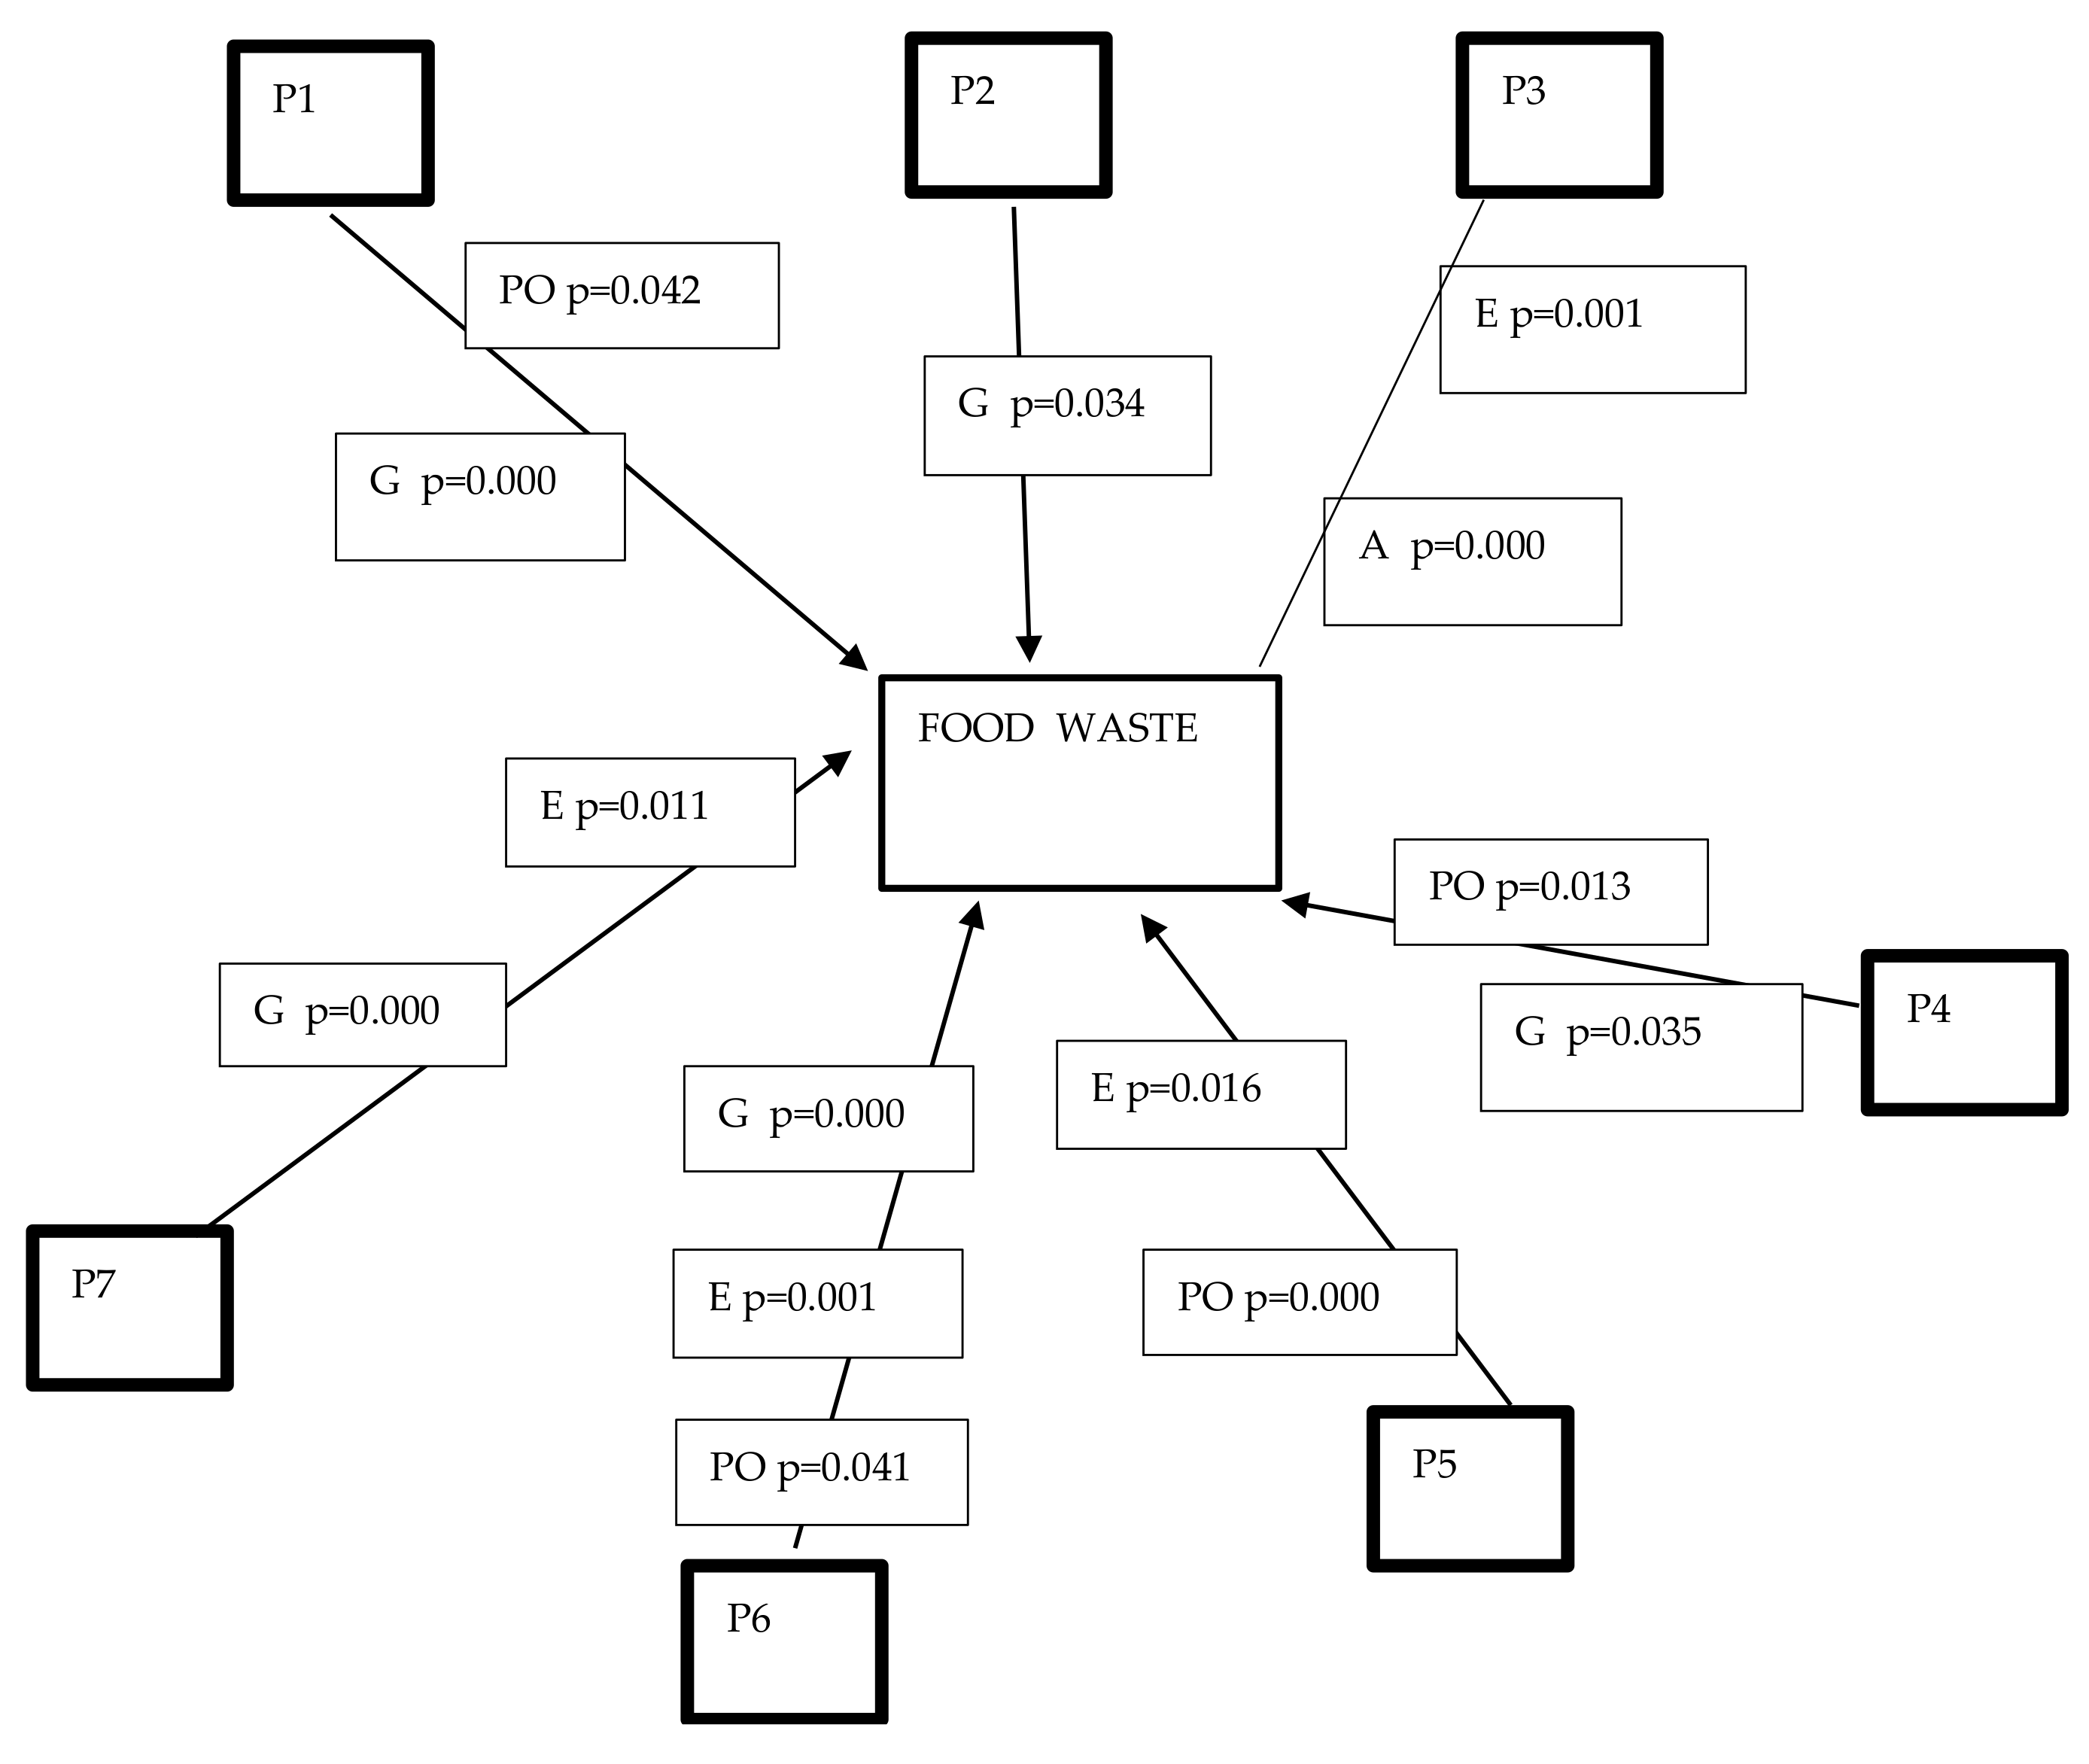
A higher percentage of men declared that they rather do not check (answers “rarely and never”) the contents of cabinets and fridges before shopping (W:18.6%; M:28.2%) or prepare a shopping list (W:24.35%; M:30.6%). On the other hand, a lower percentage of men declared buying food in bulk (answers “always and usually” W:16.8%; M:16.4%). People with primary education and residents of cities of up to 50,000 population declared more frequent purchases of products with a very short expiry date at a reduced price (answers “always and usually”). People with university-level education (P:13.5%; BV:14.8%; S:20.3%; H:24.1%) and the youngest (A:33.5%; B:23.2%; C:20.4%; D:16.0%; E:12.7%) more often bought products they did not plan to buy (answers “always and usually”). Residents of cities from 100,000 to 200,000 (26.9%) and rural areas (26.3%) check the home stocks least frequently before shopping, while most often—the inhabitants of small towns (14.8%). On the other hand, residents of cities up to 50,000 residents (22.8%) most often buy in bulk. These correlations are presented in Figure 2.
The vast majority of consumers “always or usually” store food according to the producer’s recommendations. One in ten respondents declared that they rather do not observe (answers “never or rarely”) the storage conditions indicated by the producer on the packaging, and one in five respondents—that they do so “sometimes.”
Arranging products in a refrigerator or cabinet according to expiry date, e.g., those with the nearest date closest to the door is not commonly practiced in Polish households. Almost the same percentage of respondents declared that they “never, rarely or sometimes” do so (Figure 1). Gender and education influenced the observance of storage conditions and the proper arrangement of products (Figure 2).
Men less frequently (answers “rarely and never”) either observed storage conditions (W:7%; M:13.6%) or properly arranged products in cabinets (W:36.8%; M:42.7%). People with primary education less frequently (answers “rarely and never”) observed storage conditions (P:21.1%; BV:11.4%; S:9.65%; H:5.0%) or properly arranged products in cabinets (P:47.1%; BV:41.3%; S:42.6%; H:38.8%). In contrast, residents of large cities were the least likely to observe storage conditions.
There was a correlation between arranging products in cabinets/fridge according to the expiry date and missing the expiry date (p = 0.00191). People who were less likely to do so were more likely to throw away food for this reason.
In the next step, it was analyzed how often products that were among the most frequently thrown away were bought and whether they were bought in bulk at the same time. The frequency of throwing away particular groups of products was analyzed. Of 32 product groups, 16 groups were thrown away by at least 6% of respondents with the frequency indicated as “frequently and sometimes.” Bread was the most frequently wasted product by the Polish respondents (Table 2). Almost 13% of respondents “frequently and sometimes” threw away smoked meats, vegetables except for root vegetables, dairy beverages, and fresh fruit. There was no correlation between the frequency of throwing away products and gender. It can be assumed that both women and men make the decision in a household regarding “throw away” food.
In the case of five groups of products, however, age influenced the frequency of throwing food away (Table 2). The youngest persons were less likely to throw away cream, root vegetables, while the oldest persons threw away bread, fresh fruit, and cottage cheese. Bread was more often wasted by people aged 18–24 years. Education influenced the frequency of throwing away four groups of products. People with primary education were less likely to throw away bread, dairy beverages, cottage cheese, and those with vocational education less likely to throw smoked meats away. In addition, the place of residence had a significant impact on the frequency of throwing food away. Most products were thrown away less frequently by residents of cities with more than 500,000 inhabitants.
Polish consumers most often bought durable products in bulk (Table 2). Among the ten groups of products most frequently purchased in bulk, only three belonged to products most frequently thrown away, i.e., cereal products, potatoes, and milk. Two products most often wasted in households included products purchased in bulk by a small percentage of respondents (bread was purchased in bulk by 5.5% of respondents and smoked meats by 6.2%). Gender and education (except for beverages) had no significant impact on purchases for stock. Root vegetables and cereal products were rarely bought “in bulk” by the youngest respondents. The place of residence influenced the way of buying of potatoes, cream, and cereal products.
The frequency of buying products most often wasted was checked. Products such as bread, milk, fresh fruit, and smoked meats were bought by respondents with high frequency (Table 2). The vast majority of respondents bought bread every day or every other day on average. The most frequent buyers were people aged 35–44 and the least frequent being the oldest. At the same time, it should be noted that bread was the most frequently thrown out product by almost one-fourth of respondents. Similarly, smoked meats and fresh fruit were often bought and also belonged to products frequently thrown away. Products bought in bulk were not often wasted by the respondents.
3.2. Estimation of the Risk of Food Waste by Polish Consumers
More than half of all respondents (53.3%) “always and usually” prepare meals at home. This depended on gender, age, education (p = 0.000). It should be noted that women (W:80.7%; M:24.6%), the elderly (A:30.3%; B:49.8%; C:54.0%; D:54.4%; E:63.0%) and those with university-level education prepared meals at home more often
Over a quarter of respondents (27.3%) “rarely or never” serve meals in such a way that everyone can choose the size of the portion, and almost half (46.01%) “always or usually” do so (Figure 2). Small town residents were the least likely to serve meals collectively (p = 0.017).
Nearly one in five respondents declared that they “often and sometimes: waste unused meals (Table 3). One in five respondents declared that they “often and sometimes” waste cooked potatoes, rice and pasta. The lowest percentage of respondents declared wasting sandwiches prepared for school/work and soup meat. More than one-third of respondents rather did not use the uneaten meals to prepare other meals (Table 3). The highest percentage of respondents declared that they rather did not use previously cooked vegetables. Waste and use of all meal groups depended on age, and less on the place of residence and education (Table 4). It was found that the oldest respondents were the least likely to throw away all groups of meals and most often used them to prepare other meals (Table 4).
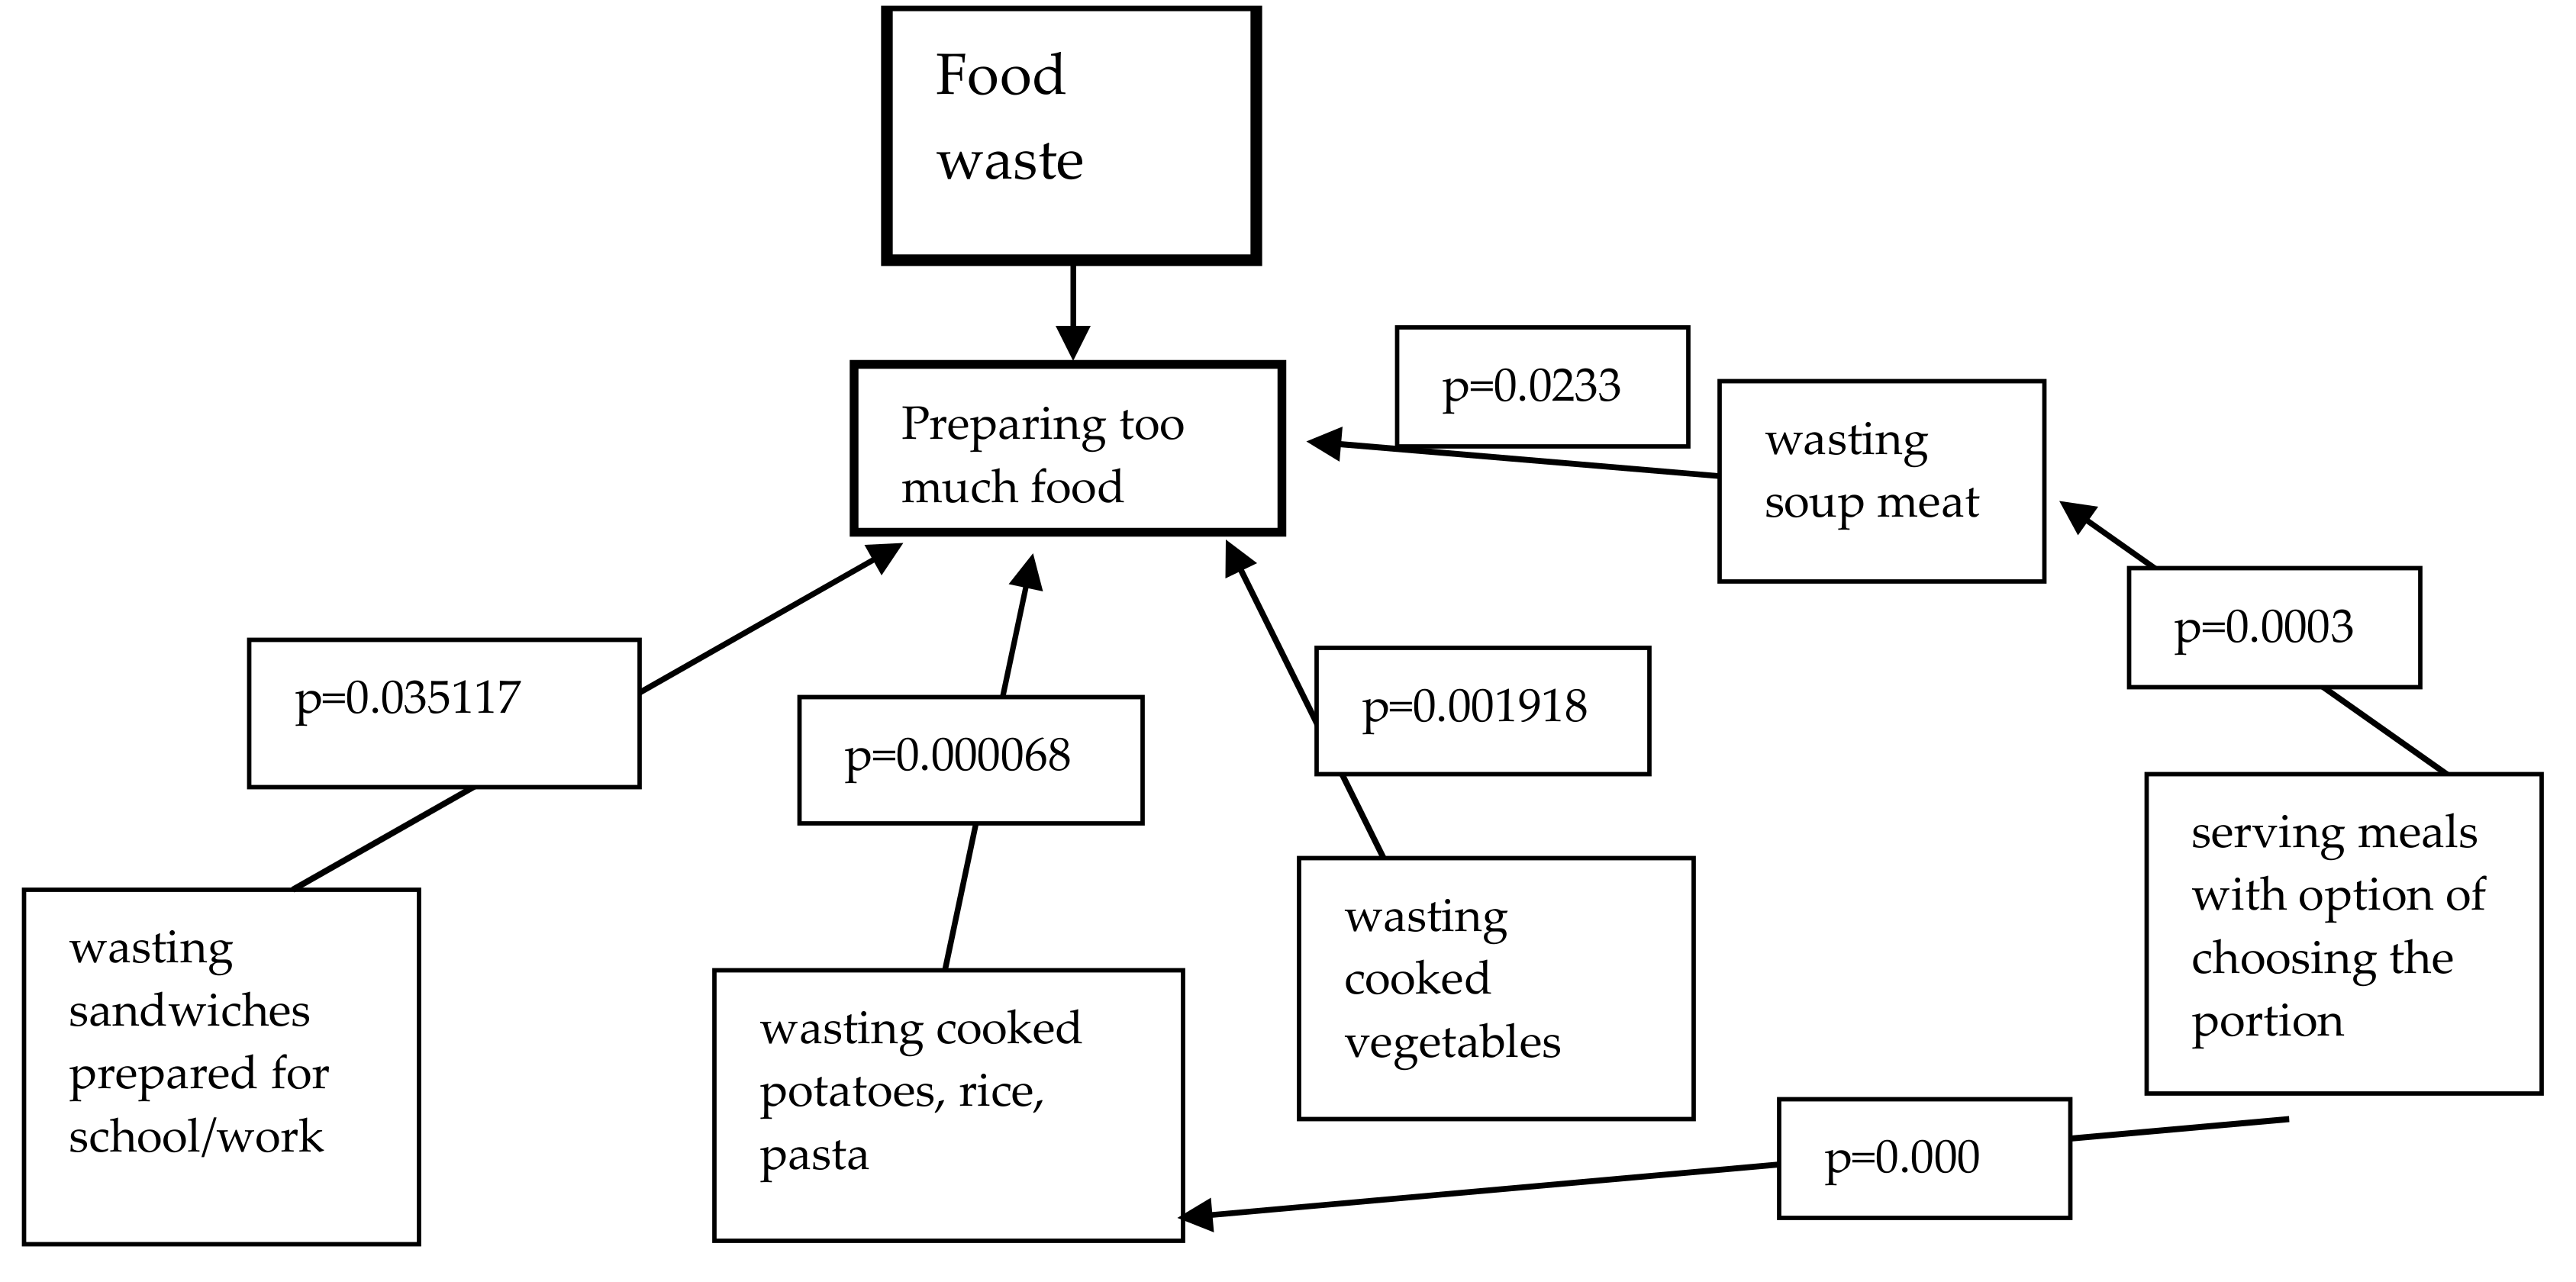
There was a correlation between serving meals with the possibility to choose the portion and wasting uneaten elements of meals (Figure 3). It was observed that people who served meals where it was possible to choose portions less often wasted cooked starch additions and soup meat.
Relationships were found between wasting particular groups of meals and preparing too much food (Figure 3). It was observed that people who served meals where it was possible to choose portions less often wasted cooked starch additions and soup meat.
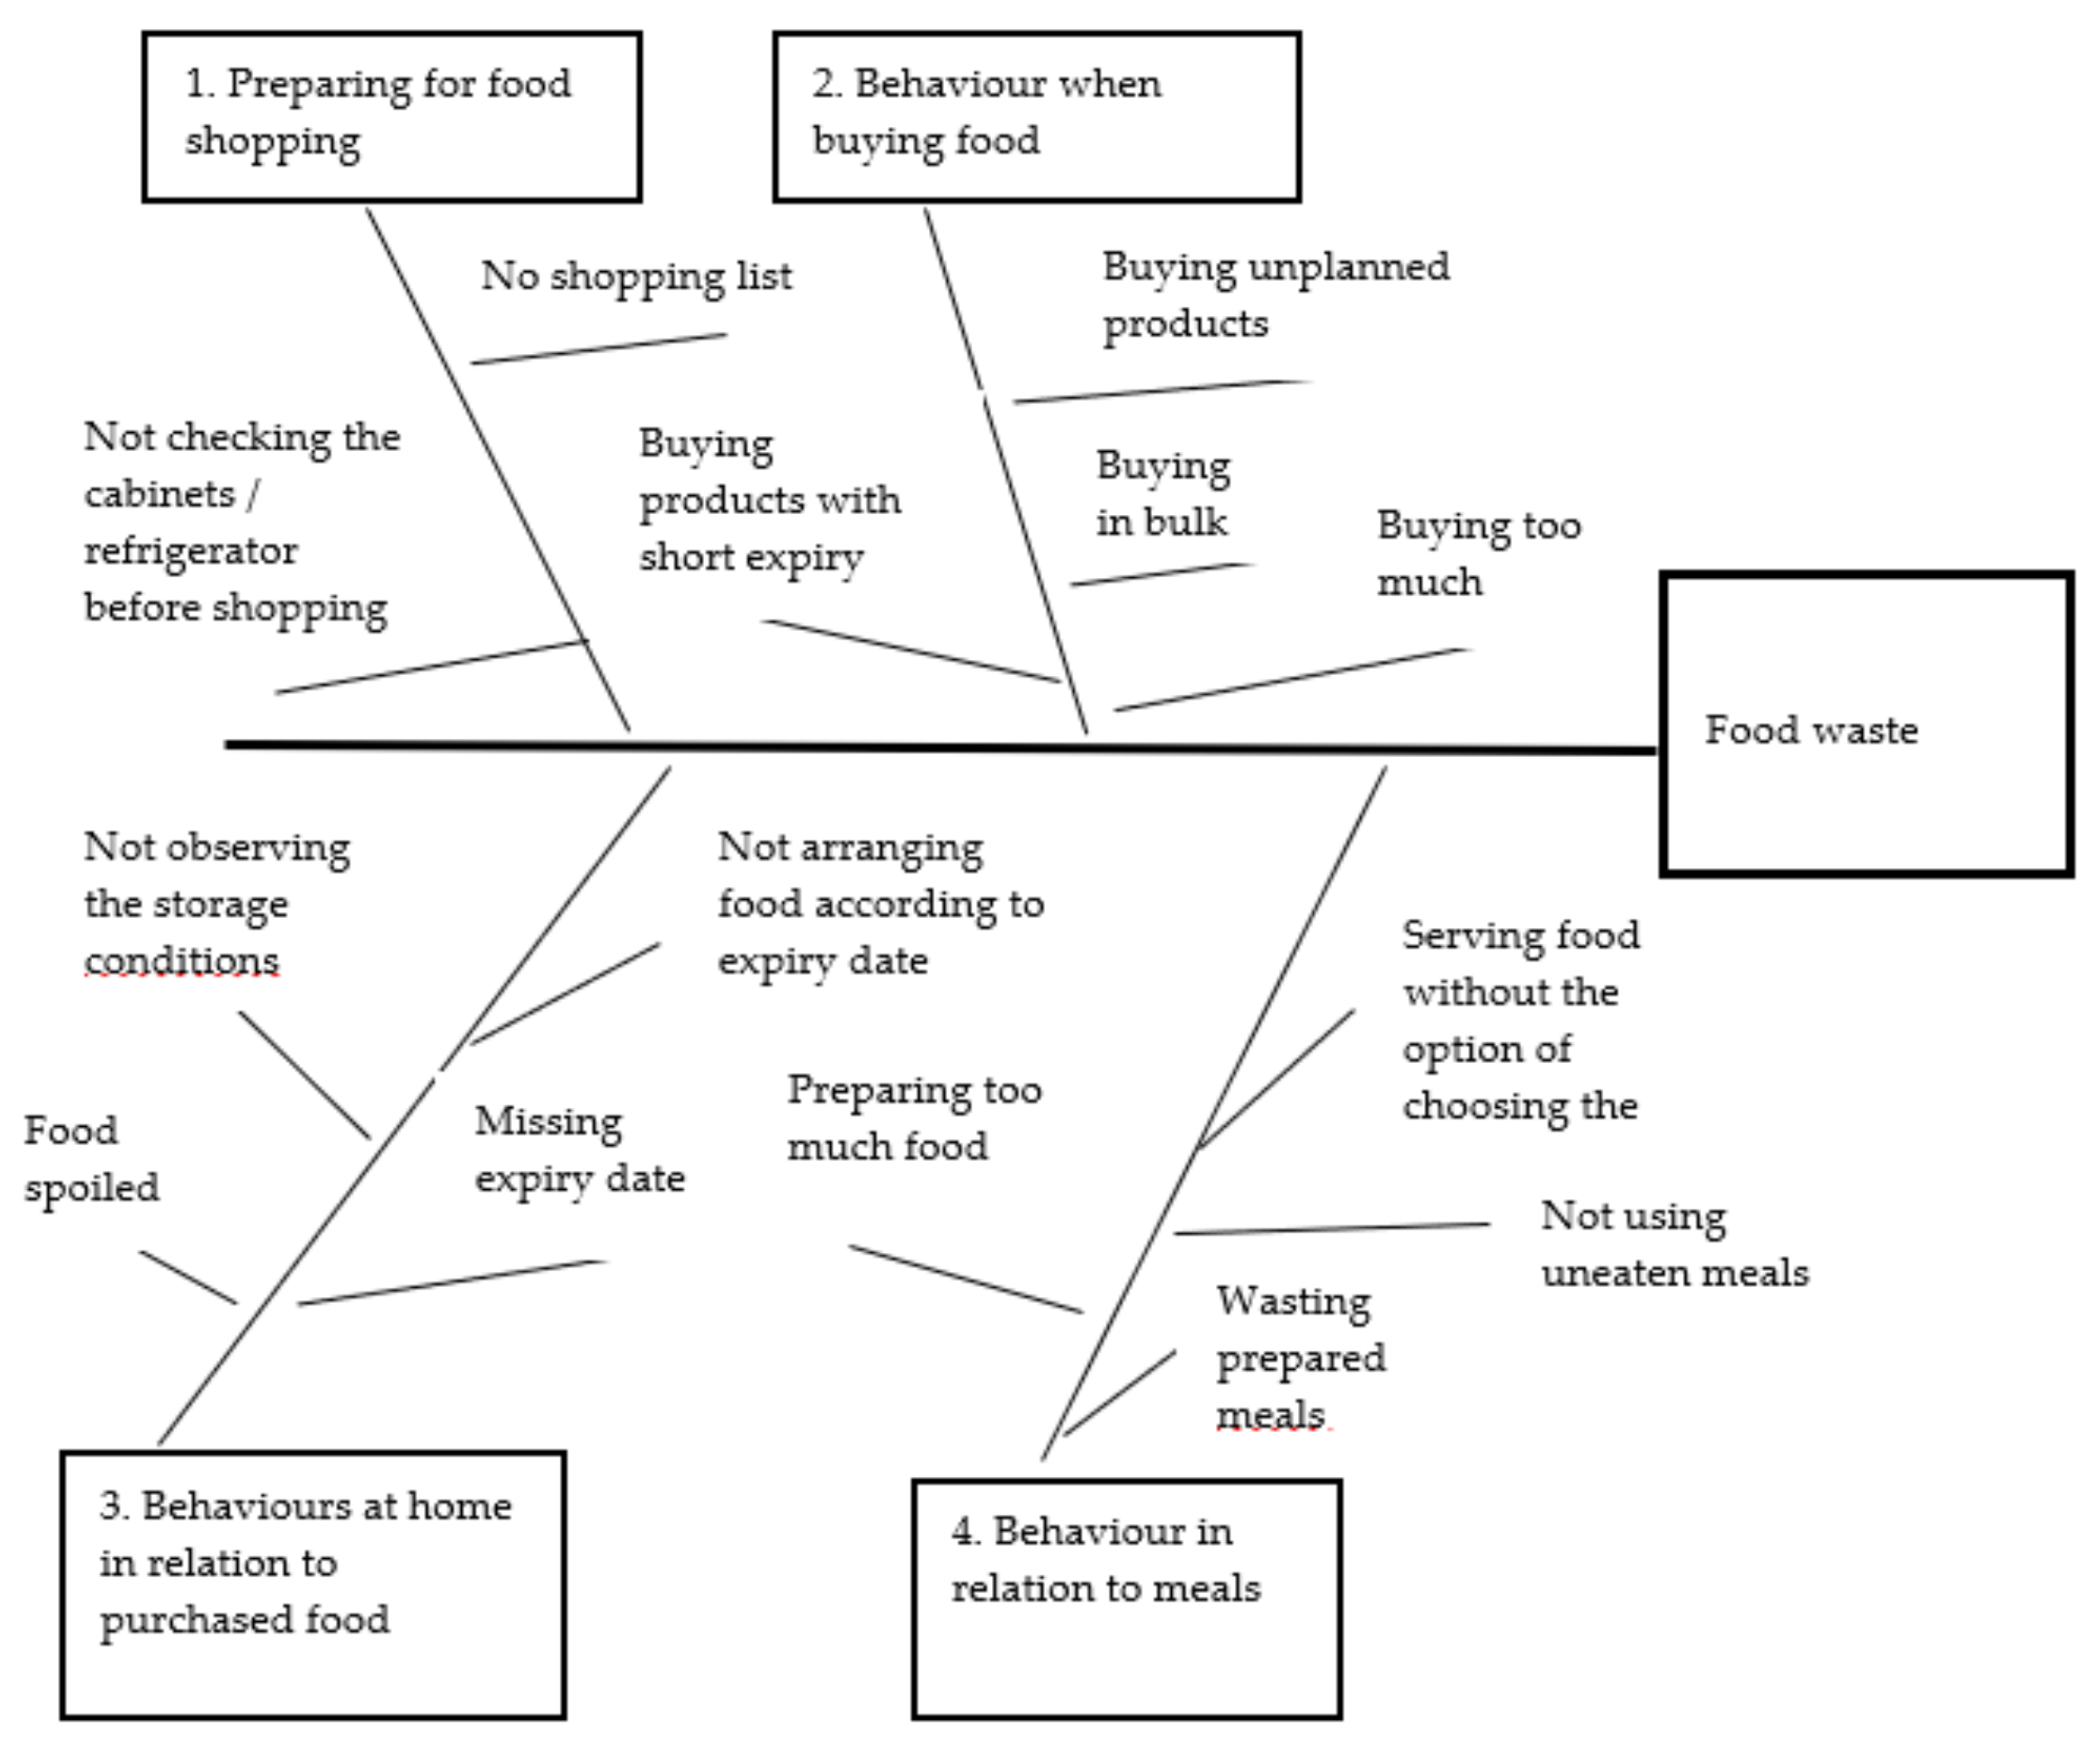
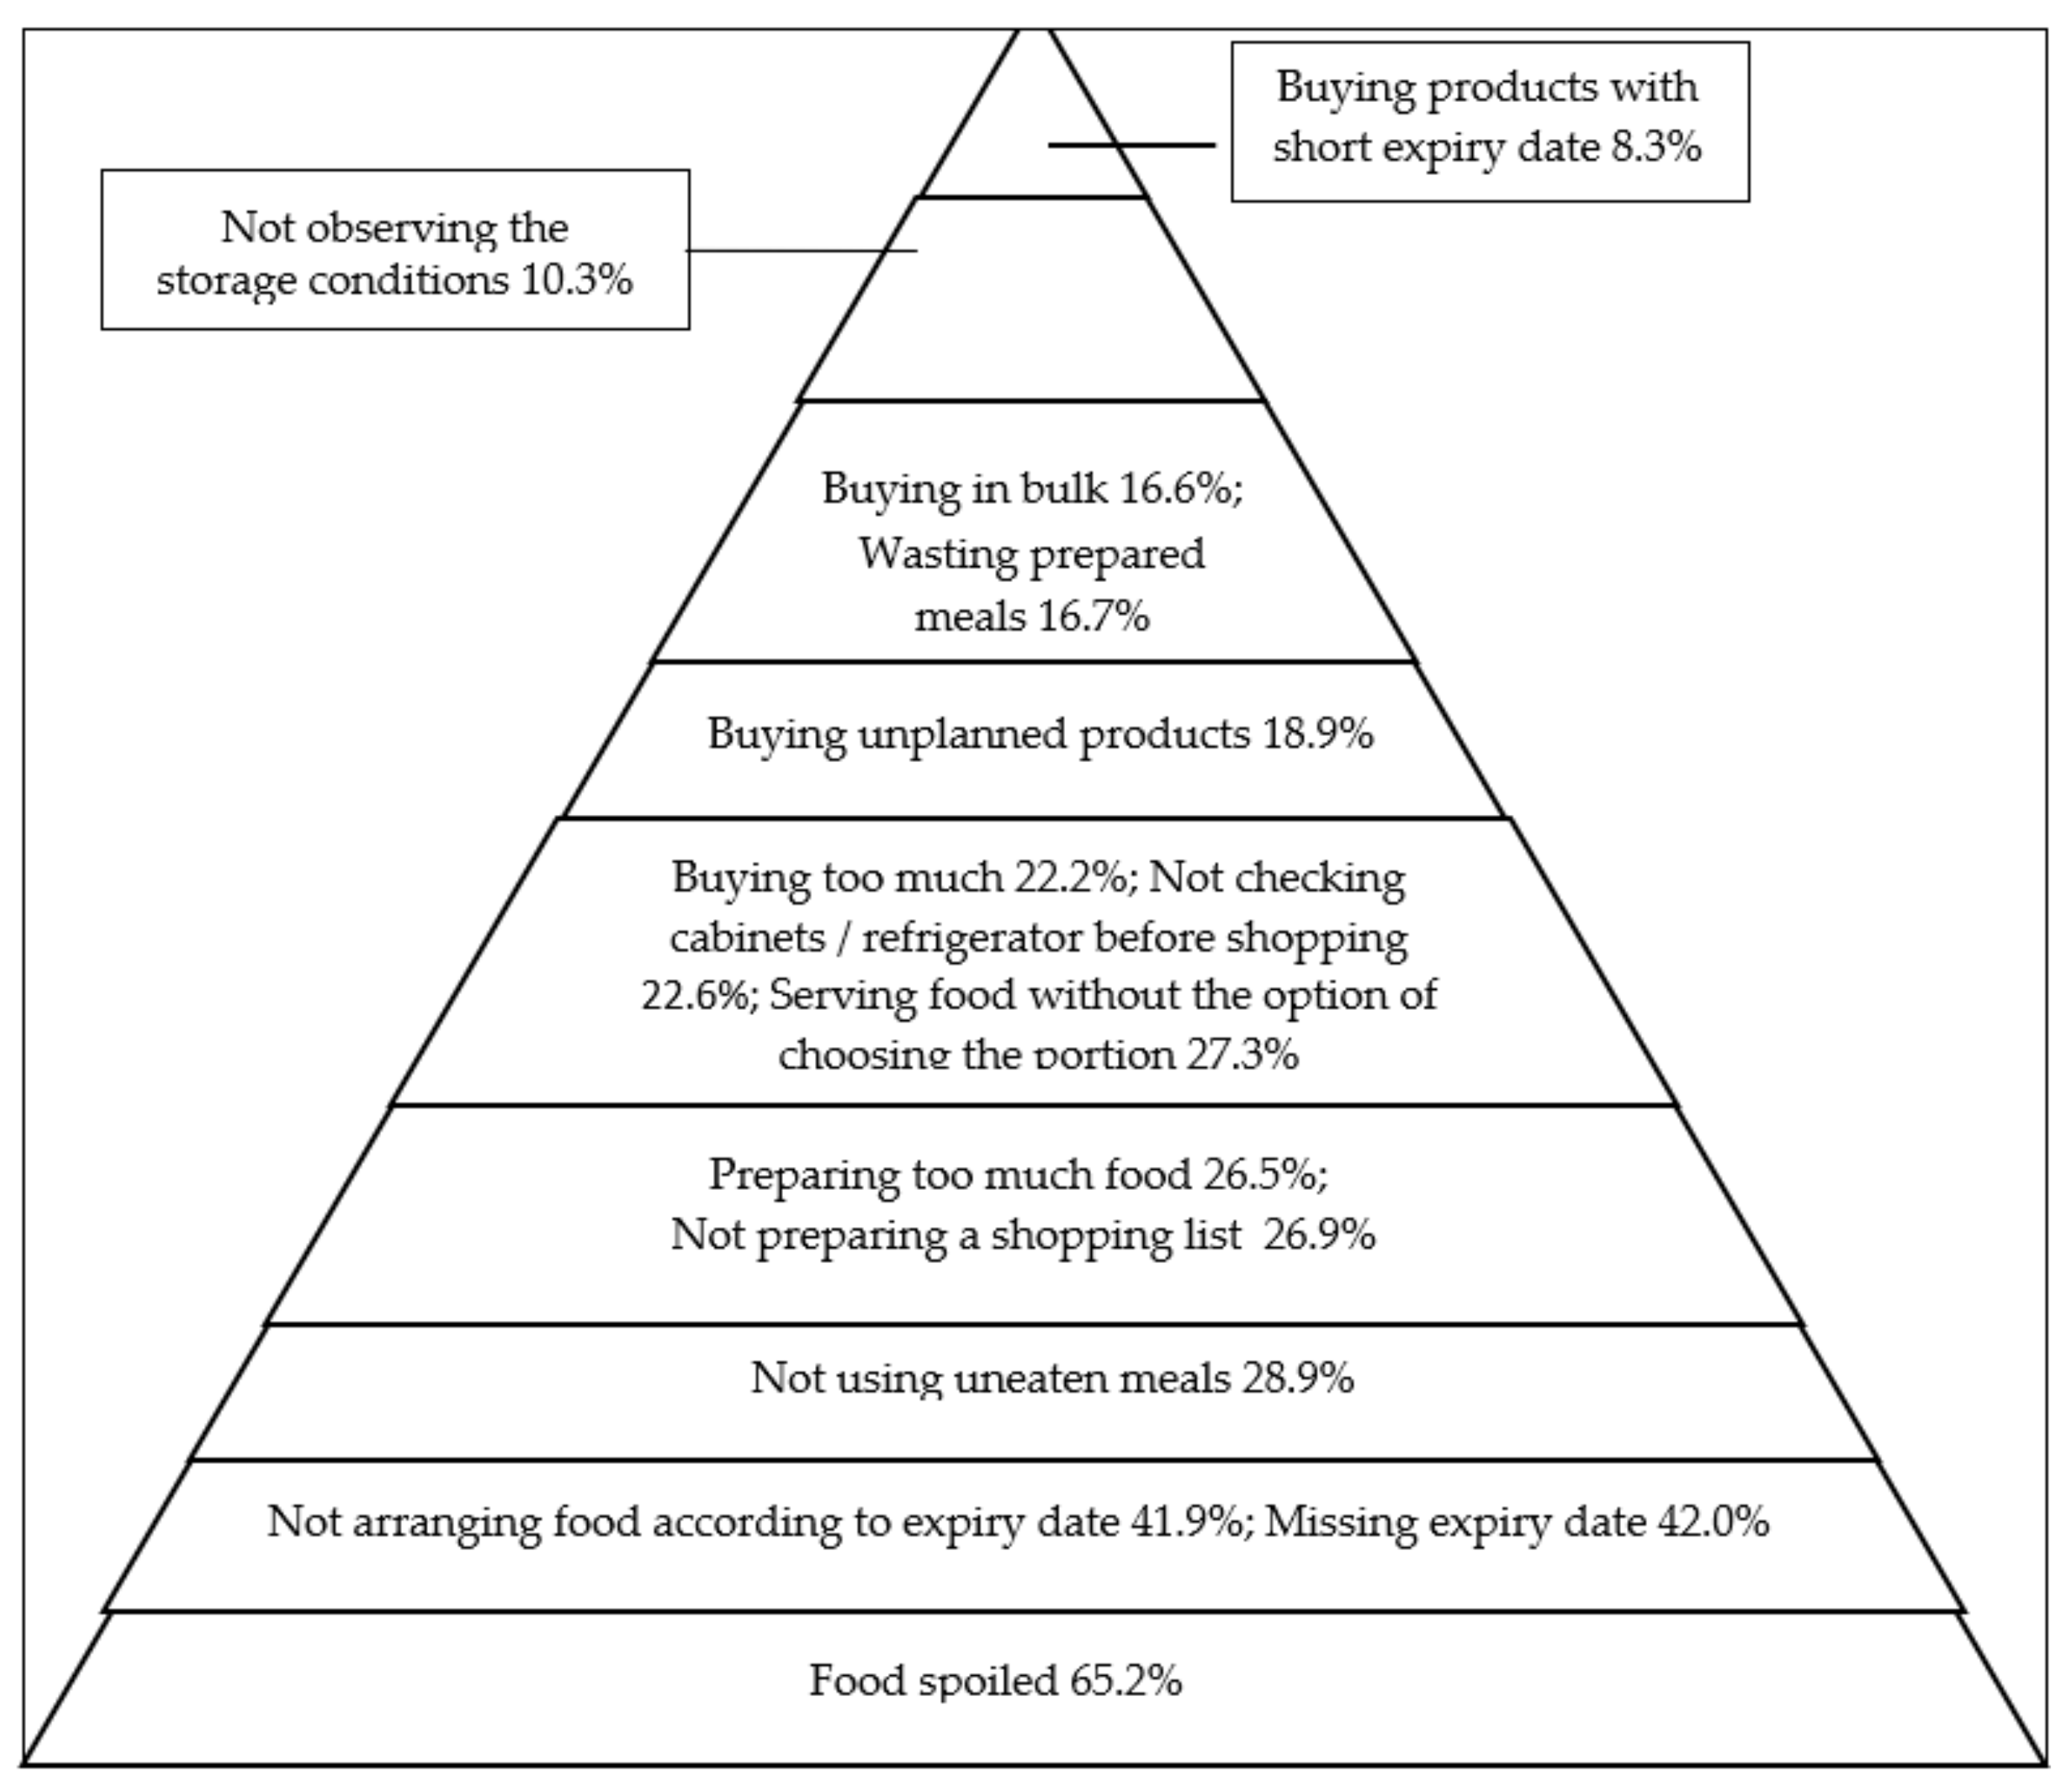
The identified causes of the risk of food waste by Polish consumers were assigned to four groups and presented in a diagram using the concept of an Ishikawa diagram (Figure 4). Four groups of causes of the risk of food waste are related to preparing for shopping for food, behavior when buying food, and behavior at home in relation to food products and meals.
Then, a hierarchy of the diagnosed causes of food waste risk was determined (Figure 5). The most frequent causes were: food spoiled, not arranging food according to expiry date, and missing the expiry date, which are related to the behavior of respondents in regard to food at home.
(U1) cooked potatoes, rice, pasta; (U2) cooked vegetables; (U3) soup meat; (U4) sandwiches prepared for work/school.
3.3. Limitations and Further Research
One limitation of this study is that food waste behavior was self-reported measures by respondents, meaning that it could be a biased. In particular, the self-estimated measure of the frequency of food waste used for this study can under-estimate the overall amount of food waste. In the future, other measurement methods should be used, e.g., diary method, in which respondents would record the amount of food thrown away along with the reason on a running basis. Second, the results show a correlation between the sociodemographic characteristics of respondents and food waste, but investigations should be made to explore the role of other important characteristics, such as income, type and size of household, and psychographics.
Further research on consumer behavior should explore which motivations are more important and how economics and household size effect on food waste. Because food spoiled and missing expiry date turned out to be the most significant causes of food waste, research regarding the terms “best before” and “use by” are indicated to determine whether consumers interpret these properly.
4. Discussion
Food waste does not reflect a single behavior, but rather results from the way a household plan, make, prepare, and consume food [28]. According to Porpino et al. [34], various daily food practices affect food waste.
In their own research, over three-quarters of respondents prepared shopping lists, although with differing frequency. According to other researchers, e.g., Parizeau et al. [35] and Secondi et al. [36], careful planning of food shopping is an effective tool to prevent food waste. In addition, Quested et al. [28] discovered that there is a strong positive correlation between making shopping lists and other behaviors such as planning meals in advance and checking food stocks before shopping. Papaj’s study [37] showed that more than half of Poles participating declared that they “always” or “very often” prepare a shopping list. Similar observations were made by Jörissen et al. [38], whose study shows that 70% of respondents declared preparing a list. Moreover, Jörissen et al. [38] stated that the shopping list makes it possible to reduce food waste by about 20% per person.
One Polish respondents in five was unlikely to check their stocks before shopping. Farr-Wharton et al. [29] emphasize that information about food products stored at home before shopping is key to avoiding unnecessary food purchases. This practice would result in reducing waste due to expired food. In addition, if consumers used an appropriate food storage system, it is likely that the amount of waste due to forgotten food would be reduced.
A relatively small percentage of respondents declared that they often bought food in bulk. Almost one in five respondents in our survey declared that they “sometimes and frequently” buy unplanned products. As many researchers pointed out [22,24,30], routine planning and cooking practices in the household play a key role in producing food waste. According to Stancu et al. [22], shopping routines contribute to buying fewer unplanned products. Planning procedures, on the other hand, were strongly and positively linked to household skills. According to Fami et al. [39], households with better food consumption management skills waste less food. The results of Janssens et. al. [40] show that the behavior in the shop, especially that consisting in buying more food than necessary, was the main driver of food waste.
As stated in the survey, buying products with a short shelf life at a reduced price was not popular among Polish respondents. As our data indicate that missing the expiry date is one of the main causes of food waste, it should be recognized that such behavior may increase food waste. However, studies conducted by Koivupuro et al. [41] indicate that households in which it is not common to buy products at a reduced price waste more. The authors explain this by the fact that people buying products at a reduced price cannot afford to waste food. Jörissen et al. [38] and Williams et al. [42] made similar conclusions from their studies.
We have established a correlation between the arrangement of products in cabinets/fridges according to the expiry date and missing the expiry date. More than 40% did not arrange food according to the expiry date. As a result, more than 40% of respondents declared that they throw away food because they missed the expiry date and 60% because it spoiled. Overall, the same main reasons can be identified from the survey by Jörissen et al. [38], where respondents indicated mouldiness, inappropriate taste/smell, storage for too long in the refrigerator, i.e., food being spoiled and out of date. According to the WRAP [43] and Koivupuro et al. [41] surveys, the causes of avoidable food waste are being spoiled, being left on a plate after a meal, and being expired. In Finnish households, on the other hand, the causes of waste were molding (29%), expiration (19%), leftovers (14%), and making too much food (13%) [44]. According to the WRAP report [43], the key factor is buying too much food. The percentage of responses confirming such behavior among Polish and British respondents was similar (22.2% and 22%, respectively). According to Janssens et al. [40], the behaviors when buying food in a shop have a significant, positive impact on food waste. This study confirms that the lack of planning of how to prepare food is one of the key impediments to reducing food waste to a minimum.
The highest percentage of Polish respondents “frequently and sometimes” throw away such products as: bread (almost 24%), smoked meats, vegetables except for root vegetables, dairy beverages, fresh fruit (about 13% each). Jörissen et al. [38] observed a similar hierarchy of discarded products on the basis of their research. Their respondents “sometimes and often” threw away fruit, bread, vegetables, and cheese, but the percentage of respondents declaring that they wasted them was much higher (over 40%). According to the WRAP report [45], the most frequently wasted products in the UK were fruit and vegetables (32.5%), beverages (17%), followed by bread and cakes (13.3%), dairy products and eggs (12%), and uneaten food leftovers (12%). Studies by Hanssen et al. [46] indicate that bread is the most often wasted food. As Schneider and Lebersorger [47] pointed out, today, bread must meet high requirements in terms of freshness, and stale bread is most often thrown away by households. A survey of 1000 Austrians over 15 years of age showed that 2/3 of respondents bought bread every other day and 78% rated freshness as its most important attribute [48]. A similar frequency of bread purchases was found in this study. According to Skotnicka et al. [49], products most frequently thrown away by Poles living in Poland and Great Britain included bread, yoghurt, sausages, fruit, and vegetables. Based on the survey conducted among Polish rural households in Lublin voivodship, it can be observed that wasting bread and bakery products not only ranks first, but it is also positively correlated with education [50]. This relationship is confirmed by our own research.
In this study, it was found that products frequently purchased were also most often thrown away, i.e., bread, smoked meats, and fruit. According to Jörissen et al. [38], the frequency of shopping affects the amount of food wasted. Less food is wasted in households that buy more often [51], as more frequent shopping helps to adapt it to current needs. Different observations were made in the WRAP Report [23], which shows that daily, spontaneous shopping can lead to more waste.
One in five Polish respondents “frequently” and “sometimes” throws away cooked starch products or cooked vegetables, and one in three declares that they generally do not use such leftovers to prepare other meals. According to Romani et al. [13], as the ability to plan meals increases, the ability to plan purchases improves and overstocking and leftovers are reduced. Stancu et al. [22] noted that, even in the absence of planning shopping and meals, the appropriate use of leftovers can contribute to reducing food waste. Poor stock management at home, buying too much, cooking, or serving too much food, and not using uneaten meals seem to be key factors leading to throwing away usable food, according to Koivupuro et al. [41]. According to the WRAP report [23], more food is thrown away after it has been prepared as compared to purchased and unused products. Almost one in three persons (32%) said they threw away a “significant” amount of food left on the plate after a meal, while nearly one in four said they threw away a significant amount of food prepared but not served, as well as unused and open products. Most of the food thrown away in Finnish households were vegetables and potatoes and the leftovers of cooked food [44]. Similarly, in Tehran households, seven product groups (bread, cooked rice, fresh fruit, cooked pasta, fresh vegetables and salads, and milk and dairy products) accounted for more than 72% of wasted food [39]. In about 40% of UK households, waste was caused by preparing too much food [38]. In some cases, consumers do not know how to prepare meals or reuse leftovers [20,22,24].
In this study, we found an influence of age on food waste. Our observation was confirmed in many studies indicating that older people waste significantly less than other age groups [22,38,40,43]. As noted by Hanssen et al. [46], the percentage of respondents who said they had wasted food within the past week decreased with age, from about 50% to 70% of respondents aged 26 to 40 and from 10% to 20% of respondents aged 71 to 85. According to Aschemann-Witzel et al. [20], demographic data do not play as important a role in explaining food waste at the consumer level as do psychographics. However, WRAP [43] and Jörissen et al. [38] believe that individual households of retired people waste more per person, whereas Koivupuro et al. [41] did not find any correlation between age and avoidable food waste or education level in their studies. Meanwhile, the results of our study indicate that people with university-level education are more likely to waste food, e.g., because the expiry date was missed, but also to pay more attention to the observance of storage conditions. The level of education is considered to be one of the factors contributing to food waste, as people with better education earn more, but have less time for better food management at home [52]. This is confirmed by the WRAP report [53], which states that people with university-level education waste more. A reverse correlation was found by Abdelradi [1] and Mattar et al. [18].
We found that the behavior of women contributes less to food waste than the behavior of men. Secondi et al. [36] confirmed the strong and significant relationship between the amount of food wasted and age, gender, and level of education. According to her observations, women seem to be more aware of food waste than men, and those who left school at the age of 15 or earlier waste less food than those who completed their education at the age of 20 or over.
Based on our study, we can conclude that the place of residence had an influence on consumer behaviors in terms of food waste. On the one hand, residents of rural areas and towns between 100,000 and 200,000 population were the least likely to throw away expired products, but most products were thrown away less often by residents of towns and cities with over 500,000 in population. According to Secondi et al. [36], it is more likely that people living in small or medium-sized towns or large cities waste more food than people living in rural areas. This was confirmed by Hanssen et al. [46] and Mattar et al. [18].
5. Conclusions
It was found that food was wasted more often by young people. Older respondents, on the other hand, wasted food less often, and more often used uneaten elements of meals to prepare other meals. Persons with university-level education wasted food more often, but also more often observed the storage conditions indicated by the producer, and paid attention to the expiry date on the label.
One of the products most frequently thrown away by Polish young respondents was bread, which was also the product most frequently purchased by the majority of respondents—every day or every other day on average.
In addition, we identified the causes of the risk of food waste by consumers and determined the frequency of their occurrence. The most common causes for the risk of food waste include food being spoiled, missing the expiry date, and failure to arrange food in cabinets according to the expiry date.
Knowing the key factors that can explain consumer behavior and practices that cause food waste is essential for the development and implementation of effective educational programs to reduce this negative phenomenon. We have studied the impact of sociodemographic factors on the behaviors of respondents related to food waste.
These programs should be devoted primarily to young people and to those with higher education. Emphasis in these educational programs should be placed on proper consumer behavior regarding food products and meals at home, as the most frequently occurring causes of food waste were spoiled food and missing an expiry date. Issues related to proper food storage at home in particular should be addressed. Proper planning of meals, using food products already available at home, is also important.
The results of our study should be used by governmental and non-governmental organizations to prepare the assumptions for strategies of reducing food waste at the level of Polish consumers. Undoubtedly, consumers should be educated in the area of household food management, from planning purchases to preparing meals.
Author Contributions
Conceptualization, B.B.; methodology, B.B. and M.T.; validation, D.K.-K., M.T., and B.B.; formal analysis, B.B.; data curation, B.B. and M.T.; writing—original draft preparation, B.B.; writing—review and editing, B.B. and M.T.; supervision, D.K.-K. All authors have read and agreed to the published version of the manuscript.
Funding
This publication has been developed under the contract with the National Center for Research and Development No. Gospostrateg1/385753/1/NCBR/2018 for carrying out and funding of a project implemented as part of the “The social and economic development of Poland in the conditions of globalizing markets—GOSPOSTRATEG” program called “Developing a system for monitoring wasted food and an effective program to rationalize losses and reduce food wastage” (acronym PROM).
Conflicts of Interest
The authors declare no conflict of interest.
References
- Abdelradi, F. Food waste behavior at the household level: A conceptual framework. Waste Manag. 2017, 71, 485–493. [Google Scholar] [CrossRef] [PubMed]
- Beretta, C.; Stoessel, F.; Baier, U.; Hellweg, S. Quantifying food losses and the potential for reduction in Switzerland. Waste Manag. 2013, 33, 764–773. [Google Scholar] [CrossRef] [PubMed] [Green Version]
- Buzby, J.C.; Hyman, J. Total and per capita value of food loss in the United States. Food Policy 2012, 37, 561–570. [Google Scholar] [CrossRef]
- Timmermans, A.J.M. FUSIONS Food waste data set for EU-28: New Estimates and Environmental Impact; European Commission: Brussels, Belgium, 2015. [Google Scholar]
- Garrone, P.; Melacini, M.; Perego, A. Opening the black box of food waste reduction. Food Policy 2014, 46, 129–139. [Google Scholar] [CrossRef]
- Monier, V.; Mudgal, S.; Escalon, V.; O’Connor, C.; Gibon, T.; Anderson, G.; Montoux, H. Final Report—Preparatory Study on Food Waste Across EU 27; European Commission BIO Intelligence Service: Brussels, Belgium, 2010; Available online: https://ec.europa.eu/environment/eussd/pdf/bio_foodwaste_report.pdf (accessed on 25 July 2017).
- Parfitt, J.; Barthel, M.; Macnaughton, S. Food waste within food supply chains: quantification and potential for change to 2050. Philos. Trans. R. Soc. B 2010, 365, 3065–3308. [Google Scholar] [CrossRef] [PubMed] [Green Version]
- Priefer, C.; Jörissen, J.; Bräutigam, K.R. Technology Options for Feeding 10 Billion People. Options for Cutting Food Waste Study; Science and Technology Options Assessment (STOA), European Parliament: Brussels, Belgium, 2013; Available online: http://www.europarl.europa.eu/RegData/etudes/etudes/join/2013/513515/IPOL-JOIN_ET(2013)513515(SUM01)_EN.pdf (accessed on 25 July 2017).
- FAO. Sustainable Development Goals: Indicator 12.3.1—Global Food Loss and Waste. Available online: http://www.fao.org/sustainable-development-goals/indicators/1231/en/ (accessed on 16 December 2017).
- Rutten, M.; Nowicki, P.; Bogaardt, M.-J.; Aramyan, L. Reducing Food Waste by Household and in Retail in the EU: A Prioritisation Using Economic, Land Use and Food Security Impacts; LEI Wageningen UR: Wageningen, The Netherlands, 2013; Available online: https://edepot.wur.nl/290135 (accessed on 27 October 2017).
- Williams, H.; Wikström, F. Environmental impact of packaging and food losses in a life cycle perspective: A comparative analysis of five food items. J. Clean. Prod. 2011, 19, 43–48. [Google Scholar] [CrossRef]
- FAO. Food Wastage Footprint. Impacts on Natural Resources. Summary Report; Natural Resources Management and Environment Department, FAO: Rome, Italy, 2013; Available online: http://www.fao.org/docrep/018/i3347e/i3347e.pdf (accessed on 25 July 2017).
- Romani, S.; Grappib, S.; Bagozzi, R.P.; Barone, A.M. Domestic food practices: A study of food management behaviors and the role of food preparation planning in reducing waste. Appetite 2018, 121, 215–227. [Google Scholar] [CrossRef]
- Schanes, K.; Dobernig, K.; Gözet, B. Food waste matters—A systematic review of household food waste practices and their policy implications. J. Clean. Prod. 2018, 182, 978–991. [Google Scholar] [CrossRef]
- Kosseva, M.R.; Webb, C. (Eds.) Food Industry Wastes—Assessment and Recuperation of Commodities, 1st ed.; Elsevier Science Publishing: London, UK, 2013. [Google Scholar]
- Russell, S.V.; Young, W.C.; Unsworth, K.L.; Robinson, C. Bringing habits and emotions into food waste behavior. Resour. Conserv. Recycl. 2017, 125, 107–114. [Google Scholar] [CrossRef]
- Bravi, L.; Francioni, B.; Murmura, F.; Savelli, E. Factors affecting household food waste among young consumers and actions to prevent it. A comparison among UK, Spain and Italy. Resour. Conserv. Recycl. 2020, 153, 104586. [Google Scholar] [CrossRef]
- Mattar, L.; Abiad, M.G.; Chalak, A.; Diab, M.; Hassan, H. Attitudes and behaviors shaping household food waste generation: Lessons from Lebanon. J. Clean. Prod. 2018, 198, 1219–1223. [Google Scholar] [CrossRef]
- Wansink, B. Household food waste solutions for behavioral economists and marketers. J. Food Prod. Mark. 2018, 24, 500–521. [Google Scholar] [CrossRef]
- Aschemann-Witzel, J.; Hooge, I.; Amani, P.; Bech-Larsen, T.; Oostindjer, M. Consumer-related food waste: Causes and potential for action. Sustainability 2015, 7, 6457–6477. [Google Scholar] [CrossRef] [Green Version]
- Van Herpen, E.; van der Lans, I. A picture says it all? The validity of photograph coding to assess household food waste. Food Qual. Prefer. 2019, 75, 71–77. [Google Scholar] [CrossRef]
- Stancu, V.; Haugaard, P.; Lähteenmäki, L. Determinants of consumer food waste behavior: Two routes to food waste. Appetite 2016, 96, 7–17. [Google Scholar] [CrossRef]
- Brook Lyndhurst. Food Behavior Consumer Research: Quantitative Phase; WRAP: Banbury, UK, 2007. [Google Scholar]
- Stefan, V.; van Herpen, E.; Tudoran, A.A.; Lähteenmäki, L. Avoiding food waste by Romanian consumers: The importance of planning and shopping routines. Food Qual. Prefer. 2013, 28, 375–381. [Google Scholar] [CrossRef]
- Davenport, M.L.; Qi, D.; Roe, B.E. Food-related routines, product characteristics, and household food waste in the United States: A refrigerator-based pilot study. Resour. Conserv. Recycl. 2019, 150, 104440. [Google Scholar] [CrossRef]
- Farr-Wharton, G.; Foth, M.; Choi, J.H.J. Identifying factors that promote consumer behaviors causing expired domestic food waste. J. Consumer Behav. 2014, 13, 393–402. [Google Scholar] [CrossRef] [Green Version]
- Griffin, M.; Sobal, J.; Lyson, T.A. An analysis of a community food waste stream. Agric. Hum. Values 2009, 26, 67–81. [Google Scholar] [CrossRef]
- Quested, T.E.; Marsh, E.; Stunell, D.; Parry, A.D. Spaghetti soup: The complex world of food waste behaviors. Resour. Conserv. Recycl. 2013, 79, 43–51. [Google Scholar] [CrossRef]
- Evans, D. Blaming the consumer—Once again: The social and material contexts of everyday food waste practices in some English households. Crit. Public Health 2011, 21, 429–440. [Google Scholar] [CrossRef]
- Visschers, V.H.; Wickli, N.; Siegrist, M. Sorting out food waste behavior: A survey on the motivators and barriers of self-reported amounts of food waste in households. J Environ. Psychol. 2016, 45, 66–78. [Google Scholar] [CrossRef]
- WRAP. We Don’t Waste Food! A Household Survey; WRAP: Banbury, UK, 2007. [Google Scholar]
- Ajzen, I. Consumer attitudes and behavior: The theory of planned behavior applied to food consumption decisions. Rivista di Economia Agraria 2015, 2, 121–138. [Google Scholar]
- Central Statistical Office. The National Official Register of the Territorial Division of the Country. Available online: http://eteryt.stat.gov.pl/eTeryt/rejestr_teryt/aktualnosci/aktualnosci.aspx (accessed on 27 March 2019).
- Porpino, G.; Parente, J.; Wansink, B. Food waste paradox: Antecedents of food disposal in low income households. Int. J. Consum. Stud. 2015, 39, 619–629. [Google Scholar] [CrossRef] [Green Version]
- Parizeau, K.; von Massow, M.; Martin, R. Household-level dynamics of food waste production and related beliefs, attitudes, and behaviors in Guelph, Ontario. Waste Manag. 2015, 35, 207–217. [Google Scholar] [CrossRef]
- Secondi, L.; Principato, L.; Laureti, T. Household food waste behavior in EU-27 countries: A multilevel analysis. Food Policy 2015, 56, 25–40. [Google Scholar] [CrossRef]
- Papaj, K.A. Food Waste—Policies, Initiatives and Consumer Behavior. Case Study: Poland and Portugal. Ph.D. Thesis, The NOVA School of Science and Technology (FCT NOVA), Lisbon, Portugal, September 2016. Available online: https://run.unl.pt/bitstream/10362/20044/1/Papaj_2016.pdf (accessed on 10 October 2019).
- Jörissen, J.; Priefer, C.; Bräutigam, K.-R. Food waste generation at household level: Results of a survey among employees of two European research centers in Italy and Germany. Sustainability 2015, 7, 2695–2715. [Google Scholar] [CrossRef] [Green Version]
- Fami, H.S.; Aramyan, L.H.; Sijtsema, S.J.; Alambaigi, A. Determinants of household food waste behavior in Tehran city: A structural model. Resour Conserv Recycl. 2019, 143, 154–166. [Google Scholar] [CrossRef]
- Janssens, K.; Lambrechts, W.; van Osch, A.; Semeijn, J. How consumer behavior in daily food provisioning affects food waste at household level in The Netherlands. Foods 2019, 8, 428. [Google Scholar] [CrossRef] [Green Version]
- Koivupuro, H.-K.; Hartikainen, H.; Silvennoinen, K.; Katajajuuri, J.-M.; Heikintalo, N.; Reinikainen, A.; Alkanen, L. Influence of socio-demographical, behavioral and attitudinal factors on the amount of avoidable food waste generated in Finnish households. Int. J. Consum. Stud. 2012, 36, 183–191. [Google Scholar] [CrossRef]
- Williams, H.; Wikström, F.; Otterbring, T.; Löfgren, M.; Gustavsson, A. Reasons for household food waste with special attention to packaging. J. Clean. Prod. 2012, 24, 141–148. [Google Scholar] [CrossRef] [Green Version]
- WRAP. The Food We Waste: A Study of the Amount, Types and Nature of the Food We Throw away in UK Households; WRAP: Banbury, UK, 2008. [Google Scholar]
- Silvennoinen, K.; Katajajuuri, J.-M.; Hartikainen, H.; Jalkanen, L.; Reinikainen, A. Food waste volume and composition in Finnish households. Brit. Food J. 2014, 116, 1058–1068. [Google Scholar] [CrossRef]
- WRAP. Household Food and Drink Waste in the UK 2012; WRAP: Banbury, UK, 2013; Available online: http://www.wrap.org.uk/content/household-food-and-drink-waste-uk-2012 (accessed on 25 July 2017).
- Hanssen, O.J.; Syversen, F.; Stø, E. Edible food waste from Norwegian households—Detailed food waste composition analysis among households in two different regions in Norway. Resour. Conserv. Recycl. 2016, 109, 146–154. [Google Scholar] [CrossRef]
- Schneider, F.; Lebersorger, S. The challenges of food wastage to European Society. In Proceedings of the 15th European Roundtable on Sustainable Consumption and Production(15th ERSCP), Bregenz, Austria, 2–4 May 2012. [Google Scholar]
- Starmayr, B. 10 Antworten zum Brot- und Gebäckkonsum in Österreich, Ergebnisse derUmfrage „Brot 08“ [10 Answers Regarding Bread and Pastry Consumption in Austria, Results of the Survey „Bread 08“]; Backaldrin Österreich GmbH: Asten, Austria, 2008. [Google Scholar]
- Skotnicka, M.; Karwowska, K.; Śmiechowska, M. The problem of food waste in different types of households on the example of the residents of Poland and Polish people residing in the United Kingdom—Pilot Study. Problemy Rolnictwa Światowego 2018, 18, 282–294. [Google Scholar] [CrossRef] [Green Version]
- Florkowski, W.J.; Us, A.; Klepacka, A.M. Food waste in rural households support for local biogas production in Lubelskie Voivodship (Poland). Resour. Conserv. Recycl. 2018, 136, 46–52. [Google Scholar] [CrossRef]
- Glanz, R. Causes of Food Waste Generation in Households—An Empirical Analysis. Master’s Thesis, University of Natural Resources and Applied Life Sciences, Vienna, Austria, 2008. [Google Scholar]
- Shahnoushi, N.; Firoozzare, A.; Jalerajabi, M.; Danshvar, M.; Dehghaniyan, S. The use of the order logit model in an investigation of the effective factors on bread waste. J. Econ. Res. 2011, 46, 111–132. [Google Scholar]
- WRAP. Research into Consumer Behaviour in Relation to Food Dates and Portion Sizes; WRAP: Banbury, UK, 2008. [Google Scholar]
Figure 1.
Frequency of performing the following activities by the respondents: (P.1) checking cabinets/refrigerators before shopping, (P.2) preparing a shopping list, (P.3) buying unplanned products, (P.4) buying in bulk, (P.5) buying products with a very short expiry date at a reduced price, (P.6) observing the storage conditions indicated by the producer on the packaging, (P.7) arranging food according to the expiry date in the refrigerator/cabinet.

Figure 2.
Influence of sociodemographic characteristics on consumer behavior: (P.1) checking cabinets/refrigerators before shopping, (P.2) preparing a shopping list, (P.3) buying unplanned products, (P.4) buying in bulk, (P.5) buying products with a very short expiry date at a reduced price, (P.6) observing the storage conditions indicated by the producer on the packaging, (P.7) arranging food according to the expiry date in the refrigerator/cabinet.

Figure 3.
Correlation between serving meals with the possibility to choose portions, wasting uneaten elements of meals, and preparing too much food.
Figure 3.
Correlation between serving meals with the possibility to choose portions, wasting uneaten elements of meals, and preparing too much food.

Figure 4.
Ishikawa Diagram showing the causes of food waste risk.

Figure 5.
Hierarchy of the identified causes of food waste risk.


Table 1.
Sociodemographic characteristic of consumers’ groups, %.
| Variable | Abbreviation * | Characteristics | Abbreviation * | % |
|---|---|---|---|---|
| Gender | G | Women Men | W M | 51.1 48.9 |
| Age | A | 18-24 25-34 35-44 45-59 over 60 years old | A B C D E | 8.3 19.0 18.0 27.4 27.4 |
| Inhabitancy (place of origin) | PO | Villages Cities up to 50,000 Cities over 50,000 up to 100,000 Cities over 100,000 up to 200,000 Cities over 200,000 up to 500,000 Cities over 500,000 | V VSC SC MC BC VBC | 38.2 24.8 7.4 9.1 9.0 11.6 |
| Education level | E | Primary Basic vocational Secondary Higher | P BV S H | 8.4 31.9 42.0 17.7 |
* abbreviations used in the discussion of results.
Table 2.
Influence of sociodemographic features on the frequency of throwing away and buying selected food products.
Table 2.
Influence of sociodemographic features on the frequency of throwing away and buying selected food products.
| Food Practises. | Total | Gender | Age | Residency | Education Level |
|---|---|---|---|---|---|
| % | p-Value | ||||
| Frequency of throwing away, answers “often and sometimes” | |||||
| Bread | 23.8 | ns | 0.000 | 0.000 | 0.000 |
| Smoked meats | 12.8 | ns | ns | 0.046 | 0.039 |
| Vegetables, except root vegetables | 12.7 | ns | ns | 0.032 | ns |
| Dairy drinks | 12.7 | ns | ns | ns | 0.013 |
| Fresh fruit | 12.6 | ns | 0.001 | 0.013 | ns |
| Cakes | 11.3 | ns | ns | ns | ns |
| Potatoes | 11.0 | ns | ns | 0.016 | ns |
| Cream | 10.9 | ns | 0.025 | 0.004 | ns |
| Cereal products | 10.9 | ns | 0.000 | ns | ns |
| Milk | 9.8 | ns | ns | 0.023 | ns |
| Root vegetables | 9.2 | ns | 0.018 | ns | ns |
| Curd cheese | 9.1 | ns | 0.000 | 0.011 | 0.044 |
| Rennet cheeses | 8.4 | ns | ns | 0.042 | ns |
| Fresh red meat | 6.9 | ns | ns | ns | ns |
| Fresh fish | 6.8 | ns | ns | 0.038 | ns |
| Fresh poultry meat | 6.5 | ns | ns | 0.003 | ns |
| Products purchased “in bulk” | |||||
| Coffee, tea, cocoa | 55.8 | 0.038 | ns | 0.000 | ns |
| Sugar and substitutes | 54.9 | ns | ns | 0.013 | ns |
| Cereal products | 48.1 | ns | 0.016 | 0.021 | ns |
| Carbonated drinks, still drinks, juices | 31.3 | ns | ns | ns | 0.021 |
| Ketchup, mayonnaise, mustard and other sauces | 30.2 | ns | ns | 0.014 | ns |
| Food concentrates | 28.3 | ns | 0.013 | ns | ns |
| Potatoes | 28.3 | ns | ns | 0.037 | ns |
| Canned meat and fish | 27.3 | ns | ns | ns | ns |
| Other fats | 25.1 | ns | ns | ns | ns |
| Milk | 21.8 | ns | ns | ns | ns |
| Frequency of shopping, answers “every day, every other day on average” | |||||
| Bread | 82.3 | 0.028 | 0.001 | ns | ns |
| Milk | 19.9 | ns | ns | 0.002 | ns |
| Fresh fruit | 16.6 | ns | 0.000 | 0.000 | 0.000 |
| Smoked meats | 14.0 | ns | ns | 0.046 | ns |
| Dairy drinks | 9.6 | ns | 0.000 | 0.000 | 0.011 |
| Vegetables, except root vegetables | 8.7 | ns | ns | 0.000 | 0.002 |
| Potatoes | 6.7 | 0.019 | ns | 0.000 | 0.032 |
| Fresh poultry meat | 5.5 | ns | 0.007 | 0.000 | 0.003 |
| Cereal products | 5.4 | 0.007 | 0.031 | 0.004 | ns |
| Cream | 5.3 | 0.009 | ns | 0.004 | ns |
| Root vegetables | 4.8 | 0.003 | ns | 0.000 | 0.005 |
ns—not significant.
Table 3.
Correlation between sociodemographic characteristics and wasting or using uneaten elements of meals.
Table 3.
Correlation between sociodemographic characteristics and wasting or using uneaten elements of meals.
| Type of Food | Total | Gender | Age | Inhabitancy |
|---|---|---|---|---|
| % | p-Value | |||
| Wasting: answers “often and sometimes” | ||||
| sandwiches prepared for work/school | 14.5 | ns | 0.000 | ns |
| cooked potatoes, rice, pasta | 19.9 | ns | 0.002 | 0.044 |
| cooked vegetables | 18.0 | ns | 0.000 | 0.028 |
| soup meat | 14.7 | ns | 0.013 | ns |
| Used: answers “rarely and never” | ||||
| cooked potatoes, rice, pasta. | 24.7. | 0.044 | 0.000 | 0.001 |
| cooked vegetables | 33.6. | ns | 0.001 | 0.000 |
| soup meat | 28.4 | ns | 0.000 | 0.001 |
ns—not significant.
Table 4.
Percentage share of responses by gender, age, place of residence and education to questions about wasting and using uneaten elements of meals and throwing away expired products and products with signs of spoilage.
Table 4.
Percentage share of responses by gender, age, place of residence and education to questions about wasting and using uneaten elements of meals and throwing away expired products and products with signs of spoilage.
| Type of Food. | Gender | Age | Inhabitancy | Education Level | |||||||||||||
|---|---|---|---|---|---|---|---|---|---|---|---|---|---|---|---|---|---|
| W | M | A | B | C | D | E | V | VSC | SC | MS | BC | VBC | P | BV | S | H | |
| Using uneaten elements of meals (percentage of responses: rarely and never) | |||||||||||||||||
| U1 | 23.1 | 26.6 | 37.6 | 27.4 | 26.3 | 22.5 | 18.9 | 26.0 | 19.0 | 21.1 | 25.9 | 35.8 | 25.9 | ns | ns | ns | ns |
| U2 | ns | ns | 46.5 | 32.8 | 37.0 | 34.2 | 26.2 | 34.0 | 29.2 | 31.2 | 38.6 | 44.0 | 32.5 | ns | ns | ns | ns |
| U3 | ns | ns | 42.2 | 30.2 | 30.0 | 26.7 | 22.6 | 28.8 | 22.1 | 28.1 | 35.4 | 39.2 | 28.1 | ns | ns | ns | ns |
| Wasting uneaten elements of meals (percentage of responses: often and sometimes) | |||||||||||||||||
| U1 | ns | ns | 22.7 | 24.2 | 20.7 | 20.6 | 14.1 | 19.4 | 20.7 | 22.3 | 18.0 | 26.1 | 14.7 | 11.7 | 14.8 | 23.2 | 24.6 |
| U2 | ns | ns | 16.3 | 23.1 | 22.8 | 20.5 | 12.4 | 18.2 | 20.4 | 17.4 | 14.7 | 30.4 | 14.5 | 8.2 | 15.5 | 22.7 | 21.4 |
| U3 | ns | ns | 16.0 | 18.6 | 16.3 | 13.9 | 11.0 | ns | ns | ns | ns | ns | ns | ns | ns | ns | ns |
| U4 | ns | ns | 19.8 | 18.6 | 14.6 | 14.8 | 9.0 | ns | ns | ns | ns | ns | ns | ns | ns | ns | ns |
ns—not significant.
© 2019 by the authors. Licensee MDPI, Basel, Switzerland. This article is an open access article distributed under the terms and conditions of the Creative Commons Attribution (CC BY) license (http://creativecommons.org/licenses/by/4.0/).
Share and Cite
MDPI and ACS Style
Bilska, B.; Tomaszewska, M.; Kołożyn-Krajewska, D. Analysis of the Behaviors of Polish Consumers in Relation to Food Waste. Sustainability 2020, 12, 304. https://doi.org/10.3390/su12010304
AMA Style
Bilska B, Tomaszewska M, Kołożyn-Krajewska D. Analysis of the Behaviors of Polish Consumers in Relation to Food Waste. Sustainability. 2020; 12(1):304. https://doi.org/10.3390/su12010304
Chicago/Turabian StyleBilska, Beata, Marzena Tomaszewska, and Danuta Kołożyn-Krajewska. 2020. "Analysis of the Behaviors of Polish Consumers in Relation to Food Waste" Sustainability 12, no. 1: 304. https://doi.org/10.3390/su12010304
Note that from the first issue of 2016, this journal uses article numbers instead of page numbers. See further details here.