Analysis of Energy-Related Carbon Emissions in Inner Mongolia, China


General Education Center, National Taiwan Ocean University, Keelung City 20224, Taiwan
Sustainability 2019, 11(24), 7008; https://doi.org/10.3390/su11247008
Submission received: 7 November 2019
/
Revised: 3 December 2019
/
Accepted: 5 December 2019
/
Published: 8 December 2019
Abstract
:Inner Mongolia has shown both rapid economic growth and a large renewable energy base, this has come about by the introduction of the “Western Development” strategy and renewable energy policy of the Chinese Government. However, this has led to a contradictory situation where both high carbon emission and reduction exist together. The average economic growth of Inner Mongolia reached 15.76% between 2006 and 2016, which caused huge CO2 emissions. However, promotion of the renewable energy policy (since 2005) resulted in an energy self-sufficiency rate that reached 270.80% by 2016. In this study of the Inner Mongolia carbon emission situation, the logarithmic mean divisia index (LMDI) model was used to analyze the factors affecting carbon emission fluctuations from 2005 to 2016. The decoupling elasticity index was then used to measure the decoupling effect of the economic growth and carbon emissions. The results of this research show that: firstly, CO2 emissions increased rapidly from 651.03 million tons in 2006 to 1723.24 million tons in 2013. Despite a slight decline in CO2 emissions, a level above 1600 million tons was maintained between 2014 and 2016. Secondly, the industry sector was the main source of CO2 emissions in Inner Mongolia, and coal-based fuel played a determining role. Thirdly, in this study, two important contributions were made, including the discovery of two new drivers: labor and emission intensity factors. Further, findings about the effect of the six industrial sectors, economic structure, energy density, and emission intensity factors were also decomposed. It was found that during research period, the population factor, labor factor, and labor productivity factor all had a positive influence on CO2 emissions, whereas the economic structure factor and emission intensity factor had different impacts on the CO2 emissions depending on the particular industrial sector. Furthermore, the energy intensity of six industrial sectors contributed to the decrease in aggregate CO2 emissions. Finally, in this study, it was also found that economic growth and CO2 growth in Inner Mongolia presented a weak decoupling state. Policy recommendations based on these results have been presented.
1. Introduction
The rapid economic growth of China since the implementation of the “reforms and opening up” policy in 1978 has led to a continuous increase in energy consumption and this has resulted in the generation of huge amounts of CO2. China is now the largest CO2 emitter in the world [1,2]. Therefore, China is facing tremendous pressure from the international society to reduce carbon emissions and has pushed its provinces towards this direction. At the 2015 United Nations Climate Change Conference in Paris, the Chinese government promised to reduce carbon emissions to 40%–50% of the 2005 standard by 2020 [3]. To achieve this ambitious objective, the Chinese government has proposed a series of policies targeting carbon reduction, energy density reduction, renewable energy, and energy conservation [4,5].
Interestingly, the provinces/areas of Western China have also shown the same contradictory phenomenon—the development of industries with high energy consumption and high carbon emissions on the one hand, and the development of renewable energy industries on the other. First of all, starting in 2000, the government strove to enhance the level of economic and social development in the western region through the “Western Development” strategy and was committed to the acceleration of the development of infrastructure such as transportation, energy, chemical engineering, raw materials, and construction industries in order to achieve the goal of industrial adjustment [6,7]. However, all these industries are energy-intensive, particularly the raw material and the chemical engineering industries, which all have high CO2 emissions. Secondly, the Chinese government promulgated the “Renewable Energy Law” in 2005, launching a series of renewable energy policies and industrial development in China. Since the western region is a vast and sparsely populated area, it was chosen as a large renewable energy base [8], with a focus on wind and solar power generation to reduce carbon-based energy and carbon emissions.
According to the official statistics, the energy-intensive industries promoted through the “Western Development” strategy has led to an average 13.8% economic growth in Inner Mongolia from 2006 to 2015 [9,10]. Within the same period, economic growth-driven energy consumption in 2015 increased by 47.46% compared to 2006. Under the government’s active renewable energy policy, this growth was staggeringly high—an increase of 152.28% in 2015 compared to 2006—and this has also led to a self-sufficiency rate of 297.21% in 2015 [9,10]. As observed during the “Eleventh Five-Year Plan” (2006–2010) and the “Twelfth Five-Year Plan” (2011–2015) periods, Inner Mongolia was the most representative region for its unbalanced development. Therefore, this study used Inner Mongolia as the research sample to analyze the factors that influenced CO2 emissions and the relationship between emissions and economic growth.
2. Literature Review
In past studies, decomposition methodologies were used to analyze factors affecting CO2 emissions in China, including national, regional/provincial and industrial sector levels. Many studies were performed using the logarithmic mean divisia index (LMDI) method to analyze factors contributing to carbon emission changes in China at the national level, pointing out that economic activity [11,12,13,14], energy intensity [11,12,13,14,15,16,17], building and land expansion [16], energy mix [12,15], population [15], investment [12], export [12], economic growth [15,18], emission coefficient [18], and industrial structure adjustment [11,12,13,14,16,18] were the important factors related to changing carbon emissions. For example, Chen et al. [15] used the LMDI method to analyze early studies in China from 1985–2007 and found that per capita GDP was the largest positive driver of CO2 carbon emissions growth, while energy density improvement significantly reduced the industrial sector’s CO2 emissions. Population, economic structure, and energy structure on the other hand only played a weakly positive promoter role [15]. Similarly, Wang et al. [13] used the LMDI method to analyze carbon emission fluctuations in China from 1994 to 2013, and they showed that the per capita wealth, industrial output, and energy intensity were the main impact factors of industrial carbon emissions (ICE). Some of these previous studies used the Tapio model [19] to further analyze the decoupling effect of carbon emissions and economic growth [11,13]. It was inferred that energy density [11,13] and economic activity [11,13] were the important factors affecting decoupling. For instance, Zhao et al. [11] pointed out that from 1992 to 2012, the activity and economic share of the industrial sector in China showed a negative decoupling effect. Using Tapio model analysis, Wang et al. [13] found that from 1994 to 2013, the relationship between economic growth and carbon emissions in China presented weak as well as expansive decoupling.
Secondly, studies performed at the regional/provincial level were all resourceful, including those on Northwest China [20], Yunnan [21], Guangdong [22,23,24], Jiangsu [25,26], Shanghai [27], Chongqing [28,29], and Xinjiang [30]. The factors found to have the greatest effect on carbon emissions were economic activity [20], investment [21], energy density [21,23,24,26], economic growth [23,24], export [21], population scale [24], energy efficiency [20], technical progress [24], industrial structure [22,23,26], and energy mix [24,26]. For example, Dong et al. [21] analyzed the energy-related carbon emissions of five provinces in Northwest China from 1995 to 2012 (Shaanxi, Ningxia, Qinghai, Gansu, and Xinjiang) and found that the effect of economic activity produced a significant impact on increased carbon emission. However, carbon emissions can be inhibited by improvements in efficiency. Yang and Chen [28] analyzed carbon emission fluctuations in Chongqing City from 2004 to 2008 and found energy mix, energy density, industrial structure, and industrial output to be important factors affecting industrial carbon emission (ICE) [28]. Wang et al. [24] pointed out six factors affecting carbon emissions in Guangdong from 1990 to 2014 and found economic growth and population scale to be the two main drivers for an increase in carbon emissions. Conversely, the effect of energy density plays a vital role in inhibiting carbon emissions [24]. The effect of energy structure and technological advancement exerts a relatively slight effect on carbon emissions [24]. Wang et al. [30] conducted a long-term analysis on carbon emissions in Xinjiang from 1952 to 2010 and found that the affluence and population effects were important contributors to an increase in carbon emission. Prior to 1977, energy density produced a positive effect on carbon emissions but after 1978, it produced an inhibitory effect [30]. In terms of decoupling effect analysis, Dong et al. [20] pointed out that in the five northwestern provinces, a strong decoupling effect was only seen from 2007 to 2009, and the rapid economic growth of the five northwestern provinces posed a serious threat to the decoupling process [20].
Many studies were performed that focused on the industrial sector level of China and showed that economic growth [31,32], energy structure [32], economic output [33], and labor productivity [33] were the primary factors contributing to an increase in carbon emission, while the energy intensity effect [33], and energy efficiency [32] produced significant inhibitory (or moderating) effects. For example, Wan et al. [31] analyzed carbon emissions from the equipment manufacturing industry from 2000 to 2014 and found the economic output to be a determining factor for influencing carbon emissions. Moreover, the decoupling relationship between economic growth and CO2 emissions is weak decoupling [31]. Liang et al. [32] pointed out that from 2001 to 2014, the growth in the carbon emissions of the transportation sector mainly came from economic development and energy structure, while energy efficiency produced an inhibitory effect on CO2 growth. Additionally, Liang et al. also found the inhibitory effect on the railways and highways also led to an inhibitory effect on transportation CO2 emissions [32]. Lin and Liu [33] used the LMDI to analyze carbon emission changes in heavy industries in China from 1991 to 2015 and pointed out that labor productivity improvement increased carbon emissions but lowering energy density significantly reduced them [33].
The following summary can be made from these previous studies. (1) Issue aspect: These studies focused mainly on two issues—factors affecting carbon emissions and the measurement of the decoupling effect. However, for research at the regional/provincial level, the focus was mainly on exploration of the drivers that increased or decreased carbon emission, while little research was performedon the decoupling effect. In addition, research on the regional/provinciallevel did not include the analysis of industrial sector carbon emissions and decoupling contribution. (2) the methodology aspect: the index decomposition analysis-based logarithmic mean divisia index (LMDI) is the most widely used method for the decomposition of energy consumption and carbon emission fluctuations. When measuring the relationship between economic growth and carbon emissions, the Tapio decoupling model has been widely adopted because it is very efficient and does not require a base year. (3) The research sample aspect: led by the “Western Development” strategy, the provinces in the western region of China that show rapid economic growth have received little research attention. This is especially so for Inner Mongolia, with its rich primary and renewable energies. Under central government policy guidance, Inner Mongolia has developed industries with high energy consumption and high emissions on the one hand and a very efficient renewable energy industry on the other. How does Inner Mongolia achieve a balance between economic growth and carbon emissions?
As far as policy makers are concerned, it is very important to find effective measures for reducing energy density and inhibiting CO2 emissions. In this study, the LMDI was used to decompose the factors of carbon emission and measure the contributions of the respective factors, especially the degree of effect on the industrial sectors. Subsequently, the Tapio decoupling model based on extended Kaya identity was employed to develop the decoupling index and analyze the factors on the decoupling status. Since the Chinese government legislated the active promotion of renewable energy development in 2005, this study covers the research period from 2005 to 2016. The results are expected to help with government policy assessment and the coordination of a balance between economic development and carbon emission.
3. Materials and Methods
3.1. Data Sources and Processing
The research period was from 2005 to 2016, and the data used came primarily from the 2006–2017 Inner Mongolia Statistical Yearbook [9] and 2006–2017 China Energy Statistical Yearbook [10]. The unit used in the population and labor data was 100 million people. For the Gross Regional Product (GRP) and the output values of the industry sectors, the unit used was “million RMB”. To eliminate the effect of inflation, the GRP and the output values of the industry sectors were converted to 2005 prices. According to the classification of the 2006–2017 Inner Mongolia Statistical Yearbook [9], the whole economy can be divided into six sectors: the primary sector; industry sector; construction sector; transportation sector, storage, post and telecommunications services sector; wholesale and retail trade, quarters and catering sector; and other sectors—for convenience, these are abbreviated to PRI, IND, CON, TRA, WHO, and OTH, respectively.
In this study, the energy unit used was 108 ton of standard coal equivalent (tce). According to classification in the 2006–2017 Inner Mongolia Statistical Yearbook [9] and the 2006–2017 China Energy Statistical Yearbook [10], the terminal energy consumption is aggregated to eight fuel types: coal, coke, crude oil, gasoline, kerosene, diesel oil, fuel oil, and natural gas. The computation of the CO2 emissions of the respective industrial sectors was also based on these eight fuel types. Finally, individual sector usage of each fuel type was computed using the carbon emission coefficient and with 108 tons as the unit for measuring CO2 emissions.
3.2. Methodology
3.2.1. Estimation of Energy-Related Carbon Emissions
In this study, the methods proposed by the Intergovernmental Panel on Climate Change (IPCC) Guideline for National Greenhouse Gas Inventories [34] were employed to estimate CO2 emissions. The amount of total energy-related CO2 emissions from fossil fuel combustion of industrial sector in Inner Mongolia can be calculated based on energy consumption, the fraction of oxidized carbon by fuel type and emission factors. The computational formula is as follows:
In Equation (1), the subscript t is the time in years, the subscript i = 1, 2, 3, 4, 5, 6 denotes the six industrial sectors, and the subscript j = 1, 2, 3, 4, 5, 6, 7, 8 denotes the eight fuel types. refers to the total CO2 emissions in year t (108 tons); denotes the CO2 emissions based on fuel type j industrial sector i in year t; denotes the energy consumption based on fuel type j industrial sector i in year t; denotes the fraction of the carbon oxidized by the fuel type j; represents the CO2 emissions coefficient of fuel type j. The low calorific value, oxidation rate, potential carbon content, and CO2 emissions factors are listed in Table 1. The electricity consumption is considered to be clean in order to avoid the double counting of CO2 emissions from the power generation industry [35].
3.2.2. Multilevel Index Decomposition Analysis Model of Carbon Emissions
Based on the expanded Kaya identity [37,38] and LMDI method [20,39,40], this paper proposes both an additive LMDI and multiplicative LMDI to analyze the factors affecting energy-related CO2 emission changes in industrial sectors. Accordingly, considering the features of the rapid growth of population and GRP and industrial adjustments in Inner Mongolia, changes in energy-related CO2 emissions can be decomposed into six affecting factors: the population effect, labor effect, labor productivity effect, economic structure effect, energy intensity effect, and emission intensity effect. The aggregate CO2 emissions from each industrial sector can be calculated as follows:
where C is the total energy-related CO2 emissions in Inner Mongolia (108 tons); P is the population factor (100 million); L denotes to the labor input (100 million); denotes the GRP (million RMB, 2005 constant prices); denotes the output values of six industrial sector, respectively; and are the total end-use energy consumption and energy consumption by industrial sectors i (108tce), respectively; and is CO2 emissions by industrial sector i, respectively; LAB refers to the labor factor, which indicates the share of labor in the population; PRO denotes the labor productivity effect, and it is measured by the output value per labor input; is the economic structure effect, and it is measured by the share of output values of the ith industrial sector in GRP; represents the energy intensity effect, and it indicates energy consumption per unit of output values of the ith industrial sector; denotes the emission intensity effect, and it indicates CO2 emissions from the consumption of per unit of the ith industrial sector.
From Equation (2) and according to the LMDI method [41,42], the CO2 emissions from year to year can be expressed in additive form and multiplicative form as follows:
In Equation (4), on means the CO2 emission changes from to ; , , , , , and are the changes in CO2 emissions from the population, labor, labor productivity, economic structure, energy intensity, and emission intensity effects, respectively; , , , , , and are the growth rates of CO2 emissions corresponding to the population, labor, labor productivity, economic structure, energy intensity, and emission intensity effects, respectively. The terms and . denote the estimated weights of the additive and multiplicative LMDI. Table 2 shows the structural formula for each factor. In addition, Ang et al. [43] and Ang and Liu [44] proposed to substitute zero for very small values between 10−10 and 10−20 to overcome the problem of zero values. Ang and Liu [44] also indicated that this method is robust when an appropriate value is used, and its results are satisfactory even in extreme cases.
3.2.3. The Tapio Decoupling Model
Tapio [19] proposed a decoupling elasticity indicator for studying the volume of European and Finnish transportation and decoupling states of CO2 emissions during the period 1970–2001. According to Tapio [19], the decoupling model of this study for measuring CO2 emissions and economic growth can be represented by the following equation:
where is the elasticity of decoupling indicators between carbon emissions and economic growth. Furthermore, the decoupling indicator can be decomposed into the population factor sub-indicator (), labor factor sub-indicator (), labor productivity factor sub-indicator (), economic structure factor sub-indicator (), energy intensity factor sub-indicator (), and emission intensity factor sub-indicator (). According to Tapio [19], the decoupling states can be categorized into eight states, as shown in Table 3.
4. Results and Discussion
4.1. Trajectory of CO2 Emissions in Inner Mongolia
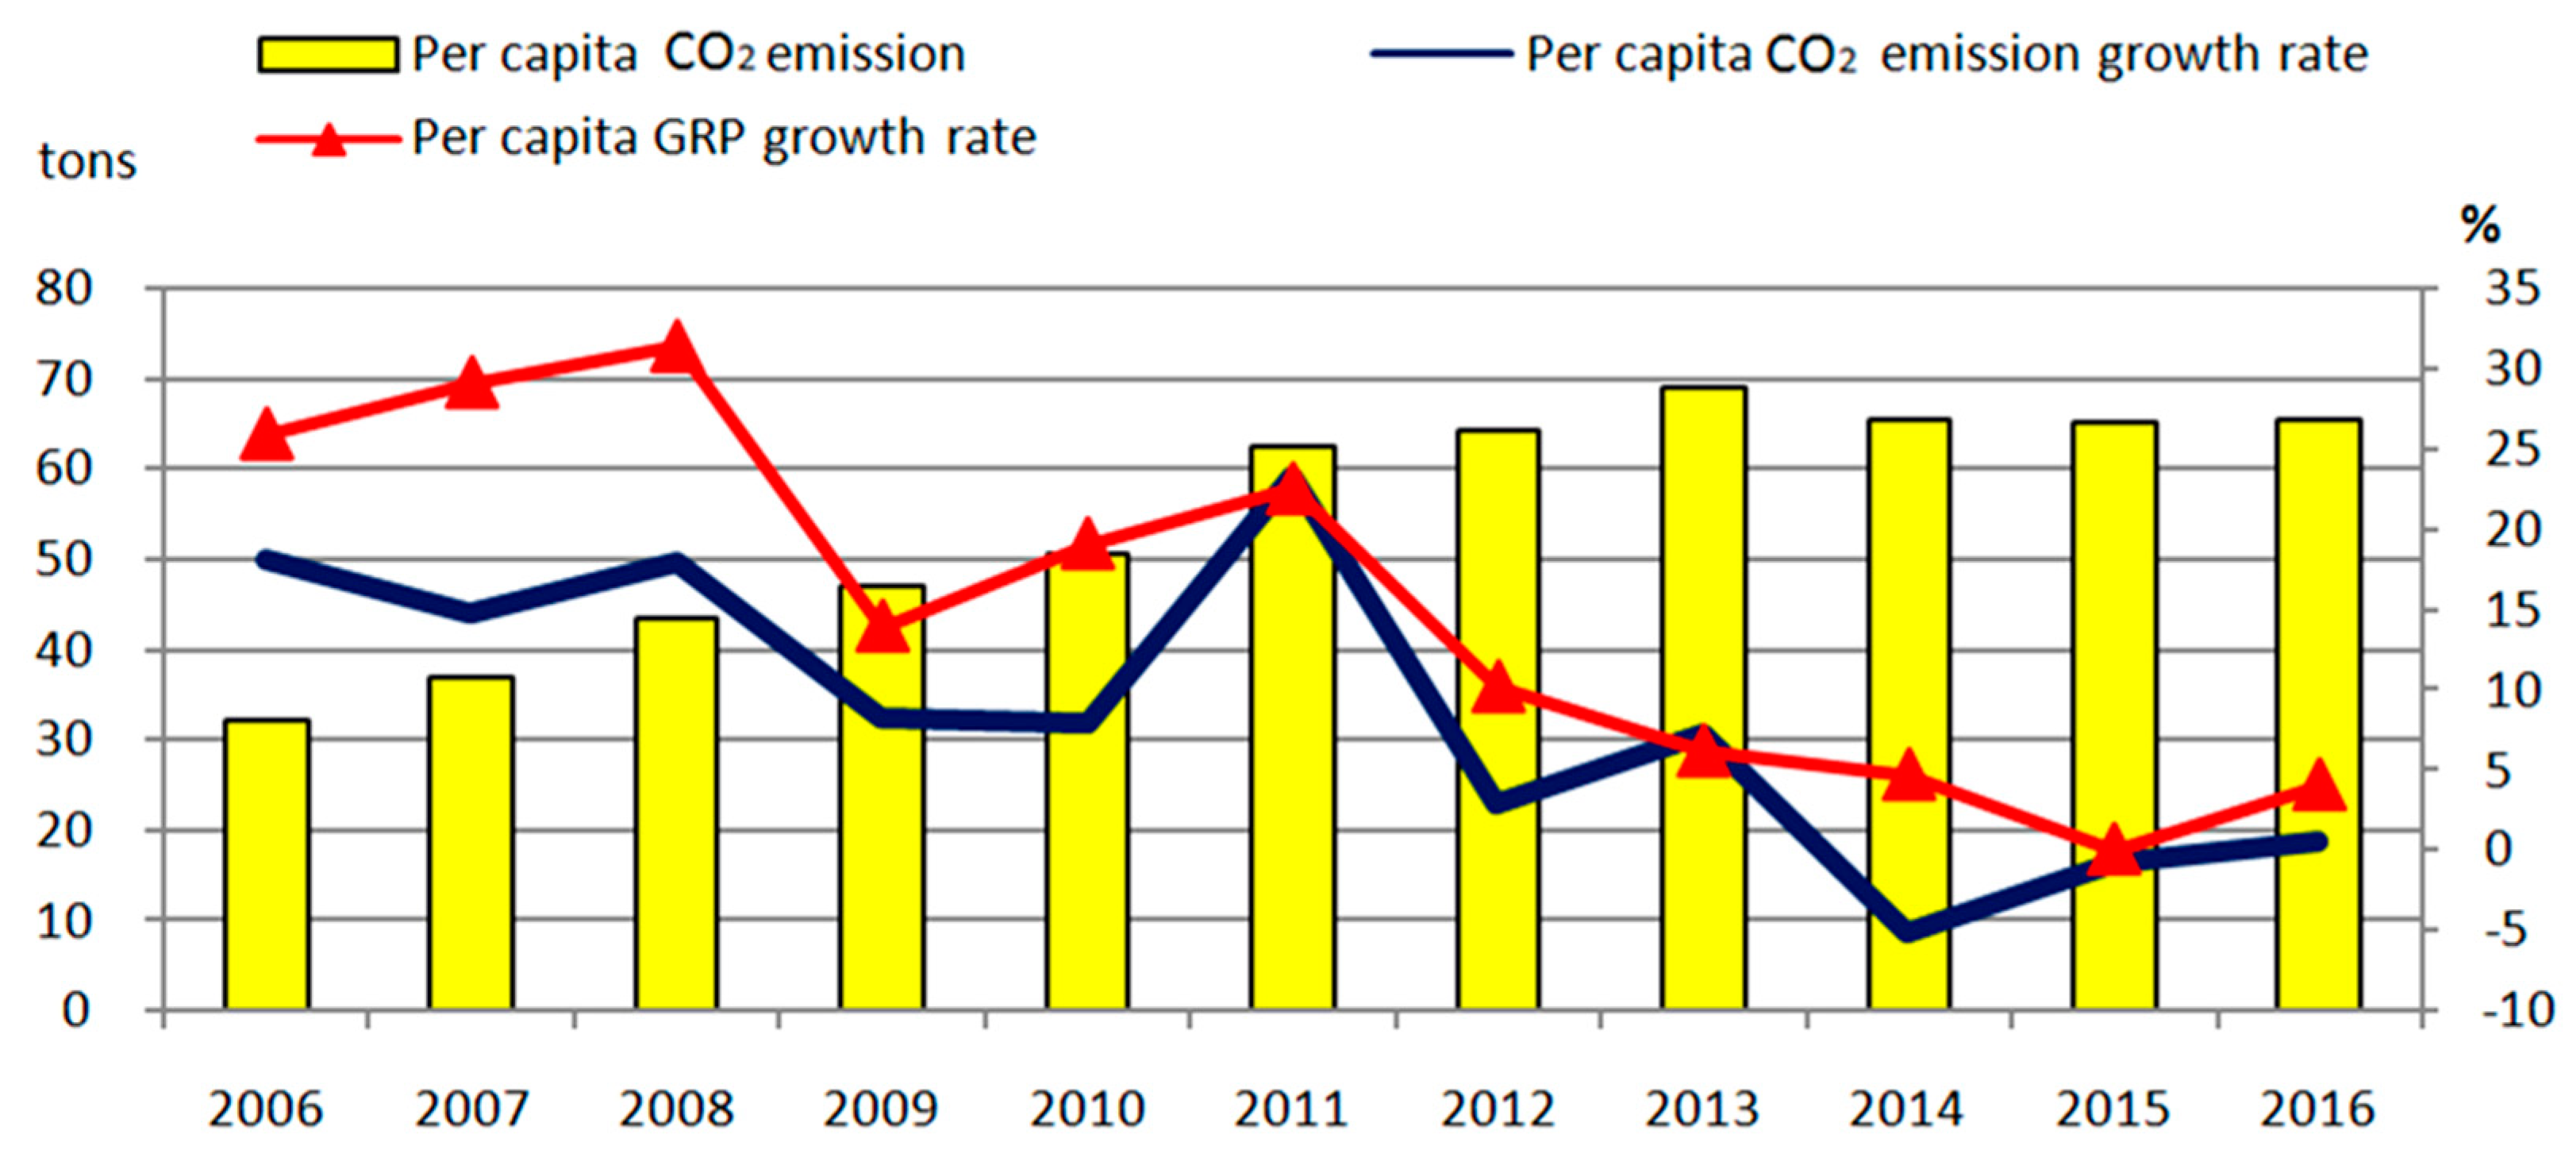
Figure 1 shows the change rate of per capita CO2 emissions, per capita CO2 emissions growth rate, and per capita GRP growth rate from 2006 to 2016. The per capita CO2 emission changes can be divided into two periods, from 2006 to 2013 and from 2014 to 2016. From 2006 to 2013, the per capita CO2 emissions increased rapidly from 32.0 (tons/person) in 2006 to 69.0 (tons/person) in 2013, a 2.15-fold increase in eight years. From 2014 to 2016, despite a slight decline in the per capita CO2 emissions, the standard of above 65 (tons/person) was maintained. Interestingly, the per capita GRP growth and per capita CO2 emissions growth rate fluctuations during the research period were almost consistent, indicating Inner Mongolia’s economic growth fluctuations led to energy consumption fluctuations.
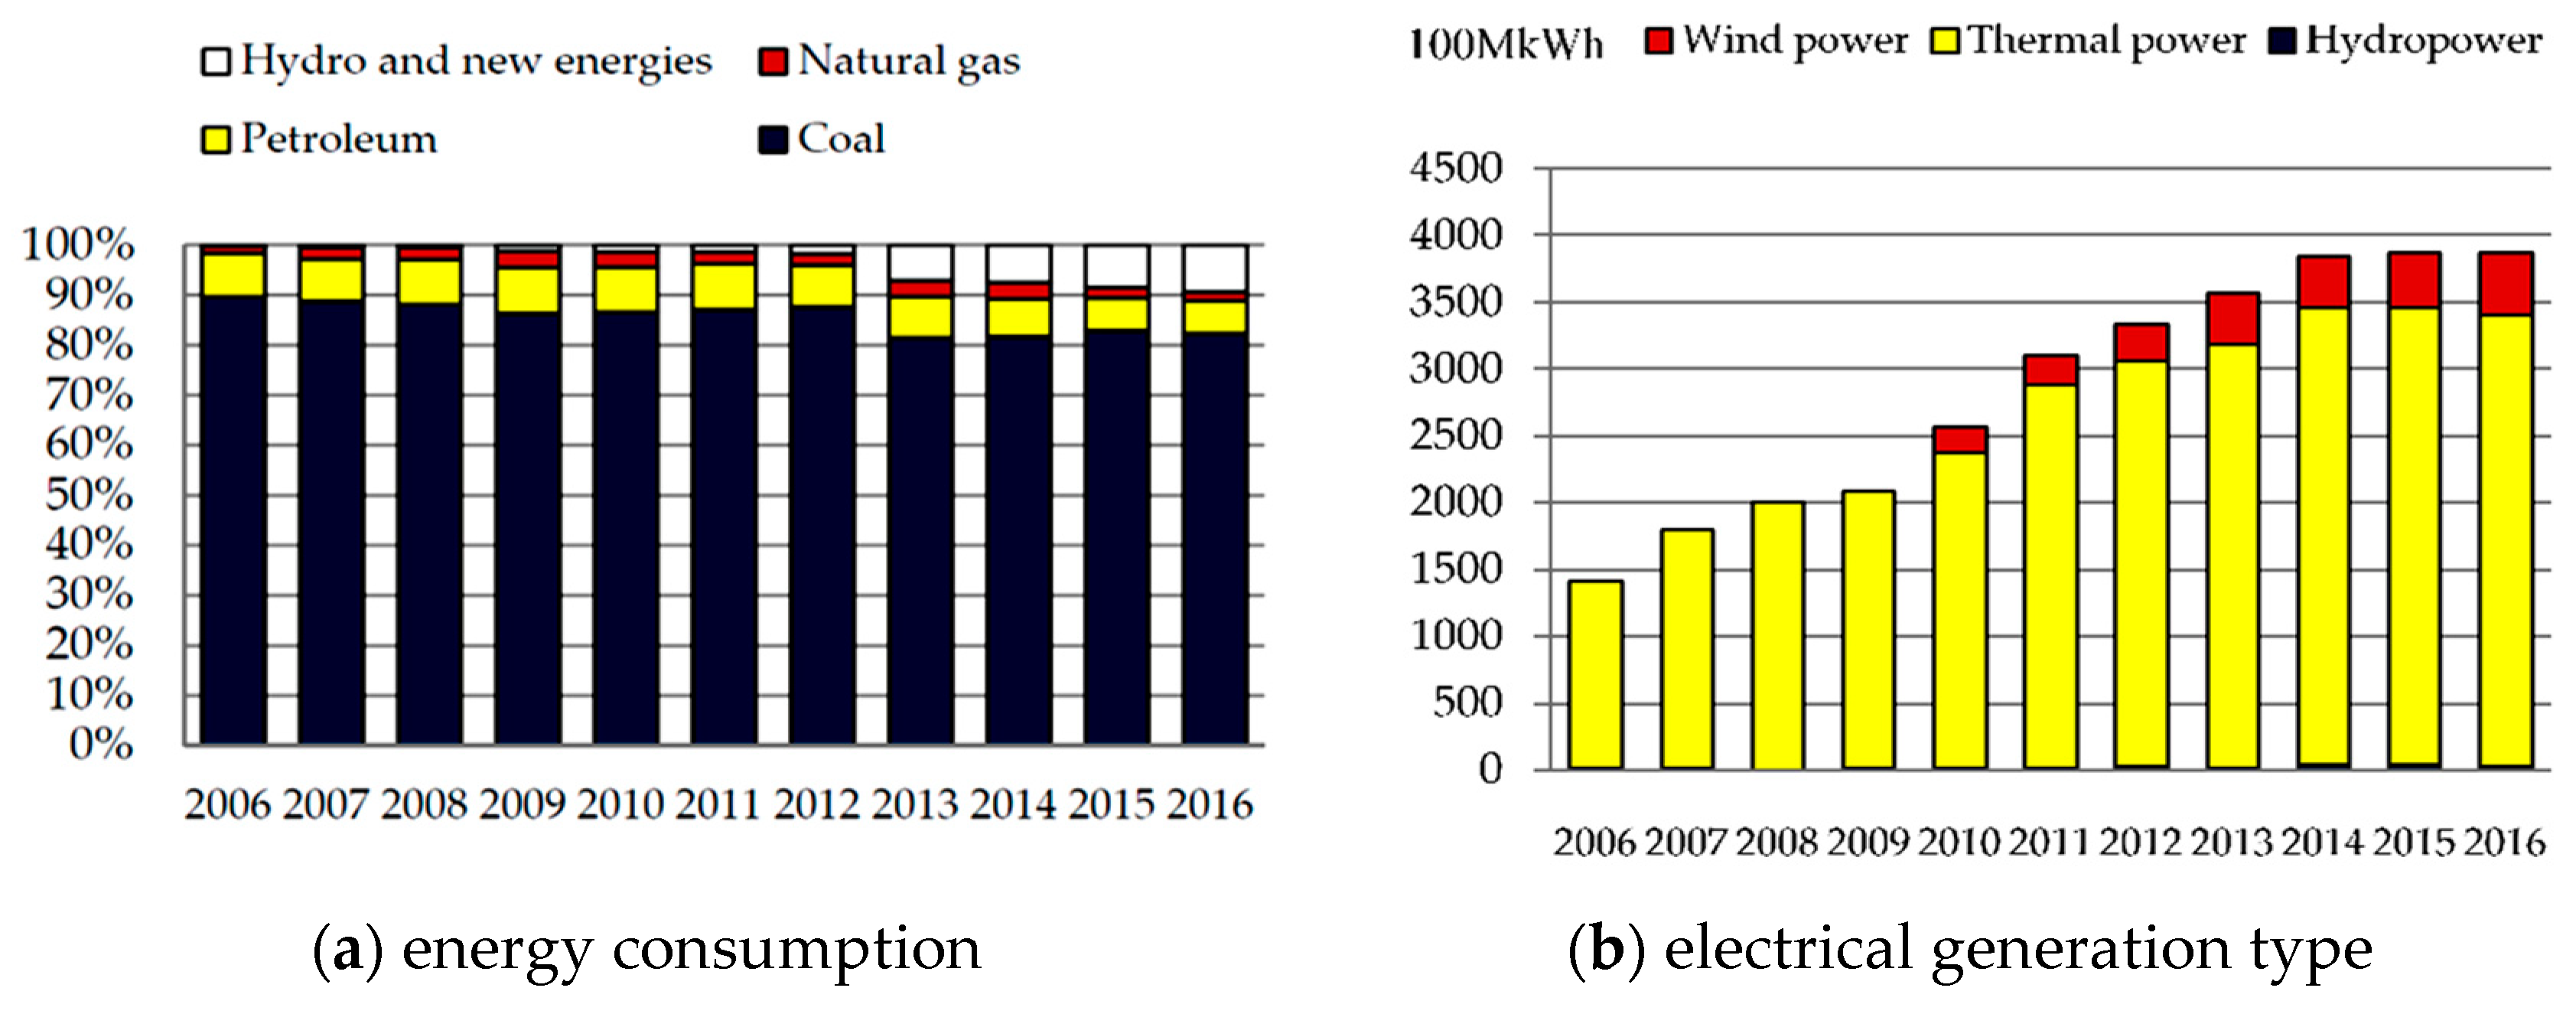
In this study, the energy consumption and electrical generation structure in Inner Mongolia is presented according to official statistics [9], as shown in Figure 2. Coal is the main pattern of energy consumption in the region, and has remained regularly above 81%, followed by petroleum, which, in 2014, was above 7.48%, but decreased to below 6.50% in early 2015. The renewable energy (including hydropower, wind power, etc.) was mainly hydropower before 2008, with a weight of below 0.5%. However, wind power construction started in Inner Mongolia in 2009 and the renewable energy weight exceeded 1.0%. Rapid growth in wind power capacity has resulted in a rise from 1.75% in 2012 to 7.07% in 2013, and it even reached 9.35% in 2016 (See Figure 2a).
In terms of the electrical generation pattern, thermal power is the main source of power generation in Inner Mongolia, with a weight of above 85%. From 2010, wind power has become the second source of power generation (7.88%), reaching 11.75% in 2016 (See Figure 2b). At the same time, total electrical generation grew rapidly at an average annual rate of 17.24% between 2013 and 2014. From early 2014, the growth rate slowed to below 1.7%. An examination of Figure 1 shows that due to the renewable energy ratio increase and rapid wind power growth starting in 2013, the per capita CO2 emission and per capita CO2 emissions growth rate slowed down significantly.
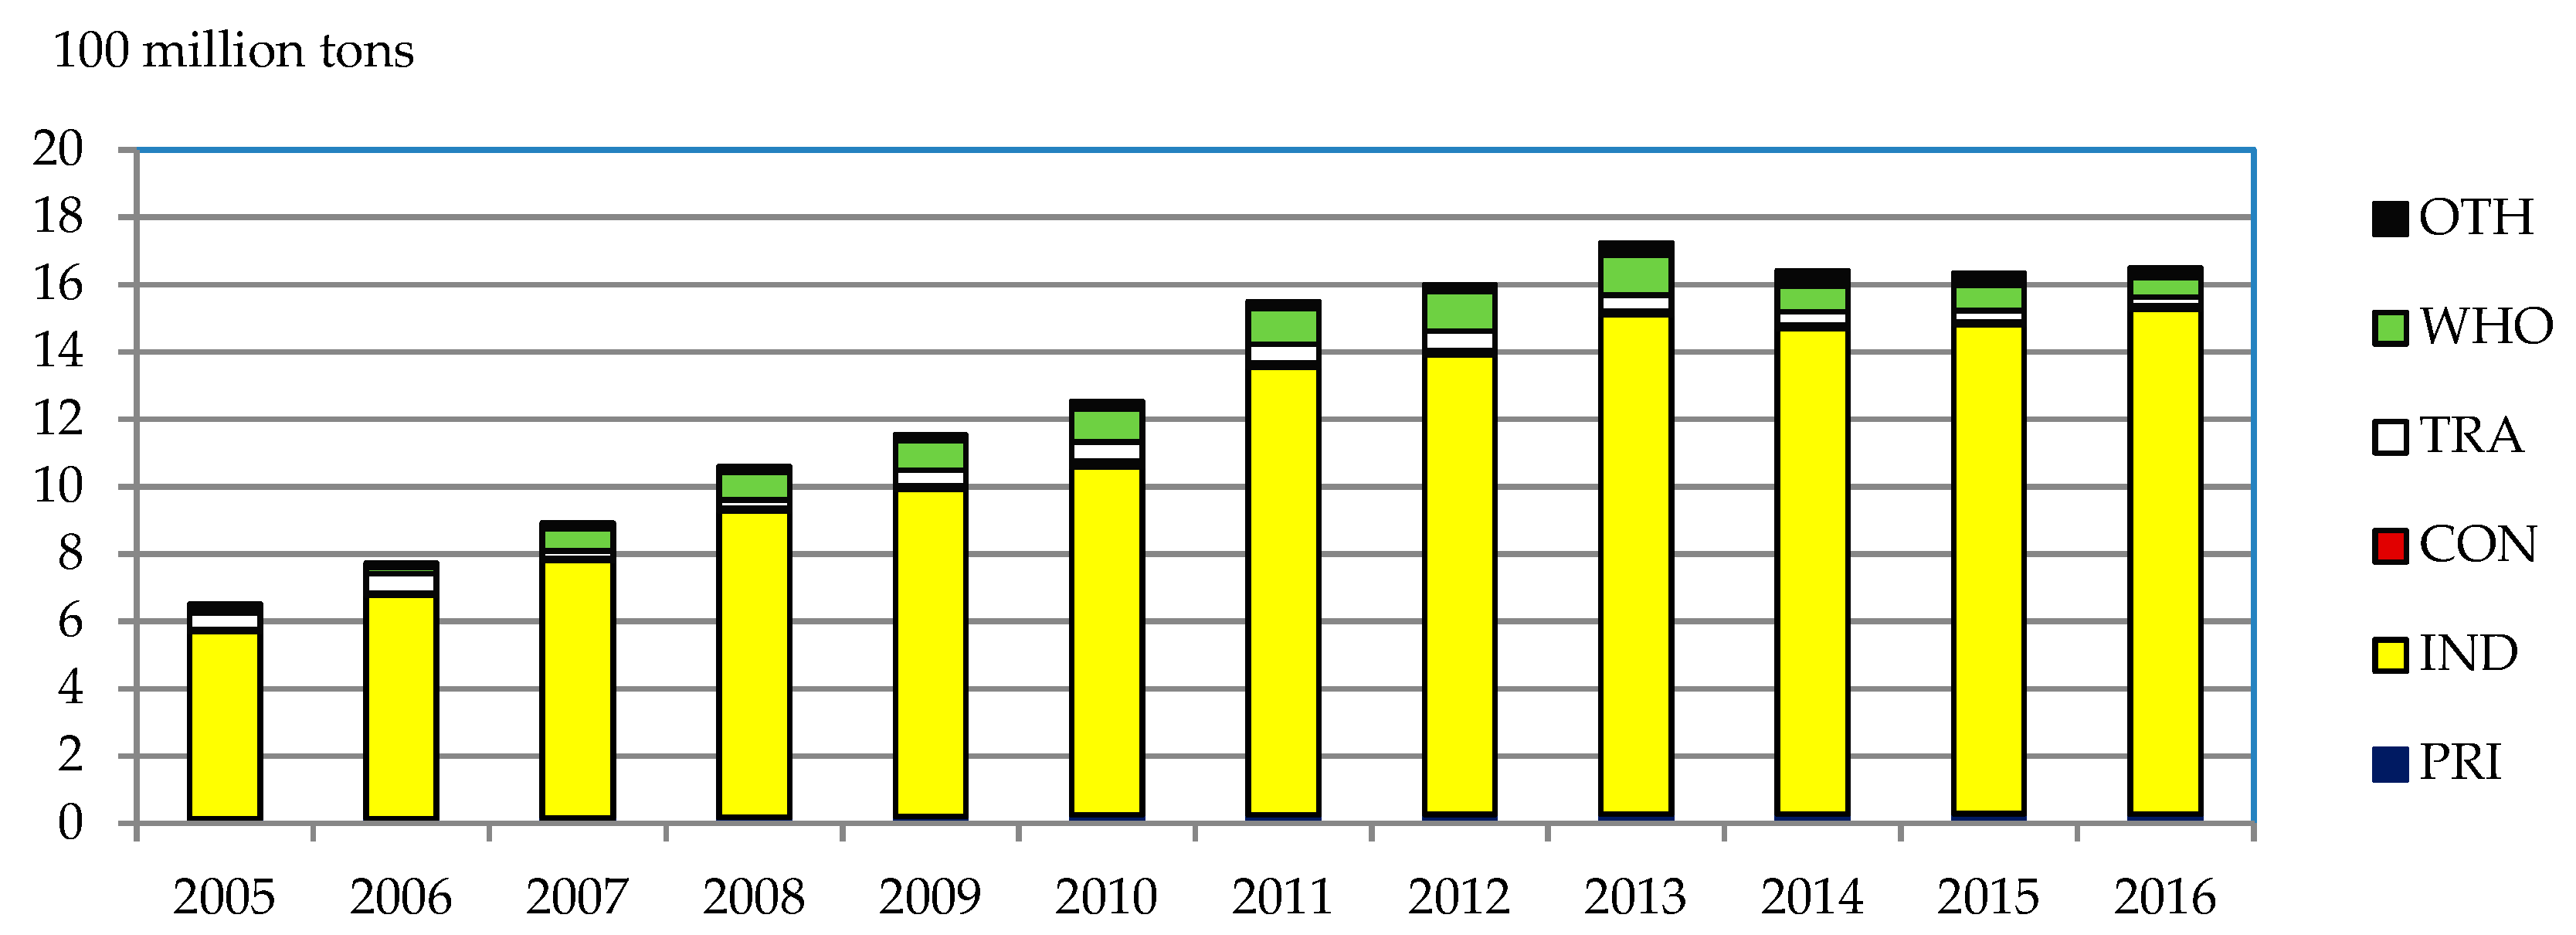
What industries are the main sources of CO2 emissions in Inner Mongolia? Figure 3 shows Inner Mongolia’s total CO2 emissions and the emission of the respective industry sectors from 2005 to 2016. From 2006 to 2013, the CO2 emissions increased rapidly from 651.03 million tons in 2006 to 1723.24 million tons in 2013, a 2.64-fold increase in eight years. The figure was maintained at above 1600.00 million tons despite a slight decline in CO2 emissions between 2014 and 2016. The industry sector (IND) is the main source of CO2 emissions in Inner Mongolia, ranging from 82.45% in 2010 to 90.95% in 2016. The transportation, storage, and post and telecommunications service sectors (TRA) had the highest share of CO2 emissions in 2005, accounting for 7.65% and this had decreased to 1.59% by 2016. The industrial share of the wholesale and retail trade, and quarters and catering sectors (WHO) was lowest in 2006, accounting for 2.28% and highest in 2010, when it reached 7.82%. The shares of the remaining industries were lower without obvious fluctuation. However, as the CO2 emissions of a particular industrial sector rises, emissions in the transportation, storage, post and telecommunications services sectors (TRA), as well as the wholesale, retail trade, and quarters and catering sectors (WHO) decrease significantly.
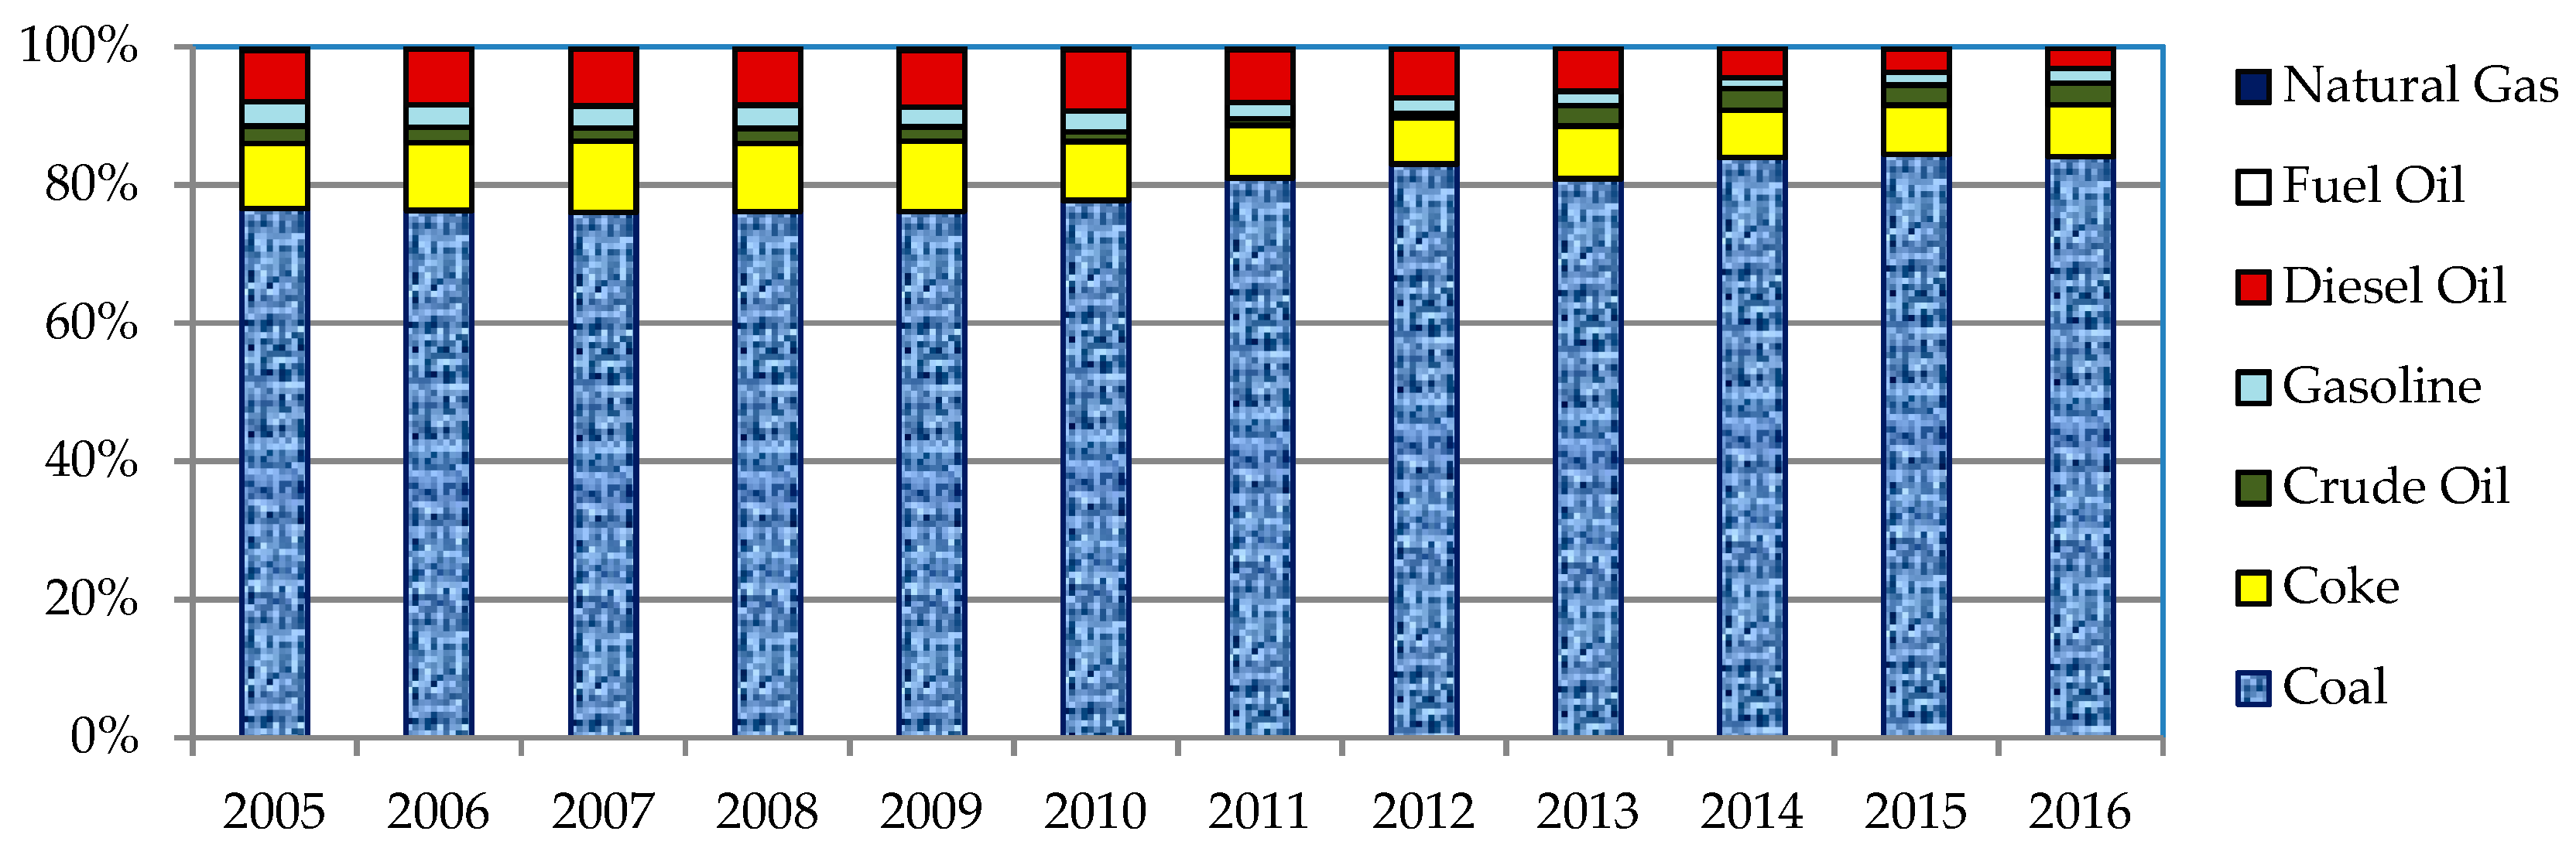
The CO2 emissions from different fuel types and sources were also analyzed. Figure 4 shows that coal is the biggest source of CO2 emissions, with an emission that rose rapidly from 498.47 million tons (76.57%) in 2005 to 1383.42 million tons (83.88%) in 2016. This was followed by coke with emission that increased from 61.36 million tons (9.42%) in 2005 to 123.42 million tons (7.48%) in 2016. In other words, the CO2 emissions weight of coal and coke combined remained above 85% and coal-based fuel clearly plays a determining role in CO2 emissions in Inner Mongolia.
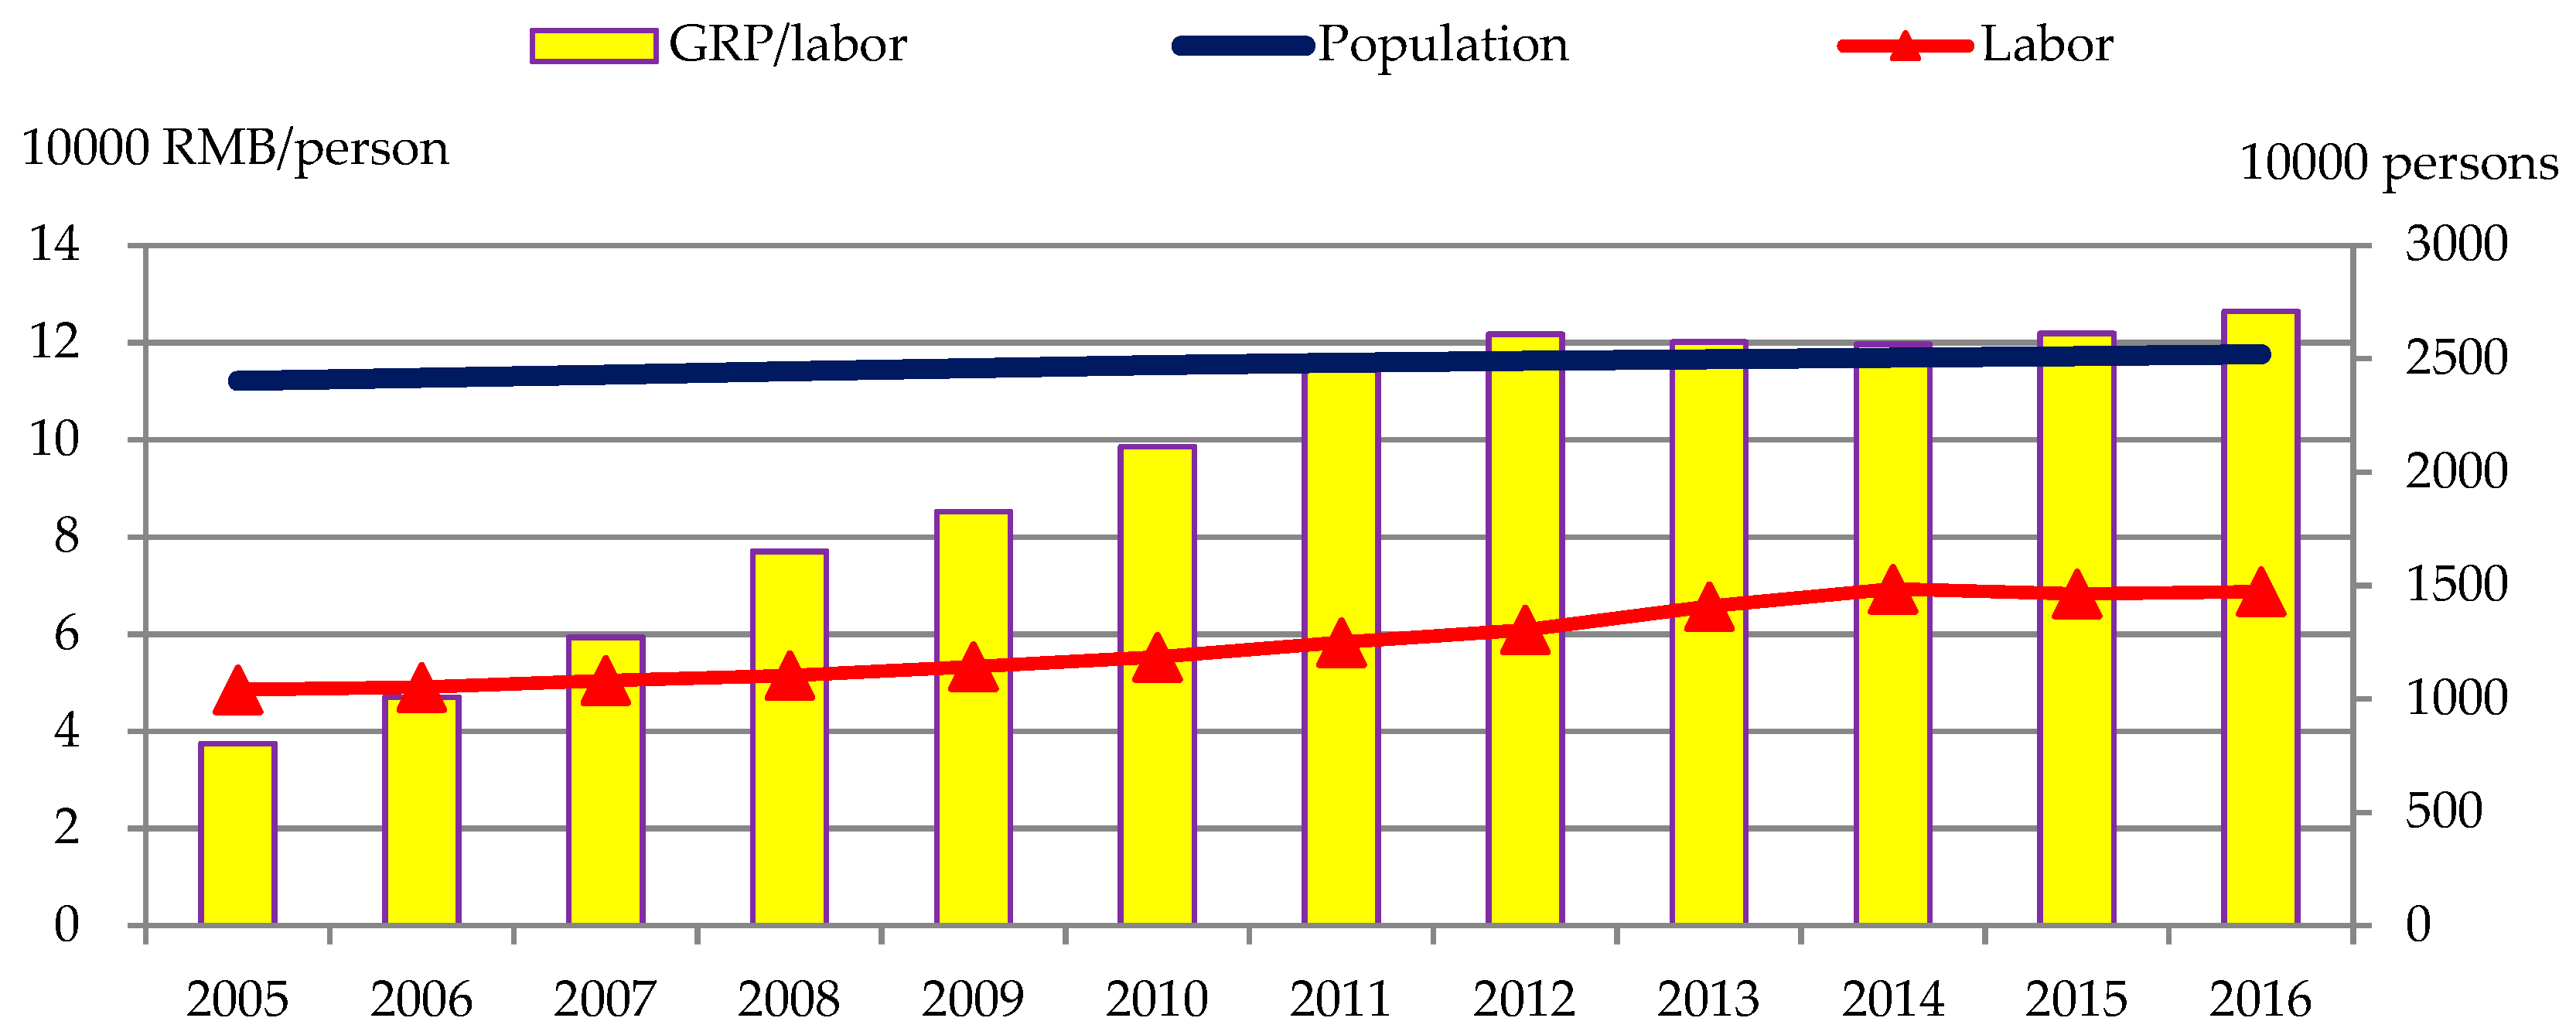
4.2. Features of Population, Labor and Labor Productivity in Inner Mongolia
Under the promotion of the “Western Development” strategy, during the “Eleventh Five-Year Plan” and the “Twelfth Five-Year Plan” periods, population, labor, and labor productivity of Inner Mongolia showed significant growth. Figure 5 shows that the population of Inner Mongolia grew from 24.031 million in 2005 to 25.201 million in 2016. The labor force also increased, from 43.32% (10.41 million people) in 2005 to 58.49% (14.74 million) in 2016. Labor productivity also increased significantly from 37.5 (thousand RMB/person) in 2005 to 126.4 (thousand RMB/person) in 2016, a 3.37-fold increase.
4.3. Industrial Share of GRP and Energy Consumption in Inner Mongolia
Figure 6 and Figure 7 show the GRP and industrial energy consumption proportions and changes. Figure 6 shows that during the research period, the GDP of Inner Mongolia showed an annual increase from 390.503 billion RMB in 2005 to 1863.444 billion RMB in 2016. From the perspective of industry structure, under the guidance of the “Western Development” strategy, the proportion of the industry sector increased from 37.85% in 2005 to 41.63% in 2016, even reaching 49.45% in 2011. As a result, the rate of the primary sector decreased from 15.10% in 2005 to 8.74% in 2016. The rate of the wholesale and retail trade, quarters and catering sector remained between 12% and 13%. The transportation, storage, post and telecommunications services sector fell from 10.90% in 2005 to 6.96% in 2016. Interestingly, the “Western Development” strategy also promoted the growth of other sectors (mainly tertiary industry), with an increase from 16.87% in 2005 to 22.57% in 2016.
How much energy has been used by the respective industry sectors? Figure 7 shows the share of use and quantities of energy consumed by industry. During the research period, the industry sector topped the list using more than 77% of the energy, although its average GRP contribution was only 44%. The transportation, storage, and post and telecommunications services sector ranked the second place, using 7.70% energy on average and the wholesale and retail trades, and quarters and catering came third using an average of 4.92% of the energy. A comparison of the industry CO2 emissions and fuel form changes in Figure 5 and Figure 6 show that although 2013 did not have the highest energy consumption, it did have the highest CO2 emissions. The reason for this was that the energy consumption share of the industry sector was high and reached 77.26% (0.74% higher than the 76.52% of 2012), and the coal and coke usage was much more than in 2012, the result was an increase in CO2 emissions of 51.32 million tons in 2013. The use of coal and coke by industry is accompanied by a rise in the rate of CO2 emissions.
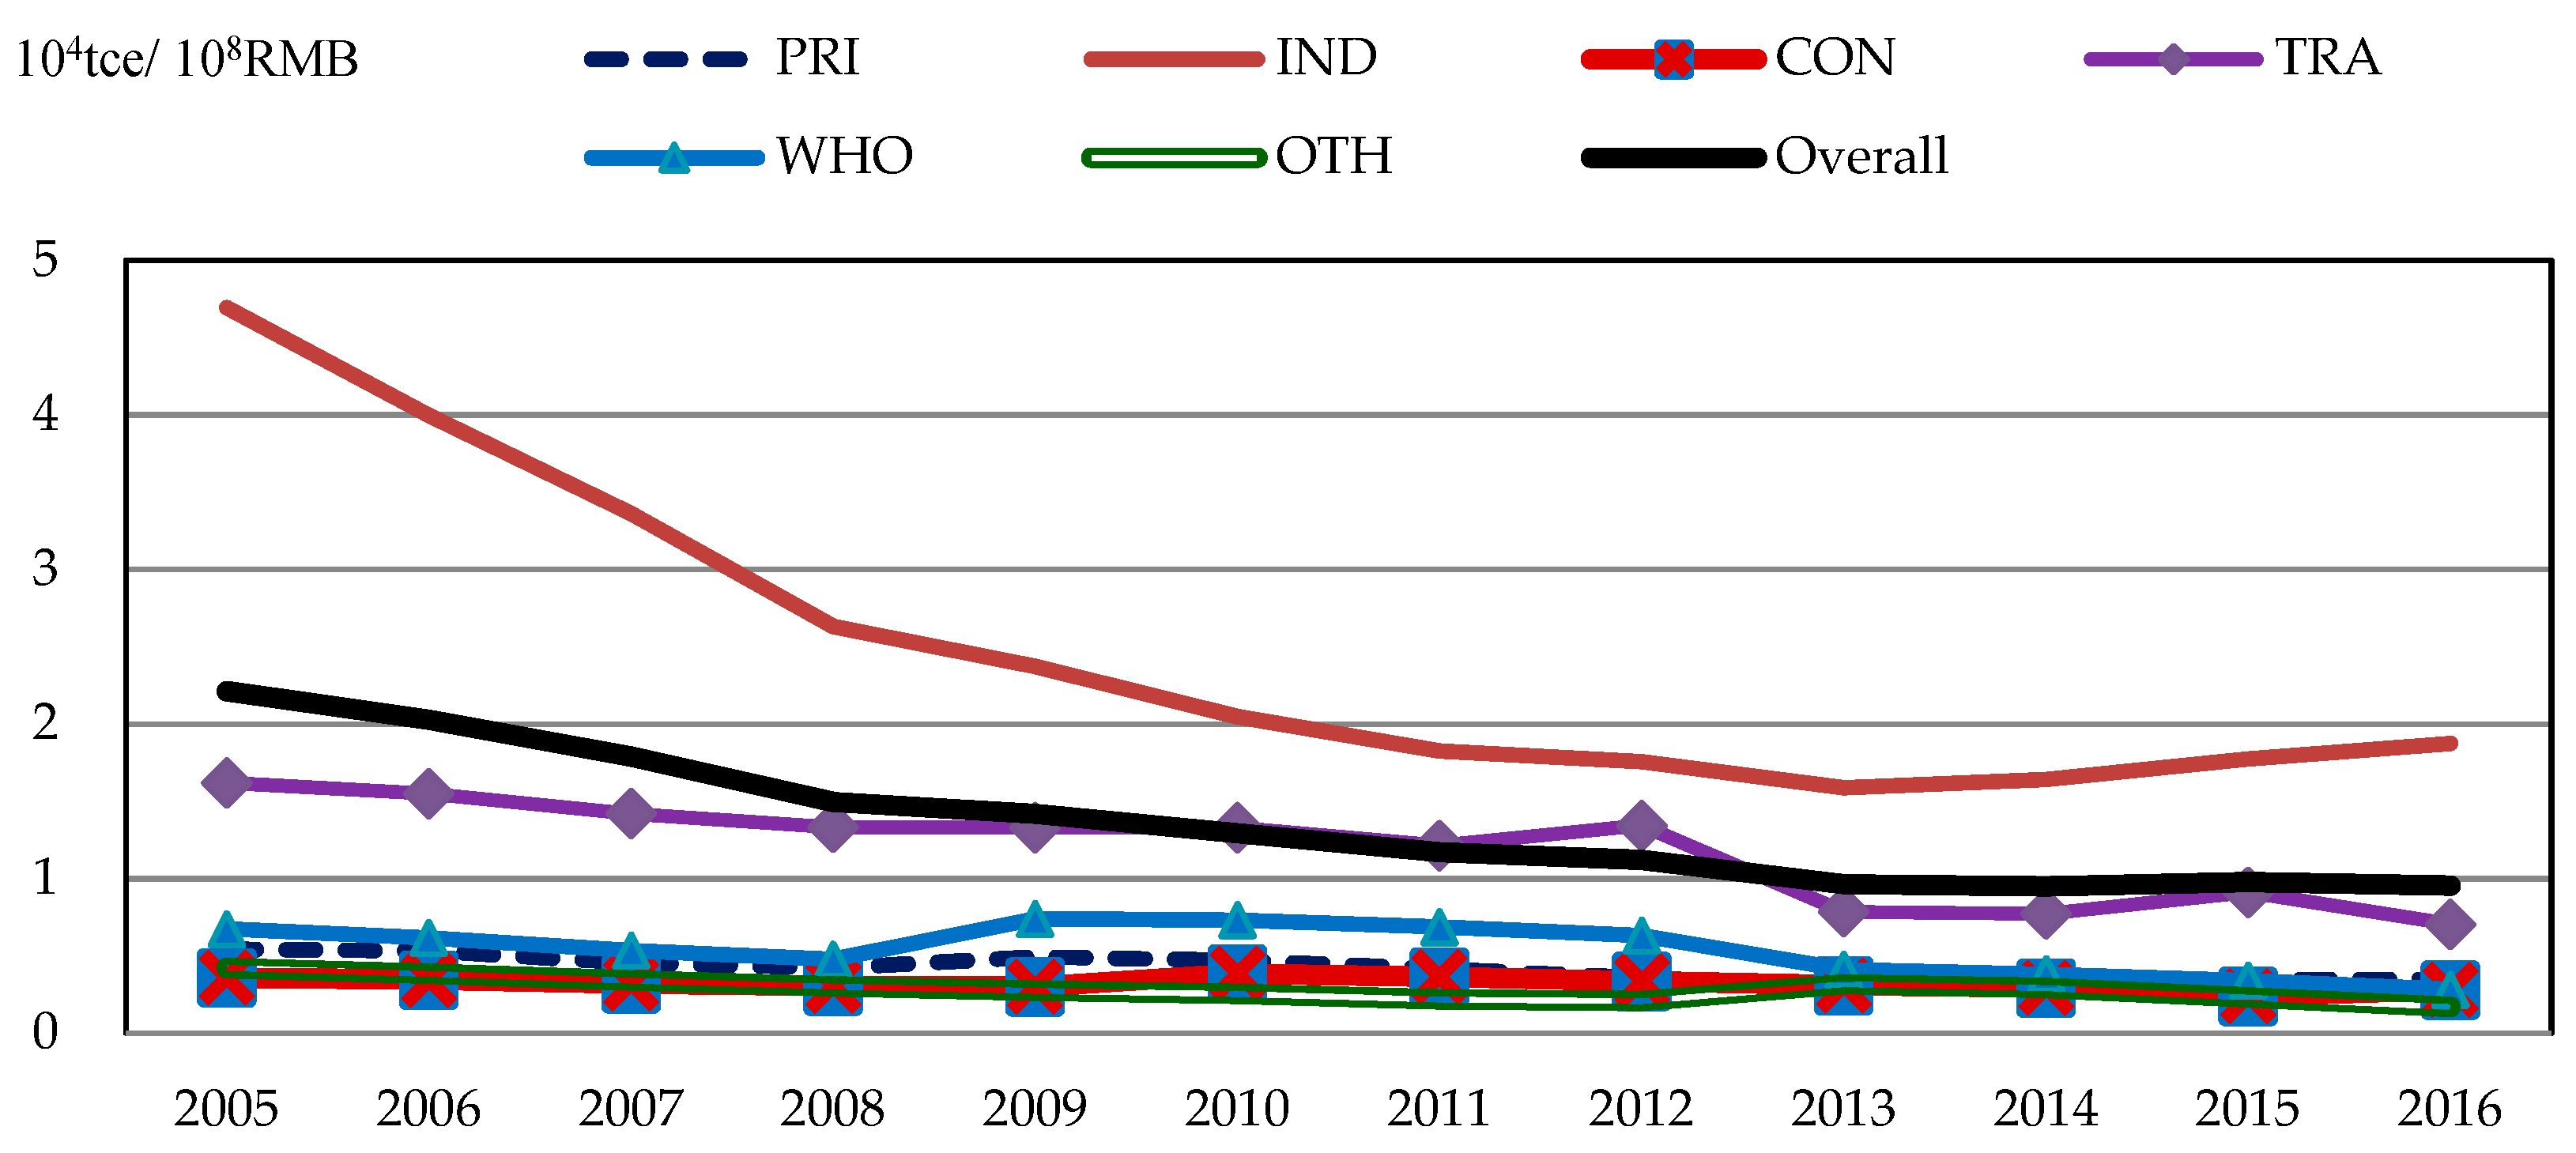
4.4. Energy Intensity and CO2 Emission Intensity in Inner Mongolia
Figure 8 and Figure 9 show the energy intensity and CO2 emission intensity change trends in Inner Mongolia. The government’s “Energy Conservation and Carbon Reduction” policy has resulted in a significant decrease in the whole industry energy density in the region, from 2.2117 (104 tons tce/108 RMB) in 2005 to 0.9541 (104 tons tce/108 RMB) in 2016. The energy density in the industry sector entered a period of decline between 2005 and 2013, dropping from 4.6938 (104 tons tce/108 RMB) in 2005 to 1.5864 (104 tons tce/108 RMB) in 2013. However, from 2013 to 2016, the energy density of the sector showed annual increases from 1.5864 (104 tons tce/108 RMB) to 1.8741 (104 tons tce/108 RMB). However, their CO2 emissions were at a record high, despite the relatively low levels of whole industry and the industry sector in 2013. This observation revealed clear decoupling between the Inner Mongolia energy density decrease and CO2 emission reduction (See Figure 8).
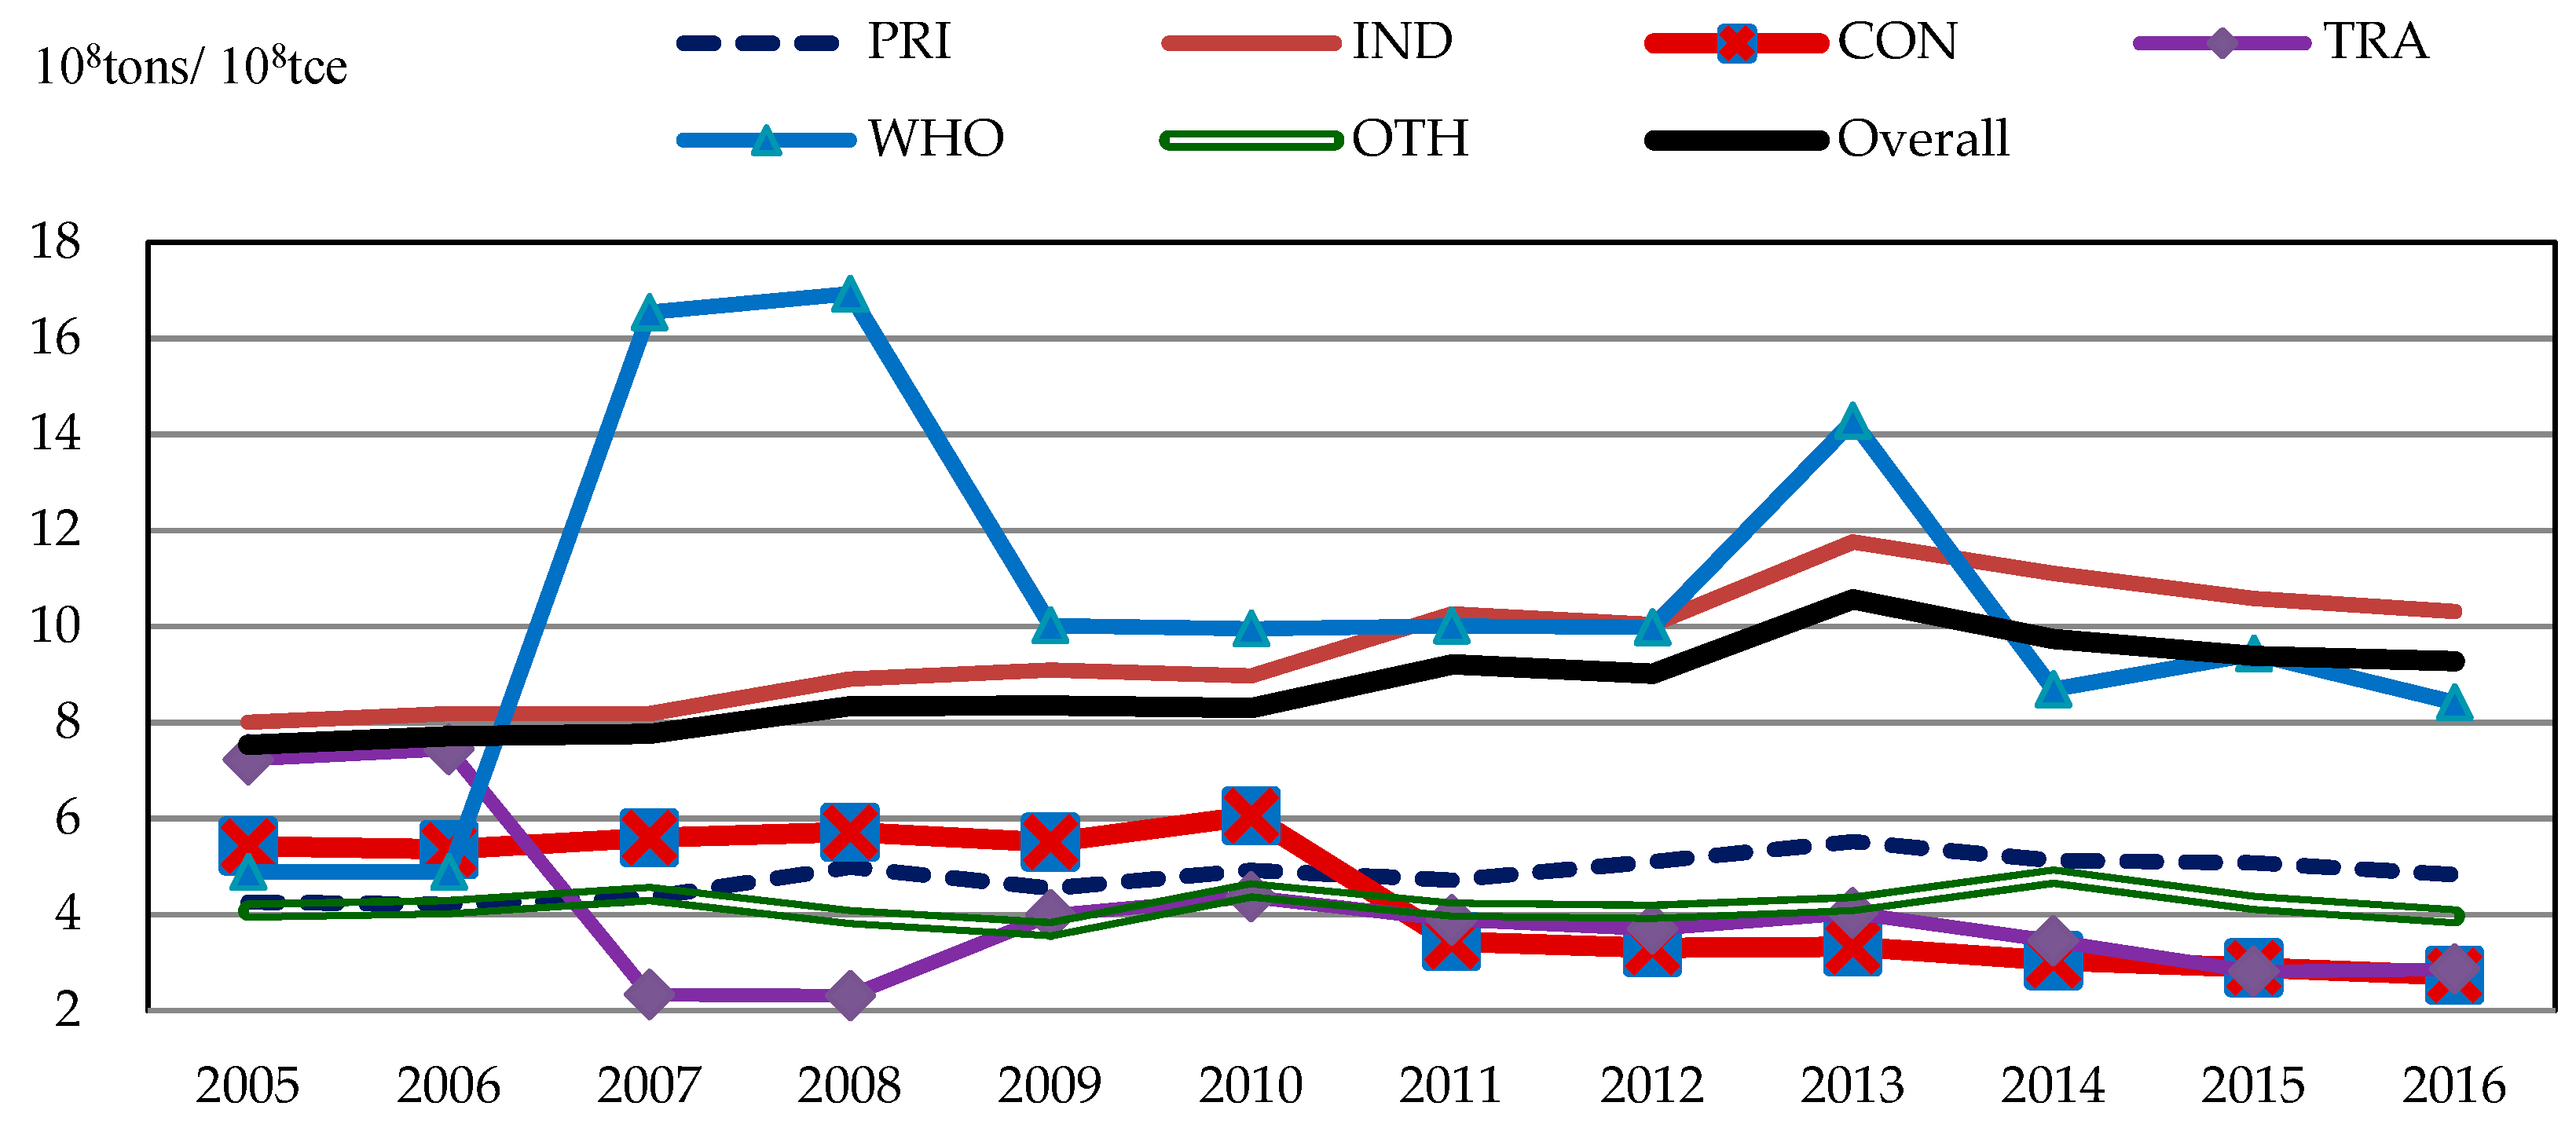
The CO2 emissions of each unit energy usage by each respective industrial sector was further analyzed. The top three in the list in terms of CO2 emission intensity were the industry sector, whole industry and wholesale and retail trade, quarters and catering sector. First, from 2005 to 2013, the CO2 emission intensity of the industry sector increased significantly, from 8.01 (tons/tce) in 2005 to 11.76 (tons/tce) in 2013. From 2013 to 2016, the CO2 emission intensity of the industry sector decreased slightly to 10.32 (tons/tce) in 2016. Subsequently, from 2005 to 2013, the CO2 emission intensity of whole industry showed a significant increase, from 7.54 (tons/tce) in 2005 to 10.56 (tons/tce) in 2013. From 2013 to 2016, the CO2 emission intensity of whole industry showed a slight decrease, down to 9.28 (tons/tce) in 2016. Figure 9 also shows that the trend towards change in CO2 emission intensity of the industry sector and whole industry are almost the same. This means that if the CO2 emissions of the industry sector per energy usage can be controlled, the whole industry CO2 emissions in Inner Mongolia can be improved.
4.5. Decomposition Results of CO2 Emissions
4.5.1. Additive Decomposition Results of CO2 Emission Changes in Inner Mongolia
In this study, the LMDI method was used to decompose the final energy-related CO2 emissions from 2006 to 2016, as shown in Table 4. Through a comparison of the “Eleventh Five-Year Plan” period (2006–2010), the “Twelfth Five-Year Plan” period (2011–2015), and the research period (2005–2016), it was found that the additive decomposition index during the “Eleventh Five-Year Plan” period accounted for 64.70% of that of the “Twelfth Five-Year Plan” period. This signified a slowdown in CO2 emissions growth during the “Twelfth Five-Year Plan” period. The factors affecting CO2 emissions were further analyzed. It was found that the main factors contributing to increased CO2 emissions throughout the entire research period included the population factor (0.5072), labor factor (3.2028), labor productivity factor (12.9649), economic structure factor of the industry sector (0.9054), and emission intensity factor of the industry sector (2.4035). The energy intensity factor of the industry sector (−8.7136), that of transportation, storage, post and telecommunications services sector, and emission intensity effect of transportation, storage, post and telecommunications services sector are the main CO2 emission factors.
During the “Eleventh Five-Year Plan” period, the main drivers of increased CO2 emissions included the labor factor (0.9256), the labor productivity factor (8.8624), the economic factor of the industry sector (1.8482), and the emission intensity of the industry sector (0.8771); the main inhibitor was the energy intensity of the industry sector (−6.3763). During the “Twelfth Five-Year Plan” period, the drivers and inhibitors varied slightly. The factors having a positive effect on increasing CO2 emissions included the labor factor (2.2260), the labor productivity factor (3.6489), and the emission intensity of the industry sector (1.7208). The main inhibitors were the economic structure factor of the industry sector (−0.5724) and the energy intensity of the industry sector (−2.6922). Interestingly, the economic structure factor of the industry sector showed a driving effect during the “Eleventh Five-Year Plan” period but showed an inhibitory effect during the “Twelfth Five-Year Plan” period.
The results in Table 4 show that the industry sector and the transportation, storage, post and telecommunications services sectors are the two key departments inhibiting CO2 emissions in Inner Mongolia. In terms of the industry sector, during the “Twelfth Five-Year Plan” period, when the industry sector weight decreased from 49.45% in 2011 to 43.40% in 2015 (Refer to Figure 5), the decomposition index had a negative value (−0.5427). During the “Eleventh Five-Year Plan” period and the “Twelfth Five-Year Plan” period, the high-intensity energy conservation policy [4,45] led to a substantial decrease in the energy intensity factor of the industry sector, which slowed down the increase in CO2 emissions (Refer to Figure 7). Since the emission intensity of the industry sector continued to increase during the “Eleventh Five-Year Plan” period and remained high during the “Twelfth Five-Year Plan” period, the emission intensity of the industry sector still produced a positive effect on CO2 emissions. The Government energy conservation policy also affected the transportation sector, and the energy intensity factor and emission intensity in the transportation, storage, post and telecommunications services sector decreased (Refer to Figure 7), it also produced an inhibitory effect on the CO2 emissions of the whole region.
These results showed that the “energy conservation and carbon reduction” policy targeting energy intensity index control of the industry sector had been successful (especially during the “Eleventh Five-Year Plan” period The CO2 emission density restriction also produced significant results for the transportation, storage, post and telecommunications services sectors. In addition, reducing the weight of the industry sector also inhibited an increase in CO2 emissions, but there is still room for improvement in terms of the transportation, storage, post and telecommunications services sector with respect to energy intensity restriction and CO2 emission density control. This means that if policy tools can effectively adjust the industrial share of the industry sector and control the CO2 emissions of each unit using energy, the result would be a reduction of CO2 emissions in Inner Mongolia.
4.5.2. Multiplicative Decomposition Results of CO2 Emission Changes in Inner Mongolia
According to the results in 4.5.1, given as physical units from an additive decomposition perspective, the population factor, labor factor, and labor productivity factor all contributed to the increase in aggregate CO2 emissions, whereas the economic structure factor, energy intensity, and emission intensity factor had different signs of CO2 emissions depending on the different industrial sectors. The multiplicative decomposition index was therefore used in this study to analyze the CO2 emission dynamic trends in Inner Mongolia. Table 5 shows the respective factors in the accumulative decomposition of changes in CO2 emissions from 2006 to 2016.
Firstly, during the research period (2005–2016), the labor and labor productivity factors contributed to increased CO2 emissions, especially labor productivity, which, in 2016, showed an increase of 234.43% compared to the level in 2005, while the labor factor increased by 34.75%. The economic structure, the industry, transportation, storage, post and telecommunications services, and other sectors, produced 10%, 10.33%, and 33.80% increases in positive CO2 emissions. For the energy intensity factor, the CO2 inhibition results of the industry sector, transportation, storage, post and telecommunications services sector, and wholesale and retail trade, quarters and catering sector were −60.03%, −55.12%, and −55.31% respectively. For the emission intensity factor, the contributions of the primary sector, industry sector, and wholesale and retail trade, quarters and catering sector were positive, showing CO2 emissions of 12.79%, 28.79%, and 65.51% respectively. However, the inhibitory effect of the transportation, storage, post and telecommunications services sector reached up to −58.94%.
Secondly, an observation of the multiplicative decomposition indexes during the “Eleventh Five-Year Plan” and the “Twelfth Five-Year Plan” periods showed that the population, labor, and labor productivity factors significantly contributed to increased CO2 emissions. The “Western Development” strategy induced higher labor force and labor productivity each year, and this had a positive effect on enhancing CO2 emissions in Inner Mongolia. In terms of the economic structure factor, during the “Eleventh Five-Year Plan” period, only the industry sector produced a positive effect on CO2 emissions, while the other five industrial sectors were inhibitory. However, during the “Twelfth Five-Year Plan” period, only three industrial sectors, primary, industry, and wholesale and retail trade, and quarters and catering showed significant inhibition. During the “Twelfth Five-Year Plan” period, all the industries showed some inhibition of CO2 emissions, showing that the energy density suppression policy did indeed have a significant effect. However, during the “Eleventh Five-Year Plan” period, the emission intensity factor only showed CO2 reduction in the transportation, storage, post and telecommunications services sector. During the “Twelfth Five-Year Plan” period, however, most of the sectors with the exception of the primary and industry sectors, contributed significantly to the inhibition of CO2 emissions, again showing that the energy policy was effective during the “Twelfth Five-Year Plan” period. However, emission density in the main the industry sector still showed an increase.
4.6. Decoupling Analysis in Inner Mongolia
The decoupling elasticity index calculation results from this study are as shown in Table 6. According to the Tapio [19] classification, weak decoupling was found between the Inner Mongolia economic growth rate and CO2 growth rate from 2006 to 2016. In other words, the current rapid economic growth in Inner Mongolia poses a weak threat to decoupling and CO2 emission reduction is needed. Furthermore, it can be seen from the figure that during the research period, the decoupling elasticity of population, labor, labor productivity, and economic structure all had positive value and showed weak decoupling. With the exception of the 2006–2007 periods, the decoupling elasticity of CO2 emission intensity was positive with weak decoupling. During the research period, the decoupling elasticity of energy intensity were negative and presented a strong decoupling state.
4.7. Discussion
The empirical results in this paper show that CO2 emissions in Inner Mongolia showed a significantly increasing trend before 2013. This conclusion is consistent with the results in many previous studies: All-China [11,13,14,15], Northwestern China [20]; Jiangsu [25], Guangdong transportation sector [22], Chongqing [28], heavy industry [34], and the transportation industry [32]. This means that the influences of a series of strong carbon reduction policies, initiated by the Chinese government during the “Twelfth Five-Year Plan” period, played effective roles in the inhibition of CO2 emissions. These policies included the “Twelfth Five-Year Energy Conservation and Emission Reduction Comprehensive Work Plan” (2011), “White Paper: The China Energy Policy” (2012), “The Action Plan on Prevention and Control of Air Pollution” (2013), “Action Plan on Energy Development Strategies” (2014), and “Comments on Accelerating the Construction of Ecological Civilization” (2015).
In this study, it was found that the rapid wind power growth and the renewable energy weight increase helped reduce the growth of CO2 emission. First, in 2009, two areas in Inner Mongolia were selected as ten-million-KW wind power bases in China (including 1. Ulanqab City and Bayannur Cityin Western Mongolia; 2. Xilingol League, Chifeng city, and Tongliao city in Eastern Mongolia) [46], effectively enhancing the region’s renewable energy power generation weight. Due to the serious wind (power) abandonment problem, Inner Mongolia has in recent years promoted the “multi-measure promotion of new energy accommodation” policy, including wind power heating supply, new energy hydrogen production, energy storage technology, and the direct supply of new energy to major users [47]. These policies have effectively reduced fossil energy use and inhibited the growth of CO2 emissions in recent years. Secondly, government promotion of the “Western Development” strategy in 2000 has resulted in the development of an equipment manufacturing industry, including the production of heavy-duty automobiles, construction machinery, railway vehicles, mining equipment, new-energy automobiles, wind power equipment, and so on [6,7]. Although the rise of these manufacturing industries has effectively supported the growth of the industrial and transportation sectors in Inner Mongolia, the problem of energy consumption has caused increased CO2 emission. Since the respective industrial sectors differ in production characteristics and CO2 emission, a systematic monitoring and management system is needed to regulate them. In other words, by use of the Best Available Techniques (BATs), equipment upgrades in the industrial sectors (especially in heavy industry) and transportation can reduce production costs as well as CO2 emissions [4,48].
In this study, it has been shown that the labor productivity factor, economic structure factor and energy density factor were the main drivers affecting CO2 emission fluctuations in Inner Mongolia, and this coincides with the finding of many previous studies [11,12,13,15,20,23,32]. Like a few research conclusions on Northwestern China [20] and All-China [14], it was also found that population had a weak positive effect on CO2 emissions growth, but this finding differed from the conclusion reached by Tang et al. [25] where population factors contributed to reduced CO2 emissions in Jiangsu. In addition, this study found that labor productivity promotion had a strong effect on CO2 emissions growth in Inner Mongolia, which coincides with the conclusion reached by Lin and Liu [34].
This study makes two new contributions: first, the effect of the six industry sectors on economic structure, energy density, and emission intensity factors were decomposed, which facilitated analysis of the effect of the three factors on emission fluctuations in the six industry sectors. Second, two new drivers have been proposed in this study: the labor and emission intensity factors. It has also been pointed out that continuous labor growth in Inner Mongolia exerted a significant effect on CO2 emissions growth and that emission intensity factors in the industry sector produced a strong effect on CO2 emissions growth in the region.
In terms of the decoupling effect, it was found that CO2 emissions growth and economic growth in Inner Mongolia showed a weak decoupling state during the research period. This finding was consistent with the results from the decoupling analysis conclusions of All-China [11,13] but differs from the finding of Northwestern China [20]. The effects of the respective factors were further explored. In this study, it was also found that the decoupling elasticity of population, labor, labor productivity, and economic structure all had positive value and showed weak decoupling, which came mainly from two policy factors—the “Western Development” strategy and “Energy Conservation and Carbon Reduction” policy. The measure for the adjustment of the economic structure of Western China, the “Western Development” strategy, was aimed at the promotion of economic development. However, the absolute value of the decoupling elasticity of economic structure showed a tendency to shrink, indicating a lessening of the decoupling effect. Another factor was the simultaneous implementation of the “Energy Conservation and Carbon Reduction” policy, with the goal to reduce energy intensity and establish intensity control significantly more than is achievable with economic structure adjustment.
5. Conclusions and Policy Implications
Inner Mongolia falls under the backward economic development region of China. The dual characteristics of high economic growth and large renewable energy bases gave rise to a contradictory situation where both high carbon emission and high carbon reduction occurred at the same time. To analyze the main factors contributing to high carbon emissions, the logarithmic mean divisia index (LMDI) was used to decompose the factors affecting terminal energy related carbon emissions by the respective industry sectors from 2006 to 2016. The Tapio decoupling model was used at the same time to determine the decoupling relationship between the CO2 emissions and the economic growth of Inner Mongolia. A summary of the conclusions reached is as follows:
- CO2 emissions: From 2006 to 2013, the CO2 emissions in Inner Mongolia increased rapidly from 651.03 million tons in 2006 to 1723.24 million tons in 2013, and the average annual growth rate reached 13.13%. From 2014 to 2016, despite a slight decline, CO2 emissions were maintained at above 1600.00 million tons. The per capita CO2 emissions remained above 65 (tons/person), and the fluctuation rate was almost consistent with the per capita GRP growth. This showed that economic growth fluctuations were closely related to CO2 fluctuations, and economic growth will trigger CO2 growth in the region.
- Energy consumption and electrical generation type: Coal ranks highest in energy consumption in Inner Mongolia, followed by petroleum. Beginning in 2009, the rapid growth in the volume of wind power devices caused a significant increase in renewable energy weight, from 1.17% in 2009 to 9.35% in 2016. Thermal Power is the main source of power generation in the region and the weight exceeds 80%. Starting in 2012, wind power became the second most important power generation source in Inner Mongolia, with the weight increasing rapidly, from 0% in 2009 to 11.75% in 2016. Moreover, the renewable energy weight increase and the rapid growth of wind power produced a positive impact on the inhibition of CO2 emissions growth.
- Population, economic structure, and energy structure: During the research period, the population, labor quantity and labor weight in Inner Mongolia all showed significant growth. The average GRP growth rate reached 15.76%, and labor productivity increased 3.37-fold. The industry sector had the highest energy consumption, accounting for over 77% of energy use, although its average GRP contribution was only 44%.
- Energy and emission density: The CO2 emission intensity and overall intensity of the industry sector showed almost consistent fluctuation. However, the energy density of the region was constantly higher than that of the whole industry, showing a decline from 2005 to 2013 and reversal to a slight increase from 2014 to 2016. The energy density of whole industry decreased significantly from 2.2117 (104 tons tce/108 RMB) in 2005 to 0.9541 (104 tons tce/108 RMB) in 2016. The industry sector and the whole industry showed similar energy density results and had the highest CO2 emission intensity. Furthermore, the CO2 emission intensity and fluctuation in the industry sector and whole industry were almost the same. Interestingly, there was decoupling, and an energy density decline, as well as CO2 emission reduction in Inner Mongolia.
- CO2 emissions source: In terms of the industry sources of CO2 emissions, the industry sector was the main source, with a rate that remained above 82% and even reached a record high of 90.95% in 2016. As the CO2 emission rate of the industry sector increased, that of the transportation, storage, post and telecommunications service sector, wholesale and retail trade, quarters and catering sectors decreased significantly. Coal-based fuel (coal and coke) was the main source of CO2 emissions in the region and was responsible for more than 85%.
- Factors affecting CO2 emissions: According to the decomposition results during research period, the population factor, labor factor, and labor productivity factor all had positive influences on the CO2 emissions, whereas the economic structure factor and emission intensity factor had different impacts on the CO2 emissions depending on different industrial sectors. Furthermore, the energy intensity of six industrial sectors contributed to the decrease in aggregate CO2 emissions. The economic structure factor of the industry sector, transportation, storage, post and telecommunications services sector, and others sector had positive effects on CO2 emissions growth. The emission intensity factor of primary sector, industry sector, transportation, storage, post and telecommunications services sector, and wholesale and retail trade, quarters and catering sector also had positive influences on CO2 emissions growth. The inhibiting effect was not enough to overcome the expansion effect and resulted in a sharp increase in CO2 emissions during 2005 and 2013. While the energy intensity factor of six industrial sectors, especially in the industry sector, had significant influences on decreasing CO2 emissions, the aggregate CO2 emissions showed a slight decline trend during 2014 and 2016.
- Decoupling state: According to the Tapio’s [19] classification of decoupling state, the growth rate and CO2 growth rate of Inner Mongolia during the research period showed weak decoupling. Based on these empirical results, the following policy recommendations are offered to reduce carbon emissions in Inner Mongolia.
- The Inner Mongolia economic growth rate and CO2 emissions growth rate showed strong decoupling. Driven by economic growth, CO2 emissions were constantly higher than 7 (100 million tons) during the “Twelfth Five-Year Plan” and even exceeded this in 2013 and 2016. Policies that will inhibit CO2 emissions are an urgent and immediate need. According to the findings of this study, the industry sector is the key to carbon reduction in this region. Furthermore, the transportation, storage, post and telecommunications services, primary, wholesale and retail trade, quarters and catering sectors should also receive attention.
- In the past, the “Energy Conservation and Carbon Reduction” policy of the government focused on control over energy density indicators. Based on the findings set out in this paper, partial results have been achieved, but there has been no effective link to CO2 emission reduction. This study clearly demonstrates that to effectively inhibit CO2 emissions growth in Inner Mongolia, the “carbon reduction” policy must start with the economic structure and emission intensity factors.
- The “Western Development” strategy has facilitated the rapid growth of the industry sector. However, the extensive coal and coke use has resulted in a high CO2 emission intensity. Therefore, it is suggested that when introducing investments from different industries into Inner Mongolia through the “Western Development” strategy, two indicators, the use of coal-based fuel and low CO2 emission intensity, should be the starting points to effectively inhibit CO2 growth.
- To reduce the contradictory phenomenon of the simultaneous development of high energy consumption (high carbon emission) and renewable energy (emission reduction) in Inner Mongolia, it is particularly important use the Best Available Techniques (BATs) to establish a customized supervision and management system targeting the industrial and the transportation sectors. In terms of the pollutant emission permit in the current stage, Inner Mongolia has only eight regulated sectors, including: animal slaughter and meat processing, the processing of other agricultural food and by-products, refined petroleum product manufacturing, ceramic product manufacturing, iron making, steel making, steel rolling, and the smelting of common non-ferrous metals [49]. To effectively inhibit CO2 emissions, the Best Available Techniques (BATs) are being used to expand the formulation of the pollutant emission permit and technical specifications targeting the equipment manufacturing sector (such as heavy automobiles, construction machinery, railway vehicles, mining equipment, coal technology and coal machinery manufacturing, and other high energy consumption industries).
- Because expansion of the transportation, storage, post and telecommunications services sectors leads to increased CO2 emissions, it is recommended that there should be active promotion of the development and use of battery powered electric vehicles to reduce the use of diesel and gasoline and inhibit CO2 emissions. The primary sector and wholesale and retail trade, quarters and catering sector should also be targeted with the aim of reducing the use of coal, diesel, and gasoline to lower the CO2 emission intensity, which is an effective means of reducing CO2 emissions.
Author Contributions
S.-W.T. conceived and designed the basic frame, carried out the main body of methodology, analyzed data, wrote the paper, reviewed the work, and improved the paper continuously.
Funding
The author greatly appreciates the sponsorship provided for this study by the Ministry of Science and Technology, Taiwan (MOST 106-2410-H-019-015-MY2).
Acknowledgments
The author greatly appreciates the research assistance provided by Yen-Yu Chen.
Conflicts of Interest
The author declares no conflict of interest.
References
- International Energy Agency. CO2 Emissions from Fuel Combustion; International Energy Agency: Paris, France, 2018. [Google Scholar]
- CO2 Emissions from Fuel Combustion Highlights. International Energy Agency. Available online: http://www.iea.org/statistics/relateddatabases/co2emissionsfromfuelcombustion/ (accessed on 24 June 2019).
- Full Text: Xi Jinping’s Speech at Opening Ceremony of Paris Climate Summit. China.org.cn. Available online: http://www.china.org.cn/chinese/2015-12/01/content_37207254.htm (accessed on 24 June 2019).
- Vöita, T. The Power of China’s Energy Efficiency Policies; Center for Energy: Paris, France, 2018. [Google Scholar]
- Tseng, S.-W. The driving forces dominating energy efficiency of industrial sectors in China. In Proceedings of the 2017 IEEE International Conference on Applied System Innovation (IEEE ICASI 2017), Sapporo, Japan, 13–17 May 2017; Meen, T.-H., Prior, S.D., Lam, A.D.K.-T., Eds.; Taiwanese Institute of Knowledge Innovation (TIKI): Taipei, Taiwan, 2017; pp. 341–344. [Google Scholar]
- State Council. Circular of the State Council Concerning Several Policies on Carrying out the Development of China’s Vast Western Regions. 2000. Available online: http://www.lawinfochina.com/display.aspx?lib=law&id=1777&CGid= (accessed on 24 June 2019).
- State Council. The Great Western Development Strategy under the 11th Five-Year Plan. 2007. Available online: http://xbkfs.ndrc.gov.cn/qyzc/200901/t20090118_256835.html (accessed on 24 June 2019).
- The Seven Base Projects and Installed Capacity of Over 15,000 (103kW), Why Did the Wind Power Development in this Orange Warning Zone Break Out Again? In-en.com. Available online: https://www.in-en.com/article/html/energy-2281983.shtml (accessed on 24 June 2019).
- Inner Mongolia Autonomous Region Bureau of Statistics. Inner Mongolia Autonomous Region Statistical Yearbook (2006–2017) (various issues); China Statistics Press: Beijing, China, 2006–2017. [Google Scholar]
- National Bureau of Statistics, China. China Energy Statistical Yearbook (2006–2017) (Various Issues); China Statistics Press: Beijing, China, 2006–2017. [Google Scholar]
- Zhao, X.; Zhang, X.; Shao, S.; Geng, Y. Decoupling economic growth from carbon dioxide emissions in China: A sectoral factor decomposition analysis. J. Clean. Prod. 2017, 142, 3500–3516. [Google Scholar] [CrossRef]
- Xiao, B.; Niu, D.; Guo, X. The driving forces of changes in CO2 emissions in China: A structural decomposition analysis. Energies 2016, 9, 259. [Google Scholar] [CrossRef] [Green Version]
- Wang, Q.; Li, R.; Jiang, R. Decoupling and decomposition analysis of carbon emissions from industry: A case study from China. Sustainability 2016, 8, 1059. [Google Scholar] [CrossRef] [Green Version]
- Wang, G.; Chen, X.; Zhang, Z.; Niu, C. Influencing factors of energy-related CO2 emissions in China: A decomposition analysis. Sustainability 2015, 7, 14408–14426. [Google Scholar] [CrossRef] [Green Version]
- Chen, L.; Yang, Z.; Chen, B. Decomposition analysis of energy-related industrial CO2 emissions in China. Energies 2016, 6, 2319. [Google Scholar] [CrossRef]
- Deng, X.; Yu, Y.; Liu, Y. Effect of construction land expansion on energy-related carbon emissions: Empirical analysis of China and its provinces from 2001 to 2011. Energies 2015, 8, 5516–5537. [Google Scholar] [CrossRef]
- Liu, N.; Ma, Z.; Kang, J. Changes in carbon intensity in China’s industrial sector: Decomposition and attribution analysis. Energy Policy 2015, 87, 28–38. [Google Scholar] [CrossRef]
- Zhang, Y.J.; Da, Y.B. The decomposition of energy-related carbon emission and its decoupling with economic growth in China. Renew. Sustain. Energy Rev. 2015, 41, 1255–1266. [Google Scholar] [CrossRef]
- Tapio, P. Towards a theory of decoupling: Degrees of decoupling in the EU and the case of road traffic in Finland between 1970 and 2001. Transp. Policy 2005, 12, 137–151. [Google Scholar] [CrossRef] [Green Version]
- Dong, J.-F.; Deng, C.; Wang, X.-M.; Zhang, X.-L. Multilevel index decomposition of energy-related carbon emissions and their decoupling from economic growth in Northwest China. Energies 2016, 9, 680. [Google Scholar] [CrossRef]
- Deng, M.; Li, W.; Hu, Y. Decomposing industrial energy-related CO2emissions in Yunnan Province, China: Switching to low-carbon economic growth. Energies 2016, 9, 23. [Google Scholar] [CrossRef] [Green Version]
- Zhao, Y.; Kuang, Y.; Huang, N. Decomposition analysis in decoupling transport output from carbon emissions in Guangdong Province, China. Energies 2016, 9, 295. [Google Scholar] [CrossRef] [Green Version]
- Wang, W.; Kuang, Y.; Huang, N. Study on the decomposition of factors affecting energy-related carbon emissions in Guangdong Province, China. Energies 2011, 4, 2249–2272. [Google Scholar] [CrossRef] [Green Version]
- Wang, F.; Wang, C.; Su, Y.; Jin, L.; Wang, Y.; Zhang, X. Decomposition analysis of carbon emission factors from energy consumption in Guangdong Provincefrom 1990 to 2014. Sustainability 2017, 9, 274. [Google Scholar] [CrossRef] [Green Version]
- Tang, D.; Ma, T.; Li, Z.; Tang, J.; Bethel, B.J. Trend prediction and decomposed driving factors of carbon emissions in Jiangsu Province during 2015–2020. Sustainability 2016, 8, 1018. [Google Scholar] [CrossRef] [Green Version]
- He, L.; Zhong, Z.; Yin, F.; Wang, D. Impact of energy consumption on air quality in Jiangsu Province of China. Sustainability 2018, 10, 94. [Google Scholar] [CrossRef] [Green Version]
- Pan, K.; Li, Y.; Zhu, H.; Dang, A. Spatial configuration of energy consumption and carbon emissions of Shanghai, and our policy suggestions. Sustainability 2017, 9, 104. [Google Scholar] [CrossRef] [Green Version]
- Yang, J.; Chen, B. Using LMDI method to analyze the change of industrial CO2 emission from energy use in Chongqing. Front. Earth Sci. 2011, 5, 103–109. [Google Scholar] [CrossRef]
- Tan, X.; Zeng, Y.; Gu, B.; Wang, Y.; Xu, B. Scenario analysis of urban road transportation energy demand and GHG emissions in China—A case study for Chongqing. Sustainability 2018, 10, 2033. [Google Scholar] [CrossRef] [Green Version]
- Wang, C.; Zhang, X.; Wang, F.; Lei, J.; Zhang, L. Decomposition of energy-related carbon emissions in Xinjiang and relative mitigation policy recommendations. Front. Earth Sci. 2015, 9, 65–76. [Google Scholar] [CrossRef]
- Wan, L.; Wang, Z.-L.; Yeong Ng, J.C. Measurement Research on the Decoupling Effectof Industries’ Carbon Emissions—Based on the equipment manufacturing industry in China. Energies 2016, 9, 921. [Google Scholar] [CrossRef] [Green Version]
- Liang, Y.; Niu, D.; Wang, H.; Li, Y. Factors affecting transportation sector CO2 emissions growth in China: An LMDI decomposition analysis. Sustainability 2017, 9, 1730. [Google Scholar] [CrossRef] [Green Version]
- Boqiang, L.; Liu, K. Using LMDI to analyze the decoupling of carbon dioxide emissions from China’s heavy industry. Sustainability 2017, 9, 1198. [Google Scholar] [CrossRef] [Green Version]
- IPCC. Greenhouse Gas Inventory: IPCC Guidelines for National Greenhouse Gas Inventories; United Kingdom Meteorological Office: Bracknell, UK, 2006. [Google Scholar]
- Lin, B.; Ouyang, X. Analysis of energy-related CO2 (carbon dioxide) emissions and reduction potential inthe Chinese non-metallic mineral products industry. Energy 2014, 68, 688–697. [Google Scholar] [CrossRef]
- Song, R.P.; Yang, S.; Sun, M. GHG Protocol Tool for Energy Consumption in China (Version 2.1); World Resources Institute: Beijing, China, 2013. [Google Scholar]
- Kaya, Y. Impact of Carbon Dioxide Emission Control on GNP Growth: Interpretation of Proposed Scenarios; IPCC Energy and Industry Subgroup; Response Strategies Working Group: Paris, France, 1990; p. 76. [Google Scholar]
- Kaya, Y.; Yokoburi, K. Environment, Energy, and Economy: Strategies for Sustainability, 1st ed.; United Nations University Press: Tokyo, Japan, 1997; pp. 16–26. [Google Scholar]
- Ang, B.W. The LMDI approach to decomposition analysis: A practical guide. Energy Policy 2005, 33, 867–871. [Google Scholar] [CrossRef]
- Ang, B.W. LMDI decomposition approach: A guide for implementation. Energy Policy 2015, 86, 233–238. [Google Scholar] [CrossRef]
- Wang, Q. Effective policies for renewable energy—The example of China’s wind power—Lessons for China’s photovoltaic power. Renew. and Sustain. Energy Rev. 2010, 14, 702–712. [Google Scholar] [CrossRef]
- Zhao, M.; Tan, L.R.; Zhang, W.G.; Ji, M.H.; Liu, Y.; Yu, L.Z. Decomposing the influencing factors of industrial carbon emissions in Shanghai using the LMDI method. Energy 2010, 35, 2505–2510. [Google Scholar] [CrossRef]
- Ang, B.W.; Zhang, F.Q.; Choi, K.H. Factorizing changes in energy and environmental indicators through decomposition. Energy 1998, 23, 489–495. [Google Scholar] [CrossRef]
- Ang, B.W.; Liu, N. Handling zero values in the logarithmic mean Divisia index decomposition approach. Energy Policy 2007, 35, 238–246. [Google Scholar] [CrossRef]
- International Energy Agency. Energy Efficiency in China 2016; International Energy Agency: Paris, France, 2016. [Google Scholar]
- National Energy Agency. New Energy Industry Revitalization and Development Plan; National Energy Agency: Beijing, China, 2009. [Google Scholar]
- He, H.; Yang, X. Thoughts on accelerating the construction of a clean, low-carbon, safe and high-efficiency energy system in Inner Mongolia. Region 2017, 12, 63–66. (In Chinese) [Google Scholar]
- OECD (The Organisation for Economic Co-operation and Development). Best Available Techniques (BAT) for Preventing and Controlling Industrial Pollution; OECD: Paris, France, 2017. [Google Scholar]
- Announcement on the Application and Issuance of Sewage Discharge Permits in 2018. Inner Mongolia Autonomous Region Department of Ecology and Environment. Available online: http://sthjt.nmg.gov.cn/zwgk/zdlyxxgk/fzxg/dqwrfz_6504/201810/t20181011_1582122.html (accessed on 28 November 2019).
Figure 1.
Change in per capita CO2 emissions and per capita Gross Regional Product (GRP) in Inner Mongolia.
Figure 1.
Change in per capita CO2 emissions and per capita Gross Regional Product (GRP) in Inner Mongolia.

Figure 2.
The structure of energy consumption and electrical generation type in Inner Mongolia.

Figure 3.
Industrial share of CO2 emissions in Inner Mongolia.

Figure 4.
Fuel type share of CO2 emissions in Inner Mongolia.

Figure 5.
Change in population, labor and labor productivity.

Figure 6.
Industrial share of GRP in Inner Mongolia.

Figure 7.
Industrial share of energy consumption in Inner Mongolia.

Figure 8.
Energy intensity of industrial sectors in Inner Mongolia.

Figure 9.
CO2 emission intensity of industrial sectors in Inner Mongolia.


Table 1.
CO2 emission factors of various fuel types.
| Fuel Type | LCV a (KJ/kg or KJ/m3) | OR b | PCC c (kgC/GJ) | CO2 EF d (tCO2/ton or 103 m3) |
|---|---|---|---|---|
| Coal | 20,908 | 0.918 | 26.37 | 1.981 |
| Coke | 28,435 | 0.928 | 29.50 | 2.860 |
| Crude Oil | 41,816 | 0.979 | 20.10 | 3.020 |
| Gasoline | 43,070 | 0.986 | 18.90 | 2.925 |
| Kerosene | 43,070 | 0.980 | 19.60 | 3.033 |
| Diesel Oil | 42,652 | 0.982 | 20.20 | 3.096 |
| Fuel Oil | 41,816 | 0.985 | 21.10 | 3.170 |
| Natural Gas | 38,931 | 0.990 | 15.30 | 2.162 |
Table 2.
Logarithmic mean divisia index (LMDI) formulas for additive and multiplicative decomposition changes in CO2 emissions.
Table 2.
Logarithmic mean divisia index (LMDI) formulas for additive and multiplicative decomposition changes in CO2 emissions.
| Aggregate CO2 Emissions | ||
| Total Effect | Additive decomposition | Multiplicative decomposition |
| Effect by Factor | ||
Source: This study.
Table 3.
The eight states of the decoupling elasticity of Taipo [19].
Table 3.
The eight states of the decoupling elasticity of Taipo [19].
| State | ||||
|---|---|---|---|---|
| Negative Decoupling | Expansive negative decoupling | (0,+∞) | (0,+∞) | (1.2,+∞) |
| Strong negative decoupling | (0,+∞) | (−∞,0) | (−∞,0) | |
| Weak negative decoupling | (−∞,0) | (−∞,0) | [0,0.8) | |
| Decoupling | Weak decoupling | (0,+∞) | (0,+∞) | [0,0.8) |
| Strong decoupling | (−∞,0) | (0,+∞) | (−∞,0) | |
| Recessive decoupling | (−∞,0) | (−∞,0) | (1.2,+∞) | |
| Coupling | Expansive coupling | (0,+∞) | (0,+∞) | [0.8,1.2] |
| Recessive coupling | (−∞,0) | (−∞,0) | [0.8,1.2] | |
Source: Tapio [19].
Table 4.
Accumulated effects of different factors on industrial CO2 emissions varied.
| Effect | Industrial Sector | 2006–2010 | 2011–2015 | 2005–2016 |
|---|---|---|---|---|
| Population | Whole | 0.2602 | 0.2063 | 0.5072 |
| Labor | Whole | 0.9256 | 2.2260 | 3.2028 |
| Labor Productivity | Whole | 8.8624 | 3.6489 | 12.9646 |
| Economic Structure | PRI | −0.0896 | −0.0078 | −0.1021 |
| IND | 1.8482 | −0.5724 | 0.9054 | |
| CON | −0.0169 | 0.0123 | −0.0048 | |
| TRA | −0.0121 | 0.0822 | 0.0525 | |
| WHO | −0.0753 | −0.0069 | −0.0808 | |
| OTH | −0.0081 | 0.0432 | 0.0536 | |
| Energy Intensity | PRI | −0.0271 | −0.0581 | −0.0827 |
| IND | −6.3763 | −2.6922 | −8.7136 | |
| CON | 0.0070 | −0.0350 | −0.0190 | |
| TRA | −0.1384 | −0.1997 | −0.4274 | |
| WHO | 0.0250 | −0.1631 | −0.1566 | |
| OTH | −0.0794 | −0.0462 | −0.1688 | |
| Emission Intensity | PRI | 0.0272 | 0.0064 | 0.0235 |
| IND | 0.8771 | 1.7208 | 2.4035 | |
| CON | 0.0114 | −0.0551 | −0.0514 | |
| TRA | −0.3543 | −0.2003 | −0.4748 | |
| WHO | 0.2177 | −0.0850 | 0.0979 | |
| OTH | 0.0155 | −0.0072 | −0.0052 | |
| Total Effect | Whole | 5.8998 | 3.8171 | 9.9242 |
Source: This study.
Table 5.
Multiplicative LMDI decomposition of CO2 emissions.
| Effect | Industrial Sector | 2006–2010 | 2011–2015 | 2005–2016 |
|---|---|---|---|---|
| Population | Whole | 1.0287 | 1.0159 | 1.0484 |
| Labor | Whole | 1.1060 | 1.2373 | 1.3475 |
| Labor Productivity | Whole | 2.6229 | 1.6038 | 3.3443 |
| Economic Structure | PRI | 0.6219 | 0.9950 | 0.5929 |
| IND | 1.2715 | 0.8750 | 1.1000 | |
| CON | 0.8517 | 1.0864 | 0.9394 | |
| TRA | 0.9778 | 1.2093 | 1.1033 | |
| WHO | 0.8437 | 0.9598 | 0.6600 | |
| OTH | 0.9497 | 1.2332 | 1.3380 | |
| Energy Intensity | PRI | 0.8664 | 0.7890 | 0.6548 |
| IND | 0.4366 | 0.9418 | 0.3997 | |
| CON | 1.0685 | 0.6064 | 0.7795 | |
| TRA | 0.7728 | 0.6648 | 0.4488 | |
| WHO | 1.0582 | 0.6343 | 0.4469 | |
| OTH | 0.6044 | 0.9432 | 0.4001 | |
| Emission Intensity | PRI | 1.1549 | 1.0261 | 1.1279 |
| IND | 1.1207 | 1.2002 | 1.2879 | |
| CON | 1.1143 | 0.4278 | 0.5095 | |
| TRA | 0.5169 | 0.7408 | 0.4106 | |
| WHO | 1.6347 | 0.7892 | 1.6551 | |
| OTH | 1.1035 | 0.9371 | 0.9723 |
Source: This study.
Table 6.
Multiplicative LMDI decomposition of CO2 emissions in Inner Mongolia.
| Period | State | |||||||
|---|---|---|---|---|---|---|---|---|
| 2005–2006 | 0.0172 | 0.0161 | 0.7811 | 0.2198 | −0.5021 | 0.0730 | 0.6050 | Weak decoupling |
| 2006–2007 | 0.0163 | 0.0421 | 0.7050 | 0.1653 | −0.4740 | −0.0556 | 0.3991 | Weak decoupling |
| 2007–2008 | 0.0157 | 0.0378 | 0.6636 | 0.1374 | −0.4886 | 0.0328 | 0.3988 | Weak decoupling |
| 2008–2009 | 0.0172 | 0.0534 | 0.6238 | 0.1182 | −0.4562 | 0.0645 | 0.4210 | Weak decoupling |
| 2009–2010 | 0.0169 | 0.0602 | 0.5765 | 0.1071 | −0.4287 | 0.0517 | 0.3838 | Weak decoupling |
| 2010–2011 | 0.0161 | 0.0750 | 0.5594 | 0.1018 | −0.4213 | 0.0936 | 0.4246 | Weak decoupling |
| 2011–2012 | 0.0157 | 0.0844 | 0.5219 | 0.0857 | −0.3870 | 0.0728 | 0.3935 | Weak decoupling |
| 2012–2013 | 0.0165 | 0.1124 | 0.4966 | 0.0729 | −0.4310 | 0.1346 | 0.4020 | Weak decoupling |
| 2013–2014 | 0.0161 | 0.1218 | 0.4502 | 0.0517 | −0.3830 | 0.0999 | 0.3567 | Weak decoupling |
| 2014–2015 | 0.0169 | 0.1143 | 0.4539 | 0.0434 | −0.3549 | 0.0789 | 0.3525 | Weak decoupling |
| 2015–2016 | 0.0174 | 0.1099 | 0.4447 | 0.0283 | −0.3282 | 0.0684 | 0.3404 | Weak decoupling |
Source: This study. Note: denotes the population factor sub-indicator; denotes the labor factor sub-indicator; denotes the labor productivity factor sub-indicator; denotes the economic structure factor sub-indicator; denotes the energy intensity factor sub-indicator; denotes the emission intensity factor sub-indicator; denotes the decoupling indicator.
© 2019 by the author. Licensee MDPI, Basel, Switzerland. This article is an open access article distributed under the terms and conditions of the Creative Commons Attribution (CC BY) license (http://creativecommons.org/licenses/by/4.0/).
Share and Cite
MDPI and ACS Style
Tseng, S.-W. Analysis of Energy-Related Carbon Emissions in Inner Mongolia, China. Sustainability 2019, 11, 7008. https://doi.org/10.3390/su11247008
AMA Style
Tseng S-W. Analysis of Energy-Related Carbon Emissions in Inner Mongolia, China. Sustainability. 2019; 11(24):7008. https://doi.org/10.3390/su11247008
Chicago/Turabian StyleTseng, Sheng-Wen. 2019. "Analysis of Energy-Related Carbon Emissions in Inner Mongolia, China" Sustainability 11, no. 24: 7008. https://doi.org/10.3390/su11247008
Note that from the first issue of 2016, this journal uses article numbers instead of page numbers. See further details here.