Assessing the Environmental Benefits of Dry Port Usage: A Case of Inland Container Transport in Turkey

1
Department of Maritime Business Administration, Faculty of Marine Sciences, Karadeniz Technical University, Trabzon 61080, Turkey
2
Department of Maritime Business Administration, Maritime Faculty, Dokuz Eylül University, Izmir 35210, Turkey
*
Author to whom correspondence should be addressed.
Sustainability 2019, 11(23), 6793; https://doi.org/10.3390/su11236793
Submission received: 21 October 2019
/
Revised: 12 November 2019
/
Accepted: 27 November 2019
/
Published: 29 November 2019
(This article belongs to the Section Sustainable Transportation)
Abstract
:Inland transportation of maritime freight conducted by trucks creates extensive emissions. These emissions can be mitigated by using intermodal-rail transport through dry ports. In that regard, this study evaluated the environmental benefits of dry port usage by using discrete event simulation modelling. The results show that the current level of dry port-based intermodal transportation decreases greenhouse gas (GHG) emissions by 5.79% compared to transportation of all containers on the road. Evaluating the impact of the electrified railway line on the GHG emissions revealed unexpected results; the electrification of the railway line would decrease GHG emissions only by 0.06%. The improvements in empty container movement and scheduling slightly reduced GHG emissions by 0.69% and 0.63% respectively, however, highest GHG emissions reduction resulted from modal shift by 6.56%. This study extended the previous literature by assessing not only the environmental benefits of dry port usage but also its effects on train capacity usage, while taking the empty container movement into account.
1. Introduction
Demand for container transportation has risen enormously since the 1960s. This increasing demand for container transportation further contributes to the negative environmental impacts. It was estimated that freight transportation activities accounted for approximately 43% of the total energy used by transport activities [1]. Logistics activities account for approximately 5.5% of global emissions, wherein 9%–10% of these emissions originate from buildings used for logistics activities and the remaining are ascribed to freight transportation [2]. The emissions caused by freight transport will account for 15%–30% of global emissions by 2050 [3].
Despite the high emissions of freight transport, maritime transportation of freight is the most environmentally friendly transportation mode in terms of emissions as per ton-km compared to other transportation modes [4]. Nonetheless, maritime freight is carried by ships only between seaports, beyond seaports, inland transportation of maritime freight must be conducted by trucks, increasing resulting emissions.
This increased environmental impact caused by road transport can be mitigated by using dry ports in inland freight transportation. Dry port is defined as “an inland intermodal terminal, directly connected to seaports with high capacity transport means, where customers can leave and pick up their standardized units as if directly to a seaport” [5]. The high capacity transport means can include barge and railways. As the inland transport corridor investigated in this study does not have inland water connection, in the context of this study, high-capacity transport means only include railways. Dry ports, in addition to transshipment and cargo handling, should provide warehousing, container storage, container loading and unloading, consolidation, deconsolidation, empty container storage, container repair, customs clearance, container tracking, and other necessary value-added logistics services [6,7,8,9,10]. They should, therefore, provide services available at seaports, and in many ways, function as seaports [11].
Usage of dry ports in inland freight transportation helps mitigate the negative environmental impacts of road transport. Since transport by rail is a more environmentally friendly alternative to road transport, utilization of railways between seaports and dry ports reduces environmental externalities associated with road transport, such as emissions, noise, accidents, and traffic congestion on roads [12]. Additionally, consolidation of partial shipments at dry ports and clustering of logistics facilities around them can help mitigate the negative environmental impacts associated with logistics activities.
Because of their assumed benefits, dry ports are widely implemented in developed countries and are becoming increasingly popular in emerging economies such as Brazil [13], India [11], and China [14]. Practitioners in the Turkish logistics sector, for example, are showing increasing interest in the development of dry port facilities. The Turkish Republic State Railways (TCDD) plans to complete the construction of 21 dry ports around the country by 2020 [15]. Since the Turkish railways sector is undergoing deregulation, in addition to TCDD, private establishments are taking initiatives regarding dry port development.
However, inadequate planning while developing dry port facilities might result in excess capacity; Europe and the USA, for instance, have excess dry port capacity [16]. The actors involved in dry port development projects tend to overestimate the benefits [17]. Additionally, dry ports must be operated in an environmentally efficient way, in order to take maximum advantage of their environmental benefits. There is a potential for improvement with regard to environmental efficiency of inland freight transport operations through dry ports [18]. Therefore, the environmental benefits resulted from inland transport operations through dry ports need to be carefully investigated.
Operational efficiency of ports has been recently investigated in several studies [19,20,21]. Some others focused on environmental efficiency of internal operations of dry ports [22,23]. The environmental benefits associated with inland transport through dry ports draw scholarly attention as well. Tsao and Thanh [24] developed a multi-objective mixed robust possibilistic flexible programming model to assess optimal number, location, and capacity of dry ports considering total network costs, which incorporate environmental and social costs. Their results suggest that total network costs can be decreased by about 1.14% with the usage of a dry port network. Roso [12] used simulation modeling and found that implementation of a dry port could reduce CO2 emissions by up to 25% while significantly decreasing congestion in the seaport and truck waiting times at its gates. Regmi and Hanaoka [9] applied a stated choice experiment to assess the impacts of a hypothetical dry port for inland freight transportation between Laos and the seaports of Thailand. They provided similar outcomes as Roso [12], noting that development of a dry port would trigger a 43% mode shift to the rail sector from roads, and reduce CO2 emissions by up to 30%.
Lättilä, Henttu, and Hilmola [25] evaluated the impacts of dry port development on the environment in Finland by simulation modeling. They provided ambitious results compared to those of Roso [12] and Regmi and Hanaoka [9], by suggesting that usage of dry ports would decrease CO2 emissions by up to 45%. Henttu and Hilmola [7] also investigated dry ports in Finland. They adopted linear integer programming to examine the impacts of a hypothetical dry port structure on the environment and found that a reduction in environmental impacts would be evident when developing up to nine dry ports.
Iannone [26] also used linear integer programming to study the impacts of various policy scenarios on the modal shift toward dry port usage in the Campania region of Italy. Iannone’s [26] results provided lower figures compared to those of Roso [12], Regmi, and Hanaoka [9], and Lättilä et al. [25], suggesting that increasing usage of dry ports would reduce harmful environmental impacts by up to 15.8%. Facchini, Digiesi, and Mossa [27] also evaluated dry port implementation in Italy. Their results showed that, with the usage of dry ports, 11% of the carbon footprint can be reduced. The study of Tao, Wua, and Zhu [28] evaluated the case of a dry port implementation in China by using stated choice experimenting. Their findings showed that subsidizing the dry port usage would increase demand for its services by 3.2% and reduce CO2 emissions by 2.07%.
Even though an increasing number of scientific studies have investigated dry ports and their environmental benefits, only a handful have empirically evaluated their impacts on transportation systems and provided evidence of these benefits. Moreover, most studies avoided considering capacity constraints of the trains and empty container flow as part of their analysis. To extend the previous literature, this study investigates not only the benefits of dry port usage with regard to the environment but also its effects on train capacity usage. Our analysis also considers empty container movement. In addition to environmental impacts of the modal shift towards the dry port, the environmental impacts of railway line electrification, improvements in empty container movement and scheduling were assessed. We investigated a specific case by discrete event simulation modeling technique in order to provide a complete and representative assessment. Additionally, this study accounted for the empty container movement and the train capacity usage as realistically as possible by usage of discrete event simulation modelling.
2. Materials and Methods
2.1. Case Description
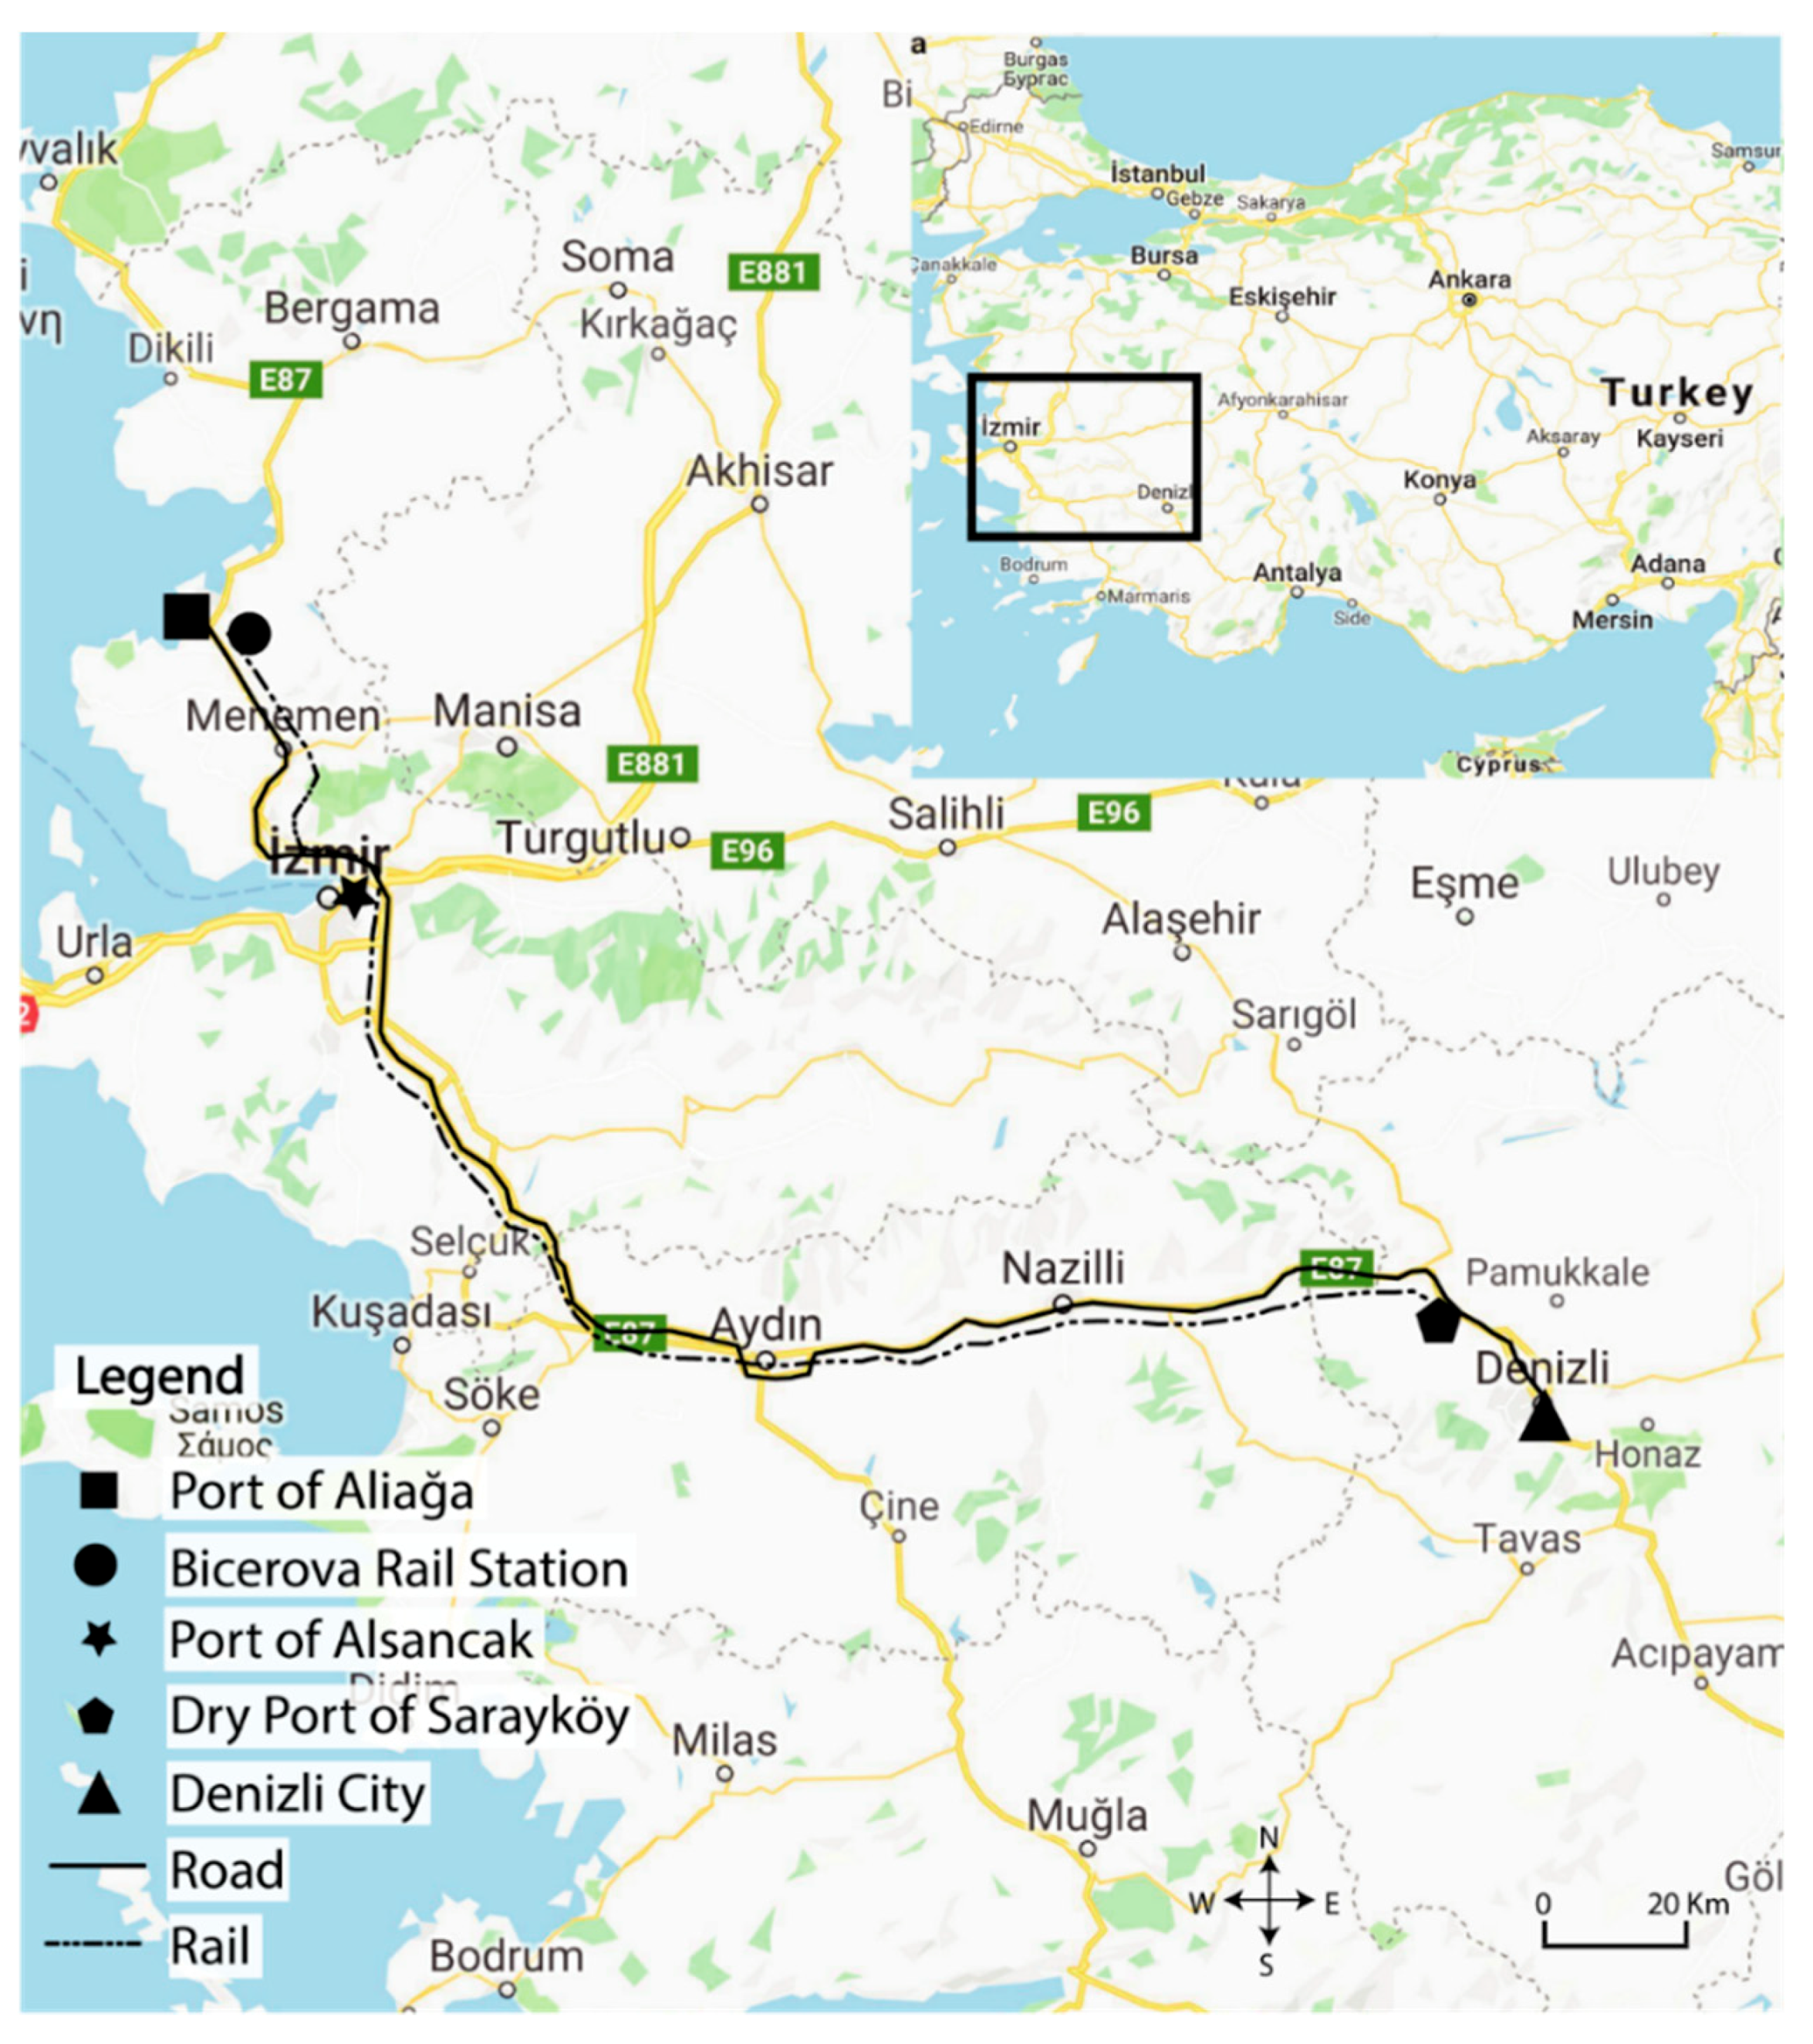
This study evaluated the inland containerized freight transportation corridor between the container terminals of the Izmir and Denizli region. Izmir is in western Turkey, and four container terminals located therein provide gateways to foreign trade in the region. As illustrated in Figure 1, the container terminals of TCE Ege, Nemport, and Petkim APM are in Nemrut Bay, and the Alsancak container terminal is located in Izmir Bay.
In the case of rail transportation between the seaports of the Aliağa and Denizli region, the containers must be transported by road between the seaports and Biçerova rail station since the railway does not extend all the way to the seaports. Biçerova rail station is located approximately 5 km from the seaports of Aliağa. On the other hand, the railway extends all the way into the seaport of Alsancak.
Denizli is an industrial city located in the hinterlands of Izmir. It covers 12.134 km2 of administrative area, and, as of 2018, 1,018,735 people lived there. Additionally, three industrial zones are located in the city [29]. Currently, there are 1375 manufacturing companies operating in the administrative area of the city [30].
Two dry ports are located in Denizli. They connect the container terminals of Izmir and Denizli with the railway network. They are located in the counties of Sarayköy and Kaklık. Currently, containerized freight is not handled at Kaklık dry port. The freight between Kaklık dry port and Izmir’s ports mainly consists of bulk cement, which is produced in a nearby cement factory. The containerized freight transported via rail in the region is handled at the dry port located in Sarayköy county of Denizli. The rail distance between Sarayköy dry port and Izmir Bay is 230 km, and that to Nemrut Bay is 249 km. Freight between the dry port and final destinations must be transported via road, and the distance by road between the dry port and the city is 26 km.
Sarayköy dry port started operations in 2011. Spread over an area of 100,000 m2, it is operated by a company called GNW Logistics, a joint venture of Medlog and Gunaydin Logistics. The operations of the dry port, the block train operations between Izmir and the dry port, and the road transport of containers between shippers’ locations in the Denizli region and the dry port are handled by the operating company. Although the operating company owns rail cars, TCDD (Turkish State Railways) currently provides the transportation service for these railway cars. TCDD is the only company authorized to provide such a service. As mentioned previously, deregulation of Turkey’s railway transportation services is underway. The dry port has a total container capacity of 5000 TEUs. Services such as container stuffing and unstuffing, maintenance, lashing, and sanitation are provided by it.
2.2. Simulation Model
We adopted discrete event simulation modeling in order to provide a complete and representative assessment by accounting for the empty container movement and the train capacity usage as realistically as possible. The simulation model in this study was built with AnyLogic, a general-purpose simulation software. It was first introduced at the Winter Simulation Conference in 2000 [31]. AnyLogic is an object-oriented simulation software that employs Java programming language [32,33].
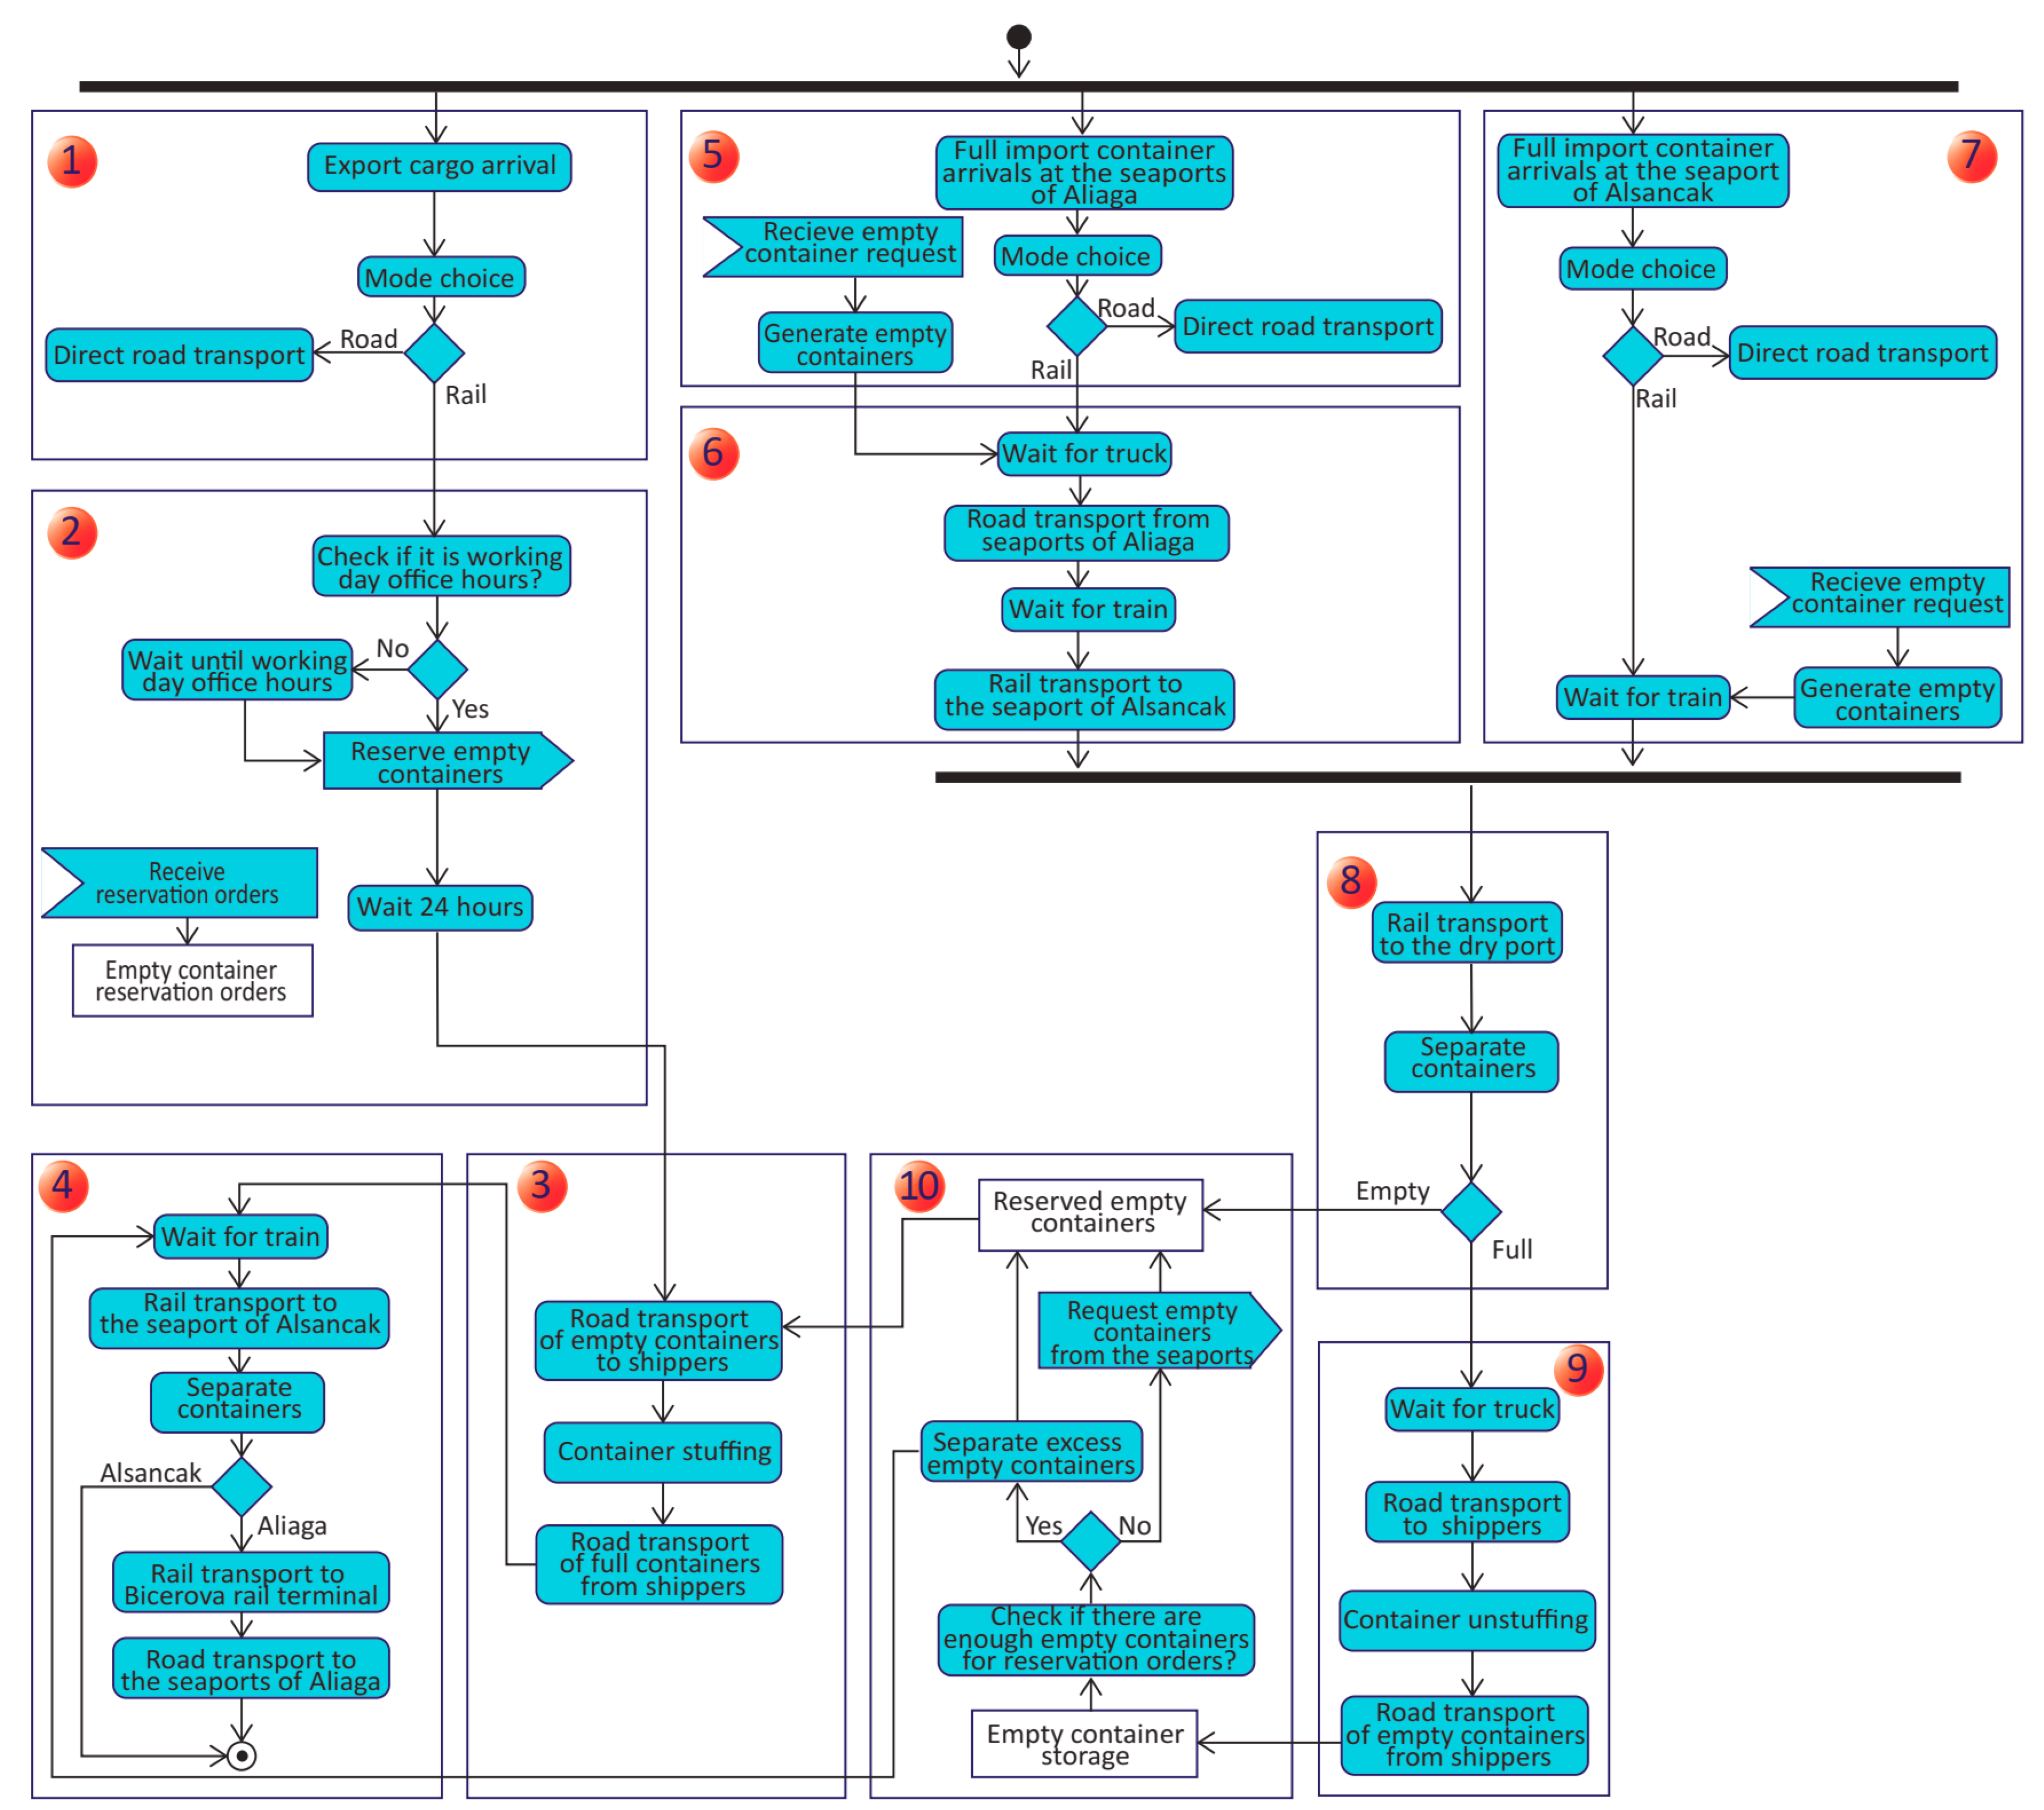
The activity diagram of the simulation model is illustrated in Figure 2. It includes two flows: export containers from the Denizli region to the seaports and import containers from the seaports to the Denizli region. Empty containers are also included in these flows. The import and export container flows are simulated separately but they are connected to each other. The simulation model includes ten sub-models.
Cargo arrivals simulate orders that are ready for export from Denizli through the seaports of Izmir. Two modes are available in the inland transport corridor. Because the simulation of container transportation by road is outside the scope of this study, we avoided detailed modeling of this aspect and assumed that the cargo entities are transported directly by road. Additionally, we maintained a record of total t-km transported via road.
2.2.1. Export Cargo Arrivals
Export container flow includes two destinations: the destination between Denizli and the seaport of Alsancak, and the destination between Denizli and the seaports of Aliağa. The export container flow starts with export cargo arrivals. Four types of cargo are generated: (1) the cargo to be transported in 20 ft (approximately 6 m long) containers from Denizli to the seaport of Alsancak, (2) the cargo to be transported in 40 ft containers from Denizli to the seaport of Alsancak, (3) the cargo to be transported in 20 ft containers from Denizli to the seaports of Aliağa, and (4) the cargo to be transported in 40 ft containers from Denizli to the seaports of Aliağa.
2.2.2. Export Cargo Reservation for Transport Through the Dry Port
Interviews with officials of the operating company at the dry port and Turkish State Railways revealed that if a cargo is to be transported by rail, Turkish State Railways must be notified by at least the previous day of the shipment. Therefore, in the simulation model, reservations of empty containers for the cargo to be transported by intermodal-rail via the dry port are made one day prior to the shipment. The available empty containers in the dry port are reserved for the next day’s export cargo. If the number of empty containers at the dry port is insufficient, empty containers are shipped to the dry port from seaports via the import container train which arrives at the dry port on the morning of the day on which the export shipments are scheduled.
Figure 2 shows that after the mode choice has been made, the cargo shifts to the sub-module of cargo reservation for transportation through the dry port. Any cargo that comes in after office hours must wait till the office reopens to make a reservation. The office hours in the model are 09:00–17:00.
A signal for “reserve empty containers” is sent to make a reservation. The signal is received and empty container reservation orders, which include the number of required empty containers in terms of their types and destinations, are stored. Empty containers of each type are reserved for the next day according to these recorded numbers. Because the reservation must be made one day before the shipment, the cargoes are delayed for 24 h. Since no train departures take place on Sundays, the cargoes must wait till Monday for transportation.
2.2.3. Export Road Transport Between the Shippers and the Dry Port
After the reservation module, the cargo is shifted to the third module to simulate road transport. The combination of the cargo entity and the empty container entity, which is reserved for that particular cargo, is regarded as a “full container entity.” Then, to simulate empty container transport, the entity is delayed for the duration of road transport between the dry port and the shippers’ locations. To simulate container stuffing and full container transport between the shippers’ locations and the dry port, the entity is delayed for the durations of container stuffing and road transport between the shippers’ locations and the dry port.
2.2.4. Export Rail Transportation of Containers from the Dry Port
The fourth sub-module in Figure 2 illustrates the rail transportation of export containers from the dry port. After the full container entities arrive at the dry port, they must wait for the train to pick them up. The capacity of the train must not exceed 750 t. The unit weight of each container type (including empty containers) is calculated and checks are performed to assess if the total weight has reached the maximum capacity. The containers that arrive after the maximum capacity has been reached must wait for the next train departure. The train departure from the dry port to the seaports of Izmir is scheduled daily (except Sundays) at 19:00 h. There are no train departures on Sundays. At most, three train departures are possible depending on the demand. The second train departs at 19:30 h and the third train departs at 20:00 h, provided five or more containers are available for transportation. The container entities waiting for the train are picked up by a train entity, and then, they are delayed for the duration of train transportation between the dry port and the seaport of Alsancak. A certain percentage of the trains are delayed, simulating unexpected delays. The train is delayed for the duration of the container unloading operation at the seaport of Alsancak. Containers destined for the seaport of Alsancak are dropped off and disposed. Then, the train entity is delayed for the duration of rail transportation between the seaport of Alsancak and Biçerova rail station, where the container entities are dropped off and the train entity is disposed.
The dropped containers request empty trucks and wait for transportation by road to the seaports of Aliağa. Empty truck entities are generated and delayed for the duration of road transport between the seaports of Aliağa and Biçerova rail station. After the empty truck entities pick up the container entities, they are delayed for the duration of road transportation between Biçerova rail station and the seaports of Aliağa. The trucks drop off the containers, and both the container and truck entities are disposed.
2.2.5. Import Container Arrivals at the Seaports of Aliağa
The sixth module in Figure 2 illustrates the arrivals of full import containers from the seaports of Aliağa. Two types of full import containers are generated: 20 ft containers that are transported from the seaports of Aliağa to Denizli, and 40 ft containers that are transported from the seaports of Aliağa to Denizli. After the full containers are generated, they choose an inland transportation mode: by road or intermodal rail through the dry port.
A reservation must be made at least one day before shipment for the containers to be transported through the dry port. However, simulating reservations for import containers does not impact the container flow because import containers are full containers; when they get emptied at the importers’ location, they are used for export cargo shipments. Therefore, we assumed that import containers to be transported through the dry port make a reservation one day before the ships carrying them arrive at the seaports. Direct road transportation from the seaports of Aliağa to Denizli city is identical to that in sub-module 1, except for the delay times.
2.2.6. Import Road Transport Between Seaports of Aliağa and Biçerova Rail Station
If the full containers that arrive from the seaports of Aliağa choose to use intermodal rail transportation, they first need to be transported by road between the seaports of Aliağa and Biçerova rail station. Then, they are transported to the dry port in Denizli by rail. However, if the full containers, which arrive from the seaport of Alsancak, choose to use the intermodal route through the dry port, they do not need to be transported by road since the railway line enters the seaport of Alsancak.
2.2.7. Import Container Arrivals at the Seaport of Alsancak
Arrival of full import containers from the seaport of Alsancak is simulated in sub-model 7. Two types of full import containers arrive: 20 ft containers transported from the seaport of Alsancak to Denizli, and 40 ft containers transported from the seaport of Alsancak to Denizli. After the full containers are generated, they choose an inland transportation mode: by road or intermodal rail through the dry port. Direct road transport is identical to that described in sub-modules 1 and 6, except for the delay times. The containers to be transported by rail wait for the train departure.
2.2.8. Import Rail Transport from Biçerova Rail Station and the Seaport of Alsancak to the Dry Port
Sub-model 8 in Figure 2 illustrates the transportation by rail of the import containers. Flows coming from sub-models 6 and 7 are combined in sub-model 8. Containers wait for the import train to pick them up. The unit weights of all types of containers are summed up to determine their total weight. The total weight cannot exceed 750 t, which is the maximum carrying capacity of a freight train in the corridor. Containers that arrive after the 750 t limit is reached must wait for the next train departure. At most, three train departures are possible if there is demand, the first being at 01:30 h, the second at 02:00 h, and the third at 02:30 h. The departures take place if at least five containers are available for transportation. Train departures are possible every day except Sundays. The train picks up containers and they are delayed for the duration of rail transportation between Biçerova rail station and the seaport of Alsancak.
The trains departing from Biçerova rail station arrive at the seaport of Alsancak to pick up the containers. Then, it is delayed for the duration of container loading on the train cars. Thereafter, the containers are delayed for the duration of rail transportation between the seaport of Alsancak and the dry port in Denizli. A certain percentage of the trains are delayed, simulating unexpected delays due to the railway. All the containers are dropped off at the dry port and the train gets disposed.
When the containers are dropped off, the full and empty containers are separated. The empty containers are placed in the empty container storage in sub-model 10, as illustrated in Figure 2. The full containers are transported by road to the importers’ locations.
2.2.9. Import Road Transport Between the Dry Port and Shippers
In Figure 2, sub-model 9 illustrates the simulation of road transport from the dry port to the importers’ locations. As explained in the previous section, when the containers arrive at the dry port, they wait for truck, are picked up by truck, and are transported to the importers. Then, to simulate road transport, entities are delayed for the duration of road transportation from the dry port to the importers’ locations. After transportation, the entities are delayed for the duration of container unstuffing. Full container entities are split into two halves: empty containers and cargoes. The cargoes are disposed while the empty containers are delayed for the road transportation time between the importers and the dry port. Lastly, the empty import containers are placed in the “Empty Container Storage.”
2.2.10. Management of Empty Containers at the Dry Port
Sub-model 10 in Figure 2 illustrates the management of empty containers at the dry port. Every day at 17:50 h, except Sundays, after office hours end, the “Empty Container Storage” is checked with regard to “empty container reservation orders” in sub-model 2. If the number of empty containers available in the “Empty Container Storage” is insufficient, the empty containers are requested from the seaports after considering the container type and destination. For instance, for export cargo to be transported in a 40 ft container to the seaport of Alsancak, a 40 ft empty container is requested from the seaport of Alsancak. If more than enough number of empty containers exist in the “Empty Container Storage” for “empty container reservation orders,” the excess empty containers are placed in sub-model 4 to be transported to the seaports they came from.
2.2.11. Empty Container Movement
Empty containers for the export cargo to be transported to the seaports of Aliağa by road come from the seaports of Aliağa. The same principle applies to the road transportation of export cargoes between Denizli and the seaport of Alsancak. As for import containers, after the import containers from the seaports are transported to consignees in Denizli directly by road, the containers get unstuffed and the empty containers are transported back to the seaports by road where the import container was received the first time. After an import container is transported to the consignee in Denizli by intermodal rail via the dry port, the container gets emptied and the empty container is transported back to the dry port. The empty containers generated from the import container shipments remain in the dry port for one day. After one day, if they have not been reserved for the export cargo, they are transported back to the seaports by the export train.
2.3. Input Data
Table 1 shows the full container unit weights, empty container unit weights, unit weight of the freight carried in a 20 ft container, and unit weight of the freight carried in a 40 ft container for the seaports located in İzmir. The data were compiled from the container statistics for 2018, available at the website of the Turkish Ministry of Transport, Maritime Affairs, and Communications (UBAK) [34]. Table 1 also shows the unit weights of empty 20 ft and 40 ft containers.
Table 2 illustrates the numbers of 20 ft and 40 ft containers exported via the seaports of Izmir from Denizli and those imported via the seaports of Izmir to Denizli were ascertained. The data are compiled from the statistics of the Turkish Ministry of Transport, Maritime Affairs, and Communications [34] and the Turkish Statistics Institute (TURKSTAT) [35]. These numbers will be used to generate a representative number of containers in the simulation model. Inter-arrival times of containers are determined by exponential distribution. This assumption is based on the discrete event simulation literature [36,37,38,39].
Table 3 illustrates the transportation times and distances for the following routes/modes: road transport between the seaport of Alsancak and Denizli, road transport between the seaports of Aliağa and Denizli, road transport between the dry port and Denizli, road transport between Biçerova rail station and the seaports of Aliağa, rail transport between the seaport of Alsancak and the dry port, and rail transport between Biçerova rail station and the seaport of Alsancak. Table 3 also illustrates the operation times for train unloading in the seaport of Alsancak, train unloading at the dry port, train unloading at Biçerova rail station, and container stuffing/unstuffing. The transportation and operation times were gathered via interviews with industry practitioners and are shown as triangular distributions with the minimum, most likely, and maximum values.
2.4. Performance Measures
2.4.1. GHG Emissions
Greenhouse gas emissions in this study were calculated using the web tool of EcoTransIT World (Ecological Transport Information Tool for Worldwide Transports). It is widely used for calculation of environmental impacts for freight transport services in accordance with the European standard EN 16258 [40], which is accepted by the European Committee for Standardization. Greenhouse gases include various types of gases; according to the Kyoto Protocol, there are five gases besides carbon dioxide: methane (CH4), nitrous oxide (N2O), hydrofluorocarbons (HFCs), perfluorocarbons (PFCs), and sulphur hexafluoride (SF6). The standard dictates that, not just carbon dioxide, but also other GHGs, must be included in calculations of emissions resulted from freight transport. The same quantities of other GHGs as carbon dioxide heat the atmosphere more than does carbon dioxide. According to the standard, the impact of other GHGs should be expressed as carbon dioxide equivalents (CO2e). Therefore, the results of our GHG emission calculations were reported as CO2e.
The GHG emissions in this study include well-to-wheel emissions. Well-to-wheel emissions include the actual emissions of the transport and the emissions resulted from producing and providing the fuel or electricity. Additionally, GHG emissions reported as the total GHG emissions, which include GHG emission resulted from road transport of containers plus GHG emissions, resulted from intermodal-rail transport of containers. The fuel consumption factors provided in EcoTransIT World were determined according to the load factor and considered the empty trip factor of trucks and trains [41]. Transportation of containers in roads is being done by lorries between 20 and 26 t and, in railway, is being done by 1000 t trains (medium train). Additionally, GHG emissions are calculated considering the amount of TEU and unit weight of freight in one TEU, which were gathered as the output of the scenario analyses. Currently, locomotives used in the corridor work with diesel, but in our simulation analysis we inspected reduction in GHG emissions if the railway line is electrified; therefore, we also inspected GHG emissions as if the railway line was electrified.
2.4.2. Average Export and Import Train Utilization
Average utilization of the trains refers to the average used capacity of the trains. This value is calculated separately for import containers, which are transported from the seaports of Izmir to Denizli, and export containers, which are transported from Denizli to the seaports of Izmir.
stands for the utilization of export trains, and represents the tonnage carried in the nth train shipment between i and j. Since the maximum carrying capacity of a freight train in the corridor is 750 t, tonnage is divided by 750 and multiplied by 100 to find the used capacity as a percentage. refers to the utilization of import trains, is the tonnage carried in the nth train shipment, and stands for the number of train shipments.
2.5. Verification and Validation
Verification of a simulation model is described as testing the model to determine if it works as intended [39]. The model verification process consists of determining if the model is correctly constructed. Tests and guidelines have been devised by researchers to verify that a computer simulation model works according to its design specifications. In this study, various techniques are used for the verification of the simulation model. First, the debugger of the AnyLogic simulation program is used to check for any inconsistencies and misspecifications in the code of the model. Second, using the trace feature, entities are traced through the simulation process. Additionally, entity flow is observed visually during the simulation runs to determine any inconsistencies. Two different tests described by Altiok and Melamed [36] are applied: (1) finding the throughput with different formulas and compering them, and (2) applying Little’s formula to find the average entities in the system.
The throughput is calculated using two different formulas for both export and import shipments and the results were compered if they are close to each other. was calculated using following formula:
represents the hourly throughput estimator for the replication r, denotes the number of entities processed during replication r, and denotes the duration of the replication r.
was calculated using the following formula:
is the effective arrival rate which equals hourly throughput. denotes the arrival rate of the full containers and denotes the probability of the containers to use the rail-based dry port during replication r.
Table 4 shows the results of the calculations. The results of and are very similar. This verifies that the simulation model works properly.
The values in Table 5 show the average number of full containers calculated using Little’s formula () and the average number of full containers from the simulation output (). and are also very similar. The calculation further verifies that the simulation model works as intended.
2.6. Experiment Design
The simulation run length is determined as one year since the number of containers are determined by using the statistics for a period of one year. Additionally, the warm-up period is determined to eliminate the bias resulting from the initiation phase. The simulation model runs for a period, known as the warm-up period, until its statistics reach a steady state, so that the results of the simulation analysis are not affected by the statistics of the initiation phase. The warm-up period is determined by observing the moving average graph of the number of entities in the system. It has been determined that the system statistics reach steady state within a period of between 1 and 2 months. In order to be conservative, we decided that three months of a warm-up period would be adequate for the simulation model.
The simulation analysis is based on various scenarios. The scenario outcomes are evaluated by comparing them with the business-as-usual (BAU). The business-as-usual reveals the impacts of the current level of the dry port usage in the corridor. Currently, only 10% of the inland container transportation in the corridor is being conducted through the dry port. In the scenario analysis, we basically evaluated four scenarios:
- The first scenario evaluated how much the electrification of the railway line would reduce total GHG emissions.
- In the second scenario, we evaluated the impact of a modal shift towards the dry port usage on train capacity usage and GHG emissions.
- In the third scenario, we inspected the impact of improved empty container transport on GHG emissions.
- The last scenario evaluated the impact of improved scheduling on GHG emissions.
3. Results
3.1. Business as Usual
Table 6 shows that the current level of dry port-based intermodal transportation decreases GHG emissions from 32,887 tons of CO2e to 30,982 tons of CO2e, with a reduction of 5.79% compared to transportation of all containers on the road. Currently, 10% of the inland transportation of containerized freight is conducted through the dry port in the corridor. To carry out the current level of traffic by the dry port, on average, 6.55 train departures per week are provided from the dry port to the seaports of Izmir for export containers and 5.76 train departures per week from the seaports of Izmir to the dry port for import containers. The average utilization of export train capacity is fairly low, at only 53%. This shows that the trains have much idle capacity. The average capacity utilization of the import trains is 18%, even lower than that of the export trains.
3.2. Scenario-1: Electrified Railway Line
In Table 6, scenario 1 reveals the GHG emission level if the railway line was electrified. The results of scenario 1 are rather unexpected because GHG emissions reduction from the electrification of the railway line is very slight by 0.06%. These unexpected results reveal the importance of producing the electricity from clean resources. Using the electricity produced mainly from coal would not reduce GHG emissions compared to usage of diesel. Additionally, these results show the accuracy of calculating GHG emissions from the well-to-wheel basis. If we calculated the GHG emissions on the basis of emissions only from usage of electricity (tank-to-wheel) and exclude the emissions resulted from the electricity production, the results would be in favor of an electrified railway line.
3.3. Scenario-2: Modal Shift towards Intermodal Rail
The second scenario evaluates how a modal shift towards intermodal transport, which results in doubling the demand for the dry port services, would impact GHG emissions and train capacity usage. Doubling the usage of the dry port service would reduce the GHG emissions by 6.56% compared to BAU. The increased dry port usage requires an increase in the average export train frequency from 6.55 to 9.13, while the average import train frequency increases slightly from 5.76 to 6.02 trains per week. Capacity utilization of the export train increases from 53% to 75.8%, while capacity utilization of import trains increased from 18% to 35.9%. The modal shift would result in a good level of capacity usage for export trains; however, import trains would still have much idle capacity, which would increase the cost and environmental impact for every tonnage of freight carried through the dry port. The utilization of the train capacity would also be increased by taking advantage of technological improvements such as tracking and tracing the containers in real time. Adoption of operational measures such as combining passenger and freight trains would also increase the train capacity utilization.
3.4. Scenario-3: Improved Empty Container Transport
The third scenario evaluated the impact of improved empty container management of the total GHG emissions. BAU simulated the current situation. Currently, shippers must notify Turkish State Railways at least 24 hours prior to transportation service performed. After the notification, empty containers are reserved considering the requirements of the shippers’ freight. In this scenario, we evaluated the situation where the notification is not required and, if there is on transit empty containers, the closest one is directed to the shipper’s location. The result of the evaluation showed that improved empty container management slightly reduces the GHG emissions by 0.69%, while increasing export train utilization from 53% to 56.4%.
3.5. Scenario-4: Improved Train Scheduling
In the last scenario, we evaluated the impact of scheduling on GHG emissions. BAU showed that average train capacity utilization is 53% for export trains and 18% for import trains. These low levels of capacity utilizations can be improved with arranging the frequency of train departures in terms of the train capacity. In this scenario, we evaluated the situation where train departures are only provided when the number of containers to be transported is equal to or more than half of the train capacity. The containers to be transported on the train are required to wait until there are enough number of containers to fill half of the train capacity. The result of the evaluation showed tremendous increase in both export and import train utilization. Average export train utilization increased from 53% to 86.1% and average import train utilization increased from 18% to 60.1%. On the other hand, average export train frequency reduced to 3.98 trains per week and average import train frequency reduced to 1.75 trains per week. The results confirmed that the low capacity utilization can easily be improved by adopting an operation policy which requires a minimum of half of the capacity to be filled in order for a train to depart. However, this operational policy would cause a significant increase in the train waiting times, which would reduce satisfaction of the dry port users.
4. Discussion
This study assessed not only the benefits of dry port usage with regard to the environment, but also its effects on the train capacity usage, incorporating empty container movements. In addition to all road and business as usual, four scenarios were evaluated: The first one was the impact of the electrification of the railway line; the second one was the impact of a modal shift towards the dry port usage; the third one was the impact of improved empty container transport; and the last one was the impact of the improved train scheduling. Our results show that the usage of the rail-based dry port results in lesser GHG emissions compared to road transport, confirming the findings of previous research that investigated the impacts of dry port usage [7,9,12,25].
The current level of dry port-based intermodal transportation decreases GHG emissions by 5.79% and modal shift towards the intermodal transport, which doubles the demand for the dry port service and would reduce the GHG emissions by 6.56% compared to business as usual. These results provide compelling evidence of the environmental benefits of modal shift towards rail-based dry port usage and suggest that policies and practices for increasing the usage of the dry port services in the inspected inland transport corridor can effectively eliminate the negative environmental impacts of road transportation.
Evaluating the impact of an electrified railway line on the GHG emissions showed rather unexpected results because the electrification of the railway line would reduce GHG emissions very slightly by 0.06%. These results confirm the importance of producing the electricity from clean resources. Electrification of the railway line would not reduce GHG emissions if the used electricity is produced mainly from coal. These results also confirm the importance of calculating GHG emissions from the well-to-wheel basis, by including emissions created from electricity production.
The results also showed that operational improvements such as efficient empty container management and train scheduling would slightly reduce GHG emissions. Evaluation of the impacts of scheduling provides an understanding of the importance of train capacity. BAU showed that trains have much idle capacity, which would create additional transportation costs and environmental impacts. This low capacity usage cannot be overcome by reducing the train frequency without reducing the level of service quality. However, measures such as taking advantage of technological improvements and combining passenger and freight trains would be more effective ways to increase the train capacity utilization.
These results reveal that the maximum reduction of GHG emissions can be achieved only by taking comprehensive measures. Only increasing modal shift towards the dry port-based intermodal transport, electrifying the railway line or operational improvements would not effectively reduce GHG emissions as expected. The measures for increasing modal shift towards the dry port usage such as subsidizing railway transportation, taxing road transport or operational improvements of the intermodal rail transportation would be supplemented by infrastructural improvements and promotion of clean means of electricity production. Promotion of clean means of electricity production has particular importance since the simulation results revealed that usage of electricity for transportation would not do any good for the environment unless the electricity is produced from clean sources.
The scope of this study is limited to the inland transportation corridor between the seaports located in Izmir and Denizli. We focused on a specific case to provide a complete and representative assessment. Only containerized shipments were included in the analysis because the block trains serving between the investigated dry port and the seaports are dedicated to container transportation. It would be interesting to investigate other inland transport corridors with cargo types other than containerized cargo. The length of the inland transportation corridor studied in this study is less than 250 km. It is assumed that when distance increases, environmental efficiency as well as economic feasibility of dry port usage would increase. Therefore, further investigations should analyze longer distances to reveal changes in the environmental impacts of dry port usage with regard to the distance between dry ports and seaports. Further studies can also evaluate impacts of dry ports on congestion and inland transportation times. Dry ports can significantly affect seaport operations and urban traffic. Hence, it would be useful to enhance the scope of the analysis to include the impacts of dry ports usage on operations and efficiency of seaports as well as urban traffic flow.
Author Contributions
Conceptualization, E.K.; methodology, E.K.; software, E.K.; validation, E.K.; formal analysis, E.K.; investigation, E.K.; resources, E.K.; data curation, E.K.; writing—original draft preparation, E.K.; writing—review and editing, E.K.; visualization, E.K.; supervision, I.B.C.
Funding
This research received no external funding.
Conflicts of Interest
The authors declare no conflict of interest.
References
- IPCC. Mitigation of Climate Change. In Contribution of Working Group III to the Fifth Assessment Report of the Intergovernmental Panel on Climate Change; Cambridge University Press: Cambridge, UK; New York, NY, USA, 2014. [Google Scholar]
- Doherty, S.; Hoyle, S. Supply Chain Decarbonization: The Role of Logistics and Transport in Reducing Supply Chain Carbon Emissions; World Economic Forum: Geneva, Switzerland, 2009. [Google Scholar]
- UK Committee on Climate Change. Building a Low-Carbon Economy—The UK’s Contribution to Tackling Climate Change; TSO: London, UK, 2008. [Google Scholar]
- Piecyk, M.; Browne, M.; Whiteing, A.; McKinnon, A. (Eds.) Green Logistics: Improving the Environmental Sustainability of Logistics; Kogan Page Publishers: London, UK; Philadelphia, PA, USA; New Delhi, India, 2015. [Google Scholar]
- Roso, V.; Woxenius, J.; Lumsden, K. The dry port concept: Connecting container seaports with the hinterland. J. Transp. Geogr. 2009, 17, 338–345. [Google Scholar] [CrossRef]
- Hanaoka, S.; Regmi, M.B. Promoting intermodal freight transport through the development of dry ports in Asia: An environmental perspective. IATSS Res. 2011, 35, 16–23. [Google Scholar] [CrossRef]
- Henttu, V.; Hilmola, O.P. Financial and environmental impacts of hypothetical Finnish dry port structure. Res. Transp. Econ. 2011, 33, 35–41. [Google Scholar] [CrossRef]
- Henttu, V.; Lättilä, L.; Hilmola, O.P. Optimization of relative transport costs of a hypothetical dry port structure. Transp. Telecommun. 2011, 12, 12–19. [Google Scholar]
- Regmi, M.B.; Hanaoka, S. Assessment of modal shift and emissions along a freight transport corridor between Laos and Thailand. Int. J. Sustain. Transp. 2015, 9, 192–202. [Google Scholar] [CrossRef]
- Ng, A.K.; Cetin, I.B. Locational characteristics of dry ports in developing economies: Some lessons from northern India. Reg. Stud. 2012, 46, 757–773. [Google Scholar] [CrossRef]
- Ng, A.K.; Gujar, G. Government policies, efficiency and competitiveness: The case of dry ports in India. Transp. Policy 2009, 16, 232–239. [Google Scholar] [CrossRef]
- Roso, V. Evaluation of the dry port concept from an environmental perspective: A note. Transp. Res. Part D Transp. Environ. 2007, 12, 523–527. [Google Scholar] [CrossRef]
- Padilha, F.; Ng, A.K. The spatial evolution of dry ports in developing economies: The Brazilian experience. Marit. Econ. Logist. 2012, 14, 99–121. [Google Scholar] [CrossRef]
- Beresford, A.; Pettit, S.; Xu, Q.; Williams, S. A study of dry port development in China. Marit. Econ. Logist. 2012, 14, 73–98. [Google Scholar] [CrossRef]
- TCDD. Lojistik Merkezler. Available online: http://www.tcdd.gov.tr/content/33 (accessed on 12 January 2018).
- Rodrigue, J.P.; Notteboom, T. Dry ports in European and North American intermodal rail systems: Two of a kind? Res. Transp. Bus. Manag. 2012, 5, 4–15. [Google Scholar] [CrossRef]
- Rodrigue, J.P.; Debrie, J.; Fremont, A.; Gouvernal, E. Functions and actors of inland ports: European and North American dynamics. J. Transp. Geogr. 2010, 18, 519–529. [Google Scholar] [CrossRef]
- Iris, Ç.; Lam, J.S.L. A review of energy efficiency in ports: Operational strategies, technologies and energy management systems. Renew. Sustain. Energy Rev. 2019, 112, 170–182. [Google Scholar] [CrossRef]
- Iris, Ç.; Christensen, J.; Pacino, D.; Ropke, S. Flexible ship loading problem with transfer vehicle assignment and scheduling. Transp. Res. Part B Methodol. 2018, 111, 113–134. [Google Scholar] [CrossRef]
- Iris, Ç.; Pacino, D.; Ropke, S. Improved formulations and an adaptive large neighborhood search heuristic for the integrated berth allocation and quay crane assignment problem. Transp. Res. Part E Logist. Transp. Rev. 2017, 105, 123–147. [Google Scholar] [CrossRef]
- Xie, Y.; Song, D.P. Optimal planning for container prestaging, discharging, and loading processes at seaport rail terminals with uncertainty. Transp. Res. Part E Logist. Transp. Rev. 2018, 119, 88–109. [Google Scholar] [CrossRef]
- Wang, L.; Zhu, X. Container Loading Optimization in Rail–Truck Intermodal Terminals Considering Energy Consumption. Sustainability 2019, 11, 2383. [Google Scholar] [CrossRef]
- Tadić, S.; Krstić, M.; Roso, V.; Brnjac, N. Planning an Intermodal Terminal for the Sustainable Transport Networks. Sustainability 2019, 11, 4102. [Google Scholar] [CrossRef]
- Tsao, Y.C.; Thanh, V.V. A multi-objective mixed robust possibilistic flexible programming approach for sustainable seaport-dry port network design under an uncertain environment. Transp. Res. Part E Logist. Transp. Rev. 2019, 124, 13–39. [Google Scholar] [CrossRef]
- Lättilä, L.; Henttu, V.; Hilmola, O.P. Hinterland operations of sea ports do matter: Dry port usage effects on transportation costs and CO2 emissions. Transp. Res. Part E Logist. Transp. Rev. 2013, 55, 23–42. [Google Scholar] [CrossRef]
- Iannone, F. The private and social cost efficiency of port hinterland container distribution through a regional logistics system. Transp. Res. Part A Policy Pract. 2012, 46, 1424–1448. [Google Scholar] [CrossRef]
- Facchini, F.; Digiesi, S.; Mossa, G. Optimal dry port configuration for container terminals: A non-linear model for sustainable decision making. Int. J. Prod. Econ. 2020, 219, 164–178. [Google Scholar] [CrossRef]
- Tao, X.; Wu, Q.; Zhu, L. Mitigation potential of CO2 emissions from modal shift induced by subsidy in hinterland container transport. Energy Policy 2017, 101, 265–273. [Google Scholar] [CrossRef]
- Bilim, Sanayi ve Teknoloji Bakanlığı. Denizli İlinde Bulunan Organize Sanayi Bölgeleri. Available online: https://osbbs.sanayi.gov.tr/citydetails.aspx?dataID=210 (accessed on 12 January 2018).
- Denizli Sanayi Odası. Denizli Sanayi Odası Meslek Gruplarına Göre Üye Sayıları. Available online: http://www.dso.org.tr/images/file/istatistik/2009/dso1.pdf (accessed on 12 January 2018).
- Kopytov, E.; Abramov, D. Multiple-criteria analysis and choice of transportation alternatives in multimodal freight transport system. Transp. Telecommun. 2012, 13, 148–158. [Google Scholar] [CrossRef] [Green Version]
- Merkuryeva, G.; Bolshakovs, V. Vehicle schedule simulation with anylogic. In Proceedings of the 12th International Conference on Computer Modelling and Simulation (UKSim), Cambridge, UK, 24–26 March 2010; pp. 169–174. [Google Scholar]
- Emrich, S.; Suslov, S.; Judex, F. Fully agent based. modellings of epidemic spread using anylogic. In Proceedings of the Proc. EUROSIM, Ljubljana, Slovenia, 9–13 September 2007; pp. 9–13. [Google Scholar]
- UBAK. Konteyner İstatistikleri. 2018. Available online: https://atlantis.udhb.gov.tr/istatistik/istatistik_konteyner.aspx (accessed on 12 August 2019).
- TURKSTAT. Foreign Trade Statistics Micro Data Set (No. 4484); TURKSTAT: Ankara, Turkey, 2018. [Google Scholar]
- Altiok, T.; Melamed, B. Simulation Modeling and Analysis with Arena; Elsevier: Oxford, UK, 2010. [Google Scholar]
- Banks, J.; Carson, J.S.; Nelson, B.L.; Nicol, D.M. Discrete-Event System Simulation; PrenticeHall: Upper Saddle River, NJ, USA, 2010. [Google Scholar]
- Choi, B.K.; Kang, D. Modeling and Simulation of Discrete Event Systems; John Wiley & Sons: Hoboken, NJ, USA, 2013. [Google Scholar]
- Rossetti, M.D. Simulation Modeling and Arena; John Wiley & Sons: Hoboken, NJ, USA, 2015. [Google Scholar]
- EN 16258. Methodology for Calculation and Declaration of Energy Consumption and GHG Emissions of Transport Services (Freight and Passengers); European Committee for Standardization: Brussels, Belgium, 2012. [Google Scholar]
- IFEU Heidelberg; INFRAS Berne; IVE Hannover. Ecotransit; Ecological Transport Information Tool for Worldwide Transports; Methodology and Data Update; EcoTransIT World Initiative: Berne, Germany; Hannover, Germany; Heidelberg, Germany, 2018. [Google Scholar]
Figure 1.
Location of container terminals in the Izmir region and Sarayköy dry port.

Figure 2.
UML Activity Diagram of the simulation model.


Table 1.
Unit weights of empty 20 ft and 40 ft containers and their share in total export and import tonnage.
Table 1.
Unit weights of empty 20 ft and 40 ft containers and their share in total export and import tonnage.
| Weight | TEU | FEU 1 |
|---|---|---|
| Full Weight (t) | 18.51 | 21.53 |
| Empty Weight (t) | 2.43 | 4.3 |
| Weight of Freight (t) | 16.08 | 17.23 |
Source: UBAK [34] 1 FEU: Forty-foot equivalent units.
Table 2.
Number of export and import 20 ft and 40 ft containers transported between the seaports of İzmir and Denizli.
Table 2.
Number of export and import 20 ft and 40 ft containers transported between the seaports of İzmir and Denizli.
| Transport Flow | Seaports of Aliağa | Seaport of Alsancak | ||
|---|---|---|---|---|
| TEU | FEU | TEU | FEU | |
| Export (Number) | 26,827 | 23,111 | 10,690 | 7839 |
| Import (Number) | 2119 | 1826 | 4253 | 3119 |
Table 3.
Transportation and operation times and transportation distances.
| Operation | Time (h) | Distance (km) |
|---|---|---|
| Road transport between the seaport of Alsancak and Denizli | Triangular (4, 5, 6) | 245 |
| Road transport between the seaports of Aliağa and Denizli | Triangular (5, 6, 7) | 295 |
| Road transport between the dry port and Denizli | Triangular (0.5, 0.75, 1) | 30 |
| Road transport between Biçerova rail station and the seaports of Aliağa | Triangular (0.25, 0.35, 0.5) | 5 |
| Rail transport between the seaport of Alsancak and Sarayköy dry port | Triangular (6, 7, 8) | 230 |
| Rail transport between Biçerova rail station and the seaport of Alsancak | Triangular (1, 1.25, 1.5) | 20 |
| Train unloading in the seaport of Alsancak | Triangular (1, 1.5, 2) | - |
| Train unloading at the dry port | Triangular (1, 1.5, 2) | - |
| Train unloading in Biçerova rail station | Triangular (1, 1.5, 2) | - |
| Container stuffing/unstuffing | Triangular (1, 2, 4) | - |
Source: Interviews with industry practitioners and Google Maps.
Table 4.
Calculation of hourly throughput with different methods.
| Hourly Throughput | Export | Import |
|---|---|---|
| 0.772 | 0.134 | |
| 0.714 | 0.134 |
Table 5.
Calculation of the average number of full containers in the system.
| Average Number of Full Containers | Export | Import |
|---|---|---|
| 1 | 38.714 | 7.472 |
| 2 | 39.32 | 7.845 |
1 denotes the average number of full containers calculated using Little’s formula. 2 denotes the average number of full containers from the simulation output.
Table 6.
Simulation results.
| Variable | All Road | BAU | Scenarios | |||
|---|---|---|---|---|---|---|
| 1 | 2 | 3 | 4 | |||
| Share of Dry Port (%) | 0 | 10 | 10 | 20 | 10 | 10 |
| Average Export Train Frequency (Per Week) | - | 6.55 | 6.55 | 9.13 | 6.21 | 3.98 |
| Average Export Train Utilization (%) | - | 53 | 53 | 75.8 | 56.4 | 86.1 |
| Average Import Train Frequency (Per Week) | - | 5.76 | 5.76 | 6.02 | 5.96 | 1.75 |
| Average Import Train Utilization (%) | - | 18 | 18 | 35.9 | 18.1 | 60.1 |
| Total GHG Emissions (1,000 kg CO2e) | 32,887 | 30,982 | 30,962 | 28,950 | 30,769 | 30,788 |
| ∆ GHG Emissions compared to BAU (%) | +5.79 | - | −0.06 | −6.56 | −0.69 | −0.63 |
© 2019 by the authors. Licensee MDPI, Basel, Switzerland. This article is an open access article distributed under the terms and conditions of the Creative Commons Attribution (CC BY) license (http://creativecommons.org/licenses/by/4.0/).
Share and Cite
MDPI and ACS Style
Kurtulus, E.; Cetin, I.B. Assessing the Environmental Benefits of Dry Port Usage: A Case of Inland Container Transport in Turkey. Sustainability 2019, 11, 6793. https://doi.org/10.3390/su11236793
AMA Style
Kurtulus E, Cetin IB. Assessing the Environmental Benefits of Dry Port Usage: A Case of Inland Container Transport in Turkey. Sustainability. 2019; 11(23):6793. https://doi.org/10.3390/su11236793
Chicago/Turabian StyleKurtulus, Ercan, and Ismail Bilge Cetin. 2019. "Assessing the Environmental Benefits of Dry Port Usage: A Case of Inland Container Transport in Turkey" Sustainability 11, no. 23: 6793. https://doi.org/10.3390/su11236793
Note that from the first issue of 2016, this journal uses article numbers instead of page numbers. See further details here.