Transportation Equity in China: Does Commuting Time Matter?

1
College of City Construction, Jiangxi Normal University, Nanchang 330022, China
2
School of Architecture, Southeast University, Nanjing 210096, China
3
School of Architecture and Urban Planning, Qingdao University of Technology, Qingdao 266033, China
*
Authors to whom correspondence should be addressed.
Sustainability 2019, 11(21), 5884; https://doi.org/10.3390/su11215884
Submission received: 18 October 2019
/
Accepted: 21 October 2019
/
Published: 23 October 2019
Abstract
:Urban commuting, a facet of transportation equity, is an important factor that shapes social equity. Little is known about how commuting practices shape individuals’ perceptions of social equity. To fill this gap, we conducted a multilevel regression using data from the China Labour-force Dynamics Survey 2016. We found that commuters who used private cars had the highest level of perceived social equity, while those who used bicycles had the lowest. Commuting time had a significant negative effect on respondents’ perceived social equity. This study verifies the “commuting paradox” to some extent, as income had no moderating effect on the relationship between commuting time and perceived social equity, which suggests that the social inequity caused by long commutes is not alleviated by higher wages. We also found that the perceived social equity of respondents who commuted on foot or by motorcycle was significantly negatively affected by commuting time. Based on our findings, we propose four ways to alleviate social inequity caused by commuting inequities: consider the commuting time sensitivity of different types of commuters, pay attention to the social equity issues caused by different transportation modes, provide more equitable commuting ways for low-income people, and prioritise public transportation.
1. Introduction
Urban transportation equity is becoming an increasingly important issue as rapid urbanisation progresses in developing countries such as China. Transportation equity is characterised by equal opportunities for different social groups (especially disadvantaged groups) in traffic service quality and transportation accessibility [1,2]. Many social groups experience “transport disadvantage” [3]. Generally, there are three types of transportation equity: horizontal equity, vertical equity with regard to income and social class, and vertical equity with regard to mobility needs and ability [4]. The transportation equity of disadvantaged groups (e.g., low-income, minority, and elderly and disabled persons) attracted the attention of many scholars [5,6]. For instance, Ricciardi, Xia, and Currie [7] compared the equity distribution of public transport for three separate disadvantaged social groups (elderly residents, low-income households, and no-car households) in Perth, Western Australia, and found that the elderly had the most inequitable distribution among them. Jansuwan, Christensen, and Chen [8] found that people with disabilities frequently relied on public transportation rather than on private transportation for work, while the number of nonwork trips made by people with disabilities was significantly lower than that of people without disabilities. Because the accessibility of different areas of cities varies greatly, residents living in different places have different traffic problems. Grengs [9] found that, although racial minorities and low-income households live in the urban core with easy access to transport, they suffer from transportation disadvantages in spite of living in advantaged locations because they do not have cars. Delbosc and Currie [10] found that people living on the fringes and in remote parts of Melbourne, Australia, are more likely to report facing more transport problems than people living elsewhere in the city. In developing countries, due to the lack of support for the transportation of disadvantaged groups, their travel is often subject to multiple restrictions. For example, Ahmad [11] found that poor environmental conditions and terminal facilities, unfriendly vehicles, behaviour of transport staff, and travel safety and security threats were the barriers that prevented disabled people to access routes in Pakistan. The research of Bombom and Abdullahi [12] showed that many disabled persons believe that the social and physical environments are deliberately hostile to them due to transportation difficulties in Jos, Nigeria. De Vasconcellos [13], using the case of São Paulo, Brazil, posited that the transport externalities of low-income groups are much lower than those of high-income groups.
Because equity is a relative concept, transportation equity still lacks widely recognised standards that are effectively implemented during traffic planning [2]. Although much of traffic planning and design takes transportation equity into consideration, the equity impact generated by traffic may be inconsistent with the intention of policy-makers and planners [14]. For example, Linovski, Baker, and Manaugh [15] showed that, in the design and planning of bus rapid transit (BRT) systems, most definitions of transit equity focused on the equal distribution of resources for all groups, rather than consideration of transit-dependent riders, leading to conflicting outcomes with regard to equity goals. As Fan, Guthrie, and Levinson [16] demonstrated, transit-dependent riders are often low-wage workers. Transit systems such as the Hiawatha light rail line in Minneapolis, Minnesota, when designed to promote social and transportation equity, can increase job accessibility and related benefits for this group of workers in particular. Eliasson and Mattsson [17] found that revenues of congestion pricing used for improving public transport would benefit women and low-income groups the most, while the revenues used for tax cuts would benefit high-income groups. Welch [1] argued that transit locations with high connectivity are just as important as reducing distance to transit in improving the transportation equity of residents living in subsidised housing. Although the concept of transportation equity is mentioned in many traffic plans, the specific measures to realise traffic equity are rarely put forward, and most traffic plans pay more attention to solving traffic problems (e.g., traffic congestion) than to realising transportation equity [18]. Additionally, accurate travel data acquisition is the basis of formulating an effective and equitable traffic development strategy. The study of Mobasheri, Zipf, and Francis, as well as that of Zipf et al. [19,20], presented experiments of tagging accessibility data into the OpenStreetMap database for enriching sidewalk data. It is of great significance for optimising the organization of walking traffic to obtain accurate route data of walkers or wheelchair travellers.
Attention to transportation equity is particularly important within the context of developing countries such as China. Population agglomeration, urban sprawl, exclusionary planning, and disproportionate investment in transportation infrastructure created a socioeconomic imbalance in developing countries [21]. In the past few decades, China’s urbanisation process advanced rapidly, with cities continuously expanding. At the same time, the extent of motorisation also increased. However, due to rapid economic development, the income gap between different social groups in China expanded, with social inequality and, by extension, transportation inequity becoming more prominent, particularly in China’s mega-cities such as Beijing, Shanghai, and Guangzhou [22]. Continuous urbanisation prompted large numbers of people to migrate to large cities, making China’s big cities more crowded [23]. The rapid urbanisation of China and resultant traffic problems not only exacerbated urban expansion and spatial reconfiguration in the process [23], but also made the issue of urban transportation equity increasingly important to address.
At the regional level, China’s transport development gap widened between developed and underdeveloped areas. For instance, investment in transportation facilities in eastern China remains much higher than that in the central and western regions, which further widens the regional gap in transportation development [24]. At the city level, many cities implement transportation development strategies that prioritise motorised forms of transport [25]. Walking, bicycle, and public transportation systems are relatively insufficient in Chinese cities, which leads to significant differences in the commuting modes and commuting time across economic classes. For low-income workers, their commuting mode and place of residence are restricted by the social–spatial structure [26]. As a result, low-income workers may not be able to freely choose more comfortable, faster transportation modes, but rather they have to endure the existing transport and traffic conditions.
In addition, the widening of the income gap of Chinese residents resulted in a class-based stratification of housing choices in China. For instance, high-income workers are more likely to accept longer commutes in order to fulfil their residential preferences [27]. Li and Liu [28] established that residents with different types of hukou (i.e., a household registration record that establishes a person as a resident of a given area and assigns benefits based on residency) also have different commuting patterns. Residents without hukou (e.g., migrants living in urban villages) tend to have a more balanced job–housing relationship and spend less time on commuting than hukou holders. In contrast, Zhao and Howden-Chapman [29] argued that the hukou system reduces the chances of migrants getting employed and increases their time costs of commuting. These studies indicated that, within the context of rapid urbanisation in China, transportation equity and social equity are increasingly intertwined.
As the above discussion suggests, existing studies on transportation equity largely focused on the relationship between transportation and travel behaviour, regarding mode of transport as a result of socioeconomic factors (e.g., job–housing imbalances, income, and hukou) [30,31], and seldom considered the impact of transport mode on residents’ psychological states in China. What is the impact of commuting on residents’ physical and psychological states? These conclusions, however, may not be generalisable to developing countries such as China [32]. Only a limited number of studies examined the impact of transport mode and commuting time on residents’ psychological well-being in China specifically. For example, Zhu and Fan [32] demonstrated that residents of Xi’an who commute by shuttle bus reported the highest happiness with their commute, followed by residents commuting by private bicycle and walking, while residents who use regular city buses reported the lowest happiness with their commute. Differences in modes of transport could further exacerbate socioeconomic inequality in Chinese society.
Are there differences in perceived social equity among residents with different commuting modes? Does commuting time have a significant impact on residents’ perceived social equity? To answer these questions, this study used a large-scale sample survey data in China to analyse the impact of commuting time and transport mode on residents’ perceived social equity, while controlling for socioeconomic factors. In this study, we took transportation equity, which is the result of commuting, as a type of social equity. We regarded transportation as an important factor affecting social equity. If a certain commuting mode (e.g., long commuting time or high commuting cost) has a negative impact on residents’ perceived social equity, then, for this social group, this commuting mode has low-level transportation equity. Through multilevel regression analysis, this study further verified the so-called commuting paradox from the perspective of social equity (through analysing the moderation effect of income and working time between commuting time and residents’ perceived social equity); with regard to individual utility, the burden of commuting can be perceived as offset by other economic and social rewards [33]. This study further analysed the commuting time sensitivity of different types of commuters from the perspective of social equity. The results will be helpful for planners to design better urban transportation, as well as job–housing relationships.
2. Materials and Methods
2.1. Research Framework
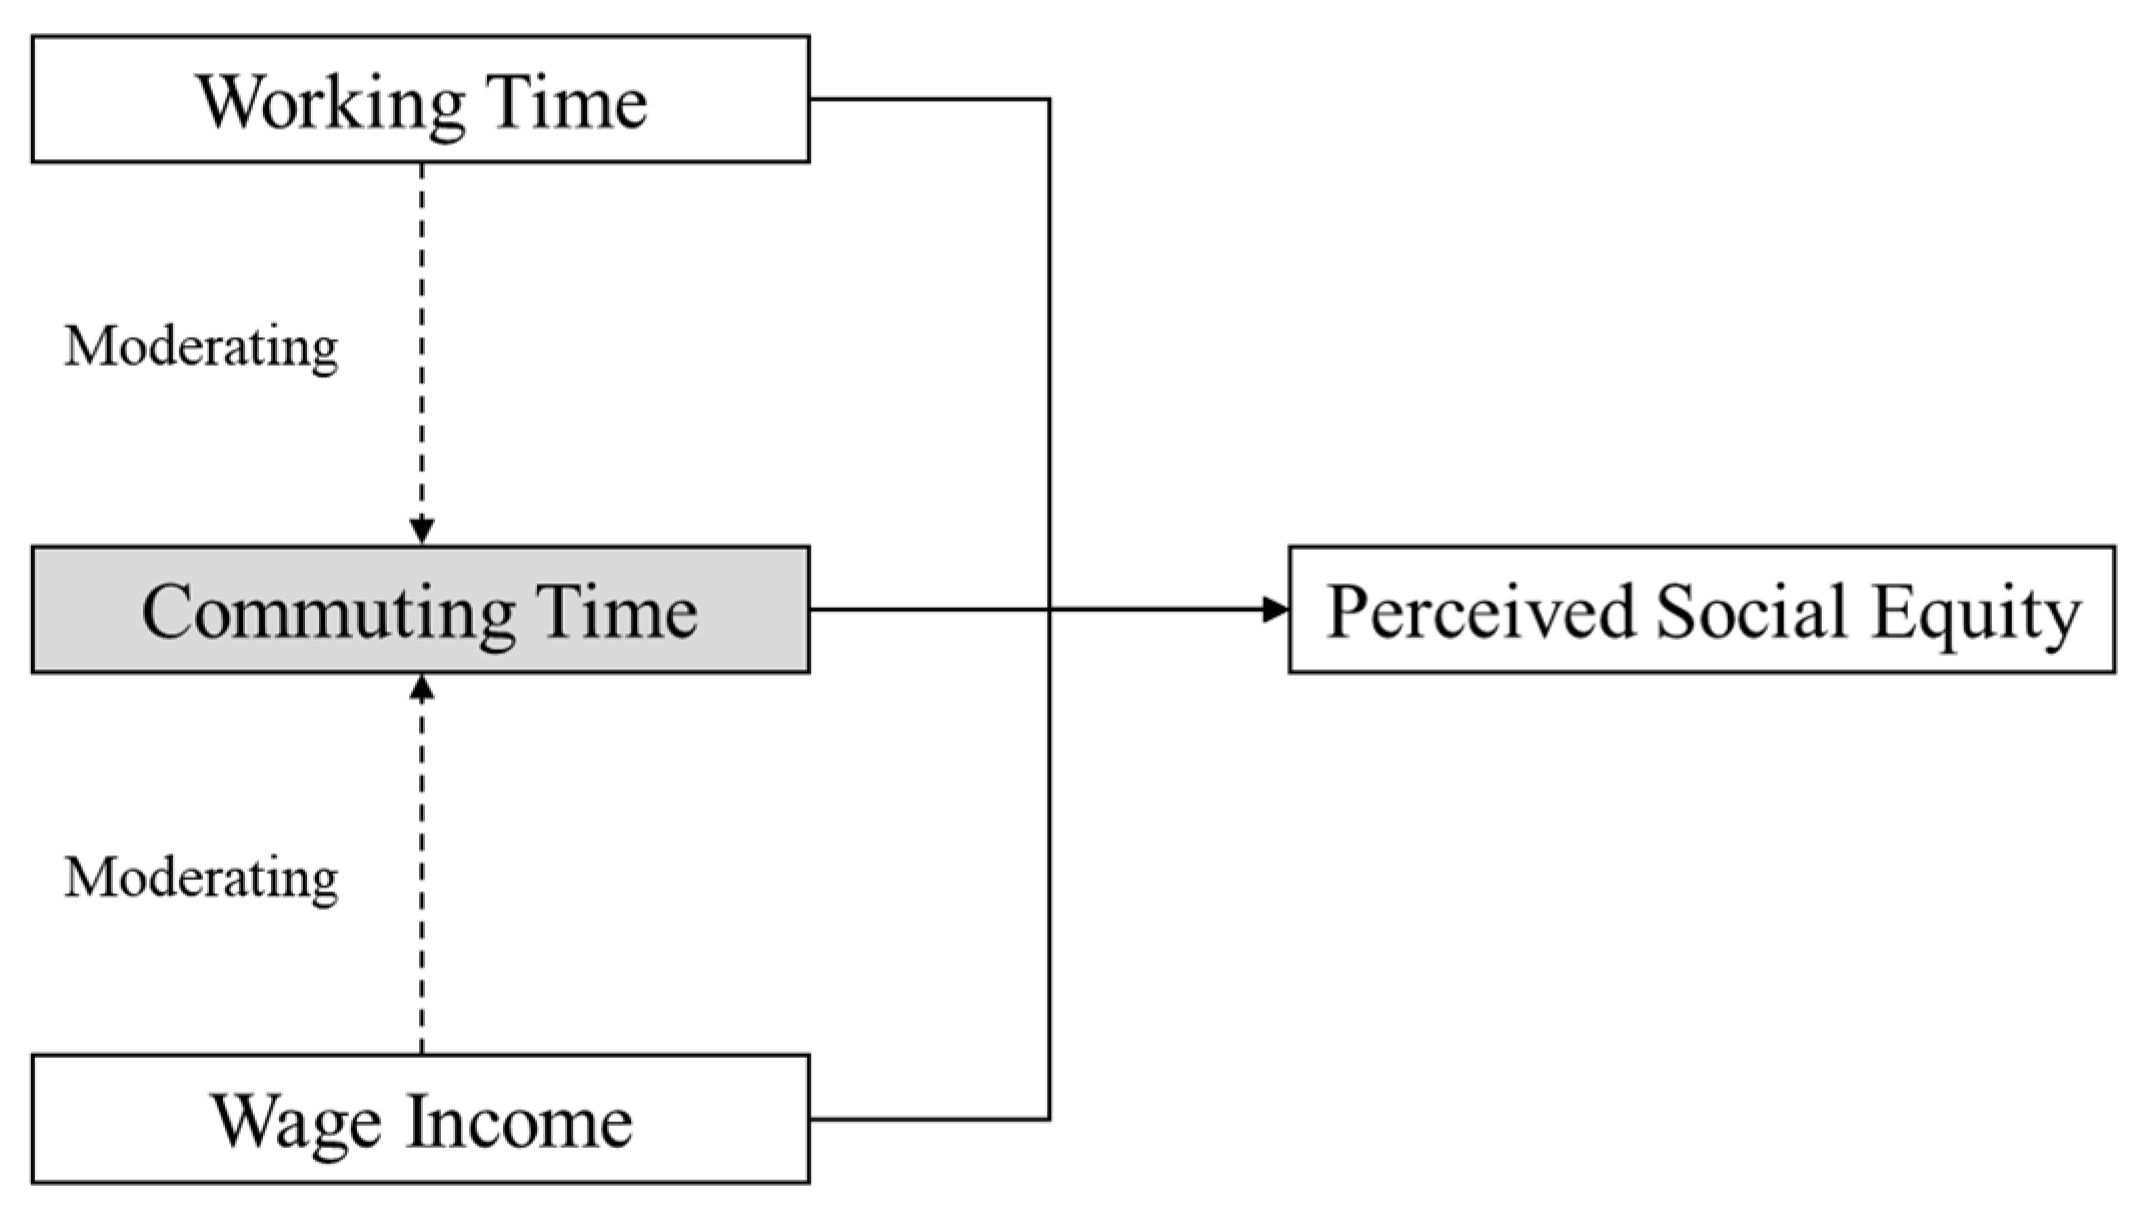
Commuting time is an important factor that affects transportation equity. However, most research on transportation equity focused on transportation itself, evaluating factors such as accessibility of the traffic and the commuting environment [14,15], paying less attention to the subjective social equity of commuters. Figure 1 shows the research framework of this study. In China, many people endure long working hours and commuting times, resulting in little leisure time, which can lead to exhaustion. For example, approximately 30,000 people who live in the town of Yanjiao and commute four hours to Beijing for work are able to secure only a few hours of sleep after they get home from work every day [34]. These people are under great pressure from life, which may lead to them thinking their commuting experience is unfair. Therefore, this study firstly explored the relationship between commuting time and commuters’ perceived social equity, controlling for socioeconomic variables.
Furthermore, within the context of Western countries, many researchers noted what is termed the “commuting paradox” [33,35,36]. Generally speaking, commuters are willing to spend more time commuting in order to obtain better jobs and higher wages. Receiving a higher salary reflects the return on one’s efforts spent commuting, and individuals are more likely to consider longer commute times as fair if the degree of effort is equal to the degree of return. Given this paradox, we also analysed the moderating effect of working time and income on commuter’s perceived social equity.
2.2. Data
The data used in this paper were from the China Labour-force Dynamics Survey 2016 (CLDS) (http://css.sysu.edu.cn; details of the CLDS sampling process are available in the literature [37]). With the working age population—aged 15 to 64—as the survey’s sample group, CLDS measured factors such as education level, employment, labour rights and interests, occupational mobility, occupational protection and health, job satisfaction, and happiness. CLDS is an important source of social survey data in China, with the data reflecting China’s state of social development at a given moment in time. The CLDS survey adopted a probability sampling method with multiple stages and multiple levels proportional to the size of the labour force. As this study focused on the impact of commuting and working time on respondents’ perceived social equity, we selected data on residents aged 18 to 60 living in urban neighbourhoods. After eliminating samples with missing values, 3212 samples nested in 76 cities were used for analysis.
2.3. Measures and method
In this study, the dependent variable was the respondents’ perceived social equity. In CLDS 2016, the respondents’ perceived social equity was measured by a five-point scale ranging from 1 (“completely unfair”) to 5 (“completely fair”). Because the dependent variable was an ordinal variable, it was more suitable to adopt an ordered regression method. Compared with the general linear regression method, the analysis results of an ordered regression are more accurate. The city was the sampling unit of the CLDS survey, and the urban traffic environments of different cities were quite different. Therefore, in order to control for the influence of city-level factors, we adopted multi-level (i.e., city-level and individual-level) order logistic regression to analyse the impact of urban commuting time on residents’ perceived social equity. In this regression analysis, the independent variables were the logarithms of three continuous variables: the daily commute time, the weekly working time, and annual wages.
Many studies found that individuals’ perceived social equity is directly related to their socioeconomic status. For example, women are more likely to be treated unfairly because of gender in the workplace [38,39]. In China, the status of Chinese Communist Party (CCP) members and the type of household registration (i.e., hukou) held have a positive impact on the social mobility of individuals and may also have a positive impact on perceived social equity [40,41]. In addition, education level and occupation type have a significant impact on an individual’s perceived social equity [42]. Therefore, several socioeconomic status dummy variables were selected as control variables, including gender (male = 1), age, marital status (single = 1), party member (yes = 1), hukou (agricultural hukou = 1), educational attainment (primary school or below = 1), workplace (in the neighbourhood = 1), and occupation (civil servants and technicians = 1). In addition, we also used interaction analysis to estimate the effect of individuals’ annual wages on two relationships: between commuting time and their perceived social equity, and between working time and their perceived social equity.
3. Results
3.1. Descriptive Statistics
Table 1 reports the descriptive statistics of the sample group. The mean value of respondents’ perceived social equity was 3.26 (SD = 0.93). The mean value of the daily commuting time was 41.92 min (SD = 42.12), and the mean value of the weekly working time was 45.55 h (SD = 15.74). In terms of respondents’ socioeconomic characteristics, the mean value of the annual wages was 48,248.31 yuan (SD = 55,860.67). The proportion of male respondents was 53.52%. The average age of the respondents was 39.52 years old (SD = 9.92). Most of the respondents were married (79.70%). CPC members constituted 18.96% of the respondents. The proportion of respondents holding agricultural hukou was 29.98%, while 70.02% held non-agricultural hukou. In terms of education level, respondents with a college degree or above constituted the largest group, followed by those with a high-school degree, those with a junior high-school degree, and those with a primary school degree or below. In terms of the distribution of respondents’ workplaces, the percentages of respondents who worked in their neighbourhood, town, county, and outside of their county were 35.4%, 11.15%, 37.8%, and 15.66%, respectively. In terms of occupational structure, most respondents held jobs in the service sector.
Table 2 shows the perceived social equity, average commute time, and average weekly working hours of respondents using different modes of transportation. There was a large difference in the average commute time by respondents using different vehicles. Respondents who commuted by public transport had the longest average commute time of 73.32 min per day, followed by 48.19 min for respondents who used a private car. In terms of weekly working hours, respondents who commuted via walking and motorcycles had the longest average weekly working hours of 47.68 h and 47.07 h, respectively. Respondents who used a private car to commute reported the highest level of perceived social equity (3.44). The respondents with the lowest level of perceived social equity (3.12) were those who used bicycles to commute.
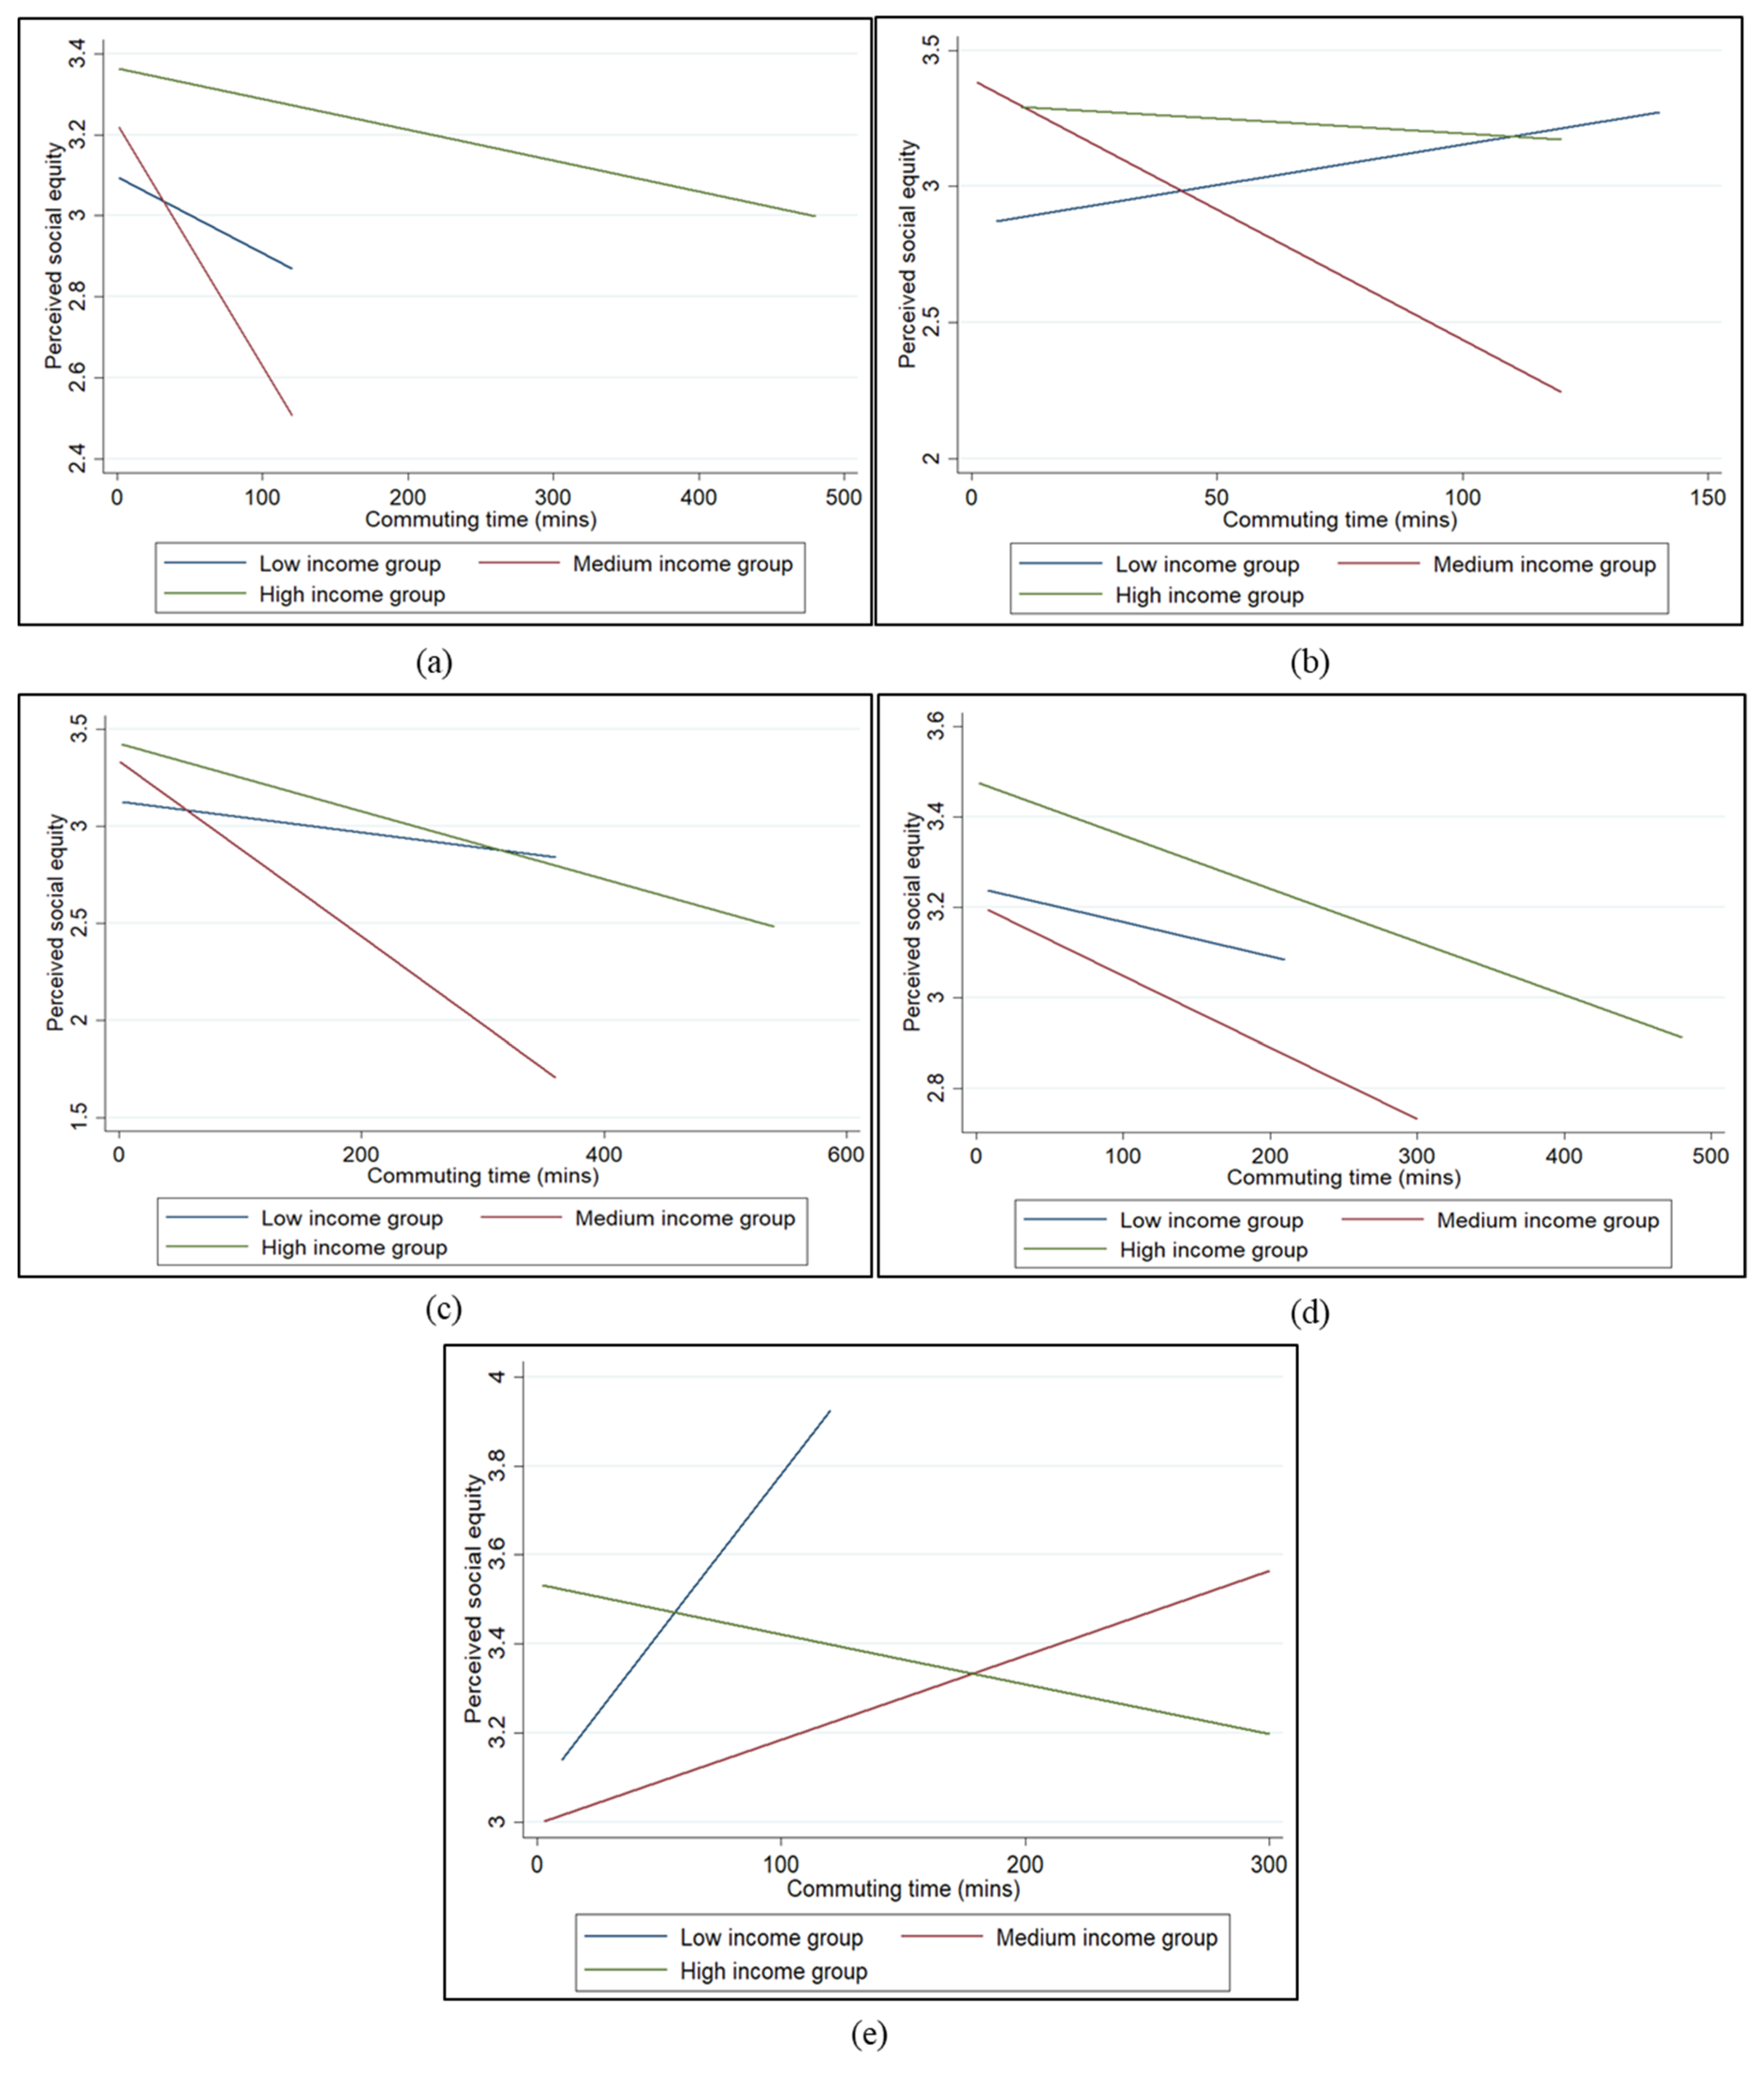
We divided respondents’ income into three categories: low income, middle income, and high income. Figure 2 shows changes in perceived social equity as a function of commute time for different income groups using five modes of transport. In general, the perceived social equity of high-income people was higher than that of middle- and low-income people and was less affected by commuting time. For those who commuted by walking, the perceived social equity of the middle-income and low-income groups decreased rapidly with increased commuting time, while the perceived social equity of the high-income group decreased slowly with an increase in commuting time. This shows that, compared with low- and middle-income people, high-income people were more willing to walk to work. This may be because high-income people can afford to live near where they are employed, and they can choose to walk to and from work. For those who used bicycles to commute to work, the perceived social equity of low-income groups gradually increased with an increase in commuting time, while the perceived social equity of middle- and high-income groups decreased with an increase in commuting time. Bicycles are a very popular commuting tool in China. For low-income people, commuting by bicycle has the advantages of low cost and convenience. Therefore, the perceived social equity of low-income commuters did not decrease with an increase in commuting time. For those who commuted via motorcycle and public transport, the perceived social equity for all income groups declined as commuting time increased. Motorcycle commuting is characterised by its low cost and long commuting distance (compared to bicycle commuting); thus, it is also one of the most commonly used commuting tools for low-income people. As a result, low-income commuters who use motorcycles are less affected by commuting time. Finally, with regard to those who commuted by private car, the perceived social equity of high-income groups decreased with an increase in commuting time, while the perceived social equity of low-income and middle-income groups increased with an increase of commuting time. Commuting by car is a relatively comfortable and convenient way of commuting. However, high-income residents may be less willing to spend time commuting and, thus, may have a lower tolerance for commuting time.
3.2. Regression results
3.2.1. Commuting Time and Residents’ Perceived Social Equity
We used multilevel regression models to examine the relationship between commuting time and respondents’ perceived social equity. Table 3 shows the regression results for all samples. Model 1 shows that the commuting time, working time, and annual wages had a significant effect on respondents’ perceived social equity. That is, as the respondent’s commute time and working time increased, so did the likelihood of them feeling their situation was unfair (odds ratio (OR) = 0.902, p < 0.05; OR = 0.831, p < 0.05, respectively). However, as the average annual wages of the respondent increased, so did the likelihood of them feeling socially equitable (OR = 1.400, p < 0.01).
With regard to the impact of individual socioeconomics on respondents’ perceived social equity, the older the respondents were, the more likely they were to feel social unfairness (OR = 0.986, p < 0.01). There was a significant difference in the perceived social equity between CCP members and non-party members. Non-party members were more likely to feel socially inequitable than respondents who were CCP members (OR = 0.764, p < 0.01). Surprisingly, among the types of work, respondents engaged in agricultural work were more likely to feel socially equitable than civil servants and technicians (OR = 2.519, p < 0.01). This may result from the Chinese government’s continuous implementation of the rural revitalisation strategy and improvement of the welfare of agricultural workers in recent years. In Model 2, we added an interaction analysis to Model 1. We found that, for all sample groups, income and working time had no moderating effect on the relationship between commuting time and perceived social equity. The results suggest that the sense of social inequity that people feel because of long commutes or working hours is not alleviated by higher wages.
3.2.2. The Relationship between Commuting Time and Residents’ Perceived Social Equity as a Function of Mode of Transportation
Table 4 displays the relationship between commuting time and perceived social equity across different types of transportation used to commute to work. For respondents who walked to work, commuting time and income had a significant impact on their perceived social equity. As the commuting time increased, so did the likelihood of them feeling socially inequitable (OR = 0.822, p < 0.05). In contrast, as the income increased, so did the likelihood of them thinking that society is fair (OR = 1.253, p < 0.01). For respondents who commuted by bicycle, commuting time and working hours had no significant effect on their perceived social equity, but income had a significant positive impact on their perceived social equity (OR = 1.820, p < 0.01). For respondents who commuted by motorcycles, commuting time and income had a significant impact on their perceived social equity. That is, as the commute time increased or the wages decreased, so did the likelihood of them feeling socially inequitable (OR = 0.756, p < 0.05; OR = 1.444, p < 0.01). For respondents who commuted by public transport, as their work time increased, so did the likelihood of them feeling social unfairness (OR = 0.753, p < 0.10). However, income had a positive impact on this group’s perceived social equity (OR = 1.356, p < 0.01). For respondents who used private cars for commuting, commuting time and working hours had no significant impact on their perceived social equity, and only income had a positive impact on their perceived social equity (OR = 1.365, p < 0.05). From the above analysis, the perceived social equity of respondents commuting by walking and motorcycles was most sensitive to commuting time.
3.3. Interaction analysis
Table 5 shows the results of the interaction analysis of the relationships between commute time and income, commuting time and working hours, and working hours and income. Among these relationships, income had a significant moderating effect on the commuting time and perceived social equity of respondents who used motorcycles to commute. Compared with respondents who used motorcycles for commuting with lower wages, respondents with higher incomes tolerated longer commuting times. Model 12 shows that, among the people who used private cars to commute, as the income increased, their tolerance of longer commuting times decreased. While the commute time in Model 7 had no significant effect on the perceived social equity of this group, the reliability of Model 12 was low.
4. Discussion
4.1. Commuting Affects Perceptions of Social Equity in Urban China
This study found that commuting time has a significant impact on the perceived social equity of respondents in urban China. The impact of long commuting on the daily life of urban residents is becoming more and more obvious. Excessive commuting time can lead to physical and mental exhaustion [43,44], which can affect work efficiency and shorten the time for family life. Moreover, people of different social classes differ significantly in their modes of commuting and time spent commuting. Most respondents in the high-income group use private cars for commuting, and their commuting time is shorter than other modes of commuting. In contrast, most of the low- and middle-income respondents commute by public transportation or motorcycles, and their commuting time is the longest. The difference in commuting methods and commuting time between different income groups has an important impact on the fairness of Chinese society. Furthermore, although studies in Western countries found that active commuting (e.g., walking and cycling) contributes to personal well-being [45], this study found that people who commute by bike or on foot have a lower perception of social equity than those who commute by car. This may be due to the unfriendly traffic environment of Chinese cities.
4.2. The “Commuting Paradox” Revisited from the Perspective of Social Equity
In line with existing research [46,47], this study found that income indeed has a significant impact on the perceived social equity of residents. Compared with high-income groups, low-income groups are more likely to think that their experience is unfair. However, we further found that income does not play a moderating role in the relationship between commuting time and residents’ perceived social equity. We know from the “commuting paradox” that people endure agonising commutes to get the jobs and income they want [33], but our findings suggest that the commuting process leads to a decline in their well-being, with the two utilities not balanced by the degree of return. Similarly, we find that the utility of income does not outweigh the cost of commuting. In the same way, the utility of working time also cannot replace the fair utility of commuting. In terms of transportation equity, this study verifies the “commuting paradox” to some extent. Our results suggest that, if we want to improve transportation equity, we should not seek to improve it through the improvement of external economic and social conditions, but rather through the improvement of the commuting efficiency of different traffic modes. It is important to note that China’s transportation inequity is largely influenced by urban development patterns. For example, the long commute time of Chinese urban residents is closely related to the imbalance between employment and housing in China’s cities [48,49]. A more equitable distribution of employment opportunities is an important way to solve the current problem of transportation inequity in Chinese cities.
4.3. Policy Recommendations: Make Transportation More Equitable in Urban China
Improving commuting efficiency and narrowing the commute time gap between different modes of transportation are important ways to achieve transportation equity. To this end, we propose four ways to improve the city’s transportation equity. Firstly, in urban planning, time sensitivity of commuters using different means of transportation needs to be considered. In China, planners often lack consideration for the negative social effect caused by long commuting time, leading to the problems of extremely large city size and long commuting time. Our study shows that, in urban planning, finding an appropriate upper limit of commuting time is very important for the social equity of the city, which is also an important social issue that should be further expanded in China. Secondly, the commute duration that different commuters can tolerate is different. In this study, we found that the perceived social equity of commuters who commute by walking or motorcycle was most affected by the commuting time. Walking commuters are greatly affected by the walkability of urban roads, such as walkway safety, landscape, and accessibility. Due to its low cost and long commuting distance, motorcycles are now the most commonly used way of commuting in China. However, because many cities in China do not have roads built specifically for motorcycles, their commutes tend to mix with other traffic lanes, which has a negative impact on their commuting safety. The construction of urban traffic road systems should optimise roads for commuting by walking, bicycles, and motorcycles, reduce the sharing of roads by motor vehicles and bicycles, and make it safer and more comfortable for cyclists and motorcyclists commuting to work. Thirdly, wage income is an important moderating factor in the relationship between social equity and urban commuting time. In general, commuters can tolerate longer commutes for higher wages. Therefore, in the design of urban transportation network, the convenience of residents in low-income communities should be better taken care of. Fourthly, in the design of urban traffic road networks, it is necessary to reduce unnecessary delays, such as congestion and transportation transfer time. Within the context of urban functional layout, it is necessary to improve the job–housing balance in order to reduce commuting time and enable more people to find a house at the right price near their workplace. Due to population growth, increased motorisation, and larger urban scales, China’s big cities are the places most affected by transportation inequity. Therefore, we propose the implementation of a public transportation priority development strategy during transportation planning in megacities, such as BRT systems.
4.4. Strengths and Weaknesses
In previous studies [50,51,52], how to evaluate transportation equity was a focus of debate among scholars. However, few scholars took transportation as an independent factor affecting residents’ perceived social equity. We argue that the subjective perception of commuters should be the most important criterion to evaluate the equality of urban transportation. In this study, the traffic factor was taken as the influencing factor of residents’ perceived social equity, and the transportation equity issue in China was discussed, which fills the gap in this aspect. In addition, the second important contribution of this study was to expand the connotation of the “commuting paradox” [33,35,36], taking social equity as one of the aspects of the “commuting paradox”, and discussing the moderating role of wage income in commuting and social equity. This helped us better understand residents’ commuting choices and their social mentality.
This study used large-scale questionnaire data collected in China to verify the relationship between commuting time and transportation equity. However, there are still some research limitations. Firstly, in order to further analyse the relationship between commuting and social equity, it is necessary to conduct more in-depth investigations, such as into the commuting environment, commuting process, and job–housing relationship. Secondly, the multi-level ordered regression method adopted in this study can help to control for the impact of urban environment on residents’ perceived social equity, but more innovative analysis methods can be adopted in future (e.g., using tracking surveys on commuters, and analysing the commuting process in specific cities).
5. Conclusions
Commuting time is an important part of transportation equity. In this study, we found that respondents who used private cars to commute had the highest level of perceived social equity, while respondents who used bicycles for commuting had the lowest level of perceived social equity. For all samples, commuting time had a significant negative effect on respondents’ perceived social equity. That is, as the respondent’s commute time increased, so did the likelihood of them feeling that society is unfair. We also found that income had no moderating effect on the relationship between commuting time and perceived social equity. The results suggest that the social inequity caused by long commutes is not alleviated by higher wages.
We also analysed the relationship between commuting time and perceived social equity of respondents who used different modes of commuting and found that the perceived social equity of respondents who used walking and motorcycle commuting was significantly affected by commuting time. Moreover, income had a slight moderating effect on the relationship between commuting time and perceived social equity of respondents who used motorcycle commuting. In response to the social inequity caused by commuting time, we proposed policy recommendations, including considering the commuting time sensitivity of different types of commuters, paying attention to the social equity issues caused by different modes of transportation, providing more equitable commuting ways for low-income people, and prioritising public transportation. With the continuous improvement of urbanization in China, transportation equity is an increasingly prominent social problem, and it is necessary to carry out long-term investigations and research. In future studies, we will choose a typical city to analyse the different effects of the job–housing relationship and commuting on residents’ well-being (e.g., life satisfaction), and we will also further investigate the mitigative effect of different traffic tools on the social equity of the same social group (e.g., whether the perceived social equity of residents who used to commute by motorcycle can be improved after they commute by bus.). In addition, we will study the commuting problems of disadvantaged groups in China (such as disabled people, low-income groups, and unemployed people) and the social impact on their daily lives.
Author Contributions
H.C. and X.L. conceptualized and designed the research; H.C. and F.S. analysed the data; H.C. and X.L wrote the paper; Y.S. and F.S. helped improve the figures and manuscript. All authors read and approved the final manuscript.
Funding
This work was supported by the National Natural Science Foundation of China (Grant No. 51568025; Grant No. 51968027; Grant No. 51908114; Grant No. 41771167) and the Fundamental Research Funds for the Central Universities.
Conflicts of Interest
The authors declare no conflicts of interest.
References
- Welch, T.F. Equity in transport: The distribution of transit access and connectivity among affordable housing units. Transp. Policy 2013, 30, 283–293. [Google Scholar] [CrossRef]
- Pereira, R.H.; Schwanen, T.; Banister, D. Distributive justice and equity in transportation. Transp. Rev. 2017, 37, 170–191. [Google Scholar] [CrossRef]
- Hine, J.; Mitchell, F. Better for everyone? Travel experiences and transport exclusion. Urban Stud. 2001, 38, 319–332. [Google Scholar] [CrossRef]
- Litman, T. Evaluating Transportation Equity; Victoria Transport Policy Institute: Victoria, BC, Canada, 1999. [Google Scholar]
- Denmark, D. The outsiders: Planning and transport disadvantage. J. Plan. Educ. Res. 1998, 17, 231–245. [Google Scholar] [CrossRef]
- Guzman, L.A.; Oviedo, D.; Rivera, C. Assessing equity in transport accessibility to work and study: The Bogotá region. J. Transp. Geogr. 2017, 58, 236–246. [Google Scholar] [CrossRef]
- Ricciardi, A.M.; Xia, J.C.; Currie, G. Exploring public transport equity between separate disadvantaged cohorts: A case study in Perth, Australia. J. Transp. Geogr. 2015, 43, 111–122. [Google Scholar] [CrossRef]
- Jansuwan, S.; Christensen, K.M.; Chen, A. Assessing the transportation needs of low-mobility individuals: Case study of a small urban community in Utah. J. Urban Plan. Dev. 2013, 139, 104–114. [Google Scholar] [CrossRef]
- Grengs, J. Equity and the social distribution of job accessibility in Detroit. Environ. Plan. B Plan. Des. 2012, 39, 785–800. [Google Scholar] [CrossRef]
- Delbosc, A.; Currie, G. Transport problems that matter – social and psychological links to transport disadvantage. J. Transp. Geogr. 2011, 19, 170–178. [Google Scholar] [CrossRef]
- Ahmad, M. Independent-mobility rights and the state of public transport accessibility for disabled people: Evidence from southern Punjab in Pakistan. Adm. Soc. 2015, 47, 197–213. [Google Scholar] [CrossRef]
- Bombom, L.S.; Abdullahi, I. Travel patterns and challenges of physically disabled persons in Nigeria. GeoJournal 2016, 81, 519–533. [Google Scholar] [CrossRef]
- de Vasconcellos, E.A. Transport metabolism, social diversity and equity: The case of São Paulo, Brazil. J. Transp. Geogr. 2005, 13, 329–339. [Google Scholar] [CrossRef]
- Karner, A. Assessing public transit service equity using route-level accessibility measures and public data. J. Transp. Geogr. 2018, 67, 24–32. [Google Scholar] [CrossRef]
- Linovski, O.; Baker, D.M.; Manaugh, K. Equity in practice? Evaluations of equity in planning for bus rapid transit. Transp. Res. A Policy Pract. 2018, 113, 75–87. [Google Scholar] [CrossRef]
- Fan, Y.; Guthrie, A.; Levinson, D.M. Impact of light rail implementation on labor market accessibility: A transportation equity perspective. J. Transp. Land Use 2010, 5, 28–39. [Google Scholar] [CrossRef]
- Eliasson, J.; Mattsson, L.-G. Equity effects of congestion pricing: Quantitative methodology and a case study for Stockholm. Transp. Res. A Policy Pract. 2006, 40, 602–620. [Google Scholar] [CrossRef]
- Manaugh, K.; Badami, M.G.; El-Geneidy, A.M. Integrating social equity into urban transportation planning: A critical evaluation of equity objectives and measures in transportation plans in North America. Transp. Policy 2015, 37, 167–176. [Google Scholar] [CrossRef]
- Mobasheri, A.; Zipf, A.; Francis, L. Openstreetmap data quality enrichment through awareness raising and collective action tools—Experiences from a European project. Geo-Spat. Inf. Sci. 2018, 21, 234–246. [Google Scholar] [CrossRef]
- Zipf, A.; Mobasheri, A.; Rousell, A.; Hahmann, S. Crowdsourcing for individual needs—The case of routing and navigation for mobility-impaired persons. Eur. Handb. Crowdsourced Geogr. Inf. 2016, 325. [Google Scholar] [CrossRef]
- Ahmed, Q.I.; Lu, H.; Ye, S. Urban transportation and equity: A case study of Beijing and Karachi. Transp. Res. A Policy Pract. 2008, 42, 125–139. [Google Scholar] [CrossRef]
- Shen, Q. Urban transportation in Shanghai, China: Problems and planning implications. Int. J. Urban. Reg. Res. 1997, 21, 589–606. [Google Scholar] [CrossRef]
- Liu, Z.; He, C.; Zhang, Q.; Huang, Q.; Yang, Y. Extracting the dynamics of urban expansion in China using dmsp-ols nighttime light data from 1992 to 2008. Landsc. Urban Plan. 2012, 106, 62–72. [Google Scholar] [CrossRef]
- Shi, J.; Zhou, N. A quantitative transportation project investment evaluation approach with both equity and efficiency aspects. Res. Transp. Econ. 2012, 36, 93–100. [Google Scholar] [CrossRef]
- Yang, J.; Gakenheimer, R. Assessing the transportation consequences of land use transformation in urban China. Habitat. Int 2007, 31, 345–353. [Google Scholar] [CrossRef]
- Zhao, P. The determinants of the commuting burden of low-income workers: Evidence from Beijing. Environ. Plan A 2015, 47, 1736–1755. [Google Scholar] [CrossRef]
- Zhao, P.; Lu, B.; Roo, G.D. The impact of urban growth on commuting patterns in a restructuring city: Evidence from Beijing. Pap. Reg. Sci. 2011, 90, 735–754. [Google Scholar] [CrossRef]
- Li, S.M.; Liu, Y. The jobs-housing relationship and commuting in Guangzhou, China: Hukou and dual structure. J. Transp. Geogr. 2016, 54, 286–294. [Google Scholar] [CrossRef]
- Zhao, P.; Howden-Chapman, P. Social inequalities in mobility: The impact of the hukou system on migrants’ job accessibility and commuting costs in Beijing. Int. Dev. Plan. Rev. 2010, 32, 363–384. [Google Scholar] [CrossRef]
- Zhu, Z.; Li, Z.; Liu, Y.; Chen, H.; Zeng, J. The impact of urban characteristics and residents’ income on commuting in China. Transp. Res. D Transp. Environ. 2017, 57, 474–483. [Google Scholar] [CrossRef]
- Lin, D.; Allan, A.; Cui, J. Exploring differences in commuting behaviour among various income groups during polycentric urban development in China: New evidence and its implications. Sustainability 2016, 8, 1188. [Google Scholar] [CrossRef]
- Zhu, J.; Fan, Y. Commute happiness in Xi’an, China: Effects of commute mode, duration, and frequency. Travel Behav. Soc. 2018, 11, 43–51. [Google Scholar] [CrossRef]
- Stutzer, A.; Frey, B.S. Stress that doesn’t pay: The commuting paradox. Scand. J. Econ. 2008, 110, 339–366. [Google Scholar] [CrossRef]
- 300,000 Beijing Office Workers Living in Yanjiao. Available online: http://dy.163.com/v2/article/detail/DPVIV24B053717RU.html (accessed on 1 August 2019).
- Van Ommeren, J.; Rietveld, P. The commuting time paradox. J. Urban Econ. 2005, 58, 437–454. [Google Scholar] [CrossRef]
- Gordon, P.; Richardson, H.W.; Jun, M.-J. The commuting paradox evidence from the top twenty. J. Am. Plan. Assoc. 1991, 57, 416–420. [Google Scholar] [CrossRef]
- Wang, J.; Zhou, Y.; Liu, S. China labor-force dynamics survey: Design and practice. Chin. Sociol. Dialogue 2017, 2, 83–97. [Google Scholar] [CrossRef]
- Zhao, J.; Settles, B.H.; Sheng, X. Family-to-work conflict: Gender, equity and workplace policies. J. Comp. Family Stud. 2011, 42, 723–738. [Google Scholar] [CrossRef]
- Bobbitt-Zeher, D. Gender discrimination at work: Connecting gender stereotypes, institutional policies, and gender composition of workplace. Gend. Soc. 2011, 25, 764–786. [Google Scholar] [CrossRef]
- Wu, X.; Treiman, D.J. The household registration system and social stratification in China: 1955–1996. Demography 2004, 41, 363–384. [Google Scholar] [CrossRef]
- Bian, Y. Chinese social stratification and social mobility. Ann. Rev. Soc. 2002, 28, 91–116. [Google Scholar] [CrossRef]
- Brennan, J.; Naidoo, R. Higher education and the achievement (and/or prevention) of equity and social justice. High. Educ. 2008, 56, 287–302. [Google Scholar] [CrossRef]
- Künn-Nelen, A. Does commuting affect health? Health Econ. 2016, 25, 984–1004. [Google Scholar] [CrossRef] [PubMed]
- Lorenz, O. Does commuting matter to subjective well-being? J. Transp. Geogr. 2018, 66, 180–199. [Google Scholar] [CrossRef] [Green Version]
- Martin, A.; Goryakin, Y.; Suhrcke, M. Does active commuting improve psychological wellbeing? Longitudinal evidence from eighteen waves of the British household panel survey. Prev. Med. 2014, 69, 296–303. [Google Scholar] [CrossRef] [PubMed]
- Xie, Y.; Zhou, X. Income inequality in today’s China. Proc. Natl. Acad. Sci. USA 2014, 111, 6928–6933. [Google Scholar] [CrossRef] [PubMed]
- Su, C.-W.; Liu, T.-Y.; Chang, H.-L.; Jiang, X.-Z. Is urbanization narrowing the urban-rural income gap? A cross-regional study of China. Habitat. Int. 2015, 48, 79–86. [Google Scholar] [CrossRef]
- Zhao, P.; Lü, B.; De Roo, G. Impact of the jobs-housing balance on urban commuting in Beijing in the transformation era. J. Transp. Geogr. 2011, 19, 59–69. [Google Scholar] [CrossRef]
- Wang, D.; Chai, Y. The jobs–housing relationship and commuting in Beijing, China: The legacy of danwei. J. Transp. Geogr. 2009, 17, 30–38. [Google Scholar] [CrossRef]
- Lee, R.J.; Sener, I.N.; Jones, S.N. Understanding the role of equity in active transportation planning in the United States. Transp. Rev. 2017, 37, 211–226. [Google Scholar] [CrossRef]
- Bills, T.S.; Walker, J.L. Looking beyond the mean for equity analysis: Examining distributional impacts of transportation improvements. Transp. Policy 2017, 54, 61–69. [Google Scholar] [CrossRef]
- Beiler, M.O.; Mohammed, M. Exploring transportation equity: Development and application of a transportation justice framework. Transp. Res. D Transp. Environ. 2016, 47, 285–298. [Google Scholar] [CrossRef]
Figure 1.
The research framework of this study.

Figure 2.
The relationship between commuting time and perceived social equity across modes of transport: (a) commuting via walking; (b) commuting via bicycle; (c) commuting via motorcycle; (d) commuting via public transport; (e) commuting via private car.
Figure 2.
The relationship between commuting time and perceived social equity across modes of transport: (a) commuting via walking; (b) commuting via bicycle; (c) commuting via motorcycle; (d) commuting via public transport; (e) commuting via private car.


Table 1.
Summary statistics of respondents’ characteristics (N = 3212).
| Variable | Mean | Standard Deviation |
|---|---|---|
| Perceived social equity (1–5) | 3.26 | 0.93 |
| Daily commuting time (min) | 41.92 | 42.12 |
| Weekly working time (h) | 45.55 | 15.74 |
| Annual wages (yuan) | 48,248.31 | 55,860.67 |
| Age (years) | 39.52 | 9.92 |
| Gender (%) | ||
| Male | 53.52 | |
| Female | 46.48 | |
| Marital status (%) | ||
| Single | 16.59 | |
| Married | 79.70 | |
| Divorced or widowed | 3.70 | |
| Party member (%) | ||
| Yes | 18.96 | |
| No | 81.04 | |
| Hukou (%) | ||
| Agricultural hukou | 29.98 | |
| Non-agricultural hukou | 70.02 | |
| Educational attainment (%) | ||
| Primary school or below | 6.82 | |
| Junior high school | 24.78 | |
| Senior high school | 26.03 | |
| College or above | 42.37 | |
| Workplace (%) | ||
| In the neighbourhood | 35.40 | |
| In the town | 11.15 | |
| In the county | 37.80 | |
| Outside the county | 15.66 | |
| Occupation (%) | ||
| Civil servants and technicians | 20.02 | |
| Service personnel | 56.32 | |
| Farm personnel | 2.21 | |
| Manufacturing personnel | 21.05 | |
| Other | 0.40 |
Table 2.
Perceived social equity, commuting time, and working hours across transport modes.
| Transport Mode | Perceived Social Equity (Mean Value, min) | Commuting Time Daily (Mean Value, min) | Working Time Weekly (Mean Value, h) |
|---|---|---|---|
| Walking | 3.21 (SD = 0.94) | 20.68 (SD = 17.83) | 47.07 (SD = 16.91) |
| Bicycle | 3.12 (SD = 1.06) | 36.65 (SD = 27.60) | 45.35 (SD = 14.81) |
| Motorcycle | 3.25 (SD = 0.91) | 32.15 (SD = 34.18) | 47.68 (SD = 16.50) |
| Public transport | 3.29 (SD = 0.92) | 73.32 (SD = 51.34) | 42.79 (SD = 14.11) |
| Private car | 3.44 (SD = 0.87) | 48.19 (SD = 40.86) | 44.65 (SD = 14.35) |
Table 3.
The relationship between commuting time and respondents’ perceived social equity. OR—odds ratio; CI—confidence interval.
Table 3.
The relationship between commuting time and respondents’ perceived social equity. OR—odds ratio; CI—confidence interval.
| Independent Variables | Model 1 | Model 2 | ||
|---|---|---|---|---|
| OR | 95% CI | OR | CI | |
| Logarithm of the daily commute | 0.902 ** | (0.832, 0.979) | 0.692 | (0.242, 1.978) |
| Logarithm of weekly working time | 0.831 ** | (0.715, 0.965) | 1.042 | (0.250, 4.348) |
| Logarithm of annual wages | 1.400 *** | (1.281, 1.529) | 1.193 | (0.660, 2.155) |
| Control variables | ||||
| Gender (reference: male) | 1.091 | (0.948, 1.255) | 1.092 | (0.949, 1.256) |
| Age | 0.986 *** | (0.977, 0.994) | 0.986 *** | (0.977, 0.994) |
| Marital status (reference: single) | ||||
| Married | 0.883 | (0.714, 1.092) | 0.880 | (0.712, 1.089) |
| Divorced or widowed | 0.920 | (0.621, 1.364) | 0.917 | (0.618, 1.359) |
| Party member (reference: yes) | 0.764 *** | (0.634, 0.921) | 0.765 *** | (0.635, 0.922) |
| Hukou (reference: agricultural hukou) | 0.933 | (0.781, 1.115) | 0.933 | (0.781, 1.115) |
| Educational attainments (reference: primary school or below) | ||||
| Junior high school | 0.969 | (0.728, 1.290) | 0.974 | (0.731, 1.298) |
| Senior high school | 0.996 | (0.736, 1.347) | 1.004 | (0.742, 1.359) |
| College or above | 1.040 | (0.754, 1.437) | 1.043 | (0.755, 1.441) |
| Workplace (reference: in the neighbourhood) | ||||
| In the town | 1.142 | (0.905, 1.441) | 1.145 | (0.908, 1.445) |
| In the county | 1.024 | (0.864, 1.214) | 1.026 | (0.865, 1.216) |
| Outside the county | 0.930 | (0.743, 1.164) | 0.920 | (0.734, 1.152) |
| Occupation (reference: civil servants and technicians) | ||||
| Service personnel | 1.161 | (0.967, 1.395) | 1.162 | (0.968, 1.395) |
| Farm personnel | 2.519 *** | (1.493, 4.249) | 2.506 *** | (1.482, 4.236) |
| Manufacturing personnel | 1.046 | (0.827, 1.323) | 1.048 | (0.829, 1.326) |
| Others | 0.916 | (0.304, 2.758) | 0.918 | (0.304, 2.776) |
| Logarithm of the daily commute × logarithm of annual wages | 1.051 | (0.964, 1.146) | ||
| Logarithm of weekly working time × logarithm of annual wages | 0.999 | (0.872, 1.144) | ||
| Logarithm of the daily commute × logarithm of the working time weekly | 0.935 | (0.805, 1.085) | ||
| Number of individuals | 3212 | 3212 | ||
| Number of cities | 76 | 76 | ||
| Log likelihood | −3946.632 | −3945.632 | ||
| Chi-squared | 116.402 | 118.761 | ||
Exponentiated coefficients; 95% confidence intervals in brackets. * p < 0.10, ** p < 0.05, *** p < 0.01.
Table 4.
Perceived social equity as a function of mode of transportation.
| Model 3: Walking | Model 4: Bicycle | Model 5: Motorcycle | Model 6: Public Transport | Model 7: Private Car | ||||||
|---|---|---|---|---|---|---|---|---|---|---|
| Independent variable | OR | 95% CI | OR | 95% CI | OR | 95% CI | OR | 95% CI | OR | 95% CI |
| Logarithm of daily commute time | 0.822 ** | (0.702, 0.962) | 0.789 | (0.549, 1.133) | 0.756 ** | (0.605, 0.946) | 0.877 | (0.707, 1.087) | 0.933 | (0.722, 1.205) |
| Logarithm of weekly working time | 0.949 | (0.723, 1.245) | 0.730 | (0.400, 1.331) | 0.832 | (0.597, 1.159) | 0.753 * | (0.554, 1.024) | 0.671 | (0.399, 1.128) |
| Logarithm of annual wages | 1.253 *** | (1.062, 1.480) | 1.820 *** | (1.240, 2.671) | 1.444 *** | (1.172, 1.780) | 1.356 *** | (1.138, 1.616) | 1.365 ** | (1.061, 1.756) |
| Control variables | ||||||||||
| Gender (reference: male) | 1.163 | (0.888, 1.523) | 1.535 | (0.912, 2.583) | 1.243 | (0.909, 1.700) | 1.086 | (0.809, 1.457) | 0.930 | (0.595, 1.454) |
| Age | 0.992 | (0.976, 1.009) | 0.979 | (0.951, 1.009) | 0.978 ** | (0.960, 0.997) | 0.970 *** | (0.951, 0.989) | 1.001 | (0.976, 1.027) |
| Marital status (reference: single) | ||||||||||
| Married | 0.974 | (0.644, 1.474) | 0.835 | (0.309, 2.256) | 0.652 * | (0.396, 1.074) | 1.099 | (0.731, 1.652) | 1.123 | (0.606, 2.082) |
| Divorced or widowed | 0.917 | (0.430, 1.957) | 0.768 | (0.211, 2.791) | 0.585 | (0.251, 1.363) | 1.237 | (0.525, 2.915) | 2.927 | (0.730, 11.741) |
| Party member (reference: yes) | 0.759 | (0.527, 1.093) | 1.018 | (0.456, 2.273) | 0.608 ** | (0.372, 0.993) | 0.916 | (0.628, 1.334) | 0.581 ** | (0.375, 0.899) |
| Hukou (ref: agricultural hukou) | 0.854 | (0.621, 1.173) | 1.088 | (0.559, 2.119) | 1.287 | (0.906, 1.829) | 0.927 | (0.618, 1.390) | 0.944 | (0.542, 1.642) |
| Educational attainment (reference: primary school or below) | ||||||||||
| Junior high school | 1.250 | (0.778, 2.010) | 1.983 * | (0.932, 4.219) | 0.474 ** | (0.253, 0.889) | 0.726 | (0.335, 1.570) | 0.974 | (0.246, 3.859) |
| Senior high school | 1.468 | (0.881, 2.447) | 1.354 | (0.590, 3.108) | 0.336 *** | (0.170, 0.663) | 0.981 | (0.460, 2.094) | 0.958 | (0.243, 3.769) |
| College or above | 1.664 * | (0.962, 2.877) | 0.816 | (0.306, 2.178) | 0.400 ** | (0.191, 0.839) | 0.916 | (0.416, 2.019) | 0.699 | (0.176, 2.780) |
| Workplace (reference: in the neighbourhood) | ||||||||||
| In the town | 1.186 | (0.701, 2.005) | 1.255 | (0.581, 2.711) | 0.895 | (0.575, 1.392) | 1.256 | (0.702, 2.248) | 0.816 | (0.401, 1.659) |
| In the county | 0.966 | (0.704, 1.325) | 1.380 | (0.766, 2.485) | 0.838 | (0.585, 1.200) | 1.137 | (0.742, 1.741) | 0.949 | (0.570, 1.582) |
| Beyond the county | 0.872 | (0.545, 1.397) | 1.199 | (0.526, 2.734) | 1.135 | (0.586, 2.196) | 0.908 | (0.557, 1.480) | 0.609 | (0.332, 1.119) |
| Occupation (reference: civil servants and technicians) | ||||||||||
| Service personnel | 1.086 | (0.759, 1.555) | 2.066 | (0.825, 5.176) | 1.193 | (0.752, 1.894) | 1.010 | (0.706, 1.445) | 1.159 | (0.744, 1.805) |
| Farm personnel | 2.126 * | (0.906, 4.990) | 12.602 * | (0.870, 182.455) | 3.147 ** | (1.183, 8.370) | 1.011 | (0.139, 7.343) | 4.278 | (0.067, 273.776) |
| Manufacturing personnel | 1.108 | (0.695, 1.766) | 2.250 | (0.800, 6.325) | 0.957 | (0.562, 1.628) | 0.905 | (0.543, 1.509) | 1.148 | (0.614, 2.146) |
| Others | 3.967 | (0.299, 52.676) | 0.407 | (0.015, 10.766) | 0.254 | (0.030, 2.126) | 0.384 | (0.055, 2.676) | 5.868 | (0.094, 367.340) |
| Number of individuals | 924 | 243 | 690 | 743 | 448 | |||||
| Number of cities | 75 | 49 | 71 | 63 | 67 | |||||
| Log likelihood | −1141.654 | −329.377 | −821.180 | −892.524 | −508.647 | |||||
| Chi-squared | 29.192 | 25.537 | 54.176 | 38.094 | 21.633 | |||||
Exponentiated coefficients; 95% confidence intervals in brackets. * p < 0.10, ** p < 0.05, *** p < 0.01.
Table 5.
The results of the interaction analysis.
| Model 8: Walking | Model 9: Bicycle | Model 10: Motorcycle | Model 11: Public Transport | Model 12: Private Car | ||||||
|---|---|---|---|---|---|---|---|---|---|---|
| Independent variable | OR | 95% CI | OR | 95% CI | OR | 95% CI | OR | 95% CI | OR | 95% CI |
| Logarithm of daily commute time | 0.498 | (0.058, 4.251) | 0.481 | (0.003, 72.493) | 0.053 * | (0.002, 1.462) | 0.747 | (0.030, 18.503) | 555.976 *** | (6.381, 48444.278) |
| Logarithm of weekly working time | 0.632 | (0.059, 6.780) | 1.378 | (0.001, 2334.851) | 0.387 | (0.007, 20.156) | 2.852 | (0.113, 71.925) | 0.001 * | (0.000, 2.363) |
| Logarithm of annual wages | 1.281 | (0.470, 3.486) | 3.712 | (0.187, 73.686) | 0.413 | (0.082, 2.066) | 1.374 | (0.367, 5.144) | 0.358 | (0.019, 6.843) |
| Control variables | ||||||||||
| Gender (reference: male) | 1.160 | (0.886, 1.519) | 1.523 | (0.905, 2.565) | 1.234 | (0.902, 1.688) | 1.091 | (0.812, 1.465) | 0.927 | (0.593, 1.448) |
| Age | 0.992 | (0.976, 1.009) | 0.980 | (0.951, 1.010) | 0.978 ** | (0.960, 0.996) | 0.970 *** | (0.951, 0.989) | 1.000 | (0.975, 1.026) |
| Marital status (reference: single) | ||||||||||
| Married | 0.979 | (0.647, 1.482) | 0.861 | (0.316, 2.344) | 0.646 * | (0.392, 1.065) | 1.087 | (0.722, 1.635) | 1.097 | (0.590, 2.039) |
| Divorced or widowed | 0.930 | (0.436, 1.986) | 0.823 | (0.219, 3.091) | 0.575 | (0.246, 1.344) | 1.220 | (0.518, 2.878) | 2.667 | (0.674, 10.553) |
| Party member (reference: yes) | 0.761 | (0.528, 1.096) | 1.045 | (0.465, 2.347) | 0.625 * | (0.382, 1.021) | 0.925 | (0.634, 1.350) | 0.566 ** | (0.364, 0.879) |
| Hukou (reference: agricultural hukou) | 0.857 | (0.623, 1.179) | 1.069 | (0.548, 2.084) | 1.299 | (0.913, 1.849) | 0.933 | (0.622, 1.400) | 1.008 | (0.573, 1.774) |
| Educational attainment (reference: primary school or below) | ||||||||||
| Junior high school | 1.248 | (0.775, 2.007) | 2.005 * | (0.939, 4.281) | 0.465 ** | (0.246, 0.879) | 0.740 | (0.342, 1.604) | 0.905 | (0.231, 3.551) |
| Senior high school | 1.454 | (0.871, 2.428) | 1.374 | (0.597, 3.161) | 0.330 *** | (0.166, 0.655) | 0.990 | (0.463, 2.115) | 0.912 | (0.234, 3.549) |
| College or above | 1.667 * | (0.962, 2.887) | 0.828 | (0.308, 2.225) | 0.391 ** | (0.185, 0.827) | 0.926 | (0.420, 2.042) | 0.633 | (0.160, 2.506) |
| Workplace (reference: in the neighbourhood) | ||||||||||
| In the town | 1.180 | (0.696, 1.999) | 1.264 | (0.581, 2.749) | 0.934 | (0.599, 1.456) | 1.261 | (0.704, 2.259) | 0.749 | (0.366, 1.529) |
| In the county | 0.967 | (0.704, 1.328) | 1.392 | (0.768, 2.521) | 0.837 | (0.584, 1.200) | 1.159 | (0.755, 1.778) | 0.861 | (0.514, 1.442) |
| Beyond the county | 0.869 | (0.542, 1.393) | 1.257 | (0.539, 2.930) | 1.076 | (0.555, 2.085) | 0.915 | (0.561, 1.492) | 0.608 | (0.330, 1.120) |
| Occupation (reference: civil servants and technicians) | ||||||||||
| Service personnel | 1.075 | (0.750, 1.540) | 2.068 | (0.819, 5.223) | 1.217 | (0.766, 1.933) | 1.010 | (0.706, 1.446) | 1.192 | (0.763, 1.861) |
| Farm personnel | 2.115 * | (0.897, 4.989) | 12.547 * | (0.861, 182.804) | 3.429 ** | (1.274, 9.232) | 1.039 | (0.142, 7.620) | 4.438 | (0.065, 300.651) |
| Manufacturing personnel | 1.097 | (0.688, 1.750) | 2.289 | (0.812, 6.453) | 0.974 | (0.572, 1.659) | 0.919 | (0.550, 1.536) | 1.210 | (0.645, 2.272) |
| Others | 3.730 | (0.274, 50.747) | 0.418 | (0.016, 11.071) | 0.282 | (0.033, 2.380) | 0.380 | (0.054, 2.651) | 8.959 | (0.134, 597.614) |
| Interaction part | ||||||||||
| Logarithm of the daily commute × logarithm of annual wages | 0.990 | (0.828, 1.185) | 0.955 | (0.613, 1.485) | 1.329 * | (0.998, 1.768) | 1.068 | (0.841, 1.357) | 0.659 ** | (0.468, 0.928) |
| Logarithm of weekly working time × logarithm of annual wages | 1.001 | (0.798, 1.256) | 0.859 | (0.430, 1.718) | 1.096 | (0.787, 1.525) | 0.928 | (0.705, 1.220) | 2.100 * | (0.999, 4.413) |
| Logarithm of daily commute time × logarithm of weekly working time | 1.173 | (0.861, 1.598) | 1.299 | (0.585, 2.883) | 0.937 | (0.612, 1.436) | 0.867 | (0.553, 1.360) | 0.629 | (0.339, 1.167) |
| Number of individuals | 924 | 243 | 690 | 743 | 448 | |||||
| Number of cities | 75 | 49 | 71 | 63 | 67 | |||||
| Log likelihood | −1141.131 | −329.072 | −819.145 | −891.978 | −503.847 | |||||
| Chi-squared | 30.122 | 26.007 | 57.927 | 39.063 | 31.021 | |||||
Exponentiated coefficients; 95% confidence intervals in brackets. * p < 0.10, ** p < 0.05, *** p < 0.01.
© 2019 by the authors. Licensee MDPI, Basel, Switzerland. This article is an open access article distributed under the terms and conditions of the Creative Commons Attribution (CC BY) license (http://creativecommons.org/licenses/by/4.0/).
Share and Cite
MDPI and ACS Style
Li, X.; Chen, H.; Shi, Y.; Shi, F. Transportation Equity in China: Does Commuting Time Matter? Sustainability 2019, 11, 5884. https://doi.org/10.3390/su11215884
AMA Style
Li X, Chen H, Shi Y, Shi F. Transportation Equity in China: Does Commuting Time Matter? Sustainability. 2019; 11(21):5884. https://doi.org/10.3390/su11215884
Chicago/Turabian StyleLi, Xiaoyun, Hongsheng Chen, Yu Shi, and Feng Shi. 2019. "Transportation Equity in China: Does Commuting Time Matter?" Sustainability 11, no. 21: 5884. https://doi.org/10.3390/su11215884
Note that from the first issue of 2016, this journal uses article numbers instead of page numbers. See further details here.