Article

Analysis for Spatio-Temporal Variation Characteristics of Droughts in Different Climatic Regions of the Mongolian Plateau Based on SPEI

1
School of Environment, Northeast Normal University, Changchun 130024, China
2
Department of Land, Air and Water Resources, University of California, 1 Shields Avenue, Davis, CA 95616, USA
3
College of Geography, Inner Mongolia Normal University, Huhhot 010022, China
*
Author to whom correspondence should be addressed.
Sustainability 2019, 11(20), 5767; https://doi.org/10.3390/su11205767
Submission received: 1 July 2019 / Revised: 28 September 2019 / Accepted: 11 October 2019 / Published: 17 October 2019
(This article belongs to the Special Issue Watershed Processes under Changing Climate)

Abstract

:
Continuous climate warming in the last few decades has led to global climate anomalies, resulting in frequent drought events in arid/semiarid regions with fragile and sensitive ecological environment. The Mongolian Plateau (MP) is located at the mid-latitude arid/semiarid climate region, which is deemed as the most sensitive region in response to global climate change. In order to understand the spatiotemporal characteristics of droughts in Mongolian Plateau under changing climate, we divided the study area into three climatic regions via Köppen climate classification. Then, the seasonal and annual drought trends were analyzed by standardized precipitation evaporation index (SPEI), which is a function of monthly mean temperatures, highest temperatures, lowest temperatures and precipitations, collected from the 184 meteorological stations from 1980 to 2015. Mann–Kendall (MK) test was employed to detect if there is an abrupt change of annual drought, while the empirical orthogonal function method (EOF) was adopted to investigate the spatiotemporal characteristics of droughts across the Mongolian Plateau. Results from MK test illustrated that the SPEI-12 exhibited statistically significant downward trends (a < 0.05) for all three climatic regions of the Mongolian Plateau. EOF spatial analysis indicated that Region III experienced the most severe drought from 1980 to 2015. During the 35 years period, an abrupt change of drought was detected in 1999. Before year 1999, the climate was relatively humid. However, the entire region became more arid after year 1999, reflected by remarkably increased frequency and intensity of drought. SPEI-3 revealed the trend of drought at seasonal scale. We found that drought became more severe in spring, summer, and fall seasons for the entire MP. However, winter became more humid. Different climate regions exhibited quite different drought seasonality: Region I experienced a severe arid trend in summer and fall. For Region II and III, summer became more arid. All three regions became more humid in winter season, especially for Region I, with the Sen’s slope of 0.0241/a.

Graphical Abstract

1. Introduction

The trend of global warming has become evident. According to the Intergovernmental Panel on Climate Change(IPCC) Fifth Assessment Report, the global average temperature has risen by 0.85 °C since 1880, as exemplified by the period between 1983 and 2012—the warmest 30 years for the Northern Hemisphere in the past 1400 years [1]. Continuous climate warming leads to global climate anomalies, resulting in frequent extreme climate events or simply extreme events and various natural disasters [2,3]. Among them, the fragile ecological environment in arid/semiarid areas is most sensitive to human activities and climate change [4,5]. Under the influence of continuous temperature rise, the decrease of precipitation and the intensification of potential evaporation further aggravate the drought and expansion of arid/semiarid areas [6]. Some researchers pointed out that by the end of the 21st century, the global drought area will exceed half of the land area, accounting for 41% of the total land area [7]. Persistent aridity can easily turn into a drought which, as one of the most serious natural disasters in the world [8,9], is being affected by climate change more frequently, causing more serious damage [10,11]. Therefore, it is imperative to study the characteristics of meteorological drought.
The Mongolian Plateau is located in a typical arid/semiarid area [12], which has important impacts on the East Asia ecosystem. During the past 40 years, the average temperature of the Mongolian Plateau has risen more than the global average value, while the annual precipitation shows a trend of declining [13]. Less precipitation is not only the critical cause of meteorological drought, but also triggers other types of drought (e.g., hydrological drought and agricultural drought). The increased temperature leads to the increased evapotranspiration demand, and exacerbates drought intensity and its negative impact. Drought may cause insufficient soil moisture, hindering the growth of plants, frequent sandstorms, and the destruction of the ecological environment, such as continuous desertification of grassland. In addition, the main economic income of farmers and herders in the Mongolian Plateau is highly dependent on animal husbandry, especially in the Mongolian People’s Republic. The occurrence of drought will directly reduce the economic income of farmers and herders [14]. Therefore, drought and water shortage are the main bottlenecks restricting the ecological restoration and sustainable economic and social development of the Mongolian Plateau [15].
Considering the harmfulness of meteorological drought to the economy and ecology of the Mongolian Plateau, it has become particularly important to identify the spatiotemporal characteristics of droughts in the Mongolian Plateau and to understand the frequency and intensity of droughts. Many scholars in the past also studied the spatiotemporal characteristics of droughts in the Mongolian Plateau. However, those studies usually employed data with relatively coarse spatial resolution [16]; the analysis can only reflect the general occurrence of drought in the Mongolian Plateau or other larger regions, but did not detail the drought events inside the Mongolian Plateau. There were also several in situ studies on regional drought characteristics in the Mongolian Plateau [17,18,19,20,21]. However, the drought conditions of the entire Mongolian Plateau can hardly be represented only by in situ studies. The Mongolian Plateau spans over different climatic regions, covering areas with unique ecosystems (grassland, forest, desert, farmland, etc.).
Therefore, researchers assessing drought characteristics in the MP should subcategorize the entire study area based on climatic regions. Previous studies usually employed reanalysis data [22], forecast data, and remote sensing satellite data [23] to analyze drought [24]. Compared to those data sources, gauge-measured data are more accurate, which is more suitable to correctly reflect the intensity and frequency of droughts. Further, previous analysis mainly used Palmer Drought Severity Index(PDSI), Standardized Precipitation Index(SPI) [25,26] as drought index [10,18,27], only linking drought to the precipitation anomaly, but ignoring the evapotranspiration, which is a key bioclimatic variable of the Mongolian Plateau.
Considering the limitation of PDSI and SPI used in previous studies, we employed SPEI [28,29] in this paper to characterize drought in the MP. SPEI maintains PDSI’s advantage in reflecting temperature sensitivity. Moreover, it is suitable for multiscale and multispatial drought comparison like other indices, for example, SPI. We systematically analyzed the occurrence and distribution of droughts in different climatic regions from 1980 to 2015. In sum, this paper aims at: (1) analyzing the change of drought frequency and intensity in different climatic regions of the Mongolian Plateau by SPEI drought index, Sen’s slope and empirical orthogonal function (EOF); (2) exploring the dynamic spatiotemporal characteristics of droughts. Our research is very helpful for fully understanding the spatiotemporal characteristics of droughts in different climatic regions of the Mongolian Plateau over the past 36 years. Information from this research will facilitate the formulation of mitigation strategies against drought-induced water shortage problems, and therefore maintain the sustainable development of the ecological environment in the Mongolian Plateau.

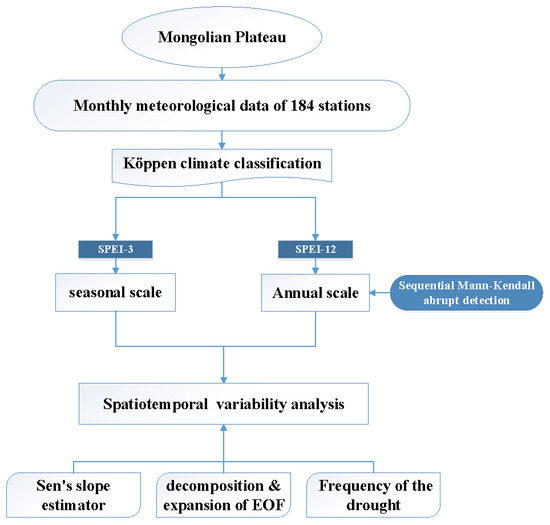
2. Materials and Methods

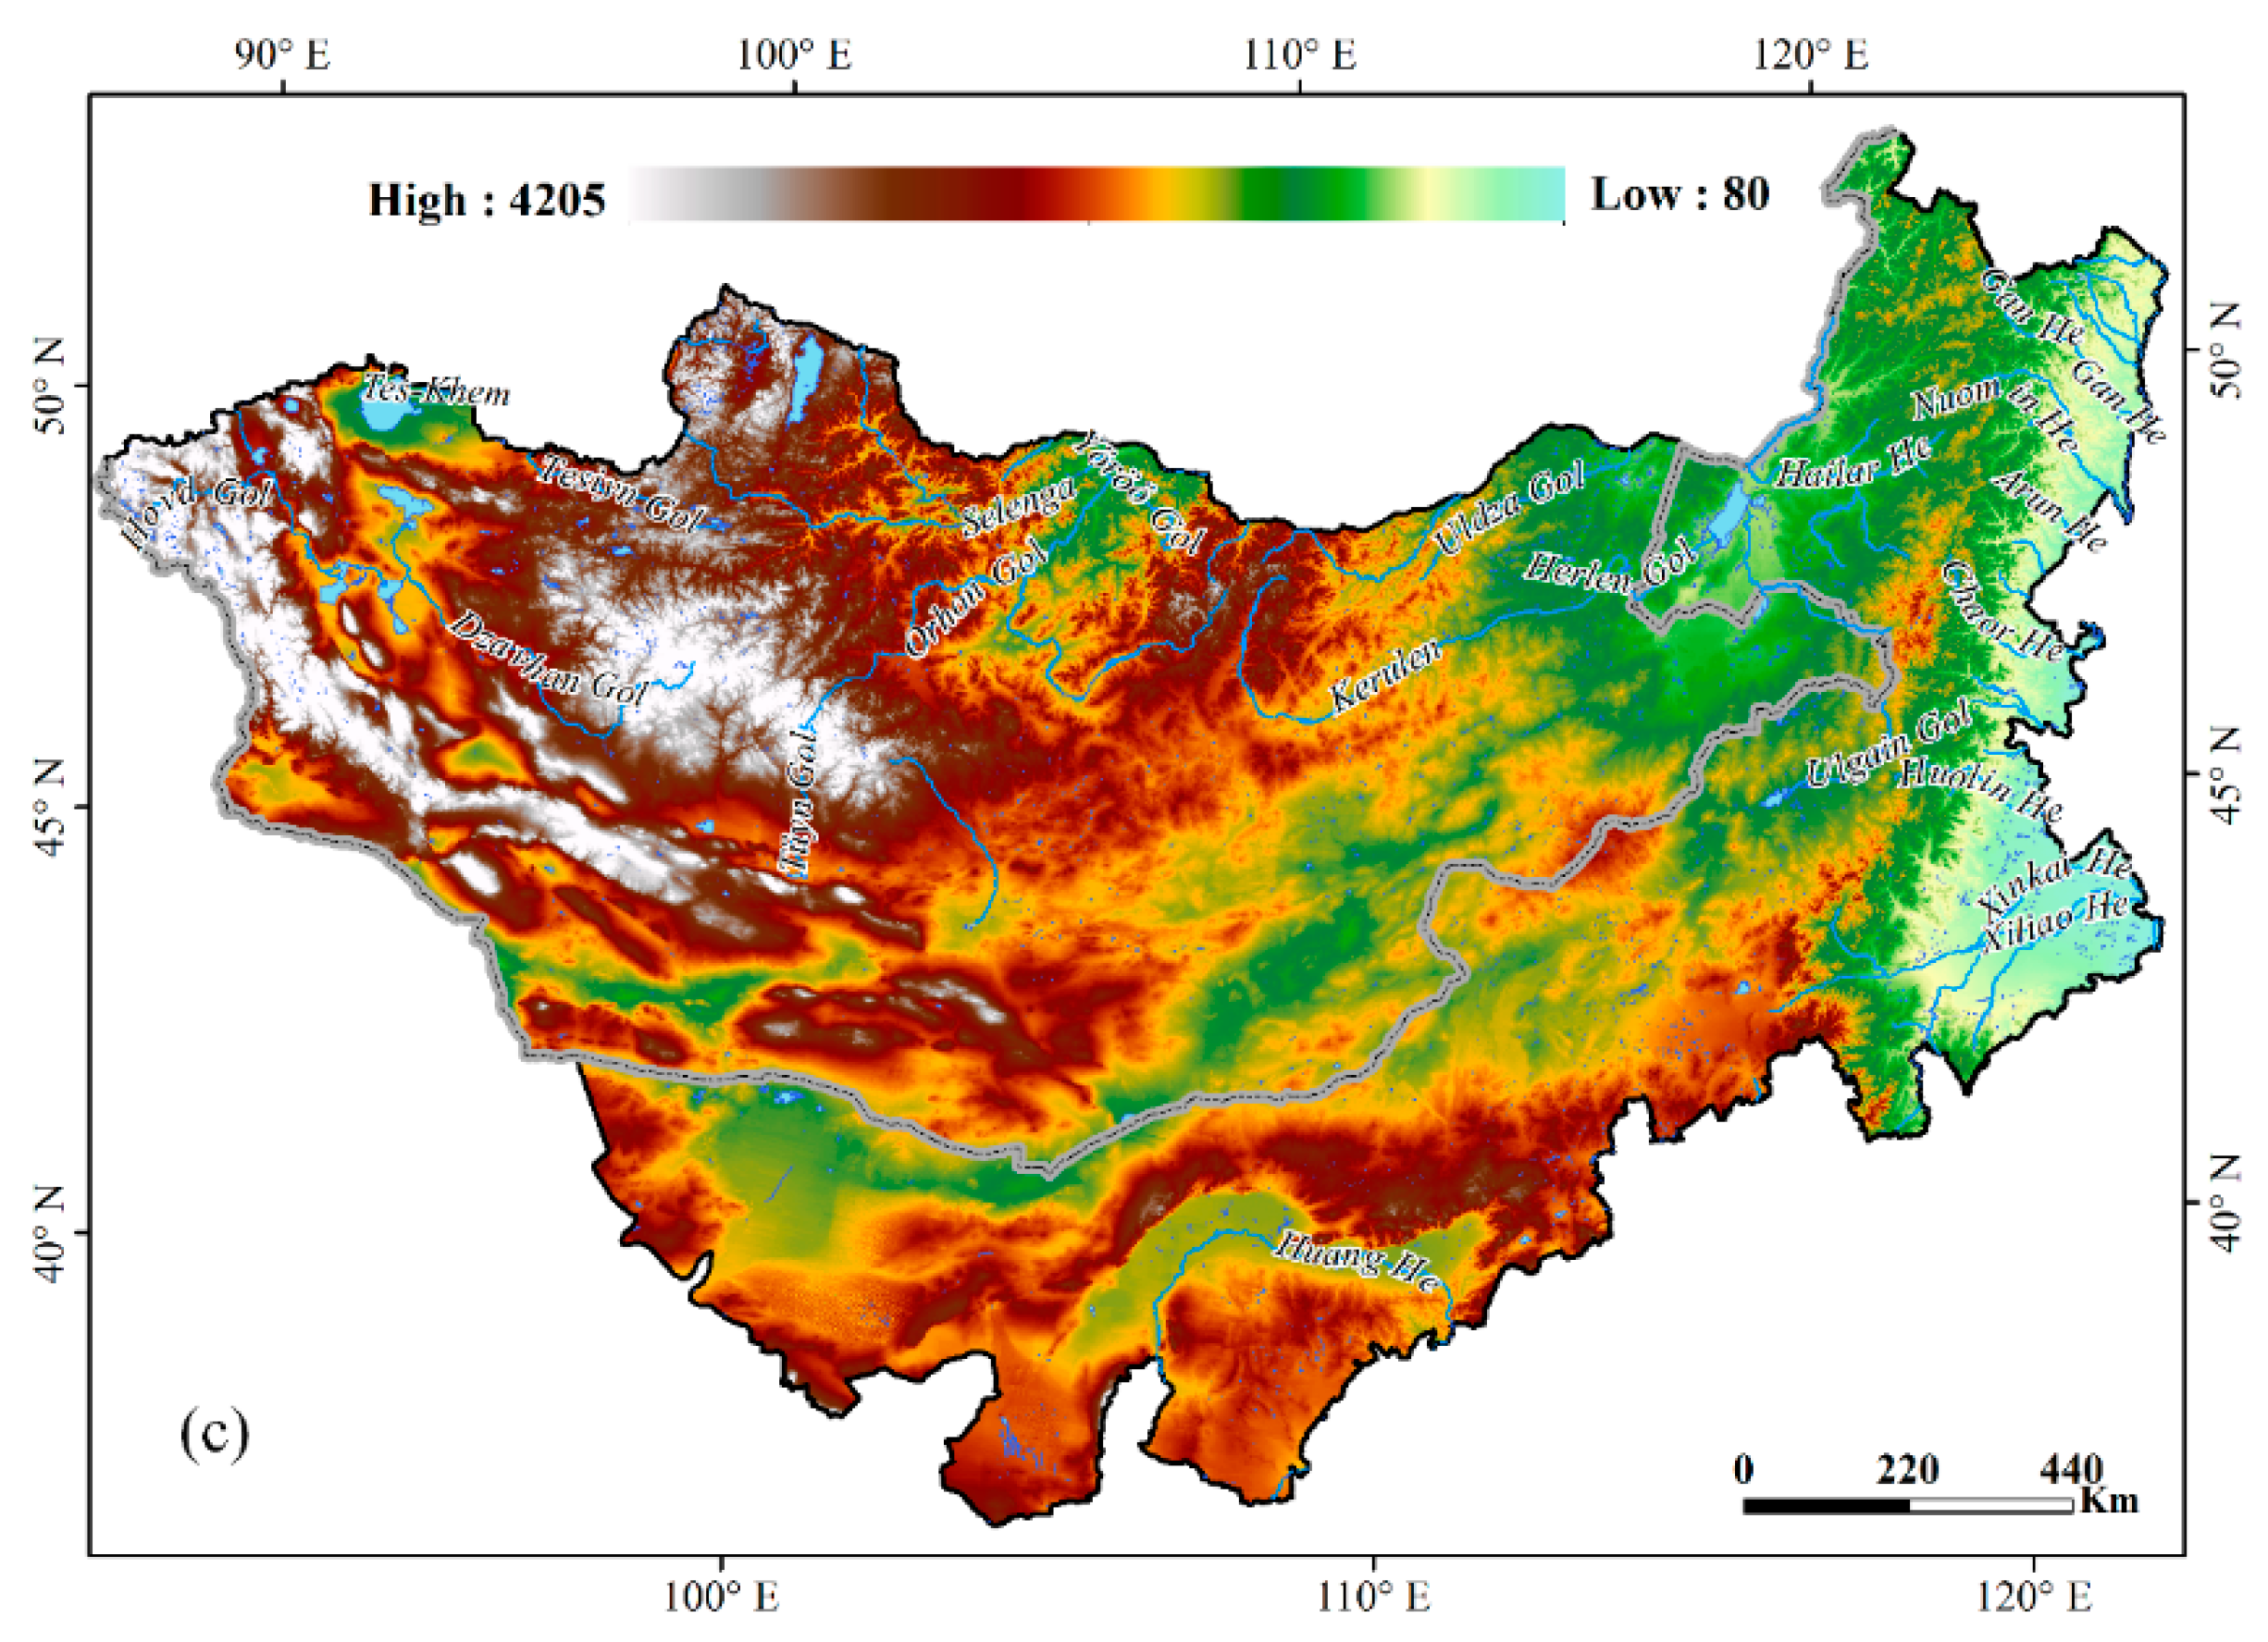
2.1. Description of Study Area

The Mongolian Plateau is located in the inland plateau of central Asia, with an average altitude of about 1580 m (Figure 1c). The Mongolian Plateau has the Greater Khingan Mountains as its east boundary, and the Altay Mountains as the west boundary. It has the boundary of the Yinshan Mountains in the South, and Sayan Mountains, Khentii Mountains, and Yablonov Range in the North. The Mongolian Plateau covers the full territory of the Mongolian People’s Republic, as well as southern Russia and part of northern China [2], which are all typical arid/semiarid areas. The study area selected in this paper is the main part of the Mongolian Plateau, covering the entire Mongolian People’s Republic and the Inner Mongolia Autonomous Region of China (87°43′~126°04′E and 37°22′~53°20′N), with an area of 260 × 104 km2 (Figure 1a).
In order to accurately analyze the droughts in different climatic regions of the study area, the Mongolian Plateau was divided into three climatic regions via Köppen climate classification—which were cold continental climate (Region I), cold semiarid climate (Region II) and cold desert climate (Region III), respectively, as shown in Figure 1b. Based on long-term climate records from 184 stations in the MP, annual average air temperatures for Regions I, II, and III are 1.22 °C, 3.87 °C, and 5.90 °C, respectively. The highest monthly temperatures were found in July for all three regions, which are 19.76 °C, 20.99 °C, and 23.21 °C, respectively, while the lowest monthly temperatures were all detected in January, which are −20.35 °C, −15.82 °C, and −13.54 °C. Köppen climate classification is a widely used climate classification system. It was proposed by the meteorologist Wladimir Köppen in 1884 and revised in 1980 to make it more precise for climate classification in mid-latitudes [29]. For our research, Region I was located in northeastern Inner Mongolia and northern Outer Mongolia, with forest and forest steppe as dominant land use. Region II was characterized by its typical steppe. Region III was mainly covered by desert steppe and Gobi desert [30,31,32].

2.2. Data Sources

Time-series climate information was extracted based on long-term records from 184 meteorological stations; 116 of them are located in Inner Mongolia, and 68 stations are located in Mongolia. The study area and locations of meteorological stations are shown in Figure 1. Monthly mean/maximum/minimum temperature, precipitation, air pressure, wind speed, relative humidity, and solar radiation data for 36 years (1980 to 2015) were obtained from the Mongolia National Meteorological and Environmental Monitoring Bureau and the National Meteorological Administration of China (http://data.cma.cn/).

2.3. Methodology

2.3.1. Standardized Precipitation-Evapotranspiration Index (SPEI)

SPEI index [29,33] was computed by calculating the difference between precipitation and potential evapotranspiration (Equations (1)–(7)). Detailed steps for calculating SPEI are shown as follows:
(1)
Calculate the potential evapotranspiration PET by the Penman–Monteith model:
P E T i = 0.408 Δ ( R n G ) + γ 900 T + 273 U 2 ( e a e d ) Δ + γ ( 1 + 0.34 U 2 )
where PET is the potential evapotranspiration (mm/d); R n is the Net irradiance ( M J   m 2 d 1 ), G is the heat flux density of soil ( M J   m 2 d 1 ) ; T is the average air temperature ( ); Δ is the slope of the temperature varying with the saturated water vapor pressure ( k P a / ) ;   γ is the Psychrometric constant ( k P a / ) ;   U 2 is the wind speed ( m / s ) 2 m above the ground;   e a is the saturated water vapor pressure (kPa) and e d is the actual water vapor pressure (kPa).
(2)
Calculate the water balance:
D i = P i ( P E T ) i
where P i is the precipitation (mm); and P E T is the potential evaporation (mm/d); D i is the difference between precipitation and evapotranspiration. according to the linear decreasing weight scheme, the cumulative water deficit series at different time scales are established.
D n k = i = 0 k 1 [ 2 ( i + 1 ) k ( k + 1 ) ( P n 1 ) P E T n 1 ] , n k
where k is time scale (monthly); n is number of the month.
(3)
The water balance is normalized into a log-logistic probability distribution to calculate the SPEI index series as follows:
f ( x ) = β α ( x γ α ) β 1 [ 1 + ( x γ α ) β ] 2
where α is the scale parameter, β is the shape parameter, and γ is the origin parameters, for D values in the range ( γ > D < ) .
β = 2 ω 1 ω 0 6 ω 1 ω 0 6 ω 2 , α = ( ω 0 2 ω 1 ) β Γ ( 1 + 1 / β ) Γ ( 1 1 / β ) , γ = ω 0 α Γ ( 1 + 1 / β ) Γ ( 1 1 / β )
Γ ( β ) is a Gamma function about β . Thereby, the cumulative function of probability density of D i is obtained.
F ( x ) = [ 1 + ( α x y ) β ] 1
(4)
With F(x), the SPEI can easily be obtained as the standardized values of F(x).
S P E I = ω C 0 + C 1 ω + C 2 ω 2 1 + d 1 ω + d 2 ω 2 + d 3 ω 3  
where ω = 2 ln ( P ) for P 0.5 and P is the probability of exceeding a determined D value, P = 1 F ( x ) . If P > 0.5 , then P is replaced by 1 P and the sign of the resultant SPEI is reversed. The constants are C 0 = 2.515517 , C 1 = 0.802853 , C 2 = 0.010328 , d 1 = 1.432788 , d 2 = 0.189269 , d 3 = 0.001308 . In this paper, we used the SPEI package of R language to calculate SPEI-3 and SPEI-12. The drought severity was classified according to the SPEI, as shown in Table 1.

2.3.2. Trend Analyzed Method

The variation trend of long-term evapotranspiration in the Mongolian Plateau was analyzed by the MK (Mann–Kendall) method and Sen’s slope detection method.
(1)
Mann–Kendall (MK) test
The Mann–Kendall test sets the original time sequence as x1, x2, …, xn, n is the length of the time series and the MK method defines the statistic S as follows [34] (Equations (8)–(10)):
S = j = 1 n 1 k = j + 1 n S ( X k X j )
where
S ( X k X j ) = { + 1 ,     X k > X j 0 ,     X k = X j     1 ,     X k < X j
where, Xj and Xk are the corresponding measured values of j and k year, and k > j.
Z = { S 1 V ( S ) ,     S > 0 0 ,     S = 0     S 1 V ( S ) ,     S < 0
where Z is a normal distribution statistic and V(S) is the variance. At a given alpha confidence level, if |Z| ≥ Z1a/2, i.e., at the alpha confidence level, there is a significant up or down trend in the time-series data. |Z| ≥ 1.96 indicate that they passed the significance test with 95% confidence.
(2)
Sen’s Slope detection method
(3)
The Sen’s slope detection method can reduce or avoid the influence of data missing and abnormality on the statistical results [30,31,32]. The Sen slope formula is as follows (Equations (11) and (12)):
S i j = M [ X j X i j i ]
where Xi and Xj are the sequence values at the i-th and j-th, respectively, 1 < i < j < n, and n is the sequence length. The Sen’s slope is the median value of slope, determined by the parity of the total number of Sij determined by the sequence length n, where k is an integer related to the length of the sequence, N = n(n − 1)
S = { S k + 1   , N = 2 k + 1 S k + S k + 1 2 , N = 2 k  

2.3.3. Sequential Mann–Kendall Abrupt Detection Method

In this study, In order to analyze the trend of drought and obtain drought mutation points, the sequential Mann–Kendall test method was introduced [35]. The mutation test statistic is calculated as: the cumulative number of samples in which an order column mi (m1, m2, ..., mn) is constructed by X1, X2, ..., Xn, and mi is Xi > Xj (1 ≤ ji). Cumulative variable dk is defined as follows:
d k = i k m i ,   2 k N
The dk mean and variance are defined as follows:
E ( d k ) = k ( k 1 ) 4
V ( d k ) = k ( k 1 ) ( 2 k + 5 ) 72
Assuming the stochastic independence for the original time sequence, the statistical magnitude is defined as:
U F k = d k E ( d k ) V ( d k )
UFi is a statistic sequence calculated by time series X1, X2, ..., Xn. Arrange the time series Xi in reverse order, repeat the above calculation process and make
U B i = U F i ( i = n , n 1 , , 1 ) ,   U B 1 = 0
If the two sequences (UFi and UBi) have intersection points, which are within the significance level interval, the intersection points indicate a significant abrupt change.

2.3.4. Empirical orthogonal function (EOF)

The data matrix X m × n describing the meteorological field in the region is obtained by anomaly processing or standardized anomaly processing for the SPEI-12 value of each meteorological station [36]. Provided there are m stations, each of which has n sample values, and each sample value is expressed as: X i j , i = 1, 2, 3, ..., m, j = 1, 2, ..., n:
X m × n =   [ x 11 x 1 n x m 1 x m n ]
The decomposition of empirical orthogonal function is to decompose X into a space function V and a time function Z:
X = V Z
where:
V = [ v 11 v 1 n v m 1 v m n ]   ,   Z = [ z 11 z 1 n z m 1 z m n ]
Steps of the decomposition are as follows:
(1) Based on the sample values, calculate
=   1 n X X T =   1 n   j = 1 1 ( x j x j T )
(2) Solve the eigenvalues and eigenvectors.
(3) The eigenvalues are λ1λ2 ≥ … ≥ λm, and the corresponding eigenvectors are v1v2 ≥ … ≥ vn, which form a matrix V = (v1, v2, …, vm), where V is a space function and each array represents a typical spatial field and is only related to space.
(4) Solve Z by Z = VTX, where Z is a time function and its value is uniquely determined by the typical spatial field V and the actual spatial field X. The time function Z is regarded as the weight coefficient of the typical field, and the element fields of different time are the results of linear superposition of several typical fields by different weights.
(5) X = VTZ is the final result of functional expansion.

3. Results

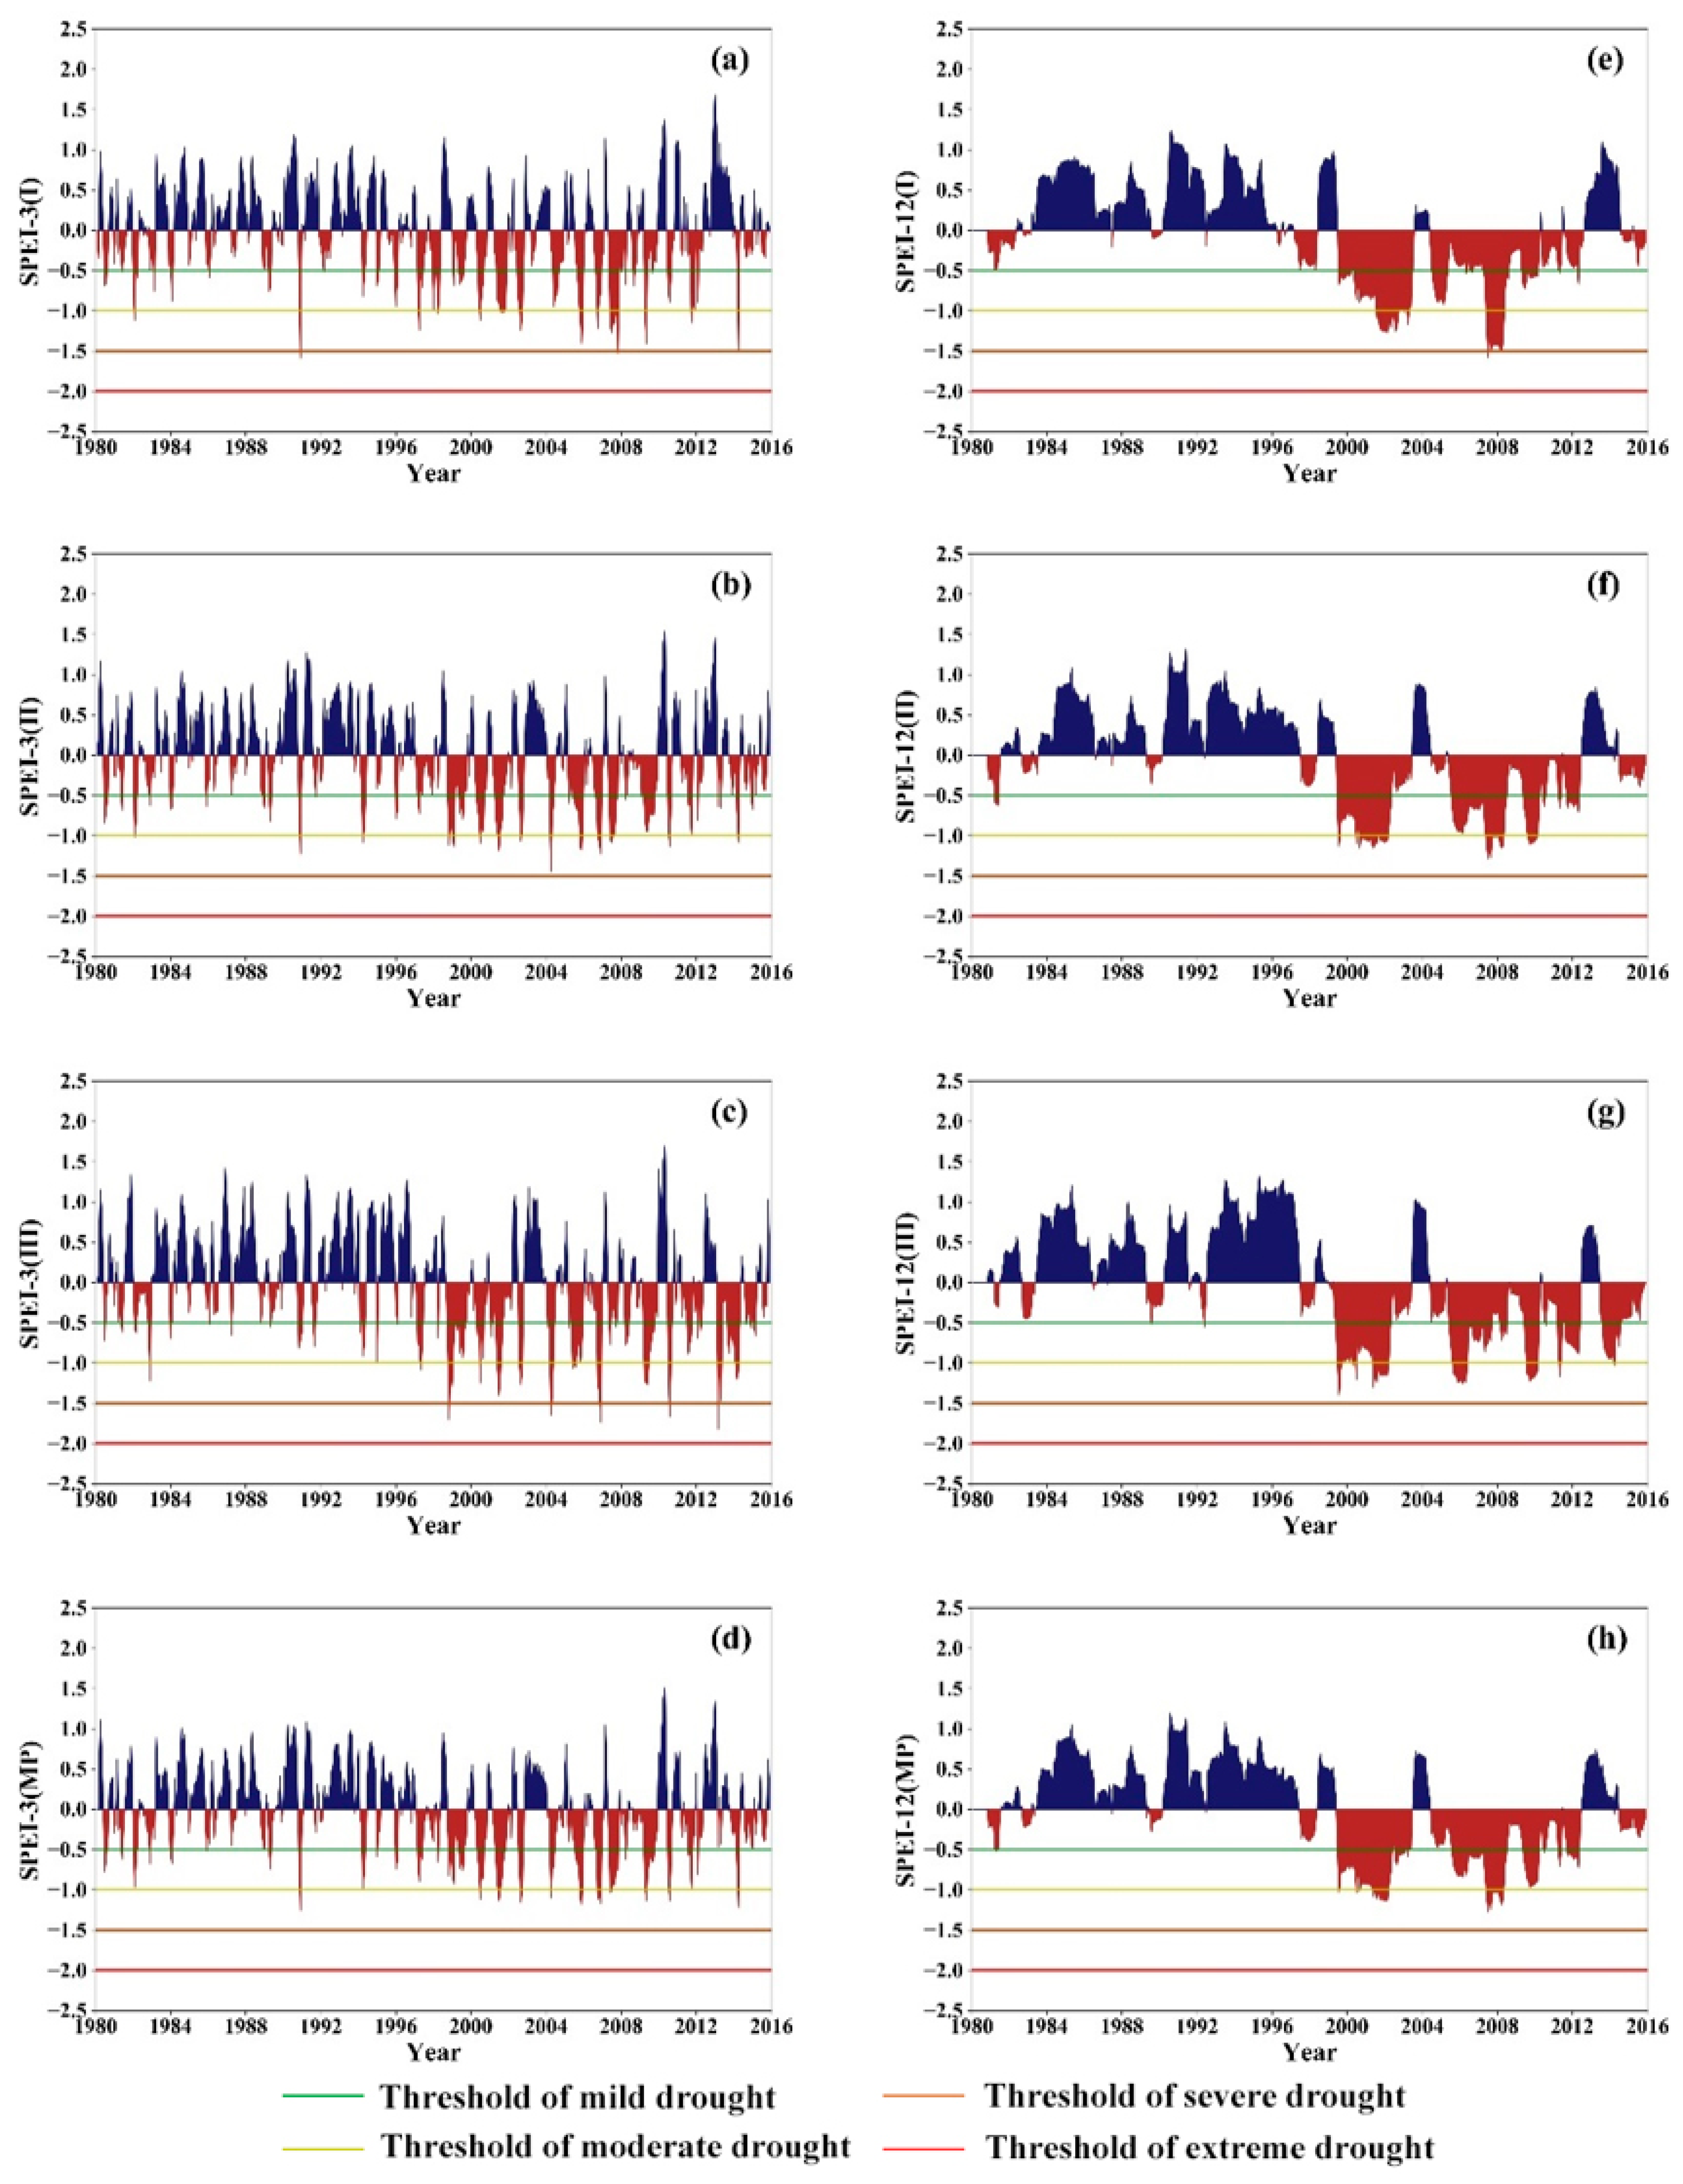
3.1. Identify Drought Period Within Different Climatic Regions of the Mongolian Plateau

The SPEI is able to characterize the alterations of wet and dry climates under different time scales. As the SPEI index is characterized by its time-sliding window, SPEI-3 and SPEI-12 indicate the seasonal drought variation and the annual drought variation, respectively. Considering the climatic characteristics of the Mongolian Plateau, four seasons were defined as follows: (Spring: March, April, May; Summer: June, July, August; Fall: September, October, November; Winter: December, January, February). The mean values of SPEI-3 and SPEI-12 in different climatic regions and the entire Mongolian Plateau were calculated by data measured at 184 meteorological stations from 1980 to 2015, so that the drought/wet period within time could be identified.
As shown in Figure 2, the pattern of SPEI-3 (short time scale) indicated more variability, which is sensitive to short-term precipitation and temperature alternation. Therefore, it was more responsive to seasonal variation of dryness and wetness. SPEI-12, on the other hand, is not responsive to short-term precipitation and temperature changes, but clearly reflects the long-term drought features.
It is apparent that from the seasonal scale SPEI-3 on the left of Figure 2, by the times of SPEI values reaching severe drought (–1.5 < SPEI-3), regions were ranked as III > I > II > MP. The four right charts in Figure 2 reveal an obvious regularity: since the beginning of the 21st century, the frequency and intensity of droughts have increased significantly both in the three climatic regions and throughout the Mongolian Plateau, with longer duration of droughts and slower dry–wet alternations. The study area basically presents a change mainly characterized by drought. In particular, continuous severe drought occurred in Region I around 2008, reflected by its SPEI-12 value, which is close to −1.5.
The sensitivity of SPEI values at different time scales in the Mongolian Plateau generally varied with time. The smaller the time scale, the more frequent the dry–wet alternation, and the more obvious the fluctuation of SPEI values between positive and negative signs. On the contrary, the larger the time scale, the slower the dry–wet alternation.

3.2. Temporal Variability of Droughts

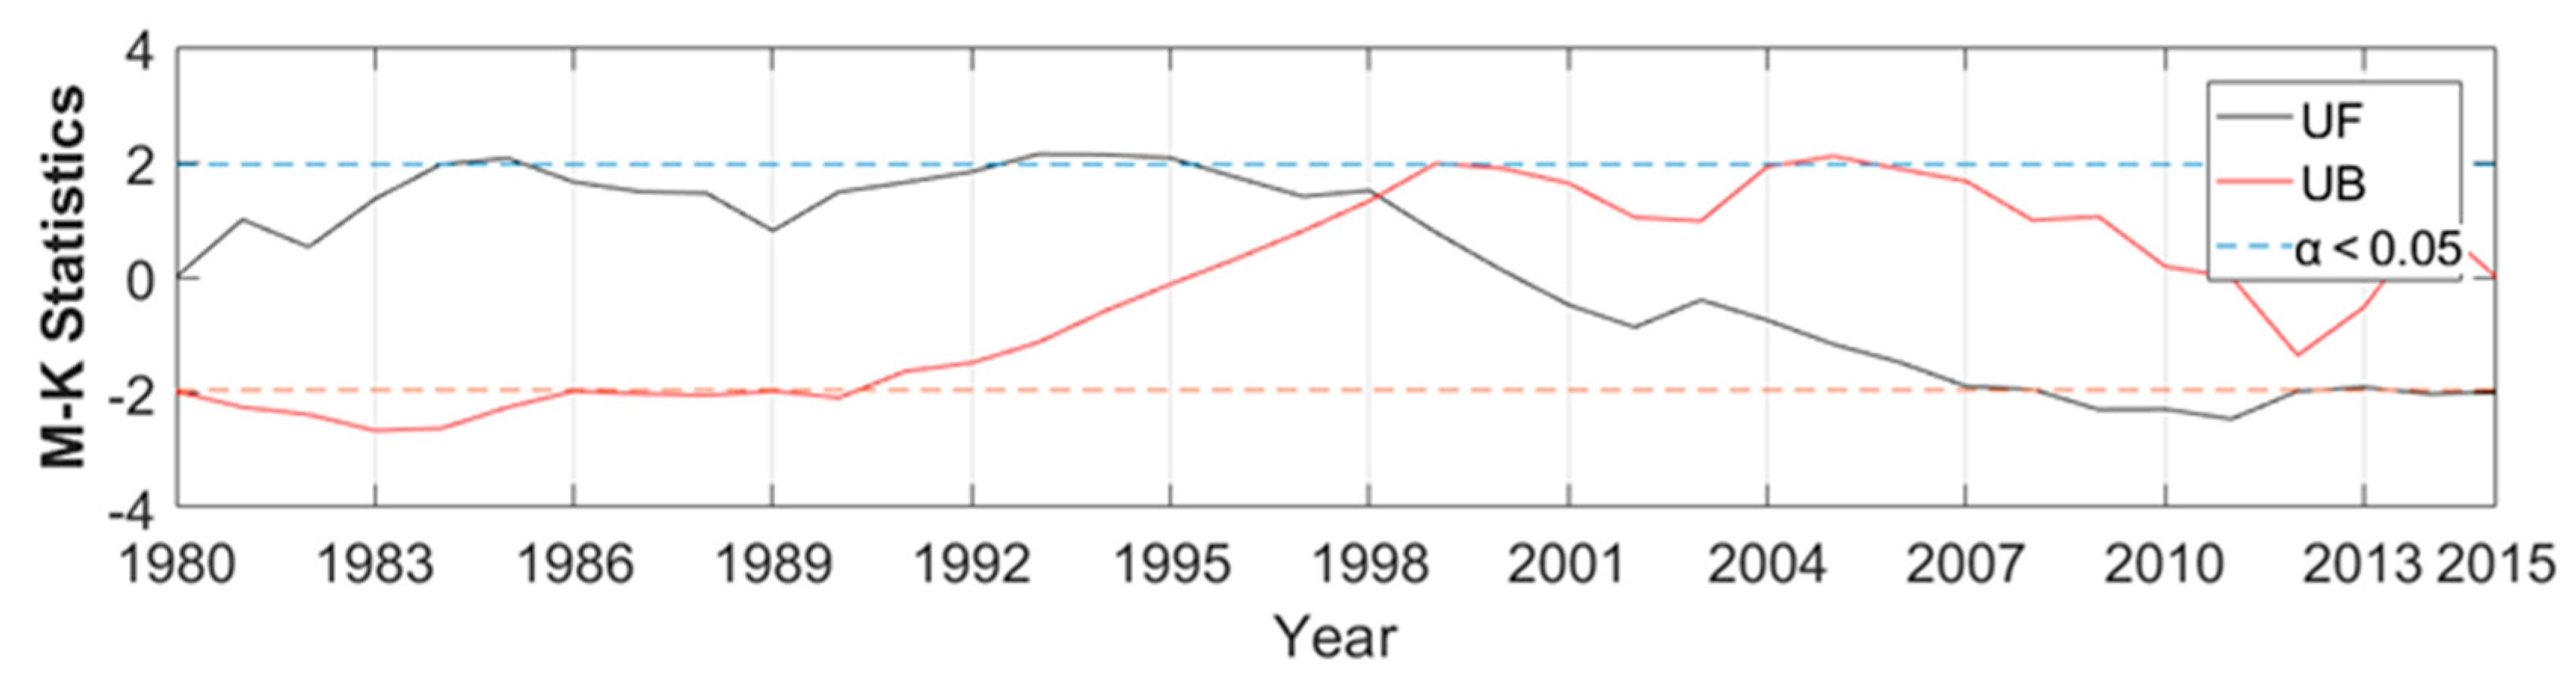
3.2.1. M–K Abrupt Change Analysis Based on SPEI-12 and Slope Analysis Before and After Abrupt Change

The M–K test is conducted on SPEI-12 values from 1980 to 2015 to identify the point of transition from wetness to dryness. Figure 3 exhibits the UF curve (grey line) and UB curve (red line). The curves have an intersection at year 1998, with M–K statistics quite close to 1.96 (blue dash line), indicating significant results within 95% confidence interval (a < 0.05). Year 1998 is then identified as the turning point from wetness to dryness in Mongolian Plateau. This is also consistent with findings in Figure 2.
In order to further investigate the droughts in the Mongolian Plateau before and after the turning point, we computed Sen’s slope of SPEI-12 for the entire 35 years for all climate regions in the MP. The average SPEI-12 values before and after year 1998 were also summarized in Table 2.
Table 2 illustrates that the SPEI-12 of the three climatic regions and the entire MP experienced a significant decline from 1980 to 2015 (α < 0.05), indicating the transition from wet period to a more severe drought period. Compared to the slope of the entire study area (–0.0234/a), Region III exhibits the most drought trend, with SPEI-12 slope of –0.3071/10a. The trend of drought is also reflected by the mean values of SPEI-12 before and after the turning point, as the values were all positive before year 1998, but all negative values after that. Region III has the highest mean SPEI-12 value before 1998, but lowest mean SPEI-12 value after 1998, implying a more severe drought than other regions in the MP.

3.2.2. Seasonal Variability

Based on the ending month of four seasons in the MP, we employed February SPEI-3 (SPEI-3Feb) to demonstrate drought magnitude in winter. In the same way, SPEI-3May, SPEI-3Aug, and SPEI-3Nov are used to represent drought magnitude in spring, summer, and fall, respectively. We therefore computed the Sen’s slope based on all four seasons’ SPEI-3 for all climate stations, which demonstrates the seasonal drought trend across the MP, shown in Table 3.
SPEI-3 reflected the seasonal dry–wet alternation. Similar to Section 3.2.1, Sen’s slope was computed for the different seasons over the 35 years in all three climate regions in the Mongolian Plateau. We also list average SPEI-3 values for all four seasons before and after year 1998 in Table 3.
SPEI-3 values in spring exhibit a declining trend for all three climatic regions. Compared to the other two regions, Region III shows the most rapid declining trend, with the slope of –0.0247/a under 95% confidence level. Since Region III has the lowest vegetation coverage, once affected by drought, this region is prone to experience frequent sandstorms in spring due to its fragile ecological conditions. Liu [37] et al. also proved this by studying the features of frequency variation of sandstorms in Inner Mongolia. The frequency of sandstorms in central and western Inner Mongolia decreased in the 1980s and 1990s, but soared after 2000.
SPEI–3 values in summer indicates a significant declining trend for the entire Mongolian Plateau. This is especially true for Region III, which experiences the most significant change from wetness to dryness, with the slope of –0.0257/a. For areas in Region III with limited surface vegetation coverage, mitigating drought effect becomes more challenging in summer.
SPEI-3 values in fall also exhibit a declining trend for the entire Mongolian Plateau, especially for Region I. Compared to other regions, Region I has better vegetation, with meadow steppe and forest as the main land use types. The increasing drought trend may increase the frequency of grassland fires and forest fires in Region I, which is located in the Greater Khingan Mountains area. Our result is consistent with Fan [38] et al., who indicated a significant increase in forest fires in fall seasons since the mid-1990s in the Greater Khingan Mountains area.
SPEI-3 values in winter, however, exhibit an opposite trend for all three climatic regions. SPEI-3 in Region III shows a mild decline trend; however, for other climate regions, SPEI-3 shows an increasing trend, implying that Regions I and II become wetter in winter, especially for Region I (95% confidence level). The dominate land use in Regions I and II are typical pastoral areas; wetter winter usually indicates more snowfalls. Although the increase of snow amount has a positive impact on the reviving of vegetation in spring, it may also lead to snow disasters with too much winter precipitation.

3.3. Spatial Variability of Droughts

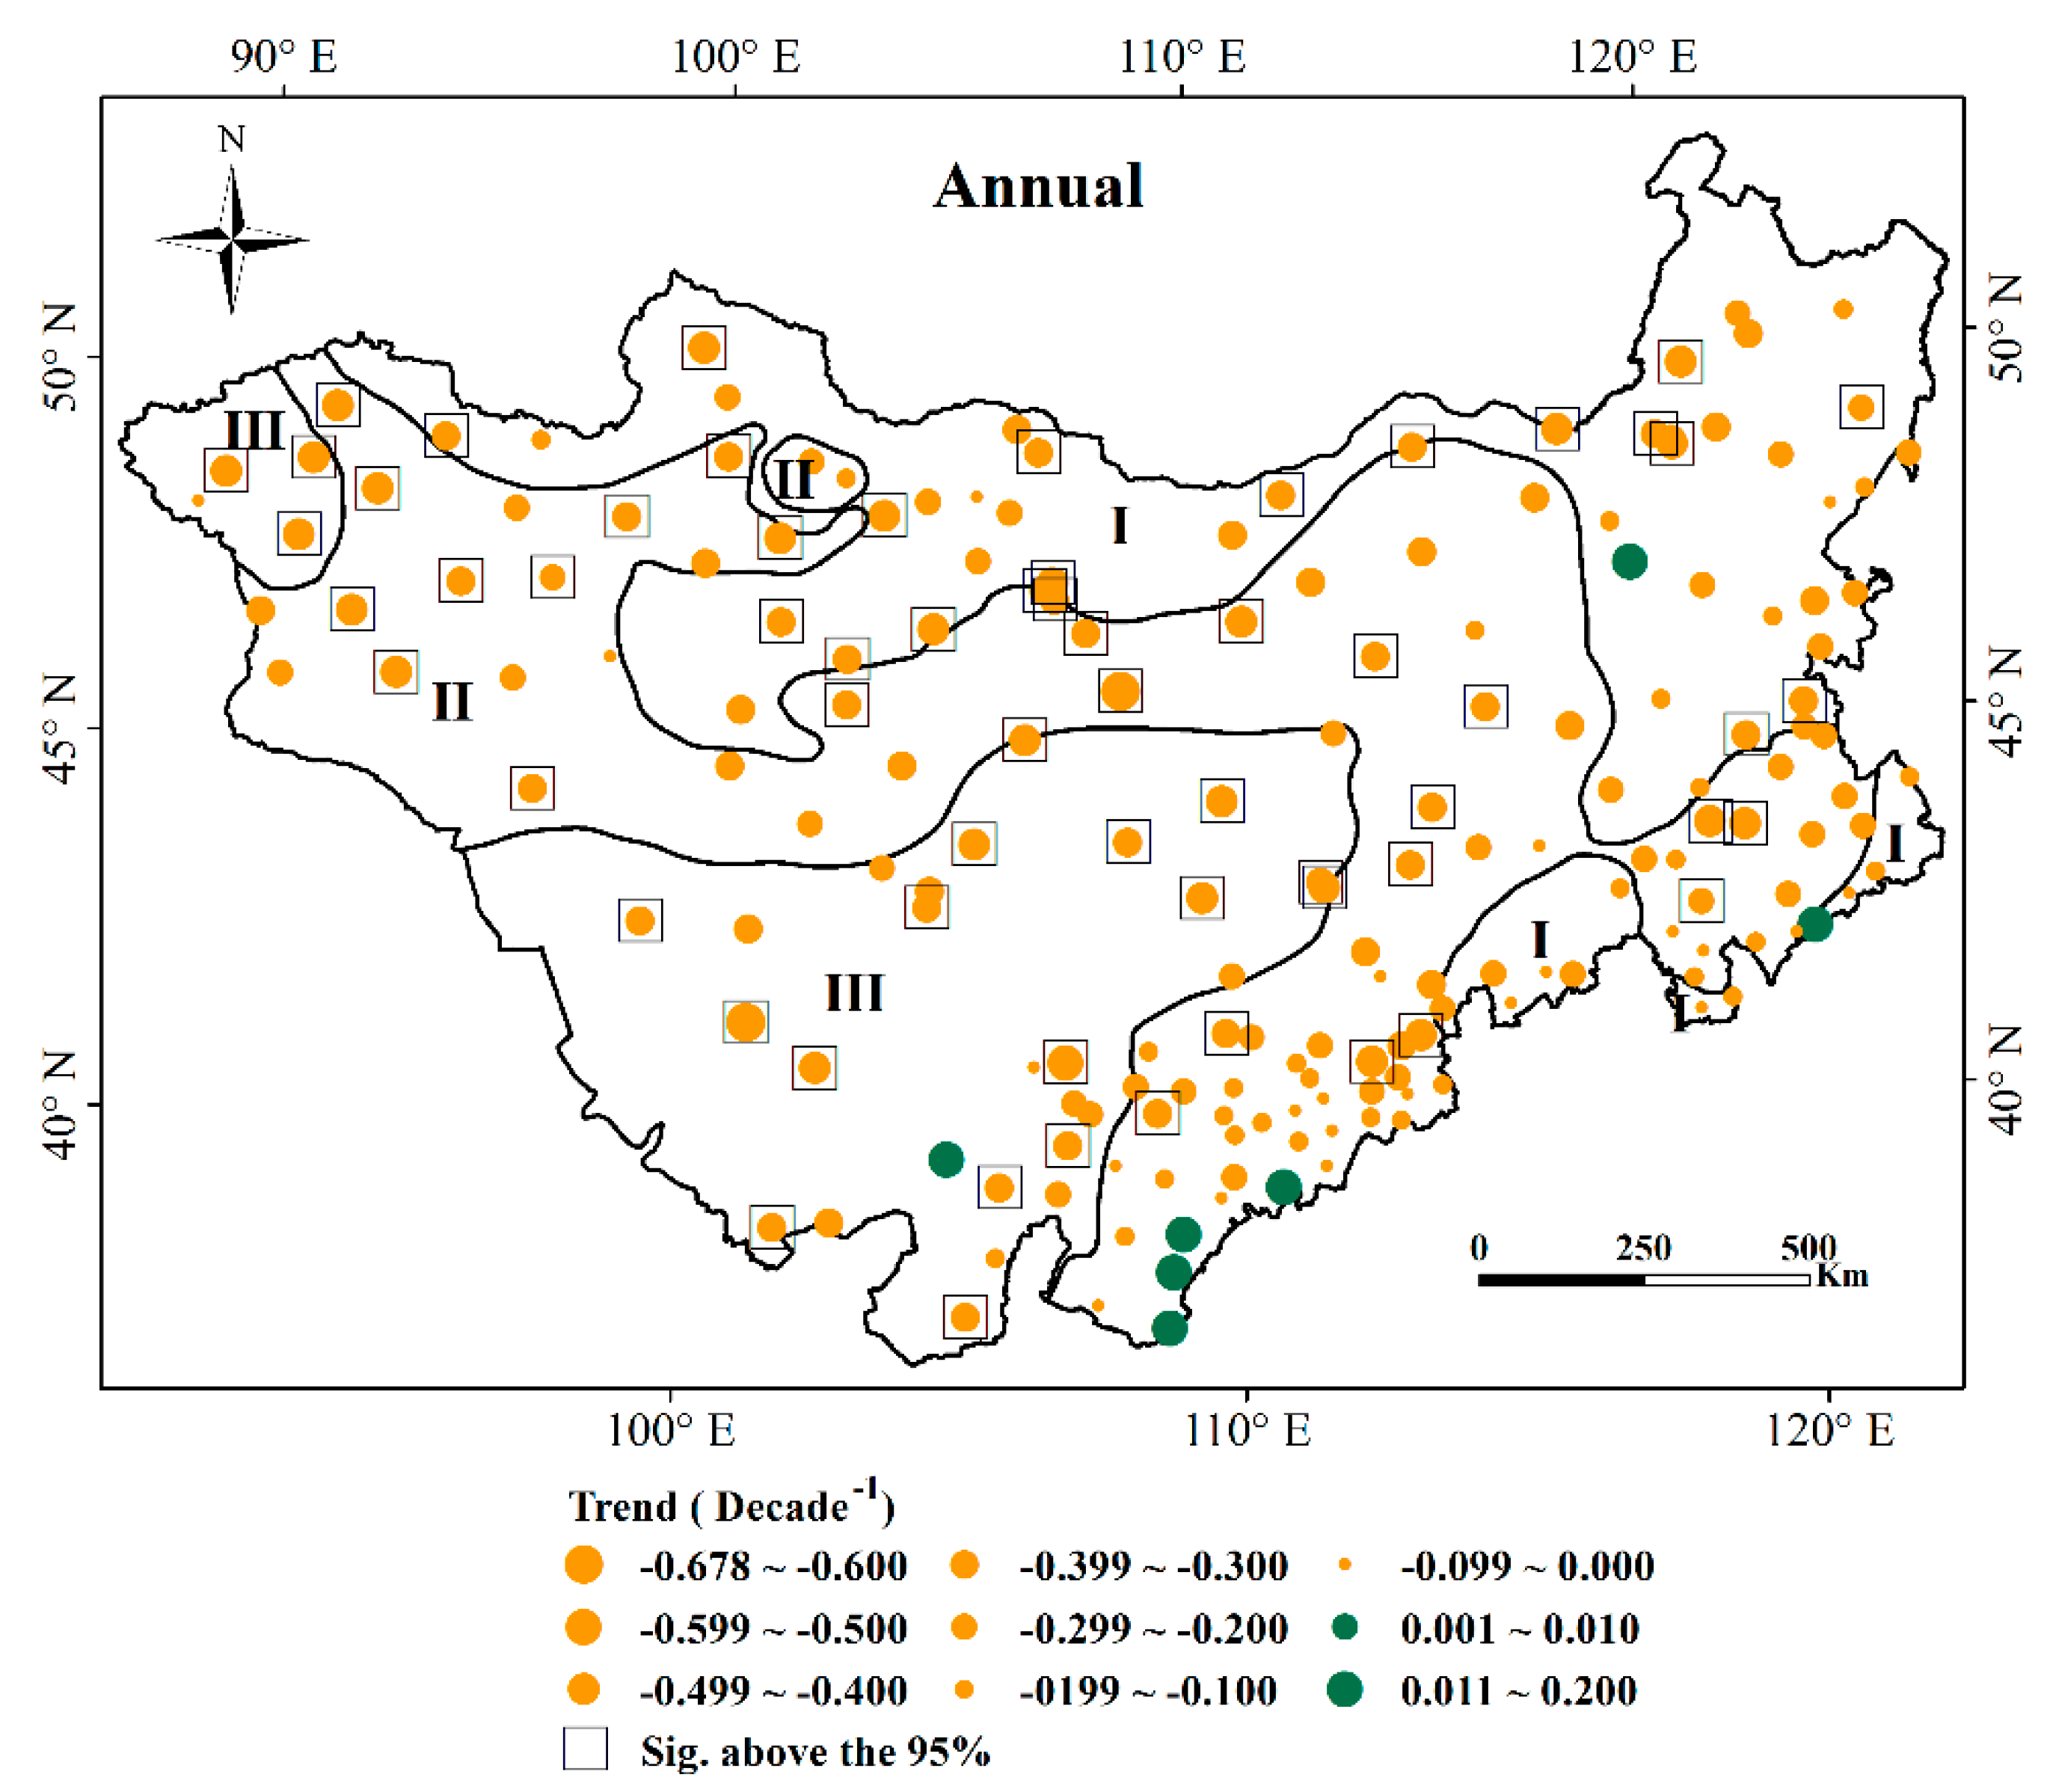
3.3.1. Annual Drought Trend Detected by SPEI Analysis

The December SPEI-12 values could be used to reflect the magnitude of drought for each year. If a downward trend was detected for long-term December SPEI-12 values, then it implies a trend of climatic drought. To better reflect the spatial pattern of drought in MP, we computed the Sen’s slope and confidence level based on December SPEI-12 time series for all climate stations (1980–2015). As shown in Figure 4, 177 of the 184 stations across the study area exhibit a downward trend in December SPEI-12. The downward trends in 63 stations are statistically significant (α < 0.05), with −0.678/10a as the most substantial decline. Although 7 stations reflect upward trends, the slope is marginal (0.011/10a and 0.02/10a) and not significant.
Note that 17 stations in Region I exhibited significant downward trends based on 35 years’ December SPEI-12 values (α < 0.05). Almost all of these stations (Figure 4) are located beyond the north of 44°N, with the trend values between –0.439/10a and –0.284/10a. For almost all other stations in Region I, which are located in the south of 44°N, their trends, either upward or downward, are not statistically significant.
Also, 27 stations in Region II showed significant downward trends (α < 0.05), with the slope values between −0.678/10a and −0.222/10a. These stations were basically located in the area north of 40°N. For Region II stations located in the south of 40°N, their slope values were generally higher than −0.3/10a, and are not statistically significant. In addition, four stations south of the Yellow River in Inner Mongolia reflected nonsignificant upward trends.
Only one station in southern Inner Mongolia in Region III showed an upward trend, but not significant (α < 0.05). However, all the other stations exhibited downward trends, 19 of which showed significant downward trends (α < 0.05), with slope values ranging from –0.615/10a to –0.3199/10a.

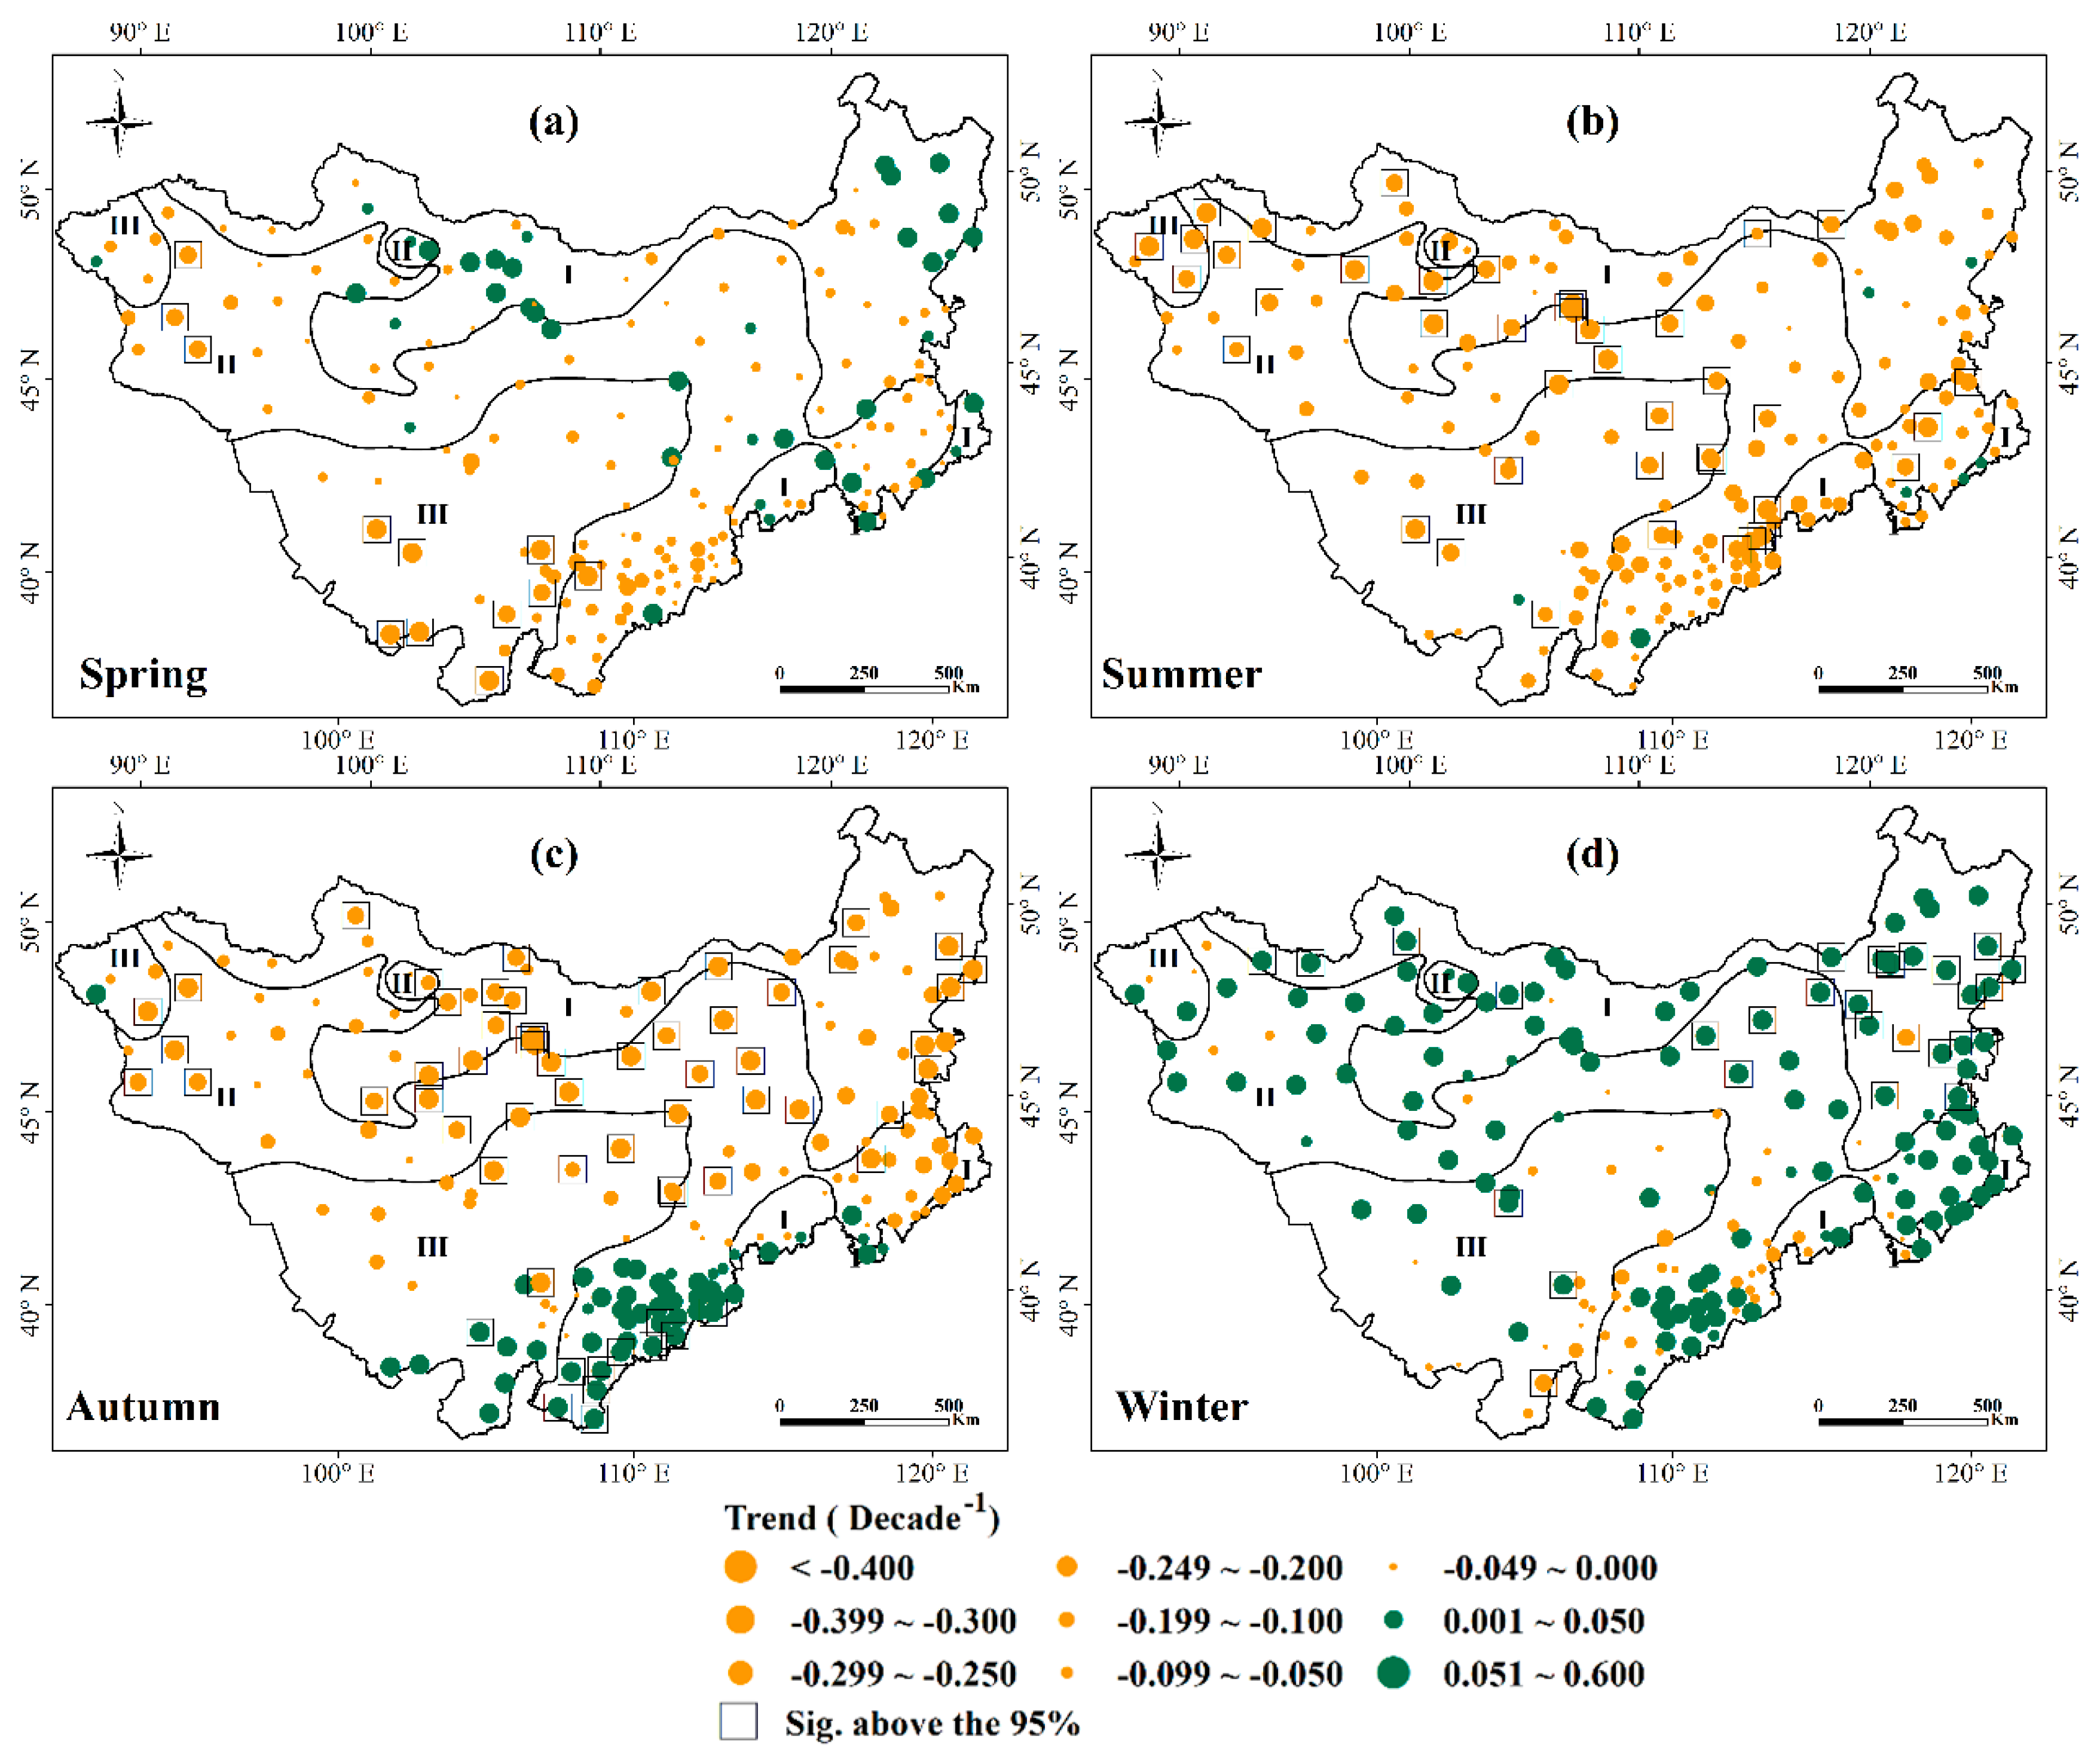
3.3.2. Seasonal Trend of SPEI in Different Climatic Regions

Based on the ending month of four seasons in MP, we employed February SPEI-3 (SPEI-3Feb) to demonstrate drought magnitude in winter. In the same way, SPEI-3May, SPEI-3Aug, and SPEI-3Nov were used to represent drought magnitude in spring, summer, and fall, respectively. Similar to Section 3.3.1, we therefore computed the Sen’s slope based on all four seasons’ SPEI-3 for all climate stations, which demonstrates the seasonal drought trend across the MP, shown in Figure 5.
Most stations indicated a drought trend in spring (Figure 5a). For example, most stations in Region III exhibited negative Sen’s slope. The downward trends are statistically significant (α < 0.05) for eight stations, located in Alashan and Ordos, which are typically ecologically fragile areas in Inner Mongolia.
Figure 5b indicates that summer seasonal SPEI-3 exhibits a downward trend for the entire Mongolian Plateau. This downward trend is statistically significant for most stations, except for several stations located in northeastern Inner Mongolia (Hulun Beir and Hinggan League) and the south of Yinshan Mountain. Compared to other seasons, summer season becomes more drier over the 35 years period.
Positive Sen’s slopes are found in southern Inner Mongolia, indicating a more humid trend during the fall season in the study area (Figure 5c). However, most other parts of the MP still exhibit severe drought trends, which is reflected by a statistically significant (a < 0.05) decreasing trend of SPEI-3Aug for 133 stations across all three climate regions.
Most stations displayed positive Sen’s slope for winter season (Figure 5d), especially for stations located in northeastern Inner Mongolia, eastern Mongolia and northwestern Mongolia, which are all statistically significant. Therefore, the entire MP became more humid in winter from 1980 to 2015.

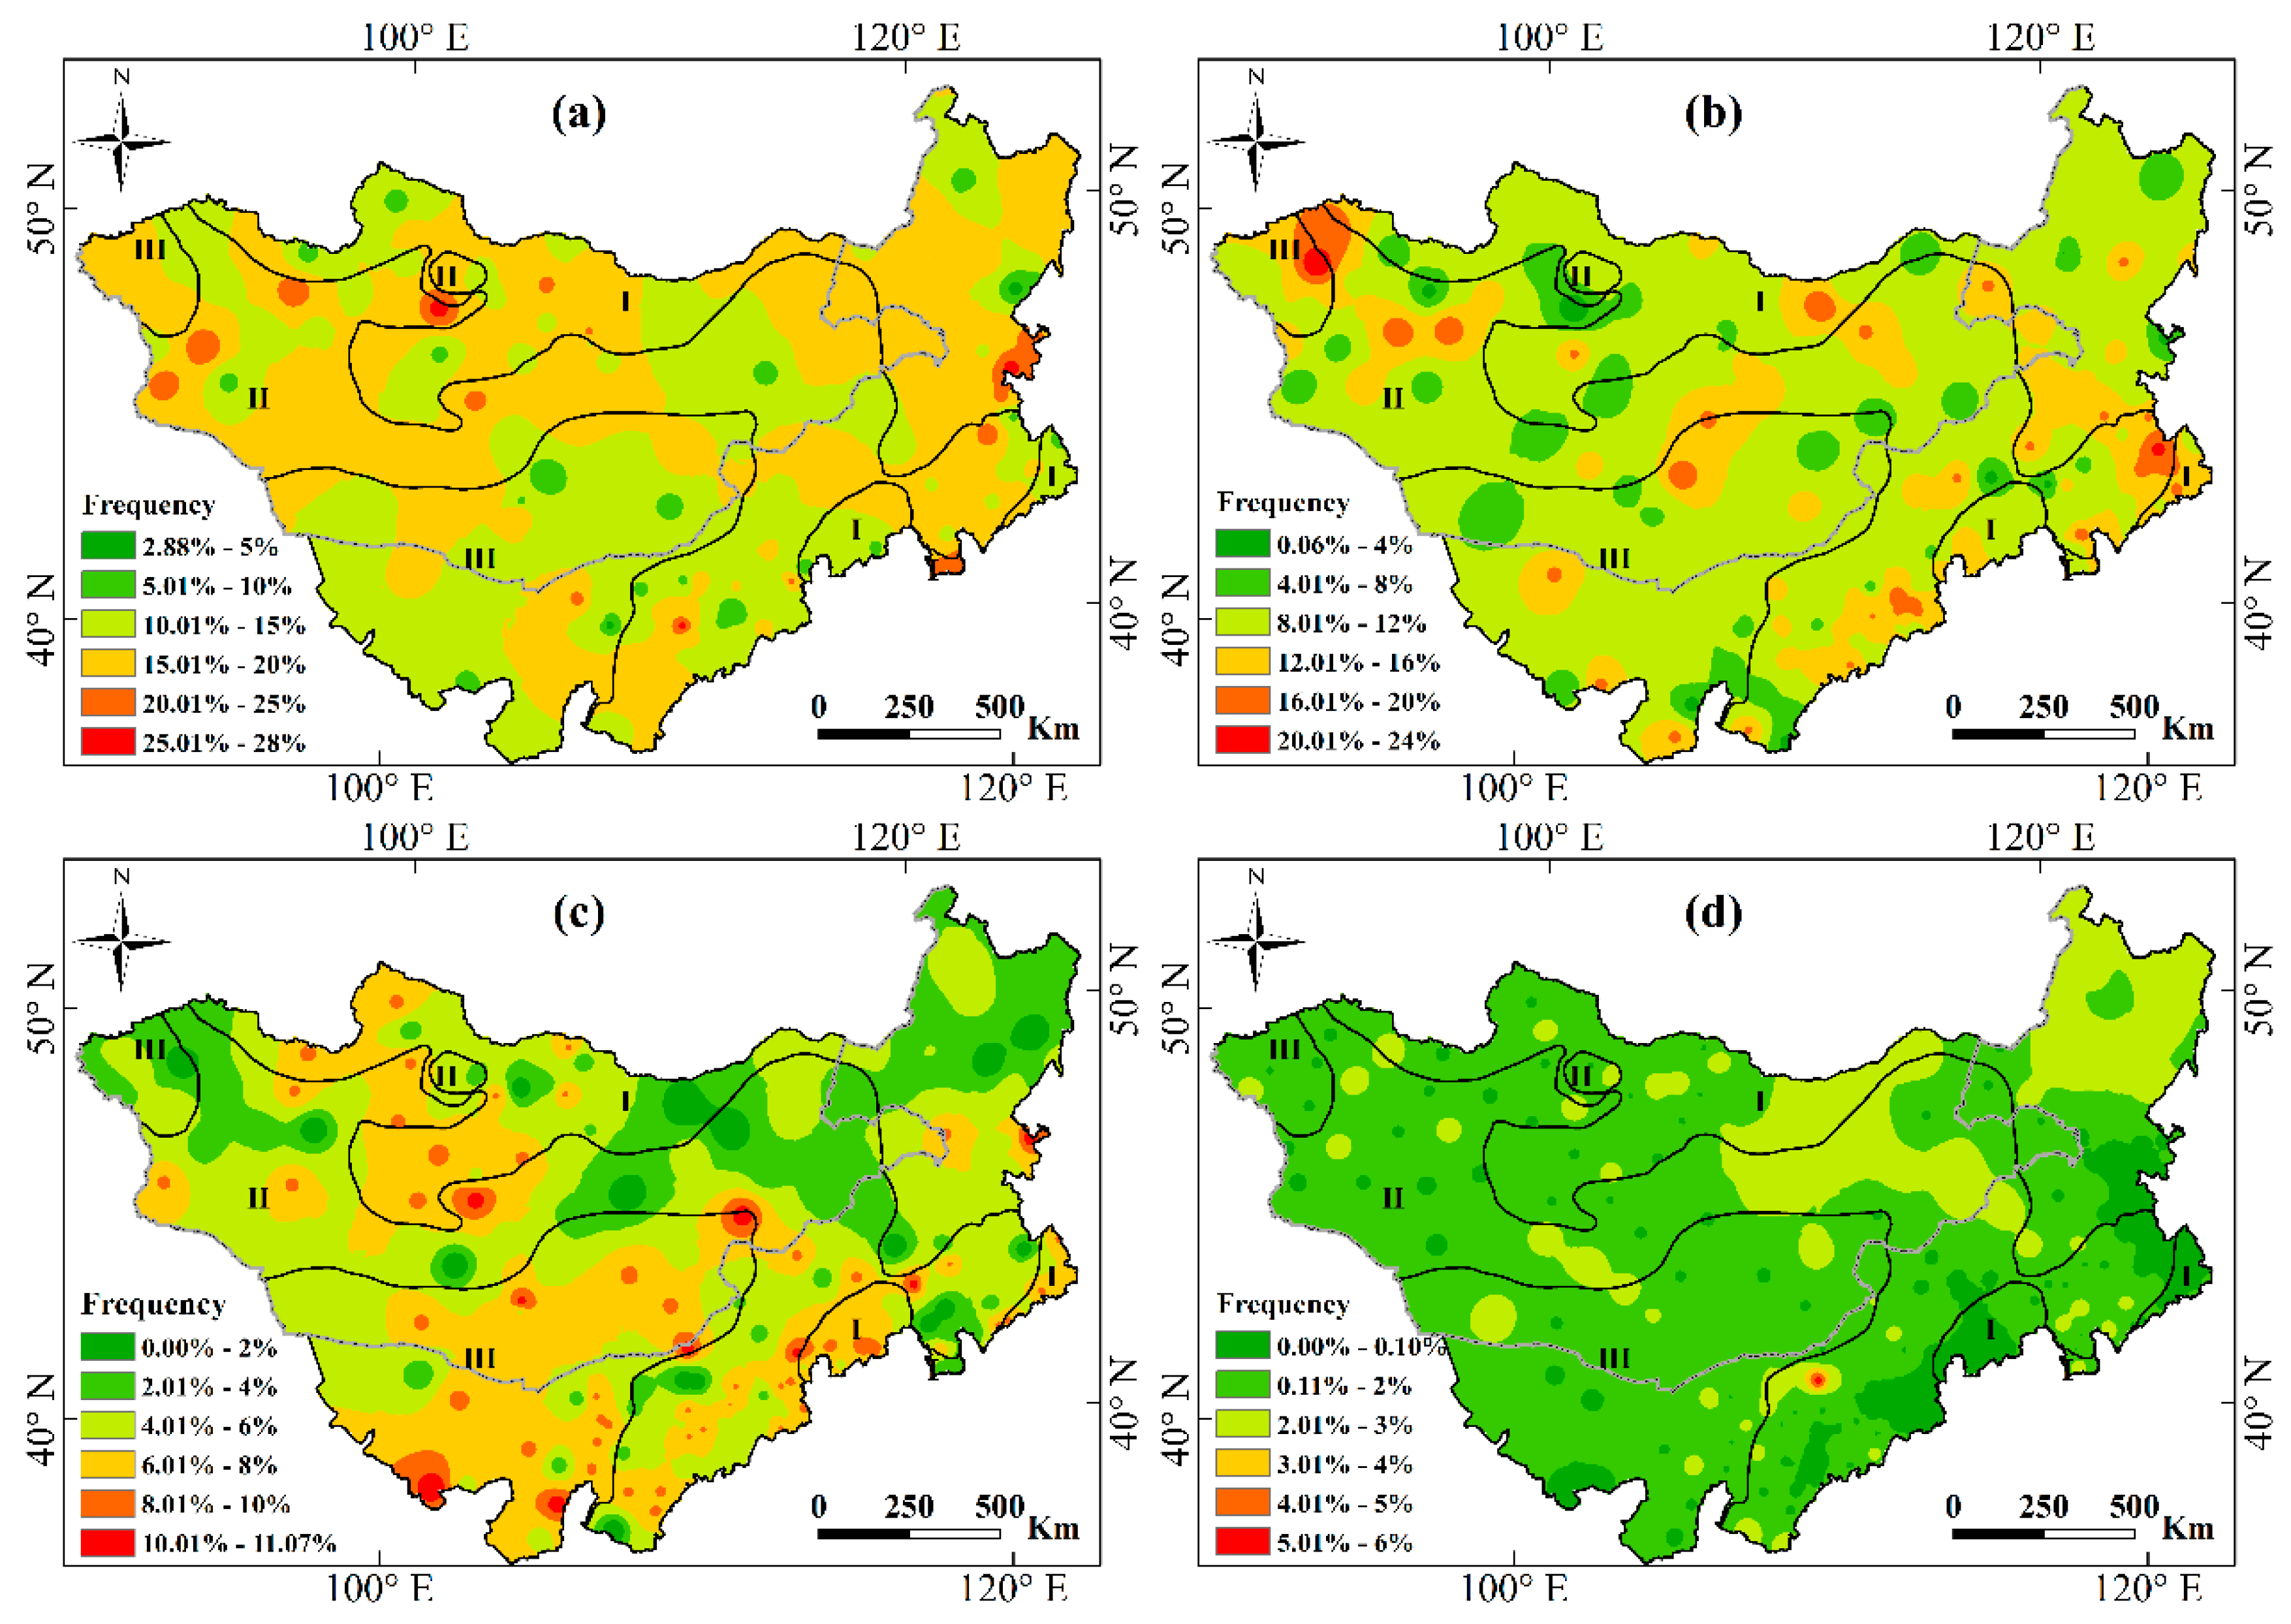
3.3.3. Spatial Distribution of the Drought Frequency Categorized by Relative Severity

Based on 35 years’ SPEI-12 time-series values of all 184 stations, the frequency for four drought severity classes (Table 1) is computed at the station level. Then, the inverse distance weighted interpolation (IDW) [39,40] approach is employed to spatially interpolate station values into the entire MP by the help of ArcGIS 10.3 (Figure 6a–d).
Figure 6 exhibits the spatial distribution pattern of drought frequencies at different severity classes. Mild level drought is the most common drought in the MP, with the frequency ranging from 2.88% to 28%, and above 10% for most areas. The highest frequencies of mild drought are detected in the southern and eastern parts of Region I and in the western part within Mongolia of Region II, with the frequency more than 20% (Figure 6a).
The distribution pattern of moderate droughts exhibits somewhat spatial complexity (Figure 6b). The magnitude of moderate drought frequency ranges from 0.06% to 20% for the entire MP. Higher frequency of moderate drought (12–24%) is found at the junction of the three climatic regions (northwestern Mongolian Plateau), as well as the junction of Regions I and II (southeastern Inner Mongolia).
Areas with higher frequency of severe drought (6–11%) were mainly located in southern Inner Mongolia and the western area of central Mongolia. For other areas, the frequency of severe drought is usually below 6% (Figure 6c).
Figure 6d indicated that the frequency of extreme droughts was relatively low (<6% for the entire study region). The frequency of extreme droughts in Region III was less than 2%. Areas with frequencies between 2% and 3% were primarily located in the northeast of Region I, as well as in the central part of Outer Mongolia. Only one station located in Inner Mongolia exhibits higher frequency (4–6%) when compared to other areas.

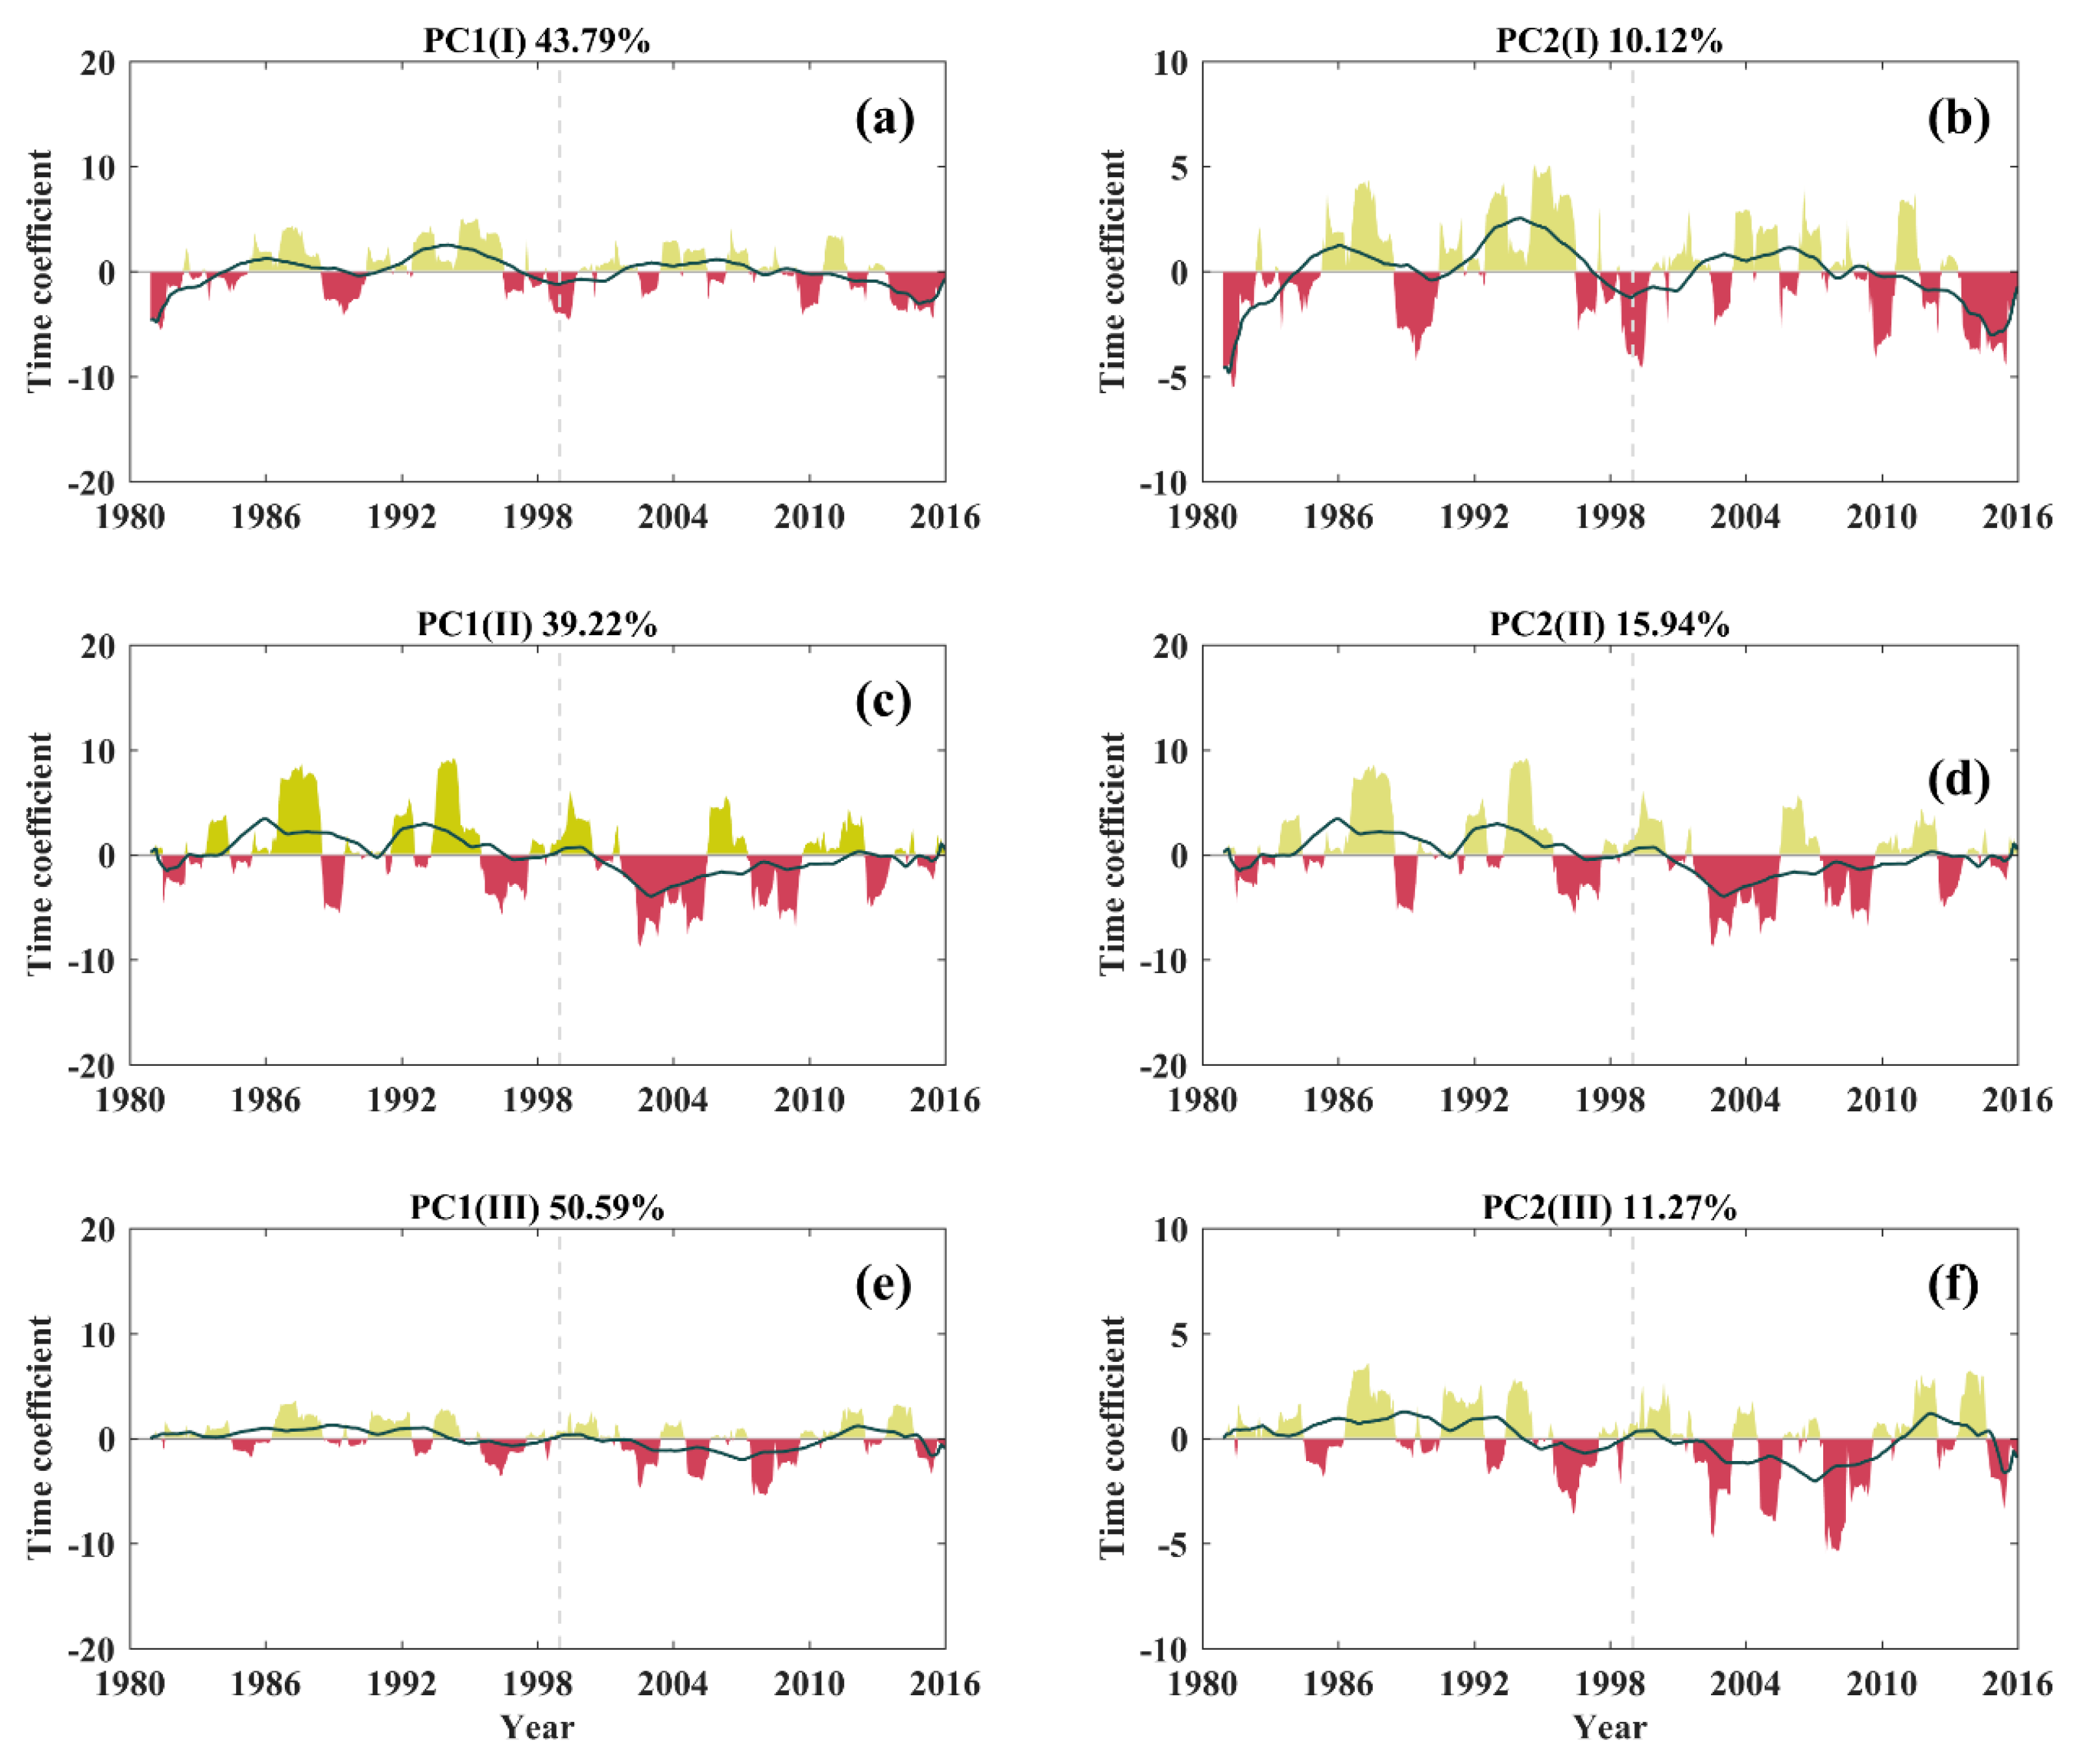
3.4. Spatial Distribution Characteristics of Droughts (Decomposition and Expansion of EOF)

In the research, to perform spatial analysis for the drought characteristics in different climatic regions of the Mongolian Plateau, the EOF is introduced into the study to calculate time coefficients (Figure 7) and characteristic variables (Figure 8). Table 4 demonstrates how much each mode contributes to the variance and the cumulative variance, and each of the first seven modes calculated in the three climatic regions contributes to the cumulative variance more than 75%. Among them, the contribution rates of the first and second eigenvalues of the three climatic regions are bigger. The contribution rates of Regions I, II, and III are 53.91%, 55.16%, and 61.86%, respectively. The first and second modes are the most important spatial anomaly modes, which can reflect the spatial variability distribution of droughts in each climatic region of the Mongolian Plateau. From the third mode, the contribution rate of the characteristics is relatively small, as they are not obvious.
The eigenvectors corresponding to the first two modes employ the inverse distance weighting (IDW) method to interpolate points into grid surfaces for spatial analysis (Figure 8). The left chart manifests that all values of the first eigenvector of the whole Mongolian Plateau are positive, indicating that the spatial distribution of drought variations in the Mongolian Plateau maintain consistency characteristic. However, the intensity of this variation varies in different climatic regions. The values of the first eigenvector of Region III are obviously larger than those of the other two regions, and it is the main control center of the first mode. The eigenvector values within Inner Mongolia in Region II, as well as western and eastern Mongolia, and southern Inner Mongolia in Region I were less than 0.12. The first mode had weak control over these areas in Region II. From the principal components (PCs) of the first mode shown on the left side of Figure 8, it can be seen that although there were dry–wet alternations in the three climatic regions from 1980 to 1998, the time coefficients generally fluctuated less among the negative values. Since 1998, most of the time coefficients in Regions II and III have been fluctuating among the negative values, indicating that Regions II and III were basically in a state of drought, with less precipitation and more drought events. From this, the first spatial mode actually reflects the average drought in the Mongolian Plateau.
The contribution rates of spatial characteristics of the second mode were only 10.12%, 15.94%, and 11.27% in Regions I, II, and III, respectively, which can be used as a reference for the spatial distribution of droughts in the Mongolian Plateau. The second spatial mode (EOF2) was quietly different from the first spatial mode (EOF1), and its variation rate ranged from −0.306285 to 0.232385. According to the spatial distribution of EOF2 (Figure 8b), northeastern Mongolia in Region I was all represented by negative values, proving that these areas were becoming wet, whereas the rest of the areas in Region I showed positive values, particularly in southeastern Inner Mongolia and northwestern Mongolia, where a drought control center with a positive value close to 0.2 had been formed. This center provided the widest and the most sensitive variation range of the drought index, which may cause drought anomalies. According to the time coefficients corresponding to the second mode (Figure 7b), the dry–wet alternation had been existing in Region I over the last 35 years, but it was relatively wetter in 1984–1997, and got drying after 2008.
The eigenvector values of Region II in southwestern Inner Mongolia were negative, which means that the second mode in this region had weak control over these areas, and the remaining larger areas showed eigenvector values greater than 0.1. The corresponding time coefficients reveal that (Figure 7d), after entering the 21st century, the region was basically in a state of drought.
It can be seen from the spatial mode of Region III (Figure 8b), that the characteristics of the areas within Inner Mongolia were just opposite to those within Mongolia. The border line was taken as the demarcation line, and the eigenvector values were all negative in Inner Mongolia, while they were all positive in Mongolia (basically above 0.15), thus forming a drought control center. It demonstrated that the drought in these areas had a large and highly sensitive variation range. The region within Mongolia was covered by the Gobi Desert in southern Mongolia, where drought easily led to sandstorms occurring. This was consistent with the study of sandstorms by Wei Hu [41] et al., who also believed that this region was the source of sandstorms in northern China. Generally speaking, based on EOF2, overall Mongolia got more seriously drier than in northeastern and western Inner Mongolia.

4. Discussion

4.1. Aridification Trend of the Mongolian Plateau under the Background of Climate Change

Previous studies have proved that sustained global warming is changing the distribution of water resources [42] and has a great impact on the regional hydrological cycles in many areas [43,44], which results in frequent natural disasters worldwide, and poses a serious threat to human society, the economy, and ecosystems. The trend of climate drought in the arid–semiarid regions of central Asia has been intensified significantly [45,46]. Since the region of the Mongolian Plateau is an arid–semiarid climatic region, we analyzed the aridification trend of the Mongolian Plateau by using SPEI-12. It can be found that the differences among climatic regions of the Mongolian Plateau in 1980–2015 were not obvious with global climate change. However, the meteorological drought across the entire Mongolian Plateau was aggravating with time, which is reflected by the abrupt change since 1999 (Figure 3). It is highly possible that the climate change in the Mongolian Plateau was a part of global climate change [26], and the trend was consistent with global climate change [47].

4.2. Drought Variations in Different Climatic Regions at the Seasonal Scale and Their Impacts

There was no obvious difference of drought trends among climatic regions on the annual scale, but more obvious on the seasonal scale. Not only was it reflected in the variation of drought trends, but also in the frequency and intensity of droughts. For Region III, the drought intensity increased significantly and drought with different grades occurred frequently in spring compared with the other two climatic regions. It meant that the fragile ecosystem of Region III was facing more severe challenges. It has been proved that one of the main reasons in recent years for frequent spring sandstorms in northern China was the sharp decline of vegetation coverage in spring [48].
There was little difference among the climatic regions in summer, when the whole Mongolian Plateau tended to be arid, especially since 1998, the summer droughts in the Mongolian Plateau had been exacerbating. Qin et al. believed that this was a result of global warming. Both Pacific decadal oscillation (PDO) [49] and Atlantic multi-decadal oscillation (AMO) [50] affect drought severity over the Mongolian Plateau by alternating the precipitation and temperature, reflected by changes of SPEI. Before 1999, PDO is the dominant factor. After year 1999, AMO is deemed more relevant to drought in MP, especially in summer [51], supported by a significant Pearson’s r in Table S1. Droughts in summer have an adverse impact on vegetation growth, especially in agricultural and pastoral areas, which are totally dependent on natural precipitation. Droughts result in less vegetation coverage and reduced crop and grass yield, which not only damages the ecological environment, but also directly affects the annual economic income of farmers and herdsmen.
The aridification trend in fall provided some interesting signs. The stations spatially spanning the three climatic regions (Figure 5c) in the southern Mongolian Plateau with low latitudes showed a humidification trend, whereas the other stations in the northern Mongolian Plateau basically demonstrated an aridification trend. The precipitation trends of these stations were analyzed. With the interannual variation of precipitation increase from 1980 to 2015 (Figure 9), it was possible that the wetting of these stations was significantly related to the Pacific decadal oscillation (PDO), and the anomalous pattern of large-scale atmospheric circulation. Some studies have manifested that the PDO has been in a negative phase since the 21st century. During this period, abnormal low pressure and cyclonic circulation appeared to the west of Lake Baikal, which caused a large-scale upward movement in the west of the East-Asia deep trough and the southward movement of moist air, prompting moist air and increased precipitation in the region in fall [24].
In winter, the overall performance of the Mongolian Plateau tended to be humid. The precipitation in the Mongolian Plateau mainly occurred in summer and fall, while the precipitation in winter was very little, below 5% of the annual precipitation [52]. According to the line chart of the mean precipitation in winter (December, January, and February of the next year) of all the stations in the Mongolian Plateau from 1980 to 2015, it could be seen that the mean precipitation in the winter after 1998 increased by approximately 0.7 mm compared with the previous mean precipitation (Figure 10). The weight of winter precipitation indicates an increasing trend based on historical records. Winter season accounted for 8.33% of the total annual precipitation for the period 1980–1999. This ratio was increased to 11.74% for the period 2000–2015, which is mainly caused by more frequent winter precipitation extremes in the MP [53]. It could be the main reason why the Mongolian Plateau became wetter in winter than before. Increased winter precipitation is deemed to relieve drought stresses at all levels. Before year 1999, mild drought was reflected by 18.54% of the stations. However, after year 1999, only 13.72% of the stations indicated the effect of mild drought. Similarly, moderate drought was detected by 14.79% and 10.87% of total stations before and after 1999. Reduced drought stresses after 1999 are also true for severe and extreme drought. One interesting point we would like to point out is year 2012. Although it is after 1999, drought was detected by 73.37% of the total stations (36.96% of them indicating moderate drought). Year 2012 was an extremely dry year based on precipitation comparison with other years after 1999. With the climate warming, the temperature of the Mongolian Plateau increases most obviously in winter [54]. However, due to the low temperature in winter, the precipitation still falls in the form of snow, and the increase of snowfall is likely to incur snow disasters [55].

5. Conclusions

The Mongolian Plateau was divided into three climatic regions via Köppen climate classification. The spatiotemporal characteristics of droughts in different climatic regions from 1980 to 2015 were analyzed by SPEI index. The conclusions are as follows:
(1) The three climatic regions of the Mongolian Plateau showed a clear drought trend after year 1998. The analysis for the drought characteristics throughout the Mongolian Plateau from 1980 to 2015 shows that 1998 was the abrupt change year of drought, which can be used as the demarcation line for the change of drought characteristics. The Mongolian Plateau was relatively humid before the abrupt change, while the three climatic regions of that area turned more arid after the abrupt change, and the frequency and intensity of drought have increased significantly.
(2) The cold desert climatic region has the largest variation slope in drought and is apparently serious in spring and summer. The drought trend analysis using SPEI-12 on an annual scale showed that the serious drought trend in three climatic regions was in the order of III > I > II, and the slopes of drought reached –0.03071/a, –0.0243/a, –0.0241/a with the confidence level above 95%, respectively. It demonstrates that the three climatic regions of the Mongolian Plateau were tending to be arid. Using SPEI-3 for analysis at the seasonal scale, we discovered that Region I suffered from a serious aridification trend in summer and fall, the drought trend in Region II is serious in summer, and the drought trend in Region III is serious in spring and summer. In winter, the three regions became more humid, especially in Region I, of which the slope reached 0.0241/a, with the confidence level above 95%.
(3) Spatially, the entire study area showed a drought trend in summer, while the southern part was more pronounced in fall, with multiple stations in three climatic regions showing a significant drought tendency. The aridification trend analysis was conducted via SPEI-12 at the annual scale, manifesting that the aridification trends of the stations within Mongolia in Regions I and II were slightly less serious, and the six humidified stations were all located within Inner Mongolia, particularly in the south of the Yellow River in Region II. The spatial seasonal analysis for droughts using SPEI-3 showed that northeastern and southern Inner Mongolia and the central and western areas of Mongolia in Region I were relatively humid in spring, but failed to reach the confidence level of 95%. There are more drought-intensified stations in Region II, but only three stations in Western Mongolia have a drought trend with the confidence level of 95%. All the stations in Region III showed a trend of drought. In summer, the whole Mongolian Plateau turned into an arid area. The area within Inner Mongolia, spanning the three climatic regions in the southern Mongolian Plateau, became more humid in fall. In winter, the whole Mongolian plateau entered into a wet state, except the relatively drought-prone areas in Regions II and III bordering Inner Mongolia.
(4) The higher frequency of mild and moderate drought is mainly in the northwest and east of the plateau, and the frequency of severe drought is higher in the climatic region III. The frequencies of mild droughts ranged between 2.88% and 28%. The frequencies of moderate droughts ranged among 8% and 12% in most areas and some areas even reached 24%. The frequency of severe droughts in Region III was apparently higher than the other two regions. The frequency of extreme droughts within northeastern Inner Mongolia in Region I and within central Mongolia in Regions II and III were relatively high, ranging between 2% and 3%, and the rest areas were basically below 2%.
(5) Two EOF models show significant spatial accumulation characteristics of drought in climate zone III and Mongolia. The EOF mode 1 showed that the whole Mongolian Plateau tended to be in a state of drought, but the intensity of drought varied distinctly among the climatic regions, especially the entire Region III which showed an obvious increasing trend in space, and northeastern Inner Mongolia in Region I may be faced with even severer droughts. The EOF model 2 reflected that the intensities’ variations among the climatic regions were nonobvious, but the aridification trend was generally strengthened in Mongolia, and the intensities’ variations of drought in northeastern and western Inner Mongolia were lower, which is opposite to other regions.

Supplementary Materials

The supplementary materials are available online at https://www.mdpi.com/2071-1050/11/20/5767/s1.

Author Contributions

Conceptualization, L.J., J.Z., and E.G.; methodology, Y.W., Y.B., and R.W.; software, L.J. and E.G.; validation, L.J. and M.Z.; formal analysis, R.W., E.G., and M.Z.; investigation, Y.W., L.J., and E.G.; resources, J.Z. and Y.B.; data curation, J.Z. and Y.W.; writing—original draft preparation, R.W. and L.J.; writing—review and editing, L.J., R.W., Y.W; visualization, L.J. and R.W.; supervision, J.Z. and M.Z.; project administration, J.Z.; funding acquisition, J.Z.

Funding

This study was financially supported by the National Natural Science Foundation of China (No.,41571491 and No.,41877520); China Special Fund for Meteorological Research in the Public Interest (Grant No.,2016006); The National Key Technology R&D Program of China under Grant (No. 2013BAK05B01).

Acknowledgments

We appreciate all constructive comments from three anonymous reviewers to improve paper quality.

Conflicts of Interest

The authors declare no conflict of interest.

References

  1. Pachauri, R.K.; Meyer, L. Climate Change 2014 Synthesis Report-Summary for Policymakers; Intergovernmental Panel on Climate Change (IPCC): Geneva, Switzerland, 2014. [Google Scholar]
  2. Cao, G.; Hou, P. Assessment of the ecological security based on the ecological carrying capacity. In Proceedings of the 2016 IEEE International Geoscience and Remote Sensing Symposium (IGARSS), Beijing, China, 10–15 July 2016; pp. 7285–7288. [Google Scholar]
  3. Wang, R.; Bowling, L.C.; Cherkauer, K.A.; Cibin, R.; Her, Y.; Chaubey, I. Biophysical and hydrological effects of future climate change including trends in CO2, in the St. Joseph River watershed, Eastern Corn Belt. Agric. Water Manag. 2016, 180, 280–296. [Google Scholar] [CrossRef]
  4. Huang, J.; Guan, X.; Ji, F. Enhanced cold-season warming in semi-arid regions. Atmos. Chem. Phys. 2012, 12, 5391–5398. [Google Scholar] [CrossRef] [Green Version]
  5. Rotenberg, E.; Yakir, D. Contribution of semi-arid forests to the climate system. Science 2010, 327, 451–454. [Google Scholar] [CrossRef] [PubMed]
  6. Li, Y.; Huang, J.; Ji, M.; Ran, J. Dryland expansion in northern China from 1948 to 2008. Adv. Atmos. Sci. 2015, 32, 870–876. [Google Scholar] [CrossRef]
  7. Huang, J.; Yu, H.; Guan, X.; Wang, G.; Guo, R. Accelerated dryland expansion under climate change. Nat. Clim. Chang. 2016, 6, 166–171. [Google Scholar] [CrossRef]
  8. Wilhite, D.A. Droughts: A Global Assessment; Routledge: Abingdon, UK, 2016. [Google Scholar]
  9. Wilhite, D.A.; Svoboda, M.D.; Hayes, M.J. Understanding the complex impacts of drought: A key to enhancing drought mitigation and preparedness. Water Resour. Manag. 2007, 21, 763–774. [Google Scholar] [CrossRef]
  10. Zarch, M.A.A.; Sivakumar, B.; Sharma, A. Droughts in a warming climate: A global assessment of Standardized precipitation index (SPI) and Reconnaissance drought index (RDI). J. Hydrol. 2015, 526, 183–195. [Google Scholar] [CrossRef]
  11. Council, A. AMS statement on meteorological drought. Bull. Am. Meteorol. Soc. 2004, 85, 771–773. [Google Scholar]
  12. Miao, L.; Fraser, R.; Sun, Z.; Sneath, D.; He, B.; Cui, X. Climate impact on vegetation and animal husbandry on the Mongolian plateau: A comparative analysis. Nat. Hazards 2016, 80, 727–739. [Google Scholar] [CrossRef]
  13. Bao, G.; Bao, Y.; Qin, Z.; Xin, X.; Bao, Y.; Bayarsaikan, S.; Zhou, Y.; Chuntai, B. Modeling net primary productivity of terrestrial ecosystems in the semi-arid climate of the Mongolian Plateau using LSWI-based CASA ecosystem model. Int. J. Appl. Earth Obs. 2016, 46, 84–93. [Google Scholar] [CrossRef]
  14. Dorjsuren, M.; Liou, Y.; Cheng, C. Time Series MODIS and in Situ Data Analysis for Mongolia Drought. Remote Sens. 2016, 8, 509. [Google Scholar] [CrossRef]
  15. Du, T.; Kang, S.; Sun, J.; Zhang, X.; Zhang, J. An improved water use efficiency of cereals under temporal and spatial deficit irrigation in north China. Agric. Water Manag. 2010, 97, 66–74. [Google Scholar] [CrossRef]
  16. Wang, Y.; Liu, G.; Guo, E. Spatial distribution and temporal variation of drought in Inner Mongolia during 1901–2014 using Standardized Precipitation Evapotranspiration Index. Sci. Total Environ. 2019, 654, 850–862. [Google Scholar] [CrossRef] [PubMed]
  17. Liu, S.; Kang, W.; Wang, T. Drought variability in Inner Mongolia of northern China during 1960–2013 based on standardized precipitation evapotranspiration index. Environ. Earth Sci. 2016, 75, 145. [Google Scholar] [CrossRef]
  18. Zhou, Y.; Li, N.; Ji, Z.; Gu, X.; Fan, B. Temporal and Spatial Patterns of Droughts Based on Standard Precipitation Index (SPI) in Inner Mongolia during 1981–2010. J. Nat. Resour. 2013, 28, 1694–1706. [Google Scholar]
  19. Gao, R.; Li, F.; Wang, X.; Liu, T.; Du, D.; Bai, Y. Spatiotemporal variations in precipitation across the Chinese Mongolian plateau over the past half century. Atmos. Res. 2017, 193, 204–215. [Google Scholar] [CrossRef]
  20. Wang, Y.; Zhang, J.; Guo, E.; Dong, Z.; Quan, L. Estimation of Variability Characteristics of Regional Drought during 1964–2013 in Horqin Sandy Land, China. Water 2016, 8, 543. [Google Scholar] [CrossRef]
  21. Sternberg, T.; Middleton, N.; Thomas, D. Pressurised pastoralism in South Gobi, Mongolia: What is the role of drought? Trans. Inst. Br. Geogr. 2009, 34, 364–377. [Google Scholar] [CrossRef]
  22. Wang, H.; He, S. The North China/Northeastern Asia Severe Summer Drought in 2014. J. Clim. 2015, 28, 6667–6681. [Google Scholar] [CrossRef]
  23. Wang, R.; Cherkauer, K.; Bowling, L. Corn Response to Climate Stress Detected with Satellite-Based NDVI Time Series. Remote Sens. 2016, 8, 269. [Google Scholar] [CrossRef]
  24. Cao, X.; Wang, J.; Gao, Z.; Ning, J.; Shi, R.; Gao, W. Monitoring Drought in the Monglian Plateau Based on NDVI-Ts General Space, 2000–2010; SPIE—The International Society for Optical Engineering: Bellingham, WA, USA, 2013. [Google Scholar]
  25. Yan, H.; Wang, S.; Wang, J.; Lu, H.; Guo, A.; Zhu, Z.; Myneni, R.B.; Shugart, H.H. Assessing spatiotemporal variation of drought in China and its impact on agriculture during 1982–2011 by using PDSI indices and agriculture drought survey data. J. Geophys. Res. Atmos. 2016, 121, 2283–2298. [Google Scholar] [CrossRef]
  26. Dai, A. Drought under global warming: A review. Wiley Interdiscip. Rev. Clim. Chang. 2011, 2, 45–65. [Google Scholar] [CrossRef]
  27. Stagge, J.H.; Tallaksen, L.M.; Gudmundsson, L.; Van Loon, A.F.; Stahl, K. Response to comment on ‘Candidate Distributions for Climatological Drought Indices (SPI and SPEI)’. Int. J. Climatol. 2016, 36, 2132–2138. [Google Scholar] [CrossRef]
  28. Vicente-Serrano, S.M.; Beguería, S.; López-Moreno, J.I. A multiscalar drought index sensitive to global warming: The standardized precipitation evapotranspiration index. J. Clim. 2010, 23, 1696–1718. [Google Scholar] [CrossRef]
  29. Beguería, S.; Vicente Serrano, S.M.; Reig, F.; Latorre, B. Standardized precipitation evapotranspiration index (SPEI) revisited: Parameter fitting, evapotranspiration models, tools, datasets and drought monitoring. Int. J. Climatol. 2014, 34, 3001–3023. [Google Scholar] [CrossRef]
  30. Gilbert, R.O. Statistical Methods for Environmental Pollution Monitoring; John Wiley & Sons: Hoboken, NJ, USA, 1987. [Google Scholar]
  31. El-Shaarawi, A.H.; Piegorsch, W.W. Encyclopedia of Environmetrics; John Wiley & Sons: Hoboken, NJ, USA, 2001; Volume 1. [Google Scholar]
  32. Sen, P.K. Estimates of the regression coefficient based on Kendall’s tau. J. Am. Stat. Assoc. 1968, 63, 1379–1389. [Google Scholar] [CrossRef]
  33. Beguería, S.; Vicente-Serrano, S.M.; Angulo-Martínez, M. A Multiscalar Global Drought Dataset: The SPEIbase: A New Gridded Product for the Analysis of Drought Variability and Impacts. Bull. Am. Meteorol. Soc. 2010, 91, 1351–1356. [Google Scholar] [CrossRef] [Green Version]
  34. Yue, S.; Pilon, P.; Cavadias, G. Power of the Mann—Kendall and Spearman’s rho tests for detecting monotonic trends in hydrological series. J. Hydrol. 2002, 259, 254–271. [Google Scholar] [CrossRef]
  35. Gerstengarbe, F.; Werner, P.C. Estimation of the beginning and end of recurrent events within a climate regime. Clim. Res. 1999, 11, 97–107. [Google Scholar] [CrossRef] [Green Version]
  36. Kaihatu, J.M.; Handler, R.A.; Marmorino, G.O.; Shay, L.K. Empirical orthogonal function analysis of ocean surface currents using complex and real-vector methods. J. Atmos. Ocean. Technol. 1998, 15, 927–941. [Google Scholar] [CrossRef]
  37. Liu, J.; Zheng, M. Climatic characteristics of strong and very strong sandstorms in the middle and west parts of Inner Mongolia. Plateau Meteorol. 2003, 1, 6. [Google Scholar]
  38. Fan, Q.; Wang, C.; Zhang, D.; Zang, S. Environmental Influences on Forest Fire Regime in the Greater Hinggan Mountains, Northeast China. Forests 2017, 8, 372. [Google Scholar] [CrossRef]
  39. Philip, G.M.; Watson, D.F. A precise method for determining contoured surfaces. APPEA J. 1982, 22, 205–212. [Google Scholar] [CrossRef]
  40. Watson, D.F. A refinement of inverse distance weighted interpolation. Geoprocessing 1985, 2, 315–327. [Google Scholar]
  41. Hu, W.; Niu, H.; Zhang, D.; Wu, Z.; Chen, C.; Wu, Y.; Shang, D.; Hu, M. Insights into a dust event transported through Beijing in spring 2012: Morphology, chemical composition and impact on surface aerosols. Sci. Total Environ. 2016, 565, 287–298. [Google Scholar] [CrossRef]
  42. Hagemann, S.; Chen, C.; Clark, D.; Folwell, S.; Gosling, S.N.; Haddeland, I.; Hannasaki, N.; Heinke, J.; Ludwig, F.; Voss, F. Climate change impact on available water resources obtained using multiple global climate and hydrology models. Earth Syst. Dynam. 2013, 4, 129–144. [Google Scholar] [CrossRef] [Green Version]
  43. Winsemius, H.C.; Jongman, B.; Veldkamp, T.; Hallegatte, S.; Bangalore, M.; Ward, P. Disaster Risk, Climate Change, and Poverty: Assessing the Global Exposure of Poor People to Floods and Droughts; The World Bank: Washington, DC, USA, 2015. [Google Scholar]
  44. Liljedahl, A.K.; Boike, J.; Daanen, R.P.; Fedorov, A.N.; Frost, G.V.; Grosse, G.; Hinzman, L.D.; Iijma, Y.; Jorgenson, J.C.; Matveyeva, N. Pan-Arctic ice-wedge degradation in warming permafrost and its influence on tundra hydrology. Nat. Geosci. 2016, 9, 312. [Google Scholar] [CrossRef]
  45. Gu, G.; Adler, R.F.; Huffman, G.J.; Curtis, S. Tropical rainfall variability on interannual-to-interdecadal and longer time scales derived from the GPCP monthly product. J. Clim. 2007, 20, 4033–4046. [Google Scholar] [CrossRef]
  46. John, V.O.; Allan, R.P.; Soden, B.J. How robust are observed and simulated precipitation responses to tropical ocean warming? Geophys. Res. Lett. 2009, 36. [Google Scholar] [CrossRef] [Green Version]
  47. Jiang, L.G.; Yao, Z.J.; Huang, H.Q. Climate variability and change on the Mongolian Plateau: Historical variation and future predictions. Clim. Res. 2016, 67, 1–14. [Google Scholar] [CrossRef]
  48. Zou, X.K.; Zhai, P.M. Relationship between vegetation coverage and spring dust storms over northern China. J. Geophys. Res. Atmos. 2004, 109. [Google Scholar] [CrossRef]
  49. Mantua, N.J.; Hare, S.R.; Zhang, Y.; Wallace, J.M.; Francis, R.C. A Pacific Interdecadal Climate Oscillation with Impacts on Salmon Production. Bull. Am. Meteorol. Soc. 1997, 78, 1069–1079. [Google Scholar] [CrossRef]
  50. Schlesinger, M.E.; Ramankutty, N. An oscillation in the global climate system of period 65–70 years. Nature 1994, 367, 723–726. [Google Scholar] [CrossRef]
  51. Qin, M.; Li, D.; Dai, A.; Hua, W.; Ma, H. The influence of the Pacific Decadal Oscillation on North Central China precipitation during boreal autumn. Int. J. Climatol. 2018, 38, e821–e831. [Google Scholar] [CrossRef]
  52. Qin, F.Y.; Jia, G.S.; Yang, J.; Na, Y.T.; Hou, M.T. Spatiotemporal variability of precipitation during 1961–2014 across the Mongolian Plateau. J. Mt. Sci. 2018, 15, 992–1005. [Google Scholar] [CrossRef]
  53. Tong, S.; Li, X.; Zhang, J.; Bao, Y.; Bao, Y.; Na, L.; Si, A. Spatial and temporal variability in extreme temperature and precipitation events in Inner Mongolia (China) during 1960–2017. Sci. Total Environ. 2019, 649, 75–89. [Google Scholar] [CrossRef]
  54. Ma, Y.; Mao, R.; Feng, S.; Gong, D.; Kim, S. Does the recent warming hiatus exist over Northern Asia for winter wind chill temperature? Int. J. Climatol. 2017, 37, 3138–3144. [Google Scholar] [CrossRef]
  55. Nandintsetseg, B.; Shinoda, M.; Erdenetsetseg, B. Contributions of multiple climate hazards and overgrazing to the 2009/2010 winter disaster in Mongolia. Nat. Hazards 2018, 92, 109–126. [Google Scholar] [CrossRef]
Figure 1. (a) Geographic location of the Mongolian plateau (MP); (b) locations of weather stations and typical climatic regions in the MP; (c) 90 m Digital Elevation Model of the MP.
Sustainability 11 05767 g001aSustainability 11 05767 g001b
Figure 2. Dynamic characteristics of SPEI-3 in Region I (a); SPEI-3 in Region II (b); SPEI-3 in Region III (c); SPEI-3 in the MP (d); SPEI-12 in Region I (e); SPEI-12 in Region II (f); SPEI-12 in Region III (g); SPEI-12 in the MP (h) from 1980 to 2015.
Sustainability 11 05767 g002
Figure 3. M–K Abrupt Change Analysis Based on SPEI-12 in the Mongolian Plateau from 1980 to 2015.
Sustainability 11 05767 g003
Figure 4. Trends per 10a for each year in the Mongolian Plateau during 1980–2015.
Sustainability 11 05767 g004
Figure 5. Spatial patterns of trends per 10a for Spring (a); Summer (b); Autumn (c); and Winter (d) in the Mongolian Plateau during 1980–2015.
Sustainability 11 05767 g005
Figure 6. Frequencies of Annual Mild Droughts (a), Moderate Droughts (b), Severe Droughts (c) and Extreme Droughts (d) during 1980–2015 (at different severity grades).
Sustainability 11 05767 g006
Figure 7. PC1 and PC2 Time Series Variations for Analysis of SPEI-12 Principal Components based on Annual Drought Variations in Different Climatic Regions in the Mongolian Plateau from 1980 to 2015.
Sustainability 11 05767 g007
Figure 8. Spatial Distribution of (a) EOF1 and (b) EOF2 for Annual Drought Variations in Different Climatic Regions in the Mongolian Plateau from 1980 to 2015.
Sustainability 11 05767 g008
Figure 9. Line Chart for Mean Precipitations in Fall at Stations with Mitigated Droughts in 1980–2015.
Sustainability 11 05767 g009
Figure 10. Line Chart for Mean Precipitations (Snowfalls) in Winter,1980–2015 (the average precipitations in 1980–1999 and 1999–2015 were 1.99 mm and 2.6 mm, respectively).
Sustainability 11 05767 g010
Table 1. The SPEI drought index categories.
GradeTypeSPEI Value
0Normalmore than −0.5
1Mild drought(−1.00, −0.5]
2Moderate drought(−1.50, −1.00]
3Severe drought(−2.00, −1.50]
4Extreme droughtless than −2.00
Note. SPEI (Standardized Precipitation-Evapotranspiration Index).
Table 2. Sen’s slope of SPEI-12 in all three climatic regions and their average values before and after year 1998.
PeriodsAreasSlope1980–1998
Average SPEI-12
1999–2015
Average SPEI-12
YearI−0.0243 *0.3711−0.4083
II−0.0241 *0.3499−0.3838
III−0.0307 *0.4330−0.4768
MP−0.0234 *0.3685−0.4070
Note. * Significance at the 95% confidence level.
Table 3. Seasonal trend of drought in the Mongolian Plateau during 1980–2015.
ZoneSeasonSlope1980–1998
Average SPEI-3
1999–2015
Average SPEI-3
Spring–0.00110.00940.0019
Summer–0.0231 *0.3594–0.3939
Autumn–0.0235 *0.2887–0.3050
Winter0.0241 *–0.18720.2389
Spring–0.01570.1377–0.1352
Summer–0.0232 *0.3671–0.3999
Autumn–0.00550.0846–0.0668
Winter0.0090–0.06900.1094
Spring–0.0247 *0.2134–0.2253
Summer–0.0257 *0.4043–0.4387
Autumn–0.01770.1257–0.1279
Winter–0.00160.02020.0198
MPSpring–0.01380.1086–0.1076
Summer–0.0236 *0.3684–0.4051
Autumn–0.01390.1559–0.1529
Winter0.0098–0.09110.1294
Note. * Significance at the 95% confidence level.
Table 4. Percentages of explained variance for each EOF of the SPEI-12.
Mode-1Mode-2Mode-3Mode-4Mode-5Mode-6Mode-7Cumulated Explained Variance
43.79%10.12%7.75%5.76%3.33%3.09%2.65%76.48%
39.22%15.94%5.39%5.10%3.60%3.28%2.75%75.28%
50.59%11.27%6.82%4.51%3.33%3.19%2.42%82.14%
Note. Empirical orthogonal function (EOF), 12 Months scale Standardized Precipitation-Evapotranspiration Index (SPEI-12).

