Review

Assessment Methods and Factors Determining Positive Indoor Soundscapes in Residential Buildings: A Systematic Review

1
Department of Civil Environmental and Mechanical Engineering, University of Trento, Via Mesiano 20, 38123 Trento, Italy
2
Institute for Renewable Energy, Eurac Research, A. Volta Straße/Via A. Volta 13/A, 39100 Bozen/Bolzano, Italy
3
UCL Institute for Environmental Design and Engineering, The Bartlett, University College London (UCL), Central House, 14 Upper Woburn Place, London WC1H 0NN, UK
*
Author to whom correspondence should be addressed.
Sustainability 2019, 11(19), 5290; https://doi.org/10.3390/su11195290
Submission received: 30 August 2019 / Revised: 20 September 2019 / Accepted: 22 September 2019 / Published: 25 September 2019

Abstract

:
The design of an indoor acoustic environment positively perceived by building occupants requires a perceptual approach to be adopted in order to define what makes it sound good. Soundscape standards ISO 12913 have been introduced to assess how the acoustic environment is perceived, in context, by people. According to the standards, a straightforward characterization of a soundscape as positive is currently possible only through measurements by persons, because of a current gap in linking perceptual metrics to acoustic or psychoacoustic measurements. In addition, despite applying also to indoor contexts, methods and perceptual metrics described by the standards have been mainly derived from studies related to outdoor urban environments and it is not clear whether they could be directly applied indoor. For this reason, a systematic review was performed to investigate: (i) Data collection methods used in the literature for indoor residential soundscapes and (ii) factors, output of such methods, that characterize them positively. For this purpose, a systematic review has been conducted in accordance with the PRISMA guidelines (preferred reporting items for systematic reviews and meta-analyses) guidelines. The Scopus database was searched for peer-reviewed journal papers published in English, between 1 January 2009 and 24 June 2019, including: (1) field or laboratory studies relevant to residential buildings and (2) studies assessing factors that influence the perception by building users of indoor acoustic environments. The search excluded studies related to: (a) Speech perception issues; (b) noise-induced sleep disturbance; (c) acoustic perception by hearing impaired building users; (d) perception of vibrations or impact sounds. The search returned 1087 results. After the screening process, 37 articles were finally included. Given the differences in methodologic approaches, a quantitative meta-analysis could not be performed, and a qualitative approach was adopted instead. A large part of the selected literature reflected a general effort of minimizing noise annoyance by reducing noise exposure and, in particular, noise levels. Questionnaires and guided interviews were used to capture people’s perception, while the adoption of soundwalks and non-participatory behavioral studies did not emerge in the review literature and need further investigation. The evaluation of a variety of auditory sensations both in their positive and negative dimensions, beyond annoyance, would be required to explore the positive perceptual potential of sounds. Besides sound level, a variety of factors related and unrelated to the acoustic environment were found to affect perceptual outcomes and a framework of evaluation has been proposed as a reference for future assessments. Results encourage the integration of soundscape methodologies into IEQ research, in order to enhance user health and well-being.

1. Introduction

The design of indoor acoustic environments beyond noise annoyance reduction implies a perceptual perspective to be adopted, in order to understand what sounds good for building occupants. This perspective perfectly aligns with the soundscape approach, defined as a framework to assess how the acoustic environment is “perceived or experienced and/or understood by a person or people, in context” [1]. Traditionally, research and, consequently, legislation have focused on “unwanted” sound sources and possible annoyance they generate. This is reflected for instance in the “European Noise Directive” (END) [2] and in a number of other technical guidelines [3,4] which have put a lot of effort in reducing environmental noise exposure and, in general, noise levels generated by sources such as road and rail vehicles and infrastructures, aircrafts and industrial equipment. Little has been said on the contrary about “wanted” sounds or sounds “of preference”.
By undertaking a perceptual perspective, the aim of soundscape research has been to promote a paradigm shift from considering sound as a “waste” to be reduced to considering sound as a “resource” to be exploited according to people´s perception, experience and understanding of the acoustic environment [5]. Despite soundscape research being originally conducted at an urban scale and for outdoor spaces [5,6], indoor soundscape research has recently spread, trying to look at how buildings mediate in the definition of the indoor aural experience [7].
“Positive” indoor soundscapes are acoustic environments being perceived positively by their users, in that context. Preliminarily to their design, it is thus foundational to understand (i) which data collection methods can be used to assess an indoor soundscape and (ii) which factors, outputs of such methods, characterize it positively. These are the two research questions underpinning the present literature review.
As far as the first research question is concerned, ISO 12913-2 has recently reported a variety of data collection methods related to human perception, acoustic environment and context [8]. The standard describes methods to measure “by persons” (e.g., soundwalks, questionnaires, guided interviews) and methods to measure “by instruments” (e.g., binaural measurements) [8]. The former results in the evaluation of soundscape descriptors used to describe how the acoustic environment is perceived, the later in the measurement and calculation of soundscape indicators used to predict soundscape descriptors [8]. Anyway, it must be observed that the methods described by the standard have been mainly derived from studies related to outdoor urban environments and it is not clear whether they could be directly applied indoor.
Regarding the second research question, a straightforward characterization of a soundscape as positive is currently possible only through measurements by persons. One of the main theoretical reference is the circumplex model of perceived affective quality for soundscape characterization proposed by Axelsson [9]. The model is defined by two main orthogonal factors: “Pleasantness” and “eventfulness”. According to this model, vibrant soundscapes are both pleasant and eventful, calm soundscapes are both pleasant and uneventful, chaotic soundscapes are both eventful and unpleasant and monotonous soundscapes are both unpleasant and uneventful. With reference to the resulting cartesian plane, human judgements located in the pleasant region—that are the first and forth quadrants—describe a positive soundscape [10]. Besides these two main dimensions, “appropriateness” is a further one, independent of perceived affected quality, providing additional information [11].
The characterization of a soundscape as positive from acoustic or psychoacoustic measurements is currently less straightforward, because of a gap between soundscape descriptors and soundscape indicators, as stressed by ISO 12913-2 [8]. In addition, soundscape descriptors have been defined from listening tests playing outdoor sounds and it is not clear whether they are equally valid indoor. Moreover, physiological measurements are not included in the standard.
Stated the main goal of designing positive indoor soundscapes and highlighted the current main gaps in indoor soundscape evaluation, the present study is intended to review studies related to the assessment of residential environments, in order to answer to the following research questions:
  • What are the methods used to capture physical, perceptual and physiological data in the acoustic assessment of residential buildings?
  • What are the factors positively influencing the perception of indoor acoustic environments?
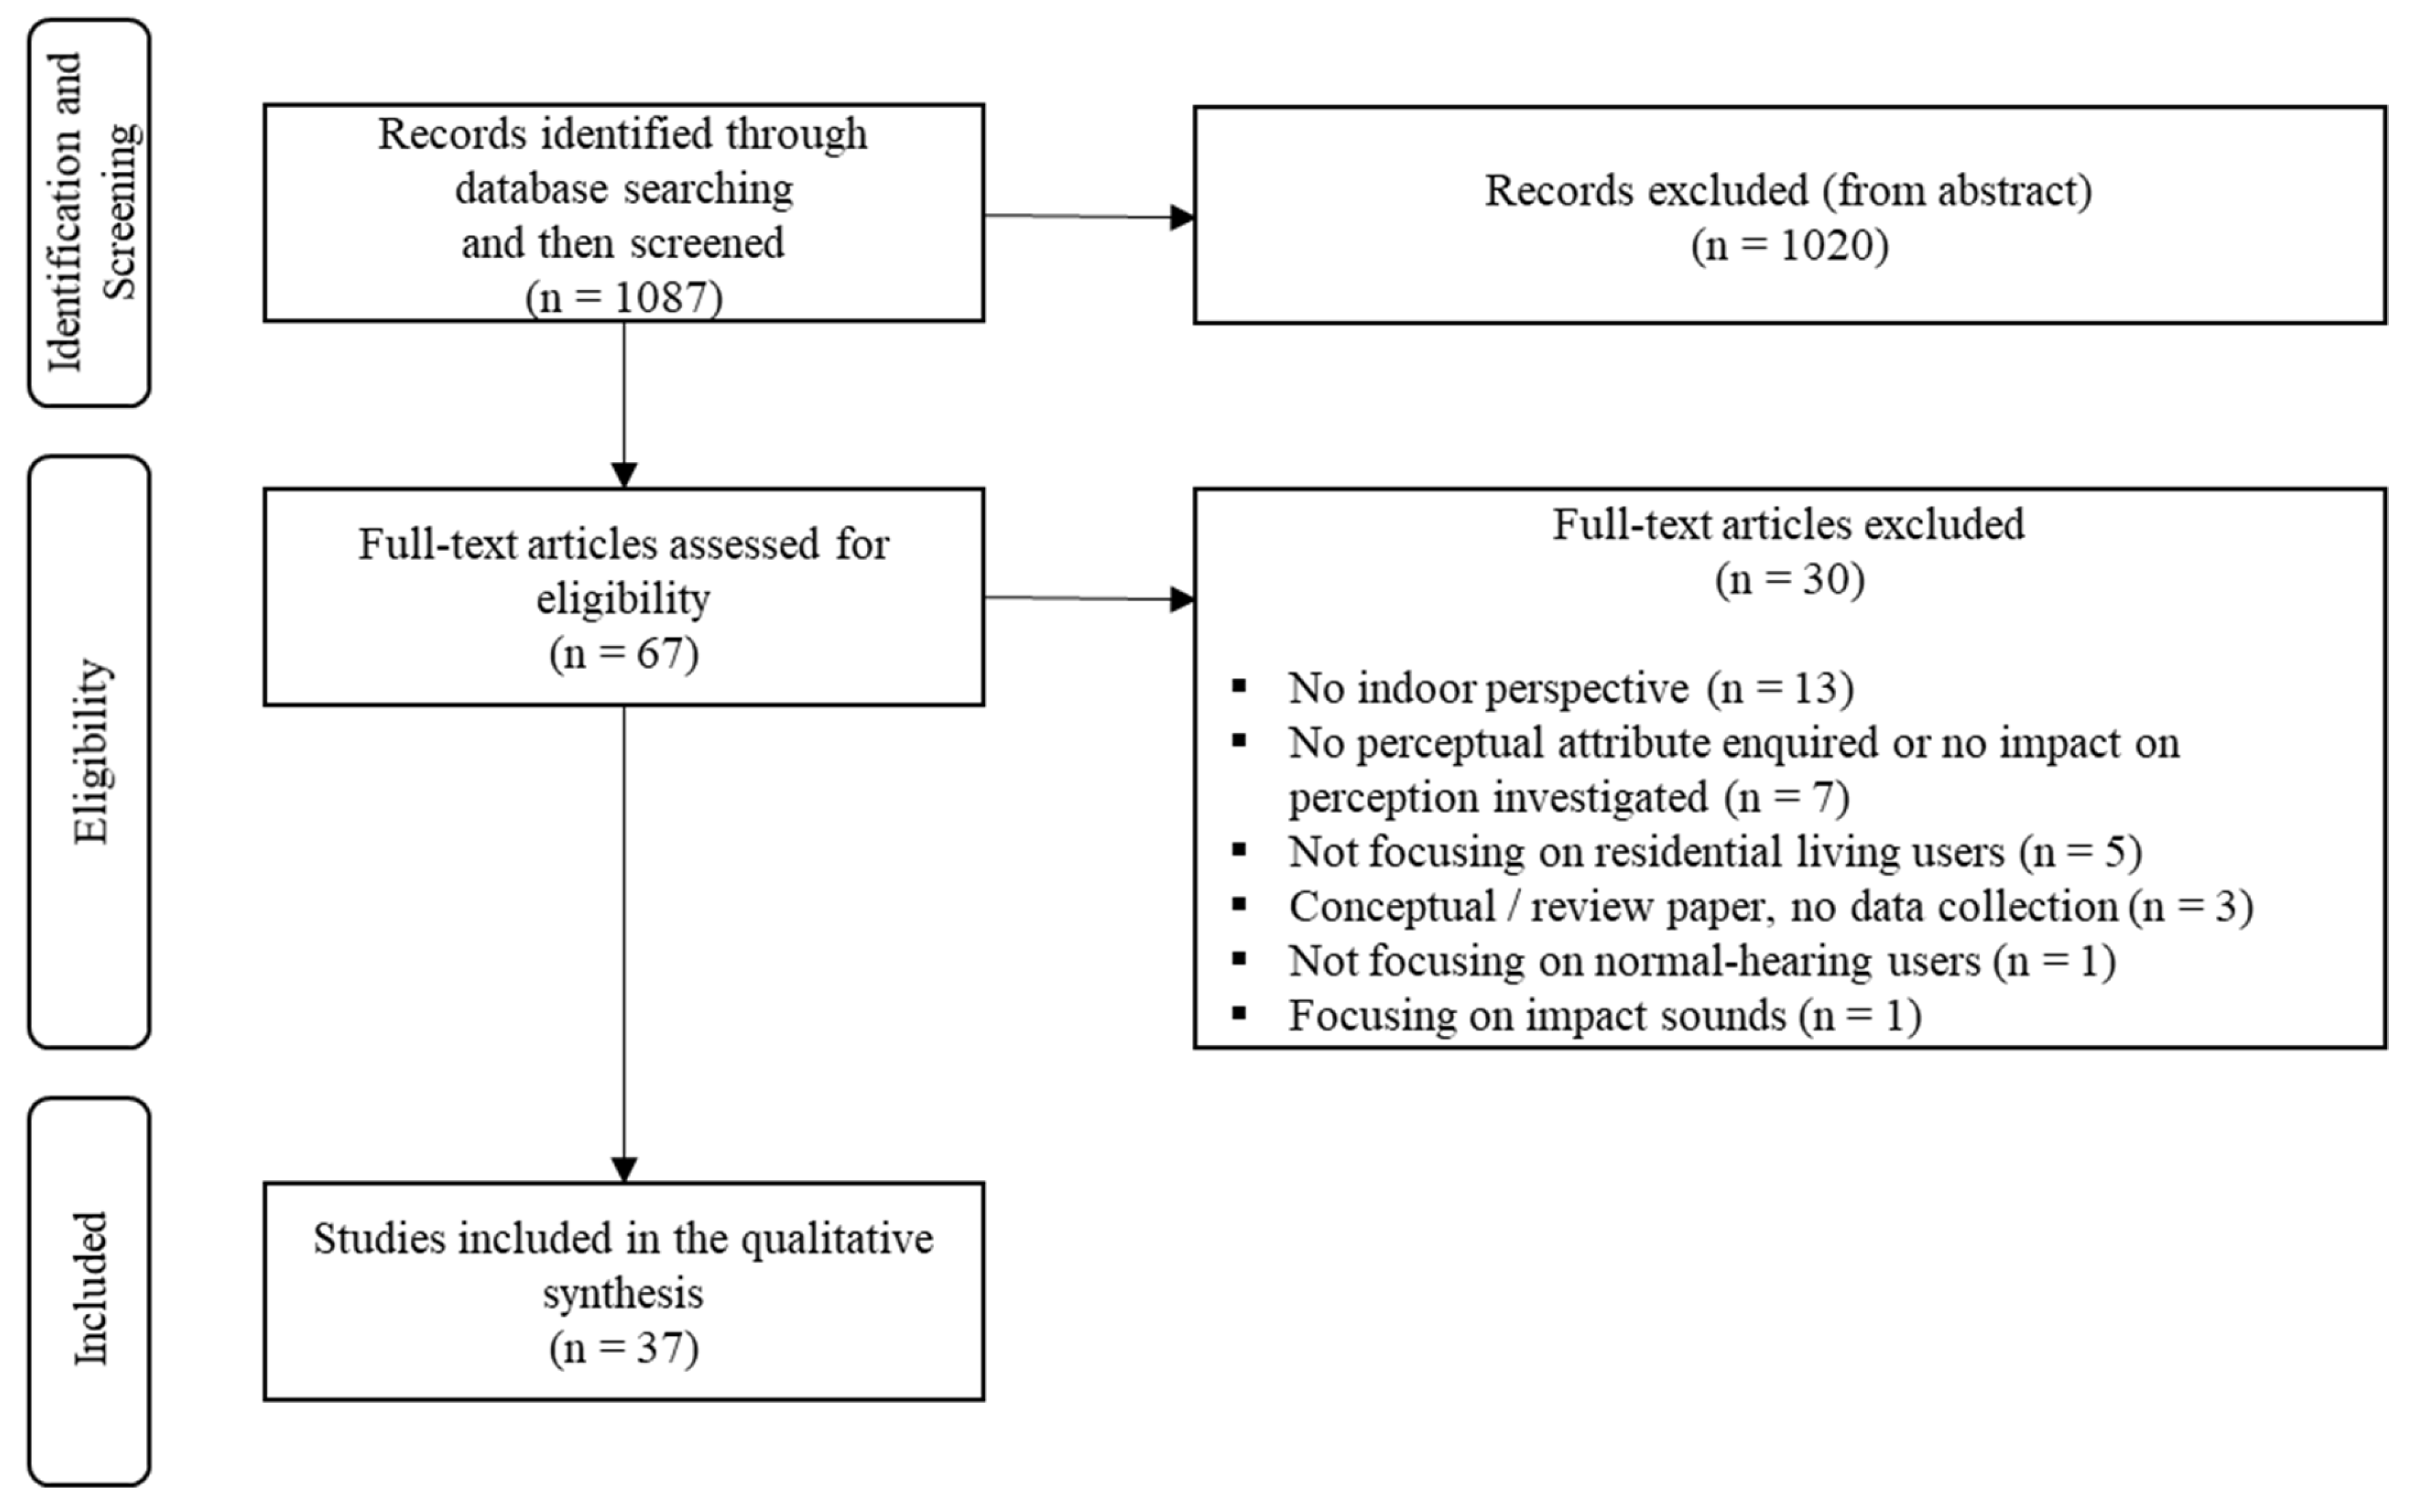
2. Methods

No predefined protocol has been registered for this systematic review, given its exploratory nature. The methodology for data extraction and collection was chosen prior to the review process. The PRISMA guidelines (preferred reporting items for systematic reviews and meta-analyses) were considered as a reference for literature review performance and data reporting [12,13,14], when applicable. PRISMA is an evidence-based set of items that is used as a common framework for reporting systematic reviews and meta-analyses with the aim of ensuring completeness of reporting. In particular, the reporting of findings from systematic reviews or meta-analysis is guided by the PRISMA checklist and flow diagram (see Figure 1).

2.1. Search Strategy and Eligibility Criteria

A literature search was performed to collect studies dealing with the acoustic perception inside residential buildings. More specifically, inclusion criteria regarded: (i) Field studies in residential areas, or laboratory studies in which test conditions were supposed to replicate those experienced in residential buildings (e.g., sound stimuli typical of indoor residential spaces, participants imagining to be in a residential environment) and (ii) studies assessing the factors that influence the perception of indoor acoustic environments by normal-hearing building users. Perceptual aspects of interest are those related to the identification of noticed and preferred noise sources in residential buildings and the positive characterization of indoor soundscapes. In the context of the present study, reduced negative perceptual outcomes (e.g., annoyance) will be interpreted as outcomes for positive indoor soundscapes as well.
The following aspects were excluded: (1) Speech perception issues, being the focus on the general perception of the acoustic environment, besides intelligibility concerns; (2) noise-induced sleep disturbance, being the focus on day activities; (3) acoustic perception by hearing impaired building users and (4) perception of vibrations or impact sounds, being the focus on airborne sounds. Only peer-reviewed journal articles published in English were considered.
The literature search was conducted in the Scopus database, based on terms related to acoustic studies (“acoustic” or “sound” or “noise”) combined with terms indicating the perceptual dimension (“soundscape” or “percept *”) and terms identifying laboratory settings or residential buildings (“laboratory” or “residential” or “home” or “house”). As the application of the soundscape methodology to indoor environments is quite recent, only journal articles published after 2009 were considered. The last search was performed on 24 June 2019.

2.2. Data Extraction

The following information was extracted from each selected study: (1) Study design (i.e., laboratory study, social or socio-acoustic survey, soundscape assessment); (2) number of participants in the study; (3) type of sounds investigated in laboratory studies or resulting relevant for perceptual outcomes from field studies; (4) sound levels and metrics used to define exposure conditions or to predict a perceptual outcome; (5) soundscape data collection method (i.e., questionnaires, interviews); (6) perceptual attributes enquired to participants; (7) type of physiologic measurement; and (8) main observed category of factors influencing the acoustic perception.
Only aspects relevant to the stated review questions according to inclusion criteria have been extracted from the selected studies and then discussed.
Given the variety of metrics encountered in the reviewed studies, a synthesis of data through a quality effects model and a quantitative meta-analysis was not possible. Instead, a qualitative approach has been adopted to summarize the results and to answer to the research questions.

3. Results

The database search returned 1087 results. A preliminary selection of articles has been made based on title and abstract and 1020 items were removed because the topic addressed by the papers was not relevant to the review research questions. The full-texts of the remaining 67 articles were assessed and 29 items were excluded as they failed to meet the eligibility criteria (e.g., the paper was not assessing residential buildings or not from an indoor perspective, etc.). Thirty-seven papers were finally included in the review. A flow diagram of the selection process is provided in Figure 1.
A summary of the thirty-seven studies included in the literature review is provided in Table 1. Items are reported according to their chronological order of publication. As only one study included physiologic measures [15], for the sake of space these will be not shown in the table.
In the following, the selected studies are analyzed and reported according to the two main review questions.

3.1. Study Designs, Acoustic Measures, and Soundscape Data Collection Methods

Selected studies make use of different study designs, that are laboratory tests [16,18,19,20,21,24,25,32,34,36,41,42,43,47] and field campaigns based on socio-acoustic [15,17,22,23,26,28,35,37,39,40,45,46,48,49,50,51], social surveys [29,30,31,33,38,44], or soundscape assessments [27]. Laboratory studies evaluate testers’ response to experimental stimuli in laboratory settings, under controlled conditions. Socio-acoustic surveys, according to the definition provided by ISO 15666 standard, assess noise-induced annoyance through both subjective and objective measurements [52]. In this paper, the term “socio-acoustic surveys” will be used by extending its reference to other investigated perceptual dimensions, besides annoyance. Differently, we will refer to “social surveys” to intend surveys only gathering subjective data (i.e., without sound measurements).
Laboratory, social and socio-acoustic surveys differ from soundscape assessments in that in the former data are provided by participants, while in the latter the data collection is performed by a trained researcher on the basis of his understanding of the acoustic environment. As shown in Table 1, laboratory studies typically use relatively smaller samples of participants, while field studies typically include larger ones.
Auditory stimuli used in laboratory experiments generally referred to one specific sound type or to a series of sound types being combined across the exposure conditions. Field studies focused on a specific sound type relevant to the context (e.g., aircraft sound near an airport) or, generally, to the soundscape of that context (e.g., a residential area). In this latter case, information about the perceived sound sources are provided by the building users. Type of sounds investigated or resulted as relevant from the reviewed studies are reported in Table 1, and can be described taking as a reference the taxonomy proposed by ISO 12913-2 [8], through the following categories:
  • Motorized transport (sounds from road traffic, railway, aircraft);
  • electro-mechanical indoor or outdoor sounds (sounds from ventilation systems, industry, wind turbines, neighbors, construction sites);
  • voice and instruments (speech and music from outdoor community areas or from neighbors);
  • nature (water sounds);
  • domesticated animals (pets).
It should be noticed that the majority of the reviewed studies focus on acoustic environments dominated by motorized transport and, in particular, by road traffic.
Perceptual data have been gathered in the majority of studies through questionnaires, and in two social surveys through interviews [30,31]. Objects of judgments vary from study to study, and are generally intended to investigate the following perceptual categories:
  • The overall evaluation of the acoustic environment;
  • the awareness of noise and the noticeability of sound sources in the indoor environment;
  • the preference for specific sound types;
  • the soundscape dimensions through the descriptors established by the soundscape literature;
  • the sound descriptors used for sound quality characterization of specific sources (e.g., wind turbines, fan noise);
  • the perception of control over the acoustic environment.
Details on the enquired items for each perceptual category are provided in Table 2. “Annoyance” is the perceptual attribute most frequently assessed by the reviewed studies. Combined with previous observations on the investigated sound sources, it follows that a large part of the selected literature is dedicated to exploring dose–response relationships between road traffic sound and the resulting annoyance in indoor environments.
In general, perceptual outcomes (e.g., annoyance) have been correlated to subjective measures (e.g., self-reported noise sensitivity), to non-acoustic objective measurable parameters (e.g., temperature) or to acoustic objective measurable parameters (e.g., sound level). In this latter case, different metrics have been used to characterize the auditory stimuli or the assessed living environment.
As shown in Table 1, laboratory studies typically refer to equivalent levels (Leq). Exposure conditions made use of auditory stimuli from indoor or outdoor recordings, sometimes filtered to take into account the attenuation provided by the façade, according to the window opening position [36,41,42,43]. Differently, socio-acoustic surveys typically made use of daily-averaged outdoor levels (e.g., Lden, Lday). Indeed, in field studies the perceptual response to indoor acoustic conditions has been generally correlated to metrics derived from outdoor recordings or from traffic noise models.
Complementarily to sound levels, psychoacoustics indicators (e.g., loudness, roughness, and fluctuation strength) were included in annoyance models derived from laboratory experiments to explain annoyance caused by single or multiple sound sources, such as: urban road vehicle pass-by noises in isolation or combined with an industrial noise [34], road traffic noise combined with construction or ventilation noise [41], or industrial noises with a main spectral component combined with a background noise [47]. Different metrics integrated into such annoyance models are reported in Table 1.
The characterization of auditory stimuli or of the acoustic environments were typically made through monoaural recordings. Anyway, in a few laboratory experiments, auditory stimuli were prepared from binaural [16,32,41], stereophonic [34,47], or ambisonic [42] recordings, in order to better consider the way human auditory system integrate the acoustic environment.
Physiologic measures were generally absent from the selected studies. Blood pressure measurements were only conducted in the study by Babisch et al., to investigate the relationship between road traffic and aircraft sound exposure to one side and annoyance and hypertension, to the other [15]. Further details are provided in the following paragraph, where factors influencing the perception of indoor acoustic environments are reported and analyzed.

3.2. Factors Influencing the Acoustic Perception of Indoor Residential Buildings

Factors affecting the perception of the indoor acoustic environment in residential spaces have been extracted from the reviewed studies and categorized for the sake of reporting and discussion. It must be observed that the category assignment is not always straightforward. Indeed, the categorization proposed in Table 3 is intended to provide a first framework for indoor residential soundscapes, to be reviewed and updated according to future studies.
In the following paragraphs, factors are described and their effect on perceptual attributes reported, according to the defined factor categories.
Acoustic factors. Factors associated to the physical character of the acoustic environment affect in different ways the dimensions underlying its perception by building users. Noise annoyance ratings were reported to be positively related to sound levels [15,16,17,18,22,23,24,25,26,28,32,35,37,41,43,45,46,48,49,51] and negatively related to the source distance [32,42,43]. Acoustic comfort was also related to sound level [19]. Besides sound level, other acoustic and psychoacoustics indices were integrated by Morel et al. in the definition of noise annoyance indicators for various urban road vehicle pass-by noises, in order to highlight spectral and temporal features of sounds [34]. Such indices included loudness (N), loudness integrated between Barks 15 and 18 (N15–18), the maximum roughness (Rmax), the fluctuation strength (F), the maximum fluctuation strength (Fmax), the equivalent level calculated for middle frequencies (LMF) and the loudness decrease rate over time ( Δ N ) . Taken together, the results for various categories of pass-by noises suggested that sounds with higher loudness, higher roughness and fluctuation strength, with important spectral content at the middle frequencies and referred to vehicles taking more time to depart are found more annoying by test participants [34].
Regarding the most annoying characteristics related to perception of aircraft sounds in home-like spaces, the laboratory study by Lambert et al. reported the perceived loudness of aircraft noises to be the most annoying factor, followed by the duration of aircraft events, their intermittency and the number of noticed events [36]. The actual number of aircraft sound events was also positively related to noise annoyance [36]. The noticeability of sound events in a home context was investigated in the laboratory experiment by Terroir et al. [42], being a perceptual aspect connected to activity interference and to the emergence of noise annoyance. In their study, the number of train passbys, the distance to the railway track and the dominance of the train sound above the background were found to influence the number of train passbys that subjects could remember. The frequency of annoyance due to community noise sources (e.g., food centers, playgrounds, schools, and waste disposal trucks) was found to be significantly correlated to the general disturbance by those community noise sources [50].
Annoyance was investigated not only with reference to specific sound types in isolation but also to combined sound sources. In the laboratory experiment by Lee and Jeon annoyance ratings due to combined traffic and construction noise or to traffic and ventilation noise were found to be correlated to the psychoacoustics parameters of loudness and roughness. In particular, higher annoyance was explained by higher loudness and larger roughness [41].
Morel et al. proposed annoyance models for vehicle pass-by noises combined with an industrial noise [34]. Several psychophysical and perceptual models were investigated, the former based on acoustic and psychoacoustic metrics (e.g., LAeq or Zwicker’s loudness of single or combined sounds), the latter based on specific or total annoyance related to the single or combined sounds. The analysis of specific and total annoyance revealed the existence of synergetic and strongest component effects between the combined noises, that seemed to be related to their temporal evolution. Through two laboratory experiments, Alayrac et al. investigated the total annoyance from an industrial noise source combined with a background noise (nature, residential area, city, building site, and road traffic) [47]. In the first experiment the exposure conditions were obtained by combining a low-frequency noise with a main spectral component at 100 Hz, at different sound emergence levels, with one of the selected background noises. Total annoyance was found to be significantly influenced by the level and by the type of the background noise and by the emergence level of the background noise source. Interestingly, mean total annoyance was lower than the annoyance due to the exposure to the single industrial noise source in case of combination with natural sounds and lower or equal in case of road traffic sounds. In their second experiment, the exposure stimuli were constituted by an industrial noise with a main spectral component centered at various frequencies between 200 and 1kHz and a background noise [47]. Annoyance response was mainly influenced by the type of background noise, compared to the sound emergence level or the type of industrial noise. For road traffic, construction or urban background noise, when the industrial and the background sounds in isolation caused a similar annoyance, total annoyance was found to be higher than the specific ones. Instead, when the industrial noise was more annoying than the background noise, total annoyance was closer to the specific annoyance of the industrial source in isolation. Differently, when the background noise was composed of natural sounds or sound from a residential area, total annoyance was lower than the specific annoyance caused by the industrial noise. Therefore, the study revealed that industrial noise was partially masked by the background noise, thus being perceived as less annoying, depending on the type of background source.
Yang et al. tested in their laboratory experiment whether exposure to short-term indoor water sounds could enhance the perception of traffic noise transmitted through ventilation openings [24]. Exposure conditions were obtained by combining indoor water sound levels (35.8–59.8 dBA) with levels of environmental (i.e., road traffic or railway) noises (43.0–62.1 dBA) that had been recorded next to windows in the living rooms of actual residences. Besides annoyance ratings, perception was assessed in terms of positive dimensions (e.g., pleasantness, calmness, naturalness). Results showed that noisiness, loudness, and annoyance of environmental noise tended to decrease when combined with water sounds, while pleasantness, calmness and naturalness increased, thus suggesting the potential of water noise to enhance the perception of indoor environmental noise. Negative and positive attributes were not always found to be inversely proportional: in another laboratory study by Yang and Moon, short-term exposure to water sounds was found to improve pleasantness of intrusive traffic noises without altering annoyance ratings [21]. In addition, intrusive noise perception did not depend on the exposure duration to indoor water sounds (immediate vs. 50 min) [21] but on water sound type [18] and on room temperature [18], as further discussed in the following. As regards water type, sounds of fountains using foam-jet nozzles significantly increased noisiness, loudness, and annoyance, compared to those using mushroom nozzles [18]. Type of sounds (babble, fan, music, water) affected acoustic comfort ratings in the multisensory laboratory experiment by Yang and Moon [19].
As already emerged from previous results, the type of sound and the nature of the sound source significantly influence the perception of indoor residential soundscape. Most commonly heard sounds in Warsaw residential areas were reported by Romanowska [38]. More than a half of the respondents reported hearing car sounds, dogs, wind sound, human talks and steps, children’s voices, bird twittering, sirens, sounds of slamming doors or gates, intercom sounds, car alarms, and motorcycle sounds. Alam et al. reported environmental noise sources (e.g., road and railway noise) being the major noise sources in Singapore (66% of respondents), followed by neighborhood noise sources (e.g., renovation, neighbor´s activities—16%) and community noise sources (e.g., food centers, playgrounds, waste trucks—10%) [50]. A cross-cultural comparison between the UK and Taiwan by Yu and Kang reported traffic noise being the most noticed noise source in Sheffield, while motorcycles, human talks, music and TV from neighbors were the most reported in Taipei [40].
Disturbance by community noise sources (e.g., playgrounds) in Singapore was found to be significantly correlated to the type of community noise source [50]. From the social survey in Warsaw, the most frequently identified unwanted sounds were found to be car traffic, car alarms and motorcycle sounds [38]. Sounds that should not be present, according to more than a half of the respondents, were technological and mechanical sounds such those related to construction works, car alarms, horn and transportation.
As regards sound type impact, noises from construction and human activity were reported to have the greatest effect on resident´s satisfaction with their acoustic environment in Hong Kong high-rise residential buildings [33]. Comparing different noise sources, Janssen et al. found that annoyance aroused by wind turbine noise was present at lower noise exposure levels, compared to industrial or transportation noises [46]. Road traffic noise was reported to be more annoying and disturbing when combined with construction noise than with ventilation noise [41].
Regarding sounds of preference in residential spaces, natural sounds (e.g., bird songs and water sounds) and human sounds (e.g., voices, step sounds) were reported as preferred in the study by Romanowska [38]. In the UK and Taiwan field study by Ju and Kang, ‘quiet’ was found to be highly preferred, followed by bird songs and water or insect sounds, depending on the country [40]. Among artificial sounds, music and church bells were the most preferred.
Urban context. Several characteristics of the area surrounding the place of living significantly affect the acoustic perception of the indoor environment. Source visibility from home was found to negatively affect annoyance by wind turbine noise [28,46]. In a large-scale cross-sectional study in airport areas, Babisch et al. showed that people that could see the street from their living room or bedroom were more annoyed by road traffic noise, while those having living or bedrooms shielded by obstacles were less [15]. Anyway, in the laboratory experiment by Aletta et al., perceived loudness and noise annoyance were not found to change according to the visibility of a chiller from a simulated living room [32].
The distance of buildings facing home and their reciprocal separating distance can significantly affect self-reported noise annoyance. The immersive virtual reality experiment by Chung et al. reported scenes rated as more oppressive, due to buildings closer to home and less spaced, to cause higher road traffic annoyance [16].
The socio-acoustic survey conducted by Dzhambov et al. in Plovdiv (Bulgaria) comprised objective measurements of greenspace, based on several GIS-derived metrics, and subjective measurements of self-reported greenspace availability [23]. People living in a greener neighborhood or perceiving it as greener were found to perceive lower noise annoyance. This result was confirmed by other studies [26,30,45,49]. In particular, Li at al. reported wetland and garden parks to be more efficient in reducing noise annoyance compared to grassy hills [49]. Similarly, the availability of a sea view was found to increase the likelihood of feeling less annoyed at home [45]. In general, the pleasantness of the visual environment was correlated to soundscape dimensions of pleasantness, eventfulness, and familiarity [29].
Satisfaction for the residential area, judged in terms of quietness of the house, of the surroundings and area attractiveness (e.g., appearance, recreational possibilities, neighbors) was reported to be negatively correlated to total noise annoyance, to annoyance due to aircraft and to road traffic noise [51]. Accordingly, residential dissatisfaction and the wish to change the residence were predictors of both perceived noise control and noise annoyance [26].
House-related factors. Aspects related to house configuration significantly affect indoor residential soundscape. Room location (facing the street vs. facing a quiet side) was found to be correlated to road traffic noise annoyance [15,26,48], but not to aircraft noise annoyance [15].
As reported by Amundsen et al., having received noise abatement measures at home considerably influenced self-reported road traffic noise annoyance [48]. Interviews conducted by Wågø et al. in energy-efficient houses reported that residents were not bothered by outdoor sounds, but in turn annoyance from indoor sounds was reported [31].
In the laboratory experiment by Lee and Griffin, compared to closed condition, window-open conditions were found to negatively affect annoyance caused by the passage of high-speed trains nearby [43].
Person-related factors. Indoor soundscape depends on several building user´s individual traits. Regarding age, no consensus could be found in the reviewed papers. Depending on study, younger people [16,39] or older people [45,46,49] were found to be highly annoyed by noise or no age effect could be found (e.g., [48]).
As far as gender-effects are concerned, higher noise annoyance in women was observed [28,51]. Anyway, other studies reported no significant effect (e.g., [48,49]). A gender effect was reported for the perception of the music stimulus, depending on sound level, in the laboratory study by Yang and Moon [19]: At 55 dBA women reported greater acoustic comfort than men, while at 75 dBA the opposite was observed. In another laboratory study on the perceptual assessment of combined indoor water sounds and environmental noise, Yang et al. reported women rating isolated water sounds as more pleasant, while no gender effect was observed in judging environmental noise in isolation [24]. When combined, compared to men, women were found to perceive water sounds as having a greater effect on annoyance, pleasantness and noisiness.
Among personal traits, noise sensitivity was reported to increase the probability of self-reported noise annoyance [25,28,43,45,46,48,49]. In the study by Oiamo et al. the opposite was observed—i.e., highly noise sensitive people had a lower likelihood of being annoyed by noise—and this was explained as depending on the environmental context: residents with lower traffic noise levels could have a lower tolerance to noise, thus reporting higher noise sensitivity [35]. Noise sensitivity was found to be related also to noise annoyance of residents living near Frankfurt Airport, in the socio-acoustic survey by Schreckenberg [51]. Anyway, in this case, noise sensitivity only contributed to the prediction of total noise annoyance and of annoyance due to the main noise source (i.e., aircrafts), not to the prediction of road traffic annoyance.
Individual mood while making the judgement (“good”/”bad”) was found to affect judgments of soundscape pleasantness, eventfulness and familiarity, while the degree of attention paid to the soundscape was found to be strongly correlated with eventfulness and with familiarity judgments [29].
Information processing style (i.e., rational vs. experiential-intuitive) was reported to be a factor influencing pleasantness judgments: participant with high experiential thinking style could perceive the acoustical environment as more pleasant [29].
A personal factor, called “audiovisual aptitude”, was proposed by Sun et al. as a factor modifying the impact of window views on noise annoyance in a living room [25]. Despite not being significant as a single effect due to the presence of more significant factors (i.e., SPL and noise sensitivity), a strong interaction was observed between audiovisual aptitude and visibility of green elements from windows on highway traffic noise annoyance [25].
The impact of perceived noise control as a factor mediating the association between road traffic noise, availability of environmental resources (access to a quiet site and to green space) and noise annoyance was investigated by Riedel et al. [26]. The mediating effect of perceived noise control, assessed through a Lykert-type scale on the agreement to the statement “feeling helpless in relation to indoor noise exposure at home”, was confirmed by the study.
Regarding health-status, contradicting results were found in the reviewed studies. People with better self-reported health status were reported to be less annoyed [45,49] or more annoyed by noise [16]. Differently, in the study by Schreckenberg et al., no correlation was found between self-reported physical and mental health and noise annoyance, except for sleep quality [51]. Human mental stress was reported by Xue et al. to impact on acoustic comfort of high-rise buildings, especially towards noise generated by construction and human activity [33].
In the study by Botelho et al., the general personal opinion towards wind turbines was found not to affect noise annoyance reported by residents [28]. However, respondents considering wind turbines inefficient were more likely to be annoyed by noise [28]. Perceived health risk associated to the noise source (i.e., traffic) was not found in the study by Oiamo et al. to predict noise annoyance [35].
Window closing habits and the adoption of other noise reducing solutions were reported to be associated to higher noise annoyance in the study by Babisch et al. [15]. Indeed, residents keeping living room or bedroom windows open were found to be less annoyed by road traffic and aircraft noise. According to the authors, this would be related to the fact that “not being able to keep the living room or bedroom windows open due to road traffic noise is a stressor by itself” [15]. Regarding window opening habits and noise perception, interviews reported by Wågø et al. provided further insight [31]. Some of the Norwegian interviewees reported window opening to be preferred, even in dwellings located in Oslo city center, in order as to maintain a contact with the outdoor environment. “You miss a lot of the smells and sounds when the windows are closed”, stated one of the interviewees [31].
Socio-economic factors. Several socio-economic factors have been regarded as possible confounding or mediating factors between noise exposure and the investigated perceptual outcome (e.g., annoyance).
Regarding the level of education, a clear trend cannot be found in the reviewed studies. Two of them found more educated people being likely to feel more annoyed by noise [16,49], two studies reported the opposite [22,45] while one study found no significant effect [48].
As regards the country of origin, no differences in annoyance were found between Korean and British residents towards noise produced by high-speed trains [43], while significant differences were found between people from Sheffield and Taipei, in terms both of annoyance by different noise sources and sound preference [40].
As far as income is concerned, depending on the study, people with higher income resulted being likely to feel more annoyed [16] or less annoyed [22] by noise, while no significant impact was found in other two studies [48,49]. Unemployed people were also found more likely to feel annoyed by traffic [22] or wind turbine [28] noise than their employed counterparts. Being single parents (family status) [22] or living as tenants (home ownership) [26] were associated with a higher noise annoyance, while no association was found between perceived noise control and home ownership [26].
Similarly, Schreckenberg et al. reported an overall positive association between several social problems (e.g., unemployment, economic situation, delinquency, aging, and density of population), annoyance caused by aircraft and road traffic noise and total noise annoyance [51].
As regards the type of housing, people living in terraced houses, apartment blocks or part of converted buildings were found to show a stronger road traffic noise annoyance increase compared to those living in detached or semi-detached houses [15]. In addition, road traffic annoyance was found to co-vary with the risk of hypertension: an increase in risk of hypertension at increasing road traffic and aircraft noise levels was reported in terraced houses, apartment blocks or part of converted buildings but not by subjects living in detached or semi-detached houses. In case of aircraft noise, the stronger annoyance increase at increasing aircraft noise level was observed for people living in detached or semi-detached houses [15].
The economic advantage from the sound source was reported to influence the perceptual outcome. Residents living in the proximity of wind turbines and benefitting economically from the noise source were found to be less likely to feel annoyed [28,46].
Situational factors. Situational circumstances were found to affect in several ways the perception of the acoustic environment.
According to Steffens et al., location while making the perceptual evaluations (e.g., home, work, on the way) significantly affected momentary judgments of pleasantness, eventfulness and familiarity [29]. Home environment was reported to be judged as more pleasant, familiar, and less eventful compared to work environments or to transition places. In the cross-sectional study by de Paiva Vianna et al. [37], the chance of reporting significant annoyance at home resulted to be the highest, followed by the work scenario and the leisure scenario. Differences were reported also from building to building, as in the case of soundscape quality variability in living rooms of different nursing homes [27].
Not only the real location but also the imaginary context was found to have a small effect on ratings collected from laboratory studies. In the laboratory study by Feldman and Carolus, participants were asked to evaluate fan sounds while imagining to be in different contexts and a minor context effect could be observed on the rating scores [20].
Besides location, the company of other people was found to significantly affect momentary judgments of pleasantness, eventfulness and familiarity [29]. Interacting with other was related to higher pleasantness at home, higher eventfulness and lower familiarity.
Task execution in laboratory tests or activity at hand while making the judgments were found to affect the perceptual outcomes. In the laboratory study by Aletta et al., the performance of a cognitive task was found to overall reduce the ratings of loudness and annoyance caused by a chiller in a living room [32]. The study by Xue et al. reported low activity intensity to make people more sensitive to the acoustic environment, especially when noise is generated by human activity [33].
The disturbance caused by major community noise sources resulted to be correlated with personal activities disturbed [50]. Soundscape pleasantness ratings were reported to be higher in people engaged in recreational, entertaining or home activities, compared to transportation or shopping activities [29]. When at home, recreational or entertainment activities were associated with higher pleasantness ratings, followed by work, study and other personal or home activities. As regards eventfulness, shopping, errand and transportation activities were associated with a more eventful soundscape compared to work, study and home activities. Regarding familiarity, when performing personal and home activities or work and study activities the acoustic environment was found to be rated as most familiar [29].
Kroesen et al. investigated the impact of the survey context on reported annoyance to aircraft noise [44]. The authors found that items preceding the question about aircraft noise annoyance in the survey design could influence the reported aircraft noise annoyance as well as the correlation trends between annoyance and other dimensions (noise sensitivity, individualism and egalitarianism).
The effect of exposure duration to noise sources, both in terms of length of residence or of time spent daily at home, has been often investigated in the reviewed studies. No trend towards higher road traffic annoyance with longer residence periods was found by Riedel et al. [26]. Interviews by Hamersma et al. reported that in several cases the perception of nuisance at home caused by an highway decreased with increased time of residence, as residents got used to it [30]. Differently, Babisch et al. found no habituation effect for people who had lived longer in their dwellings, that, on the contrary, showed a stronger increase of annoyance at increasing road traffic noise levels [15].
As regards the quantity of time spent at home, Nang Li et al. reported people with a longer stay at home (more or equal to 12 h a day) feeling less annoyed [45]. On the contrary, Babisch et al. found people spending less than 4 h in their living room during the day to show a smaller aircraft noise annoyance increase at increasing aircraft noise levels, compared to people staying longer at home [15].
Environmental factors. The perception of the acoustic environment also resulted to be related to environmental stimuli unrelated to the acoustic environment or to their perception.
In the laboratory experiment by Yang and Moon, the effect of recorded water sounds on traffic noise perception was found to be dependent on room temperature, thus revealing an interaction effect [18]. At lower room temperatures water sounds were found to increase noisiness, loudness and annoyance, while at thermal comfort conditions, they did not provide any improvement in traffic noise perception. The highest improvement was observed at warm conditions, where water sounds increased calmness, pleasantness, naturalness and acoustic comfort, without changing noisiness, loudness and annoyance ratings [18]. In another study by Yang and Moon, thermal conditions were found to affect acoustic comfort ratings [19]. Indeed, acoustic comfort was found to be greater at 25 °C compared to 20 or 30 °C.
Outdoor air pollution, measured in terms of NO2 levels, was found in the study by Oiamo et al. to affect reported noise annoyance at home [35]. Higher NO2 exposure was related to an increased likelihood to report high noise annoyance, but the impact depended on traffic noise level, thus suggesting an interaction effect. In detail, the effect of NO2 resulted stronger in people exposed to low levels of noise (DNL ≤ 45 dBA) than in people exposed to medium noise levels (55–65 dBA). As a result, the authors suggest that a multiplier reduction in noise annoyance can be achieved through a simultaneous reduction of NO2 levels and noise levels [35]. In the same study the authors reported odor annoyance to affect noise annoyance, and the effect to be dependent on noise exposure. Specifically, odor annoyance showed a higher effect on noise annoyance in areas exposed to road traffic noise compared to areas with negligible traffic levels [35].
In the study by Schreckenberg et al. environmental problems—evaluated through a series of items related to aircraft-related pollution, contaminations, air pollution, odors, water quality, nuclear power, and infrastructures—were found to be significantly correlated with the road traffic, aircraft and global noise annoyance [51].

4. Discussion

The definition of methods for acoustic environment and human response characterization and the identification of factors affecting the perceptual response of building occupants are foundational for the design of positive indoor soundscapes. The study has reviewed what has been done in the last 10 years in case of residential buildings. In the following paragraphs, results will be discussed with reference to the framework provided by ISO 12913–2 standard and to relevant soundscape literature.

4.1. Methods for Indoor Acoustic Environment, Perceptual and Physiological Response Characterization

Most of the case studies tended to be led by annoyance-related analyses aimed at finding exposure–response relationships, typically regarding traffic noise exposure. Exposure conditions in laboratory studies were mainly defined by equivalent levels, but psychoacoustic parameters were also included in models to better explain annoyance caused by single or multiple sound sources. Differently, exposure conditions in field studies were mainly described by outdoor daily-averaged levels, reflecting the general objective of reducing environmental noise exposure. The reviewed studies typically made use of monoaural measurements and binaural measurements were only employed for the preparation of auditory stimuli in some laboratory experiments.
Anyway, if the focus would be on soundscape assessment, according to standard ISO 12913-2, the description of the acoustic environment generated from all sound sources, as modified by the environment, would be required [8]. In the indoor case, this would suggest describing the indoor acoustic environment resulting from outdoor and indoor sources, as modified by the building (e.g., façade, ventilation devices, and indoor materials), in the conditions of subjective evaluation. Indoor measurements should thus be preferred to outdoor ones. During the design phase, outdoor measurements could be used for preliminary evaluations, properly filtered to take into account building façade attenuation and mixed with reference sounds from foreseen indoor sources, when available. Virtual reality technologies based on simulation models could certainly play a role in the predictive description of the acoustic environment. A set of acoustic and psychoacoustic parameters should be used for an enhanced description of the acoustic environment, and binaural measurements should be preferred, in order to “measure the acoustic environment as close as possible to the human auditory sensation” [8]. Measurements techniques belonging to noise-control engineering, building and room acoustics together with soundscape techniques derived and adapted from urban studies should be integrated within the indoor soundscape framework, in order to foster an objective characterization of the acoustic environment closely related to the perceptual response of building users.
Within the selected literature, only one study investigated the relation between sound characteristics (transportation noise exposure) and physiologic outcomes (blood pressure) [15], but generally physiologic measurements were not conducted. Physiological measures such as heart rate and skin conductance level are reported in the literature to reflect autonomic activity and to co-vary with self-reported levels of valence (i.e., pleasantness) and arousal, respectively [53]. Nevertheless, physiologic measures are not commonly used and neither included within soundscape data collection methods by ISO 12913-2 standard. Previous research revealed the importance in coupling the objective and subjective assessments of the acoustic environment with the recording of objective physiological responses [54,55,56], as this helps in better understanding the relationship between the physical acoustic environment and people´s perceptual and behavioral response to it. Physiological measurements should thus be included within soundscape assessment practices and further research efforts would be needed to investigate the association between sound stimuli, physiological responses, subjective assessments and behavioral reactions in the peculiar case of indoor environments.
As reported in Section 3.1, reviewed studies included laboratory tests and field campaigns based on socio-acoustic, social surveys or soundscape assessments. Subjective judgments about the indoor residential acoustic environment were gathered mainly through questionnaires and, in some cases, through interviews. Other soundscape data collection methods described by standard ISO 12913-2, such as soundwalks or non-participant behavioral observations [8], did not emerge within the context of this review. These methodologies are encountering growing consensus in urban soundscape studies, as they provide high ecological validity, often difficult to obtain in laboratory studies or in unattended large-scale socio-acoustic surveys. Attempts of application of the soundwalk methodology to indoor environments can be found in the literature [57,58], but they are still quite limited. Therefore, an interesting future direction of research that may be possibly worth exploring could be the application of such methods or their adaptation to the assessment of indoor soundscapes.
Objects of judgments, as described in Table 2, regarded the overall evaluation of the acoustic environment, sound awareness and noticeability, sound preference, soundscape dimensions, sound-quality descriptors and the perception of control over the acoustic environment. This latter aspect seems to be peculiar of indoor residential soundscapes, as emerged in the study by Riedel et al. [26]. As reported by the authors, “home is meant to be a place where residents ideally should be in control of their immediate environment, to pursue any activity without constraints from external stressors and uncontrollable circumstances, to feel comfortable, safe, and at ease” [26]. Research would be required to investigate the importance of the availability of control over the acoustic environment in the design of positive indoor soundscapes, as this already resulted to be beneficial for the perception of other environmental dimensions (e.g., in thermal comfort research).
Exploring the positive perceptual potential of sounds would require the evaluation of a variety of auditory sensations besides annoyance, in order to get a holistic understanding over the specific environment. Both positive and negative perceptual dimensions should be assessed, as they could act differently, such that the reduction of one dimension does not necessarily result in the increase of its antonym [18].

4.2. Factors Influencing the Acoustic Perception in Indoor Residential Buildings

As reported in Section 3.2., the analysis of the reviewed literature resulted in a number of factors able to mainly reduce noise annoyance and, in some cases, to even enhance positive perceptual outcomes. A framework of factors affecting indoor residential soundscapes has been proposed, as reported in Table 3.
Noise levels were generally reported to be positively related to self-reported noise annoyance. Anyway, besides sound level, aspects related to the spectral and temporal composition of sounds were found to affect perceptual outcomes. When investigating for the perception of multiple combined sounds, the type of sounds appeared to be a relevant factor in the determination of global perceptual outcomes. Specific sound types (i.e., natural sounds and sound from residential areas) were found to reduce annoyance caused by disturbing tonal noises, while water sounds were found to even enhance, in certain conditions, positive perceptual outcomes (e.g., pleasantness, calmness, naturalness) by environmental noises. Among sounds commonly heard in residential environments, certain were reported to elicit negative perceptions (e.g., construction, traffic noise) while others positive ones (e.g., natural sounds). When looking at masking opportunities, most of the studies have focused on the beneficial effect of added natural sounds (e.g., water sound) in moderating the perception of specific sounds of concern (e.g., transportation noise). Anyway, other sounds commonly generated inside or heard at the domestic unit may positively contribute to the perception of the overall indoor acoustic environment. With building facades more and more sound insulated, indoor-generated sounds emerge and may be potential cause of distress [31]. In this scenario, even humming, long-distance traffic sounds or indoor-generated ventilation sounds may provide positive perceptual outcomes. If further research evidence is needed to characterize the perception of combined sounds in indoor spaces, window opening habits already suggest the benefit of connecting to the outdoor environment, also aurally [31].
Factors unrelated to the acoustic environment can significantly affect sound evaluation in indoor residential buildings as well. They include urban context and building characteristics, personal traits, socio-economic features, situational circumstances and environmental conditions. Such factors should be considered as possible confounding variables in soundscape assessment.
Taken together these results suggests that a residential indoor acoustic environment with a proper mix of sound sources might result in positive perceptual outcomes, regardless its overall sound level. Annoyance reduction caused by masking effects may for instance outweigh the annoyance increase due to the increased noise level [47]. That is to say, “the quieter, the better” strategy may not always be the best solution in soundscape design [27]. This was confirmed also in the 2006 study by Berglund and Nilsson, where pleasantness in both indoor and outdoor residential buildings was found not to be well associated with sound level [57]. In their study, the quality of indoor soundscapes with closed windows at exposed sides of buildings was reported to be worse than outdoor soundscapes at shielded sides, despite sound levels being approximately 14 dB LAeq,30s lower, thus clearly invalidating “the mere use of sound level of soundscapes as indicator of soundscape quality” [57].
In any case, noise exposure has been proven to be a risk for health and well-being and sound levels in indoor residential buildings should not be raised above harmful levels. Recently, the WHO organization published the Environmental Noise Guidelines for the European Region, containing recommendations for protecting human health from exposure to noise generated by transportation (road traffic, railway, aircraft), wind turbines and leisure events [3]. The guideline provides outdoor noise limits for the different sound sources, based on established exposure–response relationships between the environmental noise (considered through Lden and Lnight indicators) and the proportion of people with a health outcome (i.e., increased risk of ischemic heart disease, hypertension, annoyance, sleep disturbance, impaired reading skills, and oral comprehension in children, hearing impairment and tinnitus, mental health and well-being) [3]. It should be noticed that among the different priority health outcomes, the prevalence of highly annoyed people is in almost all cases the one that present the lowest exposure level Lden for a fixed risk of adverse health effect considered as relevant (e.g., 10% absolute risk for annoyance). That is to say, in all cases except for leisure noise, Lden limits provided by the WHO guidelines are bounded by annoyance rather than by the emergence of other physical or mental diseases. This suggests that reducing noise annoyance would allow for higher noise levels both outdoor and consequently indoor, without harmful effects on other health outcomes. Furthermore, the creation of acoustic environments positively perceived by people has the potential not only to reduce health risks but also to induce positive-related health effects [10,59,60].

4.3. Limitations

Given the exploratory nature of the review, the recency of soundscape standards, the lack of clear guidance in case of indoor soundscape evaluation and the relatively broad field of research provided by the review questions, collected studies resulted in having substantial different measurements, study design and specific scopes. Laboratory experiments, cross-sectional studies, longitudinal studies and qualitative investigations were included in the reviewed literature, inherently with different strength of evidence within different study design. For this reason, it was not possible to quantify and compare effects of different factors on perceptual outcomes through statistical or quantitative meta-analysis and a qualitative approach to data analysis was pursued instead, as commonly done in this type of systematic research studies [10]. The aim has been not to provide quantitative indications for the design of positive indoor residential soundscapes but exploring soundscape assessment methods and factors of influence, posing the bases for further investigations.

5. Conclusions

This paper reported on (1) data collection methods for the acoustic assessment of residential buildings and on (2) factors affecting the perception of indoor acoustic environments. In order to answer to the two research questions, a systematic review has been conducted in accordance with the PRISMA guidelines. After the screening process, 37 articles were finally included. Given the differences in methodologic approaches, a qualitative analysis was performed.
As regards the first research question, the main conclusions are:
  • The reviewed studies typically made use of monoaural measurements and binaural ones were only employed for the preparation of auditory stimuli in laboratory experiments, thus not aligning with ISO 12913-2 recommendations;
  • Exposure conditions were mainly defined by outdoor equivalent levels, but psychoacoustic parameters were also included in annoyance models derived from laboratory studies;
  • Data collection methods employed to capture people´s perception over the indoor environment comprehended questionnaires and guided interviews, while the adoption of soundwalks and non-participatory behavioral studies in indoor soundscape studies did not emerge in the review literature and need further investigation;
  • Enquired categories comprehended the overall evaluation of the acoustic environment, sound awareness and noticeability, sound preference, soundscape dimensions, sound-quality descriptors, and the perception of control over the acoustic environment;
  • Exploring the positive perceptual potential of sounds would require the evaluation of a variety of auditory sensations besides annoyance, both in their positive and negative dimensions, as they can act differently;
  • Physiological measures were not commonly conducted.
As regards the second research question, the main conclusions are:
  • Besides sound level reduction, aspects related to the nature of sounds and to their spectral and temporal composition were found to affect perceptual outcomes, suggesting that “the quieter, the better” strategy may not always be the best solution;
  • Factors unrelated to the acoustic environment can significantly affect sound evaluation in indoor residential buildings, such as urban context and building characteristics, personal traits, socio-economic features, situational circumstances and environmental conditions.
Overall, large part of the selected literature reflected a general effort of minimizing noise annoyance by reducing noise exposure and, in particular, noise levels. Indeed, this dose-response approach is dominant in acoustic research, as evident also from the recent reviews on acoustic comfort evaluation in dwellings by Vardaxis et al. [61,62]. Sound is typically intended as unwanted (i.e., noise), causing negative perceptual outcomes (i.e., annoyance) and little is said about the possibility to use sounds as a resource for positive indoor soundscapes.
Results foster further research efforts to better understand how to design positive indoor soundscapes in residential buildings, beyond noise annoyance reduction. The integration of multiple indoor soundscape assessment methods may be applied to evaluate the efficacy in generating positive indoor environments, through triangulation. Techniques belonging to noise-control engineering, building and room acoustics together with soundscape techniques derived and adapted from urban studies should be integrated within the indoor soundscape framework, in order to foster a perceptual-driven acoustic design. Urban planning and building design should consider the impact they provide to the perception of the indoor acoustic environment, and a number of non-acoustic variables should be taken into account in the specific context of investigation to reduce possible confounding bias in soundscape evaluation. Furthermore, the interaction between acoustic and other environmental stimuli should be further investigated in terms of user perceptual response [63], and user-building interactions. Results encourage the integration of soundscape methodologies into the indoor environmental quality research, with the final goal to enhance user health and well-being.

Author Contributions

Conceptualization, all the authors; screening of items for the review, S.T.; methodology, all the authors; writing—original draft preparation, S.T.; writing—review, all the authors.

Funding

This research was funded by “Programma di cooperazione Interreg V-A Italia-Svizzera 2014–2020”, Project “QAES” ID n.613474.

Acknowledgments

The authors are grateful to Jack Harvie-Clark from the company Apex Acoustics Ltd. for the discussions that inspired part of this manuscript.

Conflicts of Interest

The authors declare no conflict of interest.

References

  1. ISO. BS ISO 12913-1:2014—Acoustics—Soundscape Part 1: Definition and Conceptual Framework; ISO: Geneva, Switzerland, 2014. [Google Scholar]
  2. European Parliament and Council. Directive 2002/49/EC of the European parliament and the Council of 25 June 2002 Relating to the Assessment and Management of Environmental Noise. Off. J. Eur. Communities L 2002, 189, 2002. [Google Scholar]
  3. WHO. Environmental Noise Guidelines for the European Region; WHO: Geneva, Switzerland, 2018. [Google Scholar]
  4. EEA. Noise in Europe 2014; EEA: København, Denmark, 2014.
  5. Kang, J.; Aletta, F.; Gjestland, T.T.; Brown, L.A.; Botteldooren, D.; Schulte-Fortkamp, B.; Lercher, P.; van Kamp, I.; Genuit, K.; Fiebig, A.; et al. Ten questions on the soundscapes of the built environment. Build. Environ. 2016, 108, 284–294. [Google Scholar] [CrossRef] [Green Version]
  6. Aletta, F.; Kang, J.; Axelsson, Ö. Soundscape descriptors and a conceptual framework for developing predictive soundscape models. Landsc. Urban Plan. 2016, 149, 65–74. [Google Scholar] [CrossRef]
  7. Aletta, F.; Astolfi, A. Soundscapes of buildings and built environments. Build. Acoust. 2018, 25, 195–197. [Google Scholar] [CrossRef] [Green Version]
  8. ISO. ISO TS 12913-2:2018—Acoustics—Soundscape Part 2: Data Collection and Reporting Requirements; ISO: Geneva, Switzerland, 2018. [Google Scholar]
  9. Axelsson, Ö.; Nilsson, M.E.; Berglund, B. A principal components model of soundscape perception. J. Acoust. Soc. Am. 2010, 128, 2836–2846. [Google Scholar] [CrossRef] [PubMed]
  10. Aletta, F.; Oberman, T.; Kang, J. Associations between positive health-related effects and soundscapes perceptual constructs: A systematic review. Int. J. Environ. Res. Public Health 2018, 15, 2392. [Google Scholar] [CrossRef]
  11. Axelsson, Ö. How to Measure Soundscape Quality. In Proceedings of the Euronoise 2015, Maastricht, The Netherlands, 31 May–3 June 2015; pp. 1477–1481. [Google Scholar]
  12. Liberati, A.; Altman, D.G.; Tetzlaff, J.; Mulrow, C.; Gøtzsche, P.C.; Ioannidis, J.P.A.; Clarke, M.; Devereaux, P.J.; Kleijnen, J.; Moher, D. The PRISMA statement for reporting systematic reviews and meta-analyses of studies that evaluate health care interventions: Explanation and elaboration. PLoS Med. 2009, 6, e1000100. [Google Scholar] [CrossRef]
  13. Moher, D.; Liberati, A.; Tetzlaff, J.; Altman, D.G. Preferred reporting items for systematic reviews and meta-analyses: The PRISMA statement. Ann. Intern. Med. 2009, 151, 264–269. [Google Scholar] [CrossRef]
  14. Tricco, A.C.; Lillie, E.; Zarin, W.; O’Brien, K.K.; Colquhoun, H.; Levac, D.; Moher, D.; Peters, M.D.J.; Horsley, T.; Weeks, L.; et al. PRISMA extension for scoping reviews (PRISMA-ScR): Checklist and explanation. Ann. Intern. Med. 2018, 169, 467–473. [Google Scholar] [CrossRef]
  15. Babisch, W.; Swart, W.; Houthuijs, D.; Selander, J.; Bluhm, G.; Pershagen, G.; Dimakopoulou, K.; Haralabidis, A.S.; Katsouyanni, K.; Davou, E.; et al. Exposure modifiers of the relationships of transportation noise with high blood pressure and noise annoyance. J. Acoust. Soc. Am. 2012, 132, 3788–3808. [Google Scholar] [CrossRef]
  16. Chung, W.K.; Chau, C.K.; Masullo, M.; Pascale, A. Modelling perceived oppressiveness and noise annoyance responses to window views of densely packed residential high-rise environments. Build. Environ. 2019, 157, 127–138. [Google Scholar] [CrossRef]
  17. Paiva, K.M.; Cardoso, M.R.A.; Zannin, P.H.T. Exposure to road traffic noise: Annoyance, perception and associated factors among Brazil’s adult population. Sci. Total Environ. 2019, 650, 978–986. [Google Scholar] [CrossRef]
  18. Yang, W.; Moon, H.J. Effects of recorded water sounds on intrusive traffic noise perception under three indoor temperatures. Appl. Acoust. 2019, 145, 234–244. [Google Scholar] [CrossRef]
  19. Yang, W.; Moon, H.J. Combined effects of acoustic, thermal, and illumination conditions on the comfort of discrete senses and overall indoor environment. Build. Environ. 2019, 148, 623–633. [Google Scholar] [CrossRef]
  20. Feldmann, C.; Carolus, T. Context Effect in Fan Sound Evaluation by Jury Tests Using the Method of the Semantic Differential. Acta Acust. United Acust. 2019, 105, 123–129. [Google Scholar] [CrossRef]
  21. Yang, W.; Moon, H.J. Effects of indoor water sounds on intrusive noise perception and speech recognition in rooms. Build. Serv. Eng. Res. Technol. 2018, 39, 637–651. [Google Scholar] [CrossRef]
  22. Schüle, S.A.; Nanninga, S.; Dreger, S.; Bolte, G. Relations between Objective and Perceived Built Environments and the Modifying Role of Individual Socioeconomic Position. A Cross-Sectional Study on Traffic Noise and Urban Green Space in a Large German City. Int. J. Environ. Res. Public Health 2018, 15, 1562. [Google Scholar] [CrossRef]
  23. Dzhambov, A.M.; Markevych, I.; Tilov, B.; Arabadzhiev, Z.; Stoyanov, D.; Gatseva, P.; Dimitrova, D.D. Lower Noise Annoyance Associated with GIS-Derived Greenspace: Pathways through Perceived Greenspace and Residential Noise. Int. J. Environ. Res. Public Health 2018, 15, 1533. [Google Scholar] [CrossRef]
  24. Yang, W.; Moon, H.J.; Kim, M.J. Perceptual assessment of indoor water sounds over environmental noise through windows. Appl. Acoust. 2018, 135, 60–69. [Google Scholar] [CrossRef]
  25. Sun, K.; Sanchez, G.M.E.; De Coensel, B.; Miller, Z.D. Personal Audiovisual Aptitude Influences the Interaction Between Landscape and Soundscape Appraisal. Front. Psychol. 2018, 9, 1–15. [Google Scholar] [CrossRef]
  26. Riedel, N.; Köckler, H.; Scheiner, J.; van Kamp, I.; Erbel, R.; Loerbroks, A.; Claßen, T.; Bolte, G. Home as a place of noise control for the elderly? A cross-sectional study on potential mediating effects and associations between road traffic noise exposure, access to a quiet side, dwelling-related green and noise annoyance. Int. J. Environ. Res. Public Health 2018, 15, 1036. [Google Scholar] [CrossRef]
  27. Aletta, F.; Botteldooren, D.; Thomas, P.; Vander Mynsbrugge, T.; De Vriendt, P.; Van de Velde, D.; Devos, P. Monitoring Sound Levels and Soundscape Quality in the Living Rooms of Nursing Homes: A Case Study in Flanders (Belgium). Appl. Sci. 2017, 7, 874. [Google Scholar] [CrossRef]
  28. Botelho, A.; Arezes, P.; Bernardo, C.; Dias, H.; Costa Pinto, L.M. Effect of wind farm noise on local residents’ decision to adopt mitigation measures. Int. J. Environ. Res. Public Health 2017, 14, 753. [Google Scholar] [CrossRef]
  29. Steffens, J.; Steele, D.; Guastavino, C. Situational and person-related factors influencing momentary and retrospective soundscape evaluations in day-to-day life. J. Acoust. Soc. Am. 2017, 141, 1414–1425. [Google Scholar] [CrossRef] [Green Version]
  30. Hamersma, M.; Heinen, E.; Tillema, T.; Arts, J. The development of highway nuisance perception: Experiences of residents along the Southern Ring Road in Groningen, The Netherlands. Land Use Policy 2017, 61, 553–563. [Google Scholar] [CrossRef]
  31. Wågø, S.; Hauge, B.; Støa, E. Between indoor and outdoor: Norwegian perceptions of well-being in energy-efficient housing. J. Archit. Plan. Res. 2016, 33, 329–346. [Google Scholar]
  32. Aletta, F.; Masullo, M.; Maffei, L.; Kang, J. The effect of vision on the perception of the noise produced by a chiller in a common living environment. Noise Control Eng. J. 2016, 64, 363–378. [Google Scholar] [CrossRef]
  33. Xue, P.; Mak, C.M.; Ai, Z.T. A structured approach to overall environmental satisfaction in high-rise residential buildings. Energy Build. 2016, 116, 181–189. [Google Scholar] [CrossRef]
  34. Morel, J.; Marquis-Favre, C.; Gille, L.A. Noise annoyance assessment of various urban road vehicle pass-by noises in isolation and combined with industrial noise: A laboratory study. Appl. Acoust. 2016, 101, 47–57. [Google Scholar] [CrossRef]
  35. Oiamo, T.H.; Baxter, J.; Grgicak-Mannion, A.; Xu, X.; Luginaah, I.N. Place effects on noise annoyance: Cumulative exposures, odour annoyance and noise sensitivity as mediators of environmental context. Atmos. Environ. 2015, 116, 183–193. [Google Scholar] [CrossRef]
  36. Lambert, J.; Champelovier, P.; Blanchet, R.; Lavandier, C.; Terroir, J.; Márki, F.; Griefahn, B.; Iemma, U.; Janssens, K.; Bisping, R. Human response to simulated airport noise scenarios in home-like environments. Appl. Acoust. 2015, 90, 116–125. [Google Scholar] [CrossRef]
  37. de Paiva Vianna, K.M.; Cardoso, M.R.A.; Rodrigues, R.M.C. Noise pollution and annoyance: An urban soundscapes study. Noise Health 2015, 17, 125. [Google Scholar] [CrossRef] [PubMed]
  38. Romanowska, M. The Warsaw soundscape—Structure and specifics. Misc. Geogr. 2014, 18, 5–16. [Google Scholar] [CrossRef]
  39. Daruis, D.D.I.; Awang, N.W.; Deros, B.M.; Ismail, A.R. The effects of night-time road traffic noise on discomfort - A case study in Dungun, Terengganu, Malaysia. Iran. J. Public Health 2014, 43, 58–66. [Google Scholar]
  40. Yu, C.J.; Kang, J. Soundscape in the sustainable living environment: A cross-cultural comparison between the UK and Taiwan. Sci. Total Environ. 2014, 482–483, 501–509. [Google Scholar] [CrossRef] [PubMed]
  41. Lee, P.J.; Jeon, J.Y. Relating traffic, construction, and ventilation noise to cognitive performances and subjective perceptions. J. Acoust. Soc. Am. 2013, 134, 2765–2772. [Google Scholar] [CrossRef] [PubMed]
  42. Terroir, J.; De Coensel, B.; Botteldooren, D.; Lavandier, C. Activity Interference Caused by Traffic Noise: Experimental Determination and Modeling of the Number of Noticed Sound Events. Acta Acust. United Acust. 2013, 99, 389–398. [Google Scholar] [CrossRef]
  43. Jik Lee, P.; Griffin, M.J. Combined effect of noise and vibration produced by high-speed trains on annoyance in buildings. J. Acoust. Soc. Am. 2013, 133, 2126–2135. [Google Scholar] [CrossRef] [Green Version]
  44. Kroesen, M.; Molin, E.J.E.; van Wee, B. Measuring subjective response to aircraft noise: The effects of survey context. J. Acoust. Soc. Am. 2013, 133, 238–246. [Google Scholar] [CrossRef] [Green Version]
  45. Nang Li, H.; Kwan Chau, C.; Sze Tse, M.; Tang, S.K. On the study of the effects of sea views, greenery views and personal characteristics on noise annoyance perception at homes. J. Acoust. Soc. Am. 2012, 131, 2131–2140. [Google Scholar] [CrossRef] [Green Version]
  46. Janssen, S.A.; Vos, H.; Eisses, A.R.; Pedersen, E. A comparison between exposure-response relationships for wind turbine annoyance and annoyance due to other noise sources. J. Acoust. Soc. Am. 2011, 130, 3746–3753. [Google Scholar] [CrossRef] [PubMed] [Green Version]
  47. Alayrac, M.; Marquis-Favre, C.; Viollon, S. Total annoyance from an industrial noise source with a main spectral component combined with a background noise. J. Acoust. Soc. Am. 2011, 130, 189–199. [Google Scholar] [CrossRef] [PubMed]
  48. Amundsen, A.H.; Klæboe, R.; Aasvang, G.M. The Norwegian Façade Insulation Study: The efficacy of façade insulation in reducing noise annoyance due to road traffic. J. Acoust. Soc. Am. 2011, 129, 1381–1389. [Google Scholar] [CrossRef] [PubMed]
  49. Li, H.N.; Chau, C.K.; Tang, S.K. Can surrounding greenery reduce noise annoyance at home? Sci. Total Environ. 2010, 408, 4376–4384. [Google Scholar] [CrossRef] [PubMed]
  50. Alam, S.M.; Eang, L.S.; Tan, A.; Tiong, T.S. An investigation of community noise in high-rise residential environments. J. Acoust. Soc. Am. 2010, 127, 3511–3518. [Google Scholar] [CrossRef] [PubMed]
  51. Schreckenberg, D.; Griefahn, B.; Meis, M. The associations between noise sensitivity, reported physical and mental health, perceived environmental quality, and noise annoyance. Noise Health 2010, 12, 7. [Google Scholar] [CrossRef] [PubMed]
  52. ISO. ISO/TS 15666:2003-Acoustics-Assessment of Noise Annoyance by Means of Social and Socio-Acoustic Surveys; ISO: Geneva, Switzerland, 2003. [Google Scholar]
  53. Bradley, M.M.; Lang, P.J. Affective reactions to acoustic stimuli. Psychophysiology 2000, 37, 204–215. [Google Scholar] [CrossRef] [PubMed]
  54. Irwin, A.; Hall, D.A.; Peters, A.; Plack, C.J. Listening to urban soundscapes: Physiological validity of perceptual dimensions. Psychophysiology 2011, 48, 258–268. [Google Scholar] [CrossRef] [PubMed]
  55. Hume, K.; Ahtamad, M. Physiological responses to and subjective estimates of soundscape elements. Appl. Acoust. 2013, 74, 275–281. [Google Scholar] [CrossRef]
  56. Erfanian, M.; Mitchell, A.; Kang, J.; Aletta, F. The Psychophysiological Implications of Soundscape: A Systematic Review of Empirical Literature and a Research Agenda. Int. J. Environ. Res. Public Health 2019, 16, 3533. [Google Scholar] [CrossRef]
  57. Berglund, B.; Nilsson, M.E. On a tool for measuring soundscape quality in urban residential areas. Acta Acust. United Acust. 2006, 92, 938–944. [Google Scholar]
  58. Dokmeci, P.N.; Kang, J. Indoor soundscape analysis of enclosed public and commercial spaces with soundwalk method. In Proceedings of the 41st International Congress and Exposition on Noise Control Engineering 2012, INTER-NOISE 2012, New York, NY, USA, 19–22 August 2012; Volume 8. [Google Scholar]
  59. Shu, S.; Ma, H. Restorative Effects of Classroom Soundscapes on Children’s Cognitive Performance. Int. J. Environ. Res. Public Health 2019, 16, 293. [Google Scholar] [CrossRef] [PubMed]
  60. Ma, H.; Shu, S. An Experimental Study: The Restorative Effect of Soundscape Elements in a Simulated Open-Plan Office. Acta Acust. United Acust. 2018, 104, 106–115. [Google Scholar] [CrossRef]
  61. Vardaxis, N.G.; Bard, D.; Persson Waye, K. Review of acoustic comfort evaluation in dwellings—part I: Associations of acoustic field data to subjective responses from building surveys. Build. Acoust. 2018, 25, 151–170. [Google Scholar] [CrossRef]
  62. Vardaxis, N.G.; Bard, D. Review of acoustic comfort evaluation in dwellings: Part III—airborne sound data associated with subjective responses in laboratory tests. Build. Acoust. 2018, 25, 289–305. [Google Scholar] [CrossRef]
  63. Torresin, S.; Pernigotto, G.; Cappelletti, F.; Gasparella, A. Combined effects of environmental factors on human perception and objective performance: A review of experimental laboratory works. Indoor Air 2018, 28, 525–538. [Google Scholar] [CrossRef] [PubMed]
Figure 1. Flow diagram showing the number of studies screened, assessed for eligibility, and included in the review [12].
Sustainability 11 05290 g001
Table 1. List of studies included in the systematic review in chronological order of publication. Studies often included several sound levels and metrics to define exposure conditions or to predict a perceptual outcome. When appropriate, a level range is provided (for further information refer to the original study).
ReferenceStudy DesignNSound TypeSound MeasureSoundscape Data Collection MethodPerceptual AttributesCategory of Factors Influencing Acoustic Perception
Chung et al. [16]Laboratory46Road traffic55–65 dBA (SPL)QuestionnaireAnnoyanceAcoustic, urban context, person-related, socio-economic
Paiva et al. [17]Socio-acoustic survey225Road traffic64.0–73.1 dBA 1 (LAeq-20h)QuestionnaireAnnoyance, Quietness, Noisiness, noise noticeabilityAcoustic
Yang and Moon [18]Laboratory54Road traffic, water35–60 dBA (LAeq-25s)QuestionnaireAnnoyance, noisiness, loudness, pleasantness, calmness, naturalness, acoustic comfortAcoustic, environmental
Yang and Moon [19]Laboratory60Babble, fan, music, water45–75 dBA (SPL)QuestionnaireAcoustic comfortAcoustic, person-related, environmental
Feldmann and Carolus [20]Laboratory20Fan65 dB (SPL)QuestionnaireSemantic scale for fan soundsSituational
Yang and Moon [21]Laboratory54Road traffic, water40–60 dBA (LAeq)QuestionnaireAnnoyance, pleasantnessAcoustic
Schüle et al. [22]Socio-acoustic survey556Road traffic53.32 dB 2 (Lden)QuestionnaireAnnoyanceAcoustic, socio-economic
Dzhambov et al. [23]Socio-acoustic survey720Traffic, neighbor(Lday,7–19hr)QuestionnaireAnnoyanceAcoustic, urban context
Yang et al. [24]Laboratory40Road traffic, water, railway35.8–62.1 (LAeq-25s)QuestionnaireNoisiness, loudness, annoyance, pleasantness, calmness, naturalnessAcoustic, person-related
Sun et al. [25]Laboratory68Road traffic45–60 dBA (SPL)QuestionnaireAnnoyanceAcoustic, person-related
Riedel et al. [26]Socio-acoustic survey1812Road traffic(Lden)QuestionnaireAnnoyance, perceived noise controlAcoustic, urban context, house-related, person-related, socio-economic
Aletta et al. [27]Soundscape assessment-Installation, operational, electronic, environmental, human, pets sounds (LAeq-15min) (L15min)QuestionnaireOverall quality, dominance, annoyance, appropriateness, eventfulness, uneventfulness, vibrancy, monotony, chaos, pleasantness, calmness, safety, intimacy Situational
Botelho et al. [28]Socio-acoustic survey80Wind turbine42.6–48 dB 2 (LAeq,5min)QuestionnaireAnnoyance, noticeability, semantic scale for wind turbine soundsAcoustic, urban context, person-related, socio-economic
Steffens et al. [29]Social survey32--QuestionnairePleasantness, eventfulness, familiarity, noticeabilityUrban context, person-related, situational
Hamersma et al. [30]Social survey38Road traffic-InterviewNuisanceUrban context, situational
Wågø et al. [31]Social survey33--InterviewWell-beingSituational, house-related, person-related
Aletta et al. [32]Laboratory26Chiller36.2–46.0 dB (LAeq-20s)QuestionnaireAnnoyance, loudnessAcoustic, urban context, situational
Xue et al. [33]Social survey482Road traffic, construction, human-QuestionnaireSatisfactionAcoustic, person-related, situational
Morel et al. 3 [34]Laboratory30Road traffic50–62 dB (LAeq), N, N15–18, F, ΔN-, Rmax, Fmax, LMFQuestionnaireAnnoyanceAcoustic
Morel et al. 3 [34]Laboratory30Road traffic, industrial noise47–59 dB (LAeq), LT, NT, |LRN − LIN|, LRN, LIN, NRN, NIN, LtQuestionnaireAnnoyanceAcoustic
Oiamo et al. [35]Socio-acoustic survey610Road traffic53.3 dB 2 (DNL), Leq,Day, Leq,NightQuestionnaireAnnoyanceAcoustic, person-related, environmental
Lambert et al. [36]Laboratory142Aircraft65.0–74.1 dB (LAeq-1s,max)QuestionnaireAnnoyance, semantic space for aircraft soundsAcoustic
de Paiva Vianna et al. [37]Socio-acoustic survey60Road traffic, neighbor52.6–67.5 dBA (Lden), 48,5–72,8 (Ln)QuestionnaireAnnoyance, noticeabilityAcoustic, situational
Romanowska [38]Social survey113Road traffic, human, nature-QuestionnaireNoticeability, preferenceAcoustic
Daruis et al. [39]Socio-acoustic survey114Road traffic51.0–66.4 (LAeq-2hr), 62.9–85.8 (LMAX), 55.8–67.4 (L10), 37.4–54.1 (L90)QuestionnaireAnnoyancePerson-related
Yu and Kang [40]Socio-acoustic survey80, 200, 300Road traffic, human -QuestionnaireAnnoyance, noticeability, sound preference Acoustic, socio-economic
Lee and Jeon [41]Laboratory20Road traffic, construction, ventilation30.0–50.0 dB (LAeq), L, R QuestionnaireAnnoyance, disturbanceAcoustic
Terroir et al. [42]Laboratory160Railway52.5 dB (LAeq-1hr)QuestionnaireNumber of noticed sound eventsAcoustic
Lee and Griffin [43]Laboratory20Railway80.5–96.0 (LAeq)QuestionnaireAnnoyanceAcoustic, house-related, person-related
Kroesen et al. [44]Social survey293Aircraft-QuestionnaireAnnoyanceSituational
Babisch et al. [15]Socio-acoustic survey4861Aircraft noise, road trafficLden, LAeq-24hrQuestionnaireAnnoyanceAcoustic, urban context, house-related, person-related, socio-economic, situational
Nang Li et al. [45]Socio-acoustic survey861Road traffic55.4–69.5 dB (LAeq-30min)QuestionnaireAnnoyanceAcoustic, urban context, person-related, socio-economic, situational
Janssen et al. [46]Socio-acoustic survey1820Wind turbine39.0 dBA (Lden)QuestionnaireAnnoyanceAcoustic, urban context, person-related, socio-economic
Alayrac et al. [47]Laboratory30Industrial, nature, road traffic, residential area, city, construction37.5–51 dBA (SPL), IA,1/3oct,100 Hz, Ispec, LN, Nr, N(4–9Barks)– N(2–3Barks)QuestionnaireAnnoyanceAcoustic
Amundsen et al. [48]Socio-acoustic survey415Road traffic39–43 dB (LAeq,24 h)QuestionnaireAnnoyanceAcoustic, house-related, person-related
Li et al. [49]Socio-acoustic survey688Road traffic45.6–72.0 dB (LAeq)QuestionnaireAnnoyanceAcoustic, urban context, person-related, socio-economic
Alam et al. [50]Socio-acoustic survey522Road traffic, neighbor, communityLAeq-5min, LAeq-1minQuestionnaireNoisiness, noticeability, disturbanceAcoustic, situational
Schreckenberg et al. [51]Socio-acoustic survey190Road traffic, aircraft35–69 dB (LAeq-16hr)QuestionnaireAnnoyanceAcoustic, urban context, person-related, socio-economic, environmental
1 Mean Leq in areas exposed and non-exposed to traffic noise; 2 Mean values; 3 Reference [34] included two separate studies and they are treated as separate items.
Table 2. Perceptual items enquired in the reviewed studies grouped according to the category of judgment.
Perceptual CategoriesEnquired Items
Overall acoustic evaluationAcoustic comfort, well-being, acoustic quality, satisfaction
Sound noticeability and awarenessNoticeability, perceived or dominant sounds/sound events, noise detection
Sound preferencePreferred sounds
Soundscape descriptorsAnnoyance or disturbance or nuisance, in general or caused by specific sources or related to specific activities Annoying factors related to specific sound sources
Quietness, noisiness
Appropriateness
Eventfulness, uneventfulness
Vibrancy, monotony
Chaos, calmness
Pleasantness
Safety
Familiarity
Intimacy
Sound descriptorsLoudness
Semantic spaces for wind turbines, fan or aircraft sounds
ControlPerceived noise control
Table 3. Factors and categories of factors influencing the acoustic perception in indoor residential buildings.
Category of FactorsFactors Influencing the Acoustic Perception
AcousticSound level, spectral content, roughness, loudness, fluctuation strength, number of sound events, source distance, sound dominance, duration of sound events, intermittency, frequency of annoyance, combination of multiple sources, sound type
Urban contextPresence of greenspace, sea view at home, access to a quiet side, source visibility, visual pleasantness and other visual aspects, building spacing and separation distance between buildings, satisfaction for the residential area, wish to change the residence
House-relatedRoom location, building insulation, window opening position
Person-relatedAge, gender, noise sensitivity, physical and mental health status, personal audiovisual aptitude, perceived noise control, opinion towards the noise source, perception of risk associated to sound source, consideration of the importance of noise, attention paid to the soundscape, mood, thinking style, window closing habits and noise related remedies
Socio-economicLevel of education, income, family status, family unemployment, home ownership, economic benefit from noise source, type of housing, country
SituationalContext in laboratory studies, survey context, location, activity or task, company of other people, period of day, length of residence
EnvironmentalTemperature, environmental pollution, odor annoyance

