Agent-Based Simulation Model for Evaluating Urban Freight Policy to E-Commerce
by
 , ,
, ,
Roberta Alves
1,2,* ,
,
Renato da Silva Lima
2 ,
,
David Custódio de Sena
3,
Alexandre Ferreira de Pinho
2 and
José Holguín-Veras
4 1
Mechanical Department, Federal University of São João del Rei, Minas Gerais 36307-353, Brazil
2
Industrial Engineering and Management Institute, Federal University of Itajubá, Minas Gerais 37500-903, Brazil
3
Environmental Sciences and Engineering Department, Federal Rural University of Semi-Arid, Rio Grande do Norte 59625-900, Brazil
4
Department of Civil and Environmental Engineering, Rensselaer Polytechnic Institute, Troy, NY 12180, USA
*
Author to whom correspondence should be addressed.
Sustainability 2019, 11(15), 4020; https://doi.org/10.3390/su11154020
Submission received: 9 July 2019
/
Revised: 18 July 2019
/
Accepted: 23 July 2019
/
Published: 25 July 2019
(This article belongs to the Special Issue Sustainable Urban Logistics)
Abstract
:This study aims to assess delivery lockers as a last-mile solution, considering the behavior and interaction among e-commerce stakeholders. In Brazil, a large portion of deliveries are attended home. This results in a large number of failed deliveries and redelivery attempts, which can reach up to three delivery attempts. Delivery lockers (DL) represent a solution to reduce the number of re-deliveries and consolidate the delivery of goods. The implementation of DL and the exclusion of the third delivery attempt are evaluated in this study via an agent-based simulation model (ABSM) in the city of Belo Horizonte, Brazil. Four scenarios were simulated by varying delivery locker implementation and the exclusion of the third attempts, which allowed comparable results to be obtained for each agent, in terms of gains and operational and external costs (emission, noise, and congestion). The scenario that most closely resembles the current situation was the one that presented the worst results. The implementation of the lockers brings improvements to this scenario in terms of reducing re-deliveries and distances traveled by trucks. When the possibility of three delivery attempts is excluded, the benefits are even greater. The deployment of lockers also enables carriers to reduce the number of trucks required to make deliveries, thereby increasing their profits.
1. Introduction
Brazilian e-commerce underwent increasing growth rates in recent years. While traditional retail sales grew by 2.3% in 2018 compared to 2017, e-commerce grew by 15% with a revenue equivalent of about $ 20 billion [1]. As the growth of online shopping increased, there was a greater demand for individual deliveries, in turn implying a larger number of cargo vehicles circulating in urban areas. Thus, the challenges faced in the distribution of goods also increased [2,3,4], with a direct effect on logistics systems in urban areas, where congestion and accessibility are crucial factors [4].
Despite the fact that these vehicles contribute significantly to congestion and CO2 emissions, they play an essential part in urban economies by delivering goods to commercial establishments, which meet consumption demands of the population [5,6,7]. Within this context, and based on the city logistics approach, several studies established policies and models that sought to reduce the unintended consequences caused by urban freight, such as congestion, lack of parking spaces, lack of mobility, environmental and noise pollution, and accidents, among others [8].
In the case of the business-to-consumer (B2C) market, attended home deliveries (AHD) are generally preferred by the consumer to e-commerce. This type of delivery is the most problematic solution in terms of service and programming costs [5]. In this modality, the carriers make several stops during a trip and depend on the presence of a person in the specified place to complete the delivery [9]. Song et al. [10] found in their research that 25% of deliveries are not performed on the first attempt.
E-commerce deliveries in Brazilian cities almost completely based on attended home deliveries, as is the case in most Latin American cities. That is, they need a person present at the address (usually home or work) to receive the goods. In most European countries and the United States (US), when there is no one at the address to receive the goods, they are left without on-street supervision. According to Oliveira et al. [11], deliveries without on-street supervision are not yet viable in Brazil as they represent “a temptation for thieves”. This situation, combined with the difficulty of stipulating delivery windows for customers, contributes to increasing faulty deliveries [3].
AHD deliveries present drawbacks for the consumer who needs flexibility and for the carrier who seeks to optimize their distribution of goods. Urban freight (UF) policies that offer an alternative to this type of delivery and minimize the inconveniences caused by it were the subject of several research studies [12,13,14,15]. These authors suggested the consolidation of last-mile deliveries as a solution to this problem. In this context, delivery lockers (DL) stand out as a viable solution, which were already implemented in several countries [5,13]; these automated lockers allow consumers to receive and/or return their online purchases.
According to Arnold et al. [16], using DLs can help carriers achieve time and fuel savings for both first deliveries and failed deliveries as it would not be necessary to return to the consumer’s address for a second or third delivery attempt. In this scenario, DLs are an attractive solution to the Brazilian situation since they can reduce failed deliveries; moreover, Oliveira et al. [11] stated that they bring added value in their security.
However, Taniguchi et al. [17] stated that, before implementing any urban freight policy, one must understand the behavior (actions and objectives) of the stakeholders involved in urban freight (retailers, carriers, shippers, customers, policy-makers) and the interaction between them. This study was successfully carried out by using agent-based simulation models (ABSM) [18,19,20,21]. In this paper, the stakeholders involved in urban logistics were modeled as agents capable of making decisions and interacting with each other and with the environment, when faced with a predetermined situation [17,22]. However, most ABSMs deal with policies that seek to restrict vehicular traffic in some way, without analyzing the impacts of applying DLs to the urban environment through ABSM.
Therefore, this study aims to assess DL as a last-mile solution, considering the behavior and interaction among e-commerce stakeholders. The simulations were conducted in the central region of Belo Horizonte, Brazil, from scenarios that seek to alternate measures to reduce failed deliveries. The agent-based model was based on the individual objectives and behaviors of stakeholders in urban freight transport, which were modeled as agents, which allowed comparable results to be obtained for each agent, in terms of gains and operational and external costs (emission, noise, and congestion).
This paper is organized as follows: Section 2 presents a literature review, where the main references on the subject are presented; Section 3 describes research method adopted; Section 4 details the application of this method; finally, Section 5 and Section 6 provide the analysis of the main results and the conclusions.
2. Background
2.1. E-Commerce and Urban Freight Transport
Online retailers and carriers take several steps in order to lower delivery costs and meet customer expectations. In addition to reducing costs, many of these initiatives result in greater efficiency in delivery operations and, therefore, also lead to reduced traffic and limited social and environmental impacts [13]. Online retailers are starting to offer alternatives to ration last-mile delivery, many of them based on deliveries that are not sent to home address [2]. These alternative systems allow more packages to be delivered to a smaller number of locations without the risk of delivery failure, which leads to a reduction in the unit cost of delivery. Among these alternatives [13,23], we have the delivery lockers. These are a kind of collection-and-delivery point (CDP) which operate without supervision. They are automated lockers operated from an electronic code, where carriers use this code to inform customers about the status of their orders [13].
Delivery lockers are the focus of this study, especially since they have an ample operating window. They have other advantages too, such as (i) the customer does not have to stay at home all day waiting on the delivery of the merchandise; (ii) there is a high customer satisfaction rate; (iii) they increase the attractiveness of the places where they are installed, among others [2,24].
According to Russo and Comi [25] ], it is expected that the DL contributes in terms of the following:
- Economic sustainability, reducing the distance and travel time;
- Social sustainability, reducing the interference between the actors of the urban mobility, diminishing the road accidents, and enhancing the habitability of the city;
- Environmental sustainability, which can be treated in terms of reduction in the emissions and noise caused by the operation.
Despite the numerous advantages, when poorly planned, this system can generate extra trips from customers in their private vehicles to get their orders. To minimize this problem, Morganti et al. [2] emphasized that adequate location is important for the success of the system since it can facilitate sequenced trips, i.e., the client can include a trip to the CDP on his or her daily route [12,15].
In recent years, several companies were successful with the implantation of DLs. Examples of this are ByBox (United Kingdom), Givver (The Netherlands), Inpost (Poland), DHL Packstations (Germany), POPStation (Singapore), and HiveBox (China) [2,13,15]. This system continues to grow, as seen in 2014 when DHL’s Packstation had a network of 2650 lockers in Germany [2]. Currently, this number is already greater than 3000 [26]. In the US, automatic lockers were installed by Amazon, boasting more than 2000 points distributed in 50 cities [27].
Most of the studies that investigate this alternative for the last mile are concerned with (1) conceptualizing the theme [3,28]; (2) characterizing the demand for these services [11,13,15,29]; (3) developing mathematical methods and models to analyze the potential savings in the use of collection points [9,12,14,16].
Arnold et al. [16] studied travel resulting from online shopping in the city of Antwerp. They simulated the current scenario, which deals with home deliveries by way of vans and three more scenarios, which include the use of CDPs, the use of cargo bikes, and a hybrid system. The hybrid system was identified as the scenario that would bring better results in terms of operational and external costs. The simulation performed in their study was static and solved by the vehicle routing problem. This same approach was used by Wang et al. [14] by simulating the three types of delivery (AHD, pick-up points, and delivery lockers) in scenarios that vary the density of installed systems and population. The authors indicate the use of DL for high population density and large numbers of orders. According to van Kolck et al. [30], the static simulation performed by Wang et al. [14] and Arnold et al. [16] did not estimate the result for the various agents involved in the UF, since it adapted each agent’s individual interest for global perspectives and concepts of society.
The studies described above show the importance of DL in improving the efficiency of the distribution of urban goods. However, they do not show the implications that this initiative can bring to all those involved in urban freight. This study investigates the implementation of these lockers considering the behavior and interaction among stakeholders through agent-based simulation model.
2.2. Agent-Based Simulation
According to Taniguchi et al. [17], most urban logistics models do not consider the individual interests of each agent, adapting individual objectives and perspectives to common goals and perspectives. Thus, the impacts of urban logistics measures are not estimated for the various agents involved. Consistent results were achieved by using agent-based simulation models (ABSMs) to evaluate the behavior and reactions of urban actors in the implementation of urban freight policies. The first models of this type began to be developed in recent years and generated great interest in the area of urban freight [17,31].
ABSMs, when used to represent the behavior of multiple agents within a system, are commonly called multi-agent systems (MAS). In general, the multi-agent system considers the interaction of each agent with its environment, following its pre-established behaviors and objectives. An agent can be understood as an autonomous system with a specific purpose that operates asynchronously and, when necessary, can act in a coordinated way with other agents [18]. These agents have the characteristics of autonomy, the ability to perceive, reason, and act in their environment, and the ability to interact socially and communicate to perform tasks [32].
According to Luck et al. [33], MAS can be used in two paradigms: as a multi-agent decision system or as a multi-agent simulation system. In the first of these, the agents participating in the system must make joint decisions as a group. These decisions are taken from some established mechanisms, which may be based on the market and on economic factors, such as bidding processes, or alternative mechanisms, such as argumentation, for example [34]. On the other hand, multi-agent simulation systems are used to simulate real-world domains. The simulation provides an output of some specified types to assist the user’s decision process. In this case, the decision is made by a person, not by the software system. According to Davidsson et al. [31], the latter situation is a decision support system (DSS).
Regarding urban freight, there are several stakeholders (retailers, carriers, shippers, customers, etc.) who have different goals in the handling of goods. The work in this context using ABSM is treated as a multi-agent system [21,31] and, in general, this model is used to understand and analyze the response of the different agents to the measures and policies [19].
Schroeder et al. [18] developed a multi-agent model that assesses scenarios with different UF policies, where carriers and transport service providers are the agents that, in making joint decisions, were able to improve their logistics processes. The authors presented the results for a theoretical example and represented the urban space through a GRID. This same approach of representation was adopted by Teo et al. [21] when analyzing the implementation of measures for the UF that control the pollution generated by trucks.
The ability of ABSM to capture the heterogeneity of the various stakeholders in urban logistics and their interactions was highlighted by Sopha et al. [35]. In his study, multi-agent simulation was used to solve the dynamic vehicle routing problem (DVRP), simulating the problem in the case of the city of Yogyakarta. Oliveira et al. [20] reported how the use of ABSM can help urban freight actors make decisions in flood situations at network sites, thereby reducing impacts on urban freight transport. A summary of the studies used in this work is presented in Table 1.
Most of these studies in Table 1 used MAS as a multi-agent decision system and dealt with policies that sought to restrict vehicle circulation in some way. None of these papers analyzed the impacts of the implementation of DLs in urban environments through ABMS, which is the focus of this study. To this end, MAS was built using Anylogic® (The Anylogic Company, operating from the US and Europe) software as an operating platform to analyze urban freight policies for e-commerce [38].
3. Modeling and Agent-Based Simulation
The modeling and simulation of this study followed the steps suggested by Sargent [39], which were based on three main phases: (i) identification of the system or problem situation, (ii) construction of the conceptual model, and (iii) construction of the computational model.
3.1. Situation Problem Identification
This study seeks to develop an ABSM to assess DL as a last-mile solution. All modeling was performed based on actions and interactions of process stakeholders, which are represented as agents in the simulation.
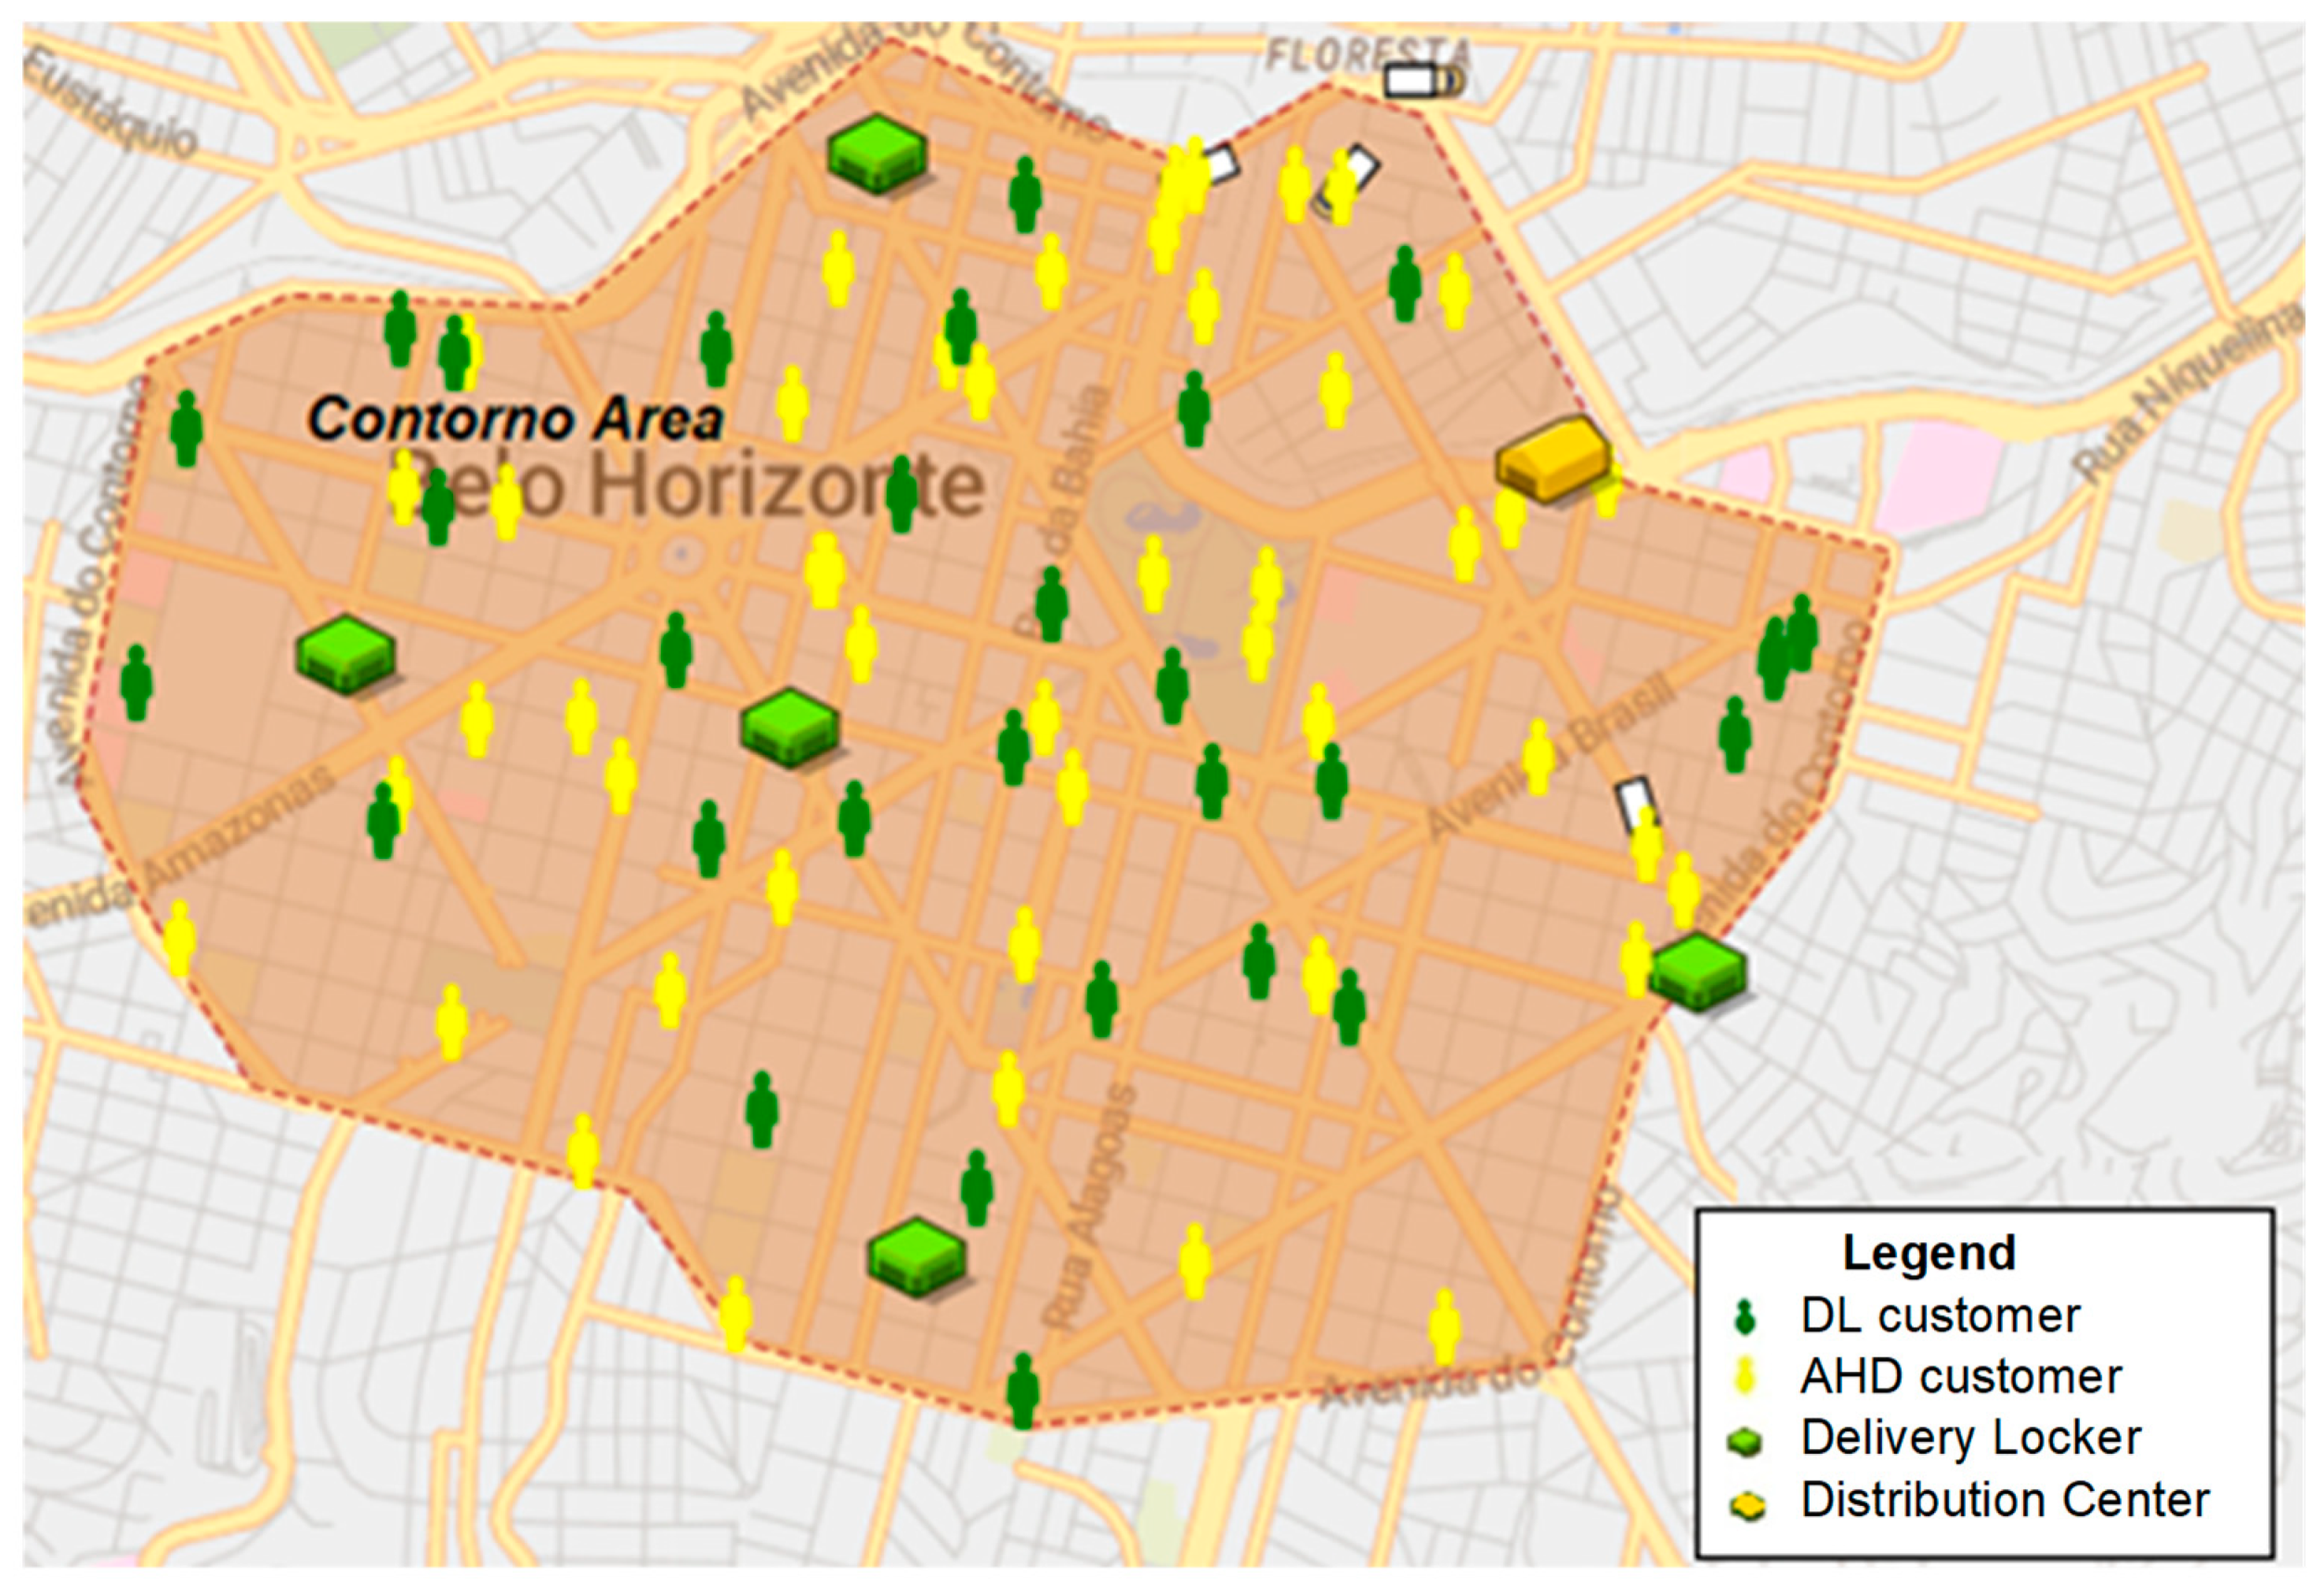
The model was developed for an area known as “Contorno” in the city of Belo Horizonte, capital of the state of Minas Gerais, Brazil. The city has approximately 2.5 million inhabitants distributed over 331 km2 and a motorized population of 1,714,233 vehicles, indicating a motorization index of 1.46 inhabitants per vehicle. The region of Contorno corresponds to the central region of Belo Horizonte and is named such because it is bounded by an outlining avenue (Contorno translated from Portuguese, means “outline” or “border”). This region comprises the neighborhoods Barro Preto, Santo Augustinho, Lourdes, Savassi, Funcionários, Boa Viagem, and part of the neighborhoods Santa Efigênia and Floresta. This area of study was chosen because of the greater availability of data and because it is economically relevant to Belo Horizonte; it presents high urbanization, which contributes to the emergence of problems related to the delivery of goods in this region [40].
For the baseline scenario, all deliveries were taken as AHD. In the context of Brazil, these deliveries obey the three-attempt policy. That is, when a delivery does not happen on the first attempt, up to two attempts can occur in the following days. It is clear that this policy generates more travel and, consequently, increases freight costs. Thus, the simulated scenarios sought to verify if the implementation of DL could contribute to the exclusion of the three-attempt policy. The business model in the simulation represents a situation where the lockers can receive items from several companies; however, a single carrier makes the deliveries.
The behavior of the e-commerce consumers and carriers are alike in different countries. Hence, the model that we present can be used to evaluate the e-commerce deliveries in different cities, only changing the selected region and tuning the input parameters that are presented in the sections below with the context to be studied.
3.2. Conceptual Model
For the construction of the model, information about the behavior of the agent that performs an action was necessary, which then generates the outputs that allow the scenarios to be analyzed. This information was obtained directly from Ebit data [1] and from the research done by Oliveira et al. [11], as well as directly collecting information from transport service providers in the studied area, and indirectly based on data obtained from the literature review. The model considers the interaction of the four main agents involved in the e-commerce delivery process: (i) carriers; (ii) e-commerce stores; (iii) DLs; and (iv) customers. The modeling of each agent is presented below.
3.2.1. E-Shopper Modeling and Delivery Locker
The Contorno region has about 93,684 inhabitants [41]. As stated by Oliveira et al. [11], the percentage of customers that make online purchases is around 30% of the population or 28,400 people. In this model, residences for these 28,400 customers were located within the Contorno region. Geographically, these residences were placed in a homogeneous manner throughout the region. The model initiates at the moment in which customers place an order and choose to receive their merchandise at home or in a DL. The software separates customers randomly, respecting the adopted parameters. Since there were no operating DLs in the region, we estimated the number of customers that would be willing to use DL based on Reference [11], where the authors reported that 43% of e-shoppers in Belo Horizonte would like to use this type of the system; in our model, we assumed this percentage of DL customers.
Thus, the model had two different types of customers (e-shoppers) who performed different actions: firstly, the customer who chooses to receive their order at home, which has two states (a state in which the delivery is performed, i.e., the customer is at home and receives the orders, and a state where the delivery is not performed where they are absent and do not receive the orders). We adopted a probability of 25% of the delivery not happening on the first attempt [24], 60% on the second attempt, and 80% on the third attempt. Following References [10,16,42], the assumption that deliveries that failed the first time would have a greater chance of failure on the second or third delivery attempt led to us adopting a high failure rate for the second and third attempts.
The second kind was for those who choose to receive their delivery in a DL, which has three states: carrying out the purchase, waiting for the delivery, and collecting the order at DL. Firstly, the customer makes the order and chooses which DL to receive the package. We assumed that the customer agent prefers to receive their order from the DL closest to home, as suggested by Iwan et al. [13] and Morganti et al. [5]. The software has a function called “nearest agent” which can be used to identify the closest DL agent in respect to customer agent location.
After making this choice, the customer then waits for the delivery of the order. When the order is delivered to the DL, they then receive an “order delivered” message sent by the truck agent. The customer then goes to the DL to collect the order and returns home.
The DLs in the model interact with the carrier and the customers, who deliver and receive the orders at these locations, respectively. DLs are a type of inanimate agent that have only one location; however, the goal is to host as many requests as possible.
The number of DLs represented in the model followed the proportion of five per 100,000 inhabitants, the proportion used in the places where these systems are already in operation [2,15]. Based on the population figures provided, there are 93,684 inhabitants and, therefore, five DLs were considered. Regarding location, according to Iwan et al. [13], supermarkets are among the main places where these systems are installed. As this was also the preference declared by the e-shoppers in Oliveira et al. [11], we adopted five geographically disperse, existing supermarkets spread throughout the region in the model for the operation of the DL.
3.2.2. E-Commerce Store and Orders Modeling
Orders are received and managed by the e-commerce store agent. Each order has a determined volume, weight, and address, which depends on the customer’s choice; it can be their home or the DL. The number of orders that the store receives in one day was obtained as a function of the number of inhabitants in the simulated region and the percentage of potential e-commerce customers. These values were obtained in E-bit [1] and IBGE (Brazilian Institute of Geography and Statistics) [41].
As soon as the orders are made, the store starts the process of forming the load (the load in this model contains a collection of orders). This process obeys two factors: the capacity of the truck and time. The latter refers to how many days a customer waits to receive their order, and the average time reported by E-bit [1] was used. Once one of these factors is met, a load is sent to the carrier.
The e-commerce store agent still uses a heuristic to assemble the load. That is, the orders are separated into a load according to the proximity of the customers, and the agent still separates the orders for the same DL in the same load. Consequently, this heuristic improves the route taken by the truck. Undelivered orders take priority over other orders and are allocated on the next day’s load, as they comply with the three-way policy.
3.2.3. Carrier
The carrier manages a specific number of trucks and has a distribution center that is located near Contorno Avenue. The modeling process was carried out from the truck’s actions, which starts the simulation in the distribution center waiting for the formation of the load. If there is a load, the store agent sends a message to the truck agent which says “start delivery”.
The truck’s route follows the principle of the nearest neighbor algorithm, which consists of finding tours for all trucks, which all start and end at the carrier’s distribution center (DC), such that each intermediate node (agent customer location) is visited exactly once and the distance of visiting all nodes is minimized [43]. Upon leaving the DC, the truck agent makes a list of destinations since, as quoted, orders are delivered to customers’ homes, as well as DLs. From this list, the algorithm identifies which destination is closest to it and sends the truck there. In the situation where the nearest destination is a DL point, the truck agent checks among the other load requests if there is another one with this same destination and then unloads and distributes all the orders in the lockers. After this process, they send a “delivered request” message to the customer agent so that they can collect their order. When the destination is the home of the customer agent, if the customer is at home, the request is delivered; if the customer is absent, the request returns to the DC for a subsequent delivery attempt until the number of retries is equal to three (baseline scenario).
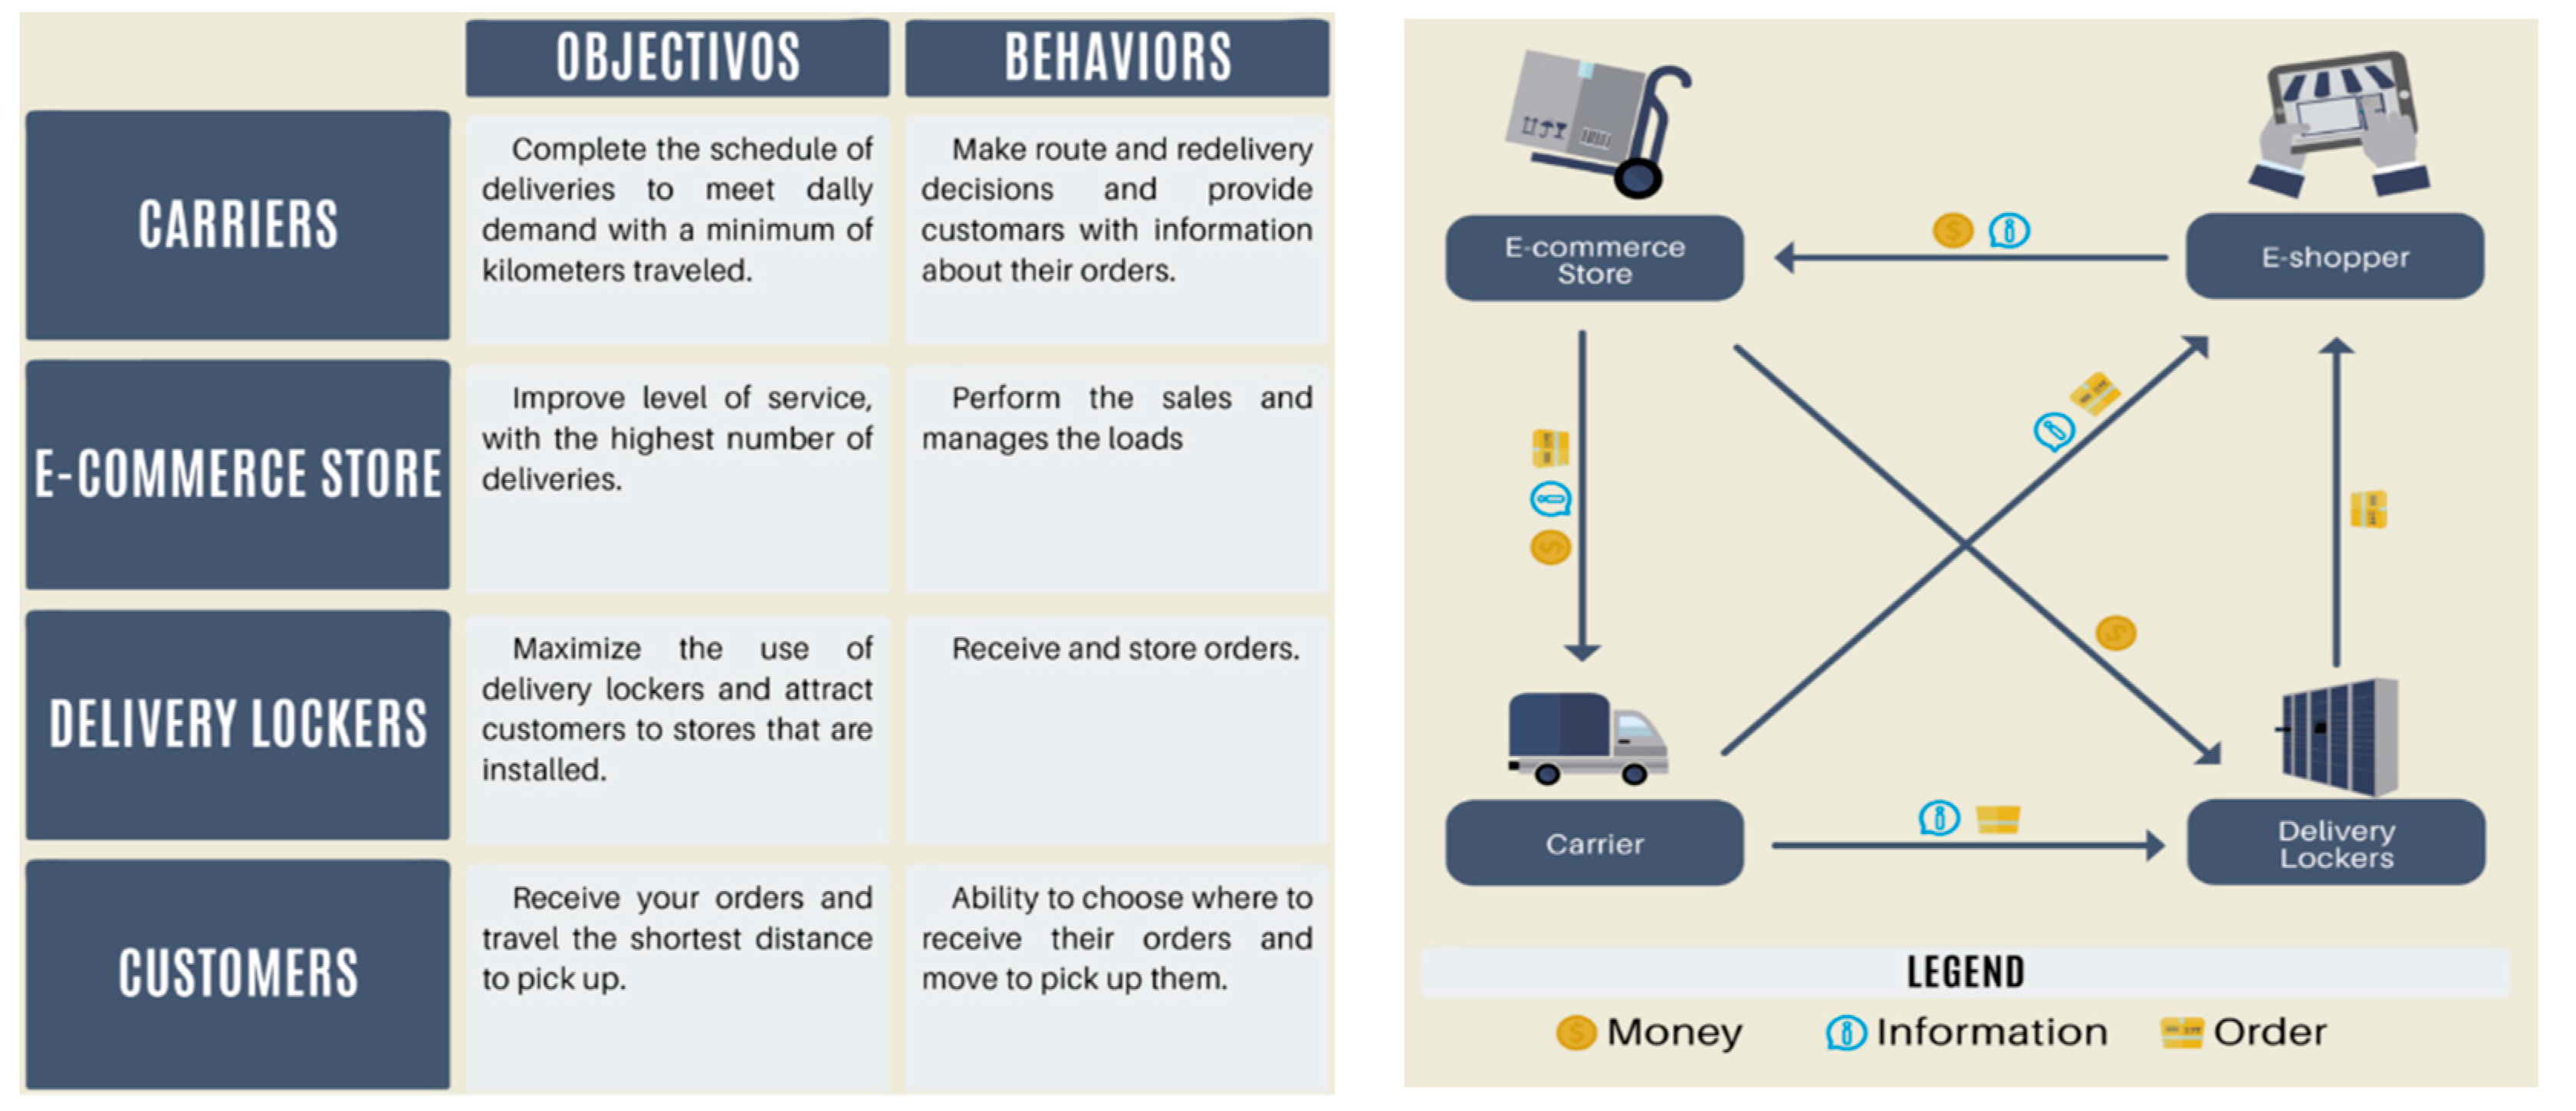
Delivery times include truck stoppage and unloading time. In the case of DL, the unloading time is a function of the number of orders delivered. When a delivery failure occurs, the only counted time is the stoppage time. Finally, after going through their route, the agent truck returns to the DC and waits until another load is sent to them. The interactions discussed above are illustrated in Figure 1, including the summary of agent objectives and behaviors.
3.3. Computational Model
The model was implemented in the software Anylogic® by presenting the functionality of ABSM and a geographic information system (GIS) routable map. Figure 2 shows the screen of the simulation environment. The input data of the computational model are presented in Table 2.
Four scenarios were simulated varying the situation of redelivery and the implementation of delivery lockers.
- ⚬
- Scenario 1 (baseline scenario)—AHD deliveries with three-attempt policy. In this scenario, all orders must be delivered at home and the three-delivery-attempt policy is in effect. When the customer is not at home to receive the order and it is not delivered, two more delivery attempts may occur over two consecutive days.
- ⚬
- Scenario 2—with the implementation of the delivery lockers and with the three-attempt policy. There is now a percentage of customers choosing to receive their deliveries from delivery lockers. AHD deliveries remain where they are and, in this case, there are three delivery attempts.
- ⚬
- Scenario 3—with one attempt and failed delivery on DC. Customers continue to choose where they prefer to receive their deliveries. However, for home deliveries, if the delivery is not made on the first attempt, the carrier takes the order with them to the DC, which will advise customers to go to the DC to collect their orders.
- ⚬
- Scenario 4—with one attempt and failed delivery in DL. In this case, customers can still choose where they prefer to receive their deliveries. However, if AHD delivery is not performed on the first attempt, the carrier leaves the order in the delivery lockers closest to the customer’s home and informs the customer that their order is in the delivery lockers awaiting pick-up.
In scenarios 3 and 4, we simulated a situation where the three-attempt policy was excluded. In scenario 3, the failed orders must be picked up by customers in the store’s distribution center. The fourth scenario differs from scenario 3 as it relates to the location of delivery of failed orders, which becomes the delivery lockers. The main objective here is to analyze the distance covered by customers to collect their orders and verify which location results in the shortest distances.
4. Results
4.1. Deliveries
For each scenario, one year of deliveries was simulated with 15 replications each. Table 3 shows the number of orders delivered and the number of re-deliveries in each scenario.
When comparing scenario 1 (baseline scenario) to scenario 2 (Table 3), which simulated the implementation of DL and maintains the three delivery attempts, it was possible to increase the number of delivered orders by 6%. Scenarios that simulated the three-attempt policy presented a high number of re-deliveries. However, Scenario 2, which simulated the implementation of the DL, managed to reduce the number of re-deliveries by 43% when compared to scenario 1. Since 43% was the simulated proportion of DL customers, it can be said that, for every 1% of DL deliveries, there is a 1% reduction in the number of re-deliveries.
Scenarios 3 and 4 did not consider the three-attempt policy compared to scenario 1. They presented a 72% reduction in the number of delivery attempts. This is because, in these scenarios, only the first delivery attempt could fail. The unsuccessful attempts in scenarios 3 and 4 were the orders that the carrier could not deliver to the customer’s home. However, in these scenarios, after the first attempt failed, customers could collect their orders either on the DC (scenario 3) or the nearest DL (scenario 4). In these scenarios, all orders were delivered.
4.2. Distances
Table 4 shows the distance traveled by each of the six trucks in the four scenarios. Scenarios 2, 3, and 4 showed a reduction in kilometers traveled by the trucks by 13%, 41%, and 29%, respectively, when compared with scenario 1. This effect was expected due to the reduction in the number of delivery points [16]. This result corroborates what was found by Cardenas et al. [9] and Esser and Kurt [44], who obtained a reduction in vehicle kilometers traveled (VKT), with a small number of collection points. Analyzing in isolation, DL deployment would be sufficient to reduce the distance traveled. When we excluded the three-attempt policy, even better results were achieved. The greater distances in scenario 4, compared to scenario 3, can be explained by the fact that, in scenario 4, when delivery does not occur, the carrier needs to address the nearest DL to leave the order. In some cases, the DL may not be on their route nor have previously been visited. In Scenario 3, when the order is not delivered, it is taken along with the other orders that are not delivered at one time to the DC, which is usually the destination point of the route, and does not entail any additional stops.
We also analyzed the number of kilometers traveled by customers when picking up their orders (Table 5). AHD customers are those who initially choose to receive their orders at home; DL customers are those who choose to receive their orders at the lockers. The average distance traveled by DL customers was between 1.2 km and 1.6 km. Discoveries in in Belgium [16,29] stated that, if the distance between client and DL is shorter than 200 m, the customer will use a car in 10% of cases; if it is between 200 m and 500 m, the probability increases to 30%; between 500 m to 1000 m, it increases to 50%; and for distances greater than 1000 m, it increases to 70%. This factor is important because an undesired effect of the DL rollout is the extra travel of customers in their private vehicles to pick up their orders. If lockers can be accessed over short distances, customers either tend to pick up their parcels on foot or align their daily journeys in their private vehicles with a stop at a DL (i.e., no additional distance).
We had greater average distances covered by AHD customers in scenario 3, which suggests the use of motorized modes to collect orders. In the worst-case scenario, it would result in 338 trips a month to the DC to remove the failed deliveries. When the place where customers look for their failed deliveries became the DL (scenario 4), we had a reduction of 46% of the average individual distance covered. This is a very positive improvement because, the lower the distance is, the greater the tendency of customers is to seek their orders through non-motorized means. Scenario 4 presents a better alternative for both customers who choose to receive their DL orders and those who would use this system to seek unplanned delivery. Most customers prefer to collect their failed delivery at a DL rather than retrieving it at the store’s DC, as this represents an economy in time and distance traveled according to McLeod et al. [24].
Although the distance traveled was the main variable analyzed in the studies on the implantation of collection points [24,29,44], we observed that, when consolidating the loads and excluding the delivery attempts, the number of loads delivered by truck had a considerable reduction.
In scenario 2, where the DL was implemented, there was a 12% reduction in the number of loads transported per year when compared to scenario 1. In scenarios where we excluded the third attempt, we saw a 28% reduction in the number of loads. Thus, in order to obtain a greater use of the trucks, we simulated a change in the number of trucks, keeping the other input parameters unaltered. The best configuration obtained in terms of reduction of the number of trucks was that of five trucks for scenario 2 and four trucks for scenarios 3 and 4, obeying the time windows of the carrier. Therefore, the scenarios previously presented were simulated again, changing the number of trucks to five (scenario 2) and four (scenarios 3 and 4).
The new simulation did not change the number of loads transported per year, but rather increased the use of each truck. There was no significant change in the distance traveled by the trucks in these new simulations when compared to the previous simulations (six trucks). The other percentage results previously discussed (the distance traveled by customers, numbers of deliveries, and failed orders) remained similar.
Reducing the number of trucks is a potential benefit of automatic delivery lockers that is still little examined in the literature as most studies analyzed the results in terms of distance traveled by trucks and customers [9,44]. The reduction in the number of trucks will also result in a smaller number of drivers, lower vehicle maintenance/tax expense, and lower cost of the carrier as a whole.
4.3. Cost Analysis
In order to obtain comparable global results for each scenario, the results found in the simulation for each agent were analyzed in terms of costs and gains obtained. The calculated costs were fuel, time, external, re-delivery, and the gain per order hosting. For trucks, we calculated fuel costs, travel time, and external costs.
Fuel costs (Fc) were obtained from fuel consumption per vehicle, fuel price ( = $0.98), and distance covered (), according to Equation (1).
The monetary value definition of time in accordance with Reference [20] is controversial. However, to have a common basis for analysis, the following adaptation of the proposal from Reference [45] was used (Equation (2)), based on the data provided by References [45,46].
where is the total cost of travel time by carriers, w is the average monthly carrier income, ES is the social and payroll tax rate of 95.02% (1.9502), FA is the possibility of alternative usages of time (0.3), HP is the percentage of productive time of the carrier (0.5), yw is the number of minutes of work per month, tv is the carrier travel time (min), and Nv is the number of trips carried out.
For external costs , we considered the externalities caused by the delivery vehicles or by the customer’s trips to a DL. As the exact quantification of the corresponding costs is still under discussion in the literature, we opted for the externalities that received the most attention, such as emission, noise, and congestion. We chose the corresponding cost values based on the calculations in References [9,47].
For the calculation of customer external costs, we need to consider their modal choice to get their order. If a customer uses a car, the trip contributes to the external costs related to the delivery. On the other hand, walking or cycling does not result in externalities. Intuitively, the greater the distance is between a customer and the nearest DL, the more likely he or she is to use a car. To calculate the distance performed for the customers by car (Table 6), we assumed the customer’s modal choice probabilities based on the results of the study carried out in Belgium [16,29].
Since we had the distance traveled by car, we also calculated the customer’s cost of fuel (. Moreover, the cost of re-delivery () for customers who did not receive their deliveries (scenarios 1 and 2) could be calculated, considering that this group desires another attempt at delivery. Thus, the minimum value charged for a freight rate per order was considered using E-bit [1]. Finally, we calculated the gains () that a DL achieved in receiving an order [11]. For Equation (3), we obtained a global index considering the gains and costs for each scenario; the summary with all of the parameters is shown in Table 7.
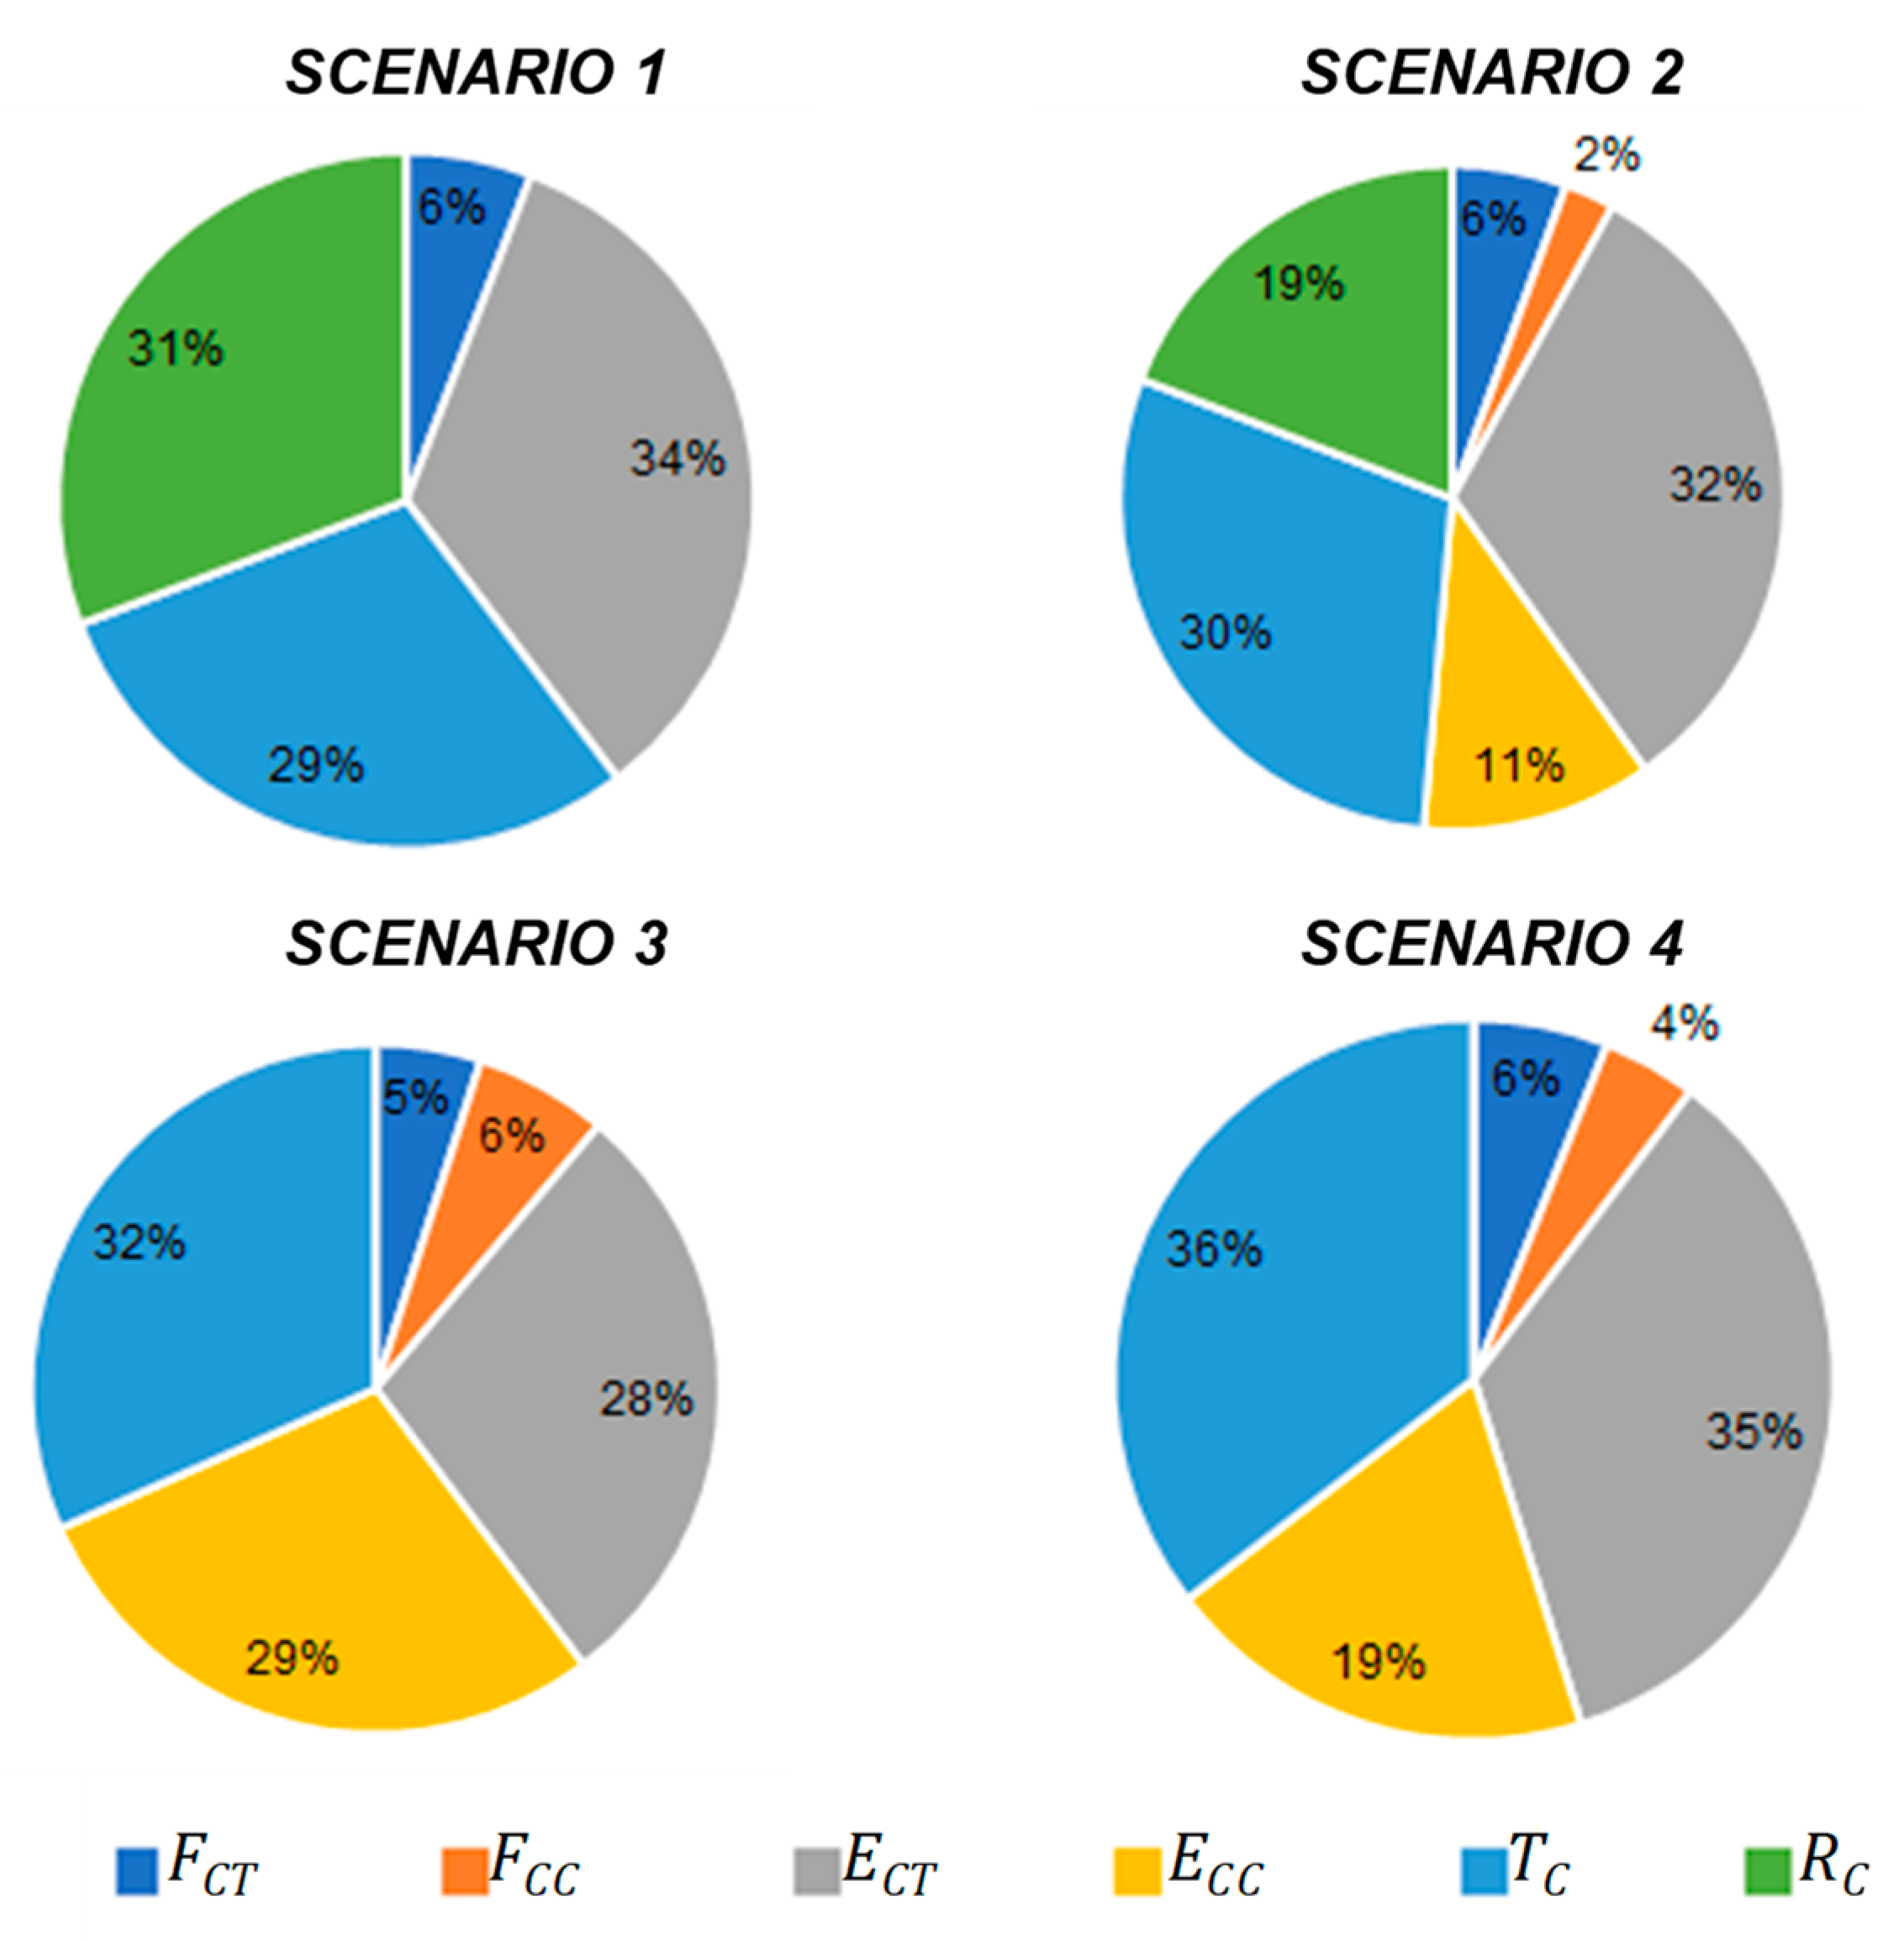
The sub-item costs which were most expressive in total costs were related to time and external costs, as can be seen in Figure 3 and Table 8. Time costs were reduced with the implementation of the DL, as there was a consolidation of deliveries. However, the total external costs (ECT + ECC) tended to be higher with the implementation of DLs in scenario 2 and scenario 3, where this value reached 17% higher results. This is because, in scenario 3, customers travel longer distances to get their orders in the DC, which are usually located in regions far from residential areas, thus encouraging the use of motorized modes. It can be observed that the distance traveled by AHD customers contributes a great deal to external costs in terms of external costs to the trucks and contributing to exceeding the fuel costs of the trucks by 24% in scenario 3. These results are similar to those found in Edwards et al. [42], where the authors still pointed out that it is unlikely that, under these conditions, a modal shift would occur due to the location of the DC.
In scenario 4, which had the most extensive use of DLs, total external costs were still greater than scenario 1 (baseline scenario). However, the reduction of these costs in comparison with scenario 3 reached 7.5%; reductions in externalities are also observed by Edwards et al. [42] when analyzing CDPs as locations to deliver failed orders. According to the authors, this occurs because the consumer travels smaller distances on average to collect the first delivery failures in the DL, instead of traveling to the DC. Cardenas et al. [9] also found that the consolidation promoted by greater usage of DL is beneficial to external costs. However, as seen in Iwan et al. [13], they argued that increased locker usage can be compensated for with a suitable location, as longer distances will result in a higher percentage of customers who use their cars to retrieve orders.
As can be observed in our results, the consolidation obtained with the use of the DL allowed the reduction of up to two trucks in scenario 4, which, according to Russo and Comi [25], can be observed as a gain in social sustainability, because it is able to reduce the interference with the population and the number of accidents.
When we analyzed the total fuel cost (truck fuel + customer fuel), the lowest cost was from the baseline scenario because this scenario did not rely on customer travel for retrieval. Among the scenarios that involved customer retrieval, scenario 4 had the lowest total fuel cost. Even though the fuel cost of the trucks was higher than that in scenario 3, the lower costs of the customers in scenario 4 helped keep total costs balanced.
As indicated by the ABSM, each agent had a behavior and one or more goals to achieve. However, these goals brought greater or lesser improvement, depending on the rules to be observed in each scenario. As scenario 1 was the closest to the current situation, the improvements for each agent were calculated in comparison with this scenario (Table 9).
Although scenario 3 presented the lowest number of kilometers traveled by trucks, truck fuel, and external costs, scenario 4 presented shorter distances traveled by the customers when seeking their orders in the DL, greater total cost reduction for final customers, and greater gains for supermarkets which received the orders. In this way, scenario 4, where the DL was most used, presented the best overall results.
5. Discussion
According to the results, the baseline scenario that had the highest number of re-deliveries subsequently presented the highest total cost for the entire system. According to PCAPredict [48], in research conducted with 300 e-commerce retailers in the United Kingdom (UK), the US, and Germany, the cost of failed delivery was estimated to be $17.78. However, retailers point out that this figure is underestimated since it does not take into account the damage that failed deliveries can cause to the reputation of the brand from the possible loss of existing customers and the difficulty of acquiring new customers. In this way, DLs, in addition to reducing the cost of re-deliveries, can help improve the reputation of e-commerce stores.
In addition to helping reduce the number of re-deliveries, the implementation of DL can generate extra income for the supermarkets that host them. As can be seen, the involved supermarkets would gain an average of $1600. This is a small value given that the estimated delivery volume is 15 packages/day. However, the lockers have the capacity to accommodate 40 to 100 packages/day, which, depending on the growth of demand, can increase by almost seven times this amount. Still, the extra flow of people visiting the store to use the DL can increase the number of sales in supermarkets. According to Iwan et al. [13], for every four DL users, one will make purchases when they collect their orders. According to Oliveira et al. [11], e-shoppers in the city of Belo Horizonte demonstrated a willingness to pay an additional $0.50 per delivery to use the DLs, a figure that could contribute to the payment of supermarkets.
These results highlight that the customer’s self-pick-up is highly cost-effective for carriers. However, self-pick-up promotion can be difficult, as most customers are used to the convenience of home delivery. One idea to promote self-pick-up is to offer reductions in the value of freight charged. The results suggest that, with the economy achieved by the consolidation of the load in the scenarios where we have locker implantation, compared with the baseline scenario, the companies could offer discounts ranging from $0.4 to $1.4 per order for customers who choose to collect their orders. All this can be done without touching the profit of the carriers, presenting results similar to those found by Arnold et al. [16].
One of the negative effects of using delivery lockers is the generation of exclusive travel from customers retrieving their merchandise by car. However, if the DL is located at a short distance, fewer people will use their cars to receive orders. At the same time, customers will feel more willing to accept the self-pick-up option. The distance between customers and DL can be reduced with the opening of more DLs throughout the city, which requires a significant investment and that can discourage the implementation of this initiative. The involvement and sponsorship of public authorities could favor this process. However, looking at the external costs of this option, which are those that the public authorities mainly seek to reduce, it would not be interesting to promote the concept of delivery based on self-pick-up by these agents, once externalities increase. Arnold et al. [16] suggested that authorities help promote the use of DLs, on the condition that carriers reduce external costs, which can be done by using bicycles, alternative fuel vehicles, and electric vehicles, for the distribution of deliveries [49,50].
In Brazil, the consolidation gains are not yet observed, due to the limited and recent use of DLs, which are still under test in the city of São Paulo at only a few points. However, according to the head of operations, some gains can already be observed. Customers residing in peripheral areas, for example, where carriers do not perform the delivery service, can now use these locations to receive their orders, thereby increasing the diffusion of deliveries and online sales.
Although the study was developed for a specific region of Belo Horizonte, the results presented here reflect the reality of almost all Brazilian and Latin American big cities: the deliveries are not left without on-street supervision due to the risk of theft. Because this is an e-commerce in development, the stores cannot offer several delivery options to their customers such as, for instance, a time window service compatible with a convenient time for customers. This implies, in the majority of cases, a greater chance of re-delivery, because the delivery time of the transport companies generally coincides with the time the customers are at work. Then, the use of DLs is a delivery option for the customers, bringing more flexibility for them and reducing the number of re-deliveries for the carriers.
6. Conclusions
In this study, we demonstrated that an agent-based simulation model is a useful tool for modeling urban freight transport. In the context of e-commerce deliveries, this method was able to correctly simulate the interactions between agents and the actions taken by them in different situations. The scenario that most closely resembled the current situation, where deliveries were all AHD and in which up to three delivery attempts may occur, was the one that presented the worst results. The implementation of the delivery lockers brought improvements to this scenario in terms of reducing the re-deliveries and distances traveled by the trucks. With DL implementation, significant reductions could be seen in fuel consumption, up to 30% in some cases; in time-related costs, also up to 30%; and external costs of up to 19%.
ABSM also showed that DLs present improvement for carriers that go beyond the reduction of kilometers traveled. When simulating scenarios with the DL, we observed reductions in the number of trucks between 17% and 33%, depending on whether or not the policy of three attempts was excluded. The result of the reduction in the number of trucks in urban areas has more than an economic aspect because it contributes to increasing in the quality and habitability of the urban environment, avoiding road accidents and reducing the interference between the urban mobility actors. Thus, performing practical studies involving partnerships with transport companies could better exploit this potential and bring an interesting contribution to this area of study.
The simulated scenarios considering the three-delivery-attempt policy presented the highest costs. However, excluding these attempts and making the customers collect the order not delivered in the DC raises the external costs, because it increases the number of individual motorized travels of the customers. The external costs of the customers who collect the order not delivered in the DC can be up to 35% higher than for those who use the DL.
Even though scenario 4 presented lower external costs compared to scenario 3, we still had a relatively high cost in the former, produced by consumers collecting their orders in the DL which can make this initiative unattractive, in turn potentially hindering the support of the local government. Thus, the importance of adequate DL locations should be emphasized, because, when strategically located, they can facilitate non-motorized access. One way of balancing these external costs would be to promote the use of bicycles and less polluting vehicles for deliveries. These combinations of measures can be encouraged by public authorities and analyzed in future work.
Another interesting extension of the work could include an analysis using more robust routing heuristics. We showed that cost over time represents a significant share of total costs and is directly linked to the size of routes; thus, this effect could be further explored.
Future works may include scenarios considering off-hour deliveries in the DL. Since the DL works 24 h and the off-hour deliveries are a city logistics measure already employed in the traditional retail market, it would be interesting to discuss the impact of the combination of those measures for the stakeholders of UF. Moreover, considering scenarios with different delivery densities, evaluating the occupation and sizing of the DL would complete the study performed in this work.
Treated separately, both the implementation of the DLs and the exclusion of the three attempts do not seem to benefit all stakeholders. However, the combination of both concepts represents a B2C delivery system that is attractive to everyone involved. The efficiency of such a delivery system can be further enhanced if more customers use the DL to receive their orders.
Finally, the success of this solution depends on e-commerce stores offering and promoting this option on their websites for their customers, in addition to the acceptance of e-shoppers, and the interest of retailers in hosting this solution. Incentives to use DLs could be part of public urban mobility policies as their use would reduce the negative effects of urban freight transport on mobility.
Author Contributions
Conceptualization, R.A., R.S.L., D.C.S., A.F.P., and J.H.-V.; methodology, R.A., R.S.L., D.C.D., and A.F.P.; software, R.A., D.C.D., and A.F.P.; validation, R.A., R.S.L., D.C.D., A.F.P., and J.H.-V.; visualization, R.A.; writing—original draft, R.A., R.S.L., D.C.D., A.F.P., and J.H.-V.; writing—review and editing, J.H.-V.
Funding
The authors would like to acknowledge the Brazilian agencies FAPEMIG (Foundation for the Promotion of Science of the State of Minas Gerais) and CNPq (Brazilian National Council for Scientific and Technological Development) for the financial support provided to this research.
Conflicts of Interest
The authors declare no conflict of interest.
References
- Ebit WEBSHOPPERS 37a Edição 2018. 2018. 45. Available online: https://www.ebit.com.br/webshoppers (accessed on 23 July 2019).
- Morganti, E.; Seidel, S.; Blanquart, C.; Dablanc, L.; Lenz, B. The impact of e-commerce on final deliveries: Alternative parcel delivery services in France and Germany. Transp. Res. Procedia 2014, 4, 178–190. [Google Scholar] [CrossRef]
- Visser, J.; Nemoto, T.; Browne, M. Home Delivery and the Impacts on Urban Freight Transport: A Review. Procedia Soc. Behav. Sci. 2014, 125, 15–27. [Google Scholar] [CrossRef] [Green Version]
- Holguín-Veras, J.; Sánchez-Díaz, I.; Browne, M. Sustainable Urban Freight Systems and Freight Demand Management. Transp. Res. Procedia 2016, 12, 40–52. [Google Scholar] [CrossRef] [Green Version]
- Morganti, E.; Dablanc, L.; Fortin, F. Final deliveries for online shopping: The deployment of pickup point networks in urban and suburban areas. Res. Transp. Bus. Manag. Final 2014, 11, 23–31. [Google Scholar] [CrossRef] [Green Version]
- Oskarbski, J.; Kaszubowski, D. Applying a mesoscopic transport model to analyse the effects of urban freight regulatory measures on transport emissions-an assessment. Sustainability 2018, 10, 2515. [Google Scholar] [CrossRef]
- Alves, R.; Lima, S.; Silva, K.; Gomes, W.; González-calderón, C. Functional and environmental impact analysis of urban deliveries in a Brazilian Historical City. Case Stud. Transp. Policy 2019, 7, 443–452. [Google Scholar] [CrossRef]
- Taniguchi, E.; Thompson, R.G.; Yamada, T.; Van Duin, R.; Ronchail, G. City Logistics; Emerald Group Publishing Limited: Bradford, UK, 2001; ISBN 978-0-08-043903-7. [Google Scholar]
- Cardenas, I.; Dewulf, W.; Vanelslander, T.; Smet, C.; Beckers, J. The e-commerce parcel delivery market and the implications of home B2C deliveries vs pick-up points. Int. J. Transp. Econ. 2017, 44, 235–256. [Google Scholar]
- Song, L.; Cherrett, T.; McLeod, F.; Guan, W. Addressing the Last Mile Problem. Transp. Res. Rec. J. Transp. Res. Board 2009, 2097, 9–18. [Google Scholar] [CrossRef] [Green Version]
- de Oliveira, L.K.; Morganti, E.; Dablanc, L.; de Oliveira, R.L.M. Analysis of the potential demand of automated delivery stations for e-commerce deliveries in Belo Horizonte, Brazil. Res. Transp. Econ. 2017, 65, 34–43. [Google Scholar] [CrossRef] [Green Version]
- Liu, C.; Wang, Q.; Susilo, Y.O. Assessing the impacts of collection-delivery points to individual’s activity-travel patterns: A greener last mile alternative? Transp. Res. Part E Logist. Transp. Rev. 2017, 121, 84–99. [Google Scholar] [CrossRef]
- Iwan, S.; Kijewska, K.; Lemke, J. Analysis of parcel lockers’ efficiency as the last mile delivery solution—The results of the research in Poland. Transp. Res. Procedia 2016, 12, 644–655. [Google Scholar] [CrossRef]
- Wang, X.; Zhan, L.; Ruan, J.; Zhang, J. How to choose “last mile” delivery modes for E-fulfillment. Math. Probl. Eng. 2014, 2014. [Google Scholar] [CrossRef]
- Weltevreden, J.W.J.; Rotem-Mindali, O. Mobility effects of b2c and c2c e-commerce in the Netherlands: A quantitative assessment. J. Transp. Geogr. 2009, 17, 83–92. [Google Scholar] [CrossRef]
- Arnold, F.; Cardenas, I.; Sörensen, K.; Dewulf, W. Simulation of B2C e-commerce distribution in Antwerp using cargo bikes and delivery points. Eur. Transp. Res. Rev. 2018, 10, 2. [Google Scholar] [CrossRef]
- Taniguchi, E.; Thompson, R.G.; Yamada, T. Emerging Techniques for Enhancing the Practical Application of City Logistics Models. Procedia Soc. Behav. Sci. 2012, 39, 3–18. [Google Scholar] [CrossRef] [Green Version]
- Schroeder, S.; Zilske, M.; Liedtke, G.; Nagel, K. Towards a Multi-Agent Logistics and Commercial Transport Model: The Transport Service Provider’s View. Procedia Soc. Behav. Sci. 2012, 39, 649–663. [Google Scholar] [CrossRef]
- Wangapisit, O.; Taniguchi, E.; Teo, J.S.E.; Qureshi, A.G. Multi-agent Systems Modelling for Evaluating Joint Delivery Systems. Procedia Soc. Behav. Sci. 2014, 125, 472–483. [Google Scholar] [CrossRef] [Green Version]
- de Oliveira, L.K.; Lessa, D.A.; Oliveira, E.; Gregório Calazans, B.F. Multi-agent modelling approach for evaluating the city logistics dynamic in a vulnerability situation: An exploratory study in Belo Horizonte (Brazil). Transp. Res. Procedia 2017, 25, 1046–1060. [Google Scholar] [CrossRef]
- Teo, J.S.E.; Taniguchi, E.; Qureshi, A.G. Evaluation of Load Factor Control and Urban Freight Road Pricing Joint Schemes with Multi-agent Systems Learning Models. Procedia Soc. Behav. Sci. 2014, 125, 62–74. [Google Scholar] [CrossRef] [Green Version]
- Alho, A.; Bhavathrathan, B.K.; Stinson, M.; Gopalakrishnan, R.; Le, D.T.; Ben-Akiva, M. A multi-scale agent-based modelling framework for urban freight distribution. Transp. Res. Procedia 2017, 27, 188–196. [Google Scholar] [CrossRef]
- Allen, J.; Thorne, G.; Browne, M. Good Practice Guide on Urban Freight Transport; BESTUFS Administration Centre: Rijswijk, The Netherlands, 2007; p. 84. [Google Scholar]
- McLeod, F.; Cherrett, T.; Song, L. Transport impacts of local collection/delivery points. Int. J. Logist. Res. Appl. 2006, 9, 307–317. [Google Scholar] [CrossRef]
- Russo, F.; Comi, A. A classification of city logistics measures and connected impacts. Procedia Soc. Behav. Sci. 2010, 2, 6355–6365. [Google Scholar] [CrossRef]
- DHL. Available online: https://www.dhl.de/content/de/en/privatkunden/pakete-empfangen/an-einem-abholort-empfangen/packstation-empfang.html (accessed on 20 April 2018).
- Amazon. Available online: https://www.amazon.com (accessed on 20 April 2018).
- Cullinane, S. From bricks to clicks: The impact of online retailing on transport and the environment. Transp. Rev. 2009, 29, 759–776. [Google Scholar] [CrossRef]
- Cardenas, I.; Beckers, J.; Vanelslander, T.; Verhetsel, A. Spatial characteristics of failed and successful E- commerce deliveries in Belgian cities. In Proceedings of the ILS 2016 6th International Conference Information System Logistics and Supply Chain, Bordeaux, France, 1–4 June 2016; pp. 1–10. [Google Scholar]
- Van Kolck, A.H. Multi-Agent Model for an Urban Distribution Centre; Delft University of Technology: Delft, The Netherlands, 2010. [Google Scholar]
- Davidsson, P.; Henesey, L.; Ramstedt, L.; Törnquist, J.; Wernstedt, F. An analysis of agent-based approaches to transport logistics. Transp. Res. Part C Emerg. Technol. 2005, 13, 255–271. [Google Scholar] [CrossRef]
- Huhns, M.N.; Singh, M.P. Readings in Agents; Morgan Kaufmann: Burlington, MA, USA, 1997; p. 523. [Google Scholar]
- Luck, M.; McBurney, P.; Shehory, O.; Willmott, S. Agent Technology: Computing as Interaction; University of Southampton: Southampton, UK, 2005; pp. 19–25. [Google Scholar]
- Roorda, M.J.; Cavalcante, R.; McCabe, S.; Kwan, H. A conceptual framework for agent-based modelling of logistics services. Transp. Res. Part E Logist. Transp. Rev. 2010, 46, 18–31. [Google Scholar] [CrossRef]
- Sopha, B.M.; Siagian, A.; Asih, A.M.S. Simulating Dynamic Vehicle Routing Problem Using Agent-Based Modeling and Simulation. In Proceedings of the 2016 IEEE International Conference on Industrial Engineering and Engineering Management (IEEM), Bali, Indonesia, 4–7 December 2016; pp. 1335–1339. [Google Scholar]
- Liedtke, G.; Matteis, T.; Wisetjindawat, W. Impacts of urban logistics measures on multiple actors and decision layers—A case study. Transp. Res. Rec. 2015, 2478, 57–65. [Google Scholar] [CrossRef]
- Marcucci, E.; Le Pira, M.; Gatta, V.; Inturri, G.; Ignaccolo, M.; Pluchino, A. Simulating participatory urban freight transport policy-making: Accounting for heterogeneous stakeholders’ preferences and interaction effects. Transp. Res. Part E Logist. Transp. Rev. 2017, 103, 69–86. [Google Scholar] [CrossRef]
- Li, C.; Zheng, X.; Cao, X. The method and application of importing GIS data to AnyLogic. In Proceedings of the 19th International Conference on Geoinformatics, Shanghai, China, 24–26 June.
- Sargent, R.G. Verification and validation of simulation models. J. Simul. 2013, 7, 12–24. [Google Scholar] [CrossRef] [Green Version]
- IBGE Demographic Census; IBGE: Rio de Janeiro, Brazil, 2015.
- IBGE Populational Census; IBGE: Rio de Janeiro, Brazil, 2012.
- Edwards, J.; Mckinnon, A.; Cherrett, T.; Mcleod, F.; Song, L. Carbon Dioxide Benefits of Using Collection—Delivery Points for Failed Home Deliveries in the United Kingdom. Transp. Res. Rec. 2010, 2191, 136–143. [Google Scholar] [CrossRef]
- Bodin, L. Routing and Acheduling of vehicles and crews, the state of the art. Comput. Oper. Res. 1983, 10, 63–211. [Google Scholar]
- Esser, K.; Kurte, J. Strategies for Optimizing Pick-up and Delivery Traffic of Internet Commerce—Packstations in Cologne (OPTIMAL)); KE-Consult: Cologne, Germany, 2007. [Google Scholar]
- ANTP/IPEA. Redução das deseconomias urbanas pela melhoria do transporte público. Rev. dos Transp. Públicos 1999, 21, 35–92. [Google Scholar]
- NTC & Logística. Planilhas Referenciais de Custo do Transporte Rodoviário de Cargas; NTC & Logística: São Paulo, Brazil, 2018. [Google Scholar]
- European Commission. Update of the Handbook on External Costs of Transport. Available online: https://ec.europa.eu/ (accessed on 20 February 2019).
- PCAPredict Fixing Failed Deliveries: Improving Data Quality in Retail; PCAPredict: Worcester, UK, 2018.
- Teoh, T.; Kunze, O.; Teo, C.C.; Wong, Y.D. Decarbonisation of urban freight transport using electric vehicles and opportunity charging. Sustainability 2018, 10, 3258. [Google Scholar] [CrossRef]
- Aljohani, K.; Thompson, R.G. A stakeholder-based evaluation of the most suitable and sustainable delivery fleet for freight consolidation policies in the inner-city area. Sustainability 2018, 11, 124. [Google Scholar] [CrossRef]
Figure 1.
Interactions between the agents of the proposed model and summary of agent objectives and behaviors.
Figure 1.
Interactions between the agents of the proposed model and summary of agent objectives and behaviors.

Figure 2.
Environment.

Figure 3.
Cost results.


Table 1.
Summary of simulation studies based on reviewed agents. MAS—multi-agent system; UF—urban freight; DVRP—dynamic vehicle routing problem.
Table 1.
Summary of simulation studies based on reviewed agents. MAS—multi-agent system; UF—urban freight; DVRP—dynamic vehicle routing problem.
| Authors | Application | Problem Treated | Software | Type of MAS |
|---|---|---|---|---|
| [22] | Singapore | Various measures | SimMobility | Decision |
| [20] | Brazil | UF scenario with vulnerability | Matsim | Simulation |
| [36] | Japan | Cordon toll for heavy trucks | Matsim | Decision |
| [37] | Rome | Various measures of limited traffic zone | Netlogo | Decision |
| [18] | Generic | Various measures | Matsim | Decision |
| [35] | Indonesia | DVRP | NetLogo | Simulation |
| [21] | Generic | Distance-based and cordon-based | Not specified | Decision |
| [19] | Generic | Urban distribution centers | Not specified | Decision |
Note: * SimMobility (Massachusetts Institute of Technology, Cambridge, Massachusetts); Matsim (Berlin, Singapore and Zuric); NetLogo (Northwestern’s Center for Connected Learning and Computer-Based Modeling, Evanston, Illinois).
Table 2.
Input parameters.
| Agent | Parameters | Amount |
|---|---|---|
| Truck | Number of trucks | 6 |
| Weight | 1500 kg | |
| Volume | 10 m³ | |
| Speed | 10 km/h | |
| Truck stoppage time | triangularAV(15) mins | |
| Truck unloading time | triangularAV(8) mins | |
| Customer | Location | randomly |
| Choice of delivery option | Home or delivery lockers | |
| Order quantity | 1/year | |
| Average time to receive orders | 9 days | |
| Orders | Volume | Triangular (0.1, 1, 0.6) m³ |
| Weight | Triangular (5, 20, 15) kg | |
| Location for delivery | Home or delivery lockers | |
| Amount | 79/day |
Table 3.
Quantity of orders delivered and re-deliveries. DL—delivery locker; CDP—collection-and-delivery point.
Table 3.
Quantity of orders delivered and re-deliveries. DL—delivery locker; CDP—collection-and-delivery point.
| With Three Attempts | With One Attempt | |||
|---|---|---|---|---|
| Scenario 1 | Scenario 2 | Scenario 3 | Scenario 4 | |
| Total orders delivered to home | 25,053 | 14,300 | 12,170 | 12,216 |
| Total failed orders | 3408 | 1943 | * 4057 | * 4068 |
| Total DL Orders | 0 | 12,215 | 12,235 | 16,293 |
| Number of re-deliveries | 14,726 | 8401 | 4057 | 4068 |
| Total orders delivered | 25,053 | 26,515 | 28,462 | 28,464 |
Note: * Orders which failed on first attempt; however, they were delivered in a different CDP or DL location.
Table 4.
Distances traveled by trucks.
| With Three Attempts | With One Attempt | |||
|---|---|---|---|---|
| Distances (km) | Scenario 1 | Scenario 2 | Scenario 3 | Scenario 4 |
| Truck 1 | 4966 | 4520 | 2968 | 3745 |
| Truck 2 | 4577 | 3974 | 2833 | 3671 |
| Truck 3 | 4189 | 3714 | 2587 | 3192 |
| Truck 4 | 3931 | 3599 | 2320 | 2601 |
| Truck 5 | 3814 | 3304 | 2179 | 2367 |
| Truck 6 | 3847 | 2920 | 1984 | 2151 |
| Total | 25,324 | 22,031 | 14,872 | 17,728 |
Table 5.
Distance traveled by customers when picking up for their orders at the distribution center (DC) and delivery lockers and percentage of customers for each distance range. AHD—attended home delivery.
Table 5.
Distance traveled by customers when picking up for their orders at the distribution center (DC) and delivery lockers and percentage of customers for each distance range. AHD—attended home delivery.
| Scenario 2 | Scenario 3 | Scenario 4 | |||
|---|---|---|---|---|---|
| Distance Range (km) | DL Customer | AHD Customers | DL Customers | AHD Customers | DL Customers |
| <0.2 | 6.6% | 0.3% | 4.70% | 4.70% | 4.70% |
| 0.2 to 0.5 | 26.4% | 3.1% | 25.60% | 32.90% | 32.90% |
| 0.5 to 1 | 56.0% | 8.2% | 57.90% | 50% | 50% |
| >1 | 11.0% | 88.4% | 11.80% | 12.40% | 12.40% |
| Distances (km) | 19,677.0 | 11,868.0 | 19,890.0 | 5625.0 | 19,812.0 |
| Average distance/customer | 1.6 | 3 | 1.6 | 1.4 | 1.2 |
Table 6.
Distance traveled by customers by car.
| Scenario 2 | Scenario 3 | Scenario 4 | |||
|---|---|---|---|---|---|
| Distance (km) | AHD | AHD | DL | AHD | DL |
| <0.2 | 129.9 | 3.56 | 93.5 | 26.4375 | 93.1164 |
| 0.2 to 0.5 | 1558.4 | 110.37 | 1527.6 | 555.1875 | 1955.444 |
| 0.5 to 1 | 5509.6 | 486.59 | 5758.2 | 1406.25 | 4953 |
| >1 | 1515.1 | 7343.92 | 1642.9 | 488.25 | 1719.682 |
| 8713.0 | 7944.44 | 9022.1 | 2476.1 | 8721.2 | |
Table 7.
Parameters used to calculate a global index.
| Parameters | Amount | Parameters | Amount |
|---|---|---|---|
| Truck fuel consumption (L/Km) | 0.13 diesel | Percentage of productive time usage | 0.5 |
| Car fuel consumption(L/km) | 0.11 gasoline | Work time (min/month) | 13,200 |
| Diesel fuel cost (L) | $0.98 | External cost—truck factor | $0.74/km |
| Gasoline fuel cost (L) | $1.29 | External cost—car factor | $0.65/km |
| Monthly average for carrier income | $1.194 | Gain in receiving order | $0.5/order |
| Possibility of alternative use of time | 0.3 | Re-delivery attempt cost | $5/order |
Table 8.
Cost results.
| Scenario 1 | Scenario 2 | Scenario 3 | Scenario 4 | |
|---|---|---|---|---|
| 3232.4 | 2812.0 | 1898.3 | 2262.8 | |
| 1236.4 | 2407.5 | 1588.8 | ||
| T | 18,739.8 | 16,302.9 | 11,005.3 | 13,118.7 |
| C | 5663.5 | 11,027.9 | 7278.0 | |
| 16,416.2 | 14,902.6 | 12,166.6 | 13,264.7 | |
| 17,040 | 9715 | |||
| 6107.5 | 6117.5 | 8146.5 | ||
| −55,428.4 | −44,525 | −32,388.1 | −29,366.7 |
Table 9.
Summary of the improvement obtained by each agent in the simulation.
| Scenario 2 | Scenario 3 | Scenario 4 | |
|---|---|---|---|
| Carriers | Reduction of 13% in fuel and external costs Reduction of 9% Travel time costs Reduction of 1 truck | Reduction of 41% in fuel and external costs Reduction of 25% travel time costs Reduction of 2 trucks | Reduction of 30% in fuel and external costs Reduction of 19% travel time costs |
| Ecommerce Store | Increased number of orders delivered by 5.8% | Increased number of orders delivered by 13.5% | Increased number of orders delivered by 13.5% |
| Delivery Locker | Hosted 12,215 orders Gain of $6107.5 | Hosted 12,235 orders Gain of $6117.5 | Hosted 16,293 orders Gain of $8146.5 |
| Customers | 93% orders delivered Average number of kilometers traveled delivery locker customers 1.6 km 2.5% total cost reduction for customers * | 100% orders delivered Average number of km traveled AHD customers 3 km Average number of kilometers traveled delivery locker customers 1.6 km 19% total cost reduction for customers * | 100% orders delivered Average number of km traveled AHD Customers 1.4 km Average number of km traveled delivery locker customers 1.2 km 34% total cost reduction for customers * |
* To obtain a comparison with the baseline scenario for the customer costs, the following values were added: re-delivery costs, fuel costs, and external costs.
© 2019 by the authors. Licensee MDPI, Basel, Switzerland. This article is an open access article distributed under the terms and conditions of the Creative Commons Attribution (CC BY) license (http://creativecommons.org/licenses/by/4.0/).
Share and Cite
MDPI and ACS Style
Alves, R.; da Silva Lima, R.; Custódio de Sena, D.; Ferreira de Pinho, A.; Holguín-Veras, J. Agent-Based Simulation Model for Evaluating Urban Freight Policy to E-Commerce. Sustainability 2019, 11, 4020. https://doi.org/10.3390/su11154020
AMA Style
Alves R, da Silva Lima R, Custódio de Sena D, Ferreira de Pinho A, Holguín-Veras J. Agent-Based Simulation Model for Evaluating Urban Freight Policy to E-Commerce. Sustainability. 2019; 11(15):4020. https://doi.org/10.3390/su11154020
Chicago/Turabian StyleAlves, Roberta, Renato da Silva Lima, David Custódio de Sena, Alexandre Ferreira de Pinho, and José Holguín-Veras. 2019. "Agent-Based Simulation Model for Evaluating Urban Freight Policy to E-Commerce" Sustainability 11, no. 15: 4020. https://doi.org/10.3390/su11154020
Note that from the first issue of 2016, this journal uses article numbers instead of page numbers. See further details here.