1. Introduction
Organized societies require robust infrastructures, among which hydraulic projects, such as water supply and drainage systems, are most important. Because of its long history, Athens offers a useful study case in this respect. Due to its dry climate, it has suffered from water insufficiency and had to develop technology to deal with this problem since ancient times. During its history, the periods of social and cultural progress have been associated with successful management of water-related problems. The current water supply system is highly sophisticated and reliable and is a result of decision making based on social, technical and economic criteria, over time. Here we study the development of the Athens water supply system from the beginning of the previous century and we present historical information for the capital intensity of the implementation of various phases of the modern water supply system, as well as the price of water and the cost of large infrastructure of hydraulic works. To this aim, a systematic investigation had to be carried out to convert past prices and costs to their equivalents today, along with an assessment of the exploitation of natural resources with the specific hydraulic projects.
To evaluate the water supply system, the cost of constructing smaller reservoirs in Greece was correlated to the cost of the existing reservoirs, which feed the water supply system. To this aim, an economic model was developed to simulate the price of water and the cost of water storage with the size of reservoirs.
The findings of this study explain that if the people of Athens had chosen the construction of smaller reservoirs instead of the existing large-ones, the price of water and therefore the cost of living in Athens, would be significantly larger. We also observe that changing the scale of water infrastructures does not deviate from the so-called “0.6 rule” [
1], which quantifies the relationship of project scale and its cost (see details below). This result supports the utility of the so-called economies of scale in the development of large cities and aims to contribute to the debate on the necessity of large scale water infrastructures.
Our analysis does not consider risk analysis methods. For the latest issues and particularly the risk analysis methods of critical infrastructure as well as their effectiveness for assessing services in utilities, the interested reader may consult references [
2,
3].
2. Methodology
It is obvious that the natural water resources of Attica are not sufficient for the water needs of an ever-growing population and therefore resources that are far from the city had to be conveyed to Athens.
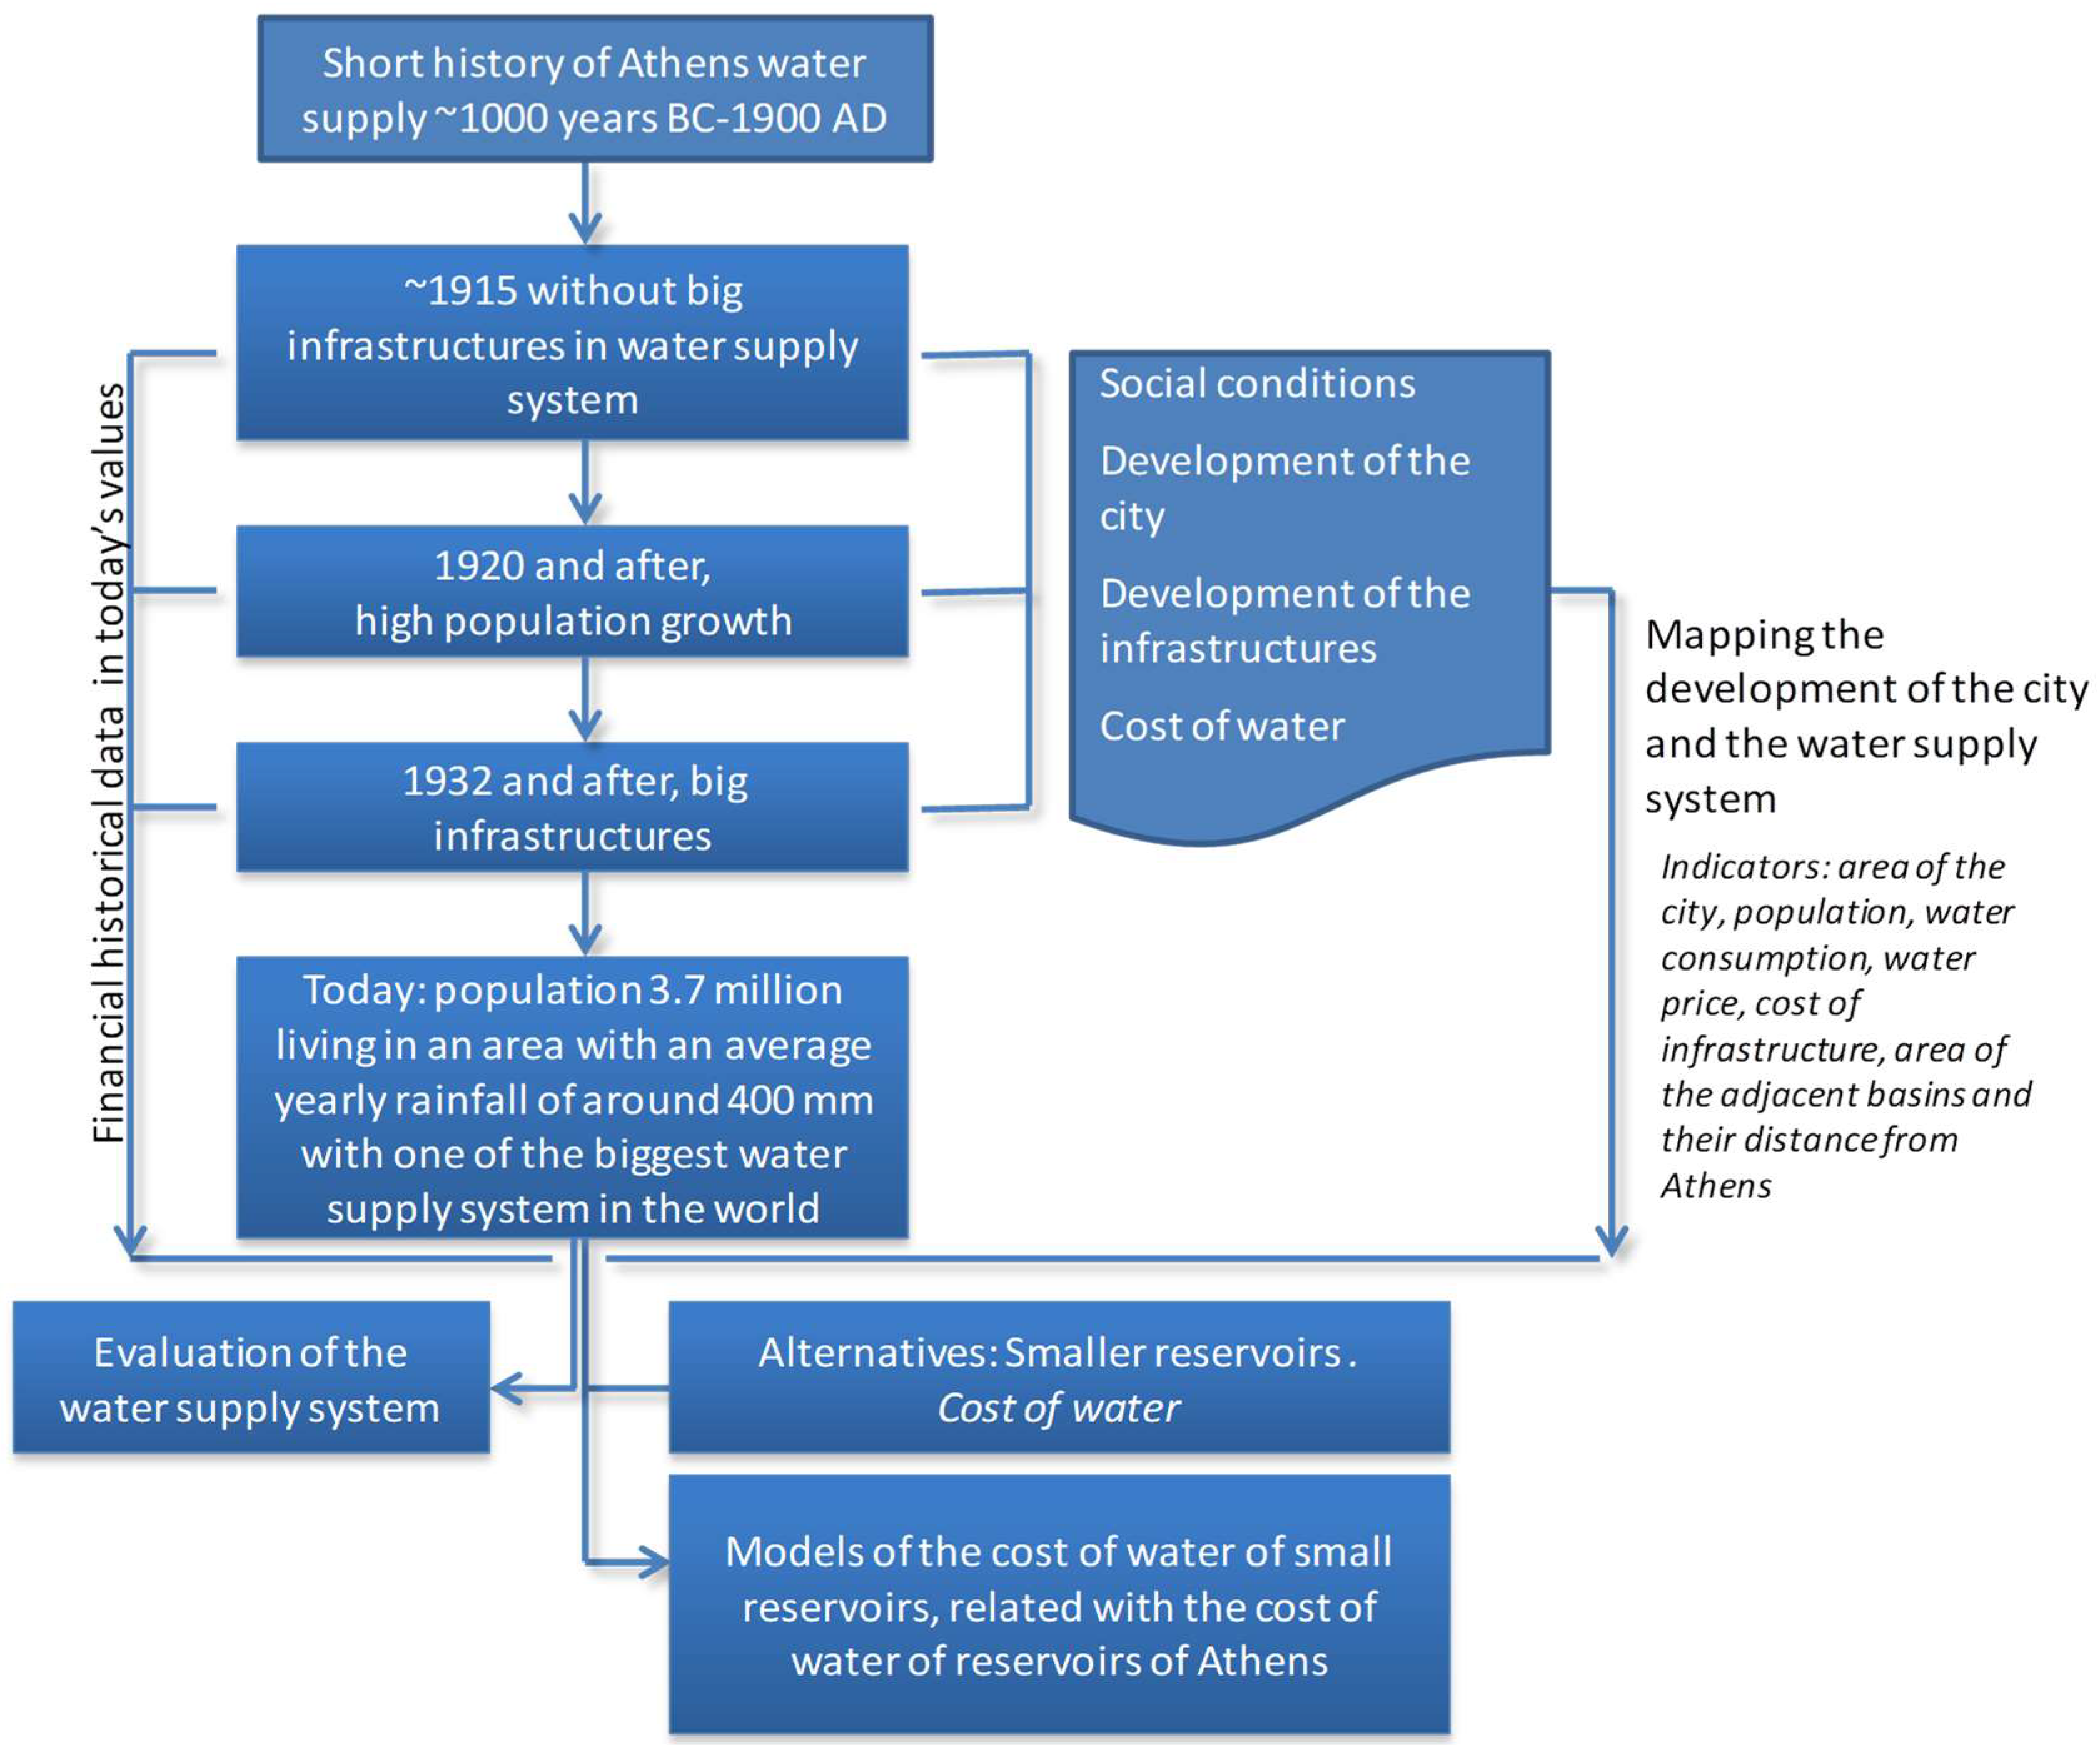
A short summary of the history of the water supply system of Athens may be useful in order to introduce the reader to the context of the study. The ancient system was in use in the 20th century, after maintenance in the 19th century, while the history of the modern system dates from the 1920s with the construction of large-scale infrastructure. However, we were able to find data for the water costs from some years before, namely from 1913.
For the first step of the methodology we follow, we investigated:
The social conditions of the 20th century, which explain the growth of population and the development of the city.
The water supply system and the related costs.
For the second step we analyze:
Historical financial data, converting them to today’s equivalents.
Other data related to water supply such as the average consumption per person per year, total (cumulative) supply capacity of the system per person per year and supply to demand ratio.
As an indicator of the development of the water supply system this analysis presents the development of the area of the adjacent basins and their distance from the city.
In the third step, we compare large-scale works of water infrastructure with smaller-scale alternatives, using data for small reservoirs in Greece.
Figure 1 illustrates the overall methodology in a flow chart form.
Overall, the questions studied are: Was the water supply system of Athens, in its current form (one of the world’s greatest [
4,
5]), necessary? In view of the increase of the population of Athens in the 20th century and its relationship to the water supply system, was the internal migration of citizens justified? What was the necessary capital intensity for the infrastructures of the water supply system to support this migration? Are these infrastructures justified by economic parameters? Are there any other changes with respect to economical, technical and social issues?
3. Social Conditions
It is estimated that Athens in 4th century BC had 160,000 inhabitants [
6]. At the time of Handrian, in the 1st century AD, the population was estimated at 30,000 [
7]. Ancient Athenians had developed particularly long aqueducts, for their era, which are admirable both for their extent and durability, as some are still in operation. Like their ancestors, modern Athenians are able to combine the convenient and healthy way of living in a dry climate by using advanced technology to transfer water from less dry areas. The difference however is in scale, as now they can transfer water in larger quantities and across longer distances, from the wetter western part of Greece. The aqueduct’s longest path from Evinos to Athens (Acharnae Water Treatment Plant) is about 217 km (without counting the passage across the Mornos reservoir).
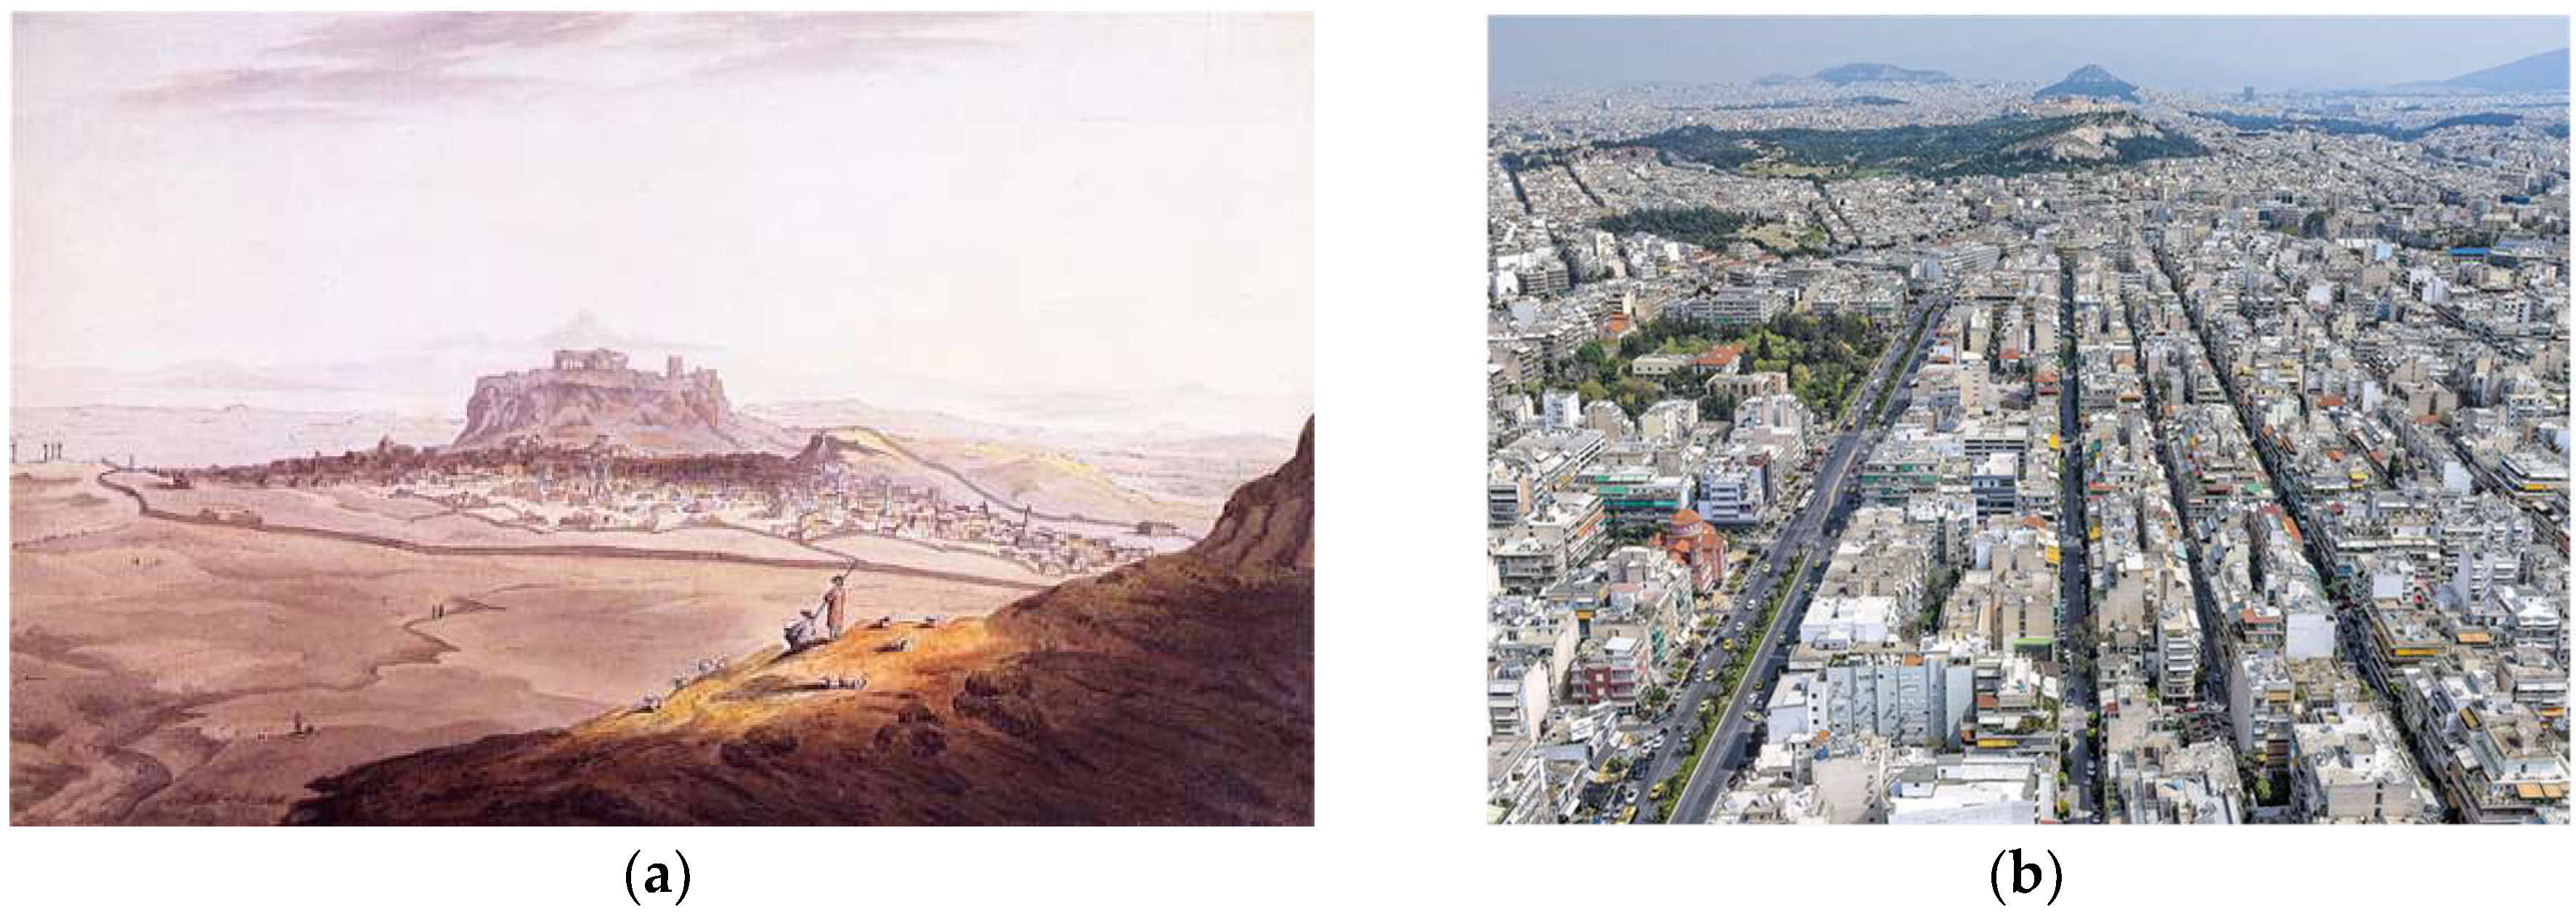
The great change in the scale of the city of Athens took place as soon as it was chosen to become the capital of the new Greek state (
Figure 2). The establishment of the capital city caused a large influx of new residents. From around 12,000 in 1834, their number doubled over the next decade [
8,
9,
10]. However, the prediction of 40,000 inhabitants by the architects who designed of the new city (Kleanthis-Schaubert) did not happen before the 1860s and the “milestone” of 100,000 inhabitants was not overtaken before the late 1880s.
The causes of this growth are related to the function of the city as a primarily administrative and secondarily an industrial-productive center. The evolution of Athens in the 20th century is connected to the history of modern Greece with its characteristic phases of mutation: the Asia Minor Disaster (1922), the Second World War (1939–1945) and the internal immigration of the population after the civil war (1946–1949), since the anonymity of the big city helped conceal the political friction and the tragic incidents of the civil war.
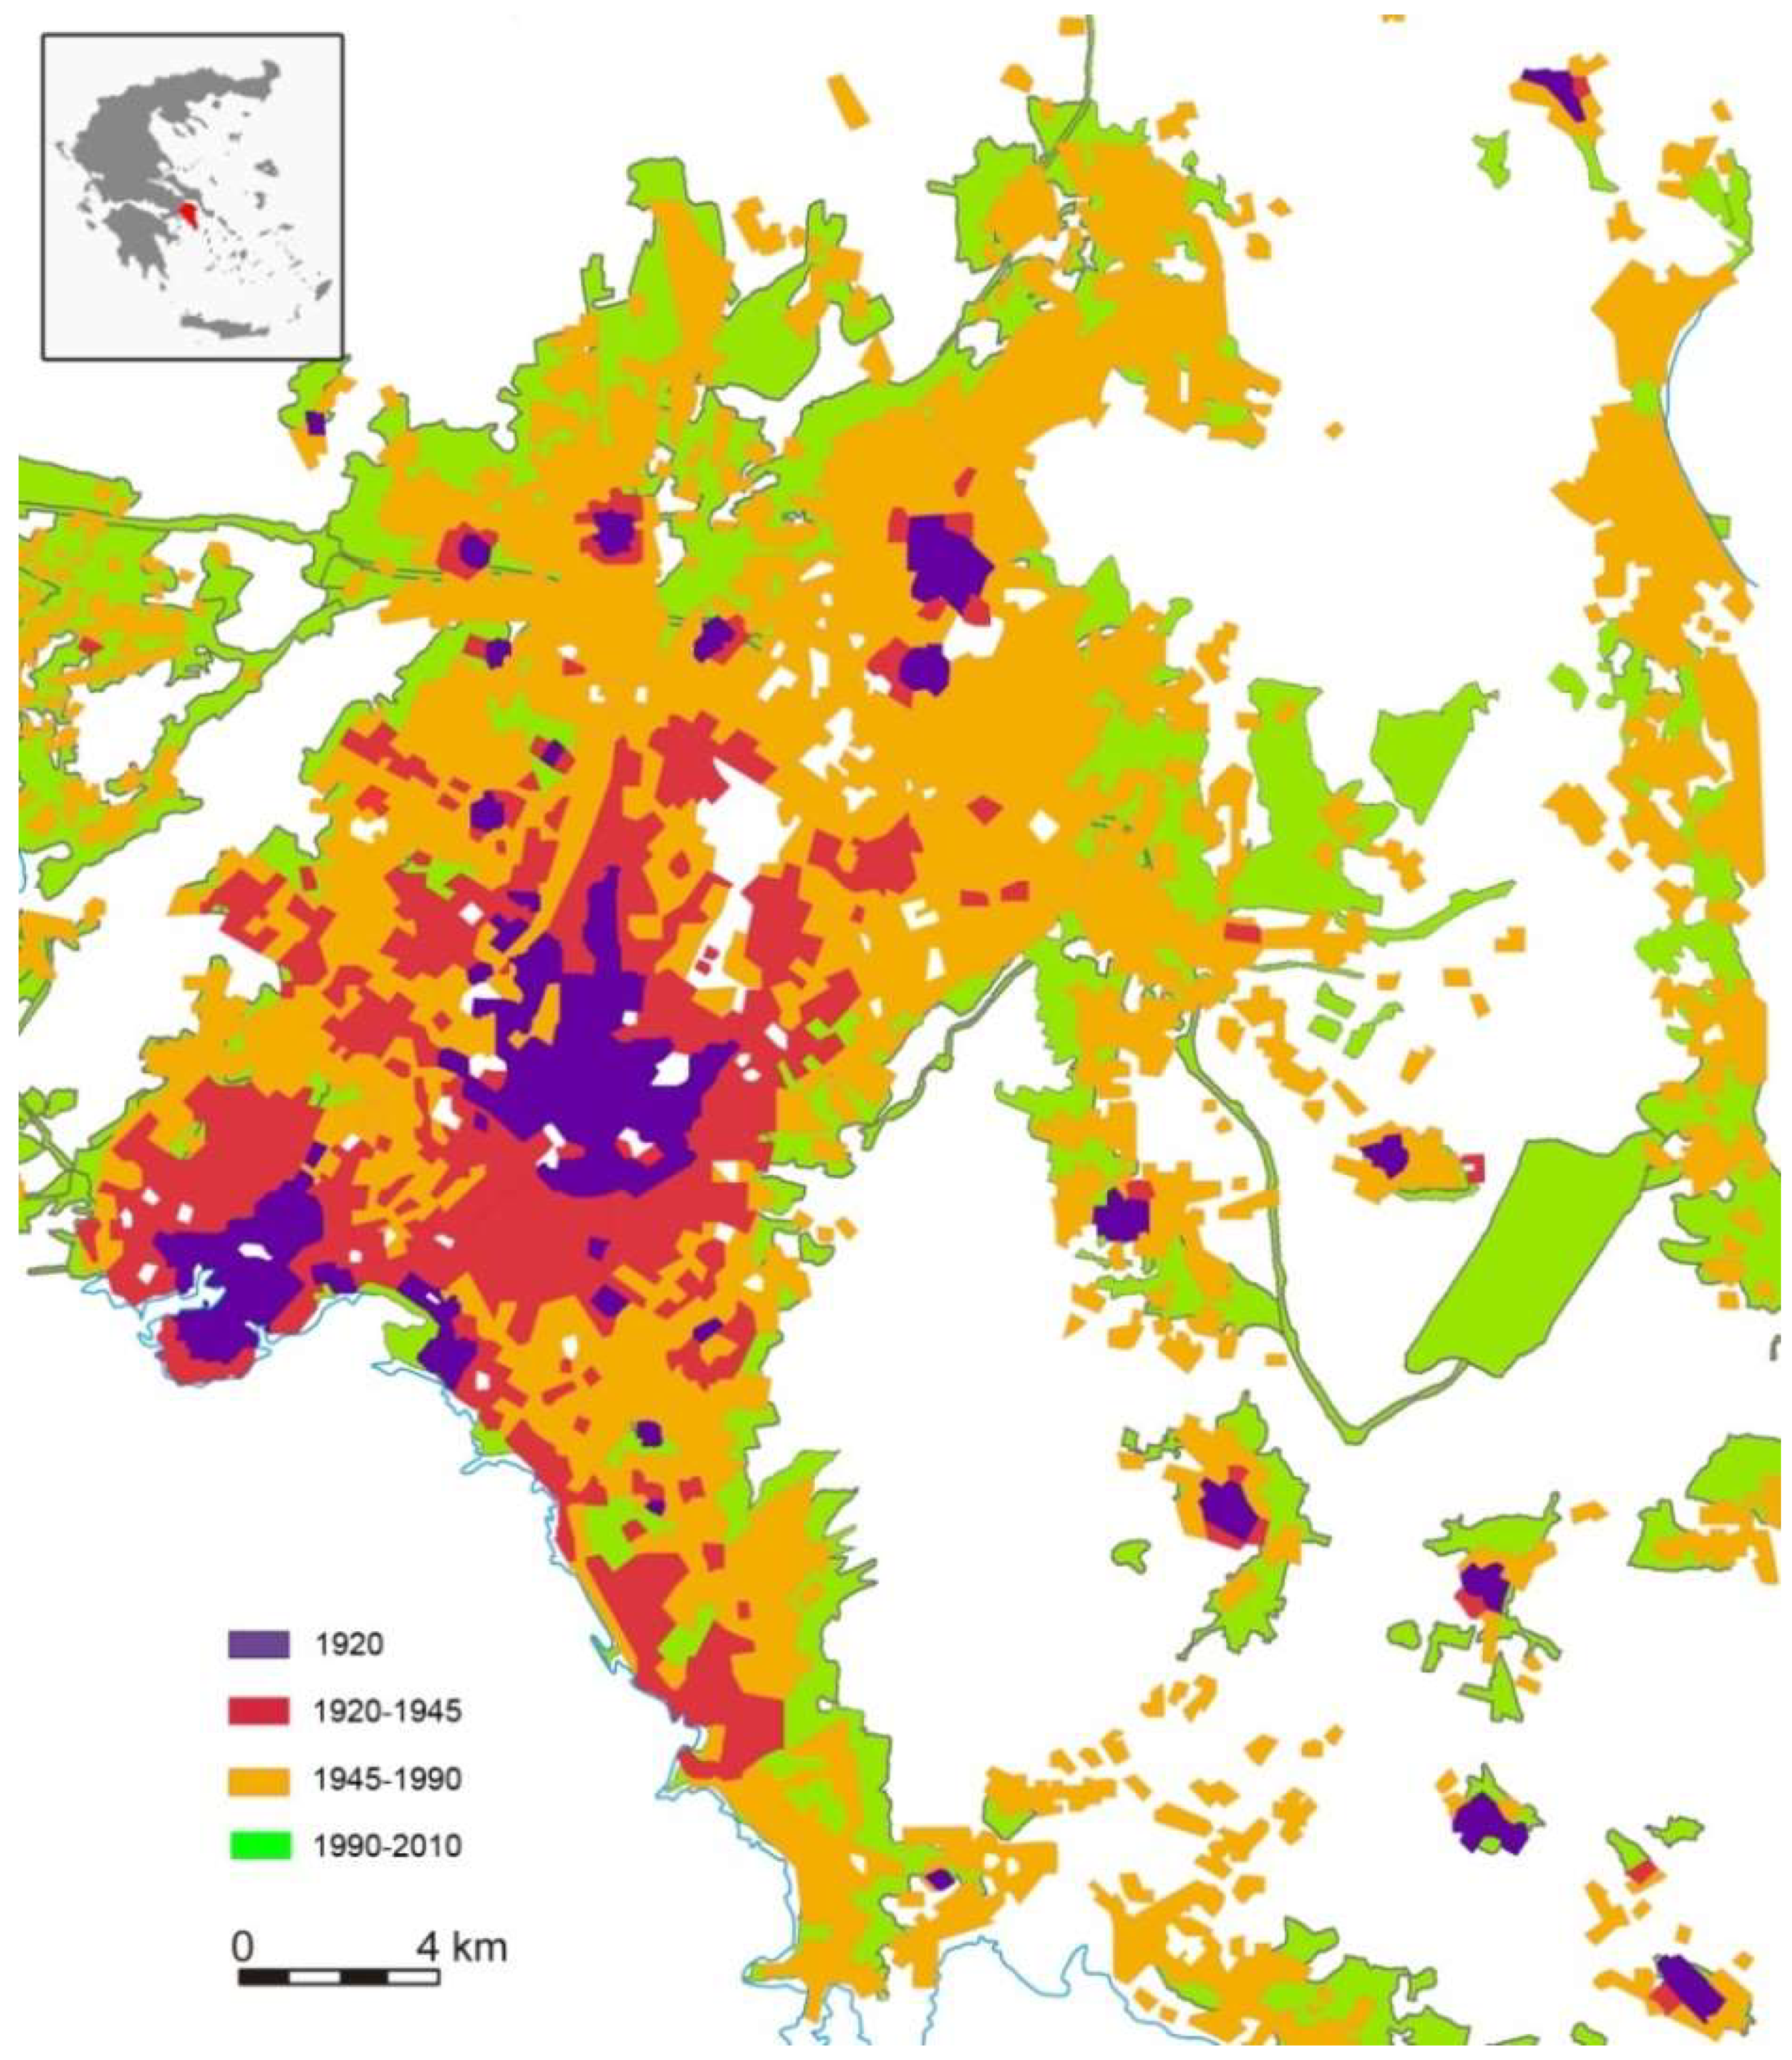
During the 20th century Athens developed as the center of Greece (
Figure 3), generating 47.3% of the Gross Domestic Product GDP of Greece [
13]. Big capital investments were needed for the construction of modern infrastructure (e.g., Athens is the only city in Greece with a metro).
4. The Development of the Water Supply of Athens
Athenians of the classical era were drinking water from wells, a few springs and from aqueducts, of which the Peisistratian [
14] aqueduct was built around 530 BC and is in operation until present date. The longer Hadrianic aqueduct was built in 134 AD.
Until the beginning of the 20th century, the water supply of the city was based on the ancient hydraulic works [
15], mostly the Hadrianic aqueduct, wells and other small-scale hydraulic infrastructures. The water price was determined on a subjective basis and the management of the water was made with the criteria and traditions of the Ottoman Empire [
16] (e.g., increased corruption meant that in many cases the manager would alter prices according to relation with the customers, bribes etc.). It is also estimated that, at the time, more than half of the income from water sales were lost.
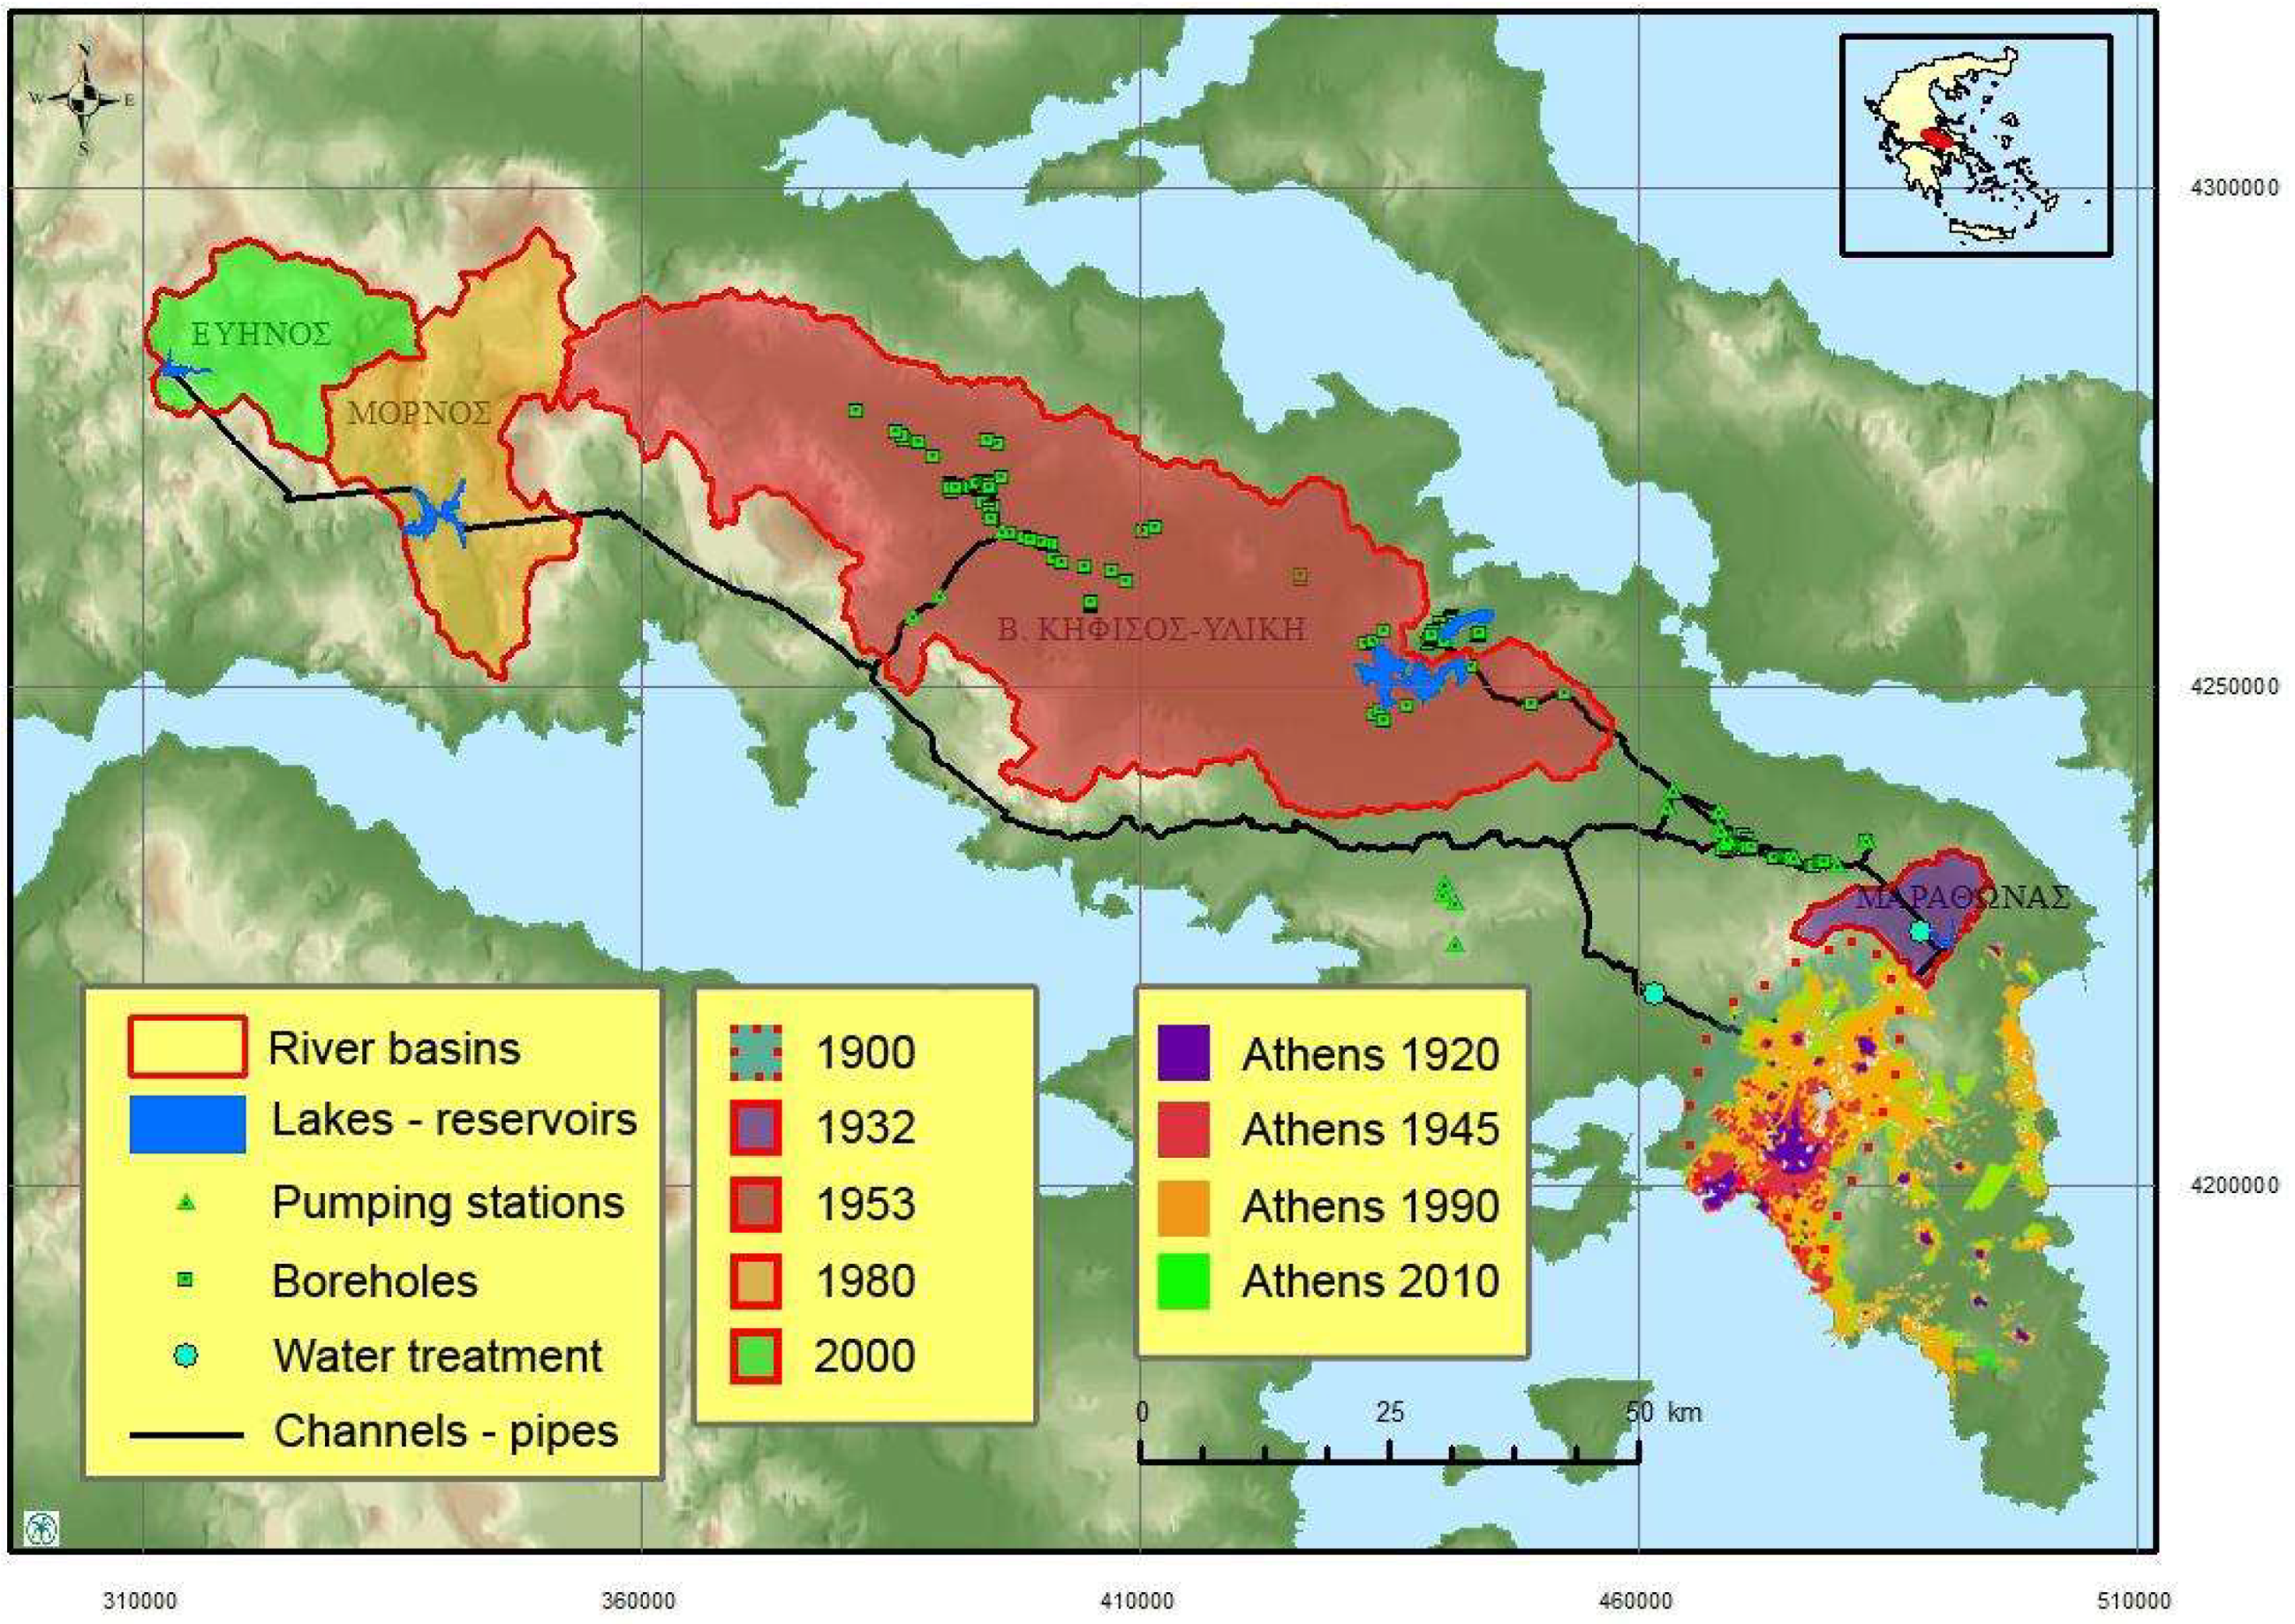
As the city started to grow, the old system became inadequate and large hydraulic projects had to be constructed.
Figure 4 and
Table 1 show the development of large hydraulic works during the 20th century in Athens [
4,
17,
18,
19,
20].
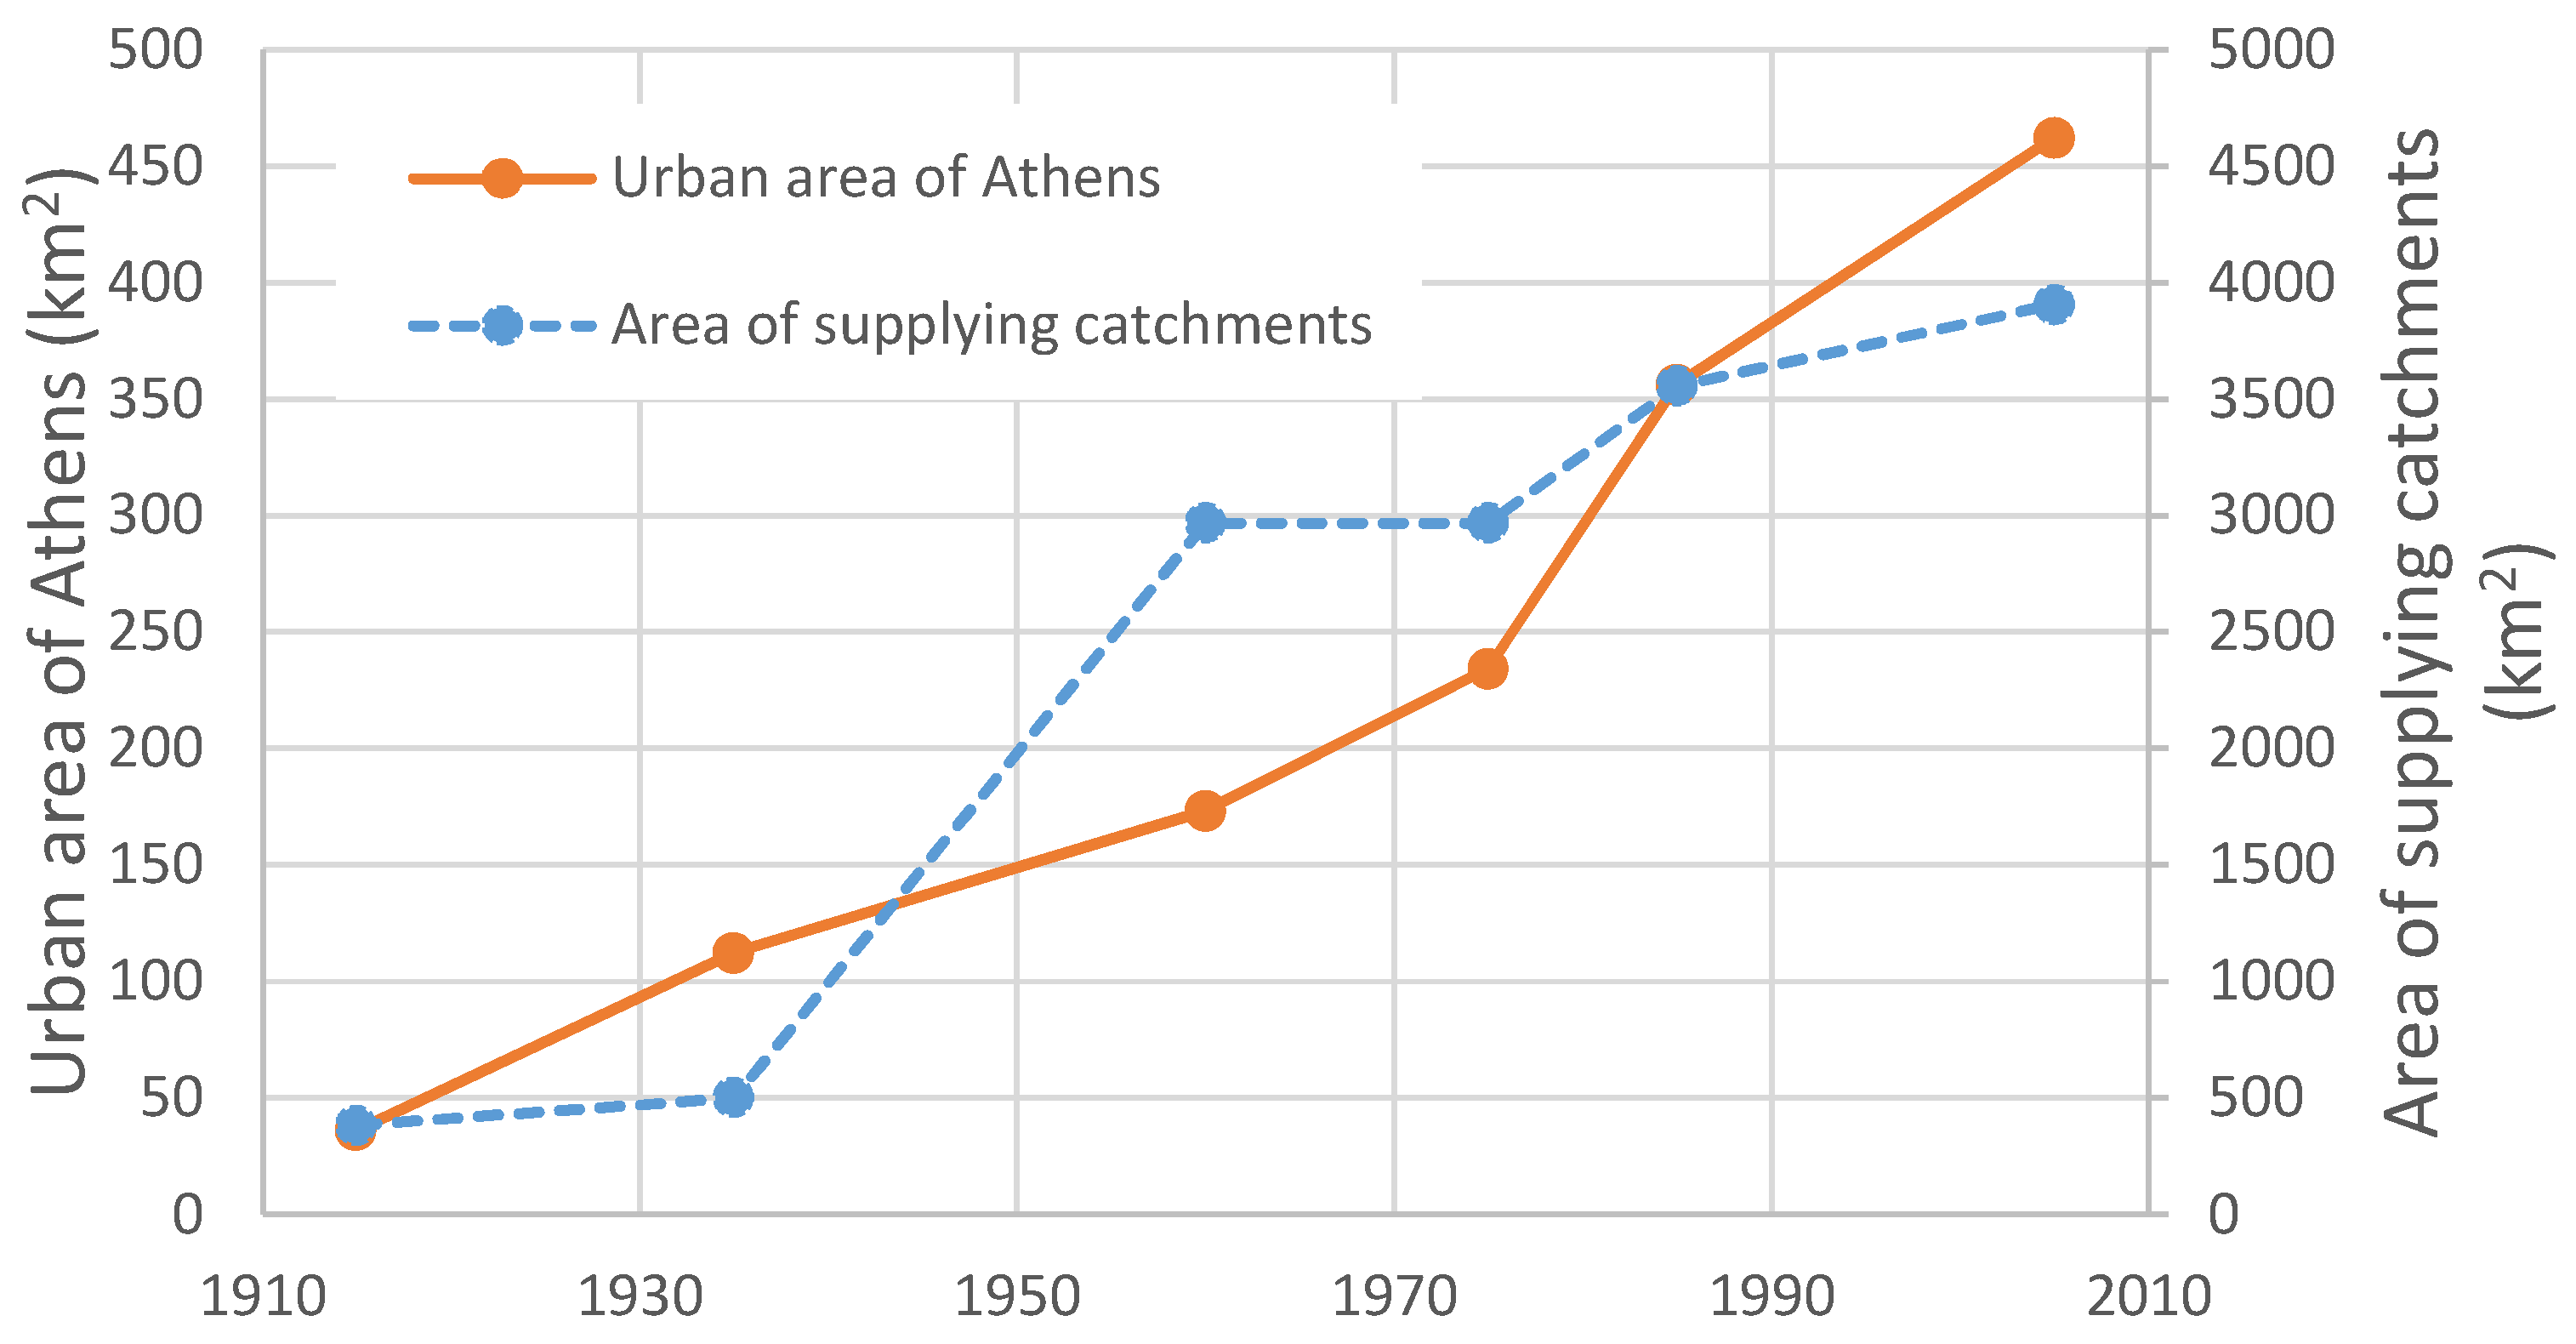
Attica is a dry area, with an average yearly rainfall of around 400 mm, so the city has to be supplied with water from basins whose distance from Athens continuously increased, ranging from 25 to 180 km (straight line distance). Today, the people of Athens live in an area of 462 km
2 and consume water resources from an area of 3906 km
2. The development of the city was accompanied by extensive urbanization of local streams [
23].
The inflows to the system, shown in
Table 1, depend on the annual hydrological balance of the basins. In surface works, inputs represent the mean inflow, while in groundwater projects the pumping capacities. The system capacity is estimated by historical data in view of the depletion conditions of each historical system configuration. The total capacity after the construction of Evinos is estimated by system simulations.
5. Data and Examination Periods
In the analysis that follows we examine the socio-economic conditions before construction and after the construction of large scale projects. Social, urban and technical data were compiled from relevant studies and were further processed. Older demographic, urban and technical data were easily accessed and compared to contemporary data, but the same could not be said for the economic data. Since the value of money is changing, in order to be able to assess economic data, a correlation of the value of currencies in which the costs and prices were measured at the time to the present currency had to be obtained.
The calculations were more and more difficult as we went back in time. Indeed, both finding data on the price of water and hydraulic infrastructures and converting them to current € becomes more difficult. From 1959 onwards, official data for the price of water have been published, including the conversion of drachmas in current €. From 1922 to 1959, some satisfactory data can still be found but not always from official sources. Finally, from 1910 to 1922 data were based on limited literature and the conversion of drachmas to € was made using ad hoc approaches, as there was no relevant literature to resolve this issue formally.
It should be noted that the value of currencies, and money in general, depends on highly complex parameters including social conditions, wars, financial changes, devaluations and revaluations. The further we go back in time, the drachma conversion in current € becomes more of a rough estimate than an accurate calculation.
Appendix A provides a description of the bibliographic data and financial methods used in each time period based on data availability.
6. Data Processing and Analysis
The analysis is focused on the operation of the water supply system and on defining its operational-economical technical and social indicators. As boundary conditions change over time, with the construction of the new components of infrastructure, we identify the changes in several parameters of the water supply system, utilizing historical data [
24].
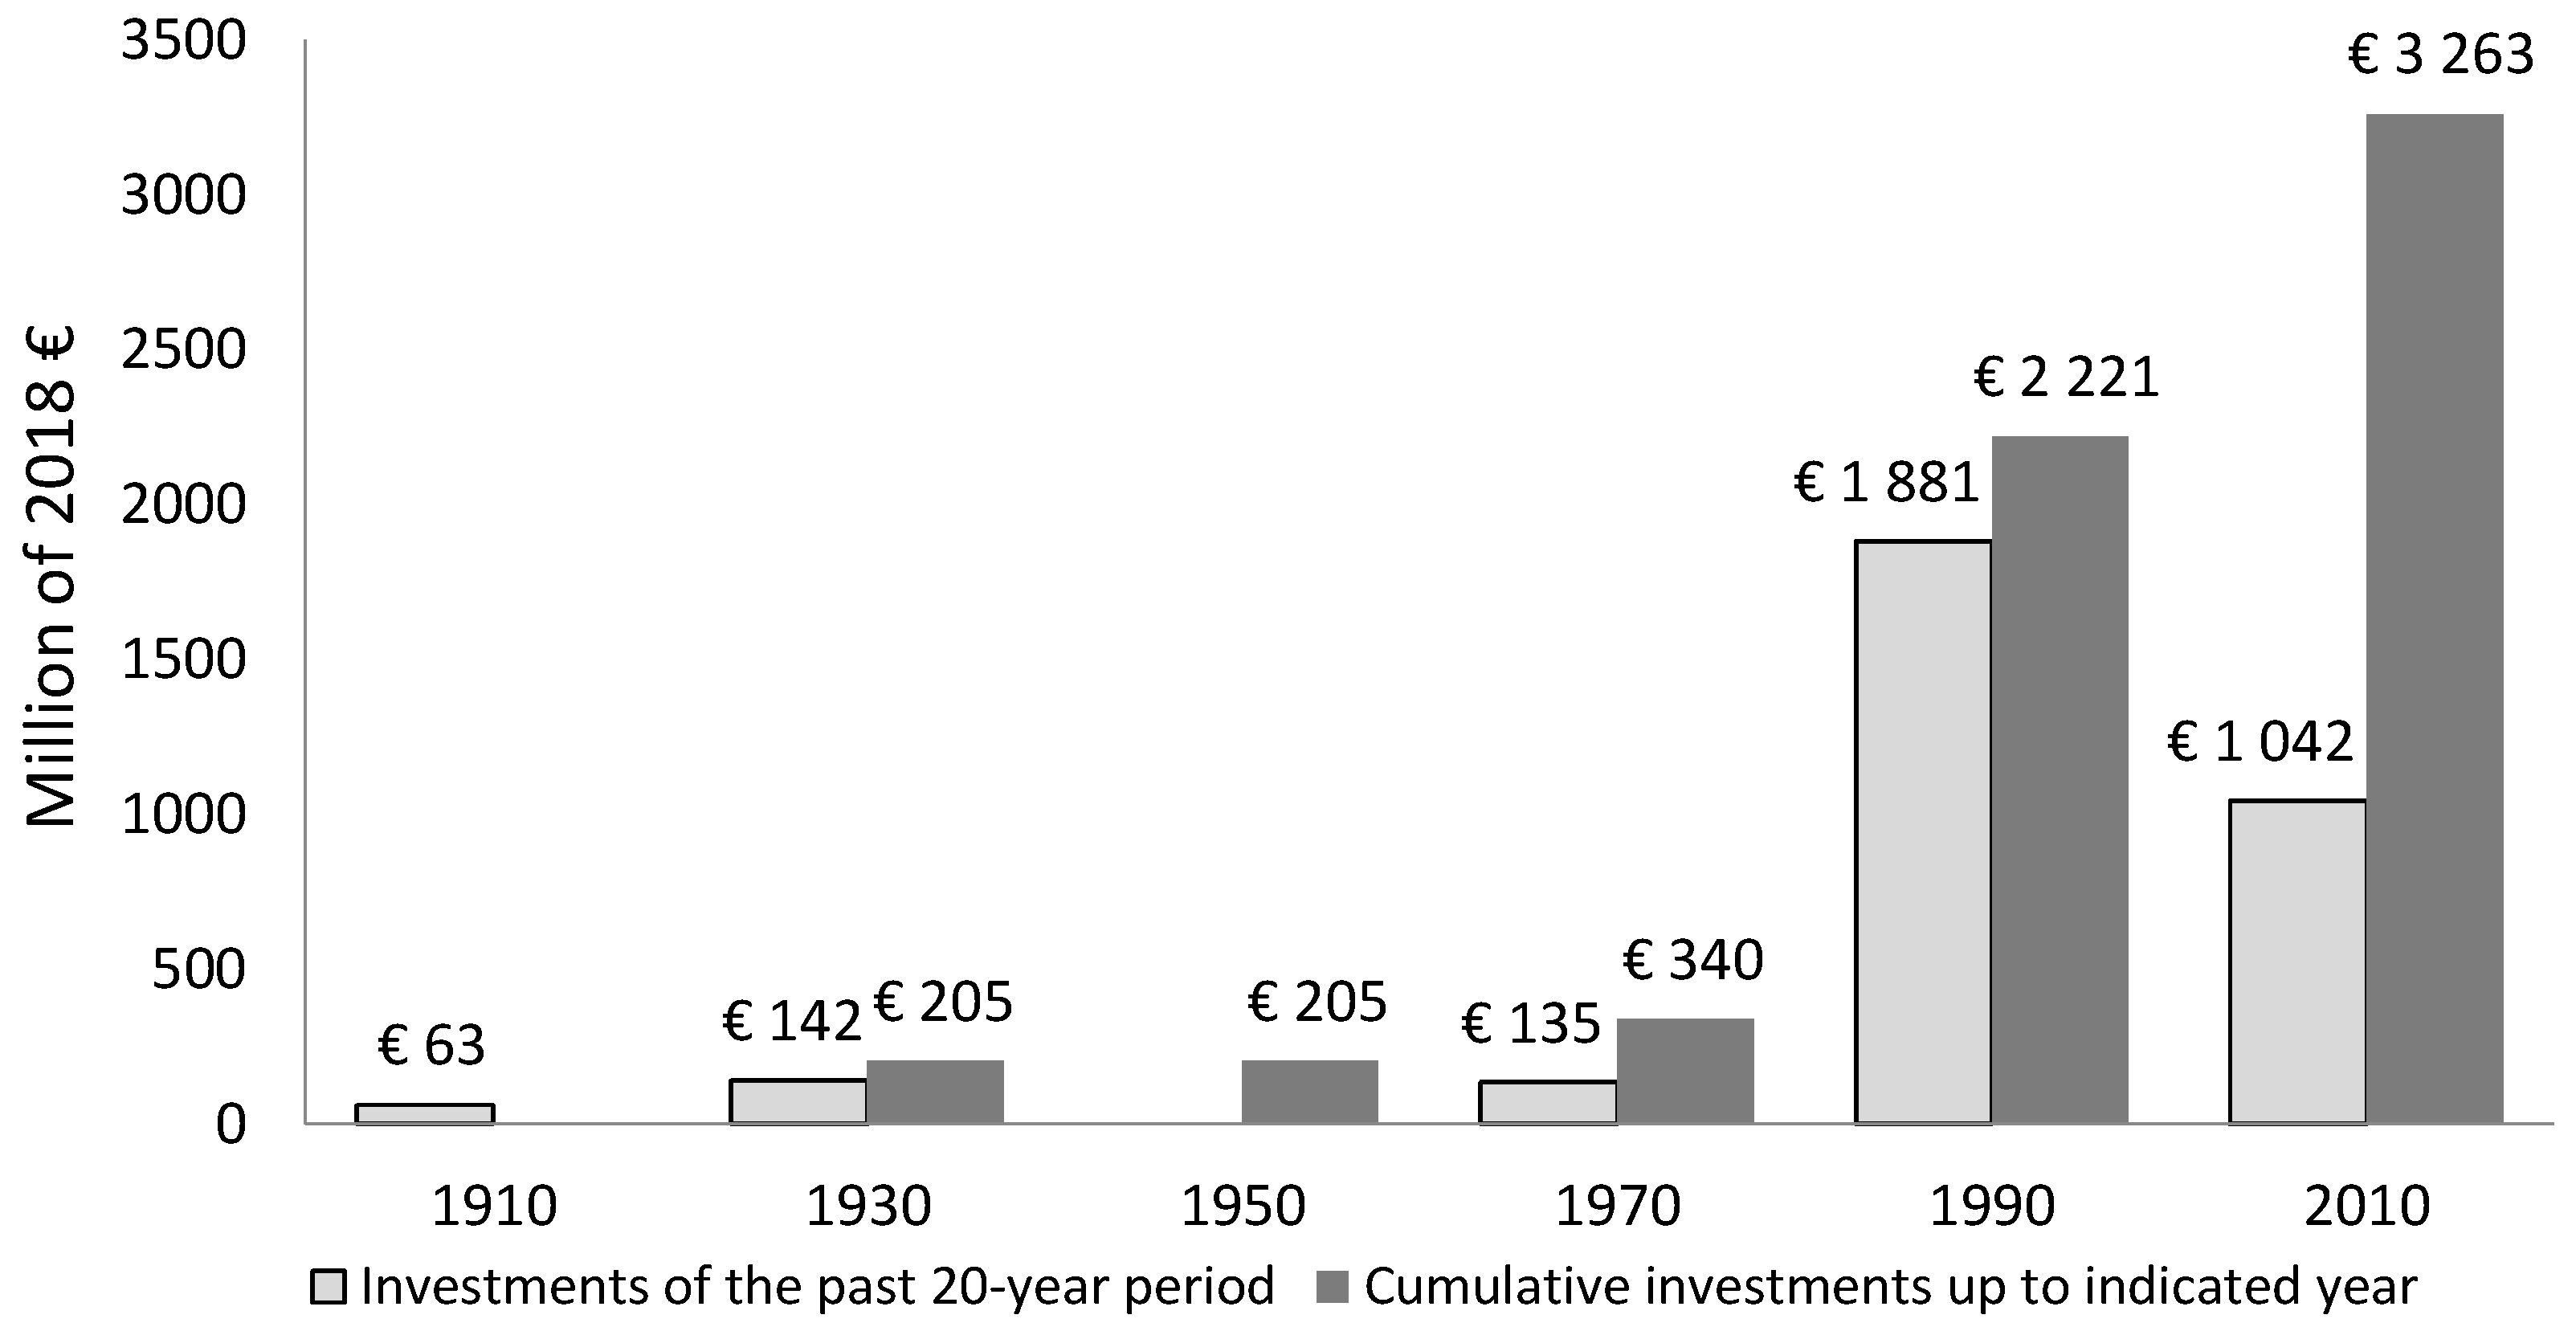
Figure 5 shows the capital investments for the water supply system of Athens. It is observed that if the same infrastructure were constructed today, the cost would be, as an order of magnitude, 1000 €/person (3,263,000,000 €/3,700,000 inhabitants). If we consider that a typical house for a family of four persons in Athens in 2018 costs about 100,000 € and that ≈5% of the cost is the plumbing infrastructure inside the house, the investment of the public hydraulic infrastructure represents a roughly equal amount of private hydraulic investment and, with their sum representing about 10% of cost.
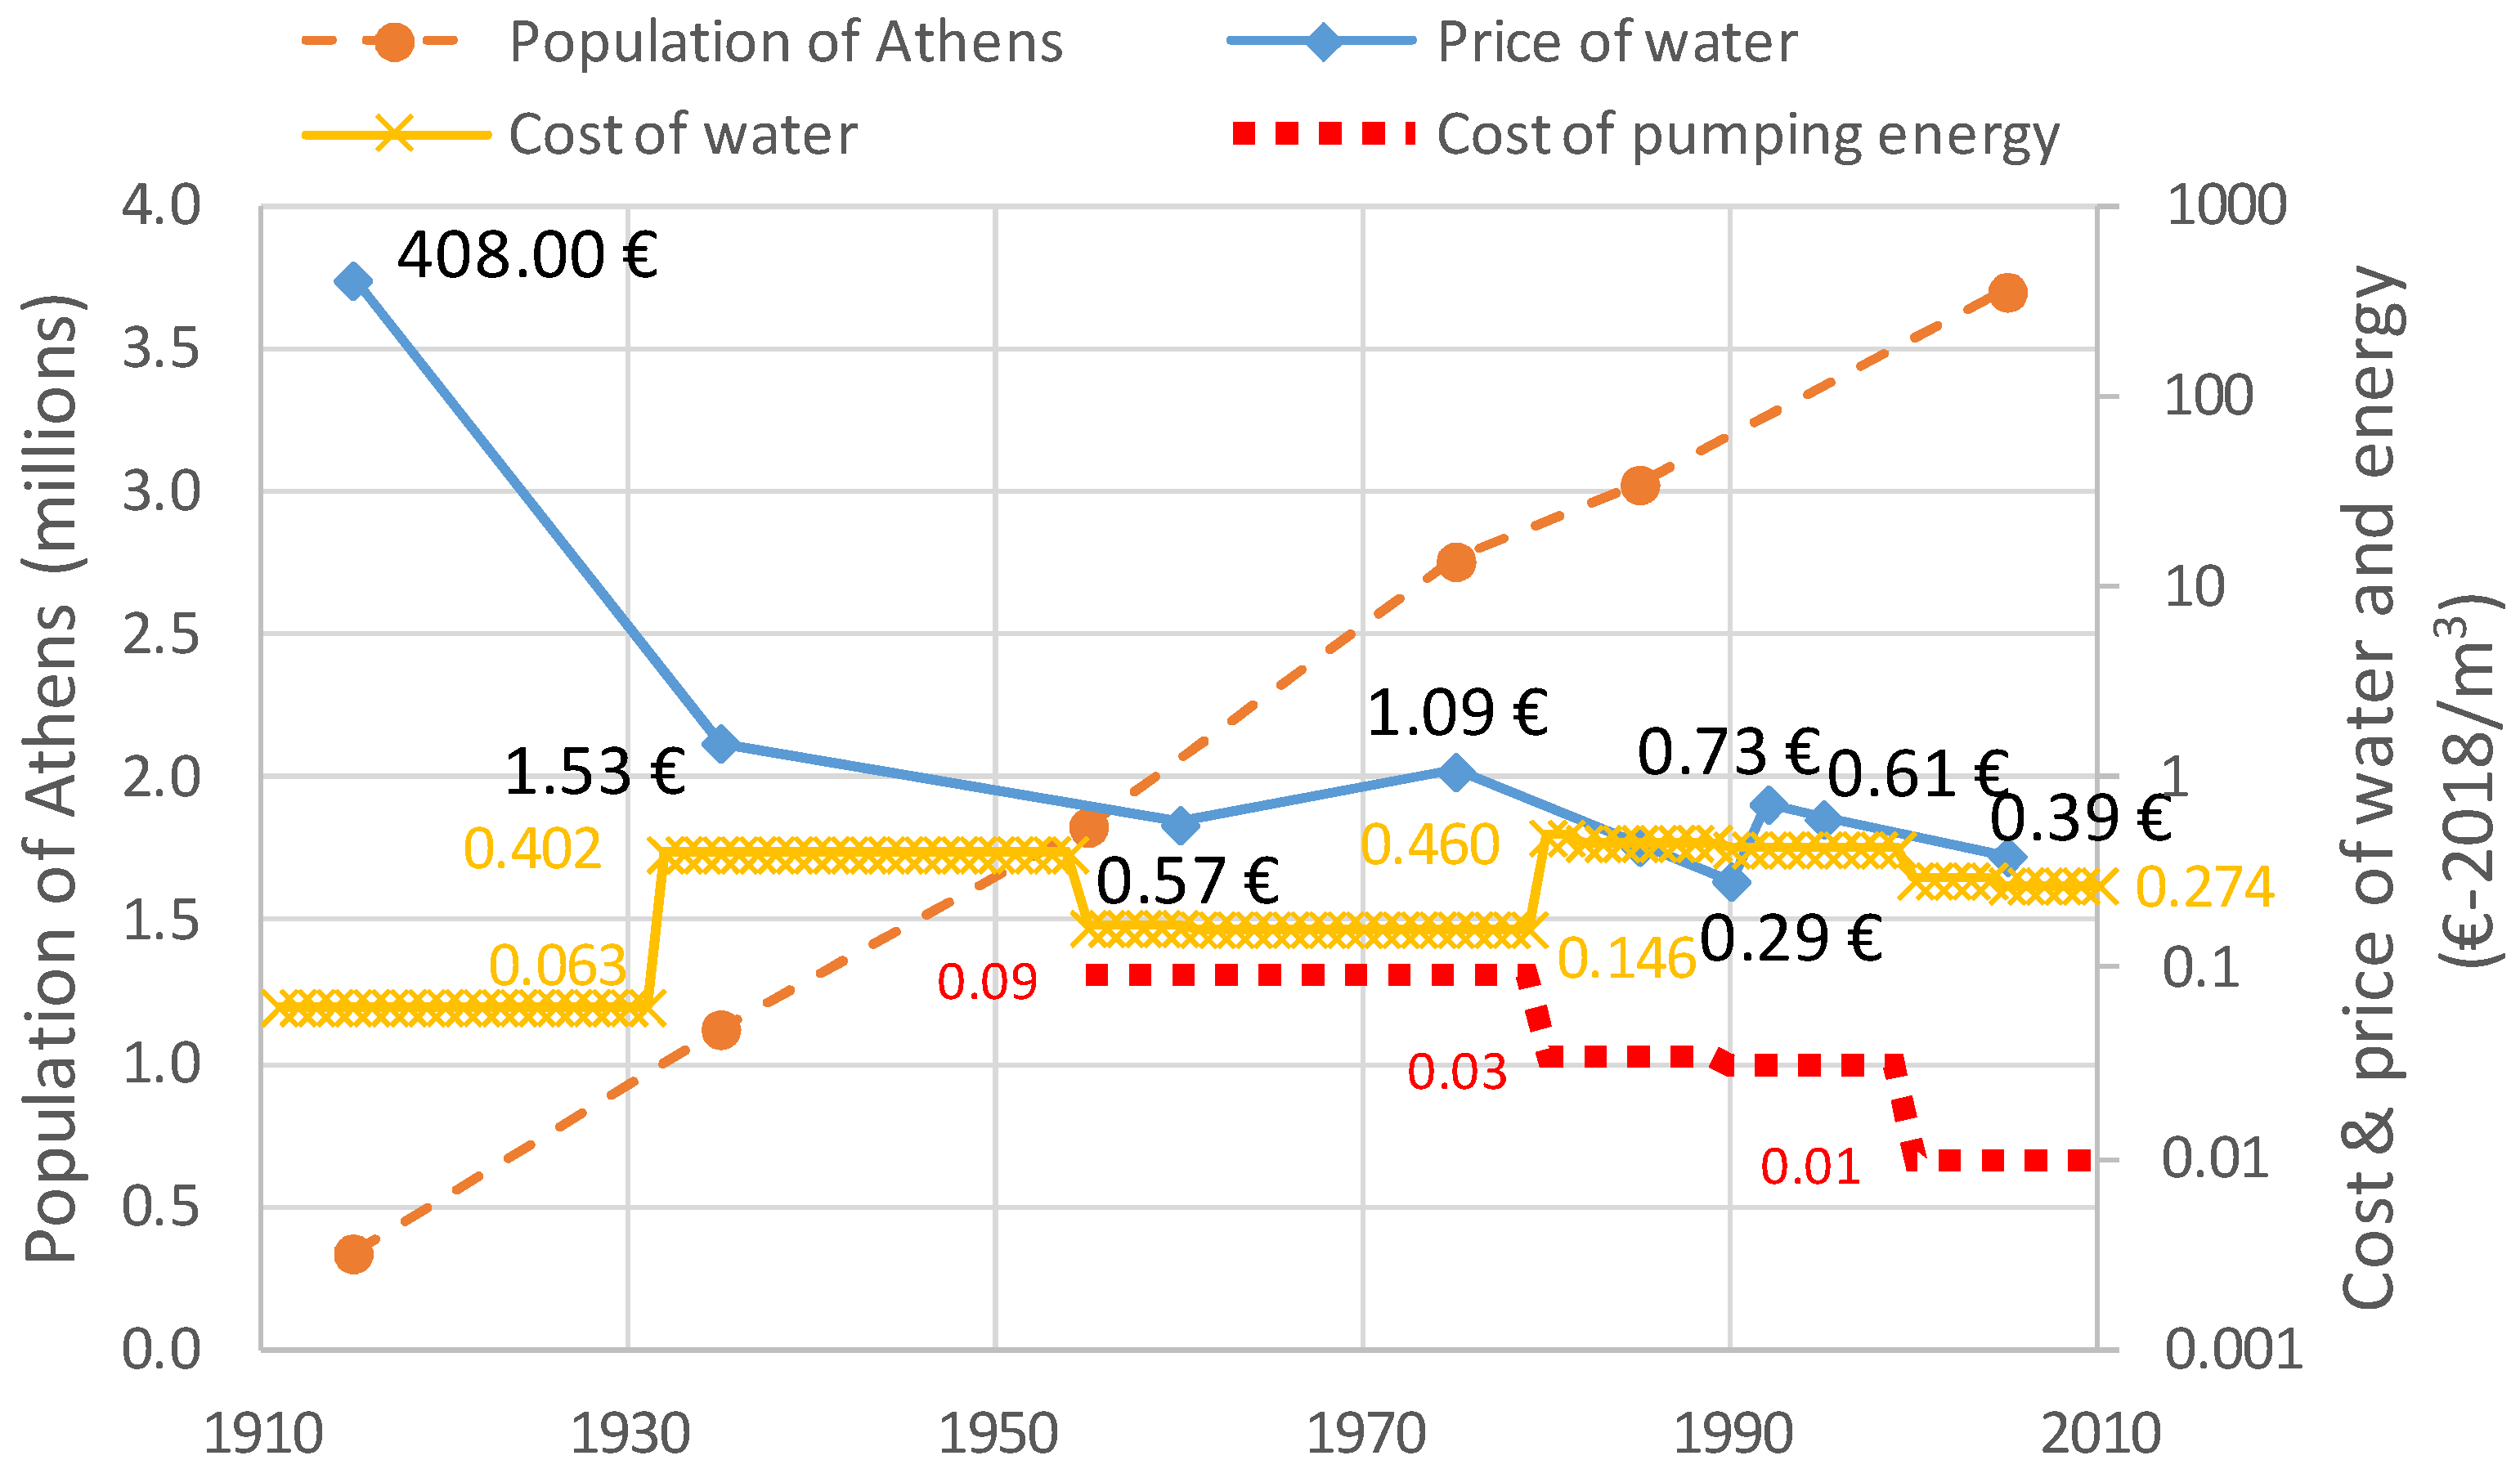
Figure 6 shows the evolution of the population of Athens over the last 100 years alongside with the cost and the price of water. The population of Athens comes from census data. The water price and cost were converted to 2018 € as already described. To determine the cost of water per m
3 the capital recovery factor was based on an assumed interest rate of 6%, which is the most typical assumption in similar cases (for example, the Department of Water Resources of California [
37] uses this value to analyze the benefits and costs of water projects).
The first dramatic drop in price from 1910 to 1935 (
Figure 6) can mostly be attributed to the construction of the first dam (Marathon) and the construction of the water distribution network (started 1926). Price is also reduced in the period from 1930 onwards, at a much slower rate. In the period before the construction of the Mornos dam, roughly from 1970 to 1980, the price was increased as a result of the unexpected high cost of that dam. An increase of the water price also happened during the prolonged drought of 1988–1995 to discourage water consumption, in a period of water scarcity for Athens [
40].
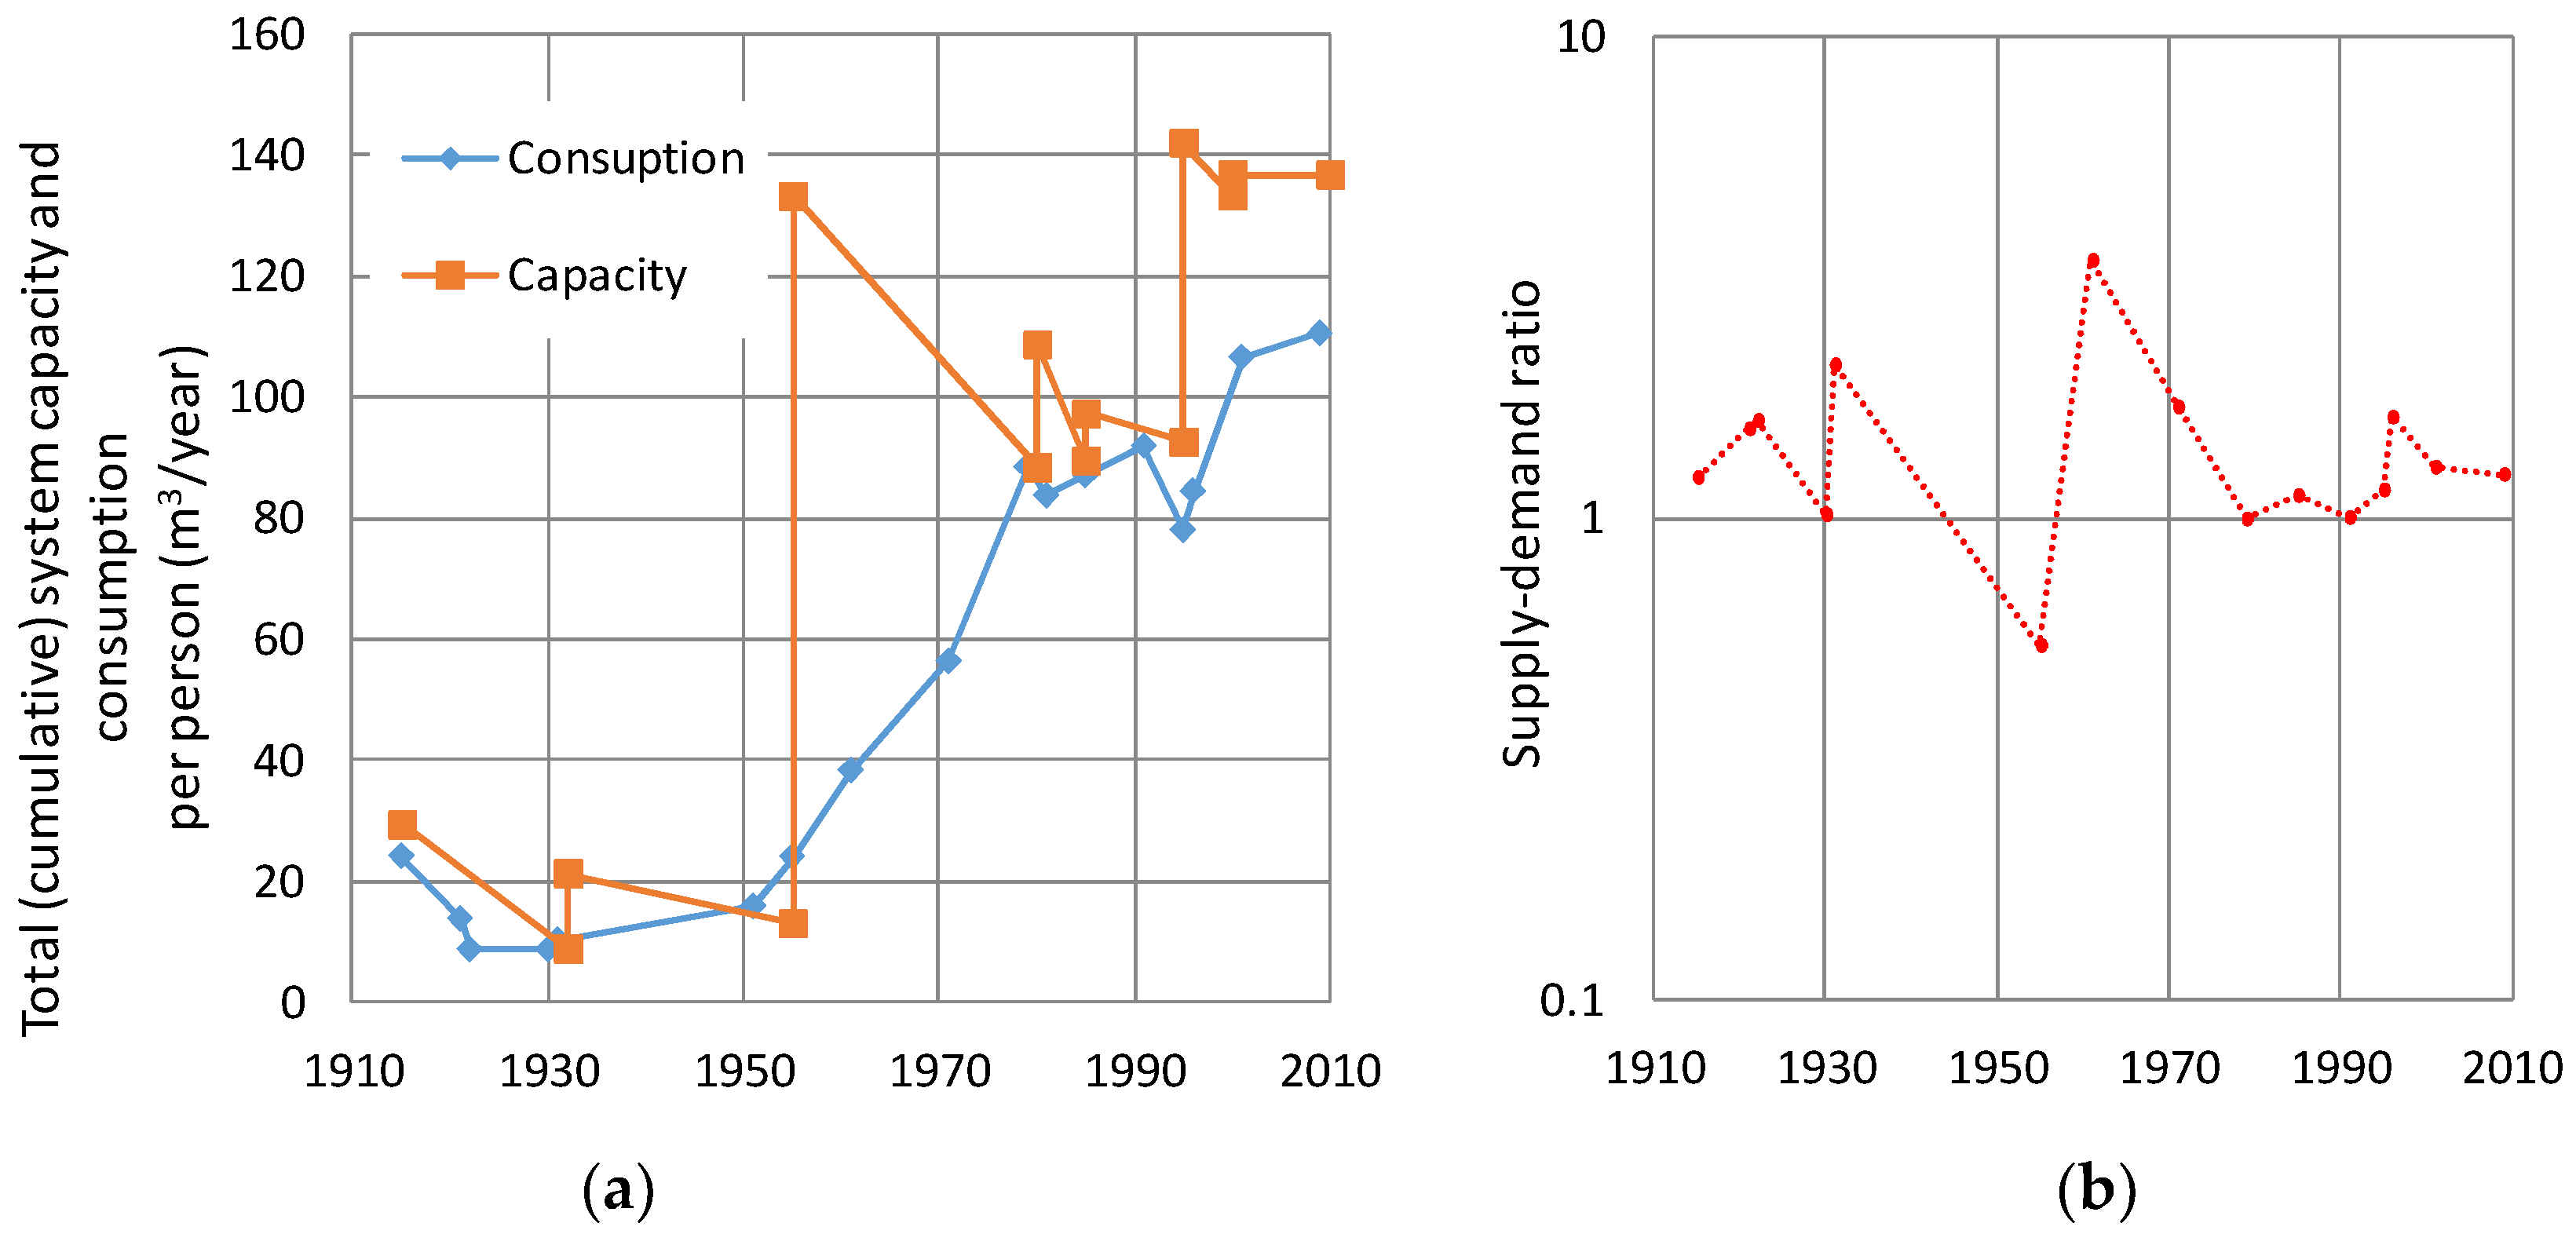
Figure 7 shows the average water consumption per person and the total (cumulative) capacity per person and is used as an indicator of the availability of water and the correlation between the abundance of the resource and its consumption. The supply-demand ratio, also plotted in the graph, is useful to evaluate these curves. As the total capacity increases, so does the consumption of water. It is possible that the abundance of the resource contributes to overconsumption alongside GDP increase and technological development.
Figure 7 also demonstrates why Mornos dam was necessary due to the spectacular decrease of the supply-demand ratio between 1960–1980 (before the construction of Mornos dam).
Observing
Figure 7, it can be noted that before 1955 people in Athens lived with less than 20 m
3/year (55 L/d); the life style leading to that low consumption is described in historical documents [
20,
25]. Thereafter, water consumption increased substantially but once again during the period of the seven-year drought (1988–1995), it dropped as a result of the demand management measures, including engagement of people, increasing-block tariffs and penalization of some water uses [
40]. The entire campaign was very successful and despite the long duration and the severity of the drought there was no system failure.
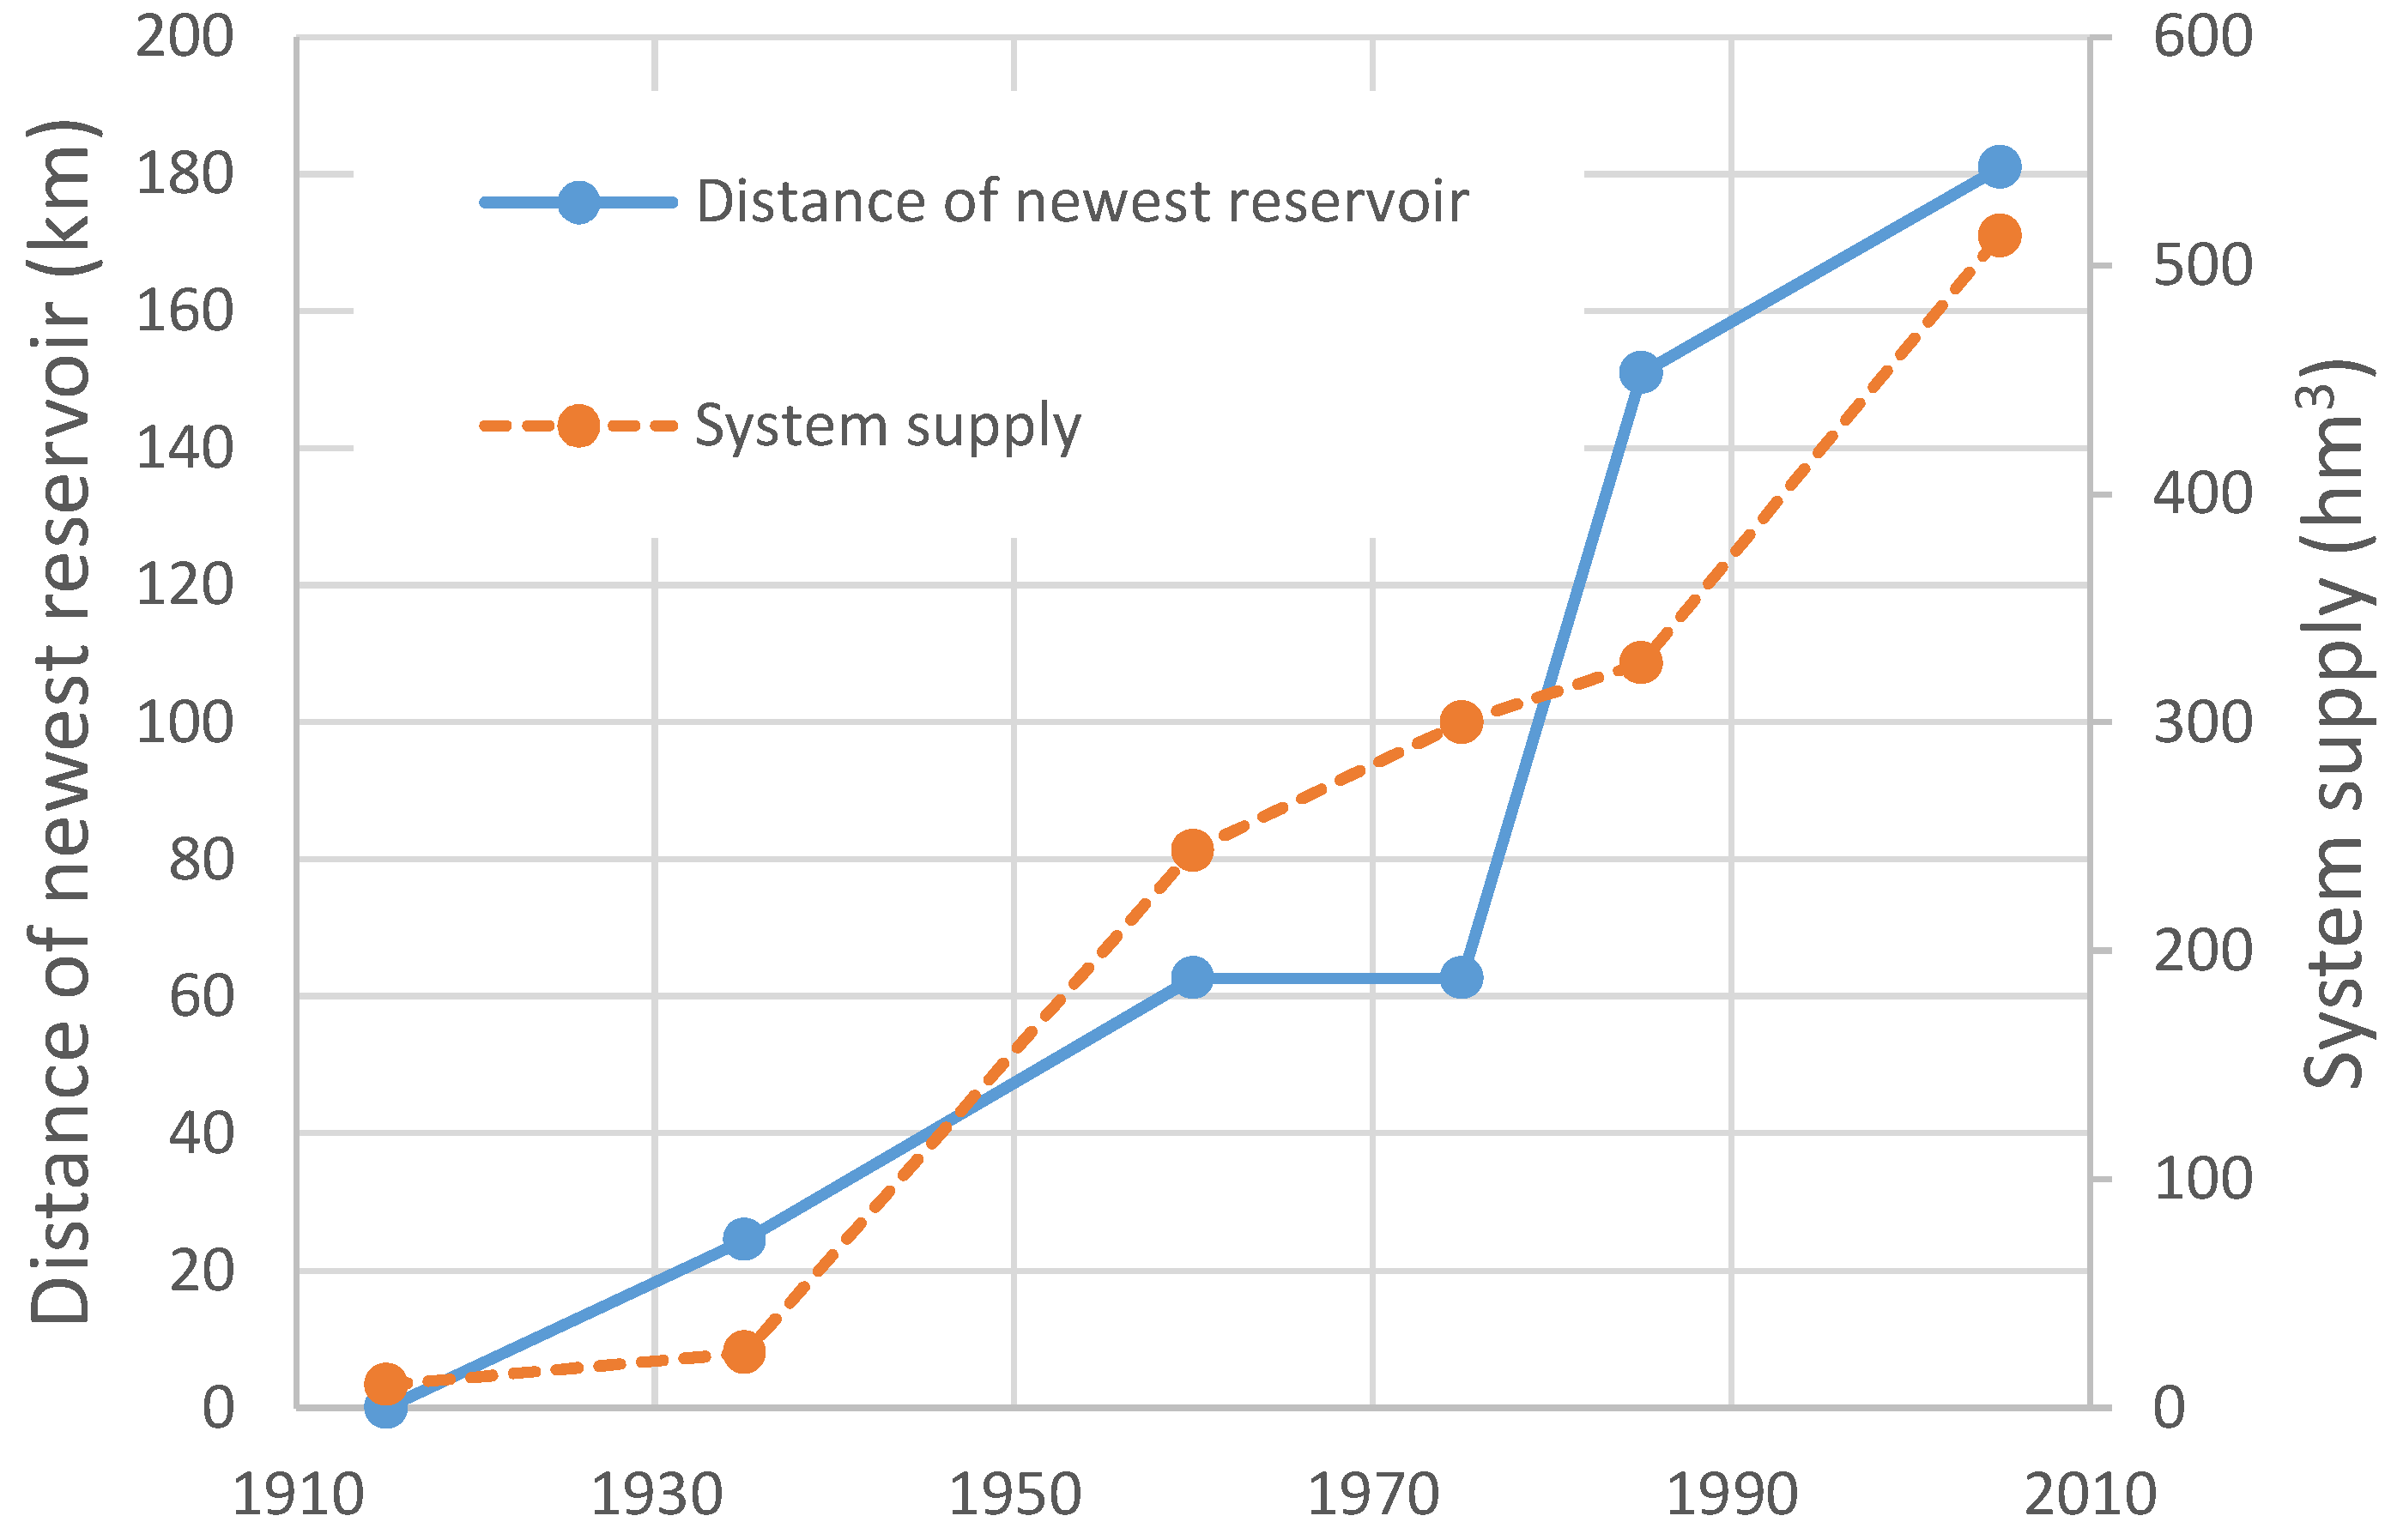
Figure 8 shows the coevolution in time of the distance of the reservoirs with their supply. The increased distance arguably limited the effect of economies of scale, which if distances were shorter would have been expected to be even more noticeable.
Figure 9 shows that the area of the city has grown about 10 times in 100 years and the area of the catchments utilized for water supply has increased accordingly. It is interesting that this trend is almost linear even though the conditions (i.e., consumption per person) are changing.
7. The Management of the Water Resources
The construction of the system of reservoirs and aqueducts of Athens has been combined with the development of a sophisticated methodology for its management [
4,
43,
44,
45]. The highlights of the methodology are:
(a)
Stochastic modeling of natural processes rather than invoking fictitious outputs of climatic models for future scenarios. In particular, a prominent characteristic that had to be modelled was the drought persistence, which stochastically can be captured by the Hurst-Kolmogorov dynamics [
44]. The software system developed for this purpose is named Castalia [
46] and can perform either in continuous simulation mode or in forecast mode. The theoretical background of the methodology can be found in Refs. [
47,
48].
(b)
Real optimization of the hydrosystem’s performance. In contrast to the traditional techniques based on deterministic optimization (e.g., linear programing) or simplified stochastic methods (e.g., stochastic dynamic programming), for the management of the Athens water supply system a sophisticated stochastic optimization methodology was developed. This combines system parameterization through parameterizing the system’s operation rules, stochastic simulation and optimization of the parametric rules. This methodology is thus known as parameterization-simulation-optimization [
45].
(c)
Water demand management, as already described in
Section 6. Applying this methodology, the system was able to cope, effectively and without failure, with the extreme seven-year drought of 1988–1995, while other cities with similar or milder problems may have used inefficient methodologies.
8. Models of Cost and Size of Water Reservoirs
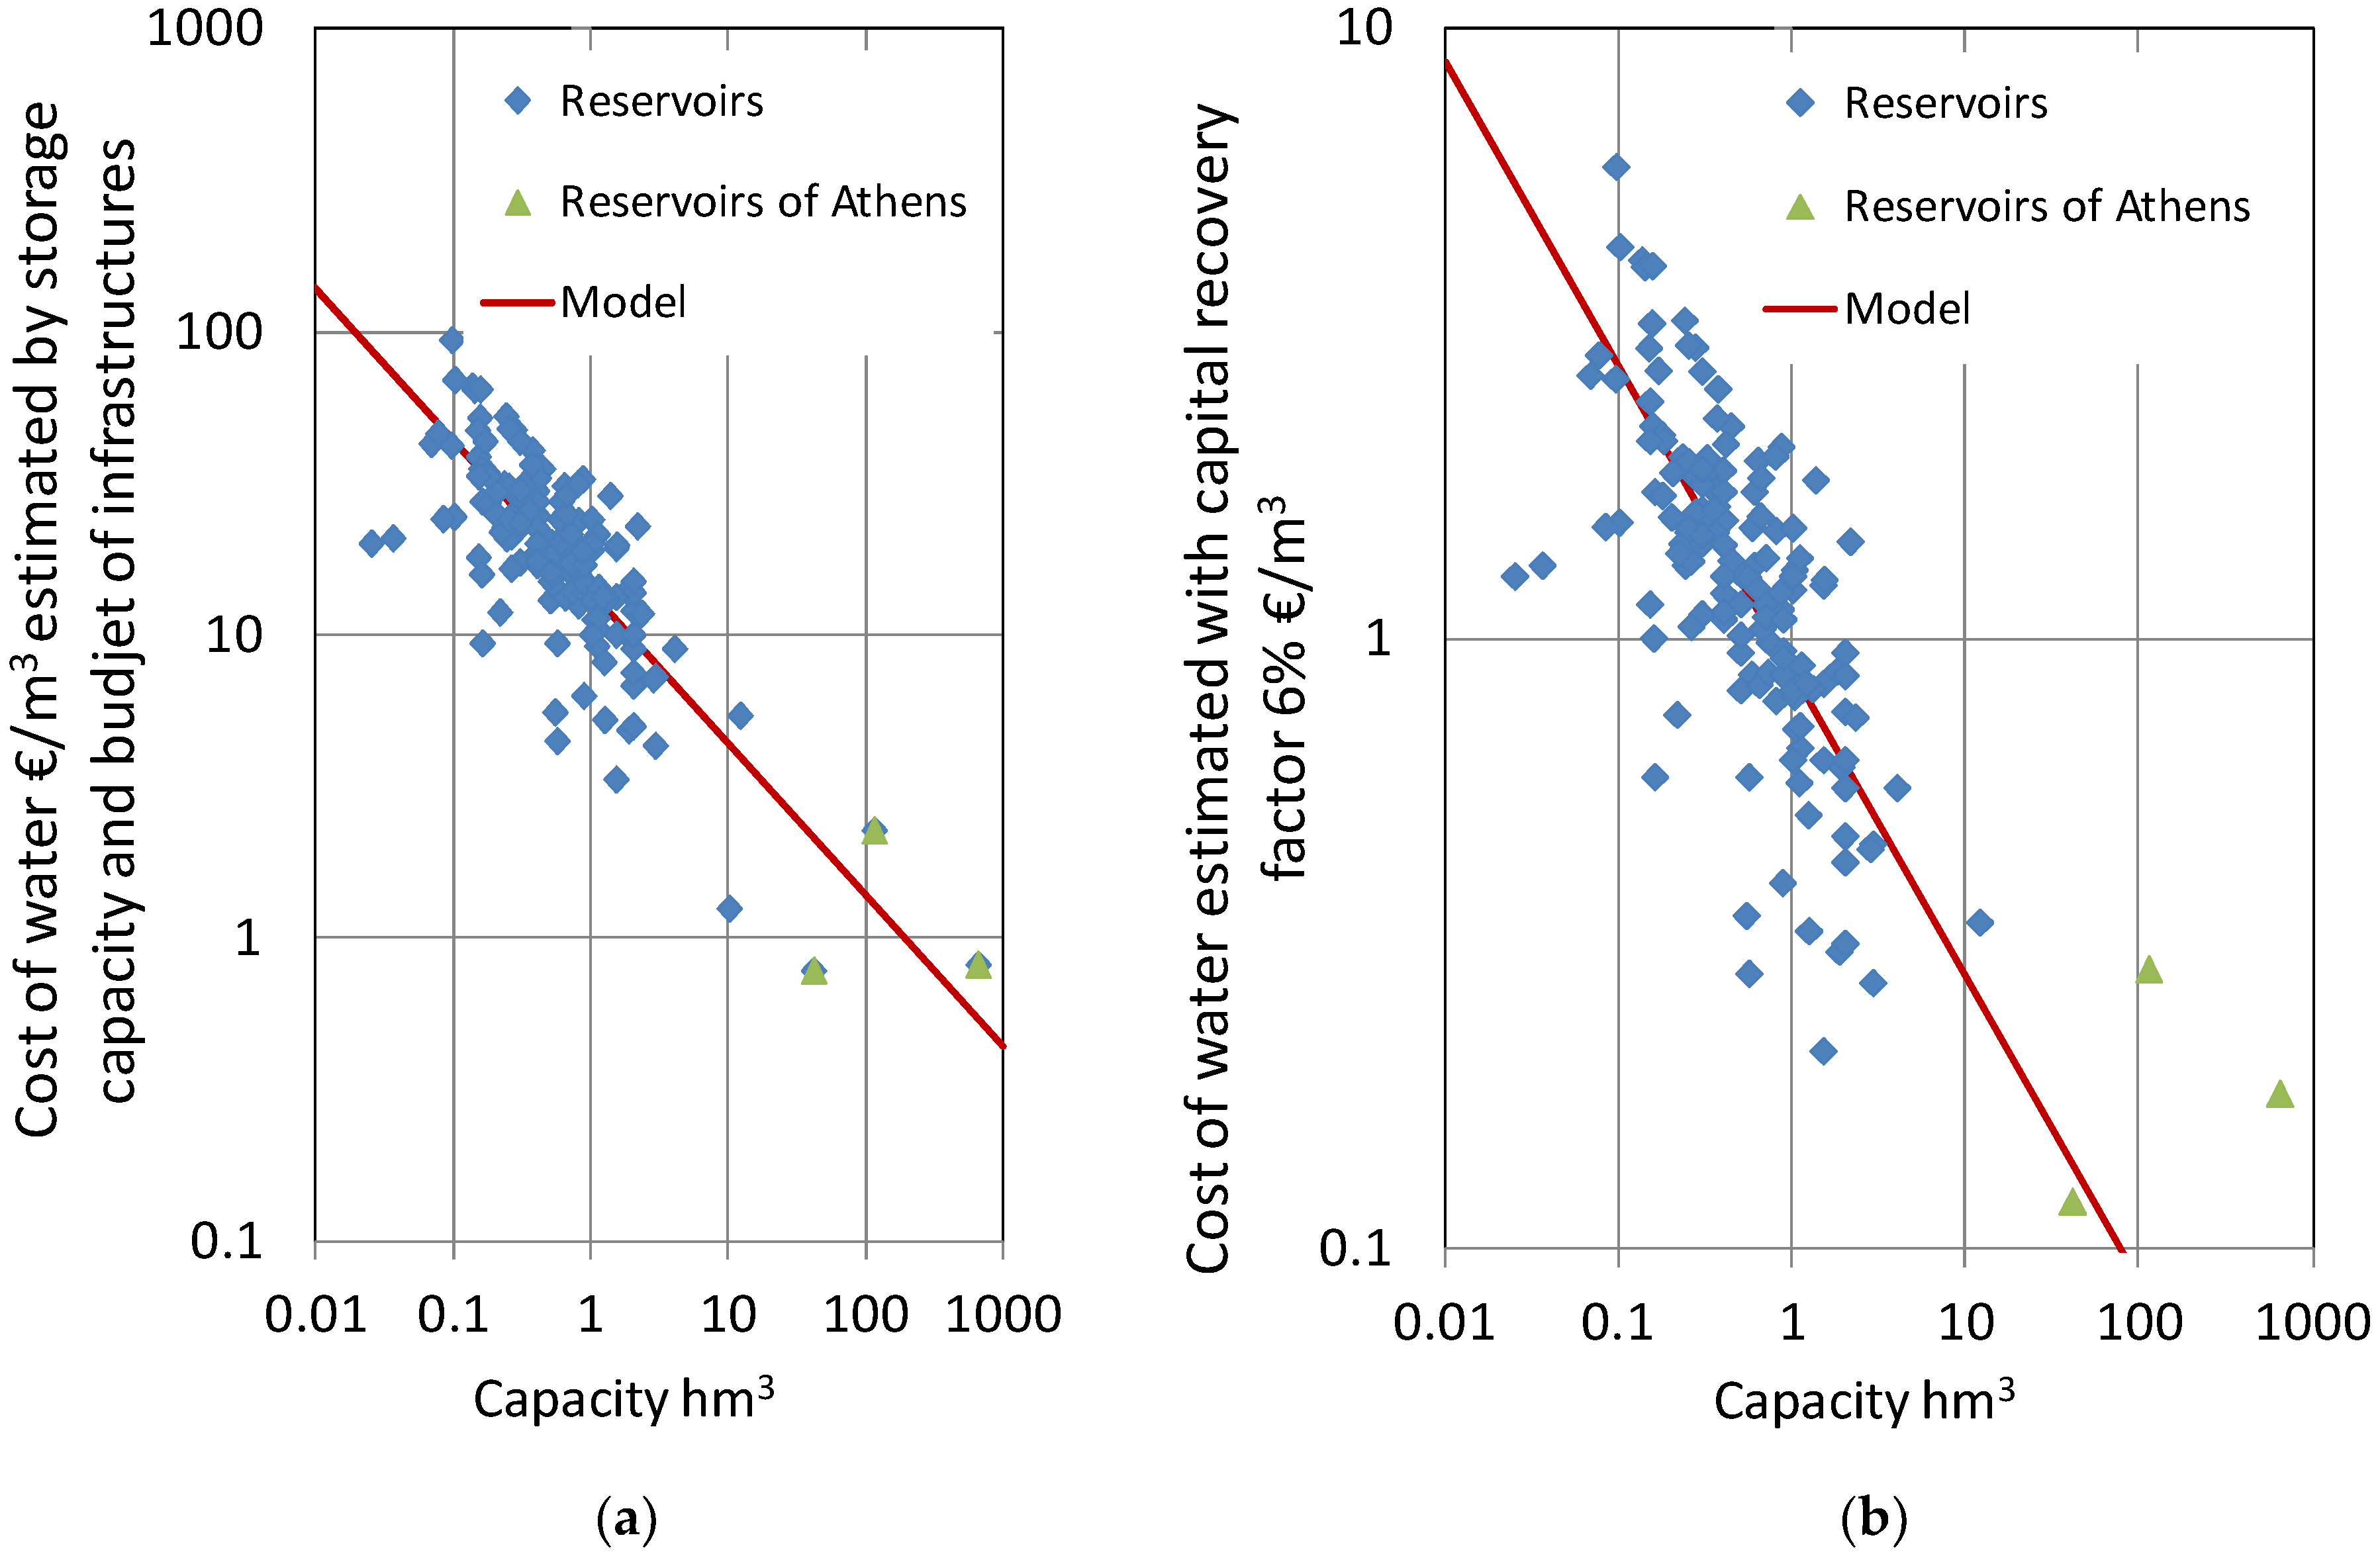
It is interesting to compare the large-scale works of Athens with alternative small-scale works, to investigate the differences in economic indexes, had the Athenians chosen smaller projects. To this aim we used data from the “Geographical database of small reservoirs in Greece” [
49] and constructed the plots shown in
Figure 10 in terms of cost versus reservoir size (measured by the reservoir storage capacity). In
Figure 10a the cost is the total budget for the reservoir construction per m
3 of reservoir storage while in
Figure 10b the cost is the annual capital recovery (assuming an interest of 6%) per m
3 of water withdrawn from the reservoir. Hylike, which is part of the water supply system of Athens, was not included because it is a natural lake from which water is pumped.
We additionally observe (see caption of
Figure 10) that in both cases the cost is inversely proportional to the square root of storage. Therefore, if the water supply system of Athens was designed with smaller reservoirs by one order of magnitude, the cost would be more than three times larger, both in terms of total budget and per m
3 of water. In case it was designed with even smaller reservoirs, say 1 hm
3, the cost of infrastructure would be 22.5 €/m
3 of storage, instead of 1.29 €/m
3 and the cost of the water would be about 1.41 €/m
3, instead of 0.19 €/m
3.
Changing the scale of water infrastructures does not deviate substantially from the so-called “0.6 rule” [
1,
50]. The “0.6 rule” states that the increase in cost and the increase in capacity, raised to the power 0.6, are inversely proportional. The definition of the rule [
51], was based on a wide range of equipment types and 87% of estimated exponents were found to fall in the range 0.3 to 0.9. It is interesting that the rule is verified also in water infrastructures of Athens.
Figure 10 demonstrates that the development of the water supply system of Athens was successful in taking advantage of the economies of scale to achieve a stable price of water as well as a consistent supply to meet the water demand. Arguably, if Athenians had chosen a smaller scale of reservoirs the cost of living in Athens would be significantly increased. At the moment and given the existing hydraulic infrastructure, with adequate future planning, the water supply system of Athens can even expand to provide water to other smaller cities close to Athens, such as Korinthos. Thus, water management is necessary to implement economies of scale for the development of the city. In this respect, from economic viewpoint, it is preferable for other cities close to Athens to use the Athens water supply system than to develop independent water supply systems.
It is interesting to note that the system development had also considered several alternatives in different period. For example, in the beginning of the development the alternative scenario of conveying water from the Stymphalian lake, Peloponnesus, was studied [
36]. The cost of the related infrastructures would be almost the same as the cost of the Marathon project. However, it this alternative was chosen, with an aqueduct in a Peloponnesus the system expansion would be difficult or even infeasible.
9. Discussion and Conclusions
Cities grow larger as a result of the concentration of labor and the scale economies that this generates [
52]. Despite agglomeration effects that relate to size, there is a strong suspicion that the best places to locate new growth are in smaller rather than larger cities, reflecting the tradeoff between economies of scale and congestion, which both increase as cities get bigger. The implications are controversial. The age-old question of what the “optimal” size for a city is as it has ever been and remains open to debate [
53]. Athens is an example of a very large city; indicatively, it hosts the 30% of the population of Greece and generates 47.3% of the GDP of Greece. However, the catchment area contributing to the water supply system (
Figure 9) is about 3% of Greece.
In view of the increase of population in the 20th century and its relationship to water supply, relevant questions are: Was this migration of citizens justified? Could the people have chosen an area of Greece with more abundant water resources instead of living in the relatively arid area of Athens? The cost to construct the water infrastructure for Athens to host such a large population was certainly higher than in other cities which were closer to water sources, but obviously that was not a concern of people. Most probably, they did not ever worry about it and claimed “the right to the city” without anxiety about water availability and technical difficulties of the water supply system but only pushed by their contemporary social conditions, particularly after periods of crisis (Minor Asia Disaster, Civil War after WWII).
Furthermore, in a scenario that the Athenians would like to stay in Athens with the current life style but without these particular hydraulic infrastructures, they would probably choose to build them again. Given that before the large works of infrastructure they were paying about 400 €/m
3 for water (almost the same price of bottled water today), with that high price they would have reached amortization of the capital for infrastructure or water supply system in less than a month. So overall, even though large concentration of population in Athens is obviously capital intensive for water management, it subsequently leads to more affordable access to water. Also, as seen in
Figure 6, (water-related financial data) and in
Figure 7 (supply to demand ratio), with large infrastructures the price of water is significantly reduced. Therefore, it seems that economies of scale in hydraulic works were necessary for the development of the city of Athens (
Figure 10).
If the water supply system of Athens was designed with smaller reservoirs these would have also smaller supplying catchments. Thus, large areas of the current system’s supplying catchments (
Figure 4) would be unexploited and in order to serve the demand, the distance of the water resources would be elevated (
Figure 8). Additionally, the numerous small reservoirs of this alternative would require a much more extended system of aqueducts to convey the water to Athens. In this case, the cost of the water would also be increased (
Figure 10).
According to the data analyzed, a change of social behavior was noted: infrastructures constructed led to increased water consumption, alongside with a much healthier way of living in the city as it is widely recognized that modern sanitation (with proper sewer systems and wastewater treatment plants) has greatly contributed to the improvement of public health and increased life expectancy. Recognizing the poor economic situation and the lack of technological infrastructure as the real reasons for water scarcity and health problems in developing countries, we can expect that economic progress, wherever and whenever is made possible, will lead to improved water availability and sanitation [
54].
Athens can serve as an encouraging example. Due to its dry climate, the water supply in Athens depends on a large-scale engineered system. Investments for the construction of this system have always been given the highest priority and have solved technical and social problems reducing the financial costs as a result of the large-scale infrastructures. All in all, the water supply infrastructure developed for Athens offers a didactic example of the sustainable management of natural resources in order to serve the population and the city.
Author Contributions
Concept of the paper, writing, data entry, data analysis, modeling and research G.-F.S., writing, data analysis and research R.I., financial consultancy G.K., GIS-maps S.S., editing and supervision N.D.L., modeling, data analysis, research and supervision D.K.
Funding
OptArch project: “Optimization Driven Architectural Design of Structures” (No: 689983) belonging to the Marie Skłodowska-Curie Actions (MSCA) Research and Innovation Staff Exchange (RISE) H2020-MSCA-RISE-2015.
Acknowledgments
This research has been supported by the OptArch project: “Optimization Driven Architectural Design of Structures” (No: 689983) belonging to the Marie Skłodowska-Curie Actions (MSCA) Research and Innovation Staff Exchange (RISE) H2020-MSCA-RISE-2015.
Conflicts of Interest
The authors declare no conflict of interest.
Appendix A. The Conversion of Past Century Drachma to Current €
Appendix A.1. Data and Examination Periods
The periods under consideration are related to the phases of the development of hydraulic infrastructure and the development and expansion of the city. Thus, socio-economic conditions are examined before and after the construction of large scale projects.
Social, urban and technical data were extracted and used from relevant studies and were further processed into charts from which useful conclusions are postulated/depicted.
The social, urban and technical data can be reliably measured, but the same could not be said for economic data. As we know, the value of money is temporal and in order to assess reliably the available monetary data, there should be a calculation of the temporal equivalence between the past value of drachma (as the national currency of Greece until 1999. From 1999 until the end of 2001 the drachma was still in circulation, however with a locked exchange ratio to the euro) and the current value of the euro as the country’s official adopted currency in circulation since 2002. In addition, we should also take the effect of the Consumer Price Index (CPI) into account as it is also a major factor in determining prices.
The difficulty of calculations increased as we went back in time because it was more difficult to find data on the price of water and hydraulic infrastructures as well as to convert them to current €.
From 1959 until now, there are official data for both the price of water and the conversion of drachmas in €. From 1922 to 1959, there are still satisfactory data but less official sources that had to be combined. Finally, from 1910 to 1922 the data are based on bibliographic sources of which the validity cannot be easily cross-referenced or verified and the conversion of drachma to € has been made using a synthesis of different approaches, as no relevant literature or relevant sources have been found to make a direct calculation.
It should be noted that the value of money depends on highly complex parameters including social conditions, gross capital formation, unemployment, wars, financial changes, devaluations, revaluations, etc. and the more we go back in time, the drachma conversion in € becomes more of an estimate than an accurate conversion.
The next paragraphs comprise a description of the bibliographic data and economic methods used at each time period based on data availability.
Appendix A.2. Conversion for the Period after 1955
From 1955 until today, finding data on the price of water and the cost of works and their conversion to current € was easy as official data are available [
55]. Prices were based on the Greek monetary unit evolution value (annual), based on the general CPI [
56].
Appendix A.3. Conversion for 1930–1940
In 1923 Ulen & Co. from New York City was selected to construct the Marathon dam. This included the dam, reservoir, a conveyance pipe and a water treatment plant. After this project Ulen & Co, took over the management of the water in Athens.
Ulen’s invoices, can be considered a reliable indicator of the price of water for the period 1930–1940 (1940), which was converted into 2018 € with data from the Bank of Greece [
57]. Correspondingly, the infrastructure cost of the period (1932, Marathon Dam) was converted to current €.
Appendix A.4. Conversion for 1913
In 1913 the price of water was 80 drachmas/m
3 [
36]. Converting this price to current € was particularly important so that conclusions could be drawn on the fluctuation of the water price, after the inclusion of large water infrastructures in the water supply network.
Since no method was found to have already been developed for this conversion in the literature, the following four alternative approaches were adopted using available data to estimate the price of water.
The first approach is based on the correlation of the data of the French franc in 1913 with the Greek drachma which, at that date, fully followed the rules of parity of the Latin Monetary Union. Available French franc conversion data for that period were used from the equivalence to 2007 € [
58] and then in current €.
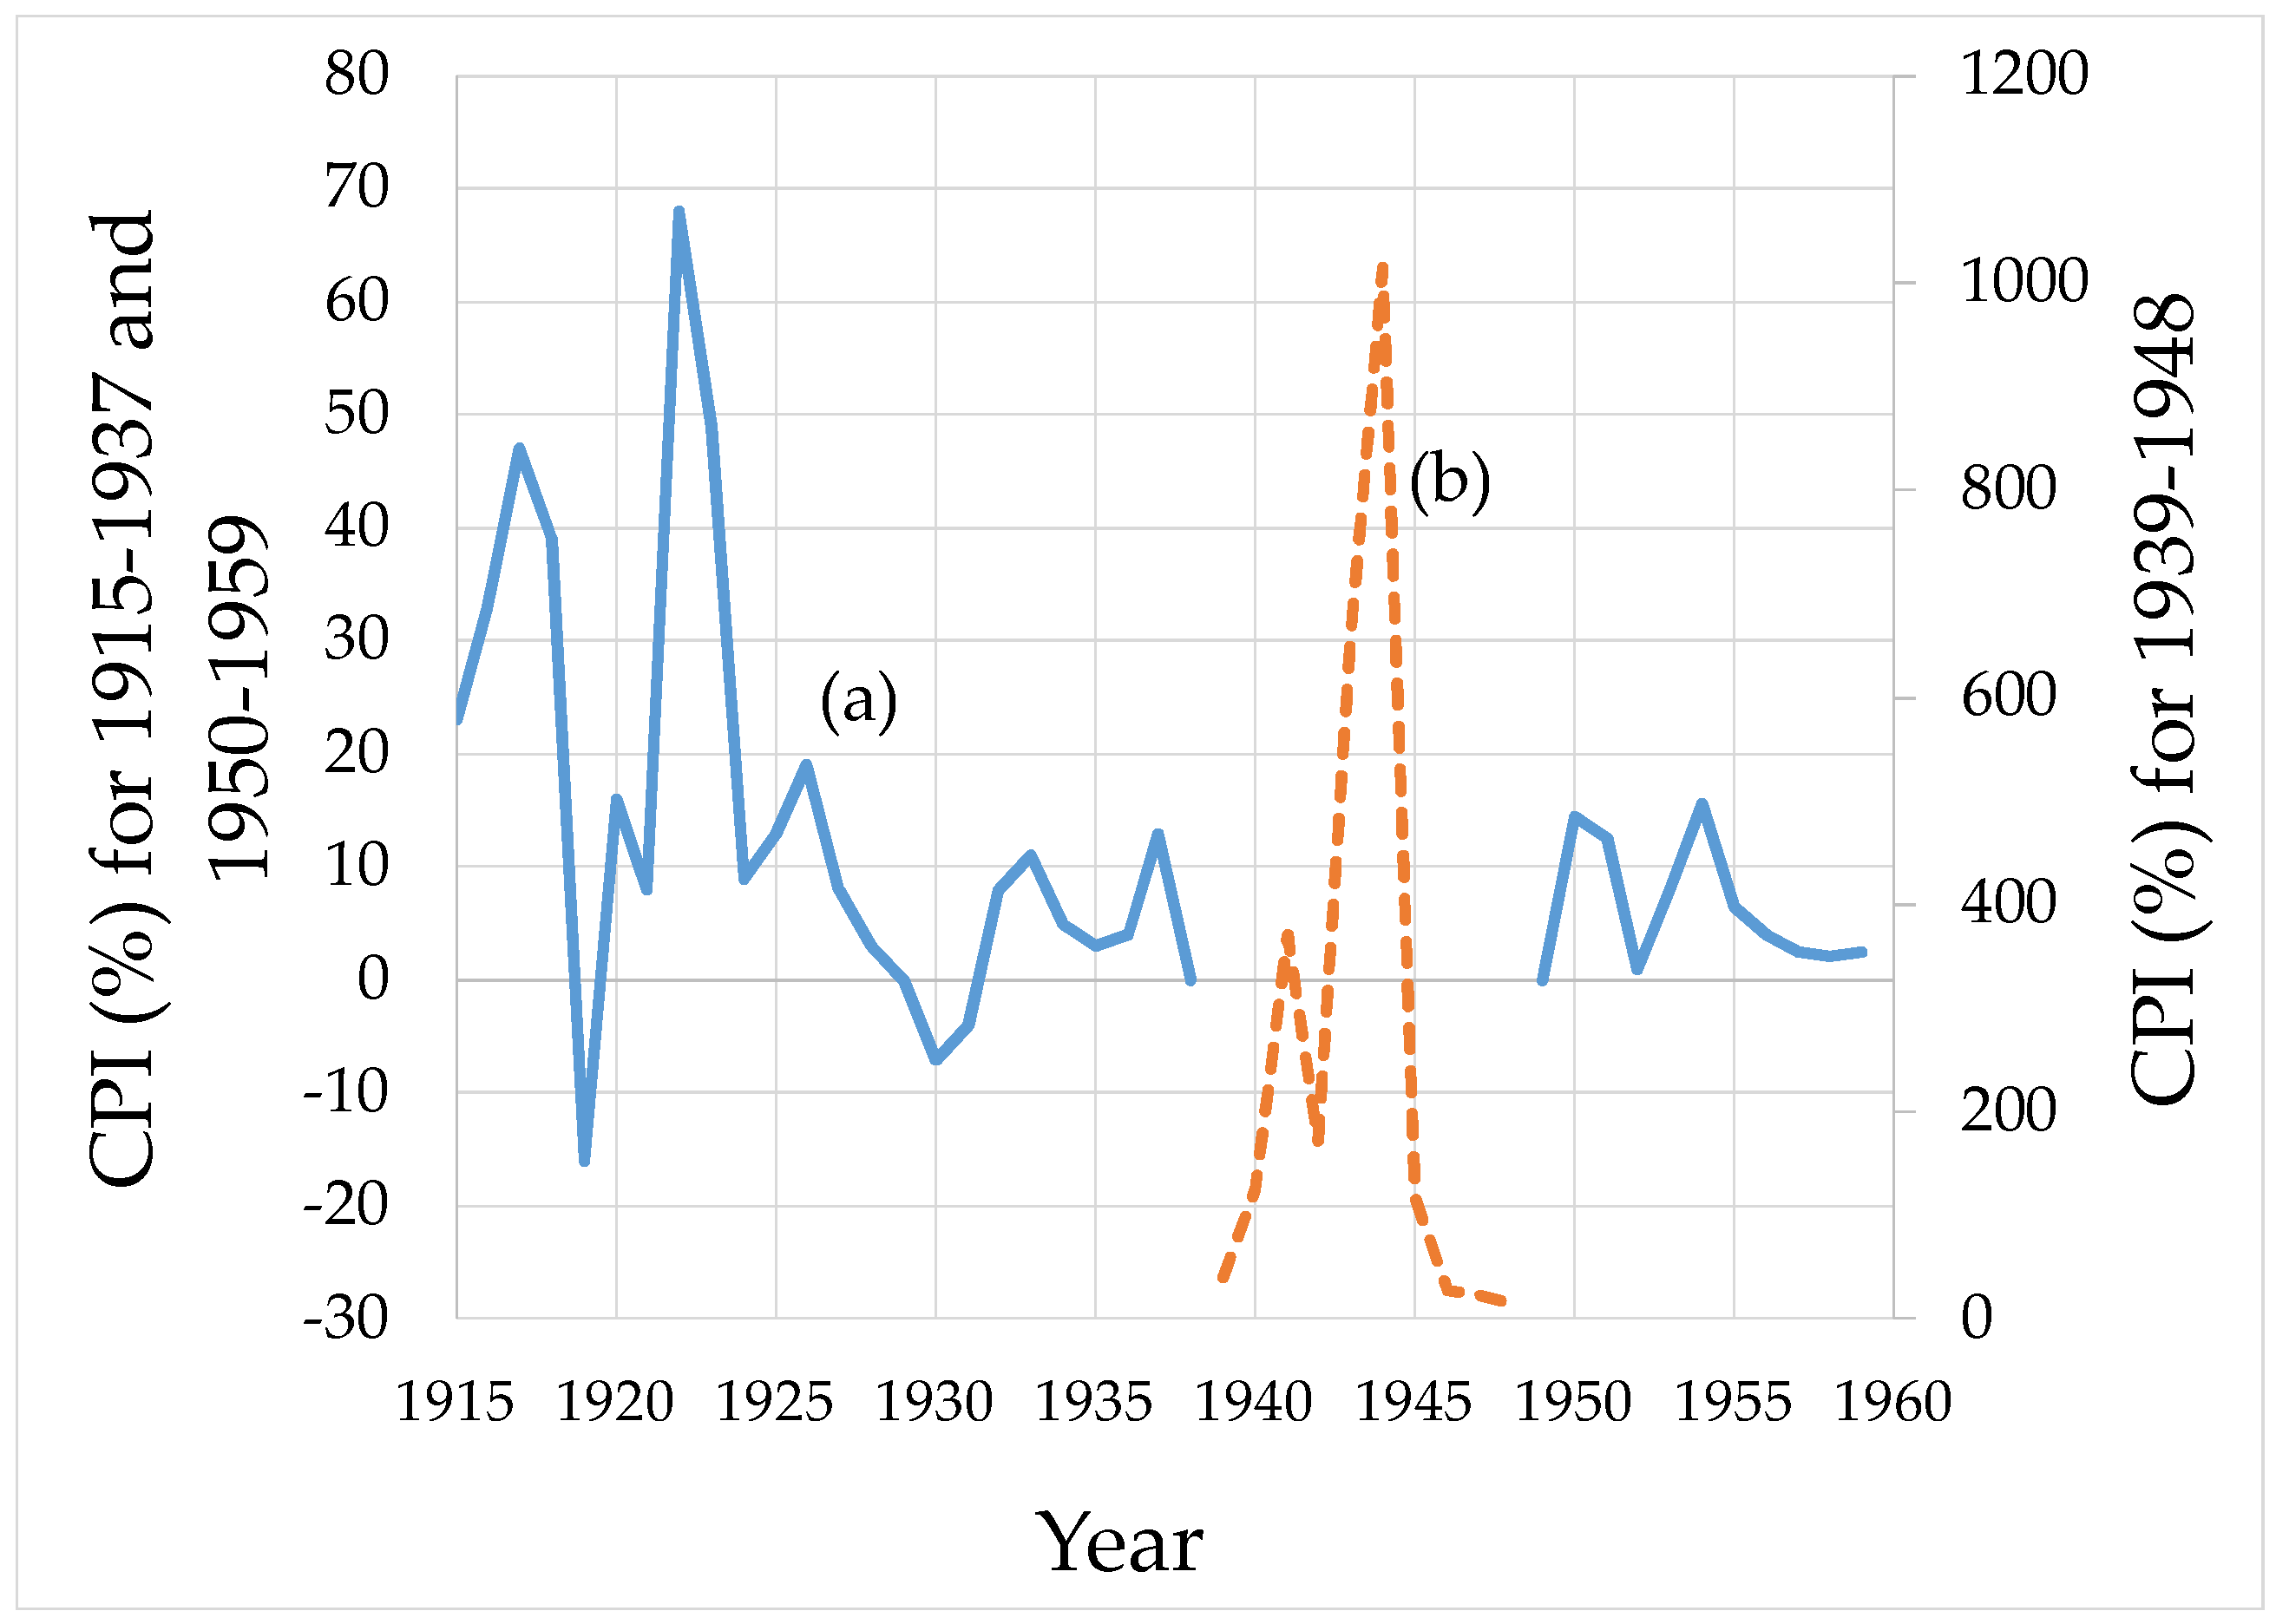
Greece’s currency table for the period 1959–2001 is based on the general consumer price index. For the years before 1959 with no corresponding data on the evolution of the value of the currency, a separate methodology was used to find the equivalent value of the drachma of 1913 to the drachma of 1959. This method was based on the use of historical CPI data and inflation rates for the same period. The CPI figures found are CPIs without the effect of inflation, while using the inflation data a new gross CPI was created, including inflation changes [
4].
Figure A1 shows the CPI time series used.
Figure A1.
CPI of Greece (
a) 1914–1938 [
59], 1949–2000 [
60], (
b) 1939–1948 [
59].
Figure A1.
CPI of Greece (
a) 1914–1938 [
59], 1949–2000 [
60], (
b) 1939–1948 [
59].
The closest calculation of the equivalence of drachma value to euro 2013, was a calculation made by the Bank of Greece on the drachma of 1923, which was found equivalent to 0.29 € of 2018. From 1913 to 1923, a period not covered by this calculation, we used the method also used in approach 2 i.e., the evolution of the value of drachma for the period 1913 to 1959 combining net CPI and inflation.
In the “Memorandum of the Athens Trade Union”, which was submitted to the Parliament of Greece in 1911 [
61], it is mentioned that “The wage of the press workers in Athens ranges from drachmas 3.50 to 5.25, reaching up to 6 drachmas only for night workers”. Therefore, we can assume that an indicative average wage was approximately 4.25 drachmas. Today, Greek Laws 4046/2012, 6/28-2-2012 and the interpretative circular 4601/304/12-3-2012 [
62] determine the worker’s daily wage between 22.83 € and 26.18 €, so an indicative average wage is 24.50 €. Corresponding to the wages with any political-social errors that can be included, the correspondence of the drachma of 1911 to € 2012 is approached.
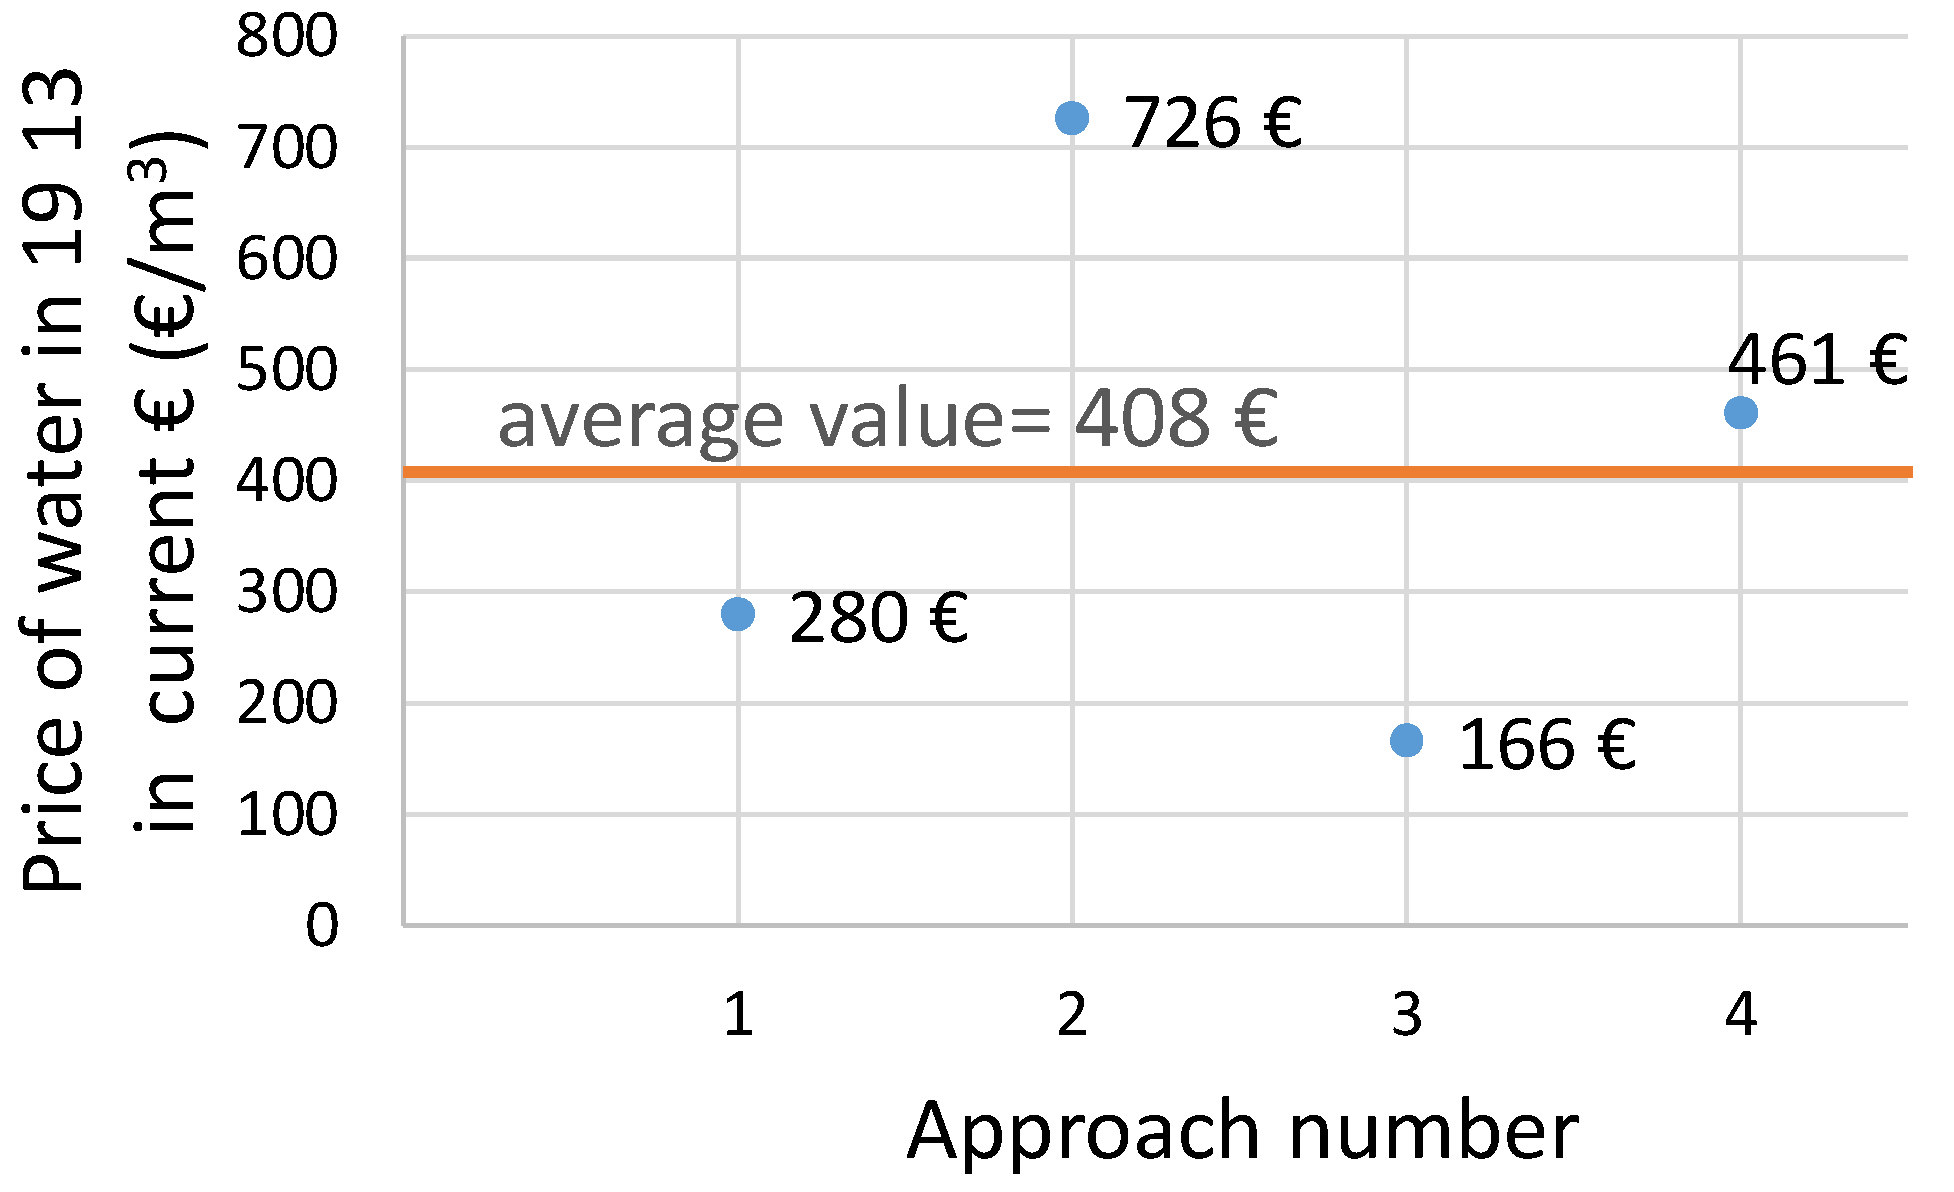
The results of these different approaches for the price of m
3 of water are shown in
Figure A2 and their average value, which is an indicator for the water price in 1913, is equal to 408 €/m
3. Interestingly, if someone wanted to buy 1 m
3 of bottled water in Athens at the year 2018 assuming that no infrastructure was built since 1913, the price would be circa 300 €, which is close to the price of water before large infrastructure projects were implemented.
Figure A2.
Cost of water in 1913 in Athens, based on different financial methodologies for estimating the equivalence of drachma of 1913 to euro of 2018.
Figure A2.
Cost of water in 1913 in Athens, based on different financial methodologies for estimating the equivalence of drachma of 1913 to euro of 2018.
References
- Koutsoyiannis, A. Modern Microeconomics, 2nd ed.; Springer: London, UK, 1979. [Google Scholar]
- Pietrucha-Urbanik, K.; Tchorzewska-Cieslak, B. Water Supply System operation regarding consumer safety using Kohonen neural network. In Safety, Reliability and Risk Analysis: Beyond the Horizon; Taylor &Francis Group: London, UK, 2014; pp. 1115–1120. [Google Scholar]
- Pietrucha-Urbanik, K.; Tchórzewska-Cieślak, B. Approaches to Failure Risk Analysis of the Water Distribution Network with Regard to the Safety of Consumers. Water 2018, 10, 1679. [Google Scholar] [CrossRef]
- Koutsoyiannis, D.; Mamassis, N. The Water Supply of Athens Through the Centuries. In Schriften der Deutschen Wasserhistorischen Gesellschaft; Wellbrock, K., Ed.; DWHG: Siegburg, Germany, 2018. [Google Scholar]
- McDonald, P.H. Fundamentals of Infrastructure Engineering: Civil Engineering Systems; Marcel Dekker: New York, NY, USA, 2001. [Google Scholar]
- Russell, J.C. Late Ancient and Medieval Population. Trans. Am. Philos. Soc. 1958, 48, 1–152. [Google Scholar] [CrossRef]
- Hansen, M.H. The Shotgun Method: The Demography of the Ancient Greek City-State Culture; University of Missouri Press: London, UK, 2006. [Google Scholar]
- Biris, K. The First Drawings..., Athenian Studies; Melissa: Athens, Greece, 1938; pp. 10–30. [Google Scholar]
- Mavrogonatou, G.; Chatzis, K. Technology and Public Sphere in Greece: The Issue of Water Supply in Athens Through the Demotion of 1880–1914, History, 2012. Available online: https://www.politeianet.gr/magazines/-periodika-ta-istorika-teuchos-56-iounios-2012-213708 (accessed on 25 April 2019).
- Mavrogonatou, G. Athens Water Supply: 1880–1930 Technology, Society, Policy. Ph.D. Thesis, University of Athens, Athens, Greece, 2009. [Google Scholar]
- Kallivretakis, L. Athens in the 19th century: From Regional Town of the Ottoman Empire to Capital of the Kingdom of Greece; Historian, Institute for Neohellenic Research, National Hellenic Research Foundation (NHRF): Athens, Greece, 2012. [Google Scholar]
- Available online: http://www.airphoto.gr (accessed on 25 April 2019).
- GDP per Capita in 281 EU Regions, Luxembourg: Eurostat. 26 February 2019. Available online: https://ec.europa.eu/eurostat/documents/2995521/9618249/1-26022019-AP-EN.pdf (accessed on 25 April 2019).
- Tassios, T.P. Water supply of ancient Greek cities. Water Supply 2007, 7, 165–172. [Google Scholar] [CrossRef]
- Chiotis, E.D.; Chioti, L.E. Water supply of Athens in the antiquity. In Evolution of Water Supply Throughout Millennia; Angelakis, A.N., Mays, L.W., Koutsoyiannis, D., Mamassis, N., Eds.; IWA Publishing: London, UK, 2012. [Google Scholar]
- Gawsmann, R.W. Water for Athens; Ulen & Co.: Athens, Greece, 1940. [Google Scholar]
- Stergiouli, M.L.; Hadjibiros, K. The growing water imprint of Athens (Greece) throughout history. Reg. Environ. 2012, 12, 337–345. [Google Scholar] [CrossRef]
- Patsis, S. Athens Mayor, The Water Supply System of Athens, Athens 1924. Available online: http://www.itia.ntua.gr/el/getfile/1110/1/documents/YdreusisTwnAthinwn.pdf (accessed on 25 April 2019).
- Law 283/1914. On Water Supply and Sanitation of the Cities of Athens and Piraeus. Available online: http://www.itia.ntua.gr/el/getfile/1110/2/documents/NeoiNomoi.pdf (accessed on 25 April 2019).
- Gausmann, R.W. How the Problem of the Water Supply of Athens, Piraeus and Surrounding Areas was Solved, Ergasia, 1932. Available online: http://www.itia.ntua.gr/el/getfile/1110/3/documents/UNKNOWN1933.pdf (accessed on 25 April 2019).
- Koutsoyiannis, D.; Efstratiadis, A.; Karavokiros, G.; Koukouvinos, A.; Mamassis, N.; Nalbantis, I.; Rozos, E.; Karopoulos, C.; Nassikas, A.; Nestoridou, E.; et al. Master Plan of the Athens Water Resource System—Year 2002–2003, Modernisation of the Supervision and Management of the Water Resource System of Athens; Report 14; Department of Water Resources, Hydraulic and Maritime Engineering—National Technical University of Athens: Athens, Greece, 2002. [Google Scholar]
- Available online: https://www.eydap.gr/ (accessed on 30 January 2019).
- Seretli, A. Environmental Evaluation of the Attica Floors—The Case of the Pikodafnis. Master’s Thesis, Environment and Development, National Technical University of Athens, Athens, Greece, 2014. [Google Scholar]
- Raso, L.; Barbier, B.; Bader, J.C. Modeling dynamics and adaptation at operational and structural scales for the ex-ante economic evaluation of large dams in an African context. Water Resour. Econ. 2018, 24. [Google Scholar] [CrossRef]
- Hekimouglou, E. Water Historiography, Timeline of the Water Management of Attika, Network of Civilianization EYDAP, Athens, 2014. Available online: https://www.eydap.gr/userfiles/47614413-661a-4fba-ba7c-a14f00cfa261/ydatini_idatografia.pdf (accessed on 25 April 2019).
- EYDAP. Annual Financial Report; (Newsleter) Period from 1 January–31 December 1999; EYDAP: Athens, Greece, 1999. [Google Scholar]
- EYDAP. Annual Financial Report Period from 1 January–31 December 2017 In Accordance with IFRS & Law 3556/2007. Available online: https://www.eydap.gr/userfiles/FinancialResults/2017/etisia_oik_ekthesi_2017.pdf (accessed on 25 April 2019).
- Savvides, K.; Abakoumkin, V.; Kotzampasakis, A.; Kavounidis, S.; Patsoukis, N.; Fessas, D. Working Group Report on Mornos, Technical Chamber, 1988. Available online: http://library.tee.gr/digital/m1001_1050/m1037.pdf (accessed on 25 April 2019).
- Technical Chamber, Mornos Folder, Newsletter, 16 January 1989. Available online: http://library.tee.gr/digital/endel/1989_1548/endel_1989_1549.pdf (accessed on 25 April 2019).
- Papadaki, M. Financial Analysis of EYDAP SA, TEI of Kalamata November 2011. Available online: http://nestor.teipel.gr/xmlui/bitstream/handle/123456789/16700/SDO_XRHMEL_00669_Medium.pdf?sequence=1 (accessed on 25 April 2019).
- Stavrianakis, E. Water Supply and Sewerage Company. Organizational Structure Economic Results, TEI of Kalamata, 2002. Available online: http://nestor.teipel.gr/xmlui/bitstream/handle/123456789/16047/SDO_DMTA_00279_Medium.pdf?sequence=1 (accessed on 25 April 2019).
- Ministry of Governmental Policy of Greece, Public Relations Service, Five Years of Economic Progress, 1967–1972, Athens 1972. Available online: https://catalogue.nla.gov.au/Record/2161627 (accessed on 25 April 2019).
- Sinos, A.; Raftopoulos, T.I. Water Supply and Irrigation from Ylikis, Athens, (Acknowledgment from the Technical Chronicles, Issue 280–282) 1948. Available online: http://library.tee.gr/digital/techr/1952/1952_gened/techr_1952_12_3.pdf (accessed on 25 April 2019).
- Makropoulos, C.; Koukouvinos, A.; Efstratiadis, A.; Halkias, N. Methodology for Estimating Financial Cost, Water Cost for Water Supply in Athens; Department of Water Resources and Environment, National Technical University of Athens: Athens, Greece, 2010. [Google Scholar]
- Makropoulos, C.; Efstratiadis, A.; Koukouvinos, A. Estimation of Financial Costs and Proposals for the Rational Management of the Hydro System, Cost of Water for the Water Supply in Athens; Department of Water Resources and Environment, National Technical University of Athens: Athens, Greece, 2010. [Google Scholar]
- Merkouris, S. The Water Supply of Athens and Piraeus, Athens 1913. Available online: https://anemi.lib.uoc.gr/metadata/0/3/7/metadata-a4d97c8bdcc87d2efe5dbed8cb8ce298_1271149227.tkl?dtab=m&search_type=simple&search_help=&display_mode=overview&wf_step=init&show_hidden=0&number=10&keep_number=&cclterm1=&cclterm2=&cclterm3=&cclterm4=&cclterm5=&cclterm6=&cclterm7=&cclterm8=&cclfield1=&cclfield2=&cclfield3=&cclfield4=&cclfield5=&cclfield6=&cclfield7=&cclfield8=&cclop1=&cclop2=&cclop3=&cclop4=&cclop5=&cclop6=&cclop7=&isp=&search_coll%5Bmetadata%5D=1&&stored_cclquery=&skin=&rss=0&lang=el&ioffset=1&offset=1 (accessed on 25 April 2019).
- Cooley, H.; Phurisamban, R. The Cost of Alternative Water Supply and Efficiency Options in California; Appendix A: Levelized Cost Methodology; Pacific Institute: Oakland, CA, USA, 2016. [Google Scholar]
- EΥDAP. Ηistorical Water Price Lists; EΥDAP: Athens, Greece, 2008. [Google Scholar]
- ULEN. What Athens Pays for Water; Ulen & Co.: Athens, Greece, 1940. [Google Scholar]
- Xenos, D.; Passios, I.; Georgiades, S.; Parlis, E.; Koutsoyiannis, D. Water demand management and the Athens water supply. In Proceedings of the 7th BNAWQ Scientific and Practical Conference Water Quality Technologies and Management, Sofia, Bulgaria, 20 February 2002; pp. 44–50. [Google Scholar]
- Koutsoyiannis, D. The Management of the Athens Water Resource System: Methodology and Implementation; Invited Lecture; Water Resources Institute: Atlanta, GA, USA, 2006. [Google Scholar]
- Avelidi, K. The Transformation of the Area of 4 Big Cities; Working Papers 2010/21; National Centre for Social Research: Athens, Greece, 2010. [Google Scholar]
- Koutsoyiannis, D. Hurst-Kolmogorov dynamics and uncertainty. J. Am. Water Resour. Assoc. 2011, 47, 481–495. [Google Scholar] [CrossRef]
- Efstratiadis, A.; Koutsoyiannis, D.; Xenos, D. Minimizing water cost in the water resource management of Athens. Urban Water J. 2004, 1, 3–15. [Google Scholar] [CrossRef]
- Koutsoyiannis, D.; Economou, A. Evaluation of the parameterization-simulation-optimization approach for the control of reservoir systems. Water Resour. Res. 2003, 39, 1170. [Google Scholar] [CrossRef]
- Efstratiadis, A.; Dialynas, Y.; Kozanis, S.; Koutsoyiannis, D. A multivariate stochastic model for the generation of synthetic time series at multiple time scales reproducing long-term persistence. Environ. Model. Softw. 2014, 62, 139–152. [Google Scholar] [CrossRef]
- Koutsoyiannis, D. A generalized mathematical framework for stochastic simulation and forecast of hydrologic time series. Water Resour. Res. 2000, 36, 1519–1533. [Google Scholar] [CrossRef] [Green Version]
- Koutsoyiannis, D. Generic and parsimonious stochastic modelling for hydrology and beyond. Hydrol. Sci. J. 2016, 61, 225–244. [Google Scholar] [CrossRef]
- Euthimiou, X.; Theodoropoulos, A. Geographical Data Base for Small Reservoirs in Greece. Master’s Thesis, Department of Civil Engineering, National Technical University of Athens, Athens, Greece, 1997. [Google Scholar]
- Tribe, M.A.; Alpine, R.L.W. Scale Economies and the “0.6 RULE”, Engineering Costs and Production Economics; Elsevier Science Publisher: Amsterdam, The Netherlands, 1986. [Google Scholar]
- Haldi, J.H. Economies of Scale in Economic Development. Ph.D. Thesis, Stanford University, Stanford, CA, USA, 1961. [Google Scholar]
- Zipf, G.K. Human, Behavior and the Principle of Least Effort; Addison-Wesley: Cambridge, MA, USA, 1949. [Google Scholar]
- Batty, M. The Size, Scale, and Shape of Cities. Science 2008, 319, 769. [Google Scholar] [CrossRef] [PubMed]
- Koutsoyiannis, D. Scale of water resources development and sustainability: Small is beautiful, large is great. Hydrol. Sci. J. 2011, 56, 553–575. [Google Scholar] [CrossRef]
- Adamopoulou, K. EYDAP SA Invoice, General Directorate of Economics; EYDAP: Athens, Greece, 2017. [Google Scholar]
- Evolution of Monetary Unit Value of Greece (per annum), Based on the General CPI, excel file. Available online: https://www.statistics.gr (accessed on 19 March 2018).
- Kontelis, Ε.; Bank of Greece, Athens, Greece. Personal Communication, 2018.
- The Value of the Old French Franc in €-2007. Available online: https://en.wikipedia.org/wiki/French_franc (accessed on 19 March 2018).
- Lazaretou, S. Greek Monetary Economics in Retrospect: The Adventures of the Drachma; Economic Notes; Banca Monte dei Paschi di Siena SpA: Siena, Italy, 2005; pp. 331–370. [Google Scholar]
- Pagoulatos, G. Greece’s New Political Economy, State, Finance and Growth from Postwar to EMU, Palgrave Macmillan, Hampshire 2003. Available online: http://www.untag-smd.ac.id/files/Perpustakaan_Digital_2/POLITICAL%20ECONOMY%20Greece%92s%20new%20political%20economy%20%20state,%20finance,%20and%20growth%20from%20postwar%20to%20EMU.pdf (accessed on 25 April 2019).
- Memorandym of the Athens Trade Union, Parliament of Greece, 1911. Available online: https://tinyurl.com/y5e69xtz (accessed on 25 April 2019).
- Greek Law 4046/2012, 6/28-2-2012 and Interpretative Circular 4601/304/12-3-2012. Available online: http://epixeirisi.gr/download.php?filepath=files/2012/pdf/egkyeka/&filename=egkyeka_4601_304_12_3_2012&filetype=pdf (accessed on 25 April 2019).
© 2019 by the authors. Licensee MDPI, Basel, Switzerland. This article is an open access article distributed under the terms and conditions of the Creative Commons Attribution (CC BY) license (http://creativecommons.org/licenses/by/4.0/).

 ,
, 


