Optimal Routing an Ungrounded Electrical Distribution System Based on Heuristic Method with Micro Grids Integration


1
Department of Electrical Engineering, Universidad Politécnica Salesiana, Quito EC170146, Ecuador
2
Department of Telecommunications, Università degli Studi di Ferrara, 050031 Ferrara, Italy
*
Author to whom correspondence should be addressed.
Sustainability 2019, 11(6), 1607; https://doi.org/10.3390/su11061607
Submission received: 18 December 2018
/
Revised: 13 March 2019
/
Accepted: 14 March 2019
/
Published: 16 March 2019
(This article belongs to the Special Issue Smart Energy Management for Smart Grids)
Abstract
:This paper proposes a three-layer model to find the optimal routing of an underground electrical distribution system, employing the PRIM algorithm as a graph search heuristic. In the algorithm, the first layer handles transformer allocation and medium voltage network routing, the second layer deploys the low voltage network routing and transformer sizing, while the third presents a method to allocate distributed energy resources in an electric distribution system. The proposed algorithm routes an electrical distribution network in a georeferenced area, taking into account the characteristics of the terrain, such as streets or intersections, and scenarios without squared streets. Moreover, the algorithm copes with scalability characteristics, allowing the addition of loads with time. The model analysis discovers that the algorithm reaches a node connectivity of 100%, satisfies the planned distance constraints, and accomplishes the optimal solution of underground routing in a distribution electrical network applied in a georeferenced area. Simulating the electrical distribution network tests that the voltage drop is less than 2% in the farthest node.
1. Introduction
The unpredictable increasing in electricity demand has made challenging the design and planning of any electrical system in transmission or distribution level. The population growth, migration and city planning had reduced the performance of the Electric Distribution Systems (EDS) in large cities, especially in third world countries. The main reason for that is the conventional deployed EDS was designed without formal considerations of planning or projected demand. Consequently, the regular EDS are mainly unplanned and the electricity service throughout the networks are unsatisfactory with problems in the entire system, for instance reliability and stability.
Electricity transportation seriously concerns designers due to the large distance from generation to the final customer. Conversely, the generation in Micro Grid (MG) with Distribute Energy Resources (DER) is close to the end-user or is in the same Low Voltage (LV) network, therefore avoiding the power transmission [1]. Biomass, solar or wind power, and small hydro generators are some examples of DERs. Those alternatives are boosting the local generation, increasing the continuous electrical service, decreasing the fossil fuel dependency and can achieve a clean ecosystem by reducing emissions [2,3,4].
Nowadays, modern EDS must satisfy optimization, security, reliability, and energy efficiency requirements, which are considered as fundamental requirements in the design and implementation process. For instance, MG is the integration of optimal EDS with DER. In order to implement a Smart Grid (SG), firstly the EDS should reach security and, reliability requirement via technical planning. Moreover, the EDS must be optimal and technically adequate because the end customer is close to that system, and due to its investment cost this is considerable compared to the entire network [5,6,7].
Furthermore, DERs are a promising solution for the implementation of Low Carbon (LC) Technologies in a conventional electrical system. Considering that the power generation industry is a considerable source of CO, a growing number of EDS have connected to DER in order to follow the LC policies [8]. The LC policies suggest countries adopt clear and measurable objectives to reduce emissions. There is some research which proposes an acceptable level of reduction, as is the case of [9], which proposed a model to reduce 80% of CO emissions taking as based line 1990, and introduced the implementation of mitigation technologies, including DER in EDS.
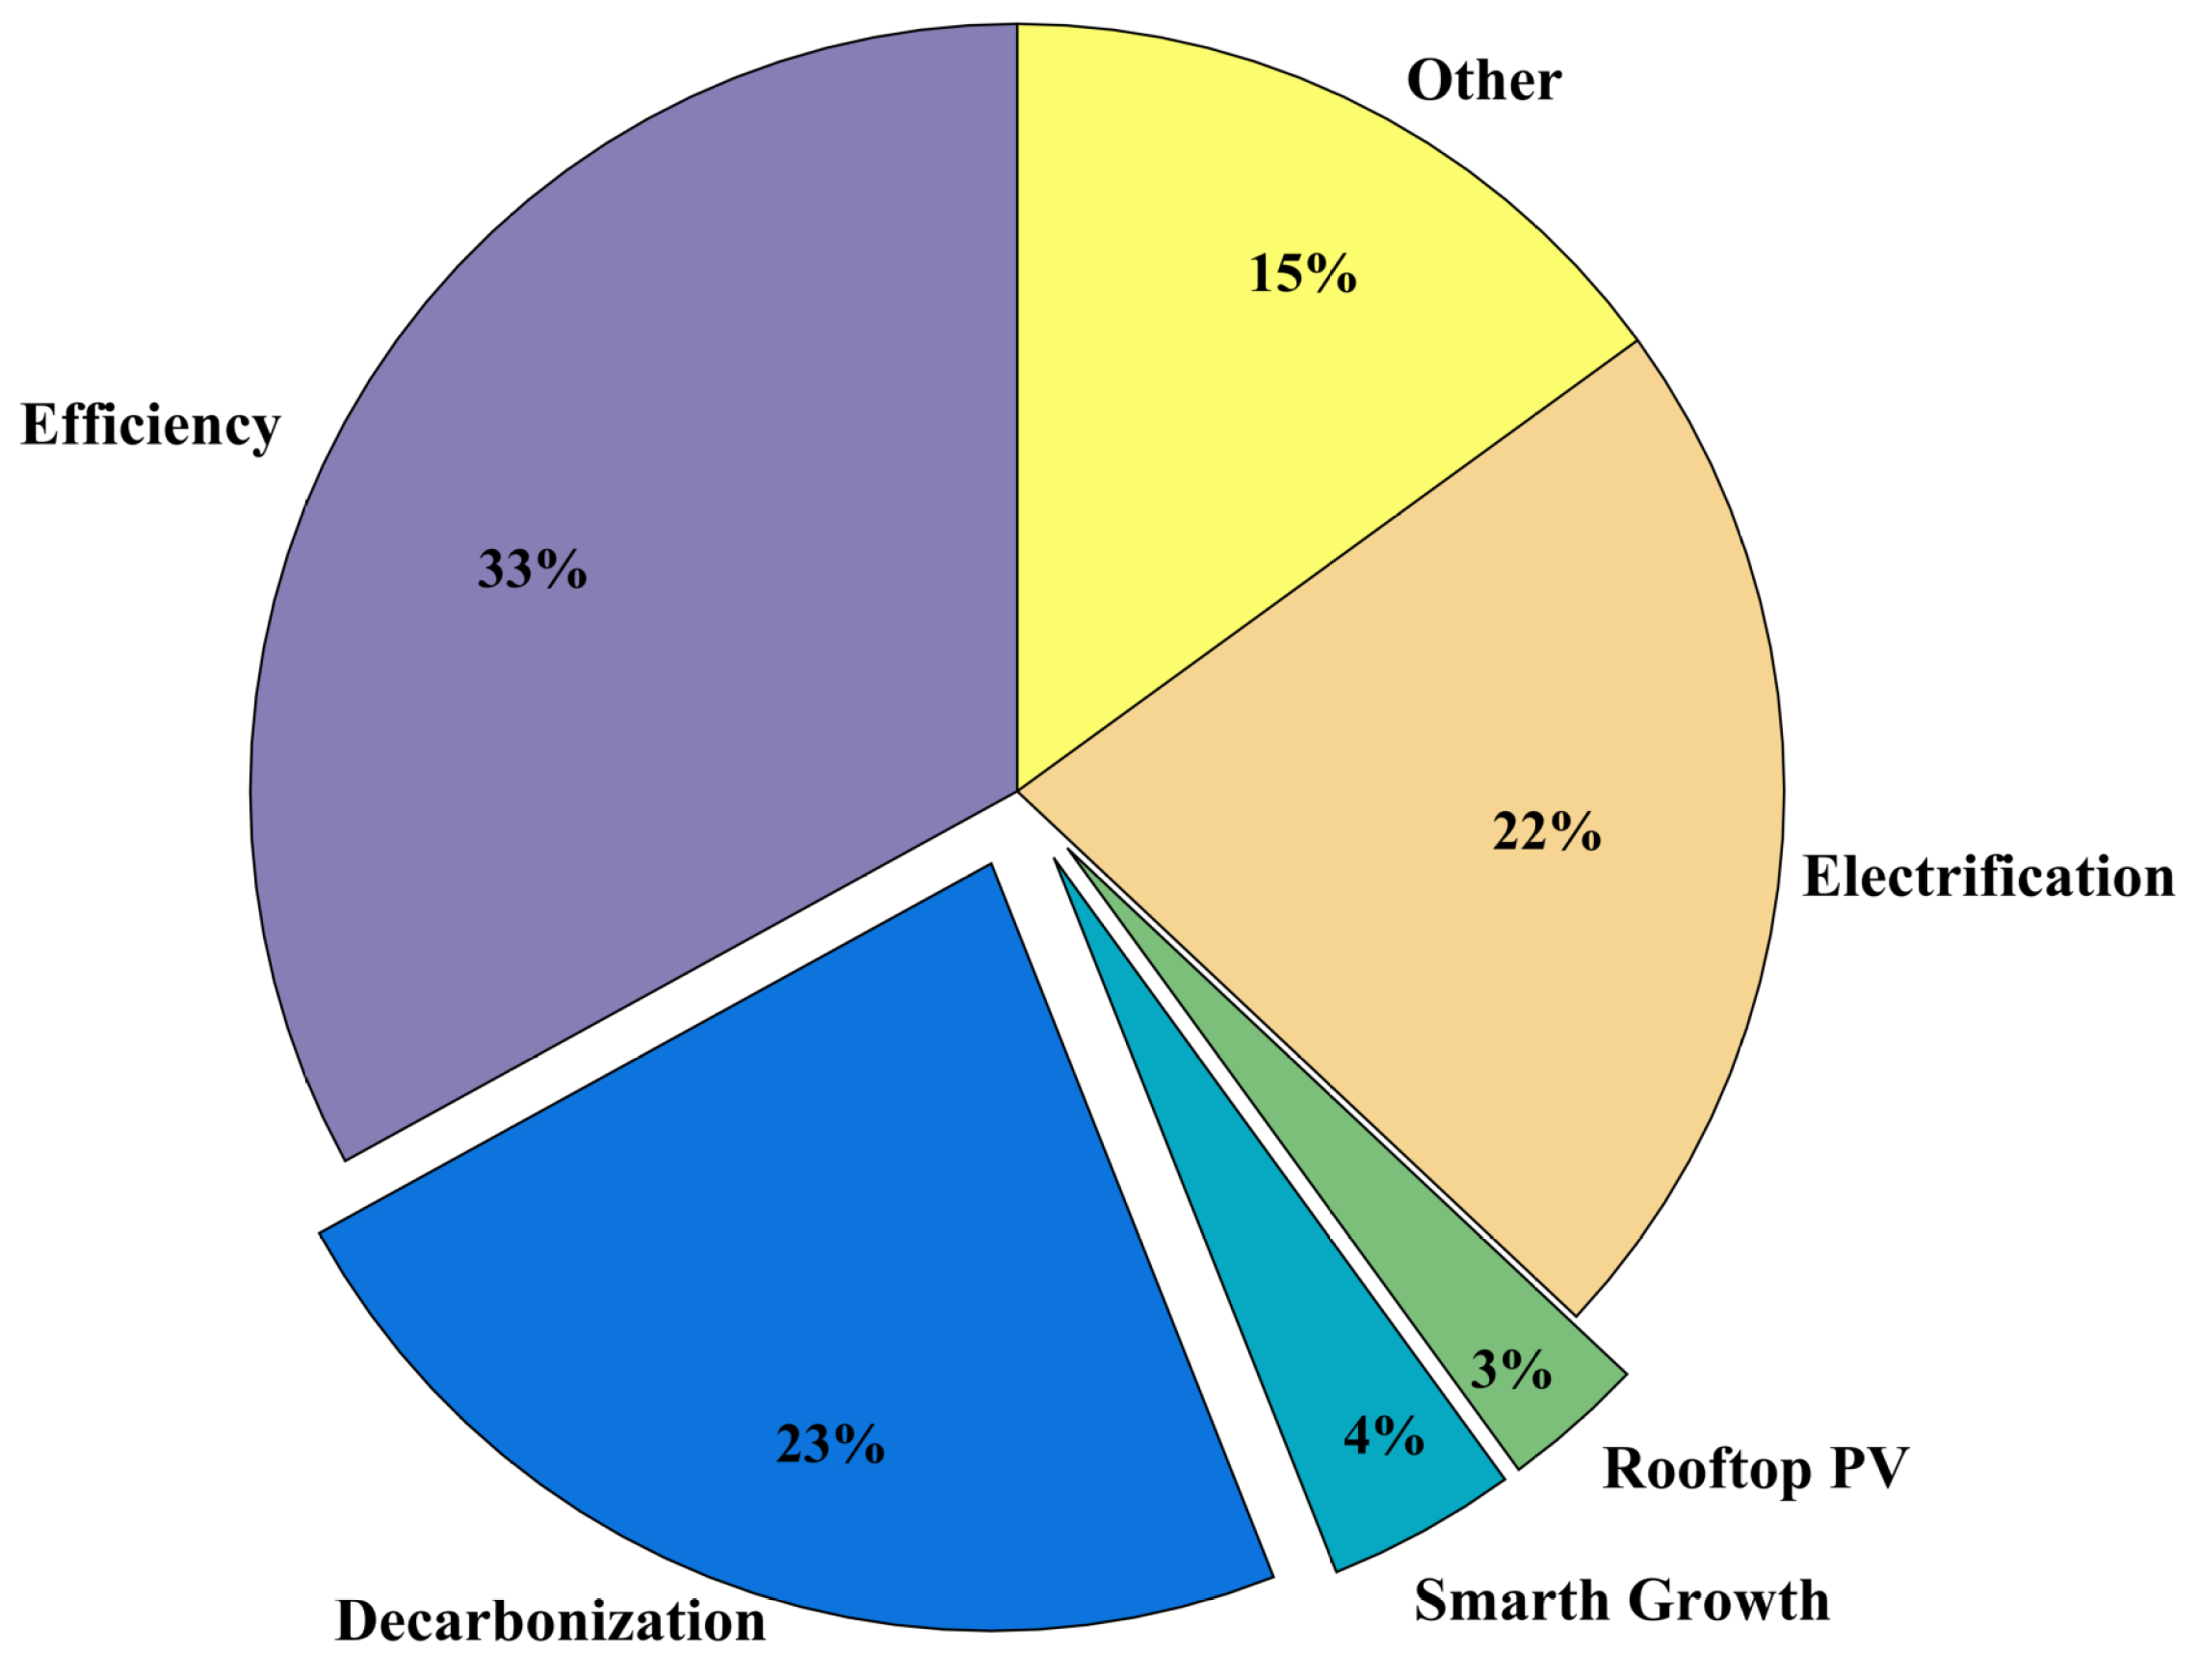
The Figure 1 shows the percentages contributions of each technology in the reduction of emissions. Special attention is focused on the electricity decarbonisation, smart growth and rooftop PV. The first technology is mainly the integration of renewable energy, which is composed of 90% CO free technologies. The second involves the optimal planning of EDS and the transportation systems. The third constitutes of rooftop PV implementation in residential and commercial buildings considering 10% of electricity demand should be reduced by the implementation of rooftop PV [9].
The mathematical model proposes in this paper achieve the entire connectivity, in order to cope with this objective the minimum expansion tree algorithm was applied, and the radial topology of a georeferenced EDS was obtained. By this methodology, the power balance in the network is achieved automatically and guaranteed, as well as the scalability, including the case of whether further residential or industrial loads would be connected to the system. The model performance test was developed in a Geographic Information System (GIS), where all the elements of the network are represented as nodes. Aside from the map information like streets, roads, and natural features, this representation includes homes, LV transformers and substations of the selected region.
Several researchers have developed models to find the best topology for an optimal EDS planning. For instance, Ref. [10] is one of the first to have presented a detailed overview of expansion planning models, compared to the different mathematical techniques describing the objective functions, constraints, the programming technique, and the pros and cons associated with the model. On the other hand, the approach is commonly used in wireless communication, Inga et al. [6,7,11,12] proposed a hybrid wireless mesh network infrastructure considering a multi-hop system which is planned for electric consumption metering in a metropolitan area network, thereby performing an advanced metering infrastructure for use in MG.
Lavorato et al. [13] proposed a critical analysis to integrate the radially as a constraint in an optimization model of an EDS, and [14] proposed a mathematical procedure for modelling the radial networks. Both studies recognize that the radially constraint is a heavy burden to implement in any model. Other researches have proposed that the problem can be solved using a combination of algorithms, including heuristics to find a good initial solution and then apply the result to a deterministic mathematical optimization [14]. In [15,16,17,18] proposed implementation of the Minimal Spanning Tree (MST) to minimize the energy supplied by medium voltage (MV) in an EDS. In [15] algorithm allowed graphing compression, leading to savings in computing time. Ref. [19] also tackled the active power loss minimizing problem using MST.
The optimization algorithm for determining the route for MV feeders was developed using simulated annealing algorithm in [20], who proposed a three stages methodology. Additionally, researchers in [21] describe a heuristic with the objective of minimizing the loss of power applying EDS reconfiguration. Ref. [22] used the complex network analysis and graph theory to explain the properties and exposed the mathematical representation of the electrical topology that are implemented in the real EDSs. In [23] describes the network design problem using the cooperative Tabu research that is the first level of the capacitated multicommodity. Ref. [24] proposed a model, using the adapted genetic algorithm, to minimize the voltage drop in distribution transformers, considering size, quantity, and siting.
There are several heuristics methods that can be used to solve an optimisation problem, in the paper [25] a scheme is explained the pros and cons of the “best solvers”, based on the analysis of a considerable amount of articles. The efficiency and closeness to the global optimum solution of some heuristic solvers are tested in [26], where implemented a Home Energy Management solved through five heuristic algorithms.
The heuristics methods applied GIS are investigated in several technological areas, for instance, the introduction of more flexible technologies in urban areas [27]. Whilst [28,29] study the DER penetration in an implemented photo-voltaic systems. The problem in [30] is solved through a modified Particle Swarm Optimization (PSO), which included a new mutation method to improve the global searching thereby avoiding the local optimum. Ref. [31] applied the local search heuristics representing the EDS as a spanning forest problem. The proposed algorithms are based on the research of the shortest spanning sub tree and connection network, originally proposed by [32,33].
Based on the extensive bibliographic research, a model of DER planning with MG integration deployed in a GIS is hardly resolved by linear programming, because it implies a large computational time due to the complexity and the massive amount of involved variables. The proposed problem represents a combinatorial problem, which includes the routing cost minimization as objective function and constraints of connectivity, radial, distance and voltage profiles. In conclusion, the problem is NP-Complete and as a result, lacks a globally optimal solution [30].
For the reasons exposed above, the raised problem is not trivial and it must be solved applying heuristic models. The solution of the mathematical model of the EDS planning is proposed as a routing problem which is approached through a complex network analysis and graph theory [34]. Hence, it is necessary to perform a heuristic model that can reach a near optimal solution or sub-optimal solution. The present paper presents a mathematical model that applies graph theory as a multi-layer algorithm; one of them addresses the problem of routing of a MV network, the second the LV network, and the third allocate the DER in the EDS.
2. Problem Formulation
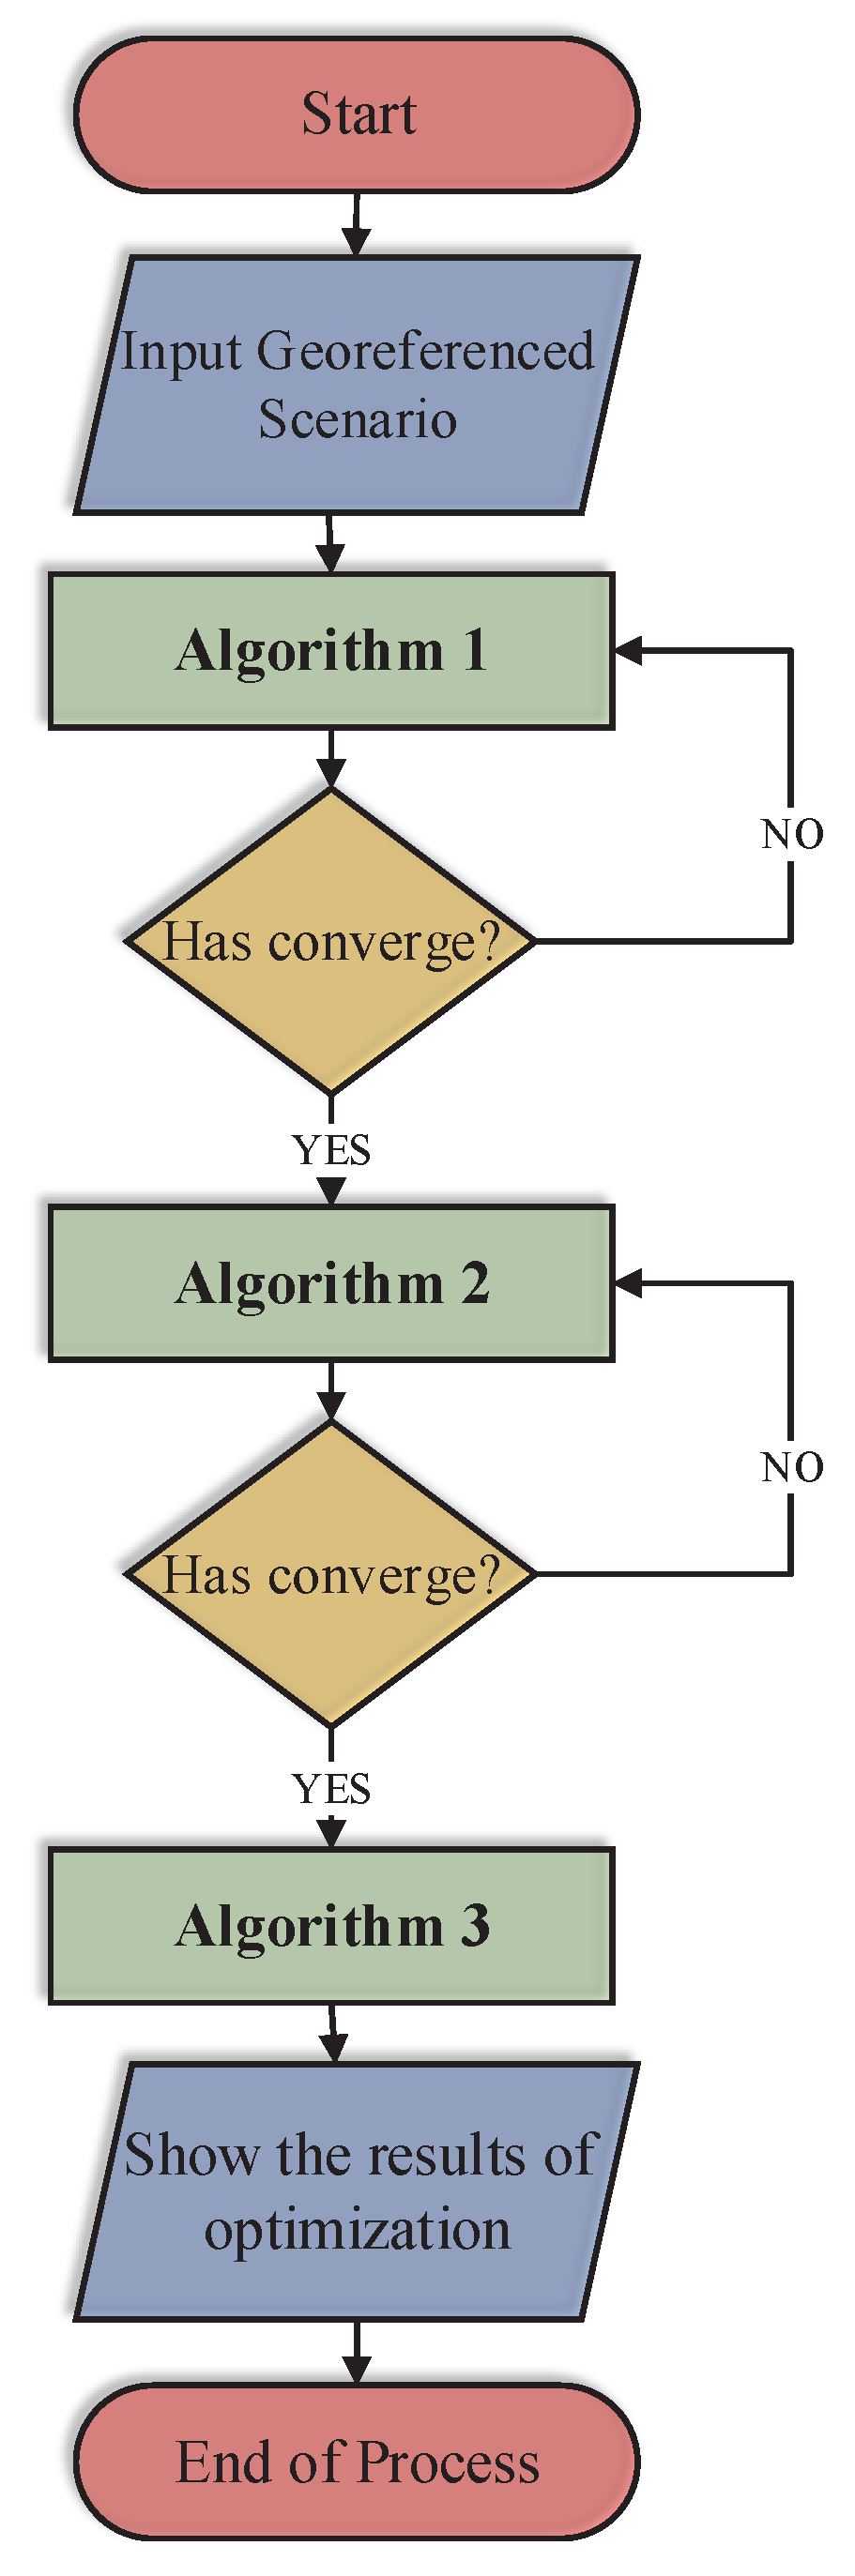
The Optimal Routing of Electrical Distribution Networks is defined as a NP-complete problem, to deal with it a heuristic model is used. The model is divided into three algorithms; Algorithm 1 solves the problem in MV network, while Algorithm 2 works with the resolution in LV network, and Algorithm 3 determines the allocation of the rooftop PV in the scenario. In Table 1 are presented the variables used in the model.
What the mathematical model accomplishes in the algorithm is represented by the next equation exposed below. The objective Function (1) finds the minimum length of path feeder, where C is the cost of distances and X represents the activation or deactivation of each node connection. The Equations (2) and (3) represent the radial nature for the network where the numbers of connections must be n − 1, where n is the number of nodes. Finally, the Equation (4) demonstrates that the connections have two states, like 0 or 1, whether there is disconnections or connection, respectively.
| Algorithm 1 Optimal location and routing a MV grid network. |
|
The Algorithm 1 has five steps.The first declares the variables, distance R and the capacity number Cap restriction to zero, or receives the georeference information from the map, including the latitude and longitude of end-user, candidate sites and substation location. The information was taken from an OpenStreetMap (OSM) file, including the georeferenced information about the houses’ shape, main routes, streets, public spaces, and more. Step 2 determines the optimal transformer selection using Prim algorithm, which returns the number and transformer index of optimal configuration. Step 3 is responsible to find the nearest street point to customer, it is done through the distance calculation of each end-user to the each constituted point street, and determining the closest point to each home, this solution has the same number as end existing users. The fourth step searches the optimal routing of the MV grid, which used the haversine distance calculation to determine the distance between all elements in the network. After that, the connectivity matrix is calculated with the model restrictions, next the Prim minimal spanning tree is applied to find the minimum rout. The fifth step determines the cost that corresponds to the total distance of the elements of the MV network.
The Algorithm 2 determines the optimal routing of the LV grid network, which approaches the problem dividing the network in pieces of the transformer that serves to the end user customer. The solution is proposed in five steps as follows. Step 1 is similar as the Algorithm 1 and aim the initialization or complete the needed information. Step 2 determines the distance between each end user with all solution transformer of Algorithm 1. After that, the connectivity matrix is calculated, which considers the connectivity between the transformer and the substation as already done, and the connection from the substation to end-user as non available. Step 3 implements the Dijkstra algorithm calculation, which find the optimal LV connections. Step 4 calculates the optimal rout of the corresponded elements to the transformer, and the step individually considers the LV connections. Finally, step 5 calculates the final cost that correspond with the final distance of conductor in LV network.
Finally, the Algorithm 3 allows us to determine the allocation of the rooftop photo-voltaic panels in the houses. The houses percentage chosen is 10%, based on the contribution of PV in MG. The algorithm in step 1 gathers the end user coordinates in one array, after the PV amount is determined with the researched criteria and is stored in PVs, in step 2. In step 3 the center of mass is calculated though k-medoids algorithm, the scenario is divided into PVs variable clusters. In step 4, the electrical power is assigned for each end user, and the power for each rooftop is 10 KV, the same for all scenarios.
| Algorithm 2 Optimal routing a LV grid network. |
|
| Algorithm 3 Allocation of DER PV generator. |
|
3. Analysis of Results
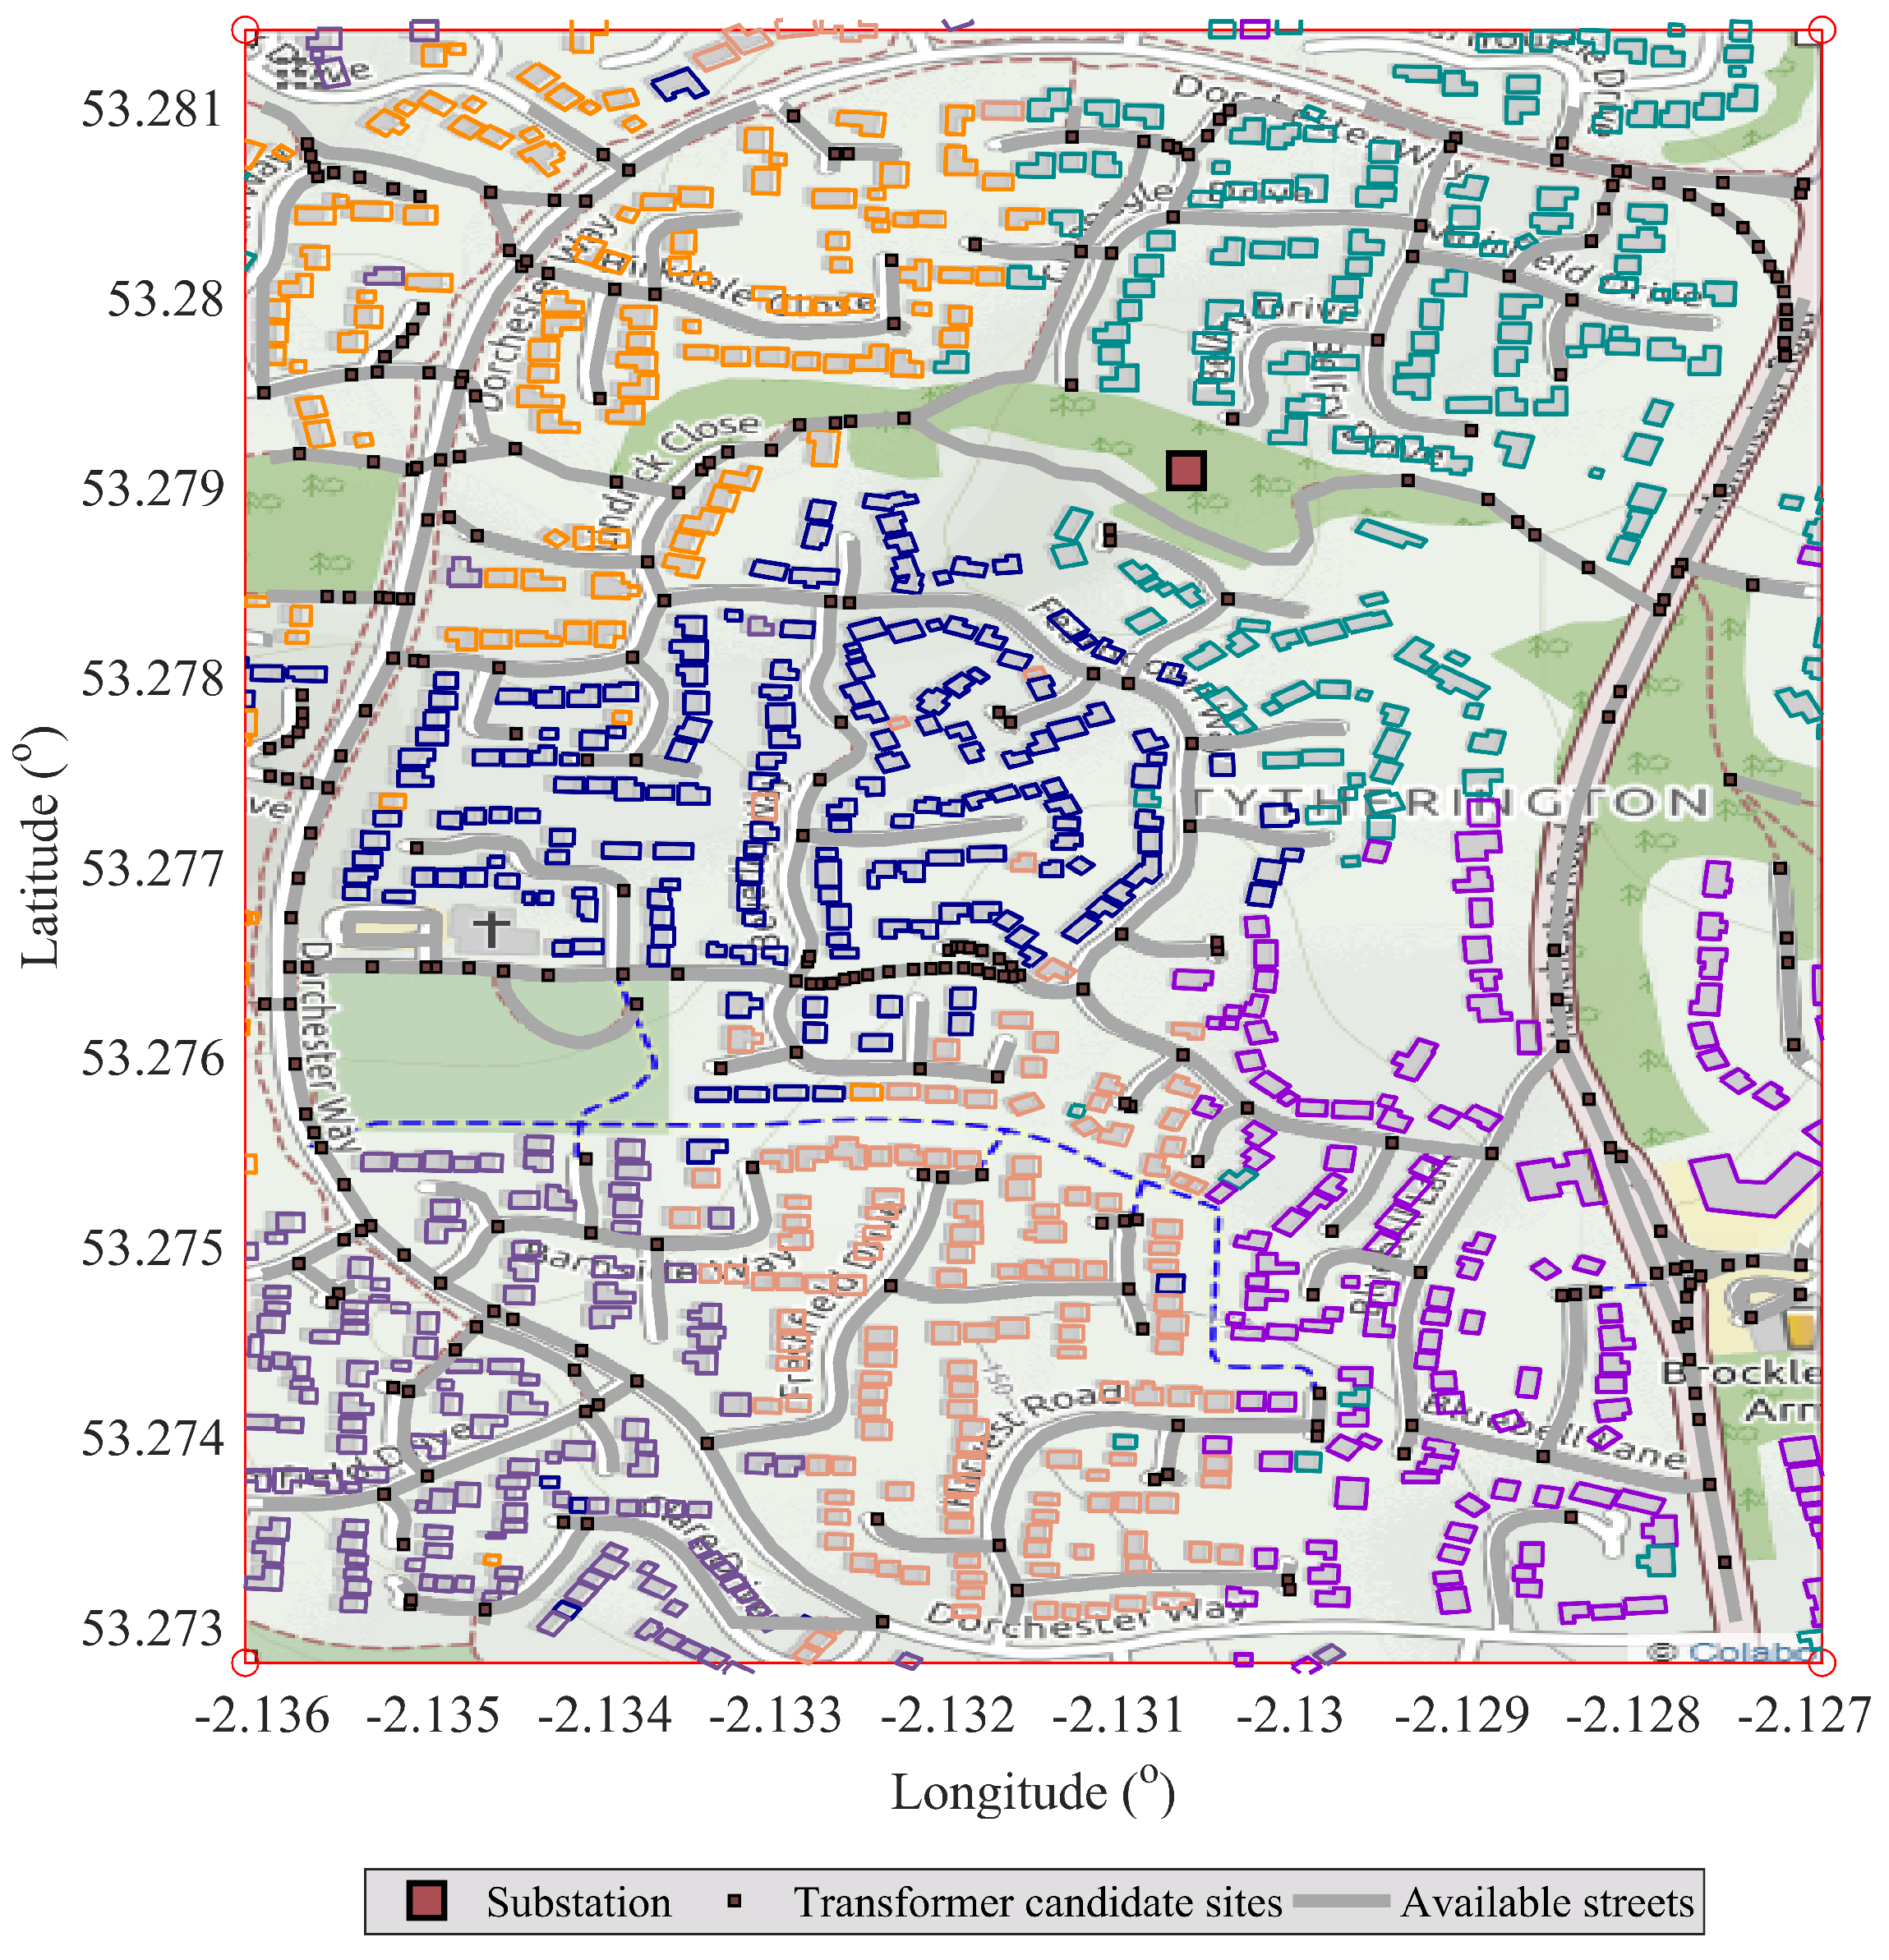
The case study is part of the EDS of the area of Tytherington in the north of Macclesfield in Cheshire, England. The limits in longitude in the present study are −2.1360 to −2.1270, meanwhile, the latitude starts from 53.2730 to 53.2810, the total area is 1.15 square kilometers. In the scenario, there are 813 loads with a total power of 5.4 MW. The presented model deploys the EDS, including the network planning expansion. Therefore, the model designs an efficient and reliable EDS, with the lowest investment cost. The network planning expansion allows us to use the initial configuration and expand the EDS with a short and medium time period. The model was developed with the algorithms one and two presented below, which was implemented in Matlab.
In the Table 2 are presented the simulation parameters used in the implementation. The selected area has a density of 700 end users per kilometer square, which is considered lower in comparison with the average density in the cities in Europe. The deployment requires a maximum distance of 100 m from an end user to transformer, with a coverage of 100% in the entire network. The installation type in both networks is under grounded and the configuration is radial in order to accomplish with the EDS requirements. The number of main feeders from the substation is one. Whilst, the voltage in the MV installation, between the substation and the transformers, is 11 KV, and the LV network voltage is 400 V. Finally, the concentrated load is balanced in all the experimental procedure.
The studied georeferenced scenario is shown in Figure 2. First, in order to analyze the designed network performance, the scenario was divided into six different clusters, the homes in the same cluster were outlining with the same colors. The division by clusters was made with the K-medoids algorithm, but any clustering algorithm could be used. The clusters are numbered from 1 to 6 in clockwise, starting with the left upper with the number 1 and the located in the middle left is the 6. The power consumption of each home depends on the cluster membership, in the cluster 1 the average consumption is 300 KVA, whilst the average power in the cluster 2 is 400 KVA and the houses of cluster 6 the consumption is 800 KVA, correspondingly. The power assignment is random normally distributed, depending on the cluster membership.
The substation location is aleatory, where must exist enough space for the implementation of this building. It can be changed, and the optimum substation allocation is proposed for future work. The transformer candidate sites are shown in the graph as well. These sites are called manhole or checkup points. To find these points are considered all the corners or bifurcation points in any street, in total there are 314 checkup points. These points are the input of the prim algorithm with the desired maximum distance, therefore the prim algorithm output is the final transformer allocation.
A constraint in the model is the maximum distance between the end user and their corresponding LV transformer. The distance restriction is an input parameter in the prim algorithm, that decided the final transformer allocation. Thus, based on this distance parameter two scenarios are proposed, the first scene takes the restriction of 80 m and the second 100 m, and are called A and B scenario, respectively.
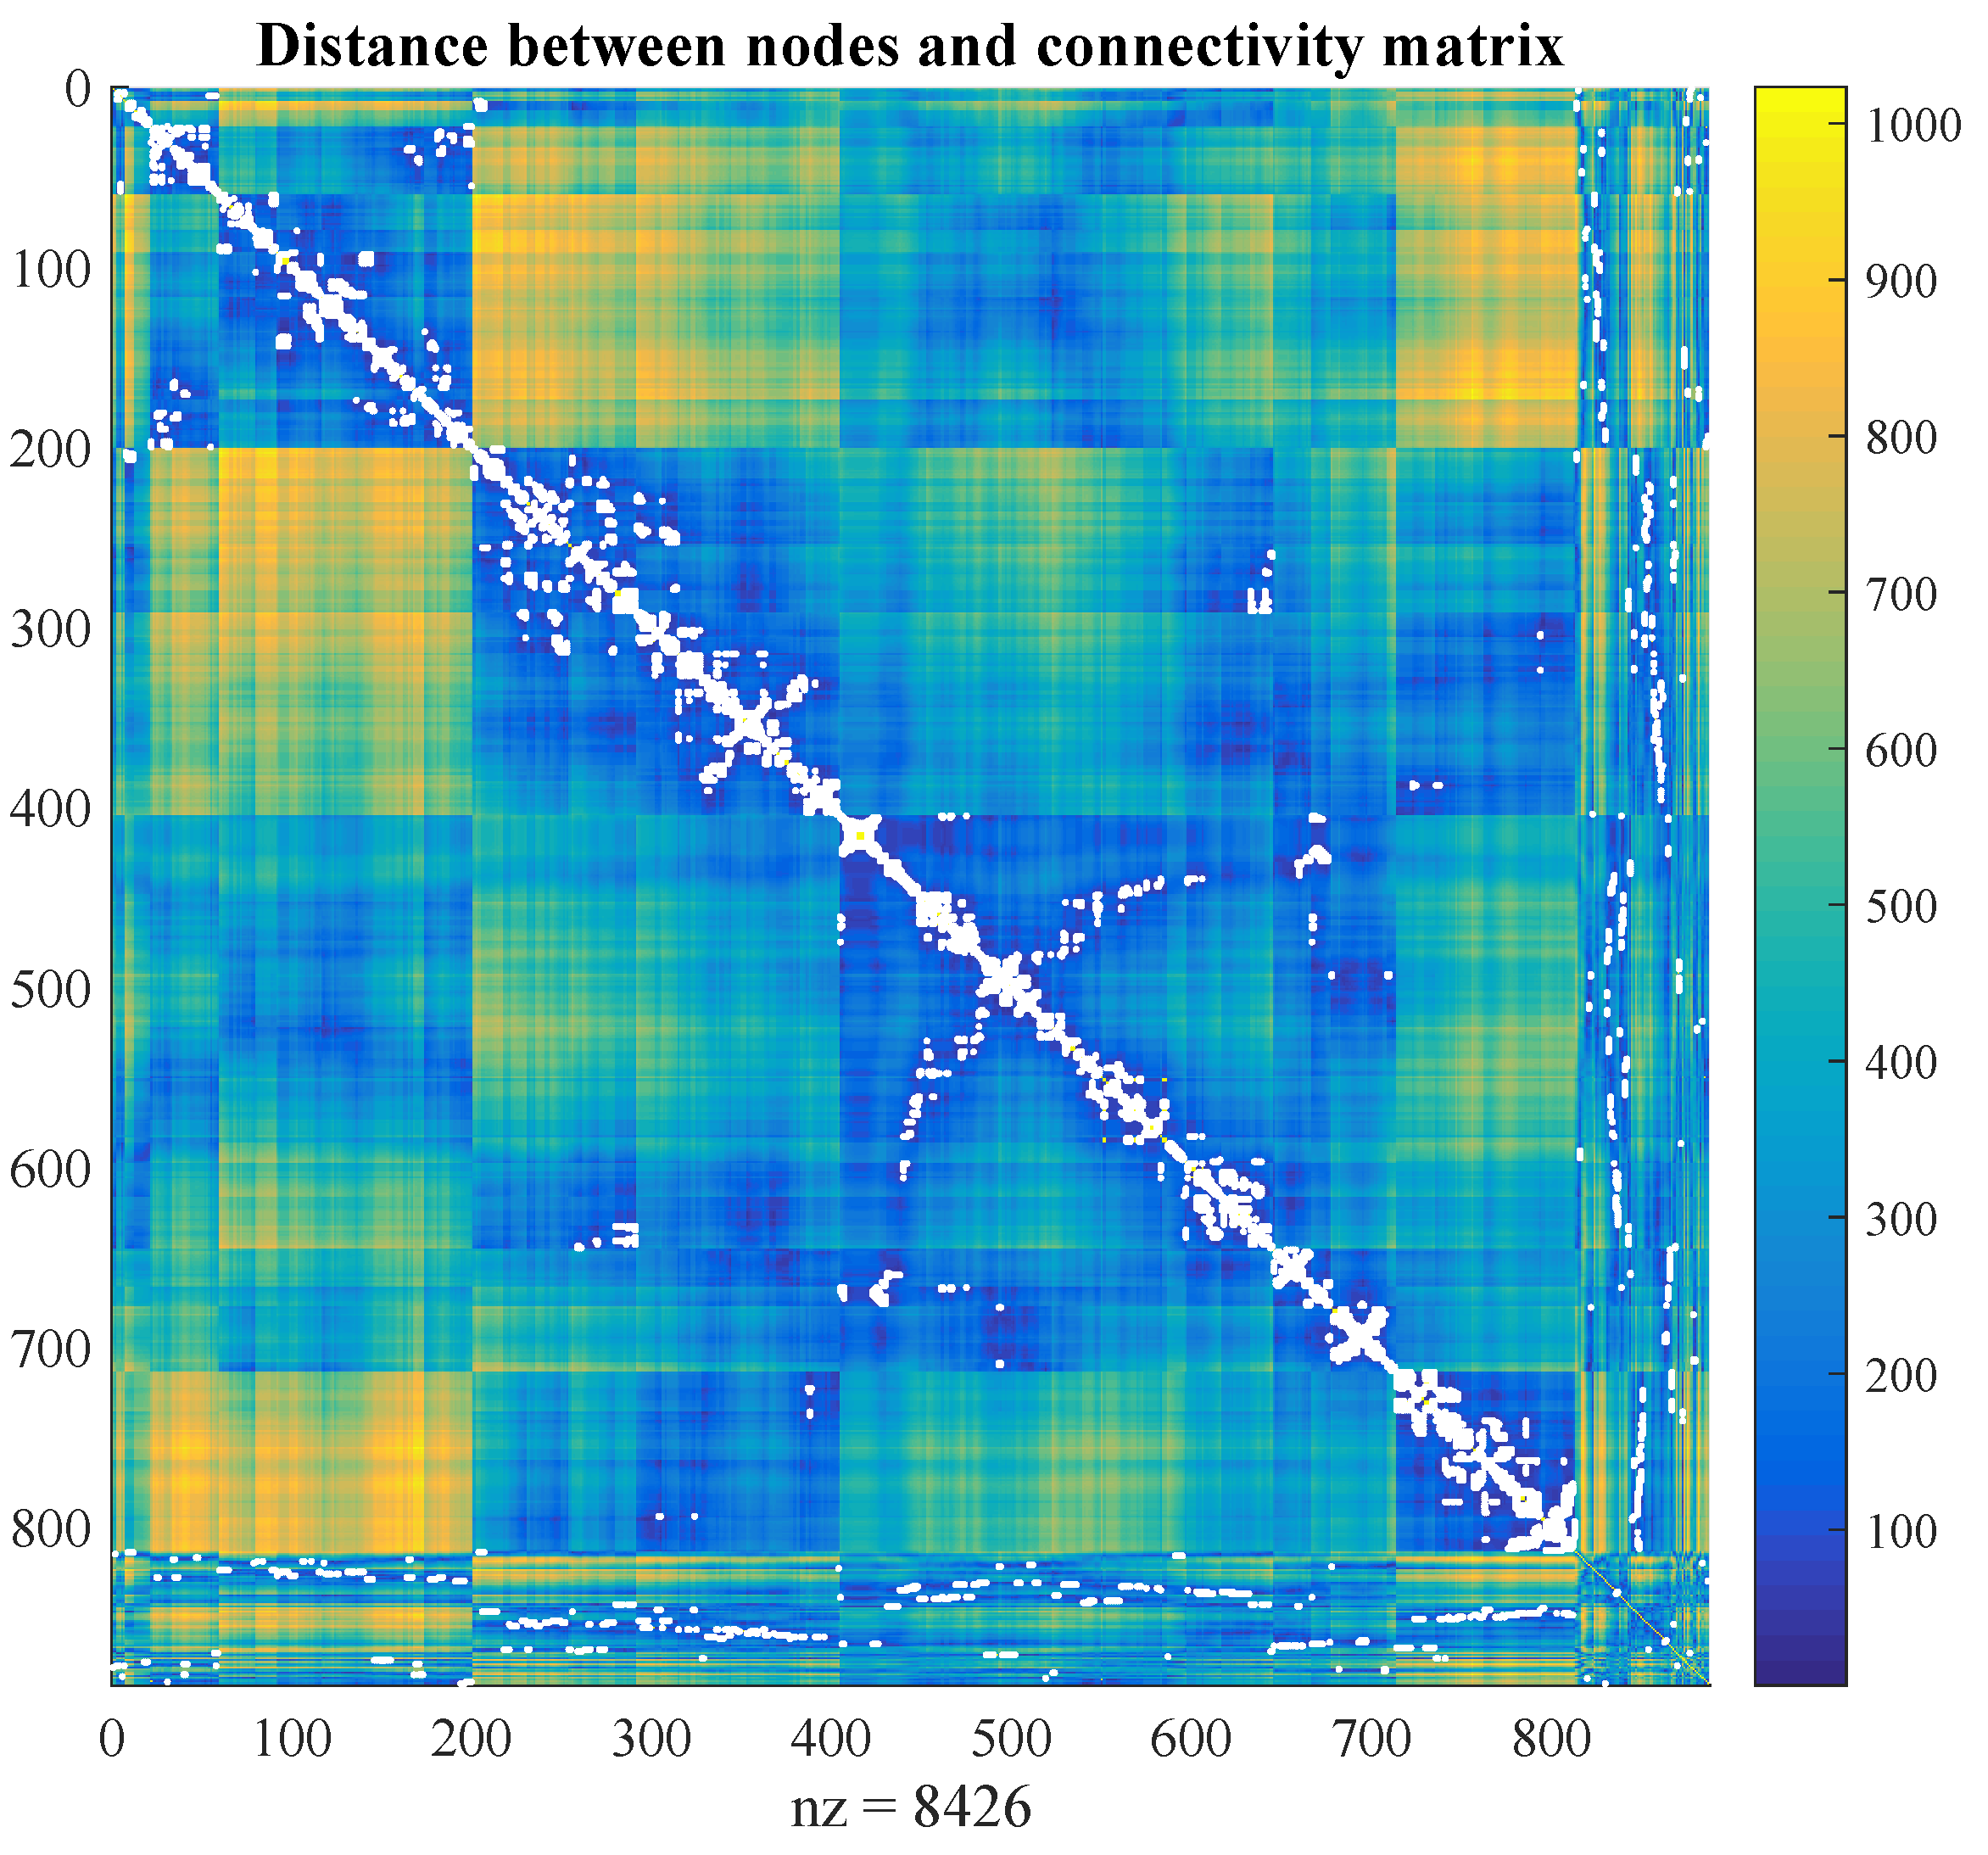
The optimization applying graph theory is based on the connectivity matrix. The connectivity matrix of the presented scenario A is shown in Figure 3, where is seen a symmetrical square matrix of N+M+S elements. Where N is the number of end users, M is the number of activated transformers and S is the substations number. In order to find the connectivity matrix, the distance matrix is calculated, which as shown in the graph represents the distance between homes to homes, homes to transformers, homes to the substation and finally transformers to the substation. The color in the matrix represents the distance, for instance, a dark color means a closer distance compared with a light color. Moreover, the white dots illustrates the possible connections between nodes, the white dots are located whether the restriction distance is accomplished. The number nz in the bottom of the figure is 8426, which represents the number of total connections in the studied scenario. There are two extreme fringes in the figure, the right and the bottom one; those fringes represent the connection between transformers and end users. Notice that the form of the fringes changes respect to the rest of the figure, mainly that there are more white dots which means the higher connection possibility between transformers and end user. This is due the optimal transformer allocation. Besides, the principal diagonal consideration must be considered, because it represents the distance between the same node, and it must be changed for a greater distance in order to do not obtain erroneous model results.
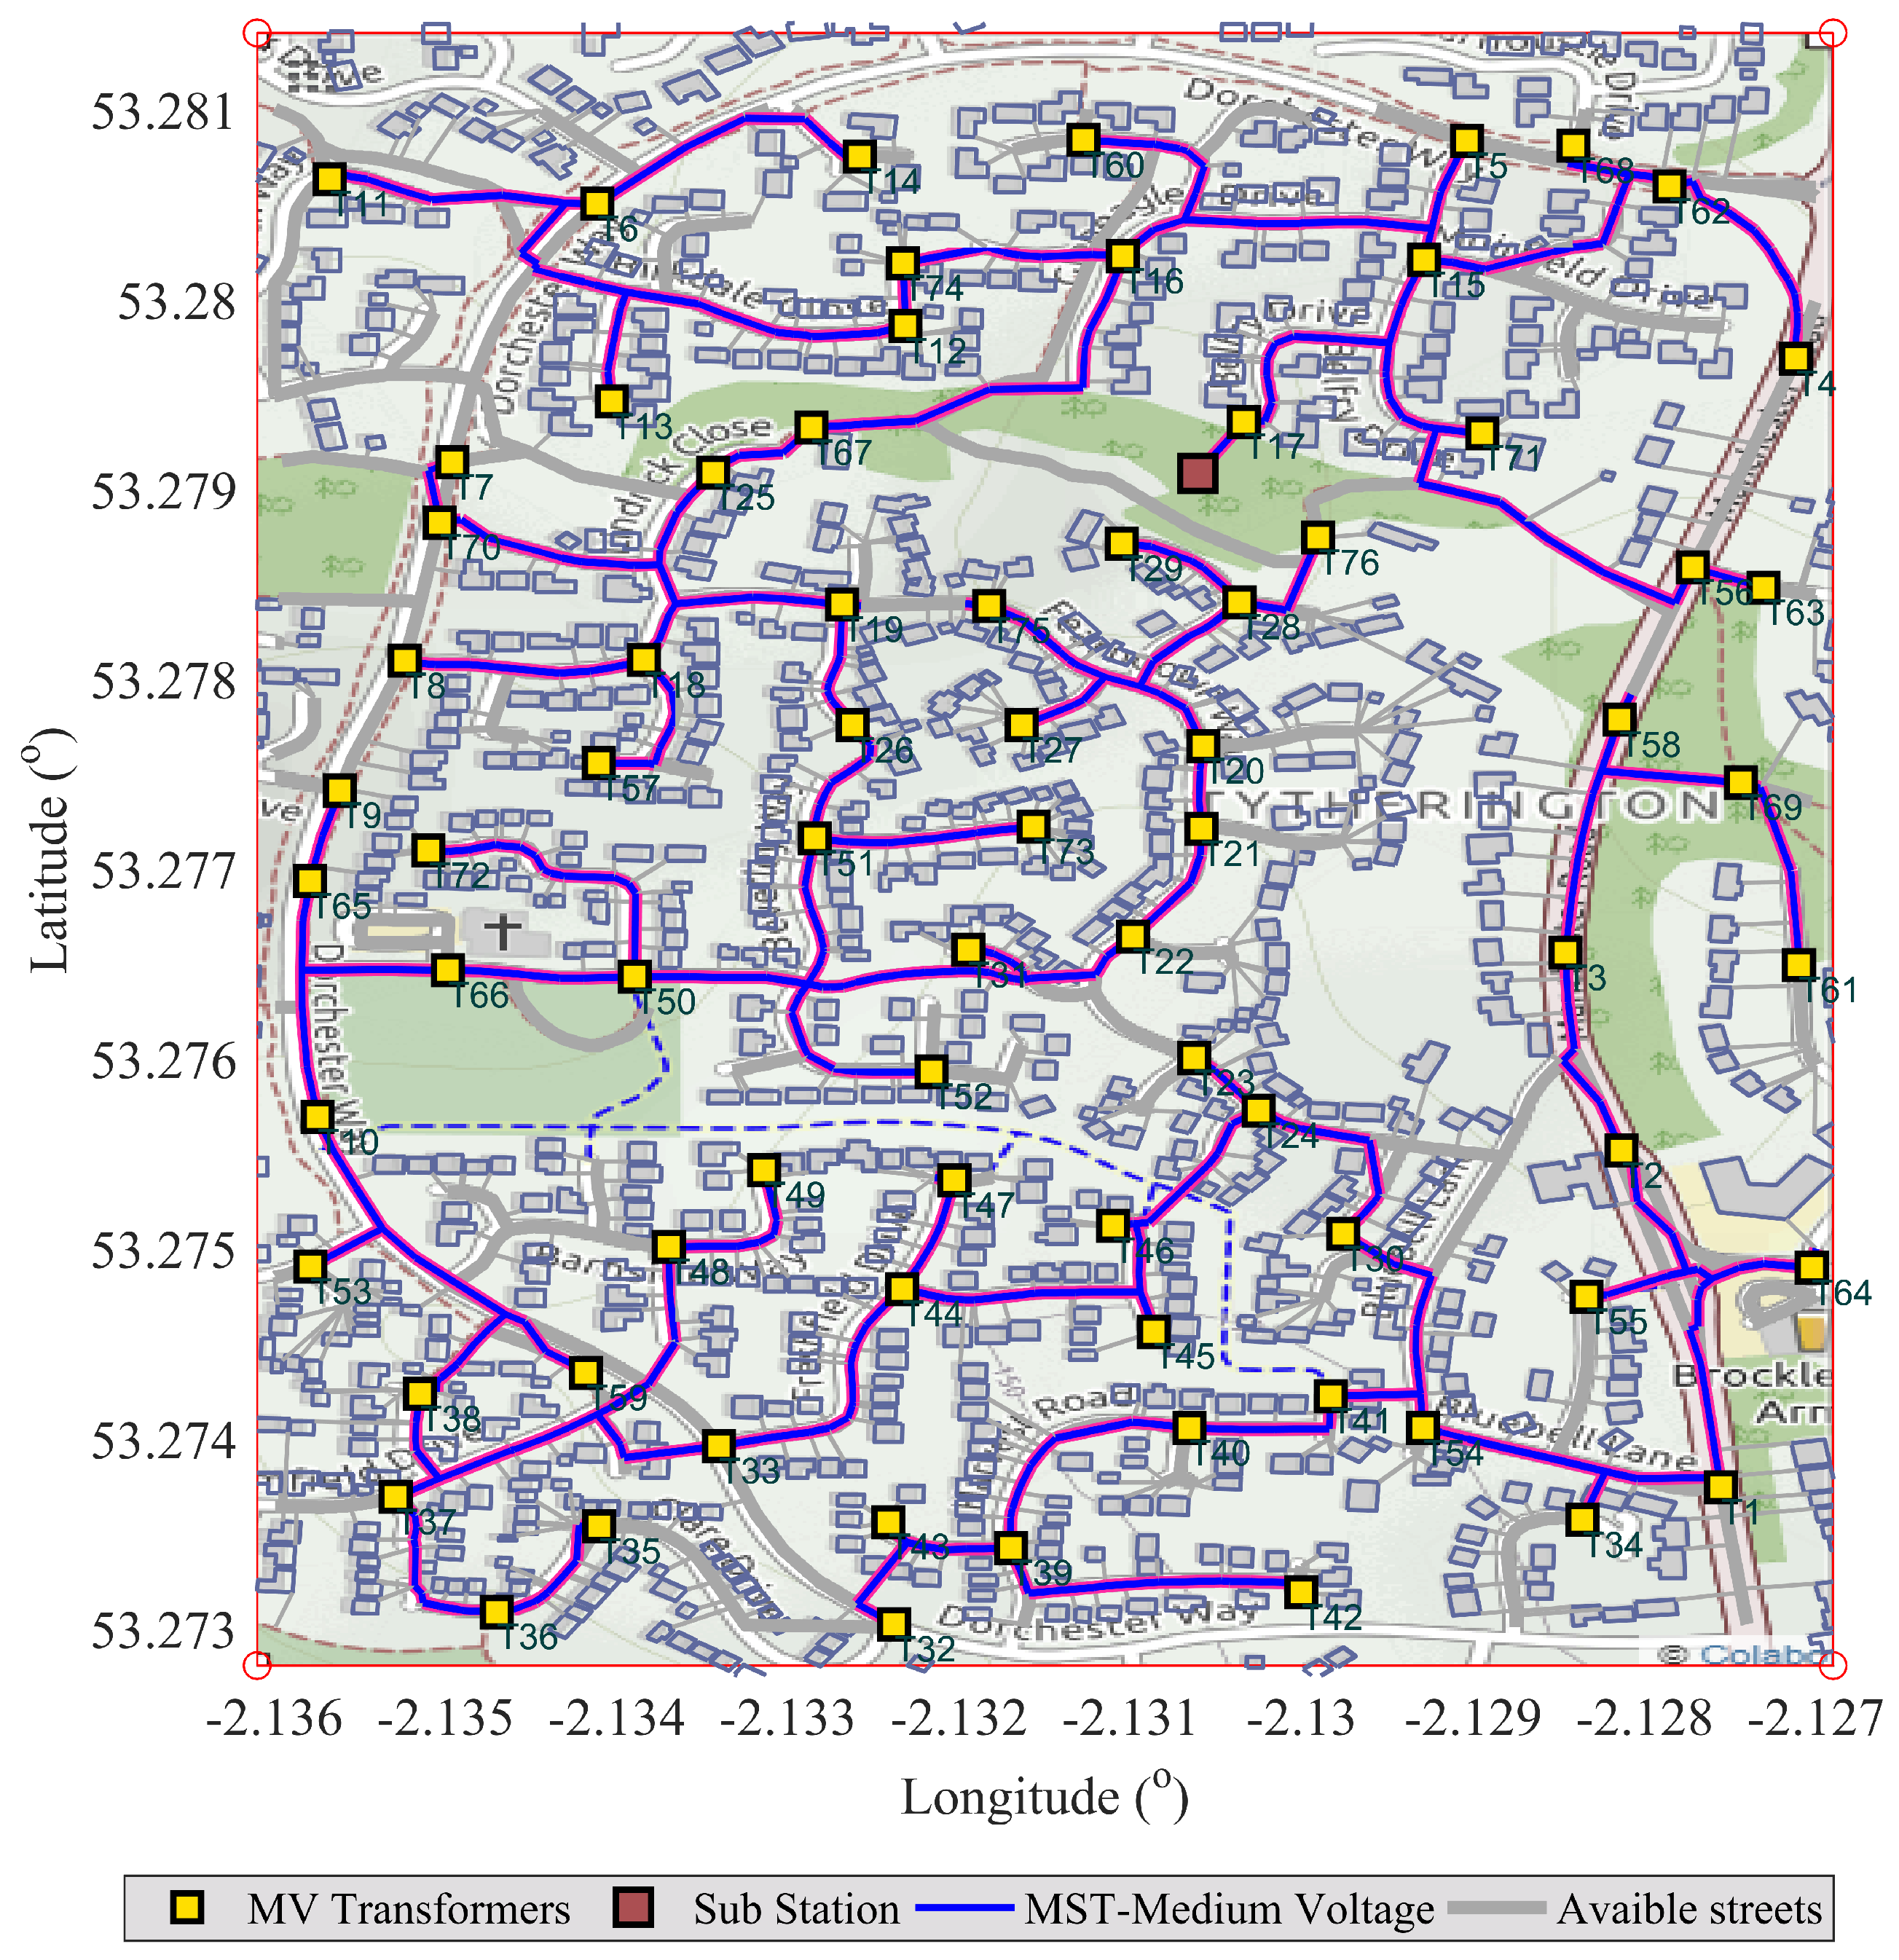
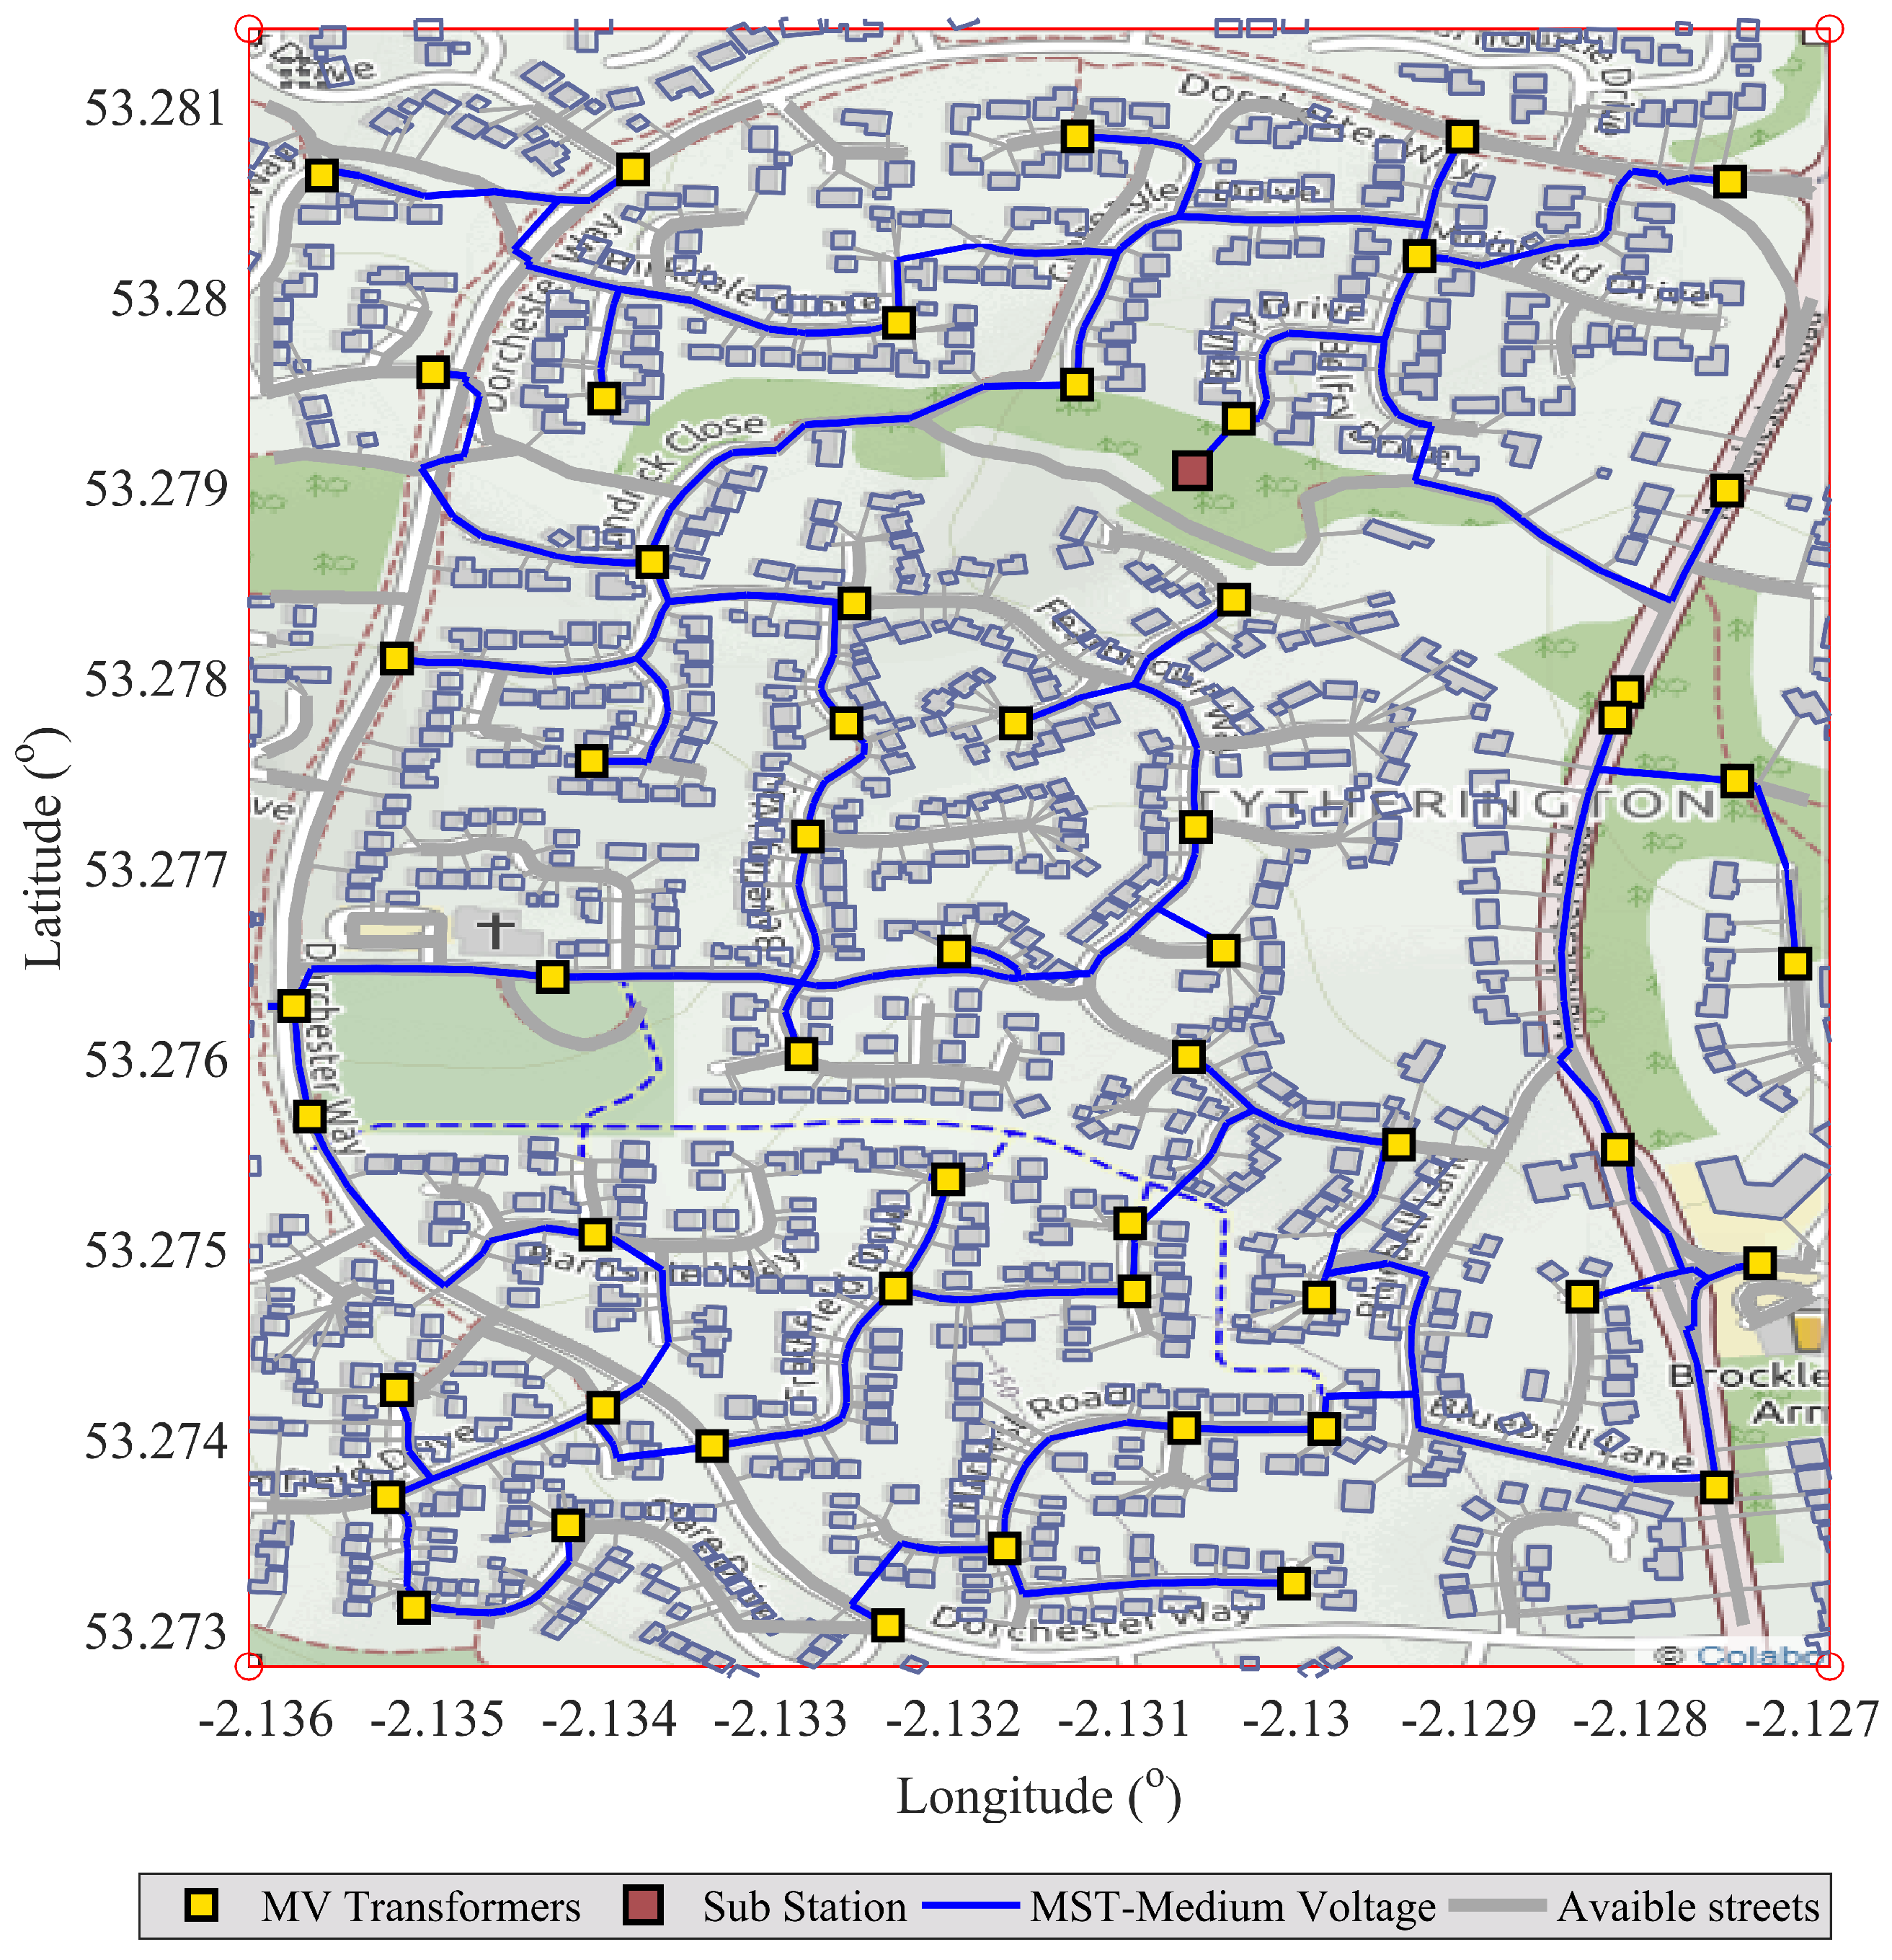
The obtained result with the Algorithm 1 is the sub optimal MV network routing of scenario A is shown in Figure 4, which was generated with a distance constraint of 80 m and a connectivity of 100%. In this scenario, there are 76 transformers located in the candidate sites using the prim algorithm. Therefore, the distance and connectivity constraints are accomplished through the location of the transformers. Moreover, initially, by the MV network route origins in the substation and by means of one feeder deliveries power to all the MV transformers. The planned routing is radial, following the routes of the streets, consequently, the MV network can be implemented as an underground network. The MV network length is 14.05 km, connected by one conductor all the transformers through MST. The planned routing is an alternative method for resilience network in order to the designer can be planned optional routes in case of adverse operating conditions, this topic is proposed as future work. Scenario B is shown in Figure 5, which was generated with distance and connectivity constraints of 100 m and 100%, correspondingly. In the present scenario, there are 55 transformers located in the candidate sites, accomplishing the desired constraints. As well as the previous scenario, the planned routing is radial, following the routes of the streets, consequently, the MV network can be implemented as an underground network. The MV network length is 12.15 km, connected by one conductor all the transformers through MST. In scenario B, there are 21 transformers and 2 km of conductor less than the last analyzed scenario. However, those savings affects the LV distribution network design because the reduction in the transformers amount represents the overloading of them. Moreover, the transformers power capacity must be raised by reason that the corresponding demand will the higher. Under those circumstances, Scenario A henceforth will be called the suboptimal solution of the presented model. The presented results in Table 3 compare the data obtained from the A and B scenarios.
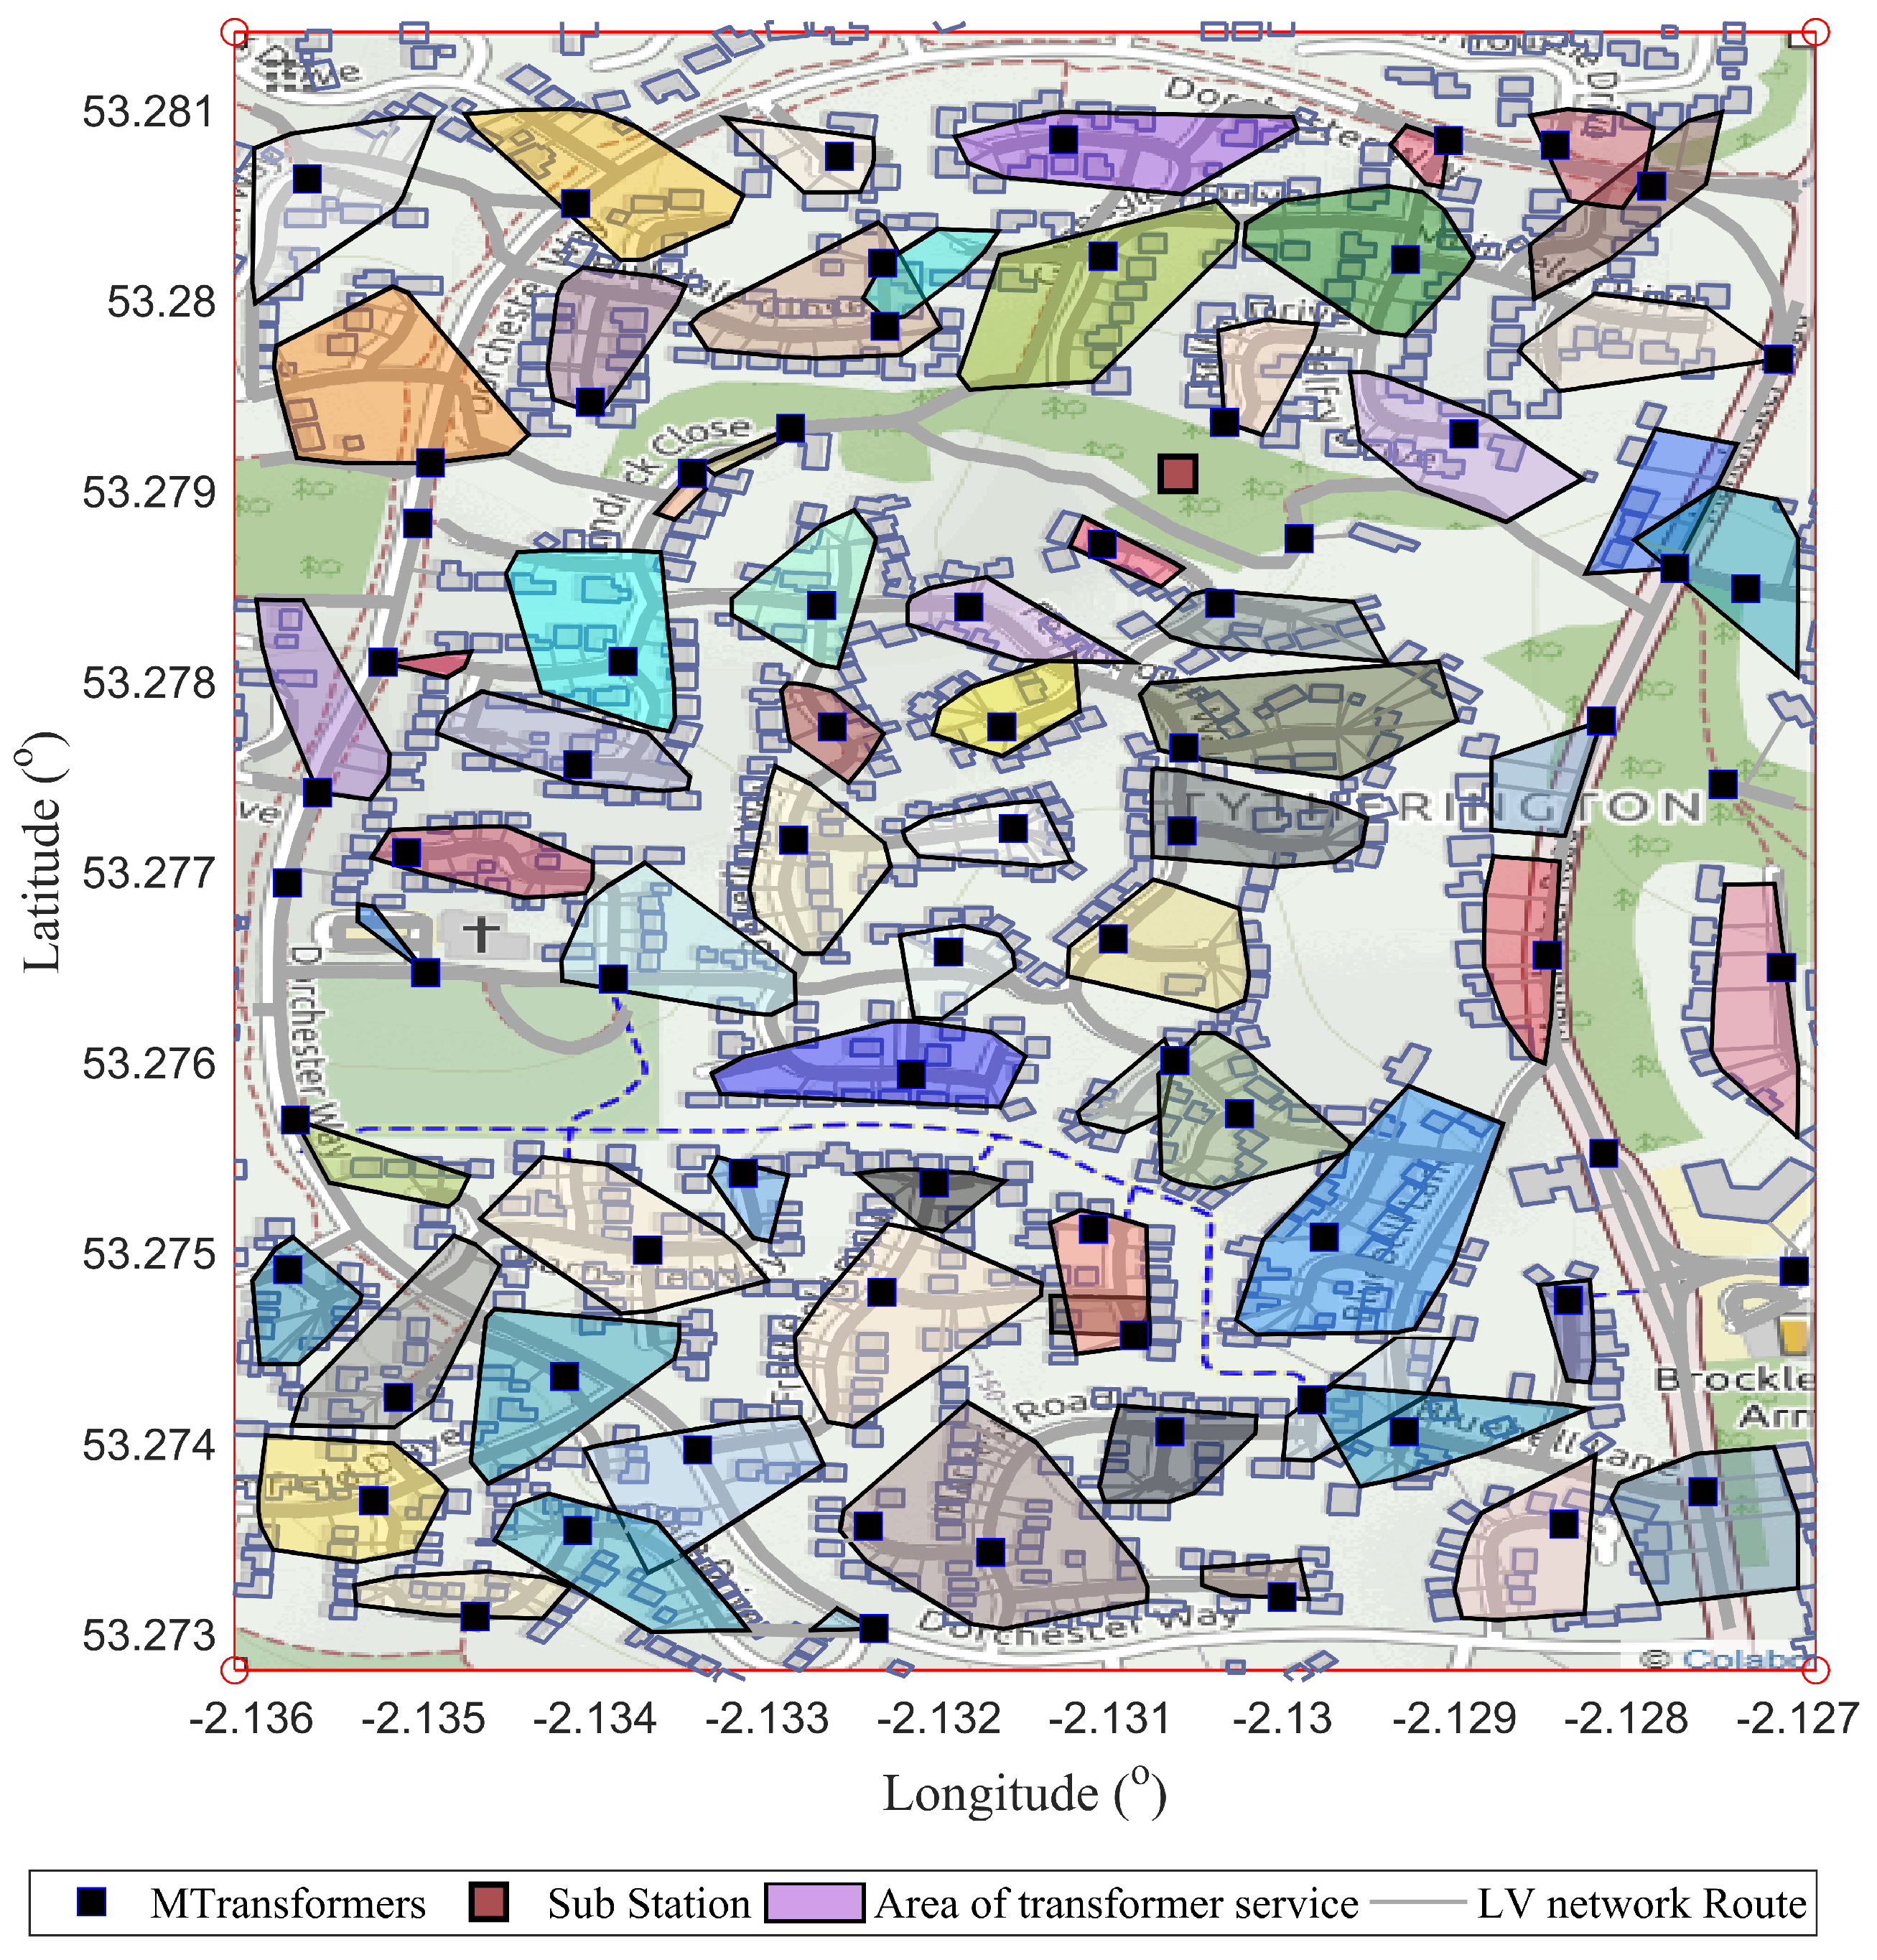
The LV network was designed through Algorithm 2, optimal routing of a LV grid network, explained in the sections below. The obtained result is presented in Figure 6, there is shown the georeferenced scenario with LV network implementation and irregular polygons sketched in the graph, delimiting the transformers area of service. The end users with 100% connectivity are connected to the LV network through the operator service cable. Those cables connect the home nearest point to the corresponding nearest street point; this calculation is included in the model. The distance in the LV network includes the length from house to the street and from that point down the street to the transformer. The model for the LV network design is subject to the application of distance restriction.
The connection representation between the transformer with their end users are shown in the Figure 7 through the irregular polygons, those indicate the service area of each activated transformer. The mentioned polygons gather the elements belonging to the individual LV EDS, the transformer normally is inside the polygon, but can be in the edge, the polygon joins all the connection house points including the transformer. If the transformer does not belong to any polygon, it means that it just delivers power to one end user, normally the closest one. There are some houses in the study that are not considered as nodes of the network, especially they are located within the map end limits. The end users connect to the corresponding transformer via under grounded electrical installation.
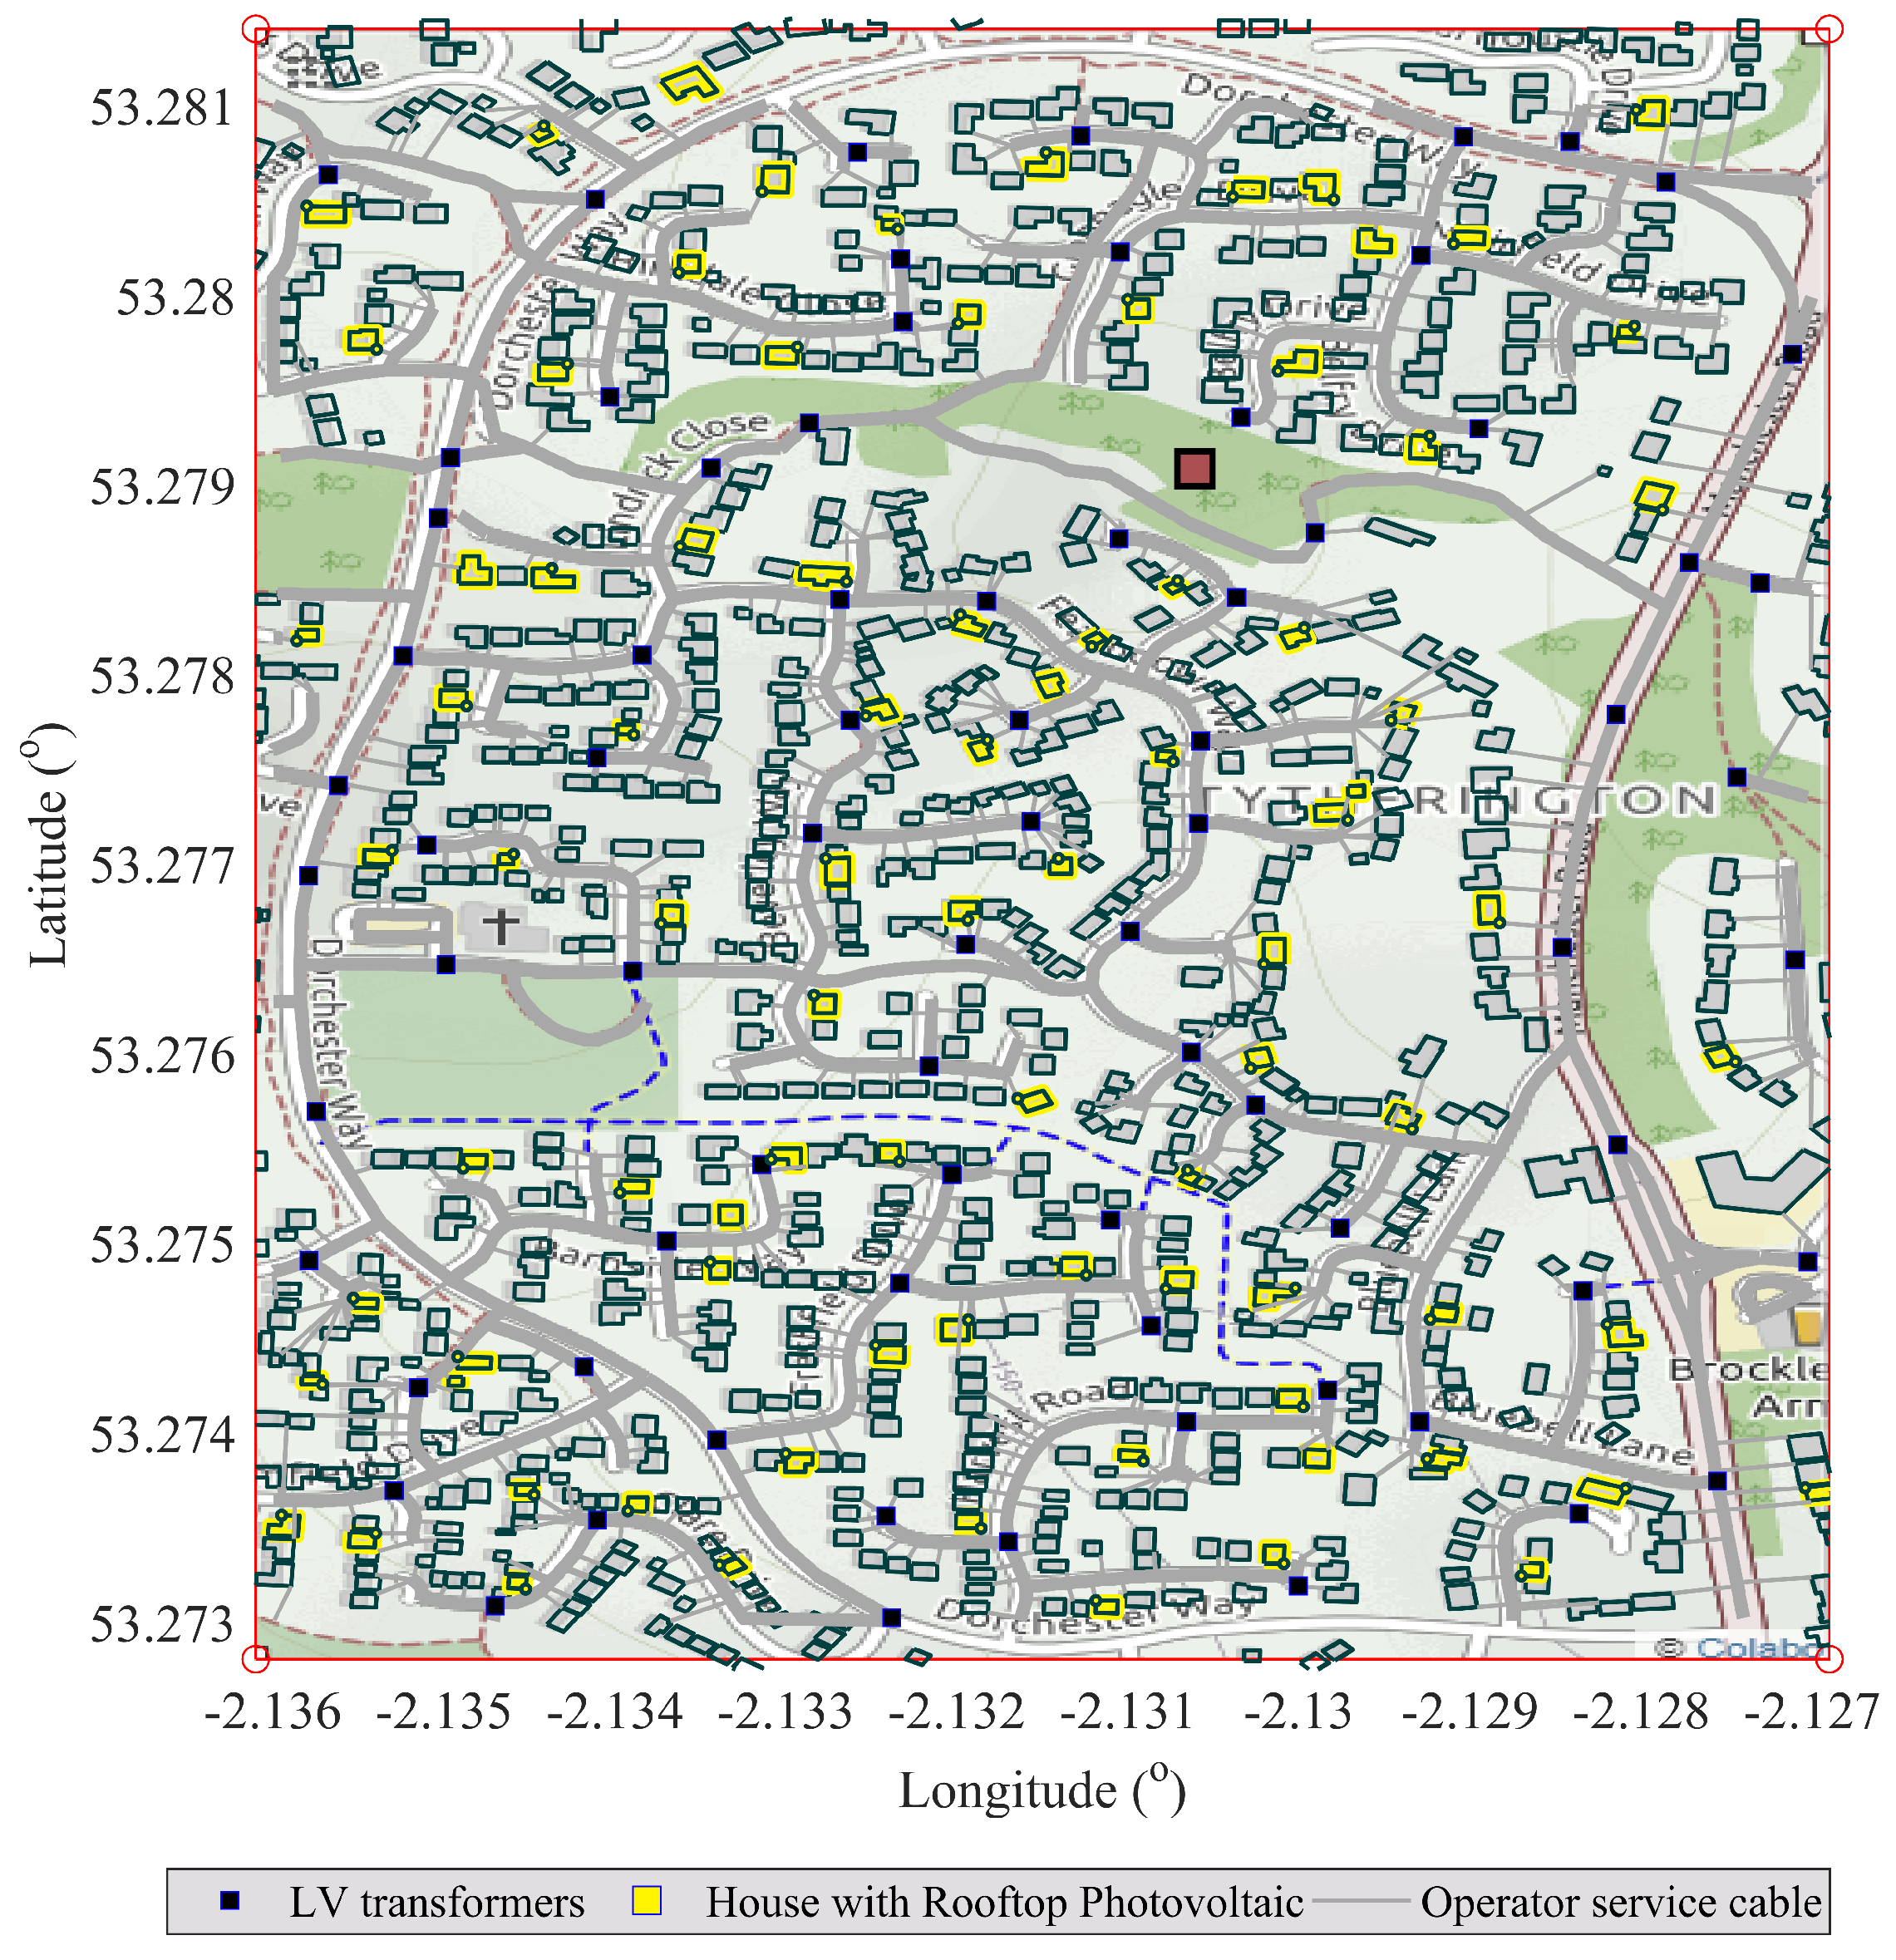
The result implementation of Algorithm 3 is shown in the Figure 8, the allocation of rooftop PV is. All the PV panels have a power of 10 KVA. The percentage of houses with PV panels are 10% of all the scenario, in total 79 houses, with a total power of 790 KV. As a result, the rooftop PV panels contribute to 14.5% to the total power deman. Notice that the distribution of the rooftop PV are in all the maps, showing the practical allocation of the PV panels. The PV will reduce the power consumption of the power delivered from the substation in approximately 10%. The MV transformer should be bidirectional for the implementation. The design should include the protection and control of the network.
The obtained results after the application of the three layers algorithm are shown in the figures below. The Figure 9 shows power (KVA) detailed in the 76 LV network, the purple bar represents the power consumption of the LV network, while the dark green bar is the representation of the power contribution of the installed rooftop PV, and the light green bar indicates the assigned MV transformer, taking on consideration standardized transformer values. Moreover, the pink area is the average power consumption that represents a power of 71.6 KVA. Analysing the power transformers, it is seen that the highest transformer has a power of 280 KVA, whereas the lowest assigned transformer is 10 KVA. The differences of each power LV network is due to the algorithm considerations that allow to taking the terrain characteristics respecting the imposed constraints.
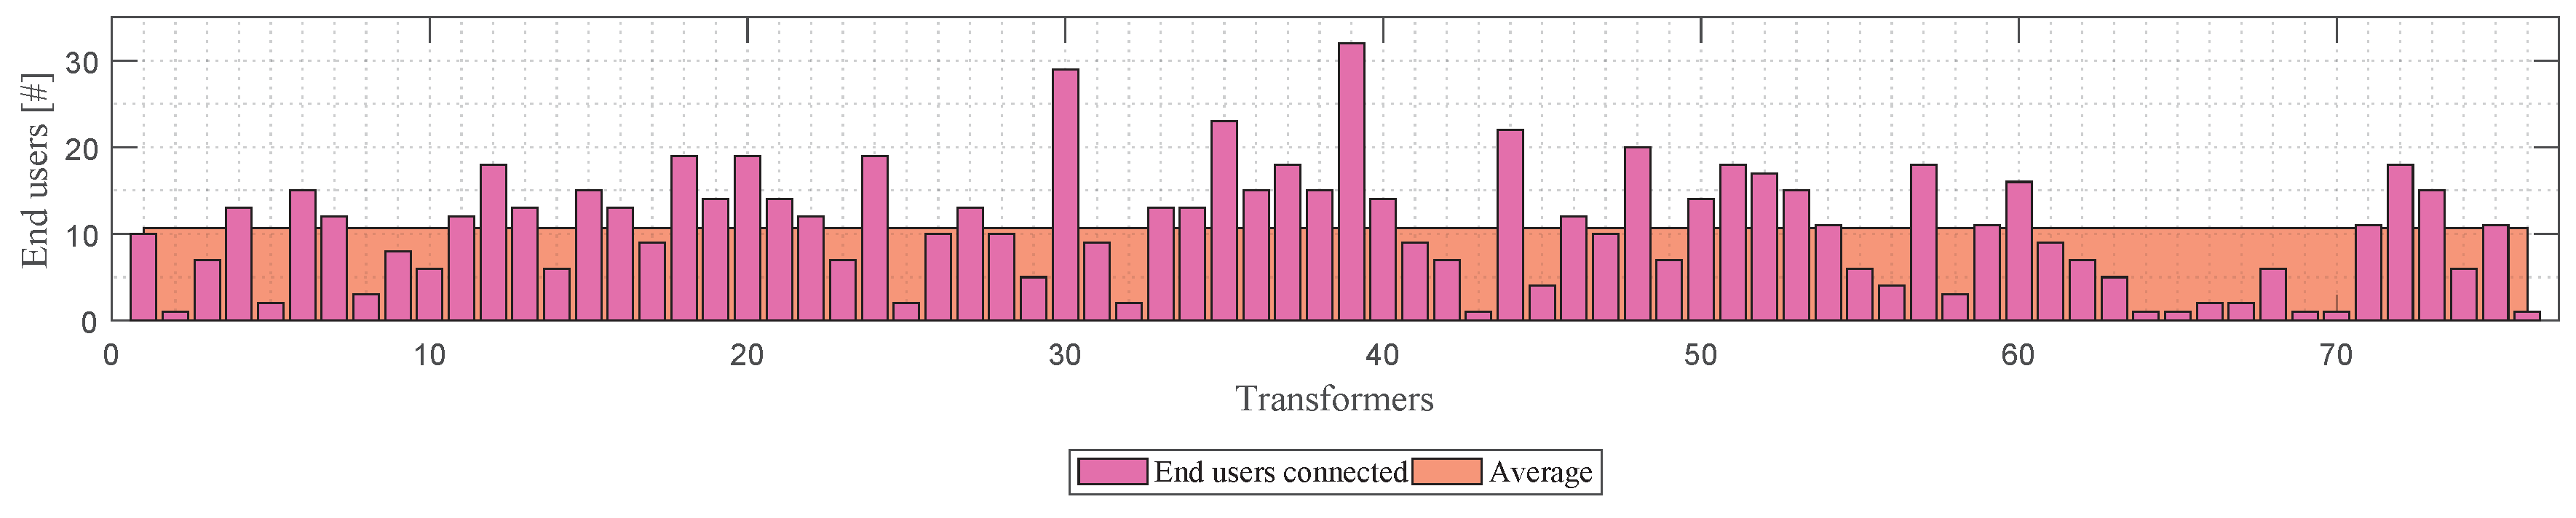
The Figure 10 shows the number of end users connected to each LV transformer, where 32 is the maximum number, and 1 is the minimum end users, the average end users connected to each transformer is 11. It can be seen that there exists a direct relationship between the power in each LV network compared with the number of connected users, and the relation between those variables is considered as linear.
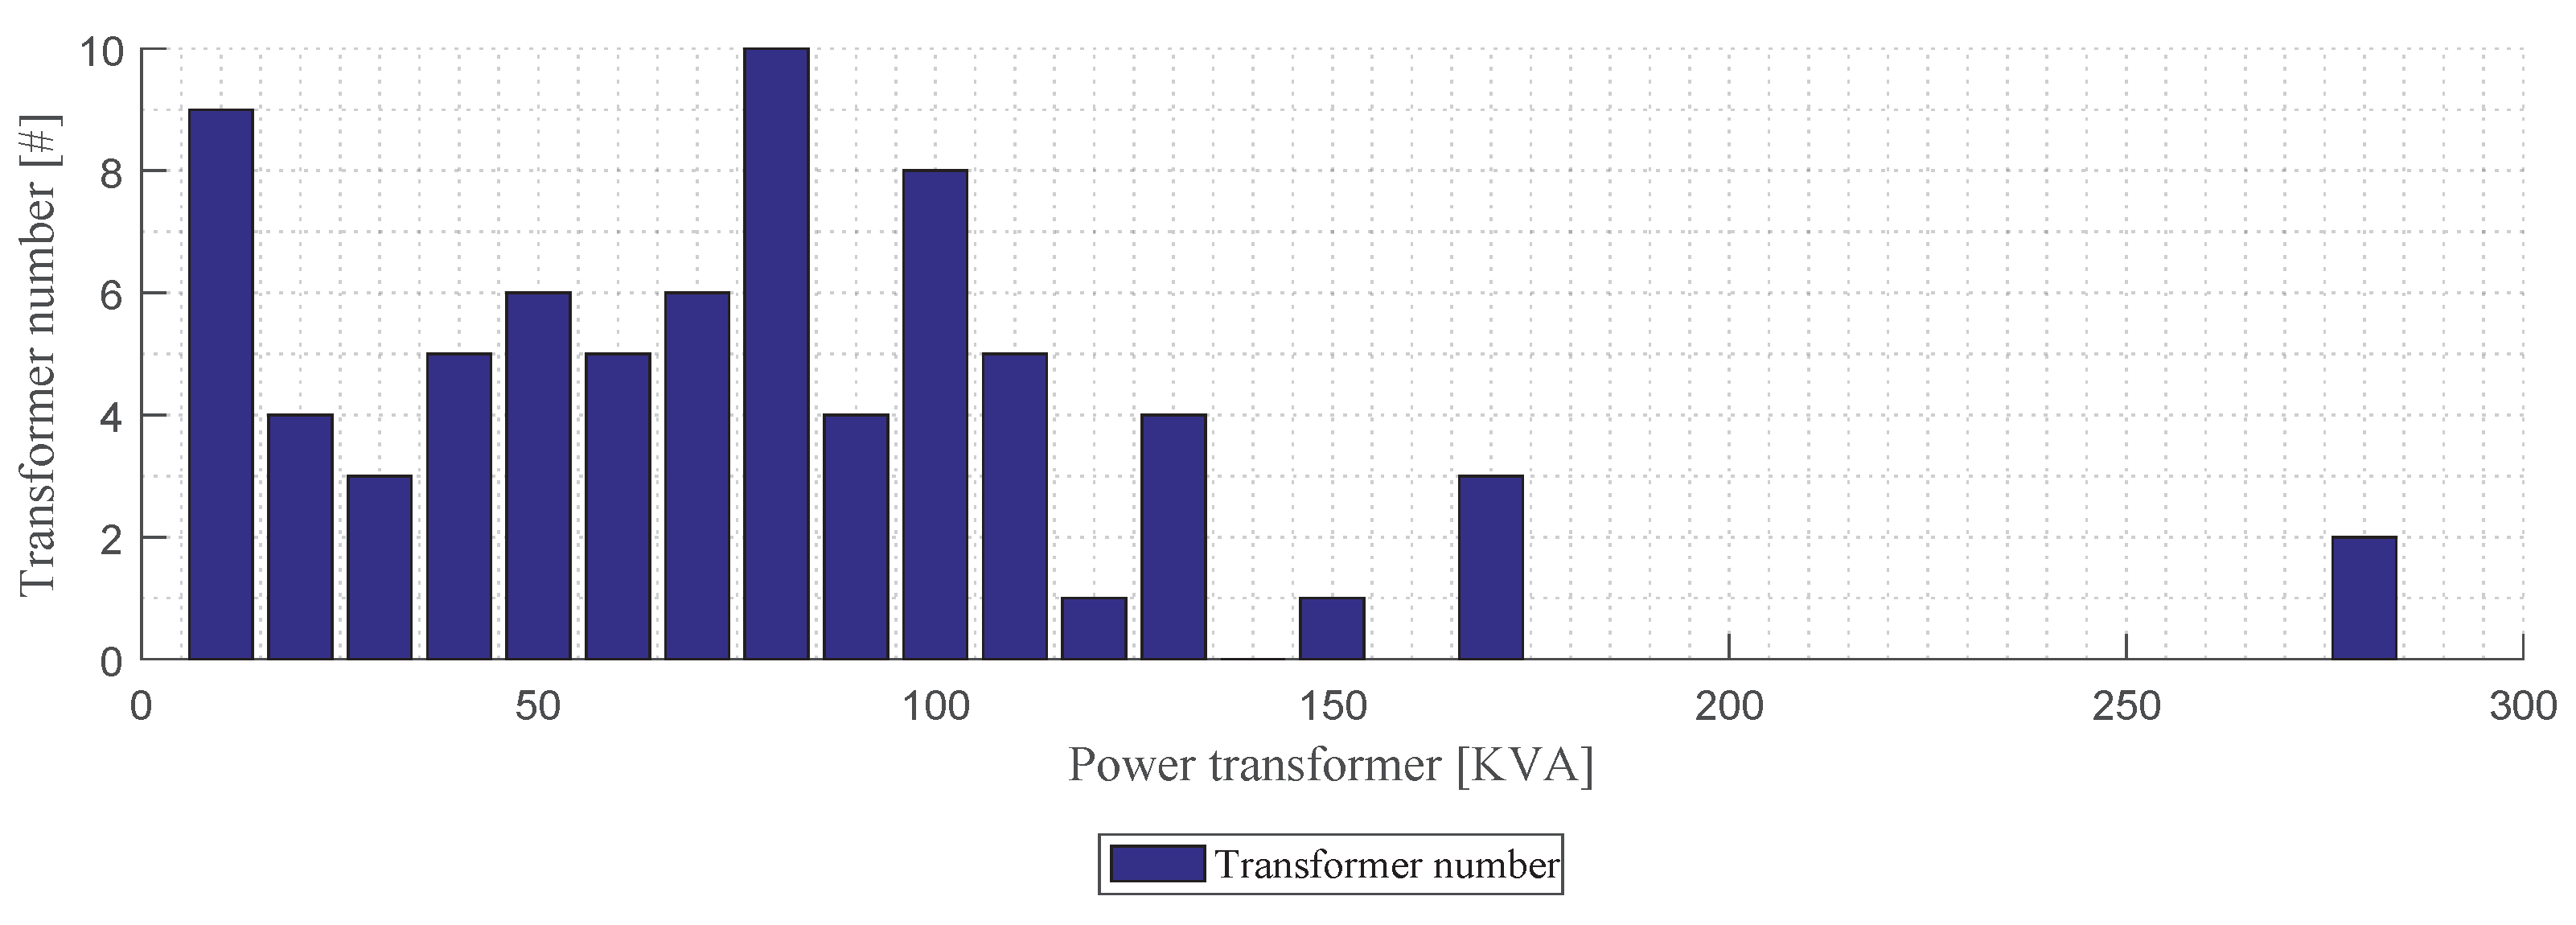
In addition, the proposed model allows planning of an MV and LV network in a georeferenced area, maintained under defined constraints and technical specifications with the minimal cost. Figure 11 presents the total number of transformer classified by the assigned electrical power. For instance, there are nine transformers of 10 KVA, four of 20 KVA, and 10 transformers with a power of 80 KVA, which is the highest amount of transformers. While the 120 KVA and 170 KVA transformers are quantitatively less than others, with one transformer, respectively. Furthermore, there are two 280 KVA transformers, which is the highest assigned power. Thus, it is demonstrated that there are areas in the scenario with high-end user density, this characteristic is a characteristic of the 30th and 39th transformers.
The distance constraint in the scenarios A and B, between end user to the corresponding transformer, are 80 and 100 respectively. The coverage is 100% and the % of drop voltage is less than 2% for both scenarios. The number of activated transformers for the scenario a is 76 with an MV grid length of 14.05 km, thus the average transformer distance to the user is 33 m. Compared with the scenario B, which has 55 transformers with a MV grid length of 12.15%, but the distance of the transformer to the end user is 40 m, higher than the case A. As a result, scenario A was selected for the sub-optimum scenario and the selected design to be implemented.
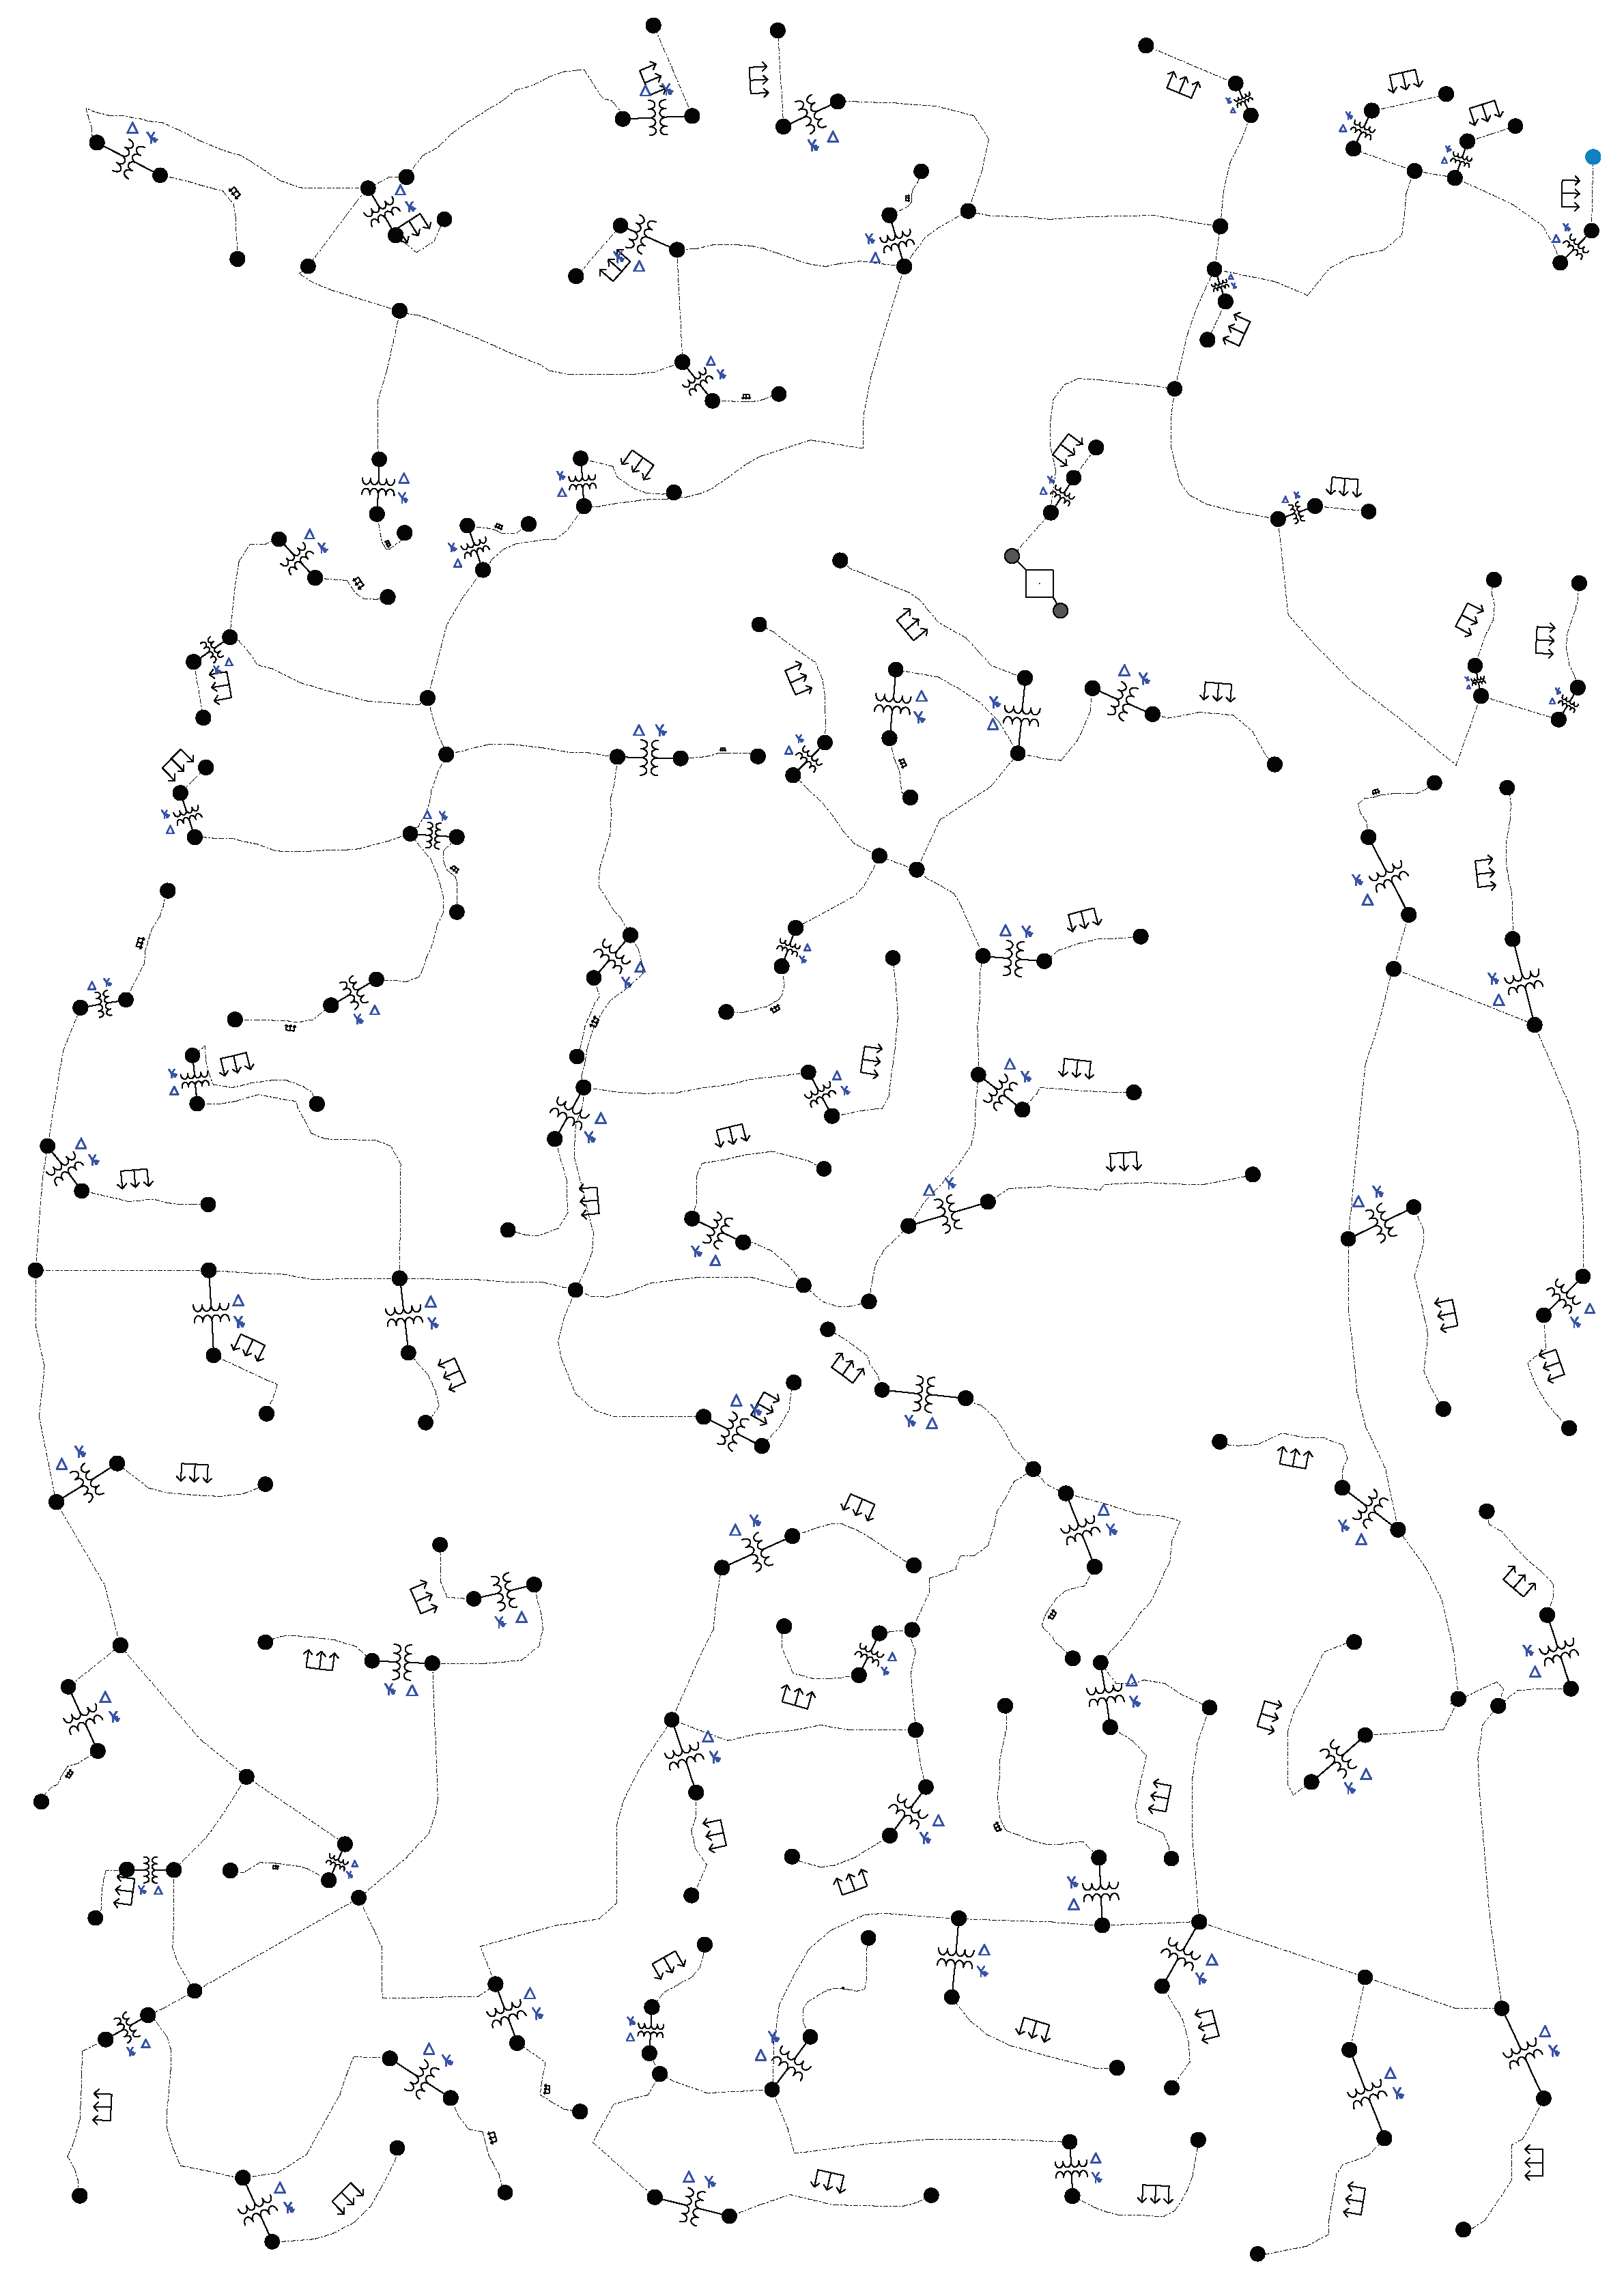
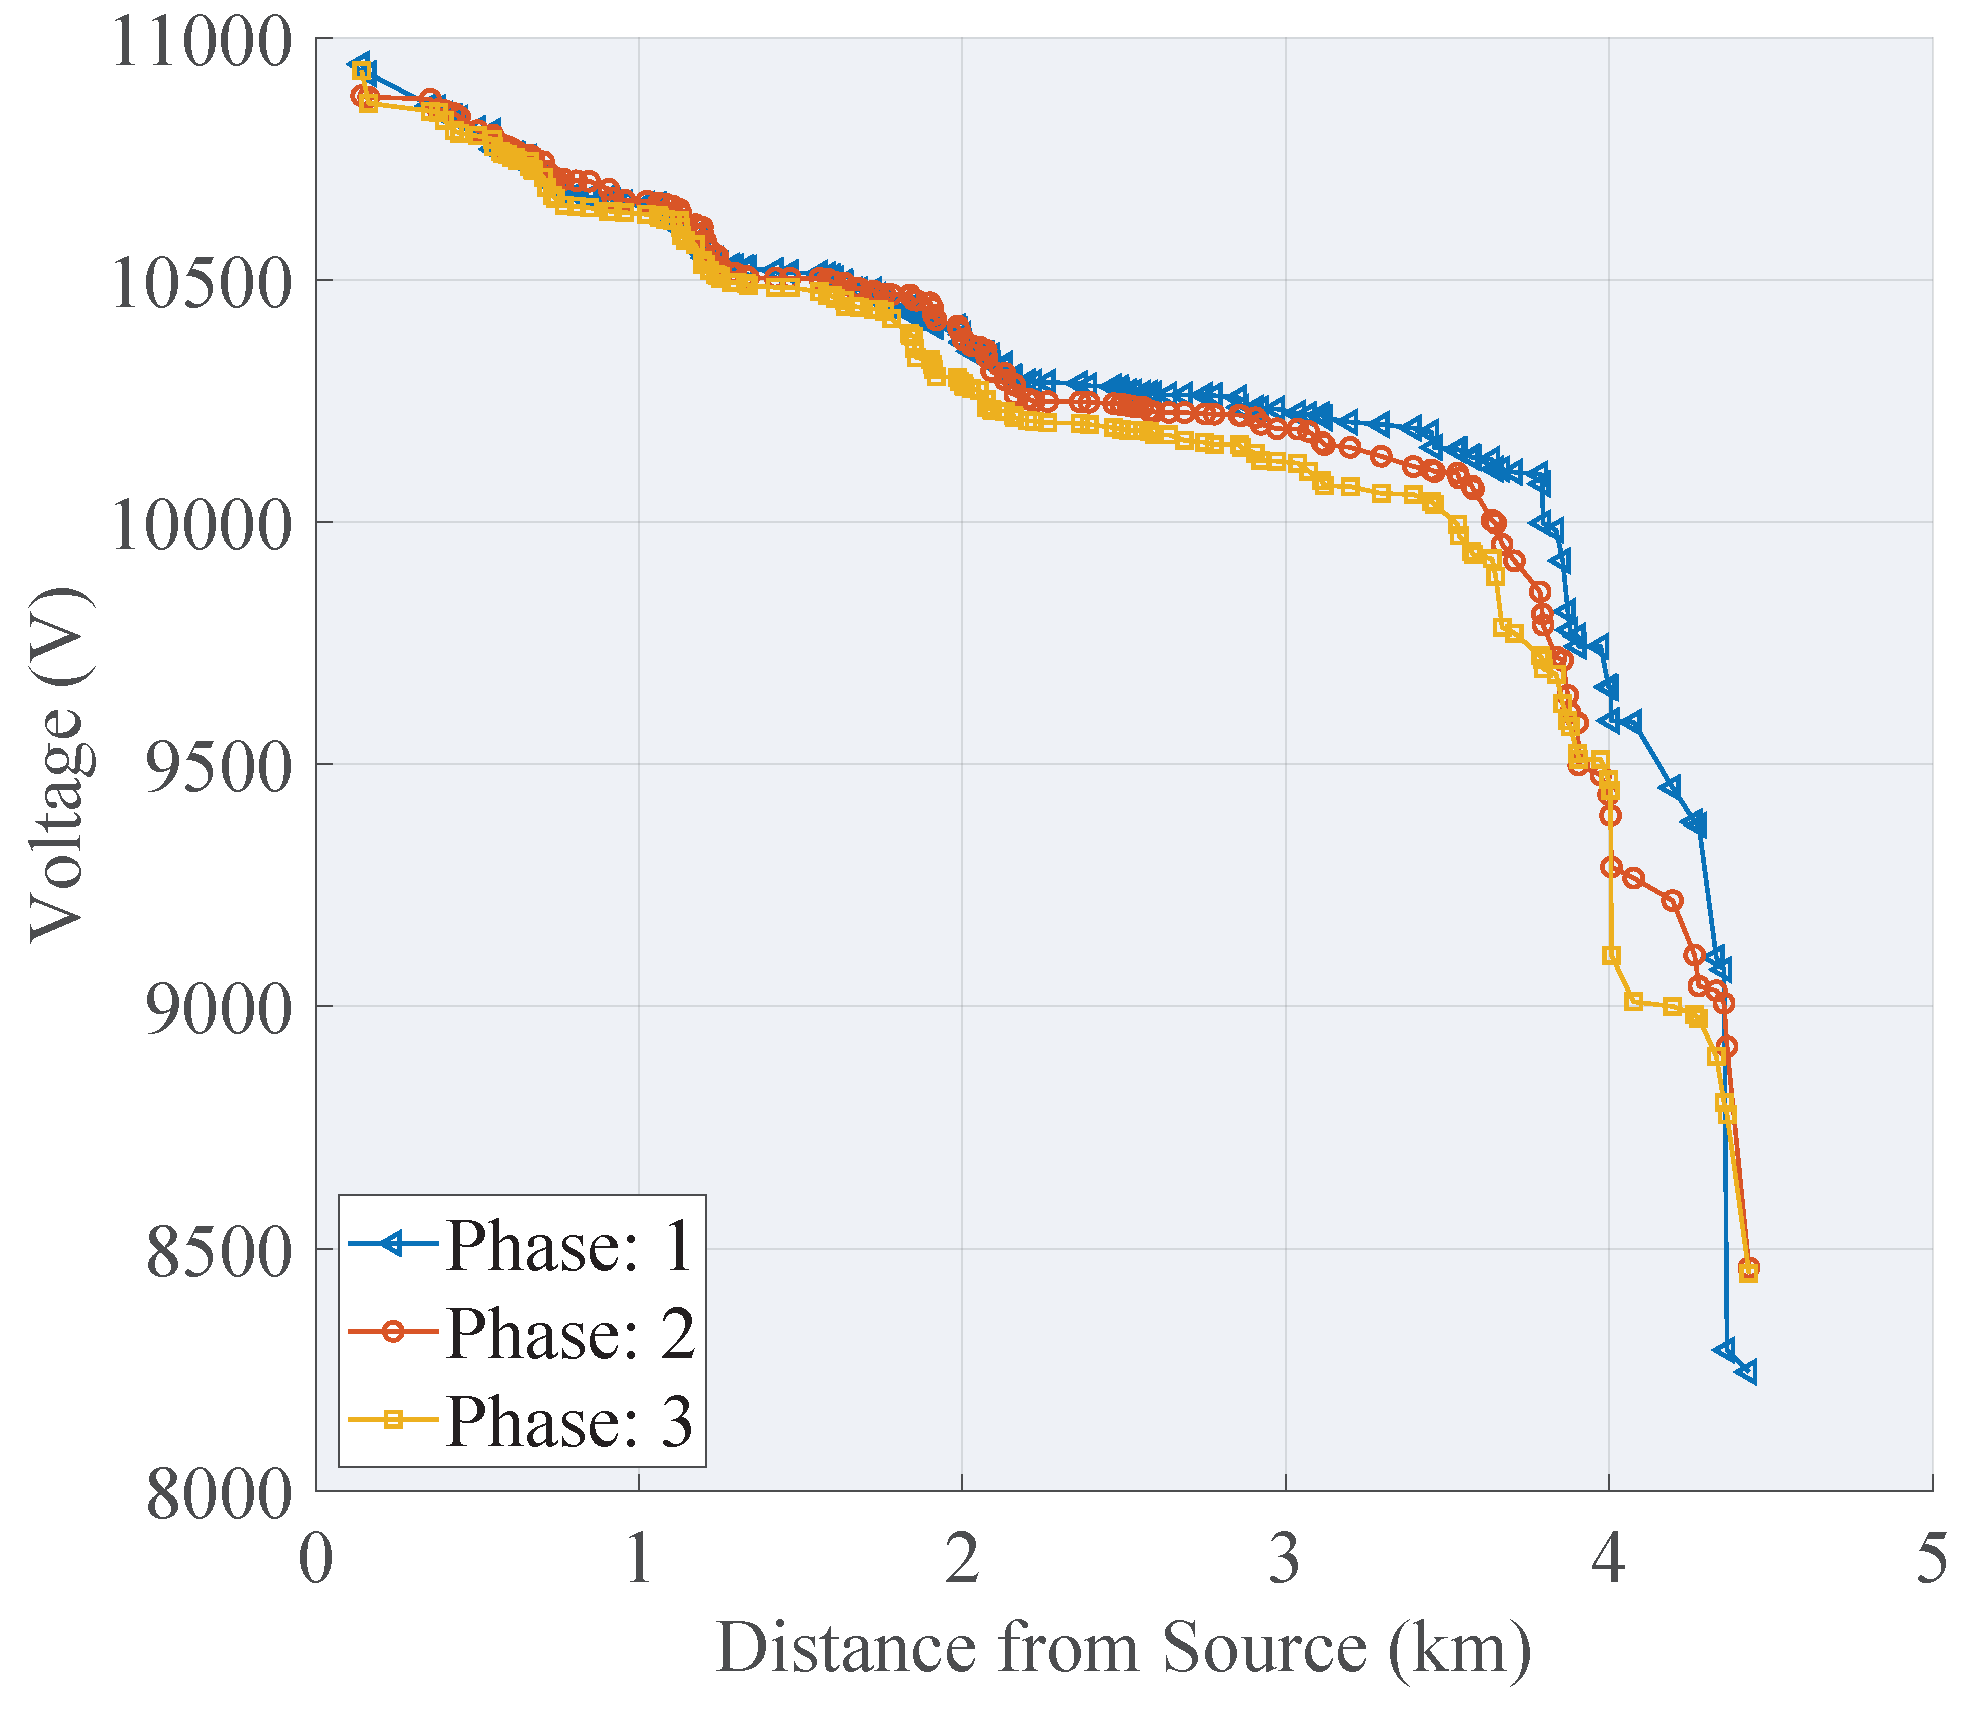
The results obtained in the scenario A were tested in electrical simulation software, the implementation is presented in the Figure 12 and Figure 13, the numeric results are summarised in Table 2. The 76 transformers are in the exact location where the algorithm determined. The simulation was development taking on account the real distance of the feeders, thus the electrical analysis is close to the real implementation. Moreover, in the Figure 12 is shown the end user voltage compared in terms of distance from the sources, where it can see that the farthest have the higher drop voltage, but they are less than the 2% compared with the source.
4. Conclusions and Future Works
This paper proposed a heuristic algorithm based model to solve the routing underground electrical networks problem in a georeferenced area. The model proposed a three layered algorithm; the first handles transformer allocation and routing of the MV network, the second algorithm works out the LV network and transformer sizing, and the third presents a method to allocate DER in an EDS. In this research, an array of rooftop photovoltaic panels with a specific criteria was allocated. The modelled networks were implemented in an electrical simulation software to demonstrate the feasibility of the proposed topology.
The proposed algorithm is capable of routing a network in a georeferenced area, taking into account the characteristics of the terrain, such as streets or intersections, including scenarios without squared streets. The modelled network achieves distance, and end user number constraints.
The suboptimal routing underground electrical networks were obtained, minimizing the implementation cost and maximizing the quality of electrical services and the reliability in the network, with a farthest node voltage drop of maximum 2%. The MV grid length was 14.05 km, with 76 activated transformers as a total number, an average of 71.6 KVA and 11 connected end users. Further, the allocated rooftop PV panels contributed 14.5% of the total demand of the network.
The optimum substation allocation, an alternative method for resilience network design in order to accommodate optional routes in case of adverse operating conditions, the application of control techniques and electrical protection in the EDS and the integration of the demand curve in the implementation of PV generation are proposed as future work.
Author Contributions
Conceptualization, methodology, software, resources, validation, formal analysis, W.P., E.I. and S.S.; investigation, writing—original draft preparation W.P.; writing—review and editing, supervision, E.I. and S.S.
Funding
This research was funded by Universidad Politécnica Salesiana-Ecuador. This work was supported by Universidad Politécnica Salesiana and GIREI—Smart Grid Research Group under the optimal model for control and operation of electrical distribution substations project—2018.
Conflicts of Interest
The authors declare no conflict of interest.
References
- Wong, J.; Baroutis, P.; Chadha, R.; Iravani, R.; Graovac, M.; Wang, X. A methodology for evaluation of permissible depth of penetration of distributed generation in urban distribution systems. In Proceedings of the IEEE Power and Energy Society 2008 General Meeting: Conversion and Delivery of Electrical Energy in the 21st Century, PES, Pittsburgh, PA, USA, 20–24 July 2008; pp. 1–8. [Google Scholar] [CrossRef]
- Vallejos, W.D.P. Standalone photovoltaic system, using a single stage boost DC/AC power inverter controlled by a double loop control. In Proceedings of the 2017 IEEE PES Innovative Smart Grid Technologies Conference—Latin America (ISGT Latin America), Quito, Ecuador, 20–22 September 2017; pp. 1–6. [Google Scholar] [CrossRef]
- Editor, R.B. Handbook of Distributed Generation Electric Power Technologies, Economics and Environmental Impacts; Springer International Publishing: Cham, Switzerland, 2017; p. 819. [Google Scholar]
- Zubo, R.H.; Mokryani, G.; Rajamani, H.S.; Aghaei, J.; Niknam, T.; Pillai, P. Operation and Planning of Distribution Networks with Integration of Renewable Distributed Generators Considering Uncertainties: A Review. 2017. Available online: https://doi.org/10.1016/j.rser.2016.10.036 (accessed on 14 March 2019).
- Martinez-Pabon, M.; Eveleigh, T.; Tanju, B. Smart Meter Data Analytics for Optimal Customer Selection in Demand Response Programs. Energy Procedia 2017, 107, 49–59. [Google Scholar] [CrossRef]
- Inga, E.; Céspedes, S.; Hincapié, R.; Cárdenas, A. Scalable Route Map for Advanced Metering Infrastructure Based on Optimal Routing of Wireless Heterogeneous Networks. IEEE Wirel. Commun. 2017, 24, 1–8. [Google Scholar] [CrossRef]
- Peralta, A.; Inga, E.; Hincapié, R. FiWi Network Planning for Smart Metering Based on Multistage Stochastic Programming. IEEE Latin Am. Trans. 2015, 13, 3838–3843. [Google Scholar] [CrossRef]
- Ge, S.; Wang, S.; Lu, Z.; Liu, H. Substation planning method in an active distribution network under low-carbon economy. J. Modern Power Syst. Clean Energy 2015, 3, 468. [Google Scholar] [CrossRef]
- Williams, J.H.; DeBenedictis, A.; Ghanadan, R.; Mahone, A.; Moore, J.; Morrow, W.R.; Price, S.; Torn, M.S. The Technology Path to Deep Greenhouse Gas Emissions Cuts by 2050: The Pivotal Role of Electricity. Science 2011, 335, 53–59. [Google Scholar] [CrossRef] [PubMed]
- Temraz, H.K.; Quintana, V.H. Distribution system expansion planning models: An overview. Electr. Power Syst. Res. 1993, 26, 61–70. [Google Scholar] [CrossRef]
- Inga-Ortega, E.; Peralta-Sevilla, A.; Hincapie, R.C.; Amaya, F.; Monroy, I.T. Optimal dimensioning of FiWi networks over advanced metering infrastructure for the smart grid. In Proceedings of the 2015 IEEE PES Innovative Smart Grid Technologies Latin America (ISGT LATAM), Montevideo, Uruguay, 5–7 October 2015; pp. 30–35. [Google Scholar] [CrossRef]
- Bader, D.A.; Cong, G. Fast shared-memory algorithms for computing the minimum spanning forest of sparse graphs. J. Parallel Distrib. Comput. 2006, 66, 1366–1378. [Google Scholar] [CrossRef]
- Lavorato, M.; Franco, J.F.; Rider, M.J.; Romero, R. Imposing Radiality Constraints in Distribution System Optimization Problems. IEEE Trans. Power Syst. 2012, 27, 172–180. [Google Scholar] [CrossRef]
- Ahmadi, H.; Martí, J.R. Distribution System Optimization Based on a Linear Power-Flow Formulation. IEEE Trans. Power Deliv. 2015, 30, 25–33. [Google Scholar] [CrossRef]
- Carcamo-Gallardo, A.; Garcia-Santander, L.; Pezoa, J.E. Greedy Reconfiguration Algorithms for Medium-Voltage Distribution Networks. IEEE Trans. Power Deliv. 2009, 24, 328–337. [Google Scholar] [CrossRef]
- Peralta, A.; Inga, E.; Hincapié, R. Optimal Scalability of FiWi Networks Based on Multistage Stochastic Programming and Policies. J. Opt. Commun. Netw. 2017, 9, 1172. [Google Scholar] [CrossRef]
- Han, X.; Liu, J.; Liu, D.; Liao, Q.; Hu, J.; Yang, Y. Distribution network planning study with distributed generation based on Steiner tree model. In Proceedings of the 2014 IEEE PES Asia-Pacific Power and Energy Engineering Conference (APPEEC), Hong Kong, China, 7–10 December 2014; Volume 1, pp. 1–5. [Google Scholar] [CrossRef]
- Oertel, D.; Ravi, R. Complexity of transmission network expansion planning NP-hardness of connected networks and MINLP evaluation. Energy Syst. 2014, 5, 179–207. [Google Scholar] [CrossRef]
- Li, H.; Mao, W.; Zhang, A.; Li, C. An improved distribution network reconfiguration method based on minimum spanning tree algorithm and heuristic rules. Int. J. Electr. Power Energy Syst. 2016, 82, 466–473. [Google Scholar] [CrossRef]
- Gouin, V.; Alvarez-Hérault, M.C.; Raison, B. Innovative planning method for the construction of electrical distribution network master plans. Sustain. Energy Grids Netw. 2017, 10, 84–91. [Google Scholar] [CrossRef]
- De Oliveira, E.J.; Rosseti, G.J.; de Oliveira, L.W.; Gomes, F.V.; Peres, W. New algorithm for reconfiguration and operating procedures in electric distribution systems. Int. J. Electr. Power Energy Syst. 2014, 57, 129–134. [Google Scholar] [CrossRef]
- Abeysinghe, S.; Wu, J.; Sooriyabandara, M.; Abeysekera, M.; Xu, T.; Wang, C. Topological properties of medium voltage electricity distribution networks. Appl. Energy 2018, 210, 1101–1112. [Google Scholar] [CrossRef]
- Crainic, T.G.; Li, Y.; Toulouse, M. A first multilevel cooperative algorithm for capacitated multicommodity network design. Comput. Oper. Res. 2006, 33, 2602–2622. [Google Scholar] [CrossRef]
- Mendoza, J.E.; López, M.E.; Peña, H.E.; Labra, D.A. Low voltage distribution optimization: Site, quantity and size of distribution transformers. Electr. Power Syst. Res. 2012, 91, 52–60. [Google Scholar] [CrossRef]
- Chicco, G.; Mazza, A. Heuristic optimization of electrical energy systems: Refined metrics to compare the solutions. Sustain. Energy Grids Netw. 2019, 17, 100197. [Google Scholar] [CrossRef]
- Javaid, N.; Qureshi, T.N.; Khan, A.H.; Iqbal, A.; Akhtar, E.; Ishfaq, M. EDDEEC: Enhanced developed distributed energy-efficient clustering for heterogeneouswireless sensor networks. Procedia Comput. Sci. 2013, 19, 914–919. [Google Scholar] [CrossRef]
- Alhamwi, A.; Medjroubi, W.; Vogt, T.; Agert, C. GIS-based urban energy systems models and tools: Introducing a model for the optimisation of flexibilisation technologies in urban areas. Appl. Energy 2017, 191, 1–9. [Google Scholar] [CrossRef]
- Tang, Y.; Mao, X.; Ayyanar, R. Distribution system modeling using CYMDIST for study of high penetration of distributed solar photovoltaics. In Proceedings of the 2012 North American Power Symposium (NAPS), Champaign, IL, USA, 9–11 September 2012; pp. 1–6. [Google Scholar] [CrossRef]
- Freitas, S.; Santos, T.; Brito, M.C. Impact of large scale PV deployment in the sizing of urban distribution transformers. Renew. Energy 2018, 119, 767–776. [Google Scholar] [CrossRef]
- Aghaei, J.; Muttaqi, K.M.; Azizivahed, A.; Gitizadeh, M. Distribution expansion planning considering reliability and security of energy using modified PSO (Particle Swarm Optimization) algorithm. Energy 2014, 65, 398–411. [Google Scholar] [CrossRef]
- Davidescu, G.; Stützle, T.; Vyatkin, V. Network planning in smart grids via a local search heuristic for spanning forest problems. In Proceedings of the 2017 IEEE 26th International Symposium on Industrial Electronics (ISIE), Edinburgh, UK, 19–21 June 2017; pp. 1212–1218. [Google Scholar] [CrossRef]
- Kruskal, J.B. On the Shortest Spanning Subtree of a Graph and the Traveling Salesman Problem. Proc. Am. Math. Soc. 1956, 7, 48–50. [Google Scholar] [CrossRef]
- Prim, R.C. Shortest Connection Networks And Some Generalizations. Bell Syst. Tech. J. 1957, 36, 1389–1401. [Google Scholar] [CrossRef]
- Lezama, F.; Soares, J.; Vale, Z.; Rueda, J.; Rivera, S.; Elrich, I. 2017 IEEE competition on modern heuristic optimizers for smart grid operation: Testbeds and results. Swarm Evolut. Comput. 2019, 44, 420–427. [Google Scholar] [CrossRef]
Figure 1.
Percentage of CO reduction contribution of Distribute Energy Resources (DER) implemented in a Electric Distribution Systems (EDS) [9].
Figure 1.
Percentage of CO reduction contribution of Distribute Energy Resources (DER) implemented in a Electric Distribution Systems (EDS) [9].

Figure 2.
The flowchart of the ordinal interaction of the three algorithms proposed for the authors.
Figure 2.
The flowchart of the ordinal interaction of the three algorithms proposed for the authors.

Figure 3.
Studied scenario with the transformer candidate cites and substation localization. The end user power consumption is represent with different colors depending on the cluster.
Figure 3.
Studied scenario with the transformer candidate cites and substation localization. The end user power consumption is represent with different colors depending on the cluster.

Figure 4.
Distance and connectivity matrix of scenario A.

Figure 5.
Sub optimal Routing of medium voltage (MV) Network, scenario A.

Figure 6.
Sub optimal Routing of the MV Network, scenario B.

Figure 7.
Suboptimal low voltage (LV) Network Routing. Transformer correspondence with end users.

Figure 8.
Photovoltaic (PV) rooftop on Distributed generation, considering the 10% of end users.

Figure 9.
Obtained model results, power consumption and end users for each MV transformer. Cite: Author.
Figure 9.
Obtained model results, power consumption and end users for each MV transformer. Cite: Author.

Figure 10.
Obtained model results, power consumption and end users for each MV transformer.

Figure 11.
Amount of transformer depending on the electrical power assigned, considering standardised quantities.
Figure 11.
Amount of transformer depending on the electrical power assigned, considering standardised quantities.

Figure 12.
The implemented MV network applied in electrical simulation software.

Figure 13.
End user voltage (V) compared in terms of Distance from the source (m).


Table 1.
Parameters and variables.
| Nomenclature | Description |
|---|---|
| X | Latitude element coordinate point or points |
| Y | Longitude element coordinate point or points |
| ij | Point to point search variables |
| Residential customer location | |
| Street nearest point to any customer | |
| Substation location | |
| Streets intersection or candidate sites location | |
| MV to LV transformer final location | |
| Member Points of L street | |
| SH | End user location |
| Ind | Optimal transformer index |
| N | Number of residential customers |
| M | Number of LV transformers |
| S | Number of substations |
| P | Total Number of subscribers N+M+S |
| Individual customer demand | |
| Individual LV transformer demand | |
| G | PxP connectivity matrix |
| dist | PxP distance matrix |
| Distance from N customer to corresponding transformer | |
| Cap | Number capacity constraint for all LV transformer |
| R | Distance constraint (m) for all LV connections |
| Path | Network connectivity route |
| Pred | Association end-user transformer |
| PVs | PV amount in the network |
| PVC | PV rooftop location |
| PVP | PV power assignation |
| C | Total customer connectivity in percentage |
| CostMV | Total distance (m) cost of designed LV network |
| Distance (m) cost of M tranformer | |
| CostLV | Total distance (m) cost of desgined low voltage network |
| Computational cost (seg) for each experiment | |
| i,j,k | Counter variables for control loops |
| flag,used,z | Temporal variables |
| Loc1, Loc2 | Temporal variables |
Table 2.
Parameter of Model Simulation Model.
| Item | Parameter | Value |
|---|---|---|
| Density | 700 per square kilometer | |
| End user information | Amount in study | 813 in all study |
| Location | Georeference | |
| Deployment | Max transformer distance | 100 m |
| MV Network transformer coverage | 100% | |
| LV Network end users coverage | 100% | |
| Installation type | Undergrounded | |
| Network configuration | Radial | |
| MV network parameters | Number of primary feeders number | 1 |
| Voltage level | 11 KV | |
| Total power demand | 5.4 MVA | |
| Installation type | Undergrounded | |
| LV network parameters | Network configuration | Radial |
| Voltage level | 400 V | |
| Concentrated load | balanced |
Table 3.
Implemented Results.
| Specification | Scenario A | Scenario B |
|---|---|---|
| Max distance model constraint [m] | 80 | 100 |
| MV and LV Coverage [%] | 100 | 100 |
| Distribution transformers [number] | 76 | 55 |
| MV grid length [Km] | 14.05 | 12.15 |
| Voltage drop in [%] | Max. 2% | Max. 2% |
| LV Transformer to end user average distance [m] | 33m | 40m |
© 2019 by the authors. Licensee MDPI, Basel, Switzerland. This article is an open access article distributed under the terms and conditions of the Creative Commons Attribution (CC BY) license (http://creativecommons.org/licenses/by/4.0/).
Share and Cite
MDPI and ACS Style
Pavón, W.; Inga, E.; Simani, S. Optimal Routing an Ungrounded Electrical Distribution System Based on Heuristic Method with Micro Grids Integration. Sustainability 2019, 11, 1607. https://doi.org/10.3390/su11061607
AMA Style
Pavón W, Inga E, Simani S. Optimal Routing an Ungrounded Electrical Distribution System Based on Heuristic Method with Micro Grids Integration. Sustainability. 2019; 11(6):1607. https://doi.org/10.3390/su11061607
Chicago/Turabian StylePavón, Wilson, Esteban Inga, and Silvio Simani. 2019. "Optimal Routing an Ungrounded Electrical Distribution System Based on Heuristic Method with Micro Grids Integration" Sustainability 11, no. 6: 1607. https://doi.org/10.3390/su11061607
Note that from the first issue of 2016, this journal uses article numbers instead of page numbers. See further details here.