Exploring the Role of Service Delivery in Remarkable Tourism Experiences
by
 , and
, and
Dalilis Escobar Rivera
1,* ,
,
Marti Casadesús Fa
1,
Paulo Alexandre Costa Araújo Sampaio
2 and
Alexandra Simon Villar
3 1
Department of Business Management and Product Design, University of Girona, 17071 Girona, Spain
2
ALGORITMI Research Centre, Department of Production and Systems, University of Minho, 4710-057 Braga, Portugal
3
Business Department, Autonomous University of Barcelona, 08035 Barcelona, Spain
*
Author to whom correspondence should be addressed.
Sustainability 2019, 11(5), 1382; https://doi.org/10.3390/su11051382
Submission received: 22 January 2019
/
Revised: 20 February 2019
/
Accepted: 1 March 2019
/
Published: 6 March 2019
(This article belongs to the Special Issue Service Quality in Leisure and Tourism)
Abstract
:The purpose of the article is to analyze through a service-experience framework the consequences and contingency factors of Service Delivery (SD) in Remarkable Tourism Experiences (RTE) and explore to what extent these factors interact to evoke delight behaviors in customers. The proposal was validated with empirical data from 284 tourists collected through survey method on remarkable experiences in hotels and restaurants. Both an exploratory and a confirmatory analysis were developed using structural equation modeling (SEM). The result highlights to what extent SD components identified (service staff, service availability, and customer service interaction) affect RTE and aid to evoke CD in tourists with high-quality memories. The service-experience model goes beyond the frontline employees with a service-oriented perspective to better understand the emerging factors that provide happiness in customers. The organizational staff is the most important component influencing a customer’s happiness and love feelings. The empirical findings support a model and measurement scale that allows analysis of the impact of SD component statements about customer delight (CD). The study shows the antecedents and interactions among SD emergent factors in RTE, specifically regarding CD behavior. The model proposed in this study links SD components and basic emotions and has important practical implications.
1. Introduction
Service Delivery (SD) competition in today’s aggressive economy is becoming increasingly significant to the Remarkable Customer Experience (RCE) concept, especially in tourism, where services, relationships, and emotions are important ingredients [1]. Literature has focused on the explanation and practical implications of RCE components on making services seem more authentic [2]. Authenticity implies that something is genuine, and this is understudied objectively and subjectively as a customer perception [3]. Authenticity is related to customers playing the role of co-producers in their own experiences through tangible aspects of experiences as catalysts in the process, according to Alnawas et al. [4]. The RCE concept, introduced by Holbrook et al. [5], is not only cognitive but also hedonic, symbolic, and aesthetic in nature [6]. That means it becomes more difficult for service providers to differentiate themselves from others.
In this sense, it is not only about the competitiveness, but also about customers’ growing needs. In fact, studies demonstrate that even if customers are satisfied, they can leave the company looking for new experiences [7]. Despite differences related to customer-oriented services, many companies in sectors characterized by higher offer availability, such as tourism, try to know the current most effective way to win the battle. In such cases, services need to manage customer behaviors to become authentic. Thus, customer delight (CD) has been studied in different scenarios describing the positive state reached by customers having memorable experiences [8].
While satisfaction results from a process where a customer compares their expectations of performance to their perceptions of performance and finds these two within the tolerance zone, delight is considered an extreme level of satisfaction, where expectations are exceeded beyond the tolerance zone. According to Parasuraman [9], the tolerance zone establishes the difference between the desired service level and the level of service considered adequate. Both concepts share a clear similarity in the dominant role of the disconfirmation theory, which states that delight is a natural evolution from satisfaction [10]. Thus, Torres [11], whose study was founded on psychology literature, defines the difference between customer satisfaction (CS) and CD, underlining that delight is more affective, whereas satisfaction is more attitudinal. Furthermore, in comparison with satisfaction, delight has a higher impact on post-consumption behaviors, such as loyalty [10].
Customers perceive the same service in different ways depending on their previous experiences, cultural factors [12], or need’s hierarchy [13]. A customer’s delight perception of a service may even diverge from what the service provider had planned if the customer was able to participate in the co-creation of experiences [12]. According to Kranzbüehler et al. [6], consumers can evaluate their journey cognitively, affectively, and through their senses. Although recent research strongly supports the conceptualization of customer delight as a more effective response [8], this study recognizes findings from Nordhorn et al. [14], whose results reveal that consumers respond more positively in affective terms to a very good service, giving as much importance to the intangible attributes as to the tangibles attributes in the elicitation of emotional reactions.
From a service-oriented perspective, there is substantial research underlying the significant factors in excellent service delivery, based on the frontline employees [13,15]. However, from a customer-oriented perspective, there is a lack of studies analyzing the consequences and contingency factors of SD in RCE and exploring to what extent these factors interact to provide an excellent service and to evoke delight behaviors in customers. The present article proposes and tests a service-experience framework for the effects of service components on CD behavior in customers’ high-quality memories, based on tourist experiences. Thus, for the purpose of the article, RCE will be contextualized as Remarkable Tourism Experience (RTE) by way of hotel and restaurant memories.
In the first section of the present article, the literature is reviewed and the hypotheses are formulated. The proposed model and the relationships among its components are then explained. The methodology for validating the assumptions referred to in the model is described in the third section, and the fourth section includes results and implications. Finally, the article discloses the conclusions and future research.
2. Theoretical Background and Hypothesis
CS has been considered as meeting customer expectations [10]. Nevertheless, there are two major approaches in literature regarding the conceptualization of delight. The first applies the disconfirmation theory, which itself implies that delight can be achieved by surpassing desired expectations [10], and the second views delight from a physiological point of view as the combination of high pleasure and high arousal. Therefore, as Loureiro et al. [7] posit, satisfaction is defined as consumers’ evaluative judgments based on more cognitive responses than delight. According to Kim and Perdue [16] (p. 247), the cognitive attributes are "physical dimensions or non-physical qualities that satisfy utilitarian needs and provide functional benefits or value", i.e., the price. Therefore, recognized cognitive factors in CD conceptualization come from models such as SERVQUAL. Based on the literature review, the service-experience framework encourages customer delight behavior in customers’ high-quality memories through the relationship between very good service quality and emotions. In the first place, because customer experience is “a phenomenon directed toward the pursuit of fantasies, feelings, and fun” [5] (p. 132). Secondly, service quality literature notes that the consumption emotions, understudied as “the set of emotional responses elicited specifically during product usage or consumption experiences”, can produce better customer responses from a very good service.
2.1. Service Delivery’s Role in Remarkable Customer Experiences Evoking Customer Delight
In recent years, the subject of CD has attracted researchers’ attention and is the focus for much marketing research, primarily in tourism experiences [7], understood as a customer’s positive emotional response to an “unexpected” service experience [17]. There is also considerable research underlying frontline employees as the highest impacting main factors in successful SD, and thus customer delight [13,15]. In a general manner, SD describes the interaction between service providers and customers [18], wherein the customer finds an extra which goes beyond occasional RCE. There are some authors [19] analyzing to what extent the SD process can affect customers’ appreciation and quality perception of services. In comparison, there is too little research examining the antecedents and interactions between SD contingency factors and RTE, specifically regarding CD behavior.
One important statement presented in the Relational Marketing (RM) and quality studies from a customer perspective establishes the customer as a productive resource in the co-creation of value [20]. Customers are also involved in the SD process, so achieving CD states should be synonymous with delivering authentic services. For instance, Nyangau [21] studied the effects of customer SD on customer satisfaction regarding the expectation disconfirmation theory through employee commitment, customer relations, service quality, and loyalty. The authors concluded that those factors are strongly correlated and highlights what is important for the business in terms of delivering high quality services and employing employees who can supply good services to retain the customers. In this sense, Wang et al. [13] and Zhao et al. [22] underline the key role played by service staff in implementing delighting services and inducing the customer participation process. Also, others authors like Mamat et al. [23] recognize the positive influence of staff interaction, familiarity, and customer involvement on customer service experience.
Additionally, Barnes et al. [24], addressing these gaps in the literature regarding other perspectives than customer-oriented CD, affirmed that frontline employees have a positive impact in terms of perceiving CD. The study provides a set of conclusions as to the influence of an employee’s positive affect on external behaviors. The broaden-and-build approach combined in the proposed framework can be understood equally well by the staff as by customers. Therefore, statements suggest considering the following hypothesis:
H1:
The interaction between the service staff and customers will positively influence a customer delight state.
Recently, Collier et al. [25] introduced the concept of Idiosyncratic Service Experience (ISE), describing a perceived unique service experience where the service provider and customer create value in an unexpected way [24] (p. 150). Collier’s study highlights the need to go deeper into the extraordinary service leading to CD and ISE. Likewise, Barnes et al. [24] propose that CD can be elicited when guests perceive the experience as being important to their personal well-being or special needs when the service is able to adapt itself to customers. Thus, service appraisal is also about services being accessible; if services are not available then customers are not going to be happy.
According to Wang et al. [13], key drivers of CD are service attributes that contribute to a delightful experience, such as accessibility. To engage CD through SD involves a customized interaction-reaction in regard to the culture and the market segment [13,16]. To illustrate this, Torres and Kline [26] suggest that customers from the European emission market better appreciate the affective component, for instance, friendliness in hotel experiences, while customers from the United States evaluate variables related to SD more highly [13]. The interaction between service suppliers and customers could be related to unsolved complaints, and implies in such cases that the service failure is creating a bad image of the expected service ideal [27]. Furthermore, Roy et al. [28] provide useful insights examining the role of service convenience in eliciting customer engagement behaviors. Authors such as Roy et al. [28] highlight the role of service convenience, service fairness, and service quality in eliciting customers’ engagement behaviors, such as customer help services.
Thus, in order to continue the exploration of factors and to fill in the main gaps in the field regarding the essential role of extraordinary service in modifying customer responses [25] during an RCE, the factors of service availability and customer service interaction will be introduced to the analysis. Thus, the following hypotheses are proposed:
H2:
The service availability will have a positive influence on customer delight state
H3:
Customer service interaction will have a positive influence on customer delight state
The SD literature encompasses tangibles factors and some service facilities from a customer perspective. It has been suggested that these whole components can have a significant impact on customers’ appraisals [19]. However, the SD process itself in relation to CD behaviors has not been deeply studied in RTE, such as accommodation services or restaurant experiences. In fact, Kim et al. [29] extend support for the conceptualization of CD as a stronger antecedent than satisfaction in post-consumption behaviors such as loyalty, concluding that CD is significantly related to cognitive, affective, and conative loyalties. Thus, Richard et al. [30] support the idea that increasing this overall CD in customers staying in hotels is necessary to improve the experience, achieved with three service components: availability, service received (staff), and service interaction. Therefore, the following hypotheses are derived:
H4:
The service staff will have a positive influence on service availability
H5:
The service availability will have a positive influence on customer service interaction
2.2. The Link between the Service Delivery Role and Emotions Evoking Customer Delight
Summarizing some important issues in service operations, Field [31] wrote the article entitled “Service Operations: What have we learned?” The author recognizes future research topics in designed experiences and provides incentives to inspire behavior-influencers working in service provision. Furthermore, Harrington et al. [32] developed a framework to represent recent transformations of value from memories and the key future research line represented in unique service experiences. The authors support the discussion in the hospitality industry through a literature analysis and conclude that memorable experiences lead to CD, based on their understanding of the value-in-memory process. Excellent service delivery may provide customers with strong memories; evoking those memories in many different environments is a starting point. The question at this point is how to engage high-level emotional responses to deliver RTE?
Customers’ behaviors in delightful service encounters are possibly related to excellent delivery services. Zhao et al. [22] explain that the effect is mediated by customer emotions, an essential factor in delight according to Richard et al. [30]. Experiences incorporate components from rational information processing and the experiential approach, including emotions [6], which may affect the customer’s overall appraisal.
Emotions in RM and quality research have mostly been studied [33]. Following Plutchik’s statements, CD has been defined as a combination of joy and surprise. However, other recent research has focused on basic emotions to explain behaviors such as CD [32,34], and specifically on emotions such as happiness and love, as well as the needs theory for the customers’ global well-being appreciation in RCE. Other recent studies, such as Nadiri and Tanova [35], conclude that service quality factors can encourage greater positive feelings in customers. Consequently, researchers like Barnes et al. [15] have positively validated the relationship between an employee’s positive affect and SD behaviors. Therefore, the following hypotheses are proposed:
H6:
The service staff will positively influence customer’s happiness to enhance RTE
H7:
Service staff will have a positive influence on customer’s love sensation in RTE
H8:
Customer service interaction will have a positive influence on happiness in CD state.
Emotional assessment approaches have often been applied to address specific questions about the feasibility of sensual arousal, joy, or surprise [36]. Ball and Barnes [37] suggested that CD would originate from the affective drive, whereas Ma et al. [38] explore CD like an emotion related to hedonic consumption and with personal well-being.
Tourists can experience self-sufficiency and have a sense of well-being if the experience is affected by positive emotions depending on other factors. In fact, a study developed in restaurants found that customers with a high level of knowledge, self-efficacy, and motivation are more likely to participate in the co-creation experience [39]. Based on those findings, to assess CD, present research uses the exceptional value and excellent experience to measure delight. Authors would consider testing the relationship between the factors describing the supplier’s and customer’s emotion. Therefore, the following hypothesis is proposed:
H9:
Service availability will have a positive influence on customer happiness during an RTE
However, love is an emotion, and like pride, it is difficult to measure in marketing studies [34], since it can be reached through other emotions, such as happiness, and requires personal interaction. Therefore, it is more likely that staff can influence feelings of happiness and love, but other SD factors may be more linked to happiness than love. Following the recommendations of Laros and Steenkamp [34] that posit carefully testing these kind of emotions, in the hypothesis model, staff will be related to both basic emotions, and the remaining components will be related only to happiness.
2.3. Emotions Role in RCE to Evoke Customer Delight
Clearly, emotions have been one of the most studied areas in relation to market and quality fields in terms of explaining customer behaviors, as well as defining a wide set of statements and findings. Nonetheless, there are gaps regarding the content and structure of emotions [34]. Recent studies [32] suggest focusing on basic emotions to support future studies on customers’ feelings and fill these gaps [34].
The hierarchical positive affectivity model proposed by Laros and Steenkamp [34] presents four basic emotions (happiness, love, pride, and contentment) that may group together in happiness and contentment. The result includes the appraisal to measure each basic dimension according to an extensive literature review. On the other hand, Milliman et al. [18] recognize the positive effect of positive emotions. In the case of Lee [40], love, joy, and positive surprise are part of psychological well-being, while Milliman et al. [18] integrate similar variables as Laros and Steenkamp [34] in a dimension entitled emotional engagement. Therefore, the following hypothesis is proposed:
H10:
Happiness will have a positive influence on RTE bringing about a customer delight state
H11:
Love will have a positive influence on customer delight state
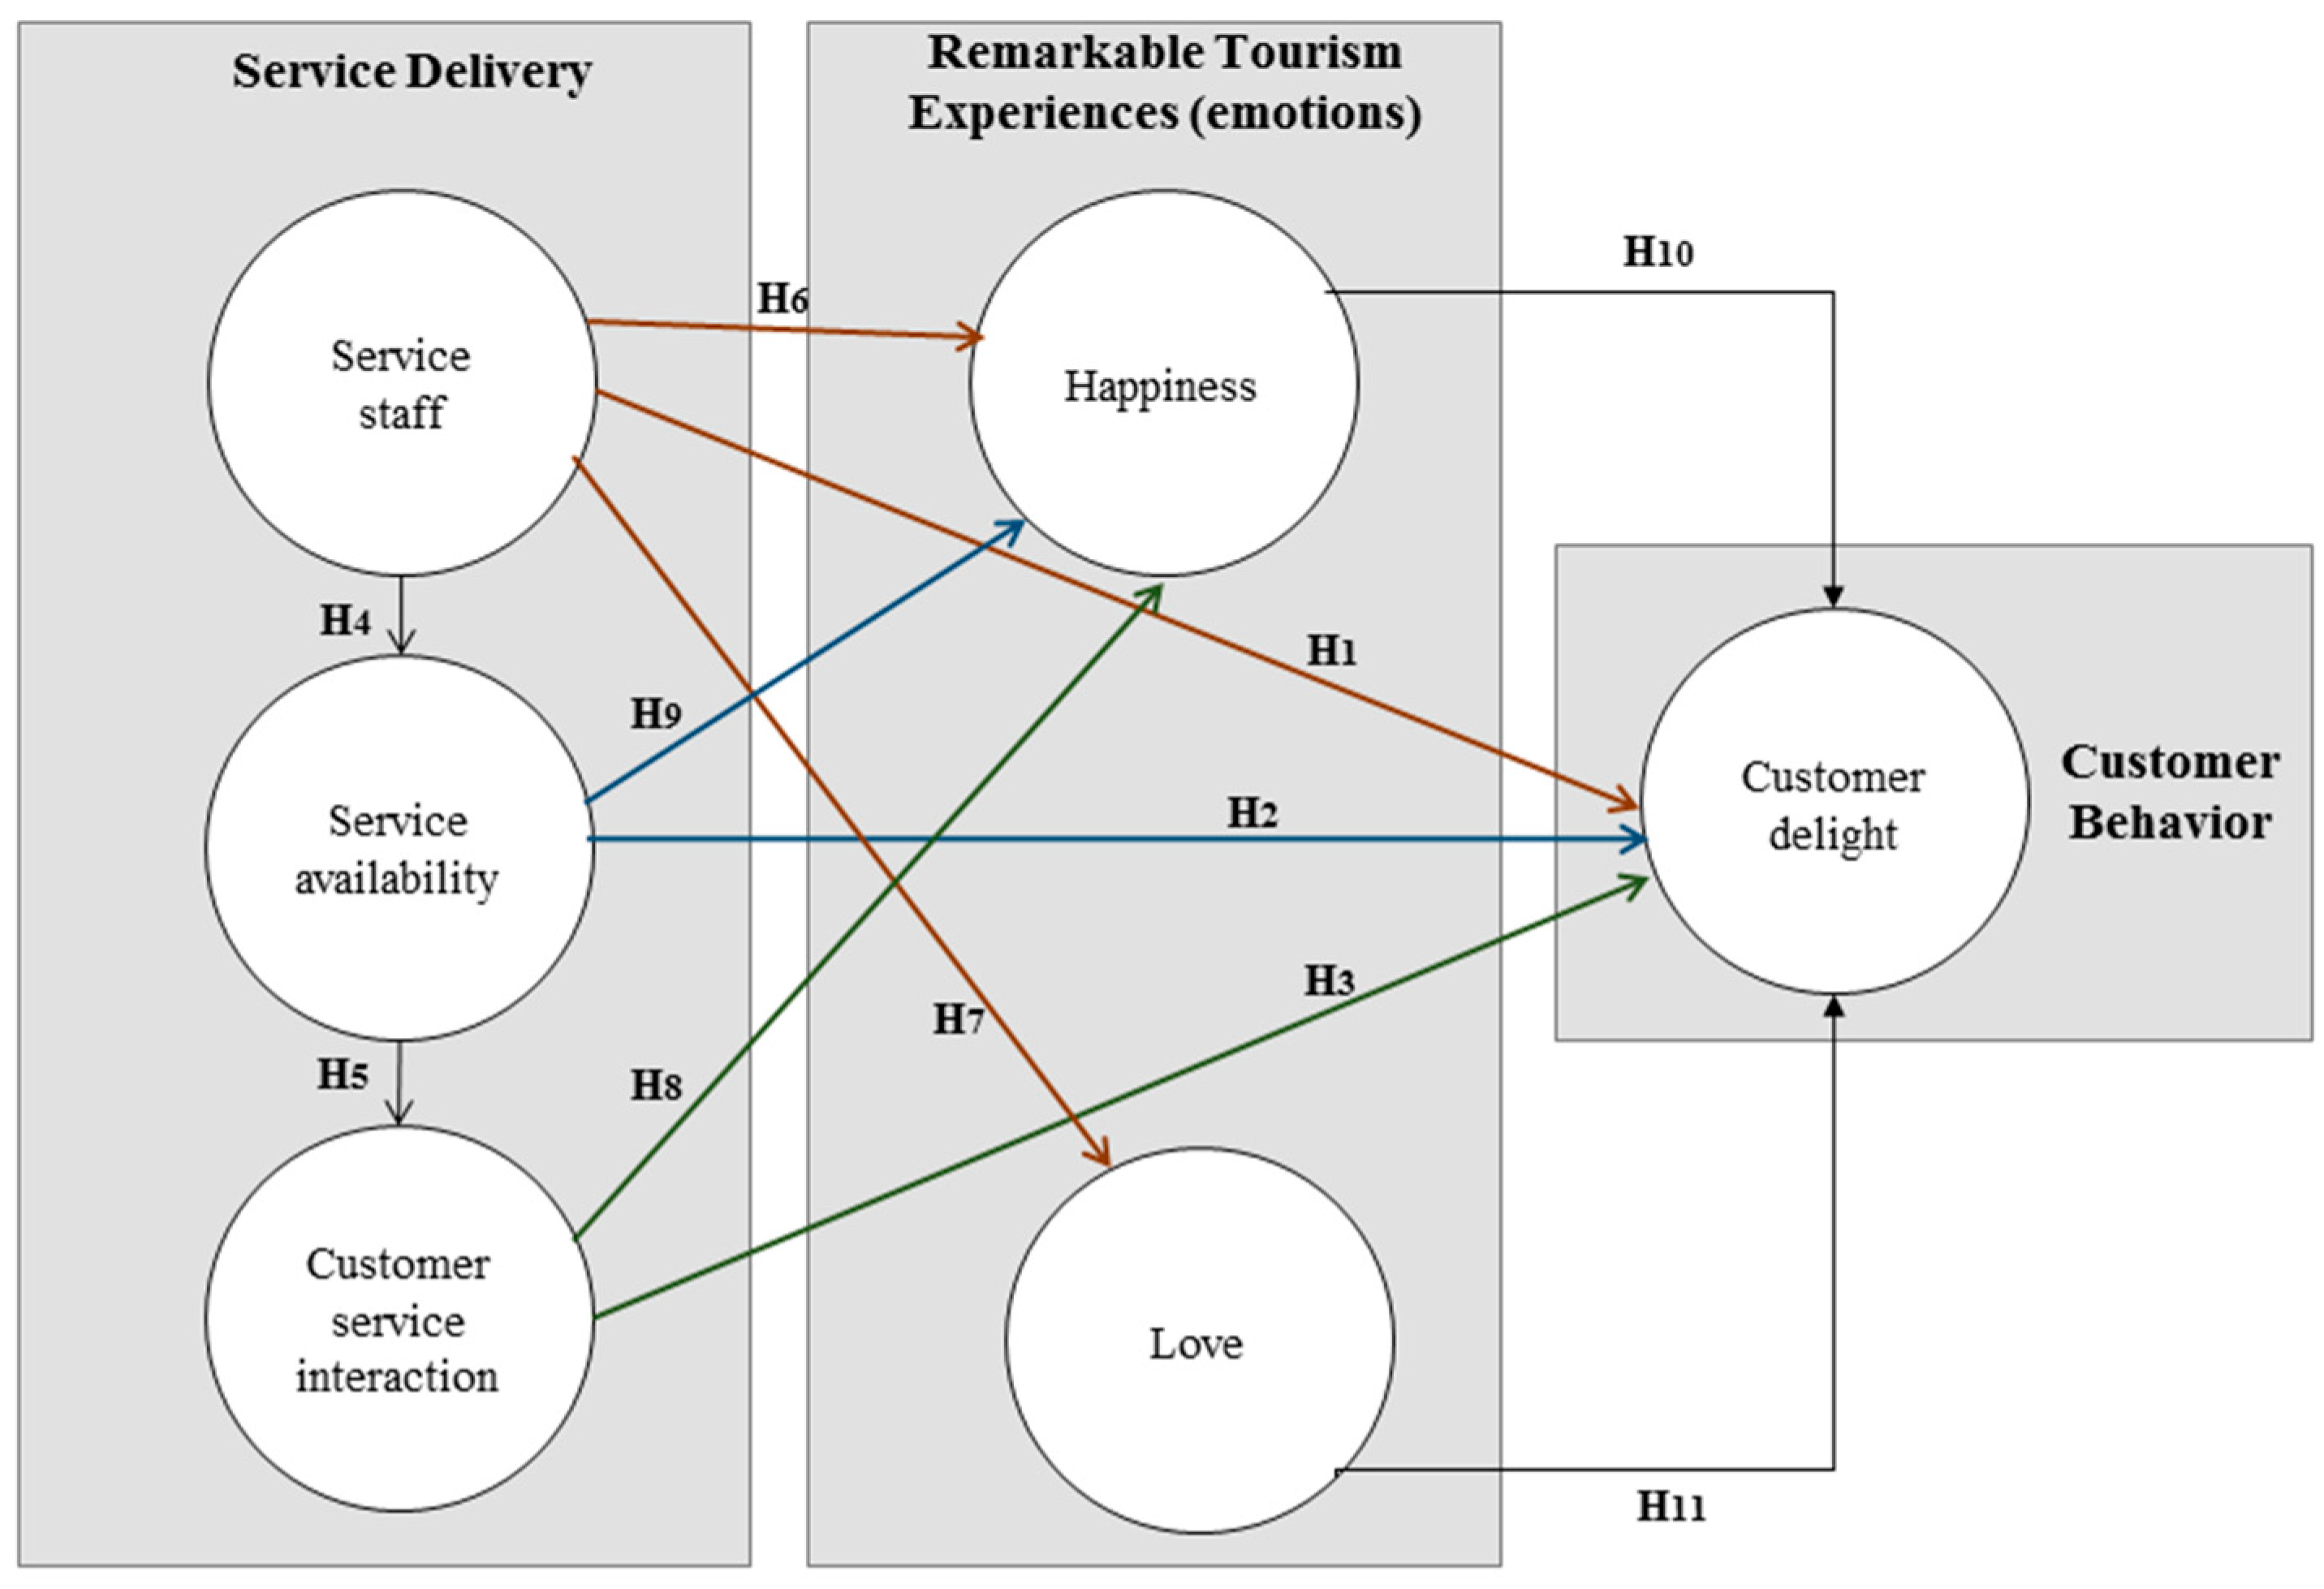
The primary goal of this research is to analyze the consequences and contingency factors of SD in RTE and their interaction in providing an excellent service, taking into account the basic emotional reaction. To achieve this goal, a grounded theoretical model was developed to describe the positive service encounter, as shown in Figure 1.
Furthermore, Table 1 summarizes and contributes to the understanding of the research design. The hypothesis has been summarized in four columns, according to the relationships of the dimensions in Figure 1.
The model describes three factors in SD (service staff, service availability, and customer service interaction) connected with emotions (happiness and love) to elicit CD. This model mostly considers the broaden-and-build theory of basic emotions [34]. These basic emotions can help to better understand customer behavior in terms of appraising tourism experiences as excellent.
3. Methodology
3.1. Sample and Method
The measurement scale was designed as a survey with 28 items, 13 of which assessed the SD component on the model by means of 3 factors, and 7 assessed the RTE component by means of 2 factors. Delight was measured directly by 5 items, including one item that described the joint assessment of the two aspects (appraisal) with three variants: (1) satisfaction, (2) extreme satisfaction, and (3) delight. There were three demographic information items.
The survey was based on an extensive review of the literature. The first component, which was used to measure SD quality, was based on Kwong and Yau [41] and Liu and Keh [42]. The second, which assessed the RTE, was an adaptation from Laros, and the third component assessed delight and was developed by the authors based on literature review. A small pilot test was undertaken to test all the items in the survey. To structure the RTE component with happiness and love as basic emotions, the authors assess the most significant emotions that best correspond to the antecedents of CD, adapting the proposal of Laros and Steenkamp [34]. This step accounted for 2 of 3 variables in the happiness factor, 1 of 2 variables in love, and surprise was included in the love component.
All items were evaluated with Likert attitude scales (1–5). The first (SD component) considered 1 as not good, 2 as acceptable, 3 as good, 4 as excellent, and 5 as extraordinary; the second (RTE component) considered 1 as nonexistent, 2 as a little, 3 as moderately, 4 as a lot, and 5 as absolutely, and for CD, from 1 as completely disagree to 5 as completely agree. Finally, the last question of the survey presents a selection of three possible options describing different customer behavior states (1, satisfaction; 2, extreme satisfaction; 3, delight). Table 2 summarizes the items on the measurement scale.
3.2. Data Collection
The data was collected through face-to-face interviews conducted at the Tourist Information Office in Girona (Spain) during August 2017 and an online survey was also employed to get the data from tourists in Portugal. The survey asked respondents to remember a remarkable experience they had during the previous 2 years in a hotel or restaurant. Once they had selected the experience, the customer had to keep this in mind while responding to the questions. The sample was comprised of 284 respondents, 33.80% of which correspond to Portugal. The demographics of the sample are shown in Table 3. The majority (79.93%) of the respondents were aged less than 50 years old and females represent 62% of the sample. The demographic analysis in Table 3 takes into account tourism experiences in hotels and restaurants according to the variables.
In total, 80.28% of respondents are from the European and American region, possibly because the data was collected during the summer-autumn season. The sample regarding the experience distribution is very similar; restaurant experience only represents 2.82% more than hotel experience.
4. Measurements
The data was analyzed in three steps: (1) assessment of the reliability and validity of the measurement scale; (2) confirmatory Factor Analysis (CFA) using Structural Equation Modelling (SEM), and (3) analysis of the indirect effect in the causal model.
Assessments of the Measurements Model and Structural Model
The exploratory analysis was developed, among other methods, through the Principal Component Analysis (PCA). SD, RTE, and customer behavior components were considered for a different PCA using the Varimax orthogonal rotation method. The three PCAs generate six factors that explain 70.90% of the total variance and the measure of sampling adequacy for Kaiser-Meyer-Olkin (KMO) of 0.939 (which was greater than the recommended value of 0.7) [43]. Bartlett’s test of sphericity was 2861.648 (df = 231) with a significance of 0.000.
Table 4 and Table 5 shows the three PCAs. Table 4 shows the values for the SD component and Table 5 for RTE and CD. Both tables include the loading value for each variable corresponding to values greater than, or equal to, 0.50, as recommended by Bernardo et al. [44]. To reduce the number of items on the scale, three main criteria were considered: (1) items loading below 0.50 in each factor, (2) inter-item correlation less than 0.30, and (3) item-dimension correlation less than 0.40, as considered by [44]. All cases were within the range of 0.30 to 0.50. During the analysis, three items were removed—one from service staff, one from service availability, and the last one from the CD factor. Finally, after the initial exploratory analysis, the measurement scale has 22 items. In the analysis the communalities values were considered in each variable. In all cases, the values were high (greater than 0.50), which means a good representation in the common factor space.
The PCA for the SD component suggests three components, which means that the three dimensions in the component space account for 58.58% of the variance. The first factor (27.74%) includes 5 items and accounts for the most variance, hence has the highest eigenvalue = 6.84, while each successive component accounts for less variance until 1.33. Table 4 shows the distribution of the items, and Table 2 shows the initial distribution before the PCA analysis.
The second and third factor in the SD component explains a similar percentage of the variance (17.91% and 12.91%). The second one emphasizes service interaction and includes three items explaining how the service responds to the customer through the service suppliers. The third factor also includes three items and explains the most practitioner aspects regarding the service; this last component intends to capture the initial picture of the customer in the service encounter.
In service delivery´s PCA, the most significant factor to explain the variance is the service staff and the remaining two explain a similar percentage of the extracted variance. The value for the Kaiser-Meyer-Olkin Measure of Sampling Adequacy is acceptable (0.90), as well as the value for Bartlett’s Test of Sphericity. This last test allows rejection of the null hypothesis about the identity character of the correlational matrix and is greater than the recommended value of 0.60.
PCA for the RTE component suggests two factors, which account for 70.64% of the variance in the component space. In this analysis, the exclusion criteria were the same as in the previous one. The first identified factor (happiness) explains 45.13% of the total variance, and the second one (love) explains almost half of the first (25.50%). Both factors integrate seven items describing the tourism experience from the customer perspective based on basic emotions. Happiness is the most important factor in the component space with eigenvalue = 4.18. Finally, the PCA in CD component explains 55.68% of the total variance in the component variables, with the highest loading values corresponding to the positive emotions, exceptional value, and appraisal (descriptive appraisal state). This CD factor includes, for the first-time, variables recognized independently as a key factor in delight. Values for the Kaiser-Meyer-Olkin Measure of Sampling Adequacy are acceptable in both PCAs, as is the value for Bartlett’s Test of Sphericity (0.89 and 0.82), rejecting the null hypothesis about the correlational matrix.
Measurement scale validity was assessed using CFA with SEM in the EQS tool, version 6.3 (Multivariate Software, Inc., Temple City, CA, USA). Before conducting the CFA analysis, we tested that the assumptions of normality, skewness and kurtosis indices for the scale items were within the recommended absolute values of 3 and 8, respectively, indicating no violation of the normality assumption [45]. The results are explained in Table 6. Reliability was assessed using the Cronbach’s alpha (0.939) and the range of Cronbach’s alpha if one item is removed (0.881–0.931); both coefficients are acceptable. The range values are also indicative of good reliability among the variables within each dimension. The composite reliability in all factors exceeded the recommended value of 0.7 for internal consistency.
The RHO correlation coefficient was 0.955. In all cases, the extracted variance (AVE) was within the recommended limit of 0.50. Furthermore, discriminant validity was analyzed by comparing the linear correlations or standardized covariance among the latent factors, checking that the correlations were less than the square root of the AVE. Table 7 shows that the square root values for each AVE were greater than the elements of the diagonal. Convergent validity was determined by checking the t-values (t > 2.58), which have a high weight in all cases.
5. Results
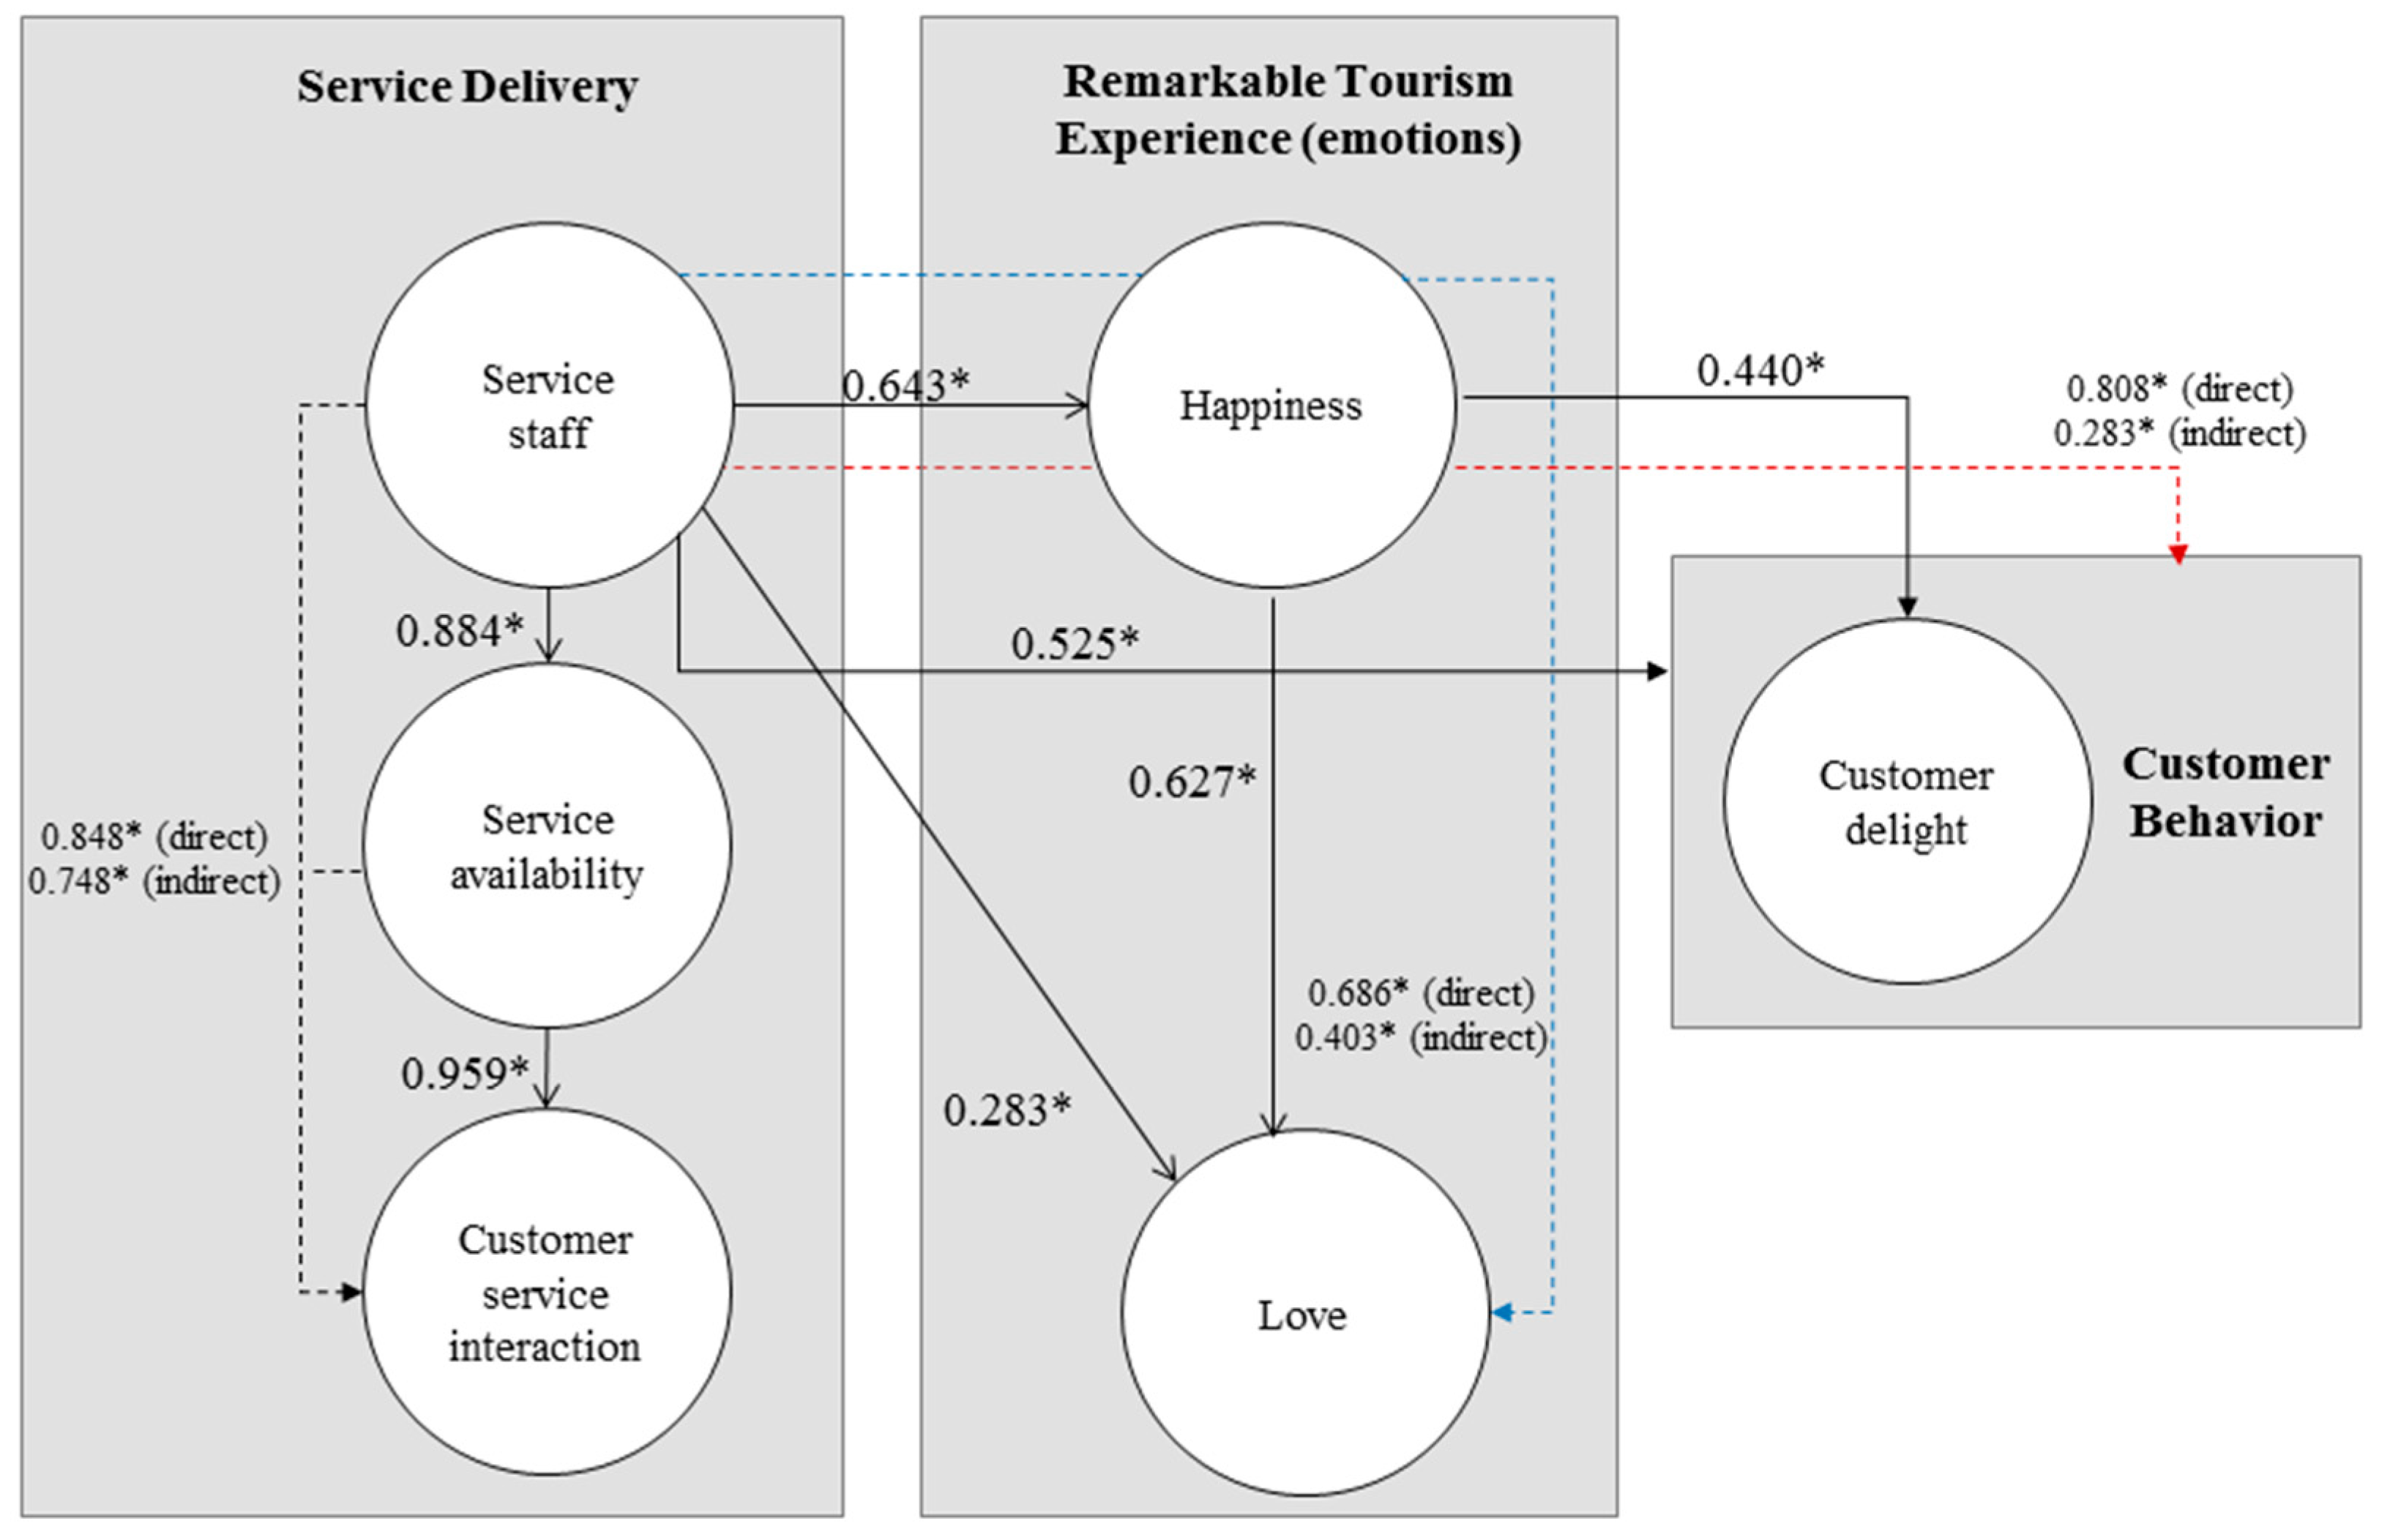
The external model includes six latent first-order reflective factors (see Figure 2) and 22 variables. The model represented in Figure 2 emphasizes the key-role of the service staff in RTE and the interaction between the components according to the research model. Figure 2 includes the direct path coefficients represented with a solid line, while the indirect effects are represented with a broken line. All the values correspond with the standardized solution considering the significance (* p ˂ 0.05) and explaining the establishment relationships in the model and their coefficients. The path coefficients with the corresponding values for the R-Squared and t-values in each case are summed up in Table 8. The model tested using the robust maximum likelihood method from the asymptotic variance-covariance matrix using the EQS 6.3 supports an acceptable and consistent adjustment for the factors in the CFA.
The obtained fit indices (see Table 8), specifically, the value of χ2 Satorra-Bentler scaled Chi-square statistic test 312.9221 (df = 200) and the p-value 0.000, denote the chi-square value of Maximum Likelihood Estimation technique (MLE). Using the Satorra-Bentler scaled Chi-square by df = 200, the factor is 1.56, which is way below the accepted limit of 5. The root mean square approximation error (RMSA) was 0.050, and the CFI was 0.930. Furthermore, values for Cronbach’s alpha test (0.879) and RHO (0.938) were also within the acceptable range.
A Lagrange test was applied in the latent factors model, which suggested determining one correlation to improve the goodness-of-fit indices. The first of these was between happiness and love, which had a significantly higher correlation (p ˂ 0.001, value = 0.627). Moreover, based on this suggested relationship, the indirect effect between the service staff and love feelings mediated by happiness (p ˂ 0.001, value = 0.403) was studied.
According to the path coefficients, the six latent factors identified previously interact as contingency factors in the SD to RTE supporting CD behaviors. The direct impact between service staff and happiness (0.643, p ˂ 0.01) was significant (p ˃ 0.05) to address RTE, most of which cannot be addressed solely with single factors. In a specific manner, respondents expressed that getting on well with a singular member of staff allows them to obtain a happiness state during the service, as well as a sensation of tiredness and surprise represented by the direct and most significant relationship between happiness and love (0.627, p ˂ 0.01) and staff-love (0.283). However, the results do not support a direct and significant relationship (p ˃ 0.05) between love and CD.
The service staff (0.525, p ˂ 0.01) and happiness (0.440, p ˂ 0.01) affect CD, suggesting a significant-value index among the customers in both factors. However, the coefficient regarding the impact of happiness was perceived as lower than the service staff in terms of adding insights to remarkable experience findings. There is a direct significant relationship between the service staff and the service availability (0.884, p ˂ 0.01) and between the service availability and the customer service interaction (0.959, p ˂ 0.01), which could imply a causal relationship.
There were no significant direct relationships established in the research model between service availability, happiness, and RTE (p ˃ 0.05). This finding in the model would be explained by the indirect effects, focused exclusively on the customer’s mediation, which is an essential factor in obtaining a thorough appraisal of the customer’s well-being settings. The explicit relationship between variables and factors with the underlying theoretical construct presented in the model suggests a mediation position of basic emotions and a higher effect of the service staff in starting a chain of relationships towards excellent customer experiences.
On the other hand, the service interaction factor and its direct relationship with happiness in RTE is also not significant (p ˃ 0.05) according to the respondents. Meanwhile, the latent factors in each component of the research studies initial design suggest a high-value index among the customers regarding the interaction with staff. The most significant variables of service staff are VIP treatment for all customers and attitude, which have both been recently stated to be closely related to staff contentment [46]. Other important items are stimulus, hope, and the sensation of not noticing time pass when the customer is enjoying RTE. Furthermore, in the SD component, the respondents highlight the positive effect of the extent to which the service responded to their complaints, suggestions, and customized needs related to an effective intervention before failing in the SD.
Indirect Effects on the Model
The perception of indirect effects could improve the quality of the evidence generated in the causal model. While direct effects provide evidence about the direct impact of one variable or factor on another without a third variable, the indirect ones explain why and how this relationship is established [47]. The application of a mediation test in the causal model enables finding the main indirect effects. In the standardized model, three indirect effects were positively significant (p < 0.01) with a 95% confidence interval excluding zero; one of them was studied after the suggestion made by the Lagrange test. Table 9 lists the indirect and direct significant effects among factors in the model with the significance level.
CD in RTE and specifically in hotels and restaurants is affected by numerous variables grouped in the service staff and customer service interaction according to the mediation described in Figure 2. The relationship between the service staff and love mediated by happiness (0.403, p ˂ 0.01) is as significant as the direct impact (0.686, p ˂ 0.01). On the other hand, the relationship between service staff and CD mediated by happiness is also significant (0.283). In this particular case, the coefficient effect on the mediation variable is quite similar to the coefficient with the mediation.
According to the results, there is a higher indirect effect between the service staff with customer service interaction mediated by the service availability (0.748, p ˂ 0.01). From a practitioner’s approach, an experienced and unique staff can modify some customer behaviors [15], for instance, when angry customers have complaints. Thus, the mediation effect suggests the causal pathways. Therefore, the direct impact of service staff in RTE is less significant than the direct impact of happiness.
6. Discussion and Implications
The model assesses the role of SD components in high-quality service memories and draws a path as to how customers come to form this opinion considering the customer´s emotional basic reaction. The model encompasses six second-order latent factors interacting in three components (SD, RTE, and CD) describing attitudinal and emotional variables. Table 10 summarizes the hypotheses formulated in the study and the results obtained, tested with data covering 284 answers from hotel and restaurant experiences.
The SD dimension of the model represents variables that some authors deem as main components in the SD process, according to the literature review [17] linked with CD. The most important latent factor suggests that interaction with a service’s staff is highly valued by the respondents [13,48,49]. It is in the staff factor that most of the significant relations in the model begin; no other factors in the SD dimension directly affect basic emotions to evoke CD. In attitudinal-cognitive terms, the service staff could represent an overall service image for customers.
Despite CD and staff being directly and positively correlated (0.525), there is another way to establish this correlation for the partial relationship between staff and happiness variables (0.642), followed by happiness and CD correlation (0.440). Results show that both are significant and start assessing variables in the staff factor. However, coefficients in the second variant are higher than in the first. This well-being in the second interaction allows customers to achieve feelings of optimism or stimulus during the experience.
Meanwhile, the direct relationship between the variables in the service’s staff and CD and the indirect one mediated by happiness, as well as the direct relationship between a service’s staff and happiness, support the first and sixth hypotheses (see Table 9). Furthermore, the results support the hypothesis of a direct relationship between the staff and love feelings, directly and indirectly. Consequently, the seventh hypothesis is also supported.
Results also suggest that the combination of a service’s staff, availability, and customer service interaction affects RTEs and consequently the appraisal each customer makes depending on their previous experience and needs. This could mean that even though the customer did not link the availability and service interaction with CD or RTE directly as the initial model posits, these factors are related, distinguishing an ascending type of CD and integrating SD components and basic emotions from the frontline employees. Hypotheses 4 and 5 are thus supported and hypotheses 2, 3, and 9 are not supported.
In a similar manner, the results do not support a direct correlation between the customer service interaction and happiness, suggesting that customers take certain variables for granted describing, for instance, attitude when dealing with complaints and suggestions. Customers can develop usual reactions even if the services provide a comprehensive set of high-quality facilities. This fact has been explained in the literature regarding emotional reactions by authors like Watson and Spence [33] and is based on the previous idea from other authors, such as Kumar et al. [50], concluding that a high degree of surprise does not necessarily mean delight. Thus, hypothesis 8 is not supported.
Happiness expressions appear in the model to represent specific emotional appraisals during RTE. According to the results, happiness is more strongly correlated to CD. Nonetheless, the distribution and significance of the emotions are different to other models available in the literature because it is based on the basic-dimensional emotions as a key informational source. In this case, the correlation between happiness and CD is similarly significant to the correlation between the staff and CD and allows validation of hypothesis 10. Finally, our findings support the key role of SD and emotions in evoking delight, however the interpretation of these findings must be used with caution due to the sample size. The number of respondents cannot be considered as a large sample, which could give a better representation of the population. Even under this condition, the response rate is 75% at its highest, as recommended by Kelley et al. [51]. Thus, we think that a nonresponse bias is unlikely [51].
6.1. Theoretical Implications
This research provided the first support for the idea that SD components like the staff, customer service interaction, and service availability affect RTE, expressed through happiness and love as basic emotions, and that they should be distinguished in tourism experiences and consequently that CD behaviors should be evoked in customers with high-quality service memories. The present article goes beyond the frontline employees to look at delight from a service perspective.
The research contributes to marketing and quality literature showing that a service’s staff is directly related to customer happiness and love. Results in both factors suggest that employees are able to evoke a happiness state in customers. Furthermore, findings support the idea that the staff is related with the extent to which customers perceive the service availability, creating a chain of SD among the three components identified. The staff groups several factors that have been tested positively in their correlation with CD, such as unsolicited recommendations to customers [24] or staff attitude in a single component.
Despite previous research showing that positive emotions such as pleasure or joy have a strong influence on CD, these findings suggest that to engage high-level emotional responses to deliver RTE, the service components are also necessary. From a quality perspective, results agree with [38] about the correlation between CD and hedonic consumption focus on customer needs. CD expresses excellence and the construction of happiness expressions might be more tightly linked with these motivational service states. However, apparently to impact customer emotions, the intervention of the staff is absolutely necessary, even if the other components are also important.
Happiness influences CD and is related to love feelings, although their implications are quite different. Emotionally, RTEs start in happiness and happiness would increase tenderness. Findings provide empirical evidence to better understand CD based on the fact that customers are also experts in the SD process and the need to go deeper into basic emotion studies to achieve RTEs is synonymous with delivering authentic and excellent service. In addition, the initial service components and basic emotions (mostly happiness) suggest that customers would transform the extra-value into memories. This possible transformation was recently mentioned in Harrington et al. [32], describing a memory-dominant logic (MDL) framework. The present research explores another dimension (SD) in extraordinary tourism services in order to establish a relationship between them.
6.2. Practical Implications
Despite contingency factors in SD, components are significant and correlated according to the results; the most important component is the service staff in agreement with Barnes et al. [24]. The first implication will possibly be related to training practices; service providers have to keep in mind that frontline employees directly impact customer service encounters [52]. In fact, Ludwig et al. [53] focus future discussions in the field of sustainable delight based on the service triangle, which means including staff. However, even though analyzing which kind of practices can improve the interactions between customers and staff to favor CD behaviors is beneficial, it was not the aim of this study, and authors considering those practices would have to include affective and empathy techniques. The arguments given above prove that the staff enable the linking and mediation of significant relationships in excellent service delivery. The model illustrates the analysis of the role of service staff and indirect and direct effects as a long-term implementation guide to evoke delight in customers.
The tourism industry can take advantage of insights from this study. Service providers must stimulate excellent service delivery and exceptional value. The exceptional value must ensure that customers have their own ideal of happiness according to the context, previous recent memories, or even culture [26]. In this case, enterprises have to be capable of designing experiences which are ideal to customers. Again, training can help employees to identify happiness needs and respond to them. However, findings demonstrate that customers and service suppliers should be aware that for CD, the emotions, and more precisely happiness, relate to needs.
The model illustrates how SD components can stimulate personal emotional resources to evoke CD. The service availability is as important as the customer service interaction and is related directly and indirectly to the staff. Both factors would help tourism service providers as well as consumers to create an effective communication system. Based on the insights, the SD component has a key role in providing delight to customers.
Service providers cannot design every customer service interaction in advance; thus, it is important to pay close attention and to improve the interactions between customers and staff. This work emphasizes the need to consider the RTE from the service, customer, and staff perspective to achieve excellence and to replace standard service memories with delightful ones. Service providers should understand the specific emotional requirements in each stage of the customer’s journey. Evoking CD behaviors is about the extent to which customers perceive the SD process and whether the service provider is able to know their needs.
7. Conclusions
The objective of this study is to analyze the consequences and emerging factors of SD in RTE and explore their interactions in evoking CD. This study established a novel and reliable service-oriented model of six factors, consisting of 22 variables. According to the results, the service staff leads the interaction among factors beginning in the SD component with basic emotions as catalysts to evoke CD in tourists.
According to the advanced literature in the RM field, factors related to service availability and customer service interaction, as well as basic emotions, were studied, to go beyond the staff’s positive influence on the CD. According to the findings, the SD component encourages delight behaviors, expressing customized ideals of excellence in RTE and particularly in hotel and restaurant memories. Happiness and excellence-oriented service attitudinal factors give customers the key they need to evoke delight. Even if this study does not offer a conclusive answer to the question, it uncovers important findings about how the positive perceptions of consumers about SD can affect the evocation of emotion’s and lead to delight behaviors. Thus, the authors recommend verifying the results on a larger sample of respondents.
The model suggests that the service providers must create the encounter conditions to be more customized to the customer’s happiness ideal; a favorable customer-staff interaction would lead to a positive appraisal of the other service components and emotional evocation, which would enhance CD. Furthermore, it can be assumed that variables in emerging factors and their interactions are bendable to improve customer behavior-influences in RTE, so one of the possibilities for future research in this field is analyzing and comparing the model with other tourism memories, as well as in other destinations with other compositions of respondents.
This study has some limitations. The results suggest that appraisal is a very important variable and we consider it a limitation to only use one item to measure it. According to the not-supported hypothesis, it is possible that other service components affect or mediate the recognized factors. Therefore, in other studies, we will possibly include other service components.
Considering the results and the key role of the staff, the present research suggests some questions to keep an advance on the field: Can employees reach a delighted state? How can employee’s delight be measured and what emerging factors would be involved? To what extent do delighted employees affect customer behaviors and an enterprise’s development?
Author Contributions
D.E. conceptualized the paper and drafted most of the text. M.C., A.S., and P.S. provided critical review, built on the conceptualization and provided text. P.S. provided support for resources.
Funding
This work was supported by Secretariat for Universities and Research, from the Department Economy and Knowledge of the Government of Catalonia, Spain; the European Social Fund, the Spanish Ministry of Science and Innovation [ECO2017-86054-C3-1-R], and the Autonomous Government of Catalonia [2017 SGR 1259].
Acknowledgments
The authors would like to thank the support received by the Tourism Office of the city of Girona belonging to the City Hall. To Gloria Plana, Director of Economic Promotion, Local Development and Tourism of Girona.
Conflicts of Interest
The authors declared no potential conflict of interest.
References
- Ou, Y.C.; Verhoef, P.C. The impact of positive and negative emotions on loyalty intentions and their interactions with customer equity drivers. J. Bus. Res. 2017, 80, 106–115. [Google Scholar] [CrossRef]
- Torres, E.N.; Milman, A.; Park, S. Delighted or outraged? Uncovering key drivers of exceedingly positive and negative theme park guest experiences. J. Hosp. Tour. Insights 2018, 1, 65–85. [Google Scholar] [CrossRef]
- Baker, M.A.; Kim, K. The role of language, appearance, and smile on perceptions of authenticity versus rapport. Int. J. Hosp. Manag. 2018, 74, 171–179. [Google Scholar] [CrossRef]
- Alnawas, I.; Hemsley-Brown, J. The differential effect of cognitive and emotional elements of experience quality on the customer-service provider’s relationship. Int. J. Retail. Distrib. Manag. 2018, 46, 125–147. [Google Scholar] [CrossRef]
- Holbrook, M.B.; Hirschman, E.C. The experiential aspects of consumption: Consumer fantasies, feelings, and fun. J. Consum. Res. 1982, 9, 132. [Google Scholar] [CrossRef]
- Kranzbüehler, A.M.; Kleijnen, M.H.P.; Morgan, R.E.; Teerling, M. The multilevel nature of customer experience research: An integrative review and research agenda. Int. J. Manag. Rev. 2018, 20, 433–456. [Google Scholar] [CrossRef]
- Loureiro, S.M.C. Satisfying and delighting the rural tourists. J. Travel Tour. Mark. 2010, 27, 396–408. [Google Scholar] [CrossRef]
- Torres, E.N.; Ronzoni, G. The evolution of the customer delight construct: Prior research, current measurement, and directions for future research. Int. J. Contemp. Hosp. Manag. 2018, 30, 57–75. [Google Scholar] [CrossRef]
- Parasuraman, A.; Berry, L.; Zeitbaml, A.V. A conceptual model for quality service and its implications for future research. J. Interact. Mark. 1985, 49, 41–50. [Google Scholar]
- Barnes, D.; Collier, J.E.; Howe, V.; Hoffman, D. Multiple paths to customer delight: The impact of effort, expertise and tangibles on joy and surprise. J. Serv. Mark. 2016, 30, 277–289. [Google Scholar] [CrossRef]
- Torres, E.N. Deconstructing Service Quality and Customer Satisfaction: Challenges and Directions for Future Research. J. Hosp. Mark. Manag. 2014, 23, 652–677. [Google Scholar] [CrossRef]
- Dadfar, H.; Brege, S.; Semnani, S.S.E. Customer involvement in service production, delivery and quality: The challenges and opportunities. Int. J. Qual. Serv. Sci. 2013, 5, 46–65. [Google Scholar] [CrossRef]
- Wang, Y.C.; Luo, C.C.; Tai, Y.F. Implementation of delightful services: From the perspective of frontline service employees. J. Hosp. Tour. Manag. 2017, 31, 90–104. [Google Scholar] [CrossRef]
- Nordhorn, C.; Scuttari, A.; Pechlaner, H. Travel motivation of Indonesian seniors in choosing destination overseas. Int. J. Cult. Tour. Hosp. Res. 2018, 12, 185–197. [Google Scholar]
- Barnes, D.C.; Collier, J.E.; Robinson, S.; Black, H.G.; Vincent, L.H.; Skinner, S.J. Customer delight and work engagement. J. Serv. Mark. 2014, 28, 380–390. [Google Scholar] [CrossRef]
- Kim, D.; Perdue, R.R. The effects of cognitive, affective, and sensory attributes on hotel choice. Int. J. Hosp. Manag. 2013, 35, 246–257. [Google Scholar] [CrossRef]
- Shneider, B.; Bowen, D. Undestending customer delight and outrage. Sloan Manag. Rev. 1999, 41, 35–45. [Google Scholar]
- Milliman, J.; Gatling, A.; Kim, J. The effect of workplace spirituality on hospitality employee engagement, intention to stay, and service delivery. J. Hosp. Tour. Manag. 2018, 35, 56–65. [Google Scholar] [CrossRef]
- Danaher, P.J.; Mattsson, J. Customer satisfaction during the service delivery process. Eur. J. Mark. 1994, 28, 5–16. [Google Scholar] [CrossRef]
- Lusch, R.F.; Vargo, S.L. Service-dominant logic: Reactions, reflections and refinements. Mark. Theory 2006, 6, 281–288. [Google Scholar] [CrossRef]
- Nyangau, J. Effects of Customer service delivery on customer satisfaction in micro finance industry in Nairobi County. J. Mark. Commun. 2017, 1, 1–15. [Google Scholar]
- Zhao, Y.; Yan, L.; Tat Keh, H. The effects of employee behaviours on customer participation in the service encounter: The mediating role of customer emotions. Eur. J. Mark. 2018, 52, 1203–1222. [Google Scholar] [CrossRef]
- Mamat, M.; Haron, M.S.; Razak, N.S.A. Personal Interaction Encounter, Customer Involvement, Familiarity and Customer Service Experience in Malaysian Public Universities. Procedia Soc. Behav. Sci. 2014, 130, 293–298. [Google Scholar] [CrossRef] [Green Version]
- Barnes, D.C.; Ponder, N.; Hopkins, C.D. The impact of perceived customer delight on the frontline employee. J. Bus. Res. 2015, 68, 433–441. [Google Scholar] [CrossRef]
- Collier, J.E.; Barnes, D.C.; Abney, A.K.; Pelletier, M.J. Idiosyncratic service experiences: When customers desire the extraordinary in a service encounter. J. Bus. Res. 2018, 84, 150–161. [Google Scholar] [CrossRef]
- Torres, E.N.; Kline, S. From satisfaction to delight: A model for the hotel industry. Int. J. Contemp. Hosp. Manag. 2006, 18, 290–301. [Google Scholar] [CrossRef]
- Mount, D.J.; Mattila, A. The Final Opportunity: The Effectiveness of a Customer Relations Call Center in Recovering Hotel Guests. J. Hosp. Tour. Res. 2000, 24, 514–525. [Google Scholar] [CrossRef]
- Roy, S.K.; Shekhar, V.; Lassar, W.M.; Chen, T. Customer engagement behaviors: The role of service convenience, fairness and quality. J. Retail. Consum. Serv. 2018, 44, 293–304. [Google Scholar] [CrossRef]
- Kim, M.; Vogt, C.A.; Knutson, B.J. Relationships among Customer Satisfaction, Delight, and Loyalty in the Hospitality Industry. J. Hosp. Tour. Res. 2013, 39, 170–197. [Google Scholar] [CrossRef]
- Richard, N.N.; Felix, N.; Sylvie, F. The role of service attributes in customer satisfaction: An analysis of classified hotels in Cameroon. Afr. J. Bus. Manag. 2018, 12, 66–77. [Google Scholar]
- Field, J.M. Service operations: what’s next? J. Serv. Manag. 2018, 29, 55–97. [Google Scholar] [CrossRef]
- Harrington, R.J.; Hammond, R.K.; Ottenbacher, M.C.; Chathoth, P.K.; Marlowe, B. From goods-service logic to a memory-dominant logic: Business logic evolution and application in hospitality. Int. J. Hosp. Manag. 2018, 76, 252–260. [Google Scholar] [CrossRef]
- Watson, L.; Spence, M.T. Causes and consequences of emotions on consumer behaviour. Eur. J. Mark. 2007, 41, 487–511. [Google Scholar] [CrossRef]
- Laros, F.J.M.; Steenkamp, J.B.E.M. Emotions in consumer behavior: A hierarchical approach. J. Bus. Res. 2005, 58, 1437–1445. [Google Scholar] [CrossRef]
- Nadiri, H.; Tanova, C. An investigation of the role of justice in turnover intentions, job satisfaction, and organizational citizenship behavior in hospitality industry. Int. J. Hosp. Manag. 2010, 29, 33–41. [Google Scholar] [CrossRef]
- Arora, R. A mixed method approach to understanding the role of emotions and sensual delight in dining experience. J. Consum. Mark. 2012, 29, 33–343. [Google Scholar] [CrossRef]
- Ball, J.; Barnes, D.C. Delight and the grateful customer: Beyond joy and surprise. J. Serv. Theory Pract. 2017, 27, 250–269. [Google Scholar] [CrossRef]
- Ma, J.; Gao, J.; Scott, N.; Ding, P. Customer delight from theme park experiences. The Antecedents of Delight based on Cognitive Appraisal Theory. Ann. Tour. Res. 2013, 42, 359–381. [Google Scholar] [CrossRef]
- Im, J.; Qu, H. Drivers and resources of customer co-creation: A scenario-based case in the restaurant industry. Int. J. Hosp. Manag. 2017, 64, 31–40. [Google Scholar] [CrossRef]
- Lee, Y.J. How Travel Makes Us Happy: The Integrated Travel-Happiness (T-H) Model of Cognitive Appraisal Theory and Self-Determination Theory. Ph.D. Thesis, University of Guelph, Guelph, ON, Canada, 2018. [Google Scholar]
- Kwong, K.K.; Yau, O.H.M. The Conceptualization of Customer Delight: A Research Framework. Asia Pac. Manag. Rev. 2002, 7, 255–266. [Google Scholar]
- Liu, M.W.; Keh, H.T. Consumer delight and outrage: Scale development and validation. J. Serv. Theory Pract. 2015, 25, 680–699. [Google Scholar] [CrossRef]
- Beltran-Martín, I.; Roca-Puig, V.; Escrig-Tena, A.; Bou-Llusar, J.C. Internal labour flexibility from a resource-based view approach: Definition and proposal of a measurement scale. Int. J. Hum. Resour. Manag. 2009, 20, 1576–1598. [Google Scholar] [CrossRef]
- Bernardo, M.; Marimon, F.; Alonso-Almeida, M.D.M. Functional quality and hedonic quality: A study of the dimensions of e-service quality in online travel agencies. Inf. Manag. 2012, 49, 342–347. [Google Scholar] [CrossRef]
- Kline, R. Structural Equation Modeling, 3rd ed.; Guilford: New York, NY, USA, 2011. [Google Scholar]
- Hasan, S.A.; Raheem, S.; Subhani, M.I. Measuring Customer delight: A model for banking industry. Eur. J. Soc. Sci. 2011, 22, 510–518. [Google Scholar]
- Kraemer, H.; Terence Wilson, G.; Fairburn, C.G.; Stewart Agras, W. Mediators and moderators of treatment effects in randomized clinical trials. Arch. Gen. Psychiatry 2002, 59, 877–883. [Google Scholar] [CrossRef] [PubMed]
- Ren, L.; Qiu, H.; Wang, P.; Lin, P.M.C. Exploring customer experience with budget hotels: Dimensionality and satisfaction. Int. J. Hosp. Manag. 2016, 52, 13–23. [Google Scholar] [CrossRef]
- Chiu-Ying, K.; Sheng-Hshiung, T.; Tsung-Chiung, W. Organizational culture on customer delight in the hospitality industry. Int. J. Hosp. Manag. 2016, 56, 98–108. [Google Scholar]
- Kumar, A.; Olshavsky, R.; King, M. Exploring alternative antecedents of customer delight. J. Consum. Satisf Dissatisfaction Complain Behav. 2001, 14, 14–26. [Google Scholar]
- Kelley, K.; Clark, B.; Brown, V.; Sitzia, J. Good practice in the conduct and reporting of survey research. Int. J. Qual. Health Care 2003, 15, 261–266. [Google Scholar] [CrossRef] [PubMed] [Green Version]
- Zhang, T.; Lu, C.; Torres, E.; Chen, P.J. Engaging customers in value co-creation or co-destruction online. J. Serv. Mark. 2018, 32, 57–69. [Google Scholar] [CrossRef]
- Ludwig, N.L.; Heidenreich, S.; Kraemer, T.; Gouthier, M. Observing delightful experiences of other customers: The double-edged sword of jealousy and joy. J. Serv. Theory Pract. 2017, 27, 22–45. [Google Scholar] [CrossRef]
Figure 1.
Research design.

Figure 2.
Path coefficients in the model. Direct and indirect effects.


Table 1.
Summary of hypothesis according to the research design.
| Path Model for the Hypothesis in the Research Model | |||
|---|---|---|---|
| Hypothesis Related to Service Staff in RCE | Hypothesis Related to Service Availability in RCE | Hypothesis Related to Customer Service Interaction in RCE | Hypothesis Related to Emotions and CD Behavior |
| H1: Service staff→ customer delight | H2: Service availability→ customer delight | H3: Customer service interaction→ customer delight | H10: Happiness→ customer delight |
| H4: Service staff→ service availability | H5: Service availability→ customer service interaction | H8: Customer service interaction→ happiness | H11: Love→ customer delight |
| H6: Service staff→ happiness | H9: Service availability→ happiness | ||
| H7: Service staff→ love | |||
Table 2.
Survey items.
| Dimension | Items |
|---|---|
| Service staff | CES1: Unrequested recommendations provided by the staff |
| CES2: The staff offering VIP treatment during the experience | |
| CES3: Staff’s attitude towards customers | |
| CES4: Trust in the staff and service | |
| CES5: The staff is able to really know the customer needs and manage them | |
| CES6: The staff provide useful and complete information to customers | |
| Customer service interaction | CEI1: Customization of the offer CEI2: Refund behavior |
| CEI3: Behavior regarding customers’ complaints or suggestions | |
| Service availability | CEA1: Ambiance/appearance of the place |
| CEA2: Access and information availability | |
| CEA3: Communication availability | |
| CEA4: Accessibility | |
| Customer delight | CDE1: Excellent service |
| CDE2: Overprice (customers agree to pay more for a similar service) | |
| CDE3: The experience evokes positive emotions and special memories for customers | |
| CDE4: Customers consider that the experience is of exceptional value to them | |
| CDE5: Experience appreciation | |
| Happiness | CHS1: Enthusiasm |
| CHS2: Optimism | |
| CHS3: Hope | |
| CHS4: Stimulus | |
| CHS5: The sensation of not noticing time pass when customers are enjoying transcendent experiences | |
| Love | CLS1: Tenderness |
| CLS2: Surprise |
Table 3.
Demographic information of the sample.
| N | % | Hotel Experience | % | Restaurant Experience | % | |
|---|---|---|---|---|---|---|
| Age | ||||||
| Between 18 and 29 years old | 150 | 52.9 | 77 | 55.8 | 73 | 50 |
| Between 30 and 49 years old | 77 | 27.1 | 34 | 24.6 | 43 | 29.5 |
| Between 50 and 59 years old | 39 | 13.7 | 17 | 12.3 | 22 | 15 |
| 60 or more years old | 18 | 6.3 | 10 | 7.3 | 8 | 5.5 |
| Gender | ||||||
| Male | 108 | 38 | 40 | 29 | 68 | 46.6 |
| Female | 176 | 62 | 98 | 71 | 78 | 53.4 |
| Nationality | ||||||
| Europe | 228 | 80.3 | 113 | 81.9 | 115 | 78.7 |
| America | 42 | 14.7 | 19 | 13.8 | 23 | 15.8 |
| Asia | 11 | 3.8 | 4 | 2.9 | 7 | 4.8 |
| Oceania | 1 | 0.35 | 1 | 0.7 | 0 | - |
| Africa | 2 | 0.7 | 1 | 0.7 | 1 | 0.7 |
| Total | 284 | 100 | 138 | 48.6 | 146 | 51.4 |
Table 4.
PCA analysis of the customer experience service factors.
| Statements | 1 | 2 | 3 |
|---|---|---|---|
| CES1 | 0.706 | 0.226 | 0.197 |
| CES2 | 0.839 | 0.130 | 0.128 |
| CES3 | 0.810 | 0.109 | 0.075 |
| CES4 | 0.691 | 0.398 | 0.061 |
| CES5 | 0.675 | 0.373 | 0.123 |
| CES6 | 0.474 | 0.395 | 0.239 |
| CEI1 | 0.425 | 0.531 | 0.289 |
| CEI2 | 0.375 | 0.541 | 0.232 |
| CEI3 | 0.407 | 0.589 | 0.210 |
| CEA1 | 0.357 | 0.290 | 0.571 |
| CEA2 | 0.424 | 0.158 | 0.587 |
| CEA3 | 0.547 | 0.042 | 0.630 |
| CEA4 | −0.140 | 0.054 | 0.558 |
Significant loadings on one factor are presented in bold Eigenvalue = 6.854; % cumulative variance = 58.58. KMO = 0.90. Bartlett’s test of sphericity = (x2 = 1620.801, df = 120, p = 0.000).
Table 5.
PCA analysis of customer experience and customer delight.
| Statements Emotional Factors | 1 | 2 | Statements Customer Delight | 1 |
|---|---|---|---|---|
| CHS1 | 0.821 | 0.227 | CDE1 | 0.777 |
| CHS2 | 0.859 | 0.253 | CDE2 | 0.474 |
| CHS3 | 0.763 | 0.327 | CDE3 | 0.814 |
| CHS4 | 0.789 | 0.323 | CDE4 | 0.778 |
| CHS5 | 0.608 | 0.286 | CDE5 | 0.765 |
| CLS1 | 0.280 | 0.839 | ||
| CLS2 | 0.309 | 0.820 | ||
| KMO = 0.892. Bartlett’s test of sphericity = (x2 = 960.302, df = 21, p = 0.000) | KMO = 0.824. Bartlett’s test of sphericity = (x2 = 387.117, df = 19, p = 0.000) | |||
| Eigenvalue = 4.186; % cumulative variance = 70.64 | Eigenvalue = 2.785%; cumulative variance = 55.68 | |||
Significant loadings on one factor are presented in bold.
Table 6.
Measurement assessment (reliability and validity).
| Dimension/Item | CFA | |||
|---|---|---|---|---|
| Standardized Loadings | r2 | t-Values | Indices | |
| Service staff | AC = 0.867 RCAIR = 0.927–0.931 RCBIS = 0.952–0.773 CR = 0.884 AVE = 0.60 | |||
| CES1 | 0.716 | 0.513 | 13.16 | |
| CES2 | 0.820 | 0.672 | 16.60 | |
| CES3 | 0.801 | 0.642 | 13.16 | |
| CES4 | 0.763 | 0.583 | 13.30 | |
| CES5 | 0.782 | 0.612 | 12.62 | |
| Customer service interaction | AC = 0.763 RCAIR = 0.850–0.918 RCBIS = 0.771–0.852 CR = 0.743 AVE = 0.50 | |||
| CEI1 | 0.726 | 0.527 | 10.72 | |
| CEI2 | 0.657 | 0.432 | 9.60 | |
| CEI3 | 0.718 | 0.510 | 10.73 | |
| Service availability | AC = 0.723 RCAIR = 0.884–887 RCBIS = 0.681–0.727 CR = 0.749 AVE = 0.50 | |||
| CEA1 | 0.614 | 0.377 | 8.34 | |
| CEA2 | 0.742 | 0.551 | 8.98 | |
| CEA3 | 0.702 | 0.492 | 9.65 | |
| Customer delight | AC = 0.803 RCAIR = 0.887–0.899 RCBIS = 0.644–0.799 CR = 0.835 AVE = 0.56 | |||
| CDE1 | 0.760 | 0.578 | 17.47 | |
| CDE3 | 0.750 | 0.562 | 12.09 | |
| CDE4 | 0.732 | 0.536 | 13.90 | |
| CDE5 | 0.746 | 0.556 | 17.163 | |
| Happiness | AC = 0.876 RCAIR = 0.881–0.908 RCBIS = 0.723–0.848 CR = 0.955 AVE = 0.65 | |||
| CHS1 | 0.763 | 0.583 | 15.27 | |
| CHS2 | 0.850 | 0.723 | 18.76 | |
| CHS3 | 0.815 | 0.663 | 20.42 | |
| CHS4 | 0.831 | 0.691 | 23.14 | |
| CHS5 | 0.600 | 0.344 | 9.86 | |
| Love | AC = 0.790 RCAIR = 0.881–0.908 RCBIS = 0.723–0.848 CR = 0.716 AVE = 0.56 | |||
| CLS1 | 0.758 | 0.574 | 12.89 | |
| CLS2 | 0.735 | 0.540 | 9.51 | |
Alpha Cronbach (AC), Range of Cronbach’s alpha if one item is removed (RCAIR), Range of correlations between items and total corrected scale (RCBIS), Composite Reliability (CR), Average Variance Extracted (AVE).
Table 7.
Correlation matrix.
| 1 | 2 | 3 | 4 | 5 | 6 | |
|---|---|---|---|---|---|---|
| 1. Service staff | 0.777 | |||||
| 2. Service interaction | 0.684 | 0.701 | ||||
| 3. Service availability | 0.748 | 0.659 | 0.707 | |||
| 4. Happiness | 0.643 | 0.568 | 0.545 | 0.808 | ||
| 5. Love | 0.686 | 0.606 | 0.581 | 0.800 | 0.747 | |
| 6. Customer delight | 0.708 | 0.694 | 0.685 | 0.778 | 0.716 | 0.747 |
Table 8.
Standardized solution of the model.
| Path | Coefficient * | R-Squared | t-Value |
|---|---|---|---|
| Service staff→ Happiness | 0.643 | 0.413 | 7.83 |
| Service availability→ service customer interaction | 0.959 | 0.921 | 8.78 |
| Service staff→ Service availability | 0.884 | 0.781 | 11.84 |
| Happiness→ customer delight | 0.440 | 0.767 | 5.71 |
| Service staff→ customer delight | 0.525 | 0.276 | 6.21 |
| Happiness→ Love | 0.627 | 0.393 | 7.43 |
| Staff→ Love | 0.283 | 0.056 | 3.16 |
Fit statistics: x2 Satorra-Bentler (df = 200) = 312.9221 (p-value = 0.00310); RMSEA = 0.050; CFI = 0.938; BB−NFI = 0.939; BB−NNFI = 0.774. Note: * All significant at p ˂ 0.05.
Table 9.
Indirect and direct effects. Mediation test results.
| Relationship | Direct Effect | Indirect Effect | p-Value | Conclusion |
|---|---|---|---|---|
| Service staff→ Happiness→ Love | 0.686 (4.60) | 0.403 | p ˂ 0.05 | Indirect-only mediation |
| Service staff→ happiness→ customer delight | 0.808 (6.03) | 0.283 | p ˂ 0.05 | Complementary mediation |
| Service staff→ service availability→ service interaction | 0.848 (5.88) | 0.748 | p ˂ 0.05 | Indirect-only mediation |
Note: In direct effect column appears the direct effect coefficient (t-value).
Table 10.
Sum of hypothesis and results.
| Hypothesis Related to Service Staff in RCE | Hypothesis Related to Service Availability in RCE | Hypothesis Related to Customer Service Interaction in RCE | Hypothesis Related to Emotions and CD Behavior |
|---|---|---|---|
| H1: Supported | H2: Not supported | H3: Not supported | H3: Supported |
| H4: Supported | H5: Supported | H8: Not supported | H11: Not supported |
| H6: Supported | H9: Not supported | ||
| H7: Supported |
© 2019 by the authors. Licensee MDPI, Basel, Switzerland. This article is an open access article distributed under the terms and conditions of the Creative Commons Attribution (CC BY) license (http://creativecommons.org/licenses/by/4.0/).
Share and Cite
MDPI and ACS Style
Escobar Rivera, D.; Casadesús Fa, M.; Alexandre Costa Araújo Sampaio, P.; Simon Villar, A. Exploring the Role of Service Delivery in Remarkable Tourism Experiences. Sustainability 2019, 11, 1382. https://doi.org/10.3390/su11051382
AMA Style
Escobar Rivera D, Casadesús Fa M, Alexandre Costa Araújo Sampaio P, Simon Villar A. Exploring the Role of Service Delivery in Remarkable Tourism Experiences. Sustainability. 2019; 11(5):1382. https://doi.org/10.3390/su11051382
Chicago/Turabian StyleEscobar Rivera, Dalilis, Marti Casadesús Fa, Paulo Alexandre Costa Araújo Sampaio, and Alexandra Simon Villar. 2019. "Exploring the Role of Service Delivery in Remarkable Tourism Experiences" Sustainability 11, no. 5: 1382. https://doi.org/10.3390/su11051382
Note that from the first issue of 2016, this journal uses article numbers instead of page numbers. See further details here.