Article

The Sustainability Conundrum of Fishmeal Substitution by Plant Ingredients in Shrimp Feeds

1
MatureDevelopment B.V., World Trade Center, 2595 AM The Hague, The Netherlands
2
Institute of Aquaculture, University of Stirling, Stirling FK9 4LA, UK
3
Research Institute for Agriculture, Fisheries and Food (ILVO), Fisheries and Aquatic Production, 8400 Ostend, Belgium
4
Mexico Aquaculture Research Inc., Guadalajara 45110, Mexico
5
Association of International Seafood Professionals, Southbank, VIC 3006, Australia
6
Aquaculture without Frontiers, Oakland, CA 94610, USA
7
Universidad Tecnológica del Mar de Tamaulipas, Soto La Marina - La Pesca, Km. 46+400, S/N, La Pesca 87678, Municipio de Soto la Marina, Tamaulipas, México
8
IFFO, The Marine Ingredients Organisation, London SE17 3BZ, UK
9
Department of Innovation, Environmental and Energy Sciences, Copernicus Institute of Sustainable Development, Utrecht University, 3508 TC Utrecht, The Netherlands
10
University Research Priority Program in Global Change and Biodiversity and Department of Geography, University of Zürich, 8057 Zürich, Switzerland
11
Fish Nutrition and Aquaculture Group, Department of Animal Production, Welfare and Veterinary Sciences, Harper Adams University, Newport TF10 8NB, UK
*
Authors to whom correspondence should be addressed.
Sustainability 2019, 11(4), 1212; https://doi.org/10.3390/su11041212
Submission received: 2 December 2018 / Revised: 13 February 2019 / Accepted: 15 February 2019 / Published: 25 February 2019
(This article belongs to the Special Issue Seafood Sustainability - Series I)

Abstract

:
Aquaculture is central in meeting expanding global demands for shrimp consumption. Consequently, increasing feed use is mainly responsible for the overall environmental impact of aquaculture production. Significant amounts of fishmeal are included in shrimp diets, causing dependency on finite marine resources. Driven by economic incentives, terrestrial plant ingredients are widely viewed as sustainable alternatives. Incremental fishmeal substitution by plant ingredients in shrimp feed was modeled and effects on marine and terrestrial resources such as fish, land, freshwater, nitrogen, and phosphorus were assessed. We find that complete substitution of 20–30% fishmeal totals could lead to increasing demand for freshwater (up to 63%), land (up to 81%), and phosphorus (up to 83%), while other substitution rates lead to proportionally lower impacts. These findings suggest additional pressures on essential agricultural resources with associated socio-economic and environmental effects as a trade-off to pressures on finite marine resources. Even though the production of shrimp feed (or aquafeed in general) utilizes only a small percentage of the global crop production, the findings indicate that the sustainability of substituting fishmeal by plant ingredients should not be taken for granted, especially since aquaculture has been one of the fastest growing food sectors. Therefore, the importance of utilizing by-products and novel ingredients such as microbial biomass, algae, and insect meals in mitigating the use of marine and terrestrial resources is discussed.

1. Introduction

Global fish consumption per capita almost doubled from 9.96 kg in 1961 until 19.86 kg in 2013, and capture fisheries and aquaculture are important contributors to the global food supply, producing in 2013 approximately 17.7% of the total 30 g capita−1 day−1 animal protein, which is more than poultry (17.4%), pig (15.7%), and bovine (12.0%) [1]. In 2015, global per capita fish supply reached 20.2 kg [2], and an annual increase in fish consumption of 0.3% until 2030 is projected [3] with a growing global middle-class increasing demand for high value species [2]. In 2015, 59.9% of the global fish stocks were fully fished, while 33.1% of the global fish stocks experienced fishing at an unsustainable level. Since 2000, capture fisheries have been close to their production limits of 90 million metric tons (MT) annually. As a result, the aquaculture sector is growing faster than any other food-producing sector, and in 2016, aquaculture contributed to 46.8% of the global fish production [2].
Currently, more than 50% of the global shrimp supply originates from aquaculture with an estimated production volume between four and five million MT in 2015 [4], making it one of the largest consumers of aquafeed [2,5] and most valuable aquaculture production group [2,3]. Additionally, the shrimp industry is one of the dominant consumers of fishmeal in the aquaculture sector [6,7]. To meet demand for a growing industry in the face of a finite supply of marine ingredients, feed manufacturers have decreased the inclusion of fishmeal in commercial diets [6,8,9]. Aquafeed is shifting towards crop-based ingredients, mainly driven by economic incentives [8,9,10], as the relative price of fishmeal increases compared to common plant ingredients, such as soy protein concentrate, cereal, and wheat gluten [2,7,11].
Fishmeal substitution by plant ingredients is considered to be environmentally sustainable, as it reduces dependency on finite marine resources [6,10]. However, the nutritional requirements of certain aquatic species may limit the amount of fishmeal substitution due to essential nutrients, which are variable or imbalanced in terrestrial plant ingredients [10,12]. Additionally, substituting fishmeal by plant ingredients would shift resource demand from the oceans onto the land, potentially adding pressure to the land-based food production systems [13,14,15], affecting the environment, biodiversity, and availability and prices of crops [8,16,17]. Minor price changes could have significant impacts in developing countries, as 50% of the household income is spent on food [18], and a price increase of one percent could result in an estimated 16 million undernourished people [19]. These potential implications do not contribute to a sustainable diet as defined by the Food and Agriculture Organization (FAO) [20], neither is it in line with the Sustainable Development Goals (SDGs) of the United Nations (UN) of food security, hunger reduction, and protection of life on land and in the sea.
Current knowledge suggests that aquaculture growth and its increasing demand for plant ingredients in aquafeed could affect agricultural supply [17] and its resources, such as land, freshwater, and fertilizer [8,16]. However, the quantitative impact is relatively unknown.

2. Aquafeed Interactions with Marine and Terrestrial Resources

Aquaculture and capture fisheries are interdependent [16,17], as fishmeal and fish oil are used in aquafeeds (mainly for finfish and crustacean diets) [5,7,9]. Fish oil and fishmeal originates from small pelagic fish and an increasing share of fish processing waste (on average a proportion of 25% to 35%) [2,3,8]. The fraction of capture fisheries for fishmeal production is relatively stable, and therefore an increasing inclusion of fishery by-products could contribute to global fishmeal supply but could affect its nutritional value [2]. Aquaculture saw an extremely fast increase in global fishmeal consumption share from 10% in 1980 to 73% in 2016 [7], while the aquafeed sector accounted for approximately 4% of global feed production [16]. While shrimp aquaculture consumed 16% (approximately 6.18 million MT) of the global aquafeed production (approximately 39.62 million MT) in 2012 [5], it consumed 31% (approximately 1 million MT) of the fishmeal in aquaculture (IFFO, personal communication, 2018). Global fishmeal production is around five million MT annually, and its future production may be affected by an increasing demand, climate change, and variability (e.g., El Niño) [9,12,21]. In response, shrimp feed manufacturers have decreased the inclusion of fishmeal from a global range of 19–40% in 2000 to 11–23% in 2014, while the global fish oil inclusion range stabilized (around 0–2%) (IFFO, personal communication, 2018). Future fishmeal inclusion in shrimp feed are expected to further decline and stabilize around 6% in 2025 [11]. Additionally, total shrimp production fed on aquafeeds is expected to increase from 84% in 2012 to 90% in 2025 (approximately 8.6 million MT) [5]. The growth in aquaculture production and increasing feed demand could have significant environmental impacts, as most life cycle assessments (LCAs) suggest that feed probably accounts for over 90% of the environmental impact [22]. However, this impact is variable depending on the type, source, and form of feed ingredients.
Aquatic animals generally convert feed more efficiently because of their buoyancy in water and efficient protein digestion and therefore use less feed compared to terrestrial animals [23,24]. Consequently, aquafeed ingredients originating from terrestrial animal by-products often embodies more resources than ingredients from fisheries or agriculture [8]. Furthermore, the inclusion of some ingredients such as those rendered animal by-products in aquafeeds is restricted in some parts of the world, but new regulations are now permitting some avian derived materials in the EU [7]. Other ingredients are limited by consumer perceptions, availability, and price [2,8]. Therefore, plant ingredients have become the principal alternatives to substitute fishmeal [6,10]. However, these alternatives come at a cost, as agricultural production for aquafeed ingredients (rapeseed/canola, soybean, corn, nuts, and wheat) required a land area as large as Iceland (~10 million ha) in 2008 [14]. At the same time, water demand for these aquafeed ingredients was estimated between 31–35 km3, from which 3.53 km3 was consumed for Litopenaeus vannamei production and 1.1 km3 for Penaeus monodon production [15], the two main shrimp species in aquaculture today [4]. Some argue that there is not sufficient land available for agricultural expansion, as 4.9 billion ha (which is approximately 40% of the total land surface in 2005) [25] (FAO, 2014) currently occupies 91% of the approximately 5.41 billion ha suitable for agriculture [26]. It is estimated that one-fourth of the global terrestrial surface functions as grazing land for livestock, and that animal feed crop production occupies around one-third of the global crop land [27]. This land is also under pressure by climate change [2,14] and increasing demand for food, biofuels, and bio-based materials [18,28]. Additionally, water scarcity is also expected, as agriculture consumes 70% of freshwater resources [11], which could affect feed and fish production [8,16]. The increasing production of non-ruminants such as pigs and poultry requires arable land compared to the production of ruminants such as cattle and sheep that requires grazing land, resulting in an increase in freshwater and nutrient demand for feed [29]. Additionally, the increasing use of phosphorus, which is a limiting nutrient for food production, raises concerns [23,30,31], while the combination with nitrogen in fertilizers causes eutrophication and dead zones in coastal marine ecosystems [8,31,32]. This agrifood system may therefore be reaching a scenario analogous to “Tragedy of the Commons” [33], as independent users in the form of small and medium-sized enterprises (SMEs), multinationals, and industries in a globalized market overexploit and deplete finite resources driven by self-interest and a rapidly growing world population.
An excessive dependency on the utilization of plant ingredients for aquaculture could lead to deleterious effects on the environment and indirectly impact human health by altering the nutritional value of the aquaculture products [8,14,17], likely underestimating the impacts of this feed transition. There is a lack of knowledge exchange between all involved stakeholders, the aquaculture industry, policy makers, and people depending on aquaculture for income and/or food [34]. In this respect, our principal objectives were to quantify firstly the resource implications [freshwater, land, nitrogen, phosphorus, and (wild) fish] of soybean meal inclusion to reduce the dependency of marine sources, and secondly examine the inclusion of alternative plant ingredients typically included in modern shrimp feeds, such as rapeseed meal, pea meal protein, and corn gluten meal.

3. Materials and Methods

We modeled the natural resource demands of a transition to plant-based ingredients in shrimp feed formulations. In this study, feed formulation algorithms were used to create unique feed formulations per shrimp species, with intermediate declining steps of 20% fishmeal substitution by plant ingredients while accounting for the dietary requirements of individual shrimp species. These diets were modeled in combination with a comprehensive multifactorial assessment of marine and terrestrial resource demand for agricultural crop production and processed ingredients.
The methodology for the feed formulations and data input is explained in Section 3.1. This is followed up (Section 3.2) by a detailed explanation of the marine and terrestrial resource demand dataset for each ingredient, which was based on FAO data and scientific literature. The last (Section 3.3) explains the model simulations and runs and includes an overview of the modeled feed formulations, ingredients, and their respective resource demand values (Table 1). These data are modeled in order to calculate the range in resource demands of the combined ingredients in the feed formulation with the equation explained at the end of Section 3.3. The model forming the basis of our investigation is available as an excel file in the supplementary materials.

3.1. Feed Formulations and Scenarios

We estimated the impact of fishmeal substitution with plant ingredients by developing contemporary shrimp feed diets using the feed formulation software [35] FeedSoft™ (FeedSoft Corporation, Dallas, TX, USA). This software uses linear optimization to calculate the most cost-efficient feed formulation based on dietary requirement data and global market ingredient prices. Nutrient requirement data of shrimp were obtained from the National Research Council (NRC) 2011 database [36], and global ingredient prices were obtained from the International Hammersmith Commodity Index Database [37]. These prices fluctuate; therefore, we selected the commodity prices of September 2018 and converted them to Euros (€) for input into the FeedSoft™ feed formulation software.
We developed feed formulations for the two most dominant species in shrimp farming, namely Litopenaeus vannamei (whiteleg shrimp) with a share of 76.1% of the total shrimp production volume in 2017, and Penaeus monodon (black tiger shrimp), which covers the second biggest share estimated at 12.5% [4,38]. Traditional shrimp feed formulations include between 20% and 30% fishmeal [39], where 30% was commonly applied for P. monodon [40]. Fishmeal inclusion differs per species because P. monodon is more carnivorous than L. vannamei, thus requiring higher protein contents in their diets (36–42% for P. monodon and 18–35% for L. vannamei) [41]. Therefore, we set baseline fishmeal inclusions at 20% for L. vannamei and 30% for P. monodon. In total, we developed 24 feed formulations for the two species [L. vannamei (LV) and P. monodon (PM)] and two scenarios [common-plant scenario (LV1, PM1) and alternative-plant scenario (LV2, PM2)]. Each combination of species and scenarios contained six feed formulations with intermediate steps of 20% fishmeal substitution by plant ingredients (Section 3.3; Table 1). For simplicity, we excluded the inclusion of animal by-products or novel ingredients in the feed formulations, as their use is often limited by consumer perceptions, availability, and price [2,8].
The first scenarios consisted of a “common-plant scenario”, which was driven by economic incentives and included plant ingredients with the lowest possible price, while the second scenario “alternative-plant scenario” excluded economic incentives and included alternative plant ingredients suitable for fishmeal substitution based on their nutrient profile. The “common-plant scenario” used mainly soybean (Glycine soja) meal to substitute fishmeal, as this crop is widely available, economically attractive [2,11], and considered a nutritious plant ingredient with high levels of protein and balanced amino acids [6,10]. The alternative-plant scenario substituted fishmeal with ingredients such as pea (Pisum sativum; Pisum arvense) protein concentrate, rapeseed (Brassica napus) meal, corn (Zea mays) gluten meal, and corn (Zea mays) oil. In order to create this scenario, we adjusted the prices of the ingredients in the feed formulations to be relatively lower than both fish and soybean meals, as their inclusion is not driven by economic incentives as in the common-plant scenario. However, based on nutrient profiles and protein content, these ingredients showed potential to substitute significant proportions of fishmeal in aquafeed [10]. These scenarios combined provided a comprehensive range of suitable plant ingredient options as fishmeal substitutes that are within the inclusion range of contemporary feeds and inclusive of future trends in commercial shrimp diet formulations. Therefore, the limits for plant feed ingredient incorporation were carefully selected on this basis, and our rationale for trending from high fishmeal to low fishmeal emulated current practice in many countries farming shrimp. It should be noted that these formulations support optimum growth and development of both shrimp species with much supporting literature [42,43]. The twenty-four developed feed formulations per species and scenarios are included in the model and listed in Table 1 (Section 3.3).
In order to ensure reliability of the model, we compared and observed similarities with the prices of our developed feed formulations and the indicative prices per ton of feed in Asia ($700–1100), China ($450–800), India ($844–956), and the Philippines ($876–967) [41,44].

3.2. Resource Demand Values

The resource demand of the feed formulations was calculated for the most relevant marine and terrestrial resources used to produce and process feed ingredients. Feed mixing and extrusion practices are not included in the model because their application and respective resource demand in global aquafeed production is relatively unknown. These practices could be applied in either small scale feed mills, locally at aquaculture farms, or produced in large scale factories [45]. However, all these practices are applied in range of different aquafeed formulations with or without high inclusions of fishmeal. Therefore, including an estimation of resource demand for feed mixing and extrusion would introduce an unnecessary variable when looking at the resource trade-offs of fishmeal substitution by plant ingredients, as shrimp diets are compared with each other. Therefore, the variables used in the model are primarily focused on the production and processing phase of the aquafeed ingredients.
Some ingredients, meals, and concentrates are directly processed from crops with associated losses. Therefore, we introduce average yields (%) from crops in order to gain insight into the amount of raw materials/crops needed to produce a certain ingredient. The yields of crop from processed ingredients such as soybean, rapeseed meal, and pea protein concentrate are 80% [46], 53% [47], and 25% [48], respectively. This means, for example, that in order to make pea protein concentrate, four times the amount of pea needs to be produced, which has a significant impact on the resource demand of pea protein concentrate. Therefore, average yields of crops were included in the model to gain insight into the resource demand of crop ingredients typically used in aquafeeds.
Conversely, some ingredients such as corn gluten meal and corn oil are not the result of direct concentrate processing but, for example, derived from regular corn processing into gluten feed, gluten meal, oil, and starch using the wet milling process [10]. However, corn gluten meal (5.2%) and corn oil (3.4%) represent only a small share of the total output of the wet milling process [46]. This means that the amount of resources for corn production needs to be allocated to corn gluten meal and corn oil in order to gain insight in their respective resource demands relative to corn production. This was calculated by multiplying the fraction of each ingredient (relative to total mass of all final products) with the total resource demands of corn production. This methodology is commonly used in life cycle assessment of both physical products and energy content [49,50]. We preferred to apply resource allocation by end-product mass over allocation by economic value, as economic value tends to change over time and therefore would introduce a changing variable in the resource demand values dataset (Table 1). Allocation of crop ingredients was included in the model, and their respective resource demand values are listed in Table 1 (Section 3.3).
Water: Water demand for crop production and processing of ingredients is globally variable, and different types of water demand are distinguished, namely green, blue, and grey water. Green water footprint refers to consumed rainwater, blue water footprint refers to the consumed or evaporated volume of surface and groundwater, and grey water footprint takes the volume of freshwater into account that is needed to process and neutralize certain pollutants. The global average freshwater demand per feed ingredient was obtained from Chatvijitkul et al. [46]. The green, blue, and grey water demands for crop production and processing were obtained from Mekonnen & Hoekstra [51] from 1996 until 2005 and their totals compared (combined green, blue, and grey water demands) with the values described in Chatvijitkul et al. [46] in order to verify their reliability. The total water footprint per hectare for wheat (Triticum aestivum; Triticum durum; Triticum spelta), soybean, corn oil, and rapeseed were presented in Chatvijitkul et al. [46]. Additionally, the total water demand for corn gluten meal and processing of fish oil and fishmeal were obtained from Chatvijitkul et al. [46] based on estimates and FAO data [52]. Water demand (green, blue, and grey) for corn gluten meal was calculated by combining water demand for corn production [51] with resource allocation by end-product mass while adding up the estimated water demand (80 m3/MT) for processing [46]. These resource demand values per ingredient were included in the model and are listed in Table 1 (Section 3.3).
In order to ensure the reliability of the model, water demand totals of the developed feed formulations for L. vannamei and P. monodon (baseline fishmeal inclusion, scenario common-plant) were compared with the resource demands described in Chatvijitkul et al. [46] of 819–1666 and 809–1542 (m3/MT). The model results for the baselines fit well in these ranges.
Land: Crop yields influence the area of land needed to produce feed ingredients. We selected the top five global producers for wheat, soybean, rapeseed, and pea based on Table 1 from Fry et al. [14], as these producers dominate the global market (>50%) and are therefore the most likely producers of the ingredients necessary for the plant-based aquafeed. FAO data was obtained through the Factfish research platform [53], and we calculated the average land requirement (ha/MT) over a period from 2007 until 2016 for each of the top five global producers per crop ingredient. Subsequently, the five average land requirements per ingredient were combined with the global production share of each producer to calculate the global weighted average land requirement per ingredient. Global weighted average land requirement per ingredient is defined as mean and listed in Table 1 (Section 3.3). However, as land demand differs among the top five producers per ingredient, range bars in the graphs were used to establish a likely range of land demand required for the combination of ingredients in the feed formulations depending on the source locations of the ingredients. The range of land demand per ingredient based on the top five producing countries was entered in the model and can be found in Table 1 (Section 3.3).
To ensure the reliability of the model, the global average land requirement (ha/MT) from Chatvijitkul et al. [46] were compared to the range (min-max) of the average land requirement (2007–2016) for soybean, corn, wheat, and rapeseed of the top five producing countries. Additionally, we compared the model results (baseline fishmeal inclusion, scenario common-plant) with the ranges in land demand for shrimp feed for L. vannamei and P. monodon (0.115–0.352 and 0.187–0.314 ha/MT, respectively) from the paper of Chatvijitkul et al. [46]. The model results for the baselines fit well in these ranges.
Nitrogen and phosphorus: As fertilizer use such as nitrogen and phosphorus differs globally, we used the values of the fertilizer application per hectare from the top five global producers of the main crops used in aquafeed. First, the weighted average of fertilizer application in kilogram per hectare was calculated for each of the top five producing countries for soybean, rapeseed, and corn. We used fertilizer application data from 2001 until 2010 [54]. The global average fertilizer application for pea was obtained from FAO [55]. While soybean and pea are capable of fixing atmospheric nitrogen, FAO [55,56] recommends adding nitrogen for the early growth phase. Because of this, a value for added nitrogen for both soybean and pea was included in the model. Nitrogen and fertilizer application ranges for wheat was calculated based on data from The World NPK model [57], which shows fertilizer application rates per country (2007–2008). The ranges (min-max) for the top five producing countries for nitrogen and phosphorus application per crop ingredient were compared to the global average phosphorus and nitrogen rates per hectare to assess the reliability of data for soybean [56], corn [46,58], pea [55], and wheat [59]. Additionally, the global average fertilizer application from the World NPK model was used to validate the ranges of the data for soybean, corn, and rapeseed [57].
We chose to compare the resource demands of the different diets per metric ton (MT), and therefore a conversion from fertilizer application rates per hectare to fertilizer demand (kg) per metric ton (MT) of crop production was required. Therefore, the fertilizer application (kg/ha) was multiplied with the land requirement (ha/MT) ranges per ingredient in order to gain insight into the range of fertilizer demand (kg) per metric ton (MT) of shrimp feed. As phosphorus and nitrogen application differs among the top five producers per ingredient, range bars in the graphs were used to establish a likely range of phosphorus and nitrogen demand (kg/MT) required for the combination of ingredients in the feed formulations depending on the source locations of ingredients. The range of fertilizer demands per ingredient based on the top five producing countries was entered in the model and can be found in Table 1 (Section 3.3).
A comparison with the paper of Chatvijitkul et al. [46] was made in order to check the reliability of the conversion from fertilizer application in kilogram per hectare (kg/ha) to fertilizer demand (kg) per metric ton (MT) of crop ingredient production. Therefore, we compared the model results (baseline fishmeal inclusion, scenario common-plant) with the resource demand ranges of the diets of L. vannamei and P. monodon: 3.93–13.39 and 3.97–11.12 (kg/MT) for nitrogen, 1.29–3.54 and 2.13–5.01 (kg/MT) for phosphorus, respectively, described in Chatvijitkul et al. [46]. Higher values of phosphorus and nitrogen were observed in the analysis compared to the resource range from Chatvijitkul et al. [46] as a result of the exclusion of the use of animal by-products in the model and a different approach to the calculation of nitrogen and phosphorus demand values and resource allocation.
Fisheries: The demand for wild caught or so-called forage, reduction, or feed fisheries needed to produce both fishmeal and fish oil differs globally depending on the species, size, and season [12,23] and the inclusion of by-products (discards, trimmings, and offal from fishery processing) [7]. We acknowledge that fishmeal and fish oil production are inseparable and that the need for forage fish by the shrimp industry is mainly driven by fishmeal demand, while the need for forage fish for salmon feed is mainly driven by the demand for fish oil [6,23,60]. Applying the methodology of Jackson [60] would be more accurate from a global perspective in terms of fish demand because it calculates the need for marine ingredients for a combination of different aquaculture production and species with different fishmeal and fish oil demands. This means that, for example, a surplus of fishmeal from salmon feed production could be used for the shrimp industry [60]. However, the method of Jackson (2009) [60] has been criticized by Kaushik and Troell [61], who state that the addition of both the fishmeal and fish oil yields in the denominator is “somewhat questionable both from arithmetic and from a nutritional point of view”. Nevertheless, we only consider the shrimp industry in this study and calculated the demand for fish to produce fishmeal and fish oil separately. Therefore, this oversimplification may not allow for the dual sourcing of fish for each component and could result in an overestimation of the need for fish resources but is considered a practical scenario given the current ratios advocated in the literature [7]. Therefore, global fishmeal and fish oil production statistics were obtained from scientific literature [7]. This was incorporated in the model as the minimum, mean and maximum resource demand values, as shown in Table 1 (Section 3.3). These values establish a likely range of fish demand (MTfish/MTfeed) required for the production of both fishmeal and fish oil in the feed formulations depending on the source of the ingredients.
In order to ensure reliability of the model, we compared our model results (baseline fishmeal inclusion) with the fish demand ranges of the diets of L. vannamei and P. monodon: 270–1350 and 585–1935 (kg/MT), respectively, described in Chatvijitkul et al. [46]. The model results for the baselines fit well in these ranges.

3.3. Model Simulations and Runs

As introduced in Section 3.1, the model ran six feed formulations per species and scenario with intermediate fishmeal substitution by plant ingredients. A total of 24 feed formulations and their unique ingredient compositions and ranges in resource demand values (Table 1) should provide insight into the impact of fishmeal substitution on marine and terrestrial resources.
As introduced in Section 3.2, a shared common data set of multi-factorial resource demand was developed and used per ingredient for each feed formulation to account for the global variety of resource demands by crops and its derived ingredients (Table 1; Resource demand values). The range for land demand and fertilizer application per crop ingredient was based on data for the top five producing countries. Their incorporation in aquafeed shows a high probability and therefore calculates a reliable range in land and fertilizer demand for the production of each crop derived ingredient. This results in three resource demand simulations (min, mean, max) per feed formulation for each impact indicator [land, phosphorus, nitrogen, and (wild) fish]. Water demand also contains three resource demand simulations, but this is the result of categorization of type of global water use (green, blue, grey) based on global averages rather than the range of water demand of different countries. Fish demand also contains three resources demand simulations based on ranges of fish demand for fishmeal and fish oil production from scientific literature.
The following equation was used to calculate the range in resource demands (freshwater, land, phosphorus, nitrogen, and fish) of the combined ingredients in the feed formulation. For each ingredient, the fraction in the feed was multiplied with the specific resource demand, and the different ingredients impacts were summed. The resource demands were calculated per ton (MT) of feed.
TRDR,M,X,S,P = Σ(FI,X,S,P × RDR,I,M)
TRDR,M,X,S,P: Total Resource Demand of resource R [fish (MTfish/MTfeed), freshwater (m3/MT), Land (ha/MT), phosphorus (kg/MT), or nitrogen (kg/MT)] for the indicator value M (Minimum, Mean, or Maximum) at fishmeal inclusion X (%) for species S (L. vannamei, P. monodon) in plant inclusion scenario P (1: common-plant or 2: alternative-plant)
FI,X,S,P: Fraction (%) of ingredient I at fishmeal inclusion X (%) for species S in scenario P.
RDR,I,M: Resource Demand on resource R of ingredient I for indicator value M.

4. Results

This study modeled different sets of shrimp diets in combination with a comprehensive multifactorial assessment of marine and terrestrial resource demand for agricultural crop production and processed ingredients. The resource implications [freshwater, land, nitrogen, phosphorus, and (wild) fish] as a result of incremental fishmeal substitution by plant ingredients are presented in the following sections. The main results are shown in absolute and relative numbers, which puts emphasis on the relative (%) change in resource demand as a result of complete fishmeal substitution with plant ingredients, highlighting the trade-offs between marine and terrestrial resources.

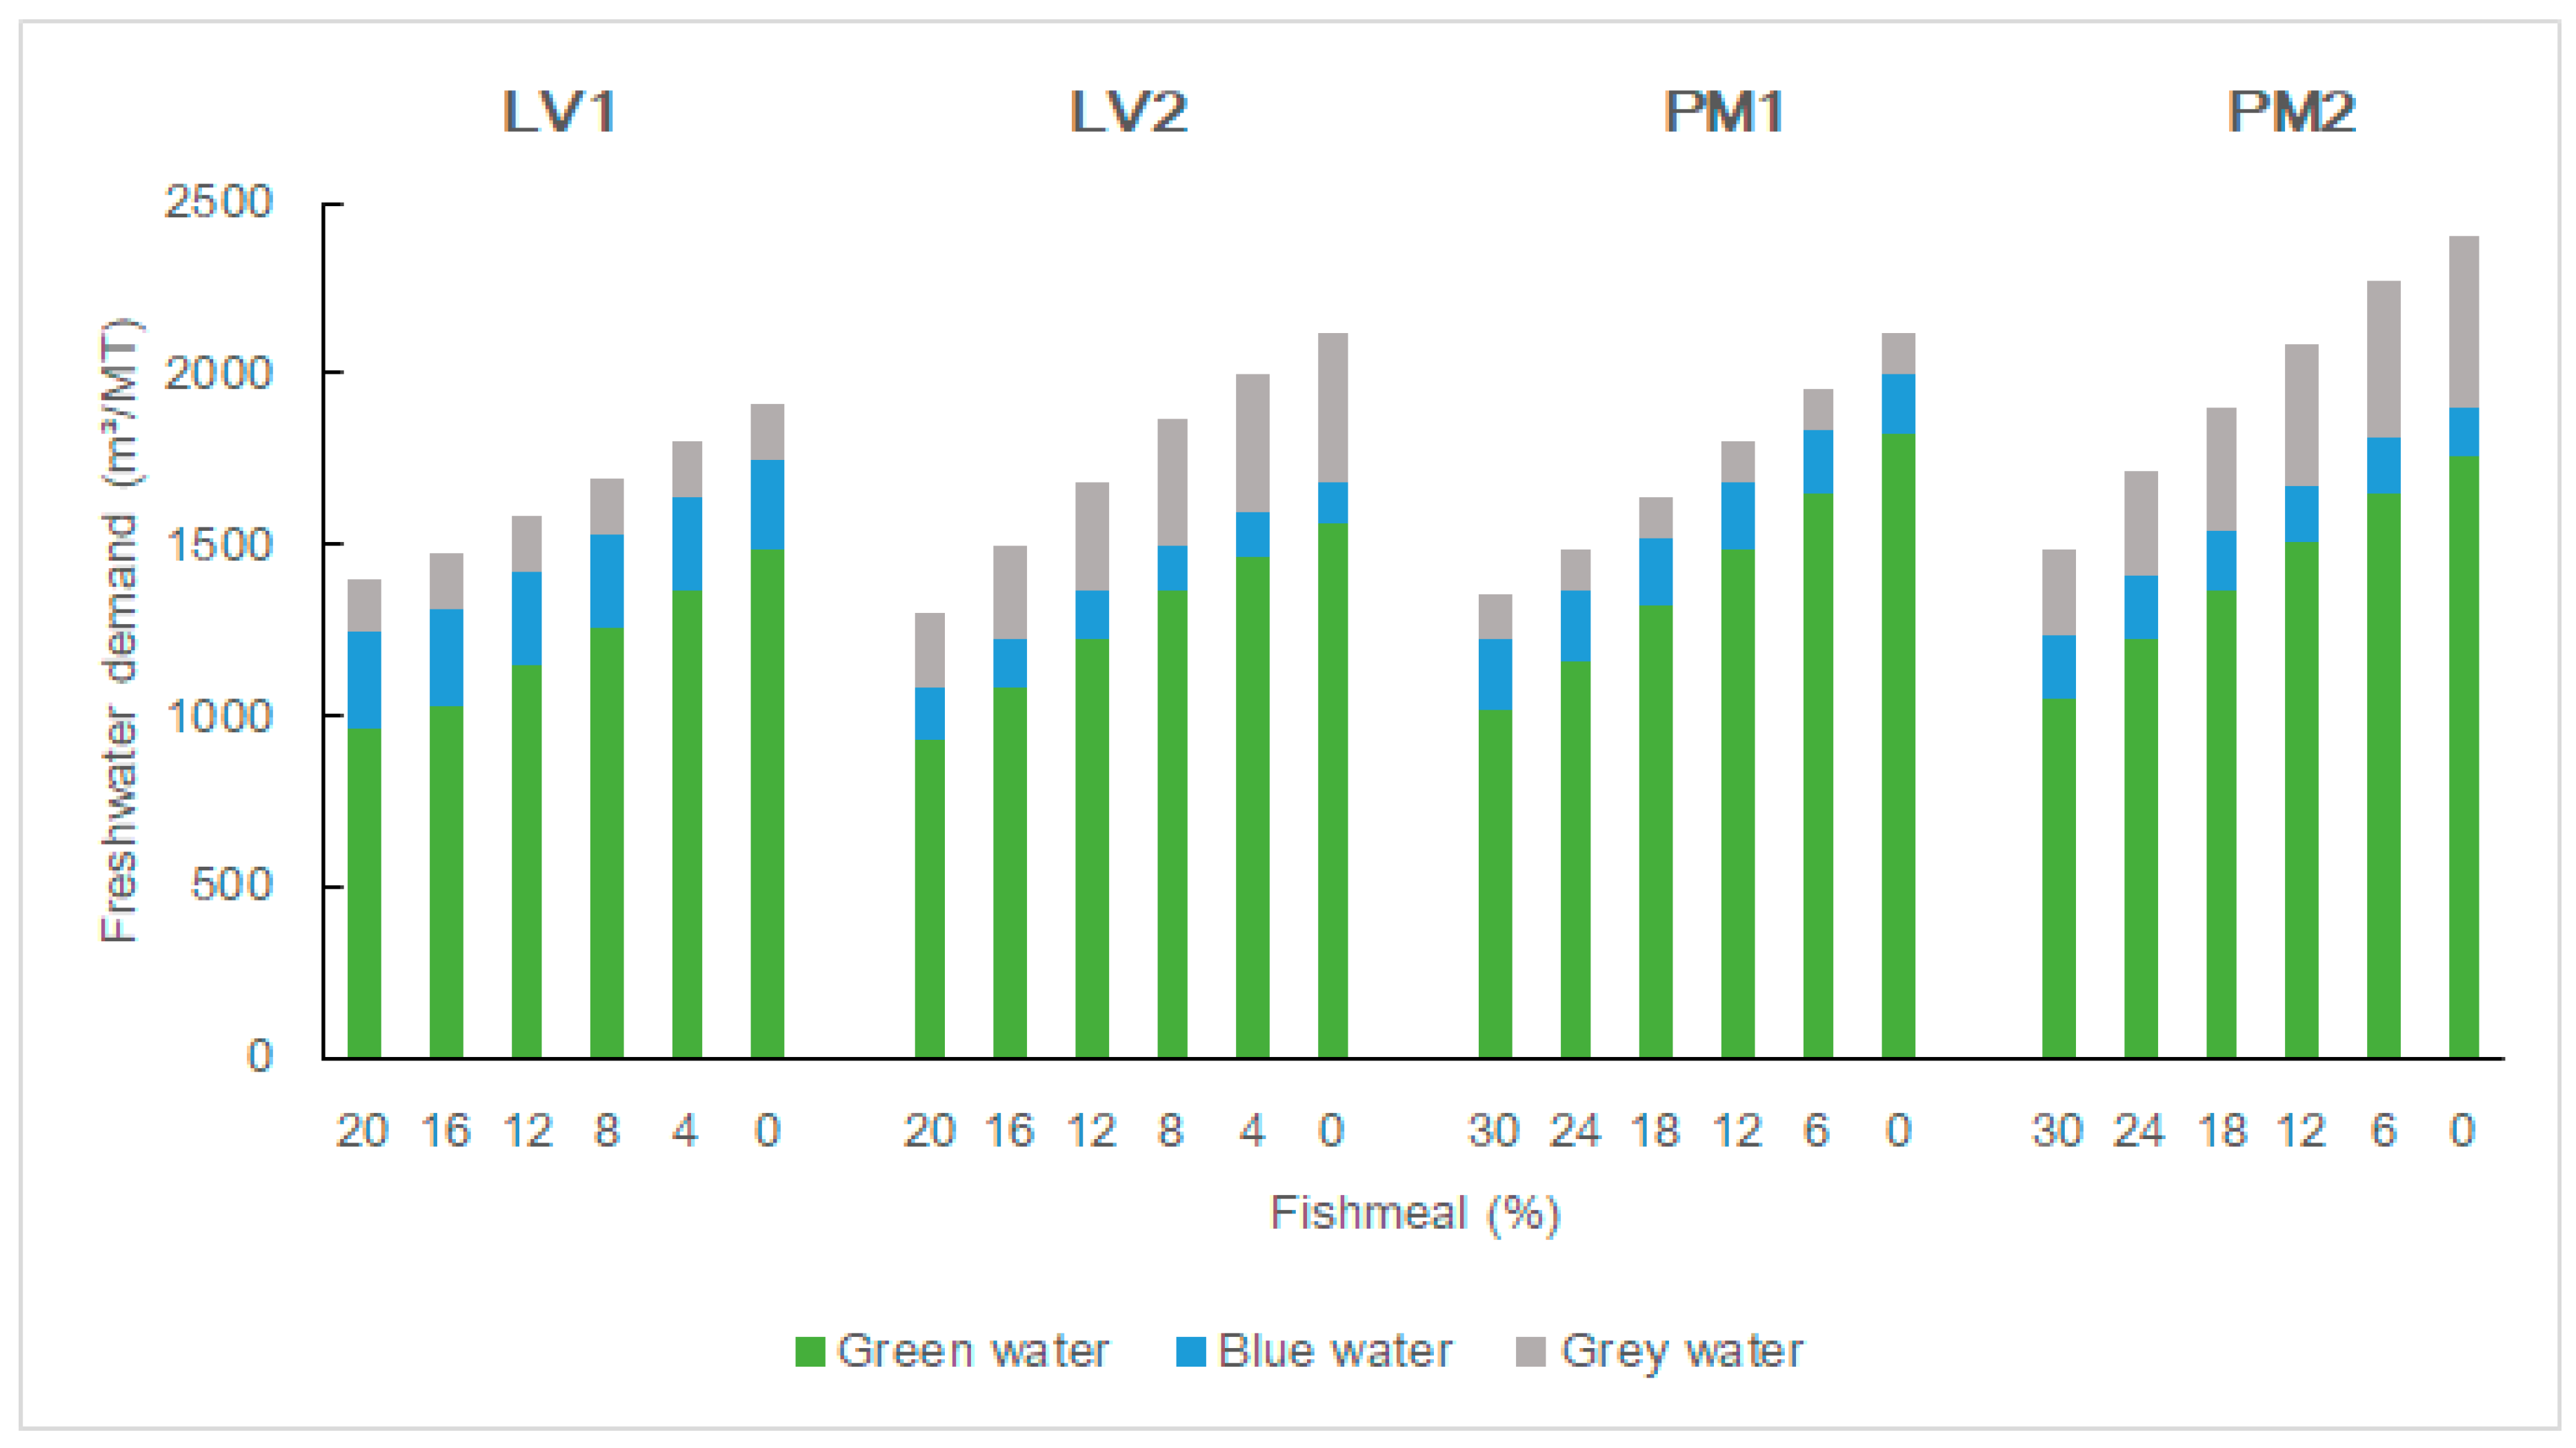
4.1. Freshwater Demand

Substitution of fishmeal by plant ingredients directly increased the pressure on freshwater resources, for both species and scenarios (Figure 1). As a result of a complete fishmeal substitution, freshwater demand increased strongest for LV2 approximately by 63% from 1298 m3/MT to 2118 m3/MT. PM1 and PM2 showed a respective increase of 57% (1354–2119 m3/MT) and 62% (1485–2402 m3/MT), while the freshwater demand for LV1 increased by 37% (1401–1915 m3/MT). The share of green water demand in the common-plant scenario increased from 69% to 77% for LV1, with respective increases of 75% to 86% for PM1. In the alternative-plant scenario, this increase in green water demand was lower, with an increase of two percentage points for both LV2 and PM2. However, in this scenario, an increasing share of grey water was observed of three percentage points for LV2 and four percentage points for PM2.

4.2. Land Demand

Mean land demand in a 0% fishmeal inclusion for common-plant scenario for both species was slightly more than half that of the alternative-plant scenario, approximately 0.33 (LV1) and 0.38 (PM1) ha/MT and 0.76 (LV2) and 0.65 (PM2) ha/MT (Figure 2). Land demand for crop production increased in all scenarios with significant differences between LV and PM. Average land demand rose strongest for PM from 0.23 ha/MT to 0.38 ha/MT (67%) in the common-plant scenario and from 0.36 ha/MT to 0.65 ha/MT (81%) in the alternative-plant scenario. Although land demand was highest for LV2 at 0% fishmeal inclusion (0.76 ha/MT), the increase in mean land demand was relatively lower for LV in both scenarios with 42% (LV1) and 40% (LV2).

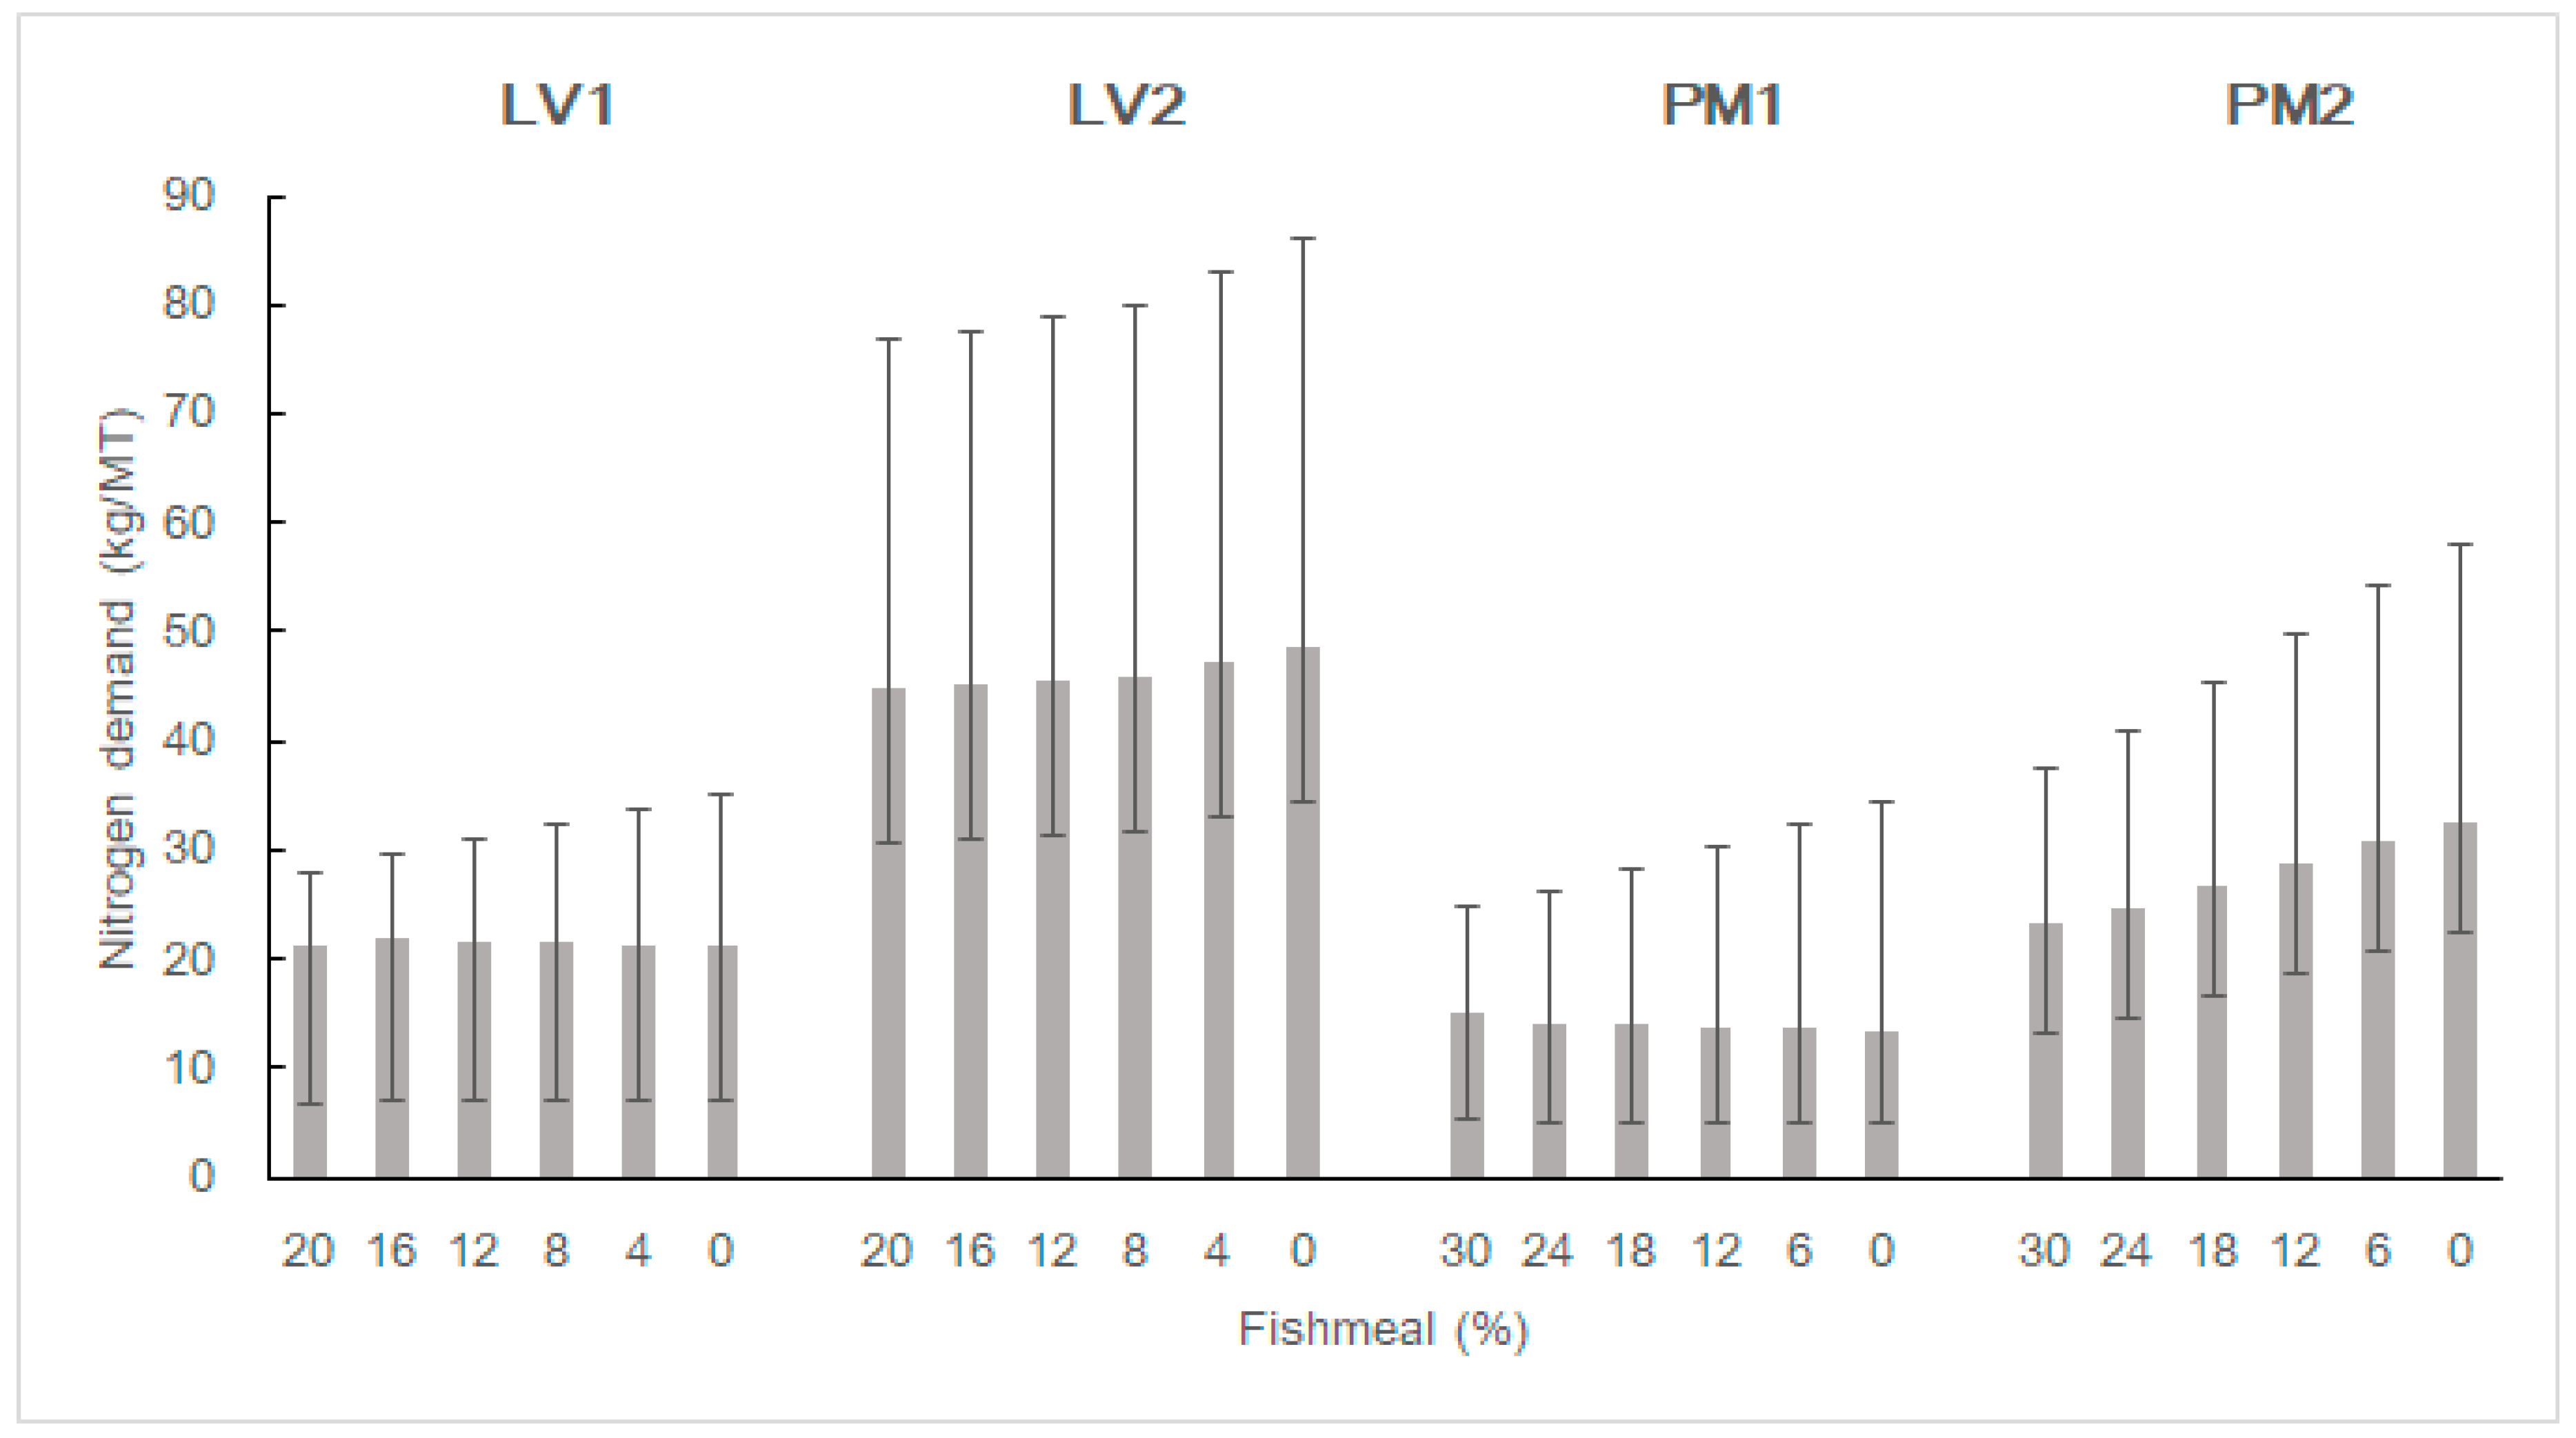
4.3. Nitrogen Demand

Mean nitrogen demand in a 0% fishmeal inclusion for the common-plant scenario was relatively lower compared to the alternative-plant scenario, approximately 21 kg/MT (LV1) and 13 kg/MT (PM1) and 49 kg/MT (LV2) and 32 kg/MT (PM2) (Figure 3). Mean nitrogen demand increased in the alternative-plant scenario by 9% (45–49 kg/MT) and 39% (23–32 kg/MT) for LV2 and PM2, respectively. On the other hand, nitrogen in the common-plant scenario showed no change (+0.1%) for LV1 and a decrease of 12% in PM1. In general, considering the variability in the model estimates, nitrogen demand was relatively stable in the common-plant scenario and showed an increase in demand in the alternative-plant scenario.

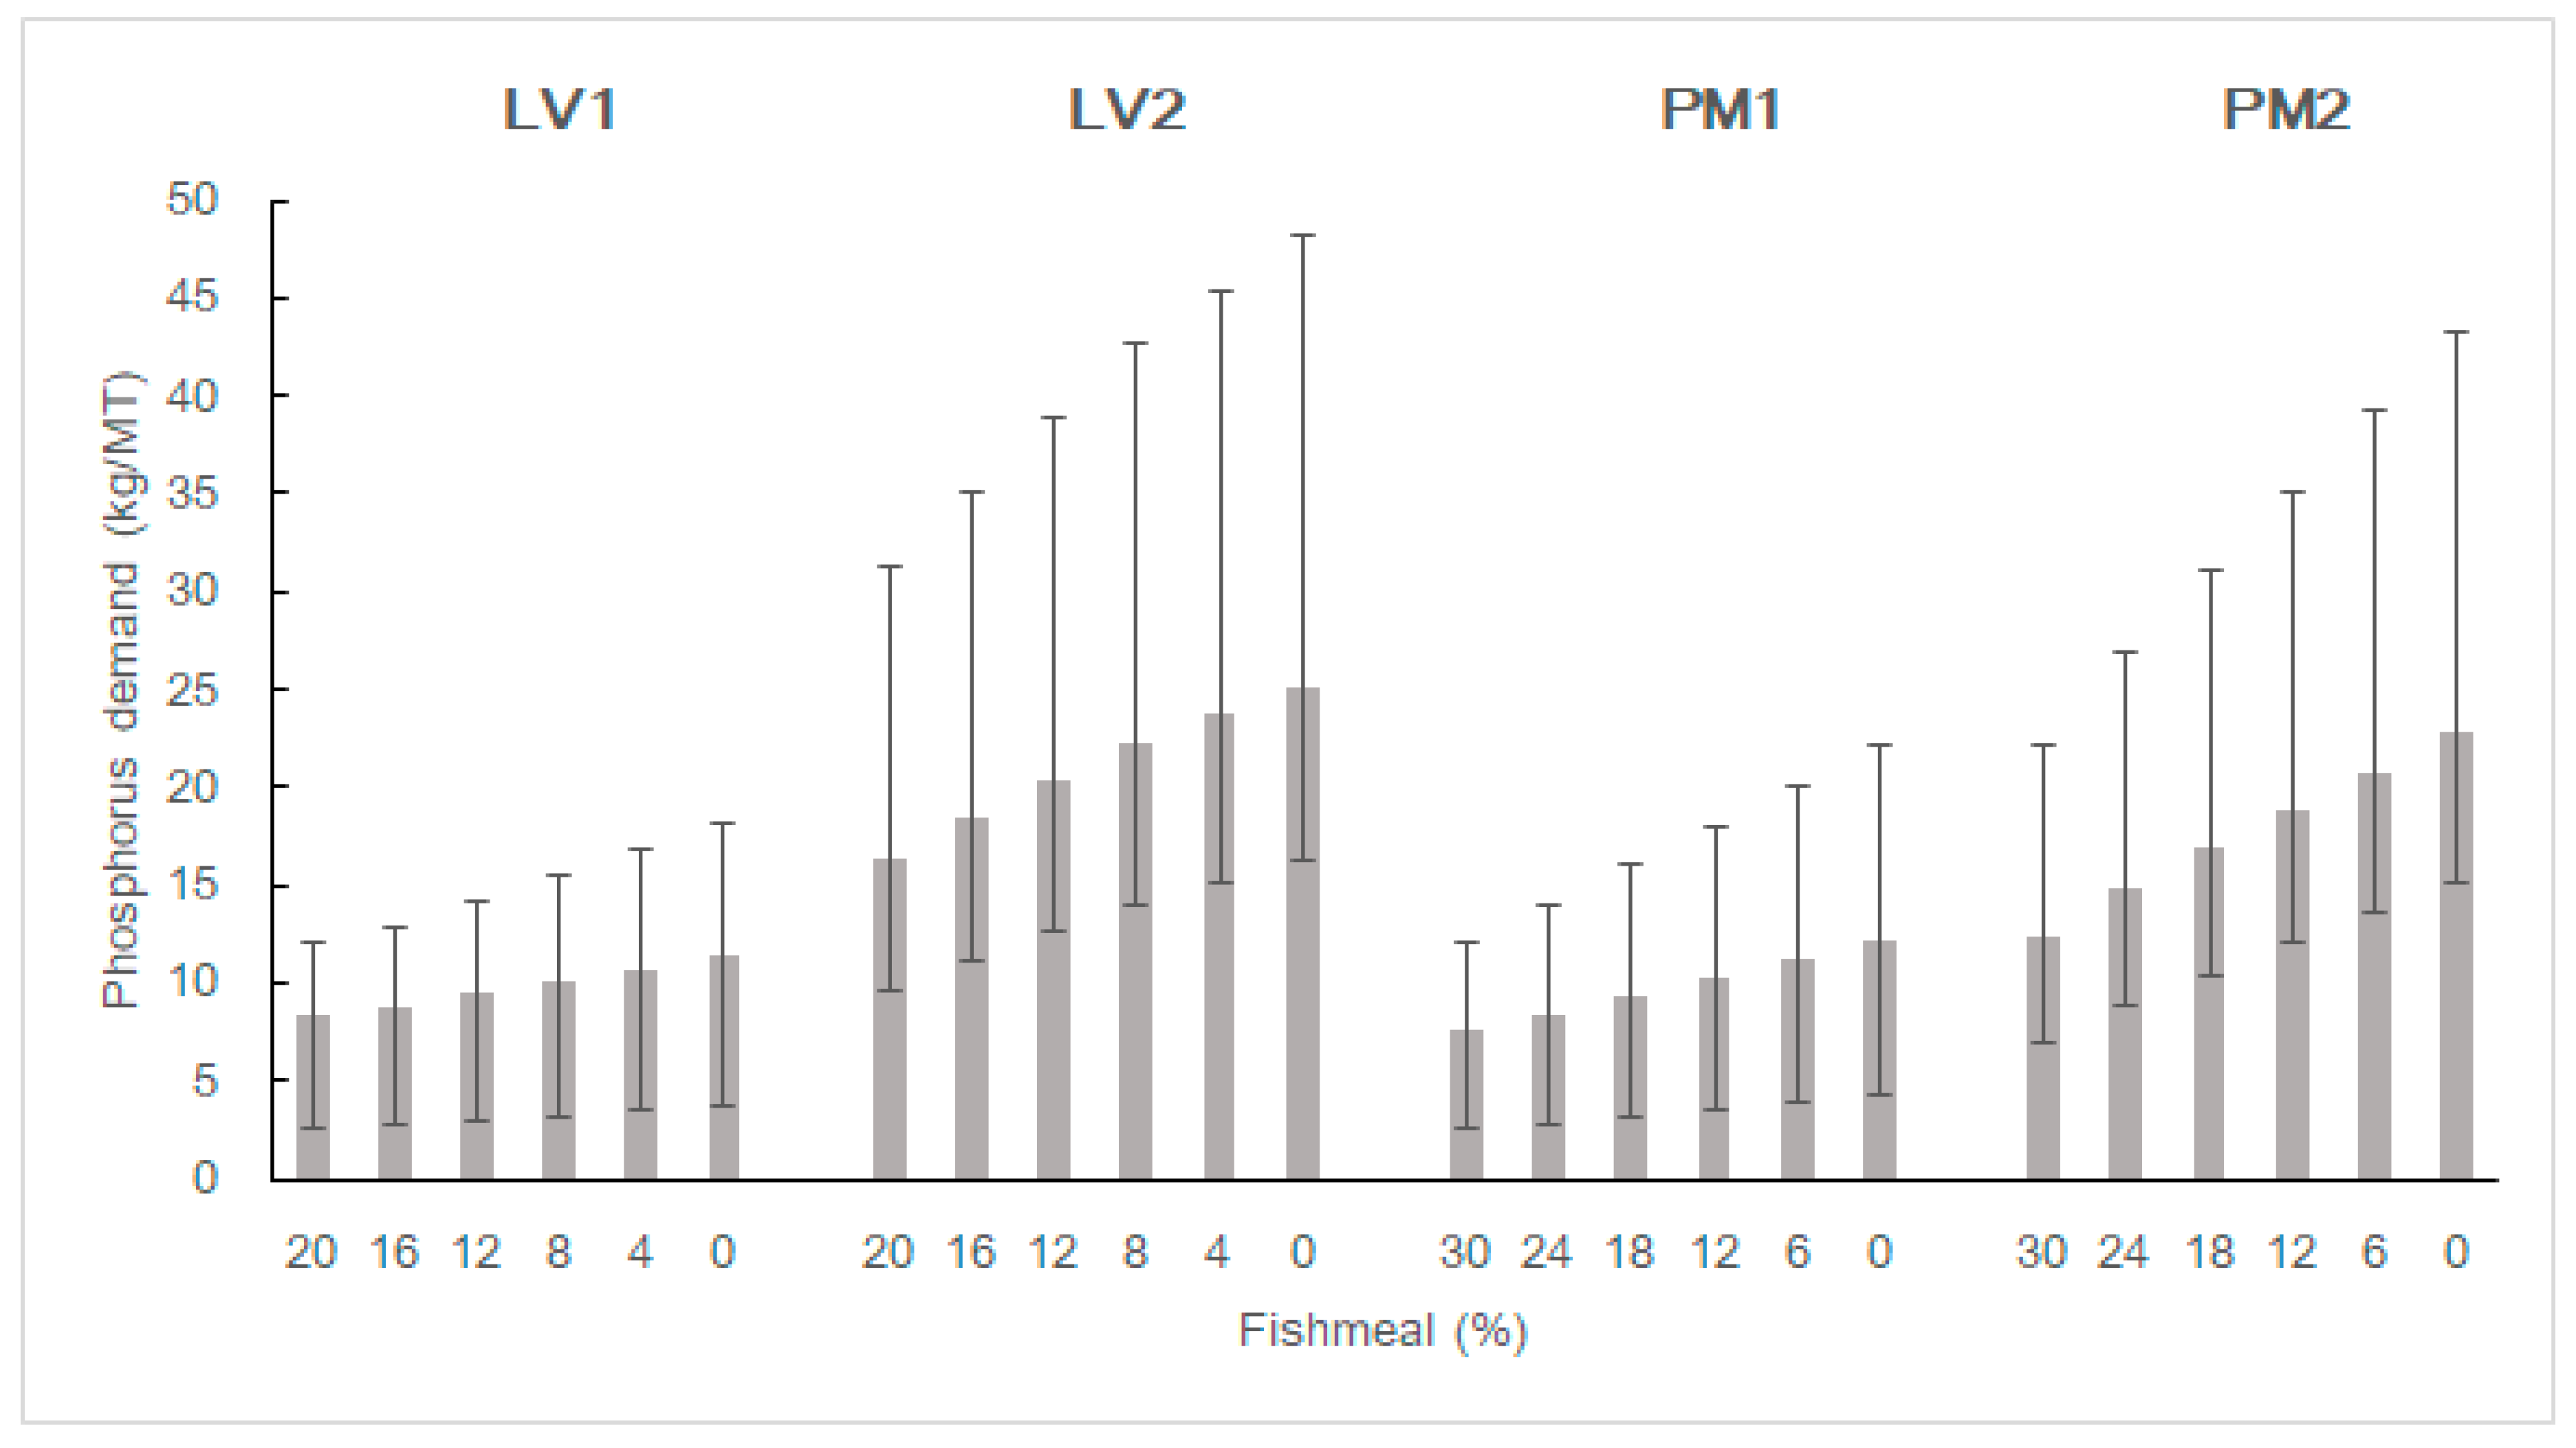
4.4. Phosphorus Demand
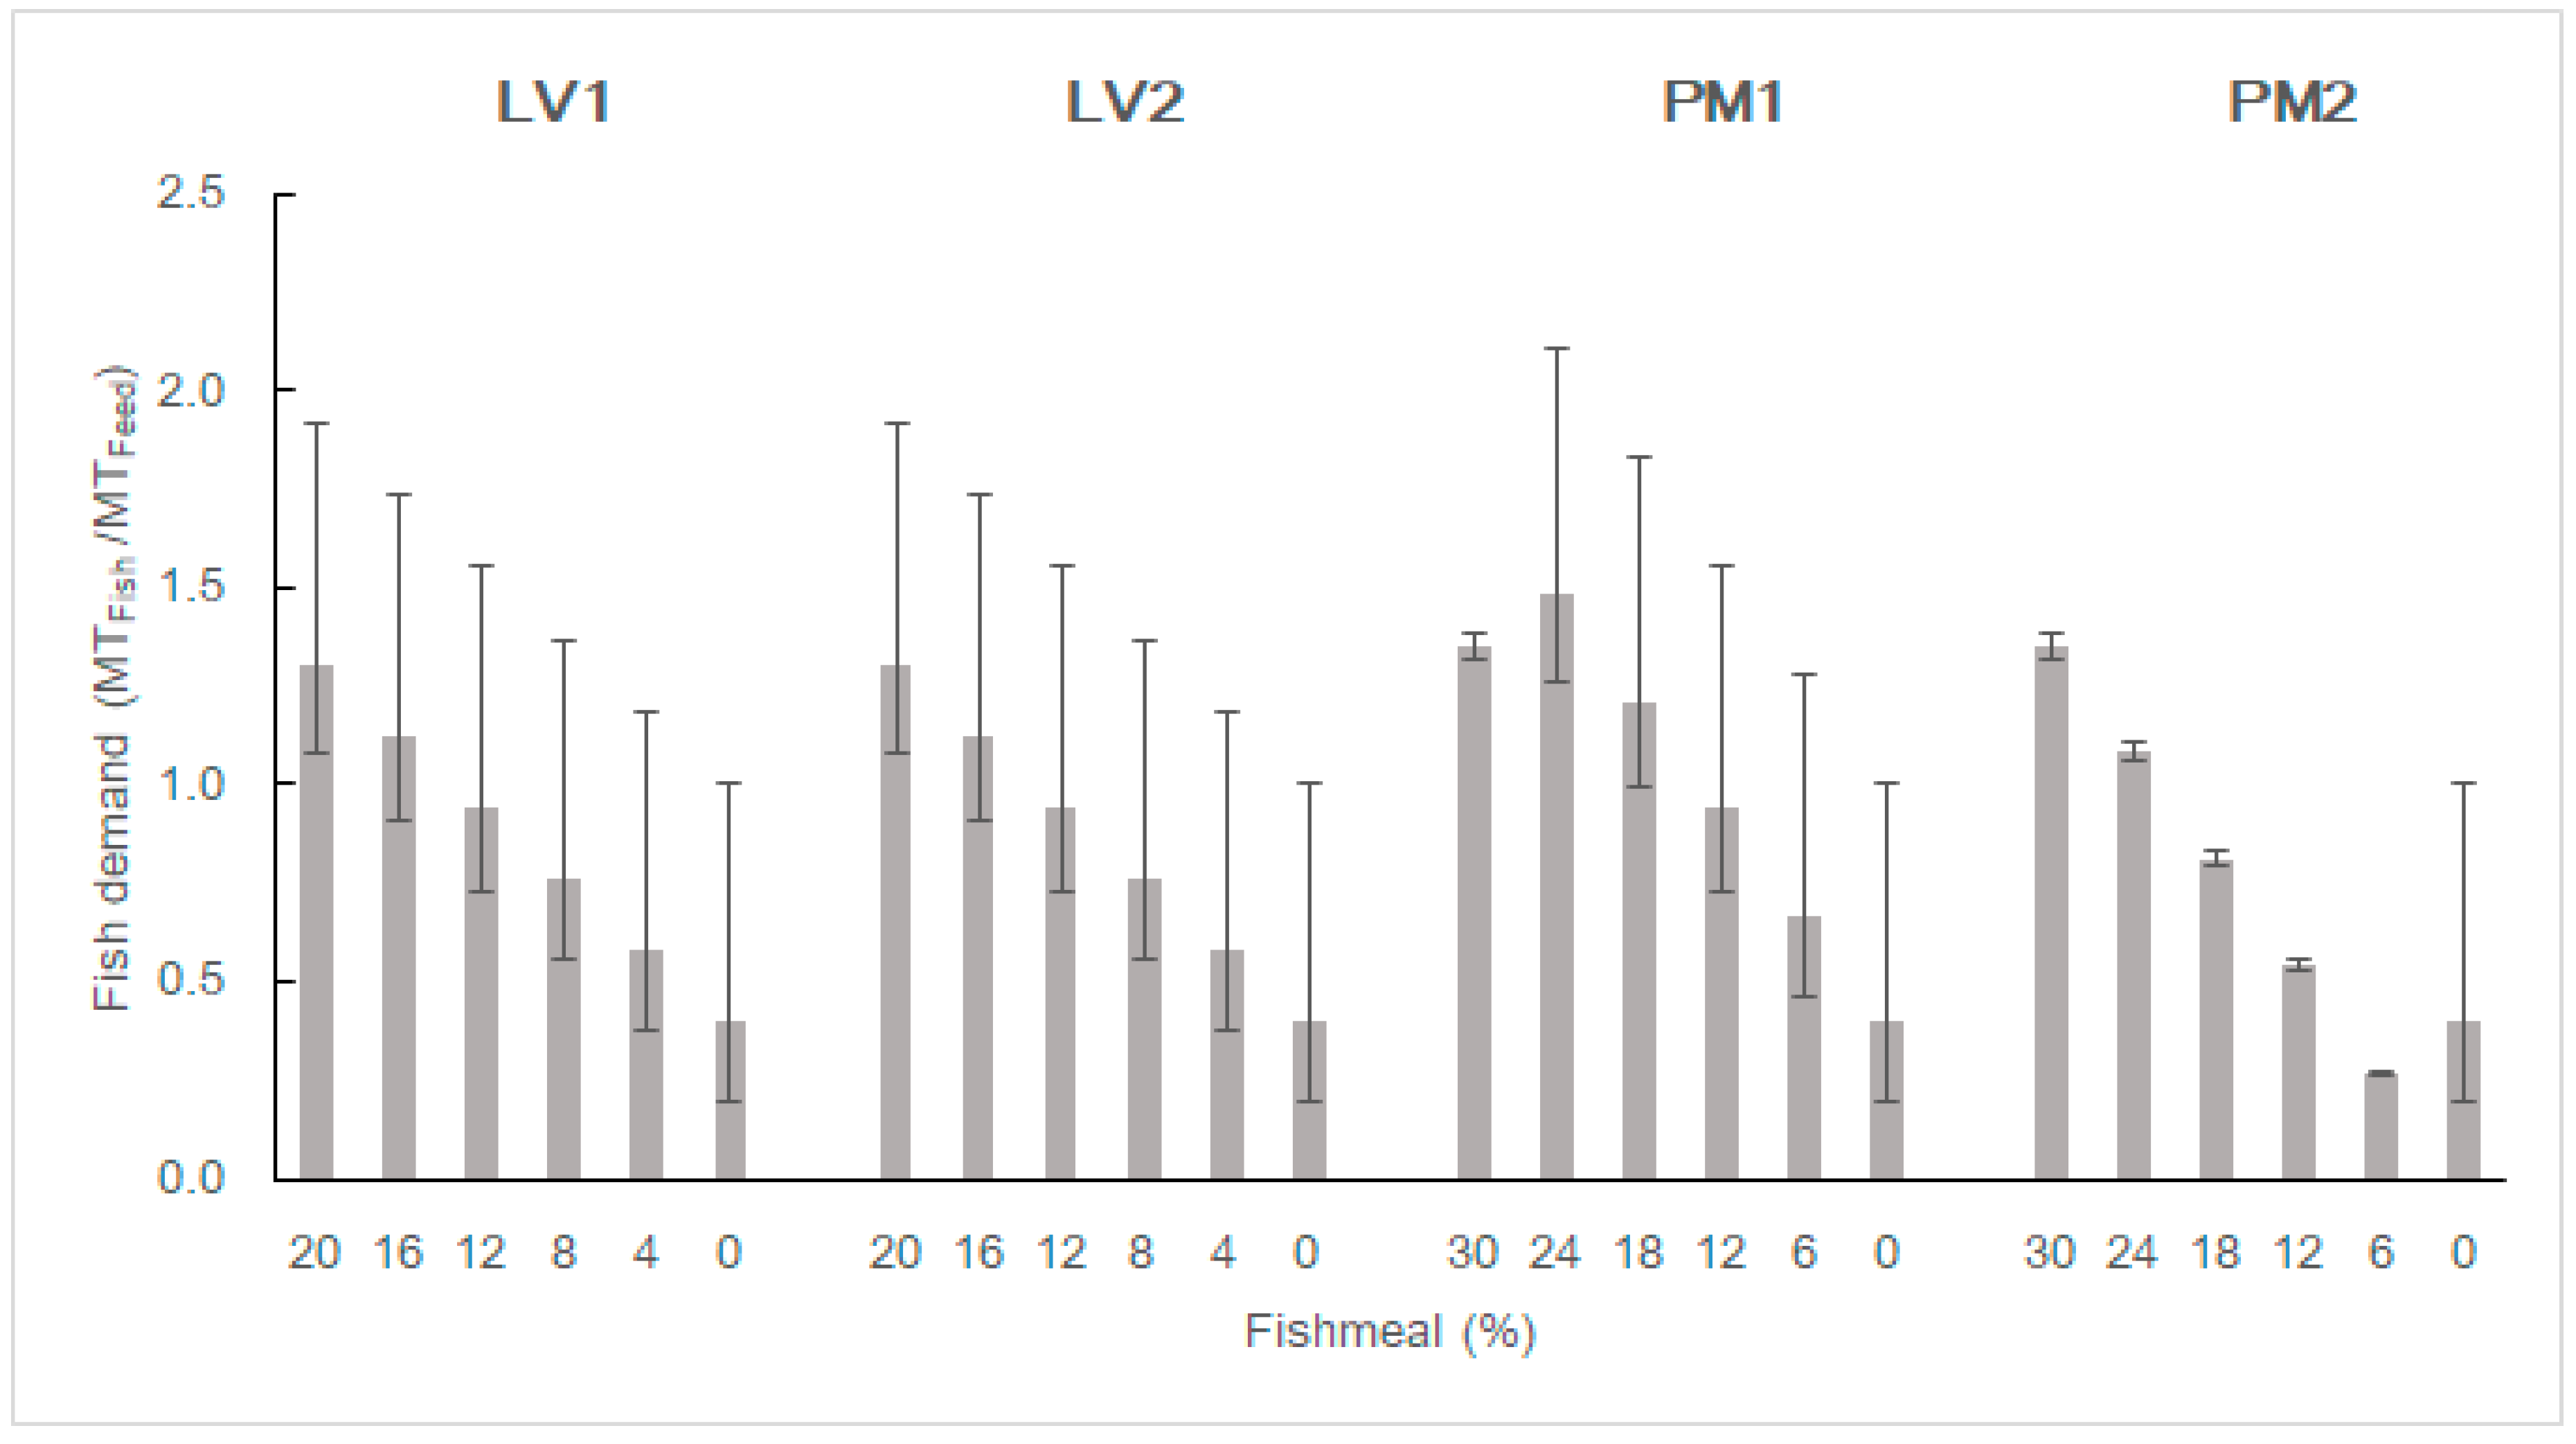
Mean phosphorus in a 0% fishmeal inclusion for the common-plant scenario was relatively lower compared to the alternative-plant scenario, approximately 11 kg/MT (LV1) and 12 kg/MT (PM1) and 25 kg/MT (LV2) and 23 kg/MT (PM2) (Figure 4). Mean phosphorus demand rose strongest (approximately 83%) for PM2 with an increase from 12 kg/MT to 23 kg/MT. Minimum phosphorus demand showed an increase in the common-plant scenario for both shrimp species, from 2.6 kg/MT to 3.7 kg/MT for LV1 and 2.5 kg/MT to 4.2 kg/MT for PM1.

4.5. Fish Demand

Demand of fish declined by approximately 70% to a value of 0.4 MTfish/MTfeed for both species and scenarios (Figure 5). Initial fish demand for both shrimp species were quite similar, even with a difference in initial fishmeal inclusions. LV showed in both scenarios a linear decrease, while PM1 under the common-plant scenario showed an increase from 1.35 until 1.48 MTfish/MTfeed (+9.6%) for fishmeal inclusions between 30% and 24%. On the other hand, PM2 under the alternative-plant scenario showed a decrease in the demand of fish with the exception of fishmeal inclusions between 6% and 0%, where an increase in fish from 0.27 until 0.4 MTfish/MTfeed was observed. Additionally, the model predicted a large variability in fish demand among the different feed formulations.

5. Discussion

5.1. The Sustainability Conundrum of Fishmeal Substitution

There is an obvious global strategy to find alternatives to the use of finite fish resources in the formulation of aquafeeds by using mainly plant ingredients. Our results show that although this strategy serves to mitigate marine protein and oil dependency, when used as a sole substitute, it shifts pressure to terrestrial resources. The modeling results show the intensity of the added pressure on freshwater, land, and fertilizer, highlighting a shift in pressures in the longer term for using higher inclusions of plant ingredients in aquafeed. The continuing trend of increased inclusion of terrestrial plant-based ingredients may lead to competition for land, causing social and environmental conflicts, which may in turn affect the resilience of the global food system [14,16,17].
Increasing production of terrestrial plant-based ingredients requires land, fertilizer, and freshwater resources [13,14,15]. On a species level, freshwater demand at 0% fishmeal inclusion (all fishmeal was substituted by plant-based ingredients) was relatively higher for P. monodon in both scenarios compared to L. vannamei as a result of the higher inclusion of water demanding crop ingredients (soybean meal, rapeseed meal, and pea protein concentrate). This clearly indicates that fishmeal substitution for the carnivorous P. monodon requires more terrestrial resources to meet nutritional requirements. According to Chatvijitkul et al. [46], resource demand range for L. vannamei and P. monodon feed is relatively similar with the exception of (wild) fish use for P. monodon. The total freshwater footprint of our model for L. vannamei under both scenarios (fishmeal 20%) was very similar compared to P. monodon (fishmeal 24%), both close to 1600 m3/MT. This value is close to that shown by Pahlow et al. [15] for P. monodon and L. vannamei at a fishmeal inclusion of approximately 25%. This paper shows that on a species level, while fishmeal inclusion in the diet of P. monodon declined from 33.7% to 6%, total water footprint increased from approximately 1500 m3/MT to 2100 m3/MT, and a change in ratio of green, blue, and grey water footprint occurred, which shows similarities with our model results. This is likely because larger inclusion shares of terrestrial crop ingredients could increase the water footprint [15]. On a scenario level, the observed increase in the share of grey water in the alternative-plant scenario can be explained by the inclusion of fertilizer demanding crops for the required ingredients, such as rapeseed meal concentrate, pea protein concentrate, corn gluten meal, and corn oil in comparison to soybean and wheat in the common-plant scenario. Contrarily, blue water (irrigation) in the alternative-plant scenario reduces due to high inclusion rate of pea protein concentrate.
According to Boissy et al. [13], land use is specifically affected by plant ingredient substitutions in salmon and trout feeds. On a species level, the large differences in mean land demand between L. vannamei and P. monodon in both scenarios is caused by the higher inclusions of soybean meal, pea protein concentrate, and corn gluten, and their relatively higher land use compared to other aquafeed ingredients (Table 1). According to Pelletier et al. [8] soy production requires more land compared to corn and wheat. The stronger increase in mean land demand (ha/MT) of LV1 (0.33) to LV2 (0.76) compared to PM1 (0.38) to PM2 (0.65) is likely caused by relatively lower inclusion (16.7%) of corn gluten meal in LV2 compared to 32% in PM2. Corn gluten meal requires relatively less land (0.2 ha/MT) compared to rapeseed meal (0.9 ha/MT), which has a higher inclusion (36.7%) in LV2 compared to 10.7% in PM2 (Table 1). On a scenario level, it is obvious that land demand is significantly higher in the alternative-plant scenario as a result of the inclusion of crops with a higher land demand such as rapeseed, pea, and corn compared to soybean and wheat in the common-plant scenario. The modeled range in land demand is caused by variable source locations and consequently land use demands of soybean, rapeseed, pea, and corn compared to wheat.
Boissy et al. [13] highlighted that low fishmeal diets (for salmon and trout) have higher terrestrial ecotoxicity values compared to high fishmeal diets due to fertilizer and pesticide use, especially for rapeseed. This explains the high nitrogen demand for the alternative-plant scenario, especially for L. vannamei containing the highest inclusion of rapeseed in the feed formulation. Conversely, the diets for P. monodon require less nitrogen because of lower inclusion of wheat and rapeseed compared to L. vannamei. In the common-plant scenario, fishmeal and wheat is substituted by soybean, which requires relatively less nitrogen but more phosphorus, which shows similarities with other published crop resource demands [46]. Therefore, a correlation between a relatively stable nitrogen demand in the common-plant scenario and an increase in phosphorus is observed. The alternative-plant scenario is overall higher in phosphorus demand due the inclusion of rapeseed meal concentrate and pea protein concentrate, both requiring relatively more phosphorus compared to the other aquafeed ingredients in the feed formulations (Table 1). This also explains the stronger rise in phosphorus requirements for P. monodon in both scenarios due the high inclusion of pea protein concentrate and soybean meal concentrate to meet nutritional requirements. The variability in phosphorus demand is dependent on the source of soybean, rapeseed, pea, corn, and wheat (Table 1). However, it is important to take into account that agricultural production in some parts of the tropics requires higher phosphorus application due the phosphorus fixing characteristics of the soil (30). In our model, this is especially clear for the phosphorus application rates for soybean sourced from Brazil (29% of global production). Consequently, the inclusion of crops and derived ingredients from these sources could increase the resource demand of aquafeed.
Complex dietary requirements of aquatic species may prevent complete substitution of fishmeal and fish oil by plant-based ingredients (10). The production of fish oil requires more fish compared to fishmeal (7), which explains the increasing demand for fish in PM1 (24% fishmeal) and PM2 (0% fishmeal), as fish oil inclusions in the feed formulations increased from 0% until 2%. This also explains the demand of 0.4 MTfish/MTfeed in a 0% fishmeal inclusion for both species and scenarios, which is caused by the inclusion of 2% fish oil. However, fish demand for fish oil shows much greater variability for fish demand compared to fishmeal (7). Therefore, the low variability in fish demand in some of the formulations of P. monodon can be explained by the absence of fish oil.

5.2. Nutritional Limitations of Plant Ingredients in Aquafeeds

Marine ingredients contain a suitable nutritional profile of amino acids, fatty acids, phospholipids, trace elements, nucleotides, vitamins, and other biologically beneficial compounds [5,8,9]. Although some terrestrial plant ingredients are economically attractive, these may also contain anti-nutritional factors (ANFs) [8]. Additionally, their oils may not deliver the entire balanced essential fatty acids (Omega-3s) of the long-chain polyunsaturated fatty acids (LC-PUFAs) found in marine lipids. This can affect the growth of crustaceans more profoundly, principally due to a lower ability to digest and absorb lipids, especially at their developmental stages [62]. However, the development of exogenous enzymes as feed additives offer significant advantages in augmenting digestibility of non-starch polysaccharides (dietary fiber), protein, and release of macro-elements such as phosphorus from P bound phytate in ingredients like soya bean meal [63,64,65,66]. Dietary protease results in a better nutrient utilization, which benefits the immune system of shrimp [67]. Other feed additives meet nutritional requirements, such as the enzyme phytase by improving phosphorus and mineral availability from plant ingredients [10]. Additionally, genetic selection and modification shows potential to modify LC Omega-3 oils in terrestrial plants and to modify the dietary requirements of aquaculture species [6,7,10].

5.3. Limitations of the Model

Feed formulations are variable and mainly based on dietary requirements and ingredient price, which could be influenced by, for example, availability, trade, fuel costs, and competition for resources [44]. Missing data in the geographic origin of crops [13,14,15], variation in country-level crop yields (Chatvijitkul et al.; table 2 [46]), resource demand of (future) agricultural production, processing techniques and yields, and resource allocation result in a range of resource demands for aquafeed ingredients [8,15,46]. Additionally, it must be noted that the skewed range towards high resource demand for land, nitrogen, and phosphorus is often caused by countries with a much higher resource demand compared to the mean while representing a relatively small share (<10%) in global crop production. Additionally, the reliability of the data remains a point of contention, as data reported by governmental organizations such as FAO can be inaccurate (because of delivery from the member countries [68]), but they are the best available data collected in a relatively systematic way. To account for data limitations, we developed and used a shared common data set of multi-factorial resource demand per ingredient (Table 1), and this was applied to each of the feed formulations regardless of the fishmeal inclusion level. Consequently, the differences in resource demand per feed formulation are mainly caused by the variation in inclusion level of the ingredients selected. In this manner, relative outputs are generated by the application of our model that are independent of resource demands. Although our model encompasses reliable feed formulations used by the industry, it is mainly dependent on secondary data and therefore cannot be tested using conventional statistical methods.
Increase in plant ingredient production could potentially lead to socio-economic benefits, such as an increase in farmers’ income and rural employment. Additionally, the production and processing of aquafeed ingredients could also generate side streams, which could be useful for other (food and feed) industries and reducing the need for additional resources. However, the model does not take this into account, as the shrimp industry is considered independently in this research.

6. Conclusions

Aquaculture is one of the fastest growing food industries with increasing feed use for high-value species such as shrimp. This sector is becoming a major player with opportunities for land-based production and therefore increasing the pressure on valuable marine and terrestrial resources. Aquaculture, and in particular the shrimp industry, is one of the dominant consumers of the global fishmeal supply, which is increasingly substituted by mainly plant ingredients. This increases the dependency and competition for agricultural crops from a terrestrial system and its essential resources, which are already under pressure to meet global demand for food, feed, biofuels, and biobased materials.
Our model highlights the need for a paradigm shift in the definition of sustainable shrimp feed by presenting quantitative data on the consequences relating to sea-land linkages as a result of the substitution of fishmeal with terrestrial ingredients based on current resource demands. Our study has clearly demonstrated that complete fishmeal substitution by plant ingredients could lead to an increasing demand for freshwater (up to 63%), land (up to 81%), and phosphorus (up to 83%). These are significant increases, as only a share of 20–30% of the feed is actually substituted. This is mainly caused by the inclusion of resource intensive crops and their derived ingredients to meet nutritional requirements, such as soybean meal concentrate, rapeseed meal concentrate, pea protein concentrate, and corn gluten meal. While aquafeed consumes approximately 4% of the global feed crops and therefore consumes a small share of the agricultural resources (such as water and land), a shift from fishmeal to plant ingredients should not be taken for granted as a sustainable solution to meeting a rapidly expanding (shrimp) aquaculture industry. The additional pressure on crucial terrestrial resources inflicted by the rapidly growing aquaculture sector may become more obvious over the next decades.
Although fishmeal can be used more strategically in various aquafeed formulations (IFFO, personal communication, 2018), there is a need for more innovation to optimize its value in relation to alternative ingredients. Strategic management and utilization of fish by-products shows potential for higher resource use efficiency of valuable marine resources [69]. Additionally, improvement of feed conversion ratios [2], side streams up to 30–40% of the global food system [28], and novel protein sources (microbial biomass [70], insects [71], yeast, microalgae [6], macroalgae [72], and macrophytes) might allow acceptable solutions to supplement high quality fishmeal [8,9,44]. On the other hand, farming up the food chain [Integrated Multi-Trophic Aquaculture (IMTA), biofloc aquaculture systems and aquamimicry] often require less biological resources and far less to almost no aquafeed input [73,74]. This must be factored into future models and scenarios in combination with broader sustainability considerations and indicators, as described in Valenti et al. [75], and nutritional value of aquaculture products.
While the paper is focused on shrimp farming, the model may be equally applicable to other intensively farmed species (for example, freshwater and marine finfish) with similar scenarios of marine and terrestrial feed ingredient requirements using reliable datasets and information platforms. However, more data on the origin and resource demand of ingredients are required in order to gain accurate insight into the optimal use of marine and terrestrial resources. This would enable the shrimp farming industry to operate and contribute in a sustainable manner to global food security and the economy, providing the much needed high nutritionally valuable seafood. This is crucial if we seek to prevent hunger and poverty in developing countries and elsewhere and if people wish to continue consuming healthy, nutritious seafood. Understanding the real impact of feed production would be a starting point for the realistic pricing of aquafeed and would create awareness of the impact of our current choices on future generations. Contrary to the current situation, such a strategy will create sustainable feeds that will contribute to the SDGs of the UN.

Supplementary Materials

The following are available online at https://www.mdpi.com/2071-1050/11/4/1212/s1, The excel model and data used to perform this work can be found in the supplementary material.

Author Contributions

Conceptualization, W.M., B.K., M.v.L., M.F., P.v.d.H., R.P., N.A.A., M.J.S. and S.J.D.; Data curation, W.M., B.K. and S.J.D.; Formal analysis, W.M., B.K. and S.J.D.; Investigation, W.M. and B.K.; Methodology, W.M., B.K. and M.J.S.; Project administration, W.M.; Resources, W.M., B.K., M.v.L., M.F., D.v.D., K.S., P.v.d.H., R.P., N.A.A., M.R., M.J.S. and S.J.D.; Supervision, W.M., M.J.S. and S.J.D.; Validation, W.M., B.K., M.v.L., M.F., K.S., M.J.S. and S.J.D.; Visualization, B.K., M.v.L., M.J.S. and S.J.D.; Writing—original draft, W.M., P.v.d.H., M.J.S. and S.J.D.; Writing—review & editing, W.M., B.K., M.v.L., M.F., D.v.D., K.S., R.P., N.A.A., M.R., M.J.S. and S.J.D.

Funding

This research received no external funding.

Acknowledgments

We would like to thank the three anonymous reviewers and the editor for their valuable comments and suggestions and Mark Johnson of the National University of Ireland (NUI) Galway and Stephen Mansbridge of Harper Adams University (HAU) for proofreading the manuscript. We would like to thank the University of Stirling for their financial support regarding the Article Processing Charges (APC) in order to make this research open access and free for readers.

Conflicts of Interest

The authors declare no conflict of interest.

References

  1. FAO. World Aquaculture Performance Indicators (WAPI)—Fish Consumption Module (WAPI-FISHCSP v.2018.1). In FAO Fisheries and Aquaculture Department. Rome. Updated 2018. 2018. Available online: www.fao.org/fishery/statistics/software/wapi/en (accessed on 23 January 2019).
  2. FAO. The State of World Fisheries and Aquaculture 2018—Meeting the Sustainable Development Goals. Rome. Licence: CC BY-NC-SA 3.0 IGO. 2018. Available online: http://www.fao.org/3/i9540en/I9540EN.pdf (accessed on 21 July 2018).
  3. World Bank. Fish to 2030: Prospects for Fisheries and Aquaculture; World Bank Report Number 83177-GLB; The World Bank: Washington, DC, USA, 2013; Available online: http://www.fao.org/docrep/019/i3640e/i3640e.pdf (accessed on 26 July 2018).
  4. Anderson, J.L.; Valderrama, D.; Jory, D. Shrimp Production Review. Global Outlook for Aquaculture Leadership (GOAL): Dublin, Ireland, 2017. Available online: https://www.aquaculturealliance.org/wp-content/uploads/2018/01/Global-Shrimp-Production-Data-Analysis-Dr.-James-Anderson-GOAL-2017.pdf (accessed on 1 February 2018).
  5. Tacon, A.G.J.; Metian, M. Feed Matters: Satisfying the Feed Demand of Aquaculture. Rev. Fish. Sci. Aquac. 2015, 23, 1–10. [Google Scholar] [CrossRef]
  6. Naylor, R.L.; Hardy, R.W.; Bureau, D.P.; Chiu, A.; Elliott, M.; Farrell, A.P.; Forster, I.; Gatlin, D.M.; Goldburg, R.J.; Hua, K.; et al. Feeding aquaculture in an era of finite resources. Proc. Natl Acad. Sci. USA 2009, 106, 15103–15110. [Google Scholar] [CrossRef] [PubMed]
  7. Shepherd, C.J.; Jackson, A.J. Global fishmeal and fish-oil supply: Inputs, outputs and markets. J. Fish Biol. 2013, 83, 1046–1066. [Google Scholar] [CrossRef] [PubMed]
  8. Pelletier, N.; Klinger, D.H.; Sims, N.A.; Yoshioka, J.N.; Kittinger, J.N. Nutritional attributes, Substitutability, Scalability, and Environmental Intensity of an Illustrative Subset of Current and Future Protein Sources for Aquaculture Feeds: Joint Consideration of Potential Synergies and Trade-offs. Environ. Sci. Technol. 2018, 52, 5532–5544. [Google Scholar] [CrossRef] [PubMed]
  9. Froehlich, H.E.; Jacobsen, N.S.; Essington, T.E.; Clavelle, T.; Halpern, B.S. Avoiding the ecological limits of forage fish for fed aquaculture. Nat. Sustain. 2018, 1, 298–303. [Google Scholar] [CrossRef]
  10. Gatlin, D.M.; Barrows, F.T.; Brown, P.; Dabrowski, K.; Gaylord, T.G.; Hardy, R.W.; Herman, E.; Hu, G.; Krogdahl, Å.; Nelson, R.; Overturf, K. Expanding the utilization of sustainable plant products in aquafeeds: A review. Aquac. Res. 2007, 38, 551–579. [Google Scholar] [CrossRef]
  11. Salin, K.R.; Arun, V.V.; Nair, C.M.; Tidwell, J.H. Sustainable Aquafeed, Part of Sustainable Aquaculture in Applied Environmental Science and Engineering for a Sustainable Future; Springer: Cham, Switzerland, 2018; pp. 123–151. [Google Scholar]
  12. Huntington, T.C.; Hasan, M.R. Fish as Feed Inputs for Aquaculture—Practices, Sustainability and Implications: A Global Synthesis. FAO Fisheries and Aquaculture Technical Paper. No. 518, Rome. 2009, pp. 1–61. Available online: http://www.fao.org/docrep/012/i1140e/i1140e01.pdf (accessed on 2 March 2018).
  13. Boissy, J.; Aubin, J.; Drissi, A.; van der Werf, H.M.; Bell, G.J.; Kaushik, S.J. Environmental impacts of plant-based salmonid diets at feed and farm scales. Aquaculture 2011, 321, 61–70. [Google Scholar] [CrossRef]
  14. Fry, J.P.; Love, D.C.; MacDonald, G.K.; West, P.C.; Engstrom, P.M.; Nachman, K.E.; Lawrence, R.S. Environmental health impacts of feeding crops to farmed fish. Environ. Int. 2016, 91, 201–214. [Google Scholar] [CrossRef] [PubMed] [Green Version]
  15. Pahlow, M.; van Oel, P.R.; Mekonnen, M.M.; Hoekstra, A.Y. Increasing pressure on freshwater resources due to terrestrial feed ingredients for aquaculture production. Sci. Total Environ. 2015, 536, 847–857. [Google Scholar] [CrossRef] [PubMed] [Green Version]
  16. Troell, M.; Naylor, R.L.; Metian, M.; Beveridge, M.; Tyedmers, P.H.; Folke, C.; Arrow, K.J.; Barrett, S.; Crépin, A.S.; Ehrlich, P.R.; Gren, Å. Does aquaculture add resilience to the global food system? Proc. Natl Acad. Sci. USA 2014, 111, 13257–13263. [Google Scholar] [CrossRef] [PubMed] [Green Version]
  17. Blanchard, J.L.; Watson, R.A.; Fulton, E.A.; Cottrell, R.S.; Nash, K.L.; Bryndum-Buchholz, A.; Büchner, M.; Carozza, D.A.; Cheung, W.W.; Elliott, J.; et al. Linked sustainability challenges and trade-offs among fisheries, aquaculture and agriculture. Nat. Ecol. Evol. 2017, 1, 1240–1249. [Google Scholar] [CrossRef] [PubMed]
  18. Spiertz, J.H.J.; Ewert, F. Crop production and resource use to meet the growing demand for food, feed and fuel: Opportunities and constraints. NJAS Wagen. J. Life Sci. 2009, 56, 281–300. [Google Scholar] [CrossRef]
  19. Runge, C.F.; Senauer, B. How biofuels could starve the poor. Foreign Aff. 2007, 86, 41–53. [Google Scholar]
  20. FAO. Sustainable diets and biodiversity. Directions and solutions for policy, research and action. In Proceedings of the International Scientific Symposium Biodiversity and Sustainable Diets United Against Hunger, FAO Headquarters, Rome, Italy, 3–5 November 2010. [Google Scholar]
  21. OECD/FAO. OECD-FAO Agricultural Outlook 2016–2025; OECD Publishing: Paris, France, 2016. [Google Scholar] [CrossRef]
  22. Little, D.C.; Young, J.A.; Zhang, W.; Newton, R.W.; Al Mamun, A.; Murray, F.J. Sustainable intensification of aquaculture value chains between Asia and Europe: A framework for understanding impact and challenges. Aquaculture 2018, 493, 338–354. [Google Scholar] [CrossRef]
  23. Ytrestøyl, T.; Aas, T.S.; Åsgård, T. Utilisation of feed resources in production of Atlantic salmon (Salmo salar) in Norway. Aquaculture 2015, 448, 365–374. [Google Scholar] [CrossRef]
  24. Froehlich, H.E.; Runge, C.A.; Gentry, R.R.; Gaines, S.D.; Halpern, B.S. Comparative terrestrial feed and land use of an aquaculture-dominant world. Proc. Nat. Acad. Sci. USA 2018, 115, 5295–5300. [Google Scholar] [CrossRef] [PubMed]
  25. Popp, A.; Calvin, K.; Fujimori, S.; Havlik, P.; Humpenöder, F.; Stehfest, E.; Bodirsky, B.L.; Dietrich, J.P.; Doelmann, J.C.; Gusti, M.; et al. Land-use futures in the shared socio-economic pathways. Glob. Environ. Chang. 2017, 42, 331–345. [Google Scholar] [CrossRef] [Green Version]
  26. Zabel, F.; Putzenlechner, B.; Mauser, W. Global Agricultural Land Resources—A High Resolution Suitability Evaluation and Its Perspectives until 2100 under Climate Change Conditions. PLoS ONE 2014, 9, e0107522. [Google Scholar] [CrossRef] [PubMed]
  27. Robinson, T.P.; Thornton, P.K.; Franceschini, G.; Kruska, R.L.; Chiozza, F.; Notenbaert, A.; Cecchi, G.; Herrero, M.; Epprecht, M.; Fritz, S.; et al. Global Livestock Production Systems; Rome, Food and Agriculture Organization of the United Nations (FAO) and International Livestock Research Institute (ILRI): Rome, Italy, 2011; p. 152. Available online: http://www.fao.org/docrep/014/i2414e/i2414e.pdf (accessed on 2 September 2018).
  28. Godfray, H.C.; Crute, I.R.; Haddad, L.; Lawrence, D.; Muir, J.F.; Nisbett, N.; Pretty, J.; Robinson, S.; Toulmin, C.; Whiteley, R. The future of the global food system. Philos. Trans. R. Soc. B 2010, 365, 2769–2777. [Google Scholar] [CrossRef] [PubMed] [Green Version]
  29. Galloway, J.N.; Burke, M.; Bradford, G.E.; Naylor, R.; Falcon, W.; Chapagain, A.K.; Gaskell, J.C.; McCullough, E.; Mooney, H.A.; Oleson, K.L.; et al. International trade in meat: The tip of the pork chop. Ambio 2007, 36, 622–629. [Google Scholar] [CrossRef]
  30. Roy, E.D.; Richards, P.D.; Martinelli, L.A.; Della Coletta, L.; Lins, S.R.; Vazquez, F.F.; Willig, E.; Spera, S.A.; VanWey, L.K.; Porder, S. The phosphorus cost of agricultural intensification in the tropics. Nat. Plants 2016, 2, 16043. [Google Scholar] [CrossRef] [PubMed]
  31. Kraan, S. Mass-cultivation of carbohydrate rich macroalgae, a possible solution for sustainable biofuel production. Mitig. Adapt. Strateg. Glob. Chang. 2010, 18, 27–46. [Google Scholar] [CrossRef]
  32. Diaz, R.J.; Rosenberg, R. Spreading dead zones and consequences for marine ecosystems. Science 2008, 321, 926–929. [Google Scholar] [CrossRef] [PubMed]
  33. Hardin, G. The Tragedy of the Commons. Science 1968, 162, 1243–1248. [Google Scholar] [PubMed]
  34. Krause, G.; Brugere, C.; Diedrich, A.; Ebeling, M.W.; Ferse, S.C.; Mikkelsen, E.; Agúndez, J.A.; Stead, S.M.; Stybel, N.; Troell, M. A revolution without people? Closing the people–policy gap in aquaculture development. Aquaculture 2015, 447, 44–55. [Google Scholar] [CrossRef]
  35. Rahman, R.A.; Ang, C.L.; Ramli, R. Investigating feed mix problem approaches: An overview and potential solution. World Acad. Scie. Eng. Technol. 2010, 46, 466–474. [Google Scholar]
  36. NRC. Nutrient Requirements of Fish and Shrimp; National Academies Press: Washington, DC, USA, 2011; pp. 376, XVI. [Google Scholar]
  37. International Hammersmith Commodity Index Database. 2018. Available online: https://hammersmithltd.blogspot.com/ (accessed on 1 September 2018).
  38. Chowdhury, M.A.; Talib, A.; Yahya, K. A review on marine shrimp aquaculture production trend and sustainability in Malaysia and the world perspective. In Proceedings of the Conference: International Fisheries Symposium, Can Tho University, Can Tho, Vietnam, 6–8 December 2012. [Google Scholar]
  39. Davis, A.; Roy, L.; Sookying, D. Improving the Cost Effectiveness of Shrimp Feeds. In Proceedings of the Avances en Nutrición Acuícola IX. IX Simposio Internacional de Nutrición Acuícola, Universidad Autónoma de Nuevo León, Monterrey, Nuevo León, Mexico, 24–27 November 2008; pp. 271–280. [Google Scholar]
  40. Boyd, C.E.; Lim, C.; Queiroz, J.; Salie, K.; De Wet, L.; McNevin, A. Best Management Practices for Responsible Aquaculture. 2014. Available online: https://www.researchgate.net/publication/255574369_Best_Management_Practices_for_Responsible_Aquaculture?_esc=publicationCoverPdf&el=1_x_2&enrichId=rgreq-e108bf408c13e66025e032d719844149-XXX&enrichSource=Y292ZXJQYWdlOzI1NTU3NDM2OTtBUzoxNjAyMTkxNTM4MzgwODFAMTQxNTIxMDYzMTkwMw%3D%3D (accessed on 15 May 2018).
  41. FAO. Cultured Aquatic Species Information Programme. Penaeus Vannamei (Boone 1931). Available online: http://www.fao.org/fishery/culturedspecies/Penaeus_vannamei/en (accessed on 1 February 2018).
  42. Tacon, A.G.J. Thematic Review of Feeds and Feed Management Practices in Shrimp Aquaculture. Report Prepared under the World Bank, NACA, WWF and FAO Consortium Program on Shrimp Farming and the Environment. Work in Progress for Public Discussion. Published by the Consortium. 2002. 69p. Available online: https://pdfs.semanticscholar.org/b530/841bdabb9cdad8dbd1a4c15bb9f437be151e.pdf (accessed on 10 January 2019).
  43. Tantikikki, C. Feed palatability and the alternative protein sources in shrimp feed. Songklanakarin J. Sci. Technol. 2014, 36, 51–55. [Google Scholar]
  44. Rana, K.J.; Siriwardena, S.; Hasan, M.R. Impact of Rising Feed Ingredient Prices on Aquafeeds and Aquaculture Production. FAO Fisheries and Aquaculture Technical Paper. No. 541. Rome, Italy, 2009. p. 63. Available online: http://www.fao.org/docrep/012/i1143e/i1143e.pdf (accessed on 26 May 2018).
  45. Hasan, M.R.; New, M.B. On-Farm Feeding and Feed Management in Aquaculture. FAO Fisheries and Aquaculture Technical Paper No. 583. Rome, Italy, 2013. p. 67. Available online: http://www.fao.org/docrep/019/i3481e/i3481e.pdf (accessed on 3 May 2018).
  46. Chatvijitkul, S.; Boyd, C.E.; Davis, D.A.; Mcnevin, A.A. Embodied Resources in Fish and Shrimp Feeds. J. World Aquac. Soc. 2017, 48, 7–19. [Google Scholar] [CrossRef]
  47. DePeters, E.J.; Bath, D.L. Canola Meal versus Cottonseed Meal as the Protein Supplement in Dairy Diets. J. Dairy Sci. 1986, 69, 148–154. [Google Scholar] [CrossRef]
  48. Allan, G.L.; Rowland, S.J.; Mifsud, C.; Glendenning, D.; Stone, D.A.; Ford, A. Replacement of fish meal in diets for Australian silver perch, bidyanus bidyanus. V. Least-cost formulation of practical diets. Aquaculture 2000, 186, 327–340. [Google Scholar] [CrossRef]
  49. Moretti, C.; Moro, A.; Edwards, R.; Rocco, M.V.; Colombo, E. Analysis of standard and innovative methods for allocating upstream and refinery GHG emissions to oil products. Appl. Energy 2017, 206, 372–381. [Google Scholar] [CrossRef]
  50. Cherubini, E.; Franco, D.; Zanghelini, G.M.; Soares, S.R. Uncertainty in LCA case study due to allocation approaches and life cycle impact assessment methods. Int. J. Life Cycle Assess. 2018, 23, 2055–2070. [Google Scholar] [CrossRef]
  51. Mekonnen, M.M.; Hoekstra, A.Y. The Green, Blue and Grey Water Footprint of Crops and Derived Crop Products; Main Report; Value of Water Research Report Series No. 47; UNESCO-IHE: Delft, The Netherlands, 2010; Volume 1. [Google Scholar]
  52. FAO. Consumption of Fuel, Electric Power and Water. Available online: http://www.fao.org/docrep/003/X6899e/X6899E08.htm (accessed on 1 July 2018).
  53. Factfish. Data. Data Based on FAOSTAT. Available online: www.factfish.com (accessed on 1 February 2018).
  54. Rosas, F. Centre for Agricultural and Rural Development (CARD). Iowa State University. Ames, Iowa 50011-1070. Fertilizer use by crop at the country level (1990–2010). CARD Working Papers 12-WP 535, November 2012. (Appendix to Fertilizer Use by Crop at the Country Level: 1990–2010). Available online: https://www.card.iastate.edu/products/publications/synopsis/?p=1178 (accessed on 5 February 2018).
  55. FAO Crop Information: Pea. 2018. Available online: http://www.fao.org/land-water/databases-and-software/crop-information/pea/en/ (accessed on 10 April 2018).
  56. FAO Crop Information: Soybean. 2018. Available online: http://www.fao.org/land-water/databases-and-software/crop-information/soybean/en/ (accessed on 10 April 2018).
  57. Rosas, F. Centre for Agricultural and Rural Development (CARD). Iowa State University. Ames, Iowa 50011-1070. World Fertilizer Model—The World NPK Model. CARD Working Papers 11-WP 520, April 2011. Available online: https://lib.dr.iastate.edu/cgi/viewcontent.cgi?referer=https://www.google.co.uk/&httpsredir=1&article=1539&context=card_workingpapers (accessed on 1 April 2018).
  58. FAO Crop Information: Maize. 2018. Available online: http://www.fao.org/land-water/databases-and-software/crop-information/maize/en/ (accessed on 10 April 2018).
  59. FAO Crop Information: Wheat. 2018. Available online: http://www.fao.org/land-water/databases-and-software/crop-information/wheat/en/ (accessed on 10 April 2018).
  60. Jackson, A.J. Fish in-fish out, ratios explained. Aquac. Eur. 2009, 34, 5–10. [Google Scholar]
  61. Kaushik, S.; Troell, M. Taking the Fish-in Fish-out Ratio a Step Further. Aquac. Eur. 2010, 35, 15–17. [Google Scholar]
  62. Glencross, B.D. Exploring the nutritional demand for essential fatty acids by aquaculture species. Rev. Aquac. 2009, 1, 71–124. [Google Scholar] [CrossRef] [Green Version]
  63. Hardy, R.W.; Gatlin, D. Nutritional strategies to reduce nutrient losses in intensive aquaculture. In Proceedings of the Avances en Nutrición Acuícola VI. Memorias del VI Simposium Internacional de Nutrición Acuícola, Cancún, Quintana Roo, Mexico, 3–6 de September 2002. [Google Scholar]
  64. Dalsgaard, J.; Knudsen, K.E.B.; Verlhac, V.; Ekmann, K.S.; Pedersen, P.B. Supplementing enzymes to extruded, soybean-based diet improves breakdown of non-starch polysaccharides in rainbow trout (Oncorhynchus mykiss). Aquac. Nutr. 2016, 22, 419–426. [Google Scholar] [CrossRef]
  65. Castillo, S.; Gatlin, D.M. Dietary supplementation of exogenous carbohydrase enzymes in fish nutrition: A review. Aquaculture 2015, 435, 286–292. [Google Scholar] [CrossRef]
  66. Kumar, V.; Sinha, A.K.; Makkar, H.P.S.; De Boeck, G.; Becker, K. Phytate and phytase in fish nutrition. J. Anim. Physiol. Anim. Nutr. 2012, 96, 335–364. [Google Scholar] [CrossRef] [PubMed]
  67. Song, H.-L.; Liu, Y.; Dong, X.-H.; Chowdhury, K.M.A. Dietary Protease Improves Immune Responses in Pacific White Shrimp, Litopenaeus Vannamei. International Aquafeed May-June 2015. Available online: https://www.slideshare.net/IntAquafeed/iaf1503-f7 (accessed on 1 June 2018).
  68. Pauly, D.; Zeller, D. Comments on FAO’s State of World Fisheries and Aquaculture (SOFIA 2016). Mar. Policy 2017, 77, 176–181. [Google Scholar] [CrossRef]
  69. Stevens, J.R.; Newton, R.W.; Tlusty, M.; Little, D.C. The rise of aquaculture by-products: Increasing food production, value, and sustainability through strategic utilisation. Mar. Policy 2018, 90, 115–124. [Google Scholar] [CrossRef]
  70. Glencross, B.; Irvin, S.; Arnold, S.; Blyth, D.; Bourne, N.; Preston, N. Effective use of microbial biomass products to facilitate the complete replacement of fishery resources in diets for the black tiger shrimp Penaeus monodon. Aquaculture 2014, 431, 12–19. [Google Scholar] [CrossRef]
  71. Stamer, A. Insect proteins—A new source for animal feed. The use of insect larvae to recycle food waste in high-quality protein for livestock and aquaculture feeds is held back largely owing to regulatory hurdles. EMBO Rep. 2015, 16, 676–680. [Google Scholar] [CrossRef] [PubMed]
  72. Wan, A.H.L.; Davies, S.J.; Soler-Villa, A.; Fitzgerald, R.; Johnson, M.P. Macroalgae as a sustainable aquafeed ingredient. Rev. Aquac. 2018, 1–35. [Google Scholar] [CrossRef]
  73. Romano, N. Aquamimicry: A Revolutionary Concept for Shrimp Farming. Global Aquaculture Advocate 2017. Available online: https://www.aquaculturealliance.org/advocate/aquamimicry-a-revolutionary-concept-for-shrimp-farming/ (accessed on 5 August 2018).
  74. Poli, M.A.; Legarda, E.C.; de Lorenzo, M.A.; Martins, M.A.; do Nascimento Vieira, F. Pacific white shrimp and Nile tilapia integrated in a biofloc system under different fish-stocking densities. Aquaculture 2019, 498, 83–89. [Google Scholar] [CrossRef]
  75. Valenti, W.C.; Kimpara, J.M.; de Lima Preto, B.; Moraes-Valenti, P. Indicators of sustainability to assess aquaculture systems. Ecol. Indic. 2018, 88, 402–413. [Google Scholar] [CrossRef]
Figure 1. Freshwater demand (m3/MT) for the baselines and five substitution levels in two scenarios and for two species. Green bar indicates consumed rainwater, blue bar indicates consumed or evaporated volume of surface and groundwater (irrigation), and grey bar indicates freshwater needed to process and neutralize pollutants.
Sustainability 11 01212 g001
Figure 2. Minimum, mean, and maximum land demand (ha/MT) for the baselines and five substitution levels in two scenarios and for two species. The y-axis represents the global mean land demand, and the bars indicate the range (min/max) in land demand of a combination of ingredients in the feed formulations.
Sustainability 11 01212 g002
Figure 3. Minimum, mean, and maximum nitrogen demand (kg/MT) for the baselines and five substitution levels in two scenarios and for two species. The y-axis represents the global mean nitrogen demand, while the bars indicate the range (min/max) in nitrogen demand of a combination of ingredients in the feed formulations.
Sustainability 11 01212 g003
Figure 4. Minimum, mean, and maximum phosphorus demand (kg/MT) for the baselines and five substitution levels in two scenarios and for two species. The y-axis represents the global mean phosphorus demand, while the bars indicate the range (min/max) in phosphorus demand of a combination of ingredients in the feed formulations.
Sustainability 11 01212 g004
Figure 5. Minimum, mean, and maximum fish demand (MTfish/MTfeed) for the baselines and five substitution levels in two scenarios and for two species. The y-axis represents the global mean fish demand, while the bars indicate the range in fish demand for the inclusion of fish oil and fishmeal.
Sustainability 11 01212 g005
Table 1. Twenty-four feed formulations for two shrimp species [L. vannamei (LV) and P. monodon (PM)] and two scenarios [(1) common-plant: fishmeal substitution by common plant ingredients and (2) alternative-plant: fishmeal substitution by alternative plant ingredients]. Each set per species and scenario (LV1, LV2, PM1, PM2) contained six feed formulations with intermediate steps of 20% fishmeal substitution by plant ingredients from the baseline. Each feed formulation used a unique combination of ingredients and their respective resource (freshwater, land, phosphorus, nitrogen, and fish) demand values, which determines the total resource demand of the feed formulation.
Price (€/MT) *Fishmeal (%)Fish oil (%)Wheat Feed (%)Soybean Meal Concentrate (%)Rapeseed Meal Concentrate (%)Pea Protein Concentrate (%)Corn Gluten Meal ** (%)Corn Oil ** (%)Vitamin and Mineral Premix (%)
Scenario 1: Fishmeal substitution by common plant ingredients (common-plant scenario)
L. vannamei (LV1)75420.02.072.80.0--2.00.71.0
72916.02.075.50.9--2.01.11.0
72012.02.073.76.3--2.01.51.0
7118.02.072.011.6--2.01.91.0
7014.02.070.316.9--2.02.21.0
6920.02.068.622.3--2.02.61.0
P. monodon (PM1)85830.00.047.413.1--5.01.02.0
87524.02.042.721.8--5.01.02.0
85718.02.041.029.5--5.01.02.0
83912.02.039.337.2--5.01.02.0
8216.02.037.545.0--5.01.02.0
8060.02.035.152.9--5.01.02.5
Scenario 2: Fishmeal substitution by alternative plant ingredients (alternative-plant scenario)
L. vannamei (LV2)67520.02.014.2-40.59.210.02.01.0
66116.02.014.3-38.614.410.22.31.0
64712.02.014.3-37.019.510.52.51.0
6358.02.014.0-35.624.510.72.81.0
6264.02.011.1-36.027.813.53.21.0
6170.02.07.8-36.730.816.73.61.0
P. monodon (PM2)74130.00.034.0-7.713.510.41.02.3
72424.00.031.3-7.019.413.31.02.8
71018.00.026.5-7.924.018.01.03.4
69712.00.021.7-8.828.622.71.04.0
6836.00.016.9-9.733.227.41.04.6
6860.02.012.0-10.737.832.01.03.3
Resource demand values
Freshwater (m3/MT)Green--1277.02397.0837.02906.01101.21996.0-
Blue100.0100.0342.083.0114.066.0174.2171.0100.0
Grey--207.044.0165.0986.0225.6409.0-
Land (ha/MT)Min--0.20.40.50.80.10.1-
Mean--0.30.50.91.20.20.2-
Max--0.41.11.62.20.70.7-
Nitrogen (kg/MT)Min--8.81.462.825.215.015.0-
Mean--28.23.887.334.518.718.7-
Max--37.235.3151.166.435.335.3-
Phosphorus (kg/MT)Min--3.55.514.533.51.41.4-
Mean--11.415.125.146.03.73.7-
Max--16.329.949.688.57.27.2-
Fish (MTfish/MTfeed)Min4.410.0-------
Mean4.520.0-------
Max4.650.0-------
Ingredients (Cholesterol, Lecithin, DL-Methionine) excluded from analysis due to insufficient data on impact indicators. * Scenario 2 (alternative-plant) excluded soybean (meal concentrate) from the feed formulations by adjusting ingredient prices, and therefore these diets are not driven by economic incentives. ** Corn gluten meal and corn oil are extracted from corn (through wet milling process), and therefore resources originated from corn production were allocated based on allocation by end-product mass with the addition of blue water demand for processing.

