Visualization and Analysis of Mapping Knowledge Domain of Urban Vitality Research


School of Economics and Management, Tongji University, Shanghai 200092, China
*
Author to whom correspondence should be addressed.
Sustainability 2019, 11(4), 988; https://doi.org/10.3390/su11040988
Submission received: 14 December 2018
/
Revised: 16 January 2019
/
Accepted: 11 February 2019
/
Published: 14 February 2019
(This article belongs to the Special Issue Pathways to Sustainable Urban Form: Compact Cities Re-Imagined)
Abstract
:Mapping knowledge domain (MKD) is an important research technology in bibliometrics. It provides a visual perspective for researchers and helps researchers to clearly understand the general situations of specific research fields. Presently, MKD has been widely used in fields such as ecology and transportation safety. In this paper, we conduct a systematically bibliometric analysis of the development trend on urban vitality research by using VOSviewer software, and this work is based on the related articles published in the Science Citation Index Expanded (SCIE) and Social Sciences Citation Index (SSCI) between 1998 and 2018. In the implementation, we firstly introduce the annual numbers of articles, source journals, highly cited papers, and production countries relating to urban vitality research. Then, we adopt a keywords co-occurrence analysis to explore the topic distribution, research frontiers, and research trends of urban vitality research intuitively. Overall, the Mapped Knowledge Domain method has proved to be an effective way to assess research trends in specific disciplines and to contribute to researchers and governments with respect to management and decision-making on issues of science.
1. Introduction
The history of urban development has exceeded a thousand years. Especially after the eighteenth century, city development has entered a rapid stage. Urban spaces are the carriers of human activities, and the development of cities is closely related to the future destiny of mankind. But what kind of city can be considered as a successful one? This is a question that urban researchers have been exploring for a century. Some literature illustrates that a successful city should make its residents feel safe, comfortable and full of vitality [1,2]; have a rich street life, and have a reasonable urban order and urban form which can satisfy the needs of various human activities [3]. The city should have five characteristics: Vitality, suitability, sense, accessibility, and controllability [4]. Among these features, vitality means that the city provides residents with a safe place to live which can satisfy all the necessary activities for them [5].
Urban vitality is the most basic element for achieving the quality of life in the city. Therefore, an increasing number of scholars are interested in the study of urban vitality. According to Jacob the “liveliness and variety attract more liveliness; deadness and monotony repel life” [6,7]. Lynch supplemented this idea, believing that urban vitality consists of three main parts: Urban morphology, urban function, and urban society [8]. In his paper, Maas described urban vitality as three aspects: the persistence of people in a public space, their activities, and opportunities, and the place where these activities take place. Maas believed that these are the three basic aspects of community-scale urban vitality [9]. At the same time, March et al. pointed out that the measurement of urban vitality should take into account the range of experience needed for a healthy lifestyle, including privacy, rest and, meditation [10].
However, how to measure and evaluate the intensity of urban vitality has always been a difficult problem in this field. Existing studies have tried to solve this problem indirectly from different perspectives. For example, some scholars evaluated the vitality of cities from the accessibility of retail stores, transportation, and jobs in cities [11,12]; there are scholars who set their sights on the natural environment [13,14] and socio-economic environment [15,16]; other research perspectives include urban landscape aesthetics, urban infrastructure, and social interaction [17]. These findings really let readers have a further understanding of urban vitality.
Therefore, in order to better understand the research themes and trends in a certain scientific field, it is necessary to conduct a systematic and comprehensive analysis of global scientific production [18]. Before this study, many scholars in other disciplines have used this strategy to find their research priorities [19]. In this sense, the bibliometric analysis will play an important role in scientific decision-making [20]. Bibliometrics is a statistical technology which includes scientific publications, citations, patent documents, and reports [21,22]. Because this technology can integrate and analyze all publicly published documents in a particular research field or discipline [23,24,25], it can reduce the scientific boundaries between countries or regions [26], and also enable researchers to clearly understand the cooperative relationship between literature authors. Therefore, bibliometrics has received special attention from the scientific community [27]. In the current body of research, there is a lack of work to apply this technology to analyze the current situation and development trends of urban vitality research.
The remainder of this paper is arranged as follows. Section 2 describes the materials and methods used. In Section 3, we introduce the results of the analysis, including the number of publications per year, source journals, influential productive countries, and keywords co-occurrence networks. In Section 4, the results are discussed. Section 5 concludes the paper and draws some meaningful conclusions.
2. Research Methods and Processes
2.1. Data Collection
The Science Citation Index Expanded (SCIE) and Social Sciences Citation Index (SSCI) citation index databases in the Web of Science (WoS) core collection were retrieved as the source database for this study, which is a common source of data for scientific research [28,29] and bibliometric research [21,22,30]. The search expressions included the application of “Urban Vitality” to the “Topic” field, which retrieves the title, abstract, and keywords (including the keywords PLUS) of publications in WoS to find the required literature [31]. The time span was “1998 to 2018”, and the publication type selected “Article” and “Review” because they represent most of the literature with complete research results [31,32]. After the search, a total of 436 eligible documents were collected, and the search results were saved as “Other File Formats” with “Full Record and Cited References”, and the data was saved on 25 November 2018.
2.2. Scientometric Analysis
Urban vitality is a multidisciplinary research field involving the integration of economics, sociology, and engineering. There are few studies on the current research status of urban vitality done through bibliometric analysis. Bibliometrics is a statistical technique that includes scientific publications, citations, patent documents, and reports. This technology has been widely used in fields such as ecology and transportation safety. It should be noted that bibliometric analysis is a quantitative analysis process, but the results are qualitative [33]. In recent years, many bibliometric tools have been developed by researchers such as Bib Excel, Ucinet, SCIMAT, VOSviewer, and CiteSpace. Some of these software (Bib Excel, Ucinet) are specialized in data processing, but they need to import the results into other visualization software (Pajek, Gephi) to display network maps, while SCIMAT, VOSviewer, and CiteSpace can not only deal with data but also display the results.
The main research method of this paper is based on Scientometrics, and the analysis software used in this paper includes VOSviewer (version 1.6.9; www.vosviewer.com) and MS Excel. VOSviewer is developed by van Eck and Waltman of Leiden University in The Netherlands. It can analyze complex networks with its own clustering analysis function according to the connection strength between projects [34]. At the same time, the software uses Visualization of Similarities (VOS) technology and has strong advantages in mapping knowledge domain display, especially in the aspect of clustering. In general, VOSviewer is a powerful visualization software of document knowledge units, especially suitable for analyzing large-scale data sets and constructing complex networks. Therefore, VOSviewer has been widely used in bibliometrics. In the latest version 1.6.9 of VOS viewer, file formats such as .net, .mat, and .txt can be used to construct keywords co-occurrence networks, reference networks, and coupling networks.
3. Results
3.1. Evolution of Scientific Activity: Prior Analysis
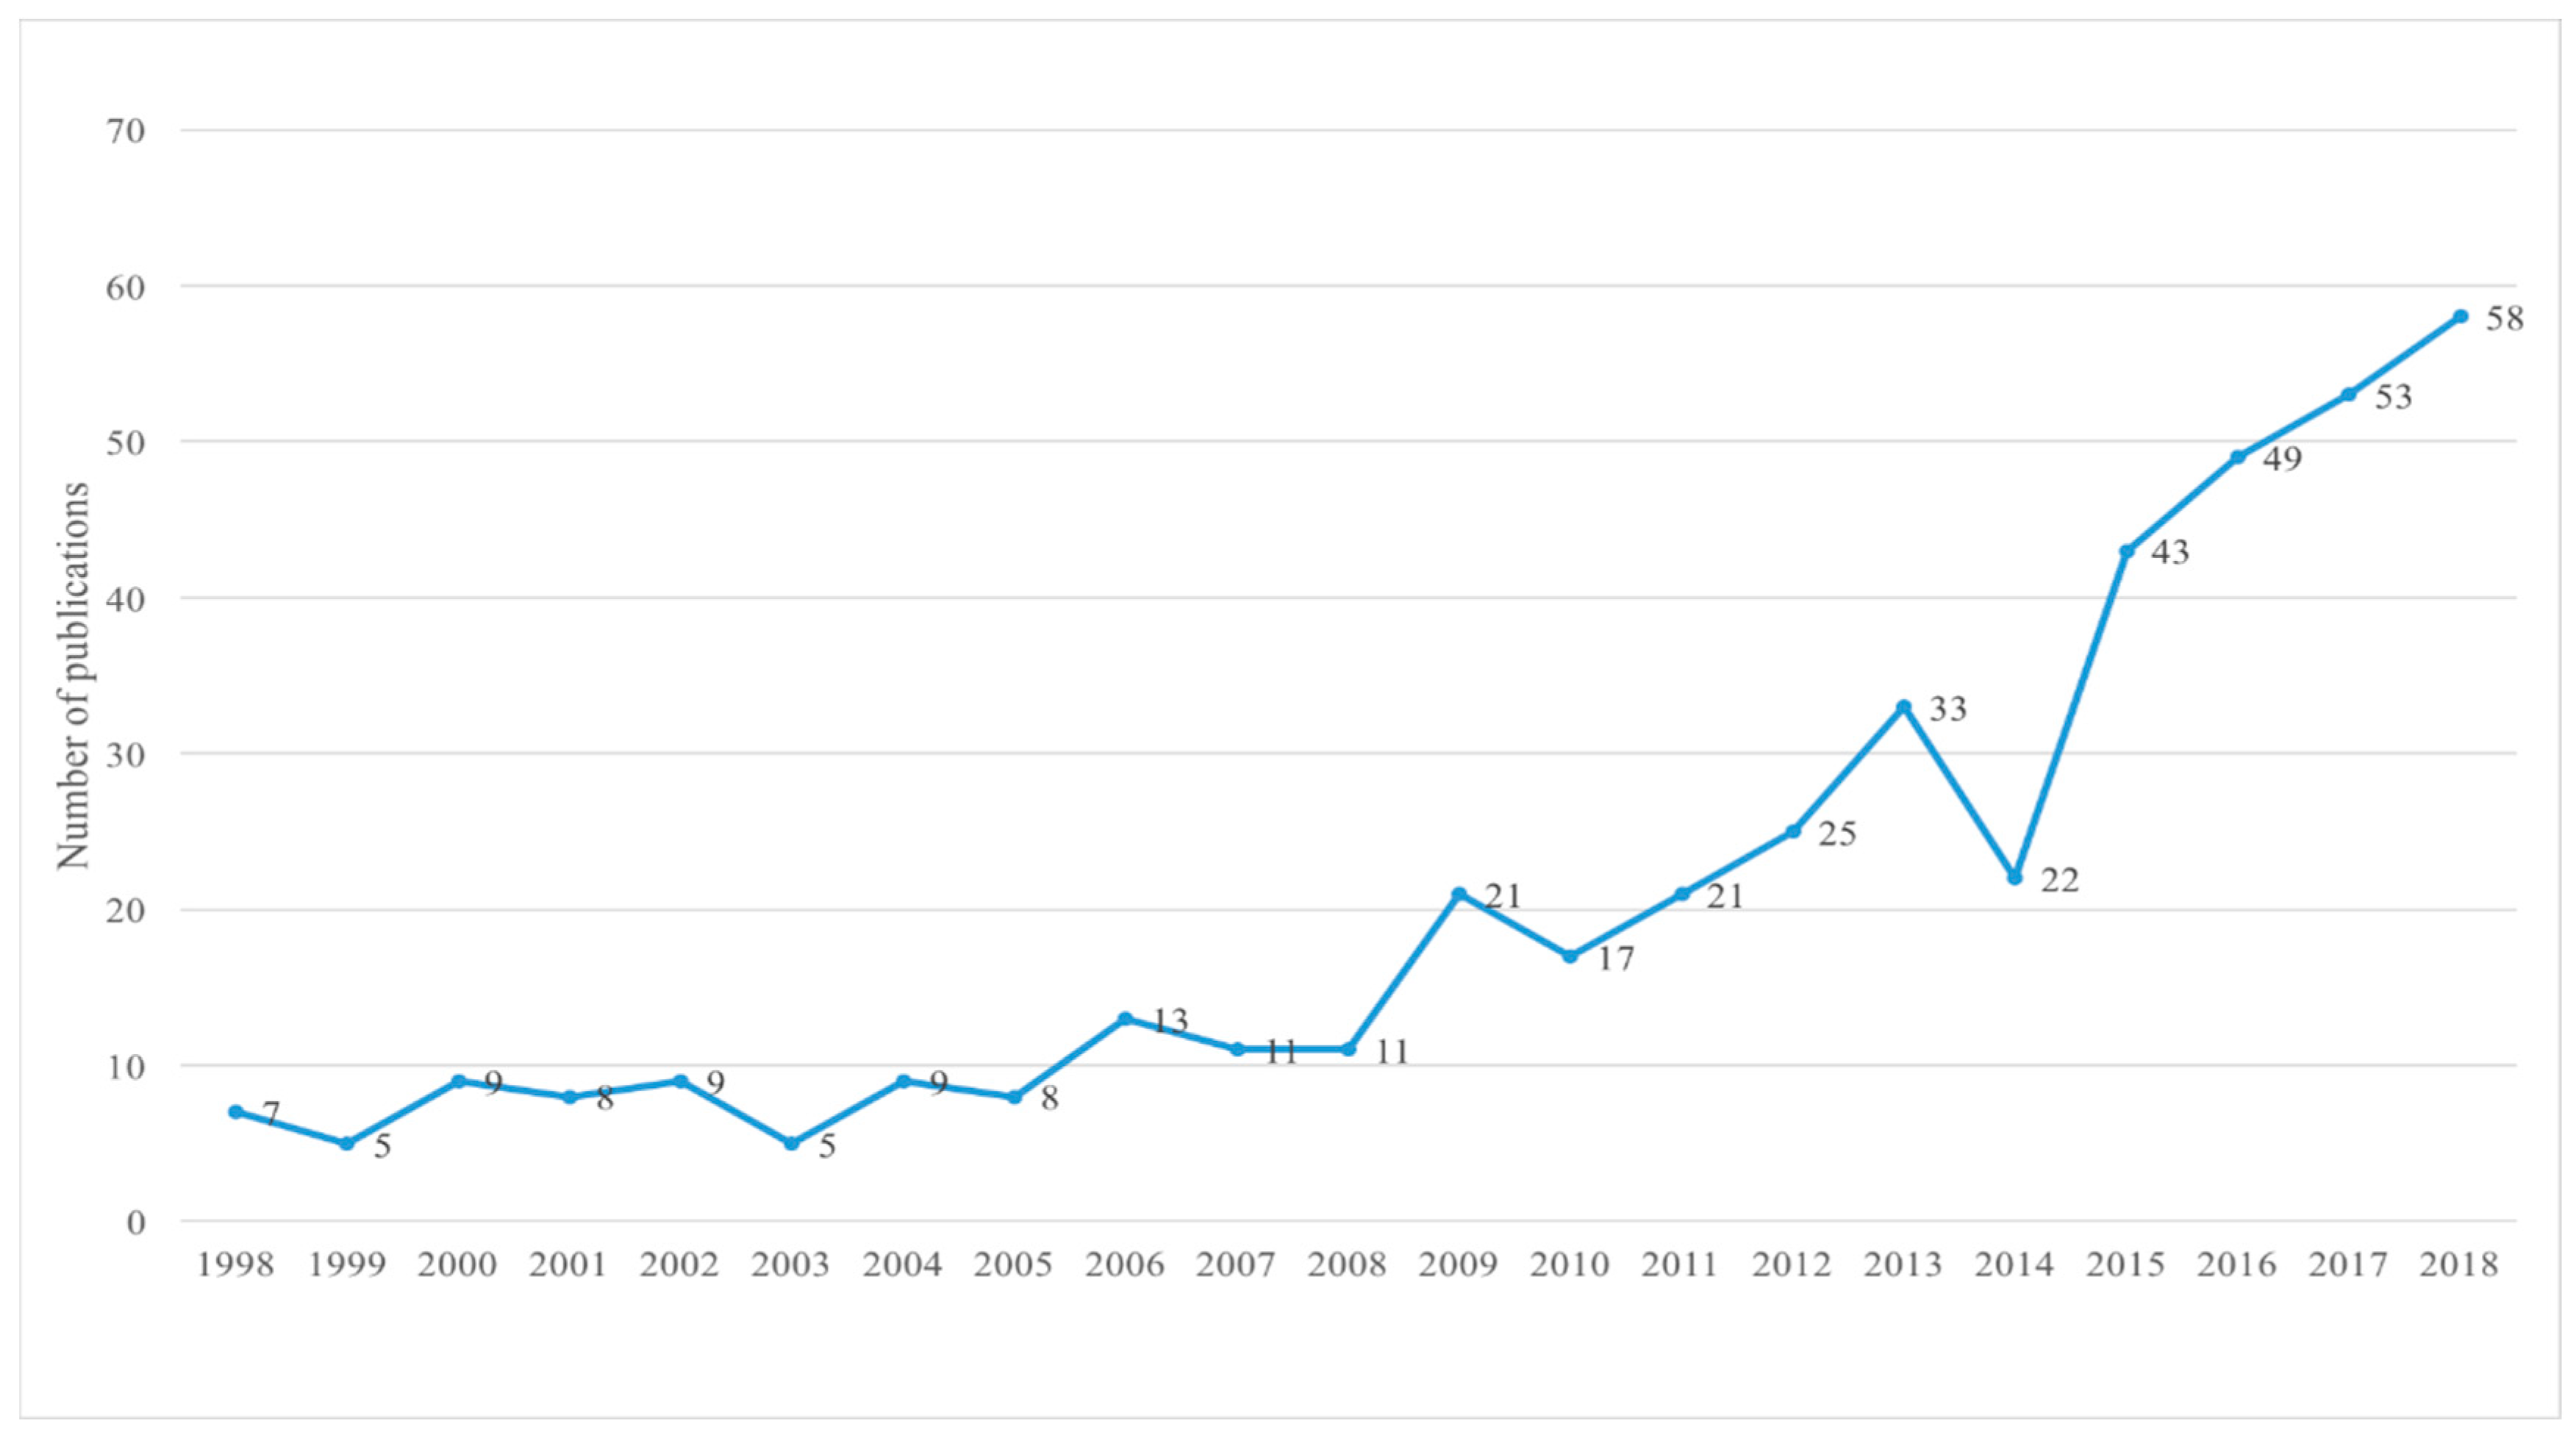
Urban vitality is not a new research field. In traditional research, urban vitality is regarded as a part of urban planning research. It is considered as including the energy and power to promote urban development [35] and the basic elements for realizing the quality of urban life [36]. In recent years, there has been a growing number of studies on urban vitality. The research topics involve urban environment [37,38], geographic science [39,40], human travel behavior [41,42], and other fields, thus forming a wide and diversified academic research system. The change in the number of academic papers for a particular research topic is an important indicator for analyzing the trend of the research topic. Simultaneously, this indicator also reflects the change in the degree of knowledge of the subject. Statistical analysis of the number of papers published in WOS every year can clarify the current research status and future development trend of this area. The trends in the number of research papers on urban vitality from 1998 and 2018 are summarized in Figure 1.
The trend shown in Figure 1 demonstrates how research about urban vitality has attracted the attention of many scholars around the world. In terms of the number of publications, before 2006, there were less than 10 papers per year on urban vitality. However, by 2018, there were more than 50 papers on urban vitality, and the numbers are still being updated. This trend shows that the field of urban vitality will be an emerging research topic and will be involved in more fields. The reason for the growth of research papers about urban vitality may be that people are paying more attention to improving quality of life, and they are looking forward to living in a livable and vibrant city. The relevant research about urban vitality is to explore how cities can make life better.
3.2. Main Journals and Papers with the Most Impact
The 437 documents retrieved were published in 293 different publications. However, as this is an emerging field, the total amount of literature on urban vitality research in 1998–2018 is small, resulting in the scattered distribution of these documents in nearly 300 journals. It should be pointed out, by understanding that the fields of papers received by these journals include urban studies. As listed in Table 1, among the top 10 most active journals, Cities is the top 1, a well-known urban research journal in America. But the total number of research papers about urban vitality published in Cities so far is less than 20. Even so, it is believed that more papers on urban vitality will be published in this journal in the future.
The second-ranked magazine is Urban Forestry & Urban Greening, the areas covered by which are Plant Science, Environmental Science & Ecology, Forestry, and Urban Studies. Up to now, 10 research papers have been published in the magazine. The rest of journals in Table 1 are Urban Design International (9 papers), Sustainability (7 papers), PloS One (6 papers), Transportation Research Record (6 papers), and Habitat International (5 papers). The distribution pattern of the papers published in these journals is decreasing, which is expected in bibliometrics (Bradford method), because only a few journals are dedicated to specific topics, although many other journals may publish scientific papers on the subject.
By analyzing the 10 most cited papers about urban vitality published on WoS, it is clear from Table 2 that the highly cited papers in this field are not closely related to the most active journals in this field. Only two papers in this table are published in the publications listed in Table 1. The most frequently cited article was “The Change Metabolism of Cities”, published in the Journal of Industrial Ecology, which was not listed in the top 10 active journals. From the perspective of urban metabolism, this paper analyses the spatial relationship between urban vitality and surrounding regions and the global resource network and explores the manner of urban sustainable development [43]. This thesis study involved the city’s water cycle and energy circulation, resulting in a higher number of references than other papers in Table 2.
Other papers shown in Table 2 are also analyzed, for instance, because some scholars believe that cities are the places where economic and social vitality takes place, and the decline of the urban population will seriously affect the economic and social vitality of cities [44,45]. At the same time, the diversity of urban residents’ occupations has made an important and positive contribution to the vitality of the city [46]. Some scholars also pay attention to the important role of cultural activities in urban economic vitality [47]. Urban social vitality will have an important impact on the ecological environment [48], but it also has a close relationship with the health of residents [49,50,51,52].
3.3. Quantitative Analysis of Productive Countries
According to the search results, all the research papers on urban vitality come from 59 countries (or territories) in the world. Table 3 lists the top 10 productive countries (or territories) with a total number of 338 academic papers which accounts for 77.5% of the total publications. Most articles are published by developed countries in North America and Europe, including the United States, England, and The Netherlands. Among them, the United States is the most active country in urban vitality research, with 128 papers published, accounting for 29% of the total. Secondly, China has become an emerging and competitive country in scientific research in the world, publishing 48 articles, accounting for 11% of the total; England ranks third, contributing 40 articles, accounting for 10% of the total; Australia and The Netherlands are the fourth and fifth, respectively, with 23 papers. The average number of papers published in countries between the 6th and 7th places is 3% of the total. The cities of these developed countries are either highly modernized or in stages of rapid expansion, so the study of urban vitality is very important for them.
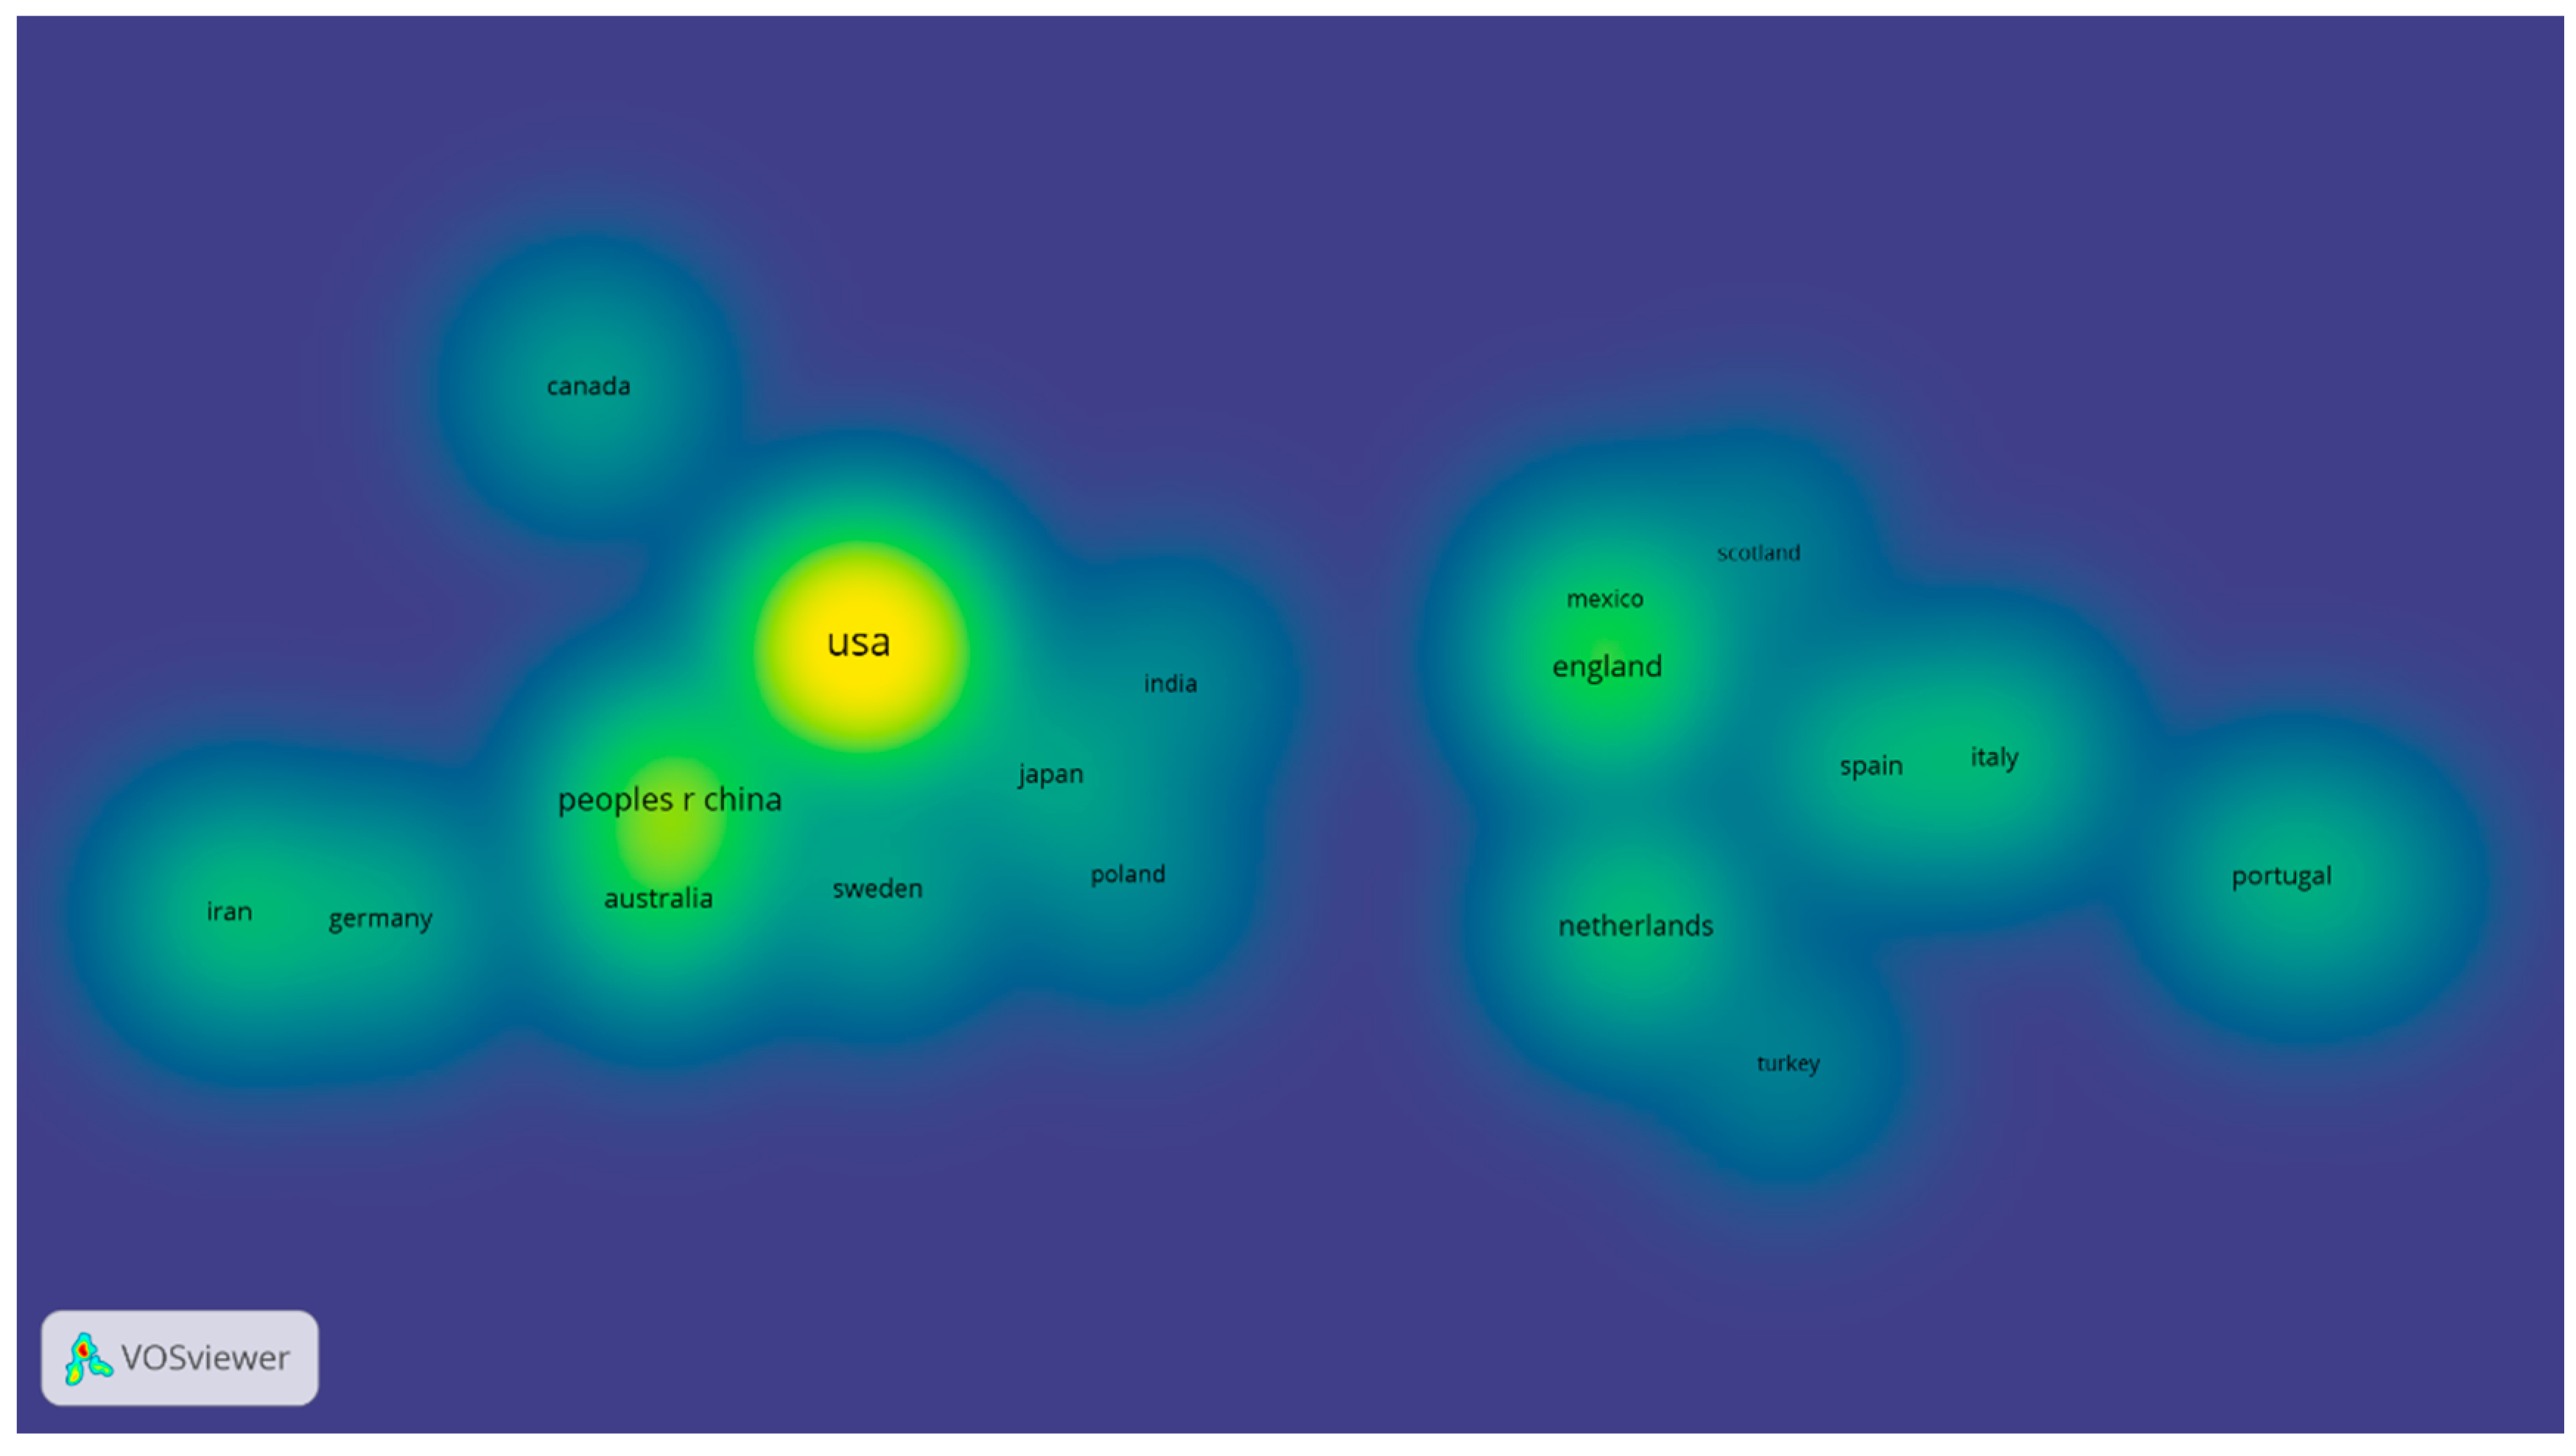
The retrieved publication data are shown as labels and thermographic patches in Figure 2. The color of the patches depends on the number of papers published by the countries (or regions) which are located at the center of the patches. The larger the number, the warmer (redder) the color of the patches; conversely, the smaller the number, the colder (bluer) the color of the patches. As shown in the figure, in this density view, countries with a large number of published papers are at the center of the plaque.
Figure 2 clearly shows the three labels of the United States, China, and England in a prominent position on the map. According to the statistics in Table 2, the United States contributed a third of the total publications of the literature, and in fact, the color of the plaque in the United States is also the deepest. The reason for the leading number of urban vitality research papers in the United States may be that the United States has two world-class megacities in Los Angeles and New York. In addition, there are other big cities also located in the United States. Therefore, it seems that American scholars are more urgent about the study of urban vitality. Another reason may be that after the September 11 attacks, the US government has higher requirements for the safety and resilience of the city. This shows that the United States is indeed the center of urban vitality research in the world. In recent years, Chinese cities are in the stage of rapid expansion, and increasing new urban districts have been set up. This has led Chinese scholars to pay more attention to the study of urban vitality. In Figure 2, the patch color of China is second only to that of the United States. London is one of the world-class cities. The question of how to achieve the sustainable development of the city and make London more livable has become a problem explored by scholars. Driven by these problems, England has made many scientific and practical achievements in the field of urban vitality research. England’s label is clear in Figure 2, and other countries, such as Australia, The Netherlands, Italy, Germany can be seen in Figure 2, which shows that the research results of these countries in the field of urban vitality are also important.
3.4. Keywords Co-occurrence Analysis: Main Topic Distribution and Research Fronts of Urban Vitality
The keywords are an important part of a research paper, which carries important information about the paper [53,54]. Systematic analysis of keywords in specific research fields can clearly understand the development trends and research differences in the field [55]. Keywords co-occurrence analysis is often used to analyze the strength of links between different keywords in a large number of documents. By analyzing the co-occurrence relationships of the keywords, we can clearly understand the internal composition relationship and structure in a certain academic domain and reveal the research frontiers of the discipline. Consequently, keywords co-occurrence analysis has become a common research method in Scientometrics.
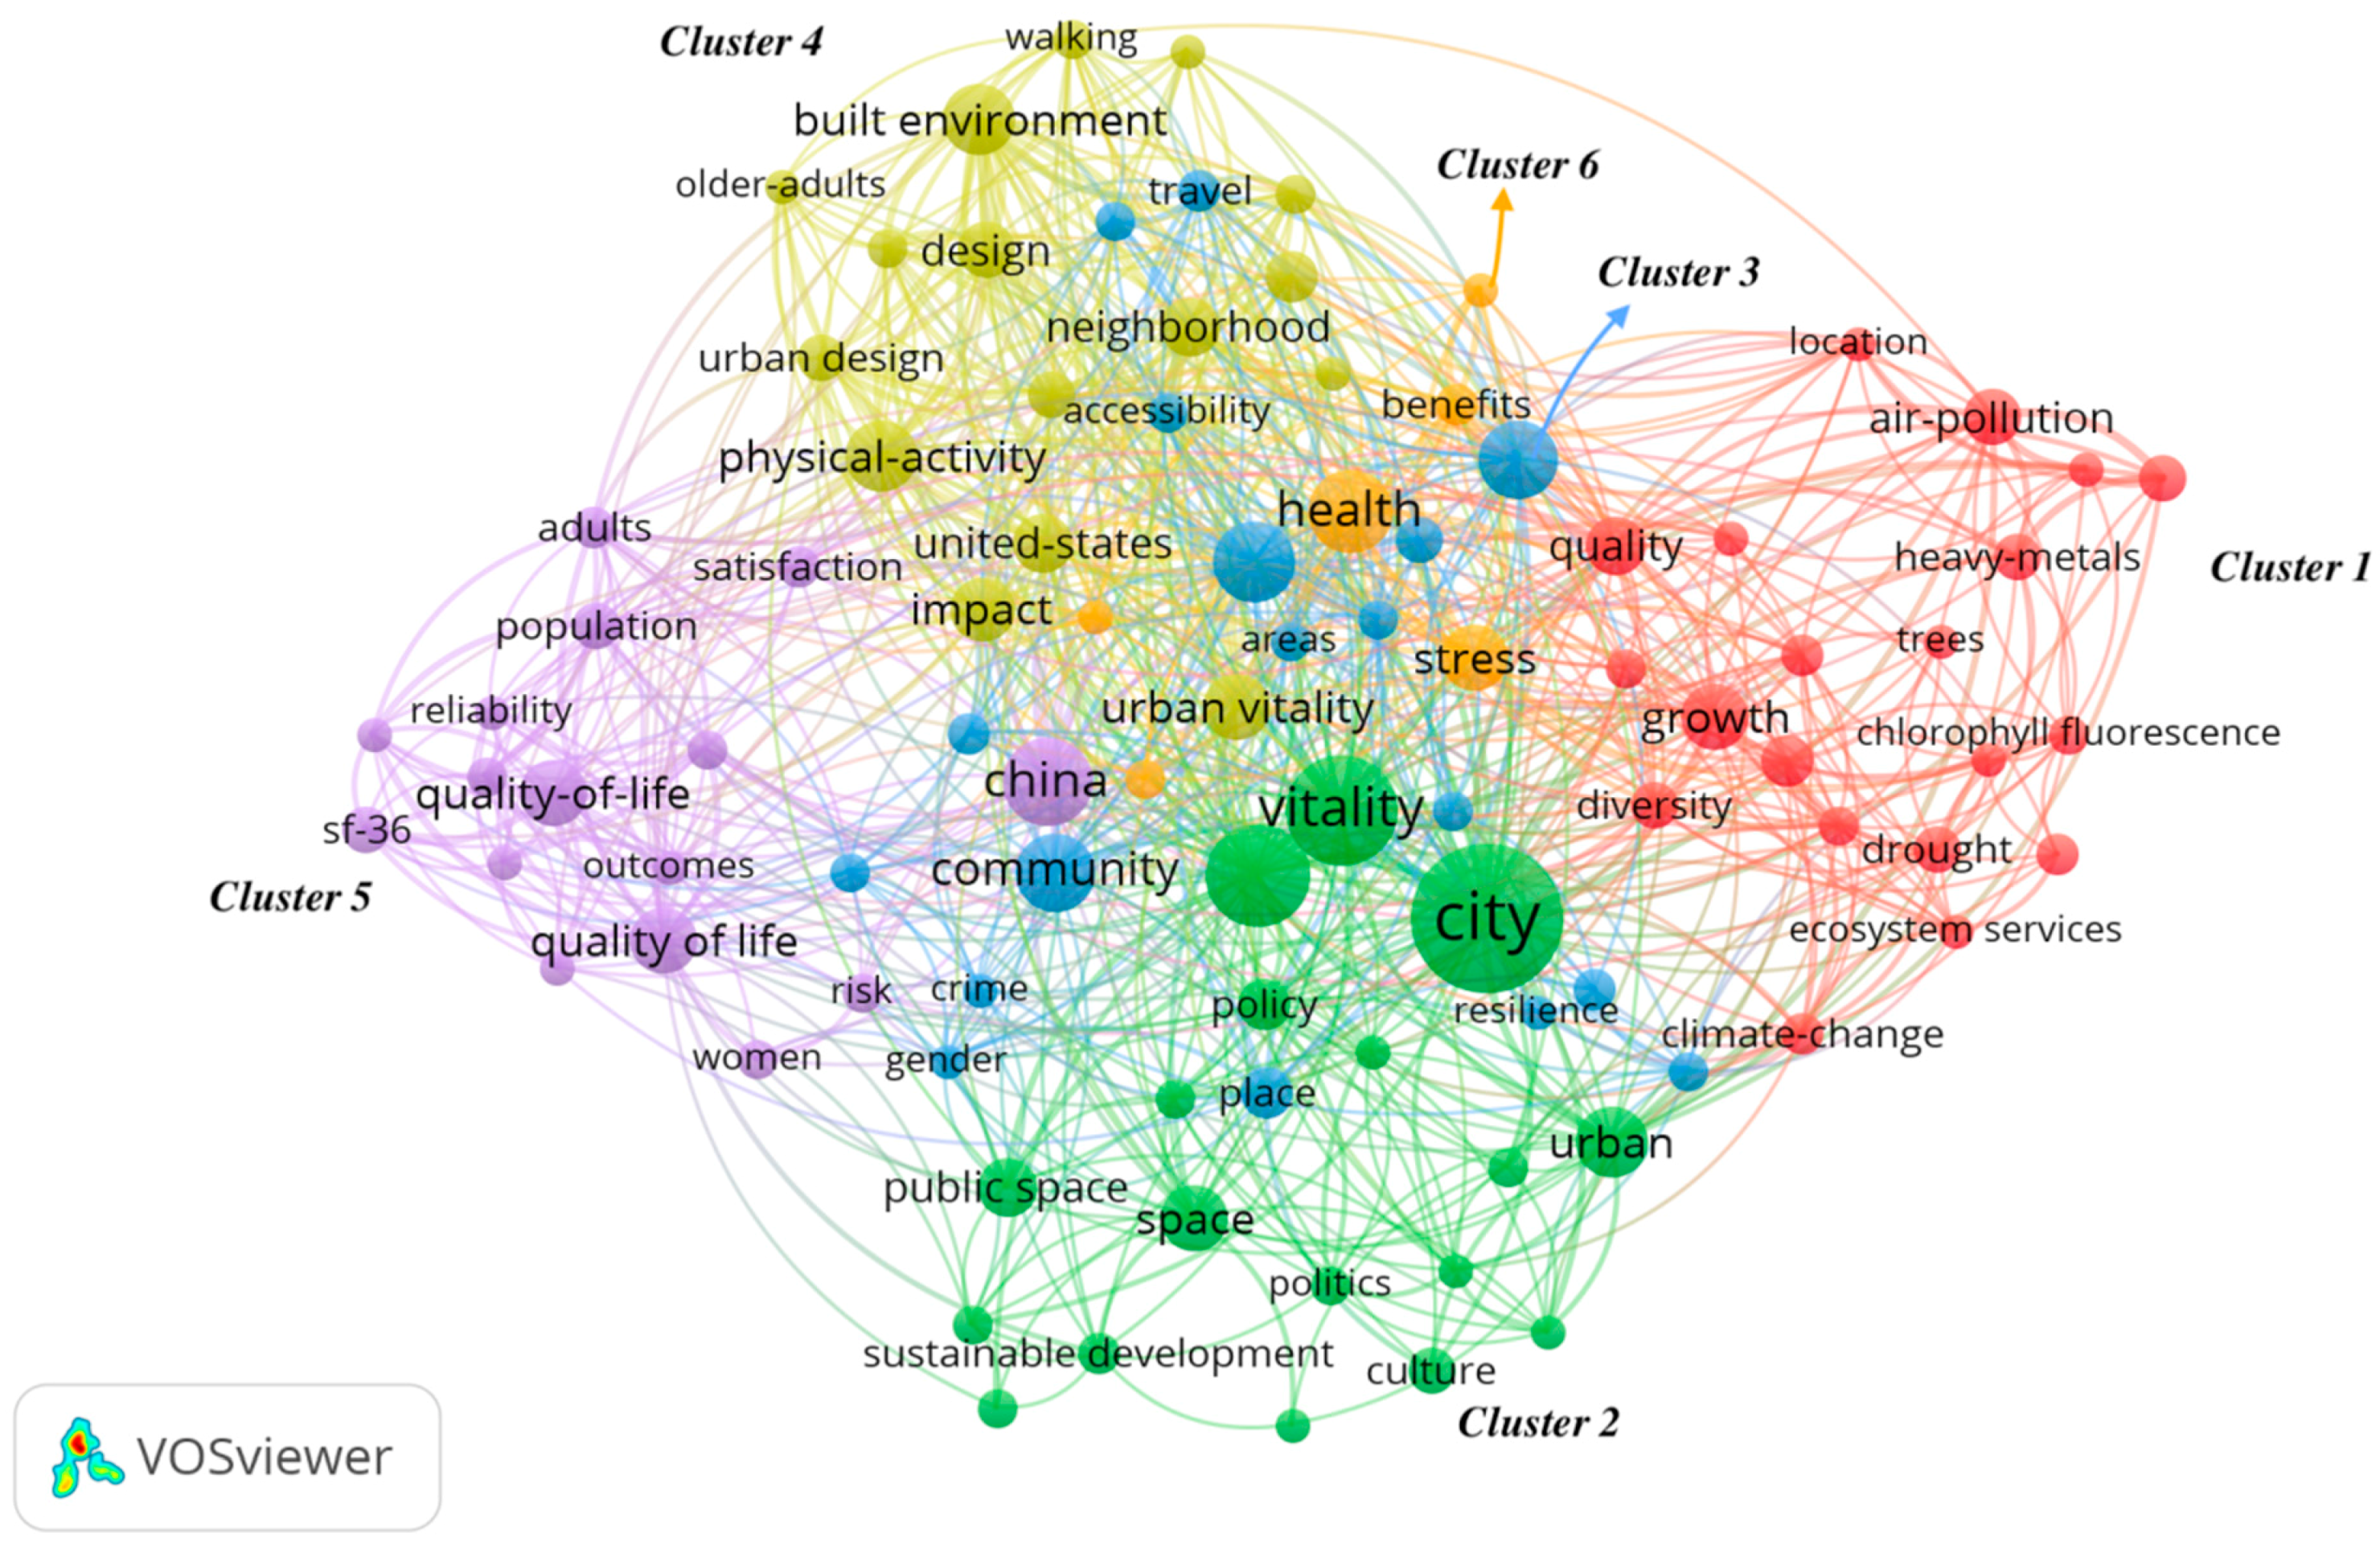
A total of 2334 keywords appeared in all the collected literature on urban vitality, which would be recognized by VOSviewer and displayed in the co-occurrence network ordinarily. But in order to understand the relationship among the documents, a selection condition was set in VOSviewer, which means that keywords with a frequency of more than 5 appearances can be recognized by the software. The result of the screening was that a total of 94 qualified keywords were successfully identified by the software. Then, we got a keywords co-occurrence network with 851 links on urban vitality research, as shown in Figure 3. In Figure 3, each node represents a keyword, the size of the node indicates the number of occurrences of the keyword, and the link connecting of the two nodes represents the relationship between the two keywords.
It can be clearly seen that the research theme of urban vitality has roughly formed six clusters in Figure 3, and there is a significant correlation between the keywords in each cluster. According to the current situation of urban vitality research, the six clusters were analyzed as follows.
- Cluster 1 (red): All the keywords of cluster 1 are listed in Table 4, in which “growth” appears the most, with a total of 13 occurrences, followed by “quality”, while “air-pollution”, “responses”, and “biomonitoring” are ranked 3rd–5th, respectively.
On the hand, “growth” in this cluster means the patterns of growth of a city. For example, He used association rule analysis to explore the relationship between different urban growth patterns on urban vitality, and the results indicated that different forms of urban growth have different effects on urban vitality [36]. On the other hand, “growth” refers to the growth of urban trees [56,57]. These keywords also include “drought”, “tree vitality”, “vegetation”, and “forest”. From this research perspective, these keywords seem to have no direct connection with urban vitality. However, in fact, the vegetation and green infrastructure in cities are considered as important components of the cityscape [58,59], and they are of great significance to people living in cities. At the same time, plants can create suitable places for human activities and can alleviate air pollution in the city, which is conducive to residents’ outdoor activities, leisure, and social interactions [60], effectively enhancing the vitality of the city [37,61].
- Cluster 2 (green): The most frequently used keyword for this cluster is “city”, where the city means a place where human activities can be satisfied. The same keywords include “cities”, “urban”, “space”, “public space”, “neighborhoods”, and “urban space” in Table 5. It is worth noting that keywords in a paper are often distributed in two or more clusters, which result in an interesting phenomenon in keywords co-occurrence networks; that is, there is a certain degree of overlap between different clusters.
Maintaining community vitality has become an important strategy for urban development [62], while outdoor public spaces are the most dynamic places in the city. Public space in cities, which are available to varying extents in all urban areas, can be used for outdoor activities, leisure and social interactions [60], which helps to improve the quality of life in urban areas and thus effectively enhances the vitality of cities [37,61]. On the other hand, the vitality and function of spaces largely depend on the comfortable conditions of people in these places [60]. Specifically, urban public space includes urban green space [37], historical blocks [63], walking streets [64,65], and so on; however, the city is a complex entity, and the efficiency of an urban public space is limited by many factors such as climate [62,66,67], vegetation [58], and historical buildings [62]. The issue of how to successfully transform the potential of public space use into high-quality life is an arduous task. Zhang used spatial syntax to describe the changes of the street structure in Shichahai Road, Beijing, and the results showed that Beijing is increasingly dependent on automobiles, which has reduced the vitality of Beijing to a certain extent [68]. These research results promote the trend of sustainable development of cities and become a scientific reference for policymakers.
- Cluster 3 (blue): The keywords (Table 6) of this cluster almost all appear in the relevant research on urban form and neighborhood vitality. In recent decades, neighborhood vitality has also received a growing amount of attention [69,70,71], and urban form is considered to be an effective way to promote neighborhood vitality [72,73]. Mixed land use, as the most typical feature of urban form, is the principal factor to be solved in the study of neighborhood vitality [42]; other characteristics include block density and accessibility [9,74,75]. These characteristics reflect differences in urban neighborhood characteristics in different urban forms, and these differences may have direct impacts on urban vitality [76]. Mixed land use can effectively promote neighborhood vitality, which is widely accepted in urban planning [77,78]. Similarly, traffic accessibility and block density can also be used to promote and maintain urban vitality [79]. At the same time, studies have shown that improving community vitality is an effective approach to reducing crime rates [80], alleviating gender discrimination [81], and enhancing community resilience [82].
- Cluster 4 (yellow): In Table 7, the keywords for the “built environment” appear most frequently. The “built environment” refers to places provided for human activities between buildings, including streets, green space, and other outdoor public space. In fact, all human physical activity takes place in the built environment. Conversely, it is precisely because of human activities that it brings vitality to the city and promotes economic growth and social development of the city. In academia, many documents describe the complex relationship between built environment, physical activity, and public health [83,84,85,86,87]. The urban building environment is characterized by high density and mixed land use, and the good street network between buildings provides space for walking and other physical activities [88,89]. The urban building environment contains a variety of human activity information [90], which usually exists in mobile location [91,92] and social media data with geotags [93,94]. By collecting and extracting these characteristics information (such as time, age, gender group, and region), the distribution of people in urban spaces can be revealed, and the relationship between human diversification behavior and urban vitality can be established [95]. These studies showed that good street networks and comfortable public environments are closely related to urban vitality [96], which can help guide policymakers and urban planners to conduct their actions and enhance street vitality through renovating the building environment.
- Cluster 5 (purple): The most frequent keyword of this cluster is “China”, followed by “quality of life” “population” in the Table 8, which may be because many scholars are very interested in the urban development of China as a developing country, and are especially interested in the specific population demographics in Chinese cities, including women, the elderly, and rural migrants. Improving the quality of life and living environments of these people is the most significant benefit of improving urban vitality. Studies had demonstrated that by improving the vitality of urban space through relevant measures, the number of women in this area will increase, and their quality of life will also be improved [97]. For urban migrants and the elderly, the same results apply. Therefore, it is also important to analyze the comfortable conditions of urban public spaces for the vitality of urban spaces.
- Cluster 6 (orange): The number of keywords in this cluster is the least of all; there are only six keywords (Table 9). As can be seen in Figure 3, the uniqueness of this cluster does not seem to be significant but is embedded in other clusters. The reason for this phenomenon may be because the keywords in cluster 6 and the keywords in other clusters have a strong correlation in meaning. For example, the keyword “health” with the highest number of occurrences in cluster 6 refers to the health status of residents. It is well known that “green space” and “urban environment” can improve the quality of life of residents [98], alleviate the working pressure of urban residents, and then improving the health level of residents [99,100,101]. Obviously, these keywords are closely related to “built environment” (cluster 4), “quality of life” (cluster 5), “public space” (cluster 2), “vitality” (cluster 2), “satisfaction” (cluster 5), “neighborhood” (cluster 4), and they often appear in the same paper.
It is not clear why VOSviewer classified these keywords into the same category and formed a new cluster instead of assigning them to other similar clusters. This reason needs to be explored in future work.
4. Further Discussion
Generally speaking, urban vitality has attracted more and more attention in academic circles. As described in this paper, urban vitality has formed a wide and diverse literature knowledge system. In terms of the number of publications, papers on urban vitality are showing a rapid growth trend, which may be caused by the acceptance of the concept of sustainable development across the world. In another sense, the increase in the number of papers reflects the requirements of urban residents necessary to improve the quality of life.
In terms of research topics, unlike traditional research on urban vitality, some scholars have conducted micro-observations on urban vitality by using new geographic data and have achieved many surprising research results in recent years. For example, social media registration data can reflect the population distribution and mobility in urban spaces, which has been widely used to analyze patterns of human mobility [102,103] and urban structures [104,105,106]. In the existing studies, the contribution of urban morphology to neighborhood vitality has not been fully or systematically measured, especially in Chinese cities. Because streets and public spaces are objectively physical places and do not have life characteristics, it follows that only users living in public spaces can reflect the vitality of streets and public spaces. Some scholars used GPS-facilitated activity diary data to analyze the impact of the urban form on neighborhood vitality. From the perspective of residents’ non-working activities around their neighbors, GPS-facilitated activity diary data can reflect the real interaction between residents and neighbors [42]. In addition, these data can also be used to analyze the socio-economic characteristics of residents to show how different types of residents can promote the vitality of neighborhoods under the influence of the urban form. In summary, although the research topics in the field of urban vitality are very diverse, scholars prefer the research topics of urban morphology, geographic data, human travel behavior, and so on. These topics have become hot topics in the study of urban vitality.
5. Conclusions
In conclusion, this paper evaluates urban vitality research from 1998–2018 through bibliometric analysis in order to quantitatively understand the literature trends related to the theme. The MKD analysis method based on Scientometrics has advantages of visualization, quantitative analysis, and knowledge discovery. This paper uses VOSviewer to carry out a multi-angle and complementary analysis of urban vitality research. The main conclusions are as follows:
- The increase in the number of articles indicates that the study of urban vitality in the global academic community is developing rapidly. According to the distribution of articles in different countries, the United States, China, and England rank in the top three, which indicates that these countries are the development centers and active areas of urban vitality research. In terms of source journals, Cities, Urban Forestry & Urban Greening, and Urban Design International are authoritative journals in the field of urban vitality research. They are important platforms for publishing and exchanging research results.
- Through the co-occurrence of keywords in the clustering network map and the analysis of urban vitality research activities, it is found that the frontier topics of urban vitality research include six representative areas. There are some overlaps among the six clusters, which shows that there are some similarities among different research topics. This result confirms that urban vitality is a cross-disciplinary research field.
In this study, we focus on the research topics and frontiers of urban vitality. We propose a systematic analysis based on MKD to determine the knowledge base, topic distribution, and research trends. In future research, the development of branches or themes of urban vitality research will be further studied. In the meanwhile, other bibliometric analysis tools (such as Citespace) will be considered in combination with the results of this paper. In addition, the weight of keywords, authors, and source journals will be the emphasis of the next study to make the results of this paper more meaningful.
Author Contributions
The research was designed and performed by J.-g.S. and W.M. The paper was written by J.-g.S. and W.M., and finally checked and revised by H.S. All authors read and approved the final manuscript.
Funding
This research received no external funding.
Acknowledgments
The authors are very grateful for the valuable comments and suggestions of the anonymous reviewers, which significantly improved the article.
Conflicts of Interest
The authors declare no conflict of interest.
References
- Alexander, C. The Timeless Way of Building; Oxford University Press: New York, NY, USA, 1979; Volume 1. [Google Scholar]
- Lynch, K. The Image of the City; MIT Press: Cambridge, MA, USA, 1960. [Google Scholar]
- Gehl, J. A Changing Street Life in a Changing Society. Places 1989, 6, 8–17. [Google Scholar]
- Montgomery, J. Making a City: Urbanity, Vitality and Urban Design. J. Urban Des. 1998, 3, 93–116. [Google Scholar] [CrossRef]
- Delclòs-Alió, X.; Miralles-Guasch, C. Looking at Barcelona through Jane Jacobs’s Eyes: Mapping the Basic Conditions for Urban Vitality in a Mediterranean Conurbation. 2018. Available online: https://www.sciencedirect.com/science/article/abs/pii/S0264837717314175 (accessed on 16 January 2019).
- Jacobs, J. The Death and Life of American Cities; Vintage: New York, NY, USA, 1992. First published 1961. [Google Scholar]
- Jacobs, J. The Life of Cities; Random House: New York, NY, USA, 1969. [Google Scholar]
- Lynch, K. Good City Form; MIT Press: Cambridge, MA, USA, 1984. [Google Scholar]
- Maas, P.R. Towards a Theory of Urban Vitality; University of British Columbia: Vancouver, BC, Canada, 1984. [Google Scholar]
- March, A.; Rijal, Y.; Wilkinson, S.; Firidin Özgür, E. Measuring Building Adaptability and Street Vitality. 2012. Available online: https://rsa.tandfonline.com/doi/abs/10.1080/02697459.2012.715813 (accessed on 16 January 2019).
- Bowes, D.R.; Ihlanfeldt, K.R. Identifying the impacts of rail transit stations on residential property values. J. Urban Econ. 2001, 50, 1–25. [Google Scholar] [CrossRef]
- Lunecke, M.G.H.; Mora, R. The layered city: Pedestrian networks in downtown Santiago and their impact on urban vitality. J. Urban Des. 2018, 23, 336–353. [Google Scholar] [CrossRef]
- Colwell, P.F.; Dehring, C.A.; Turnbull, G.K. Recreation demand and residential location. J. Urban Econ. 2002, 51, 418–428. [Google Scholar] [CrossRef]
- Smith, R.; Miller, K. Eco-city mapping using GIS: Introducing a planning method for assessing and improving neighborhood vitality. Prog. Community Health Partnersh. Res. Educ. Act. 2013, 7, 95–106. [Google Scholar] [CrossRef] [PubMed]
- Dubin, R.A.; Sung, C.H. Specification of hedonic regressions: Non-nested tests on measures of neighborhood quality. J. Urban Econ. 1990, 27, 97–110. [Google Scholar] [CrossRef]
- Van Lenthe, F.J.; Brug, J.; Mackenbach, J.P. Neighborhood inequalities in physical inactivity: The role of neighborhood attractiveness, proximity to local facilities and safety in The Netherlands. Soc. Sci. Med. 2005, 60, 763–775. [Google Scholar]
- Chhetri, P.; Stimson, R.J.; Western, J.S. Modelling the factors of neighborhood attractiveness reflected in residential location decision choices. Stud. Reg. Sci. 2006, 36, 393–417. [Google Scholar] [CrossRef]
- Borgman, C.L.; Furner, J. Scholarly communication and bibliometrics. Annu. Rev. Inf. Sci. Technol. 2002, 36, 3–72. [Google Scholar]
- Li, X.; Nan, R. A bibliometric analysis of eutrophication literatures: An expanding and shifting focus. Environ. Sci. Pollut. Res. 2017, 24, 17103–17115. [Google Scholar] [CrossRef] [PubMed]
- Ravichandran, P. Bibliometric analysis on publication trends in the biodiversity research: A study. J. Adv. Libr. Inf. Sci. 2012, 1, 94–99. [Google Scholar]
- Okubo, Y. Bibliometric Indicators and Analysis of Research Systems: Methods and Examples. 1997. Available online: https://www.oecd-ilibrary.org/science-and-technology/bibliometric-indicators-and-analysis-of-research-systems_208277770603 (accessed on 16 January 2019).
- Van Raan, A.F.J. Advances in bibliometric analysis: research performance assessment and science mapping. In Bibliometrics: Use and Abuse in the Review of Research Performance; Blockmans, W., Engwall, L., Weaire, D., Eds.; Wenner-Gren International Series; Portland Press Ltd.: London, UK, 2014; pp. 17–28. [Google Scholar]
- Zhang, Y.; Yao, X.; Qin, B. A critical review of the development, current hotspots, and future directions of lake taihu research from the bibliometric perspective. Environ. Sci. Pollut. Res. 2016, 23, 12811–12821. [Google Scholar] [CrossRef] [PubMed]
- Li, J.; Wang, M.H.; Ho, Y.S. Trends in research on global climate change: A science citation index expanded-based analysis. Glob. Planet. Chang. 2011, 77, 13–20. [Google Scholar] [CrossRef]
- Liao, J.; Huang, Y. Global trend in aquatic ecosystem research from 1992 to 2011. Scientometrics 2014, 98, 1203–1219. [Google Scholar] [CrossRef]
- Yu, H.; Zhi, Z.; Zhang, C.; Yang, H. Research on literature involving zirconia-based on Pubmed database: A bibliometric analysis. Curr. Sci. 2017, 112, 1134. [Google Scholar] [CrossRef]
- Merigó, J.M.; Yang, J. A bibliometric analysis of operations researches and management science. Omega 2017, 73, 37–48. [Google Scholar] [CrossRef]
- Azevedo, P.G.; Mesquita, F.O.; Young, R.J. Fishing for gaps in science: A bibliographic analysis of Brazilian freshwater ichthyology from 1986 to 2005. J. Fish Biol. 2005, 76, 2177–2193. [Google Scholar] [CrossRef]
- Si, H.; Shi, J.G.; Wu, G.; Chen, J.; Zhao, X. Mapping the bike sharing research published from 2010 to 2018: A scientometric review. J. Clean. Prod. 2018, 213, 415–427. [Google Scholar] [CrossRef]
- Milanez, D.H.; Schiavi, M.T.; Amaral, R.M.; Faria, L.I.L.; Gregolin, J.A.R. Development of carbon-based nanomaterials indicators using the analytical tools and data provided by the web of science database. Mater. Res. 2013, 16, 1282–1293. [Google Scholar] [CrossRef] [Green Version]
- Boudry, C.; Baudouin, C.; Mouriaux, F. International publication trends in dry eye disease research: A bibliometric analysis. Ocul. Surf. 2018, 16, 173–179. [Google Scholar] [CrossRef] [PubMed] [Green Version]
- Fu, H.Z.; Wang, M.H.; Ho, Y.S. Mapping of drinking water research: A bibliometric analysis of research output during 1992–2011. Sci. Total Environ. 2013, 443, 757–765. [Google Scholar] [CrossRef] [PubMed]
- Chen, J.; Su, Y.; Si, H.; Chen, J. Managerial Areas of Construction and Demolition Waste: A Scientometric Review. Int. J. Environ. Res. Public Health 2018, 15, 2350. [Google Scholar] [CrossRef] [PubMed]
- Van Eck, N.J.; Ludo, W. Software survey: VOSviewer, a computer program for bibliometric mapping. Scientometrics 2010, 84, 523–538. [Google Scholar] [CrossRef]
- Landry, C. Urban vitality: A new source of urban competitiveness. Prince Claus Fund J. 2000, 12, 8–13. [Google Scholar]
- Li, M.; Shen, Z.; Hao, X. Revealing the relationship between spatio-temporal distribution of population and urban function with social media data. GeoJournal 2016, 81, 919–935. [Google Scholar] [CrossRef]
- Lopes, M.N.; Camanho, A.S. Public green space use and consequences on urban vitality: An assessment of European cities. Soc. Indic. Res. 2013, 113, 751–767. [Google Scholar] [CrossRef]
- Yuan, M.; Song, Y.; Hong, S.; Huang, Y. Evaluating the effects of compact growth on air quality in already-high-density cities with an integrated land use-transport-emission model: A case study of Xiamen, China. Habitat Int. 2017, 69, 37–47. [Google Scholar] [CrossRef]
- He, Q.; He, W.; Song, Y.; Wu, J.; Yin, C.; Mou, Y. The Impact of Urban Growth Patterns on Urban Vitality in Newly Built-Up Areas Based on an Association Rules Analysis Using Geographical ‘Big Data’. 2018. Available online: https://www.sciencedirect.com/science/article/abs/pii/S0264837718306938 (accessed on 16 January 2019).
- Jin, X.; Long, Y.; Sun, W.; Lu, Y.; Yang, X.; Tang, J. Evaluating cities’ vitality and identifying ghost cities in China with emerging geographical data. Cities 2017, 63, 98–109. [Google Scholar] [CrossRef]
- Wu, C.; Ye, X.; Ren, F.; Du, Q. Check-in behaviour and spatio-temporal vibrancy: An exploratory analysis in Shenzhen, China. Cities 2018, 77, 104–116. [Google Scholar] [CrossRef]
- Wu, J.; Ta, N.; Song, Y.; Lin, J.; Chai, Y. Urban form breeds neighborhood vibrancy: A case study using a GPS-based activity survey in suburban Beijing. Cities 2018, 74, 100–108. [Google Scholar] [CrossRef]
- Kennedy, C.; Cuddihy, J.; Engel-Yan, J. The changing metabolism of cities. J. Ind. Ecol. 2007, 11, 43–59. [Google Scholar] [CrossRef]
- Turok, I.; Mykhnenko, V. The trajectories of European cities, 1960–2005. Cities 2007, 24, 165–182. [Google Scholar] [CrossRef] [Green Version]
- Chen, L.; Ng, E. Outdoor thermal comfort and outdoor activities: A review of research in the past decade. Cities 2012, 29, 118–125. [Google Scholar] [CrossRef]
- Markusen, A. Urban development and the politics of a creative class: Evidence from a study of artists. Environ. Plan. A 2006, 38, 1921–1940. [Google Scholar] [CrossRef]
- Clark, T.N.; Lloyd, R.; Wong, K.K.; Jain, P. Amenities drive urban growth. J. Urban Aff. 2002, 24, 493–515. [Google Scholar] [CrossRef]
- Olden, J.D.; Naiman, R.J. Incorporating thermal regimes into environmental flows assessments: Modifying dam operations to restore freshwater ecosystem integrity. Freshw. Biol. 2010, 55, 86–107. [Google Scholar] [CrossRef]
- Elley, C.R.; Kerse, N.; Arroll, B.; Robinson, E. Effectiveness of counselling patients on physical activity in general practice: Cluster randomized controlled trial. BMJ 2003, 326, 793. [Google Scholar] [CrossRef] [PubMed]
- Tyrväinen, L.; Ojala, A.; Korpela, K.; Lanki, T.; Tsunetsugu, Y.; Kagawa, T. The influence of urban green environments on stress relief measures: A field experiment. J. Environ. Psychol. 2014, 38, 1–9. [Google Scholar] [CrossRef]
- Rozati, R.; Reddy, P.P.; Reddanna, P.A.; Mujtaba, R. Role of environmental estrogens in the deterioration of male factor fertility. Fertil. Steril. 2002, 78, 1187–1194. [Google Scholar] [CrossRef]
- Wheelock, J.; Jones, K. ‘Grandparents are the next best thing’: Informal childcare for working parents in urban Britain. J. Soc. Policy 2002, 31, 441–463. [Google Scholar] [CrossRef]
- Liu, X.; Zhang, L.; Hong, S. Global biodiversity research during 1900–2009: A bibliometric analysis. Biodivers. Conserv. 2011, 20, 807–826. [Google Scholar] [CrossRef]
- Wang, H.J.; Liu, M.Y.; Hong, S.; Zhuang, Y.H. A historical review and bibliometric analysis of GPS research from 1991–2010. Scientometrics 2013, 95, 35–44. [Google Scholar] [CrossRef]
- Guo, L.; Xu, F.; Feng, Z.; Zhang, G. A bibliometric analysis of oyster research from 1991 to 2014. Aquacult. Int. 2016, 24, 327–344. [Google Scholar] [CrossRef]
- Sand, E.; Konarska, J.; Howe, A.W.; Andersson-Sköld, Y.; Moldan, F.; Pleijel, H.; Uddling, J. 2018. Effects of ground surface permeability on the growth of urban linden trees. Urban Ecosyst. 2018, 21, 1–6. [Google Scholar] [CrossRef]
- Stavretović, N.; Vučković, M.; Stajić, B. Classification of trees and tree species in Obrenovac “Mali Park” by the elements of growth, vitality and ornamentalness. Arch. Biol. Sci. 2010, 62, 1119–1124. [Google Scholar] [CrossRef]
- Moser, A.; Roetzer, T.; Pauleit, S.; Pretzsch, H. City trees: Growth, functions and services-risks and research prospects. Allg. Forst Und Jagdztg. 2017, 188, 94–111. [Google Scholar]
- Van den Berg, A.E.; Jorgensen, A.; Wilson, E.R. Evaluating restoration in urban green spaces: Does setting type make a difference? Landsc. Urban Plan. 2014, 127, 173–181. [Google Scholar] [CrossRef] [Green Version]
- Rossi, F.; Anderini, E.; Castellani, B.; Nicolini, A.; Morini, E. Integrated improvement of occupants’ comfort in urban areas during outdoor events. Build. Environ. 2015, 93, 285–292. [Google Scholar] [CrossRef]
- Benson, E. Rivers as urban landscapes: Renaissance of the waterfront. Water Sci. Technol. 2002, 45, 65–70. [Google Scholar] [CrossRef] [PubMed]
- Li, X.; Lv, Z.; Zheng, Z.; Zhong, C.; Hijazi, I.H.; Cheng, S. Assessment of Lively Street Network Based on Geographic Information System and Space Syntax. 2017. Available online: https://link.springer.com/article/10.1007/s11042-015-3095-2 (accessed on 16 January 2019).
- Cubillos-González, R.A.; Castillo-García, L.S. The Climate as a Key Factor of Public Life in European Cities. 2016. Available online: http://www.archnet-ijar.net/index.php/IJAR/article/view/825 (accessed on 16 January 2019).
- Forsyth, A. What is a walkable place? The walkability debate in urban design. Urban Des. Int. 2015, 20, 274–292. [Google Scholar] [CrossRef] [Green Version]
- Dičiūnaitė-Rauktienė, R.; Gurskienė, V.; Burinskienė, M.; Maliene, V. The usage and perception of pedestrian zones in Lithuanian cities: Multiple criteria and comparative analysis. Sustainability 2018, 10, 818. [Google Scholar] [CrossRef]
- Paddeu, D. Sustainable Solutions for Urban Freight Transport and Logistics: An Analysis of Urban Consolidation Centers. In Sustainable Freight Transport; Springer: Berlin, Germany, 2018; pp. 121–137. [Google Scholar]
- Greve, A.I. Sustainable development, climate change adaptation and disaster management. In Sustainable Development and Disaster Risk Reduction; Springer: Berlin, Germany, 2016; pp. 13–36. [Google Scholar]
- Zhang, J.; Zhang, J.; Yu, S.; Zhou, J. The Sustainable Development of Street Texture of Historic and Cultural Districts―A Case Study in Shichahai District, Beijing. Sustainability 2018, 10, 2343. [Google Scholar] [CrossRef]
- Leventhal, T.; Brooks-Gunn, J. The neighborhoods they live in: The effects of neighborhood residence on child and adolescent outcomes. Psychol. Bull. 2000, 126, 309–337. [Google Scholar] [CrossRef]
- Morland, K.; Wing, S.; Diez Roux, A.; Poole, C. Neighborhood characteristics associated with the location of food stores and food service places. Am. J. Prev. Med. 2002, 22, 23–29. [Google Scholar] [CrossRef]
- Sampson, R.J.; Morenoff, J.D.; Gannon-Rowley, T. Assessing “neighborhood effects”: Social processes and new directions in research. Annu. Rev. Soc. 2002, 28, 443–478. [Google Scholar] [CrossRef]
- Van Eck, J.R.; Koomen, E. Characterizing urban concentration and land-use diversity in simulations of future land use. Ann. Reg. Sci. 2008, 42, 123–140. [Google Scholar] [CrossRef]
- Yue, Y.; Zhuang, Y.; Yeh, A.G.O.; Xie, J.-Y.; Ma, C.-L.; Li, Q.-Q. Measurements of POI-based mixed use and their relationships with neighborhood vibrancy. Int. J. Geogr. Inf. Sci. 2017, 31, 658–675. [Google Scholar] [CrossRef]
- Merlino, K.R. Urban Grain and the Vibrancy of Older Neighborhoods: Metrics and Measures. 2010. Available online: https://books.google.com.hk/books?hl=en&lr=&id=79M5AwAAQBAJ&oi=fnd&pg=PA477&dq=Urban+grain+and+the+vibrancy+of+older+neighborhoods:+Metrics+and+measures.+&ots=D24b9x1cX8&sig=REmBVz0Cib6be6cvrEgSMLx3euA&redir_esc=y#v=onepage&q=Urban%20grain%20and%20the%20vibrancy%20of%20older%20neighborhoods%3A%20Metrics%20and%20measures.&f=false (accessed on 16 January 2019).
- Song, Y.; Quercia, R.G. How are neighborhood design features valued across different neighborhood types? J. Hous. Built Environ. 2008, 23, 297–316. [Google Scholar] [CrossRef]
- Sung, H.; Lee, S. Residential built environment and walking activity: Empirical evidence of Jane Jacobs’ urban vitality. Transp. Res. Part D Transp. Environ. 2015, 41, 318–329. [Google Scholar] [CrossRef]
- Song, Y.; Gordon-Larsen, P.; Popkin, B. A national-level analysis of neighborhood form metrics. Landsc. Urban Plan. 2013, 116, 73–85. [Google Scholar] [CrossRef] [PubMed] [Green Version]
- Song, Y.; Knaap, G. Measuring the effects of mixed land uses on housing values. Reg. Sci. Urban Econ. 2004, 34, 663–680. [Google Scholar] [CrossRef]
- Rashid, M.; Bindajam, A.A.A. Space, movement and heritage planning of the historic cities in islamic societies: learning from the old city of Jeddah, SaudiArabia. Urban Des. Int. 2015, 20, 107–129. [Google Scholar] [CrossRef]
- Stead, D.; Hoppenbrouwer, E. Promoting an urban renaissance in England and The Netherlands. Cities 2004, 21, 119–136. [Google Scholar] [CrossRef]
- Parish, W.L.; Luo, Y.; Stolzenberg, R.; Laumann, E.O.; Farrer, G.; Pan, S. Sexual practices and sexual satisfaction: A population based study of Chinese urban adults. Arch. Sex. Behav. 2007, 36, 5–20. [Google Scholar] [CrossRef] [PubMed]
- Kamei, M.; Hanaki, K.; Kurisu, K. Tokyo’s long-term Socioeconomic Pathways: Towards a sustainable future. Sustain. Cities Soc. 2016, 27, 73–82. [Google Scholar] [CrossRef]
- Owen, N.; Humpel, N.; Leslie, E.; Bauman, A.; Sallis, J.F. Understanding environmental influences on walking review and research agenda. Am. J. Prev. Med. 2004, 27, 67–76. [Google Scholar] [CrossRef]
- Bauman, A.E.; Bull, F.C. Environmental Correlates of Physical Activity and Walking in Adults and Children: A Review of Reviews. 2007. Available online: http://citeseerx.ist.psu.edu/viewdoc/download?doi=10.1.1.453.2573&rep=rep1&type=pdf (accessed on 16 January 2019).
- Durand, C.P.; Andalib, M.; Dunton, G.F.; Wolch, J.; Pentz, M.A. A systematic review of built environment factors related to physical activity and obesity risk: Implications for smart growth urban planning. Obes. Rev. 2011, 12, 172–182. [Google Scholar] [CrossRef]
- McCormack, G.R.; Shiell, A. In search of causality: a systematic review of the relationship between the built environment and physical activity among adults. Int. J. Behav. Nutr. Phys. Activ. 2011, 8, 125–136. [Google Scholar] [CrossRef]
- Soltani, A.; Hoseini, S.H. An analysis of the connection built environment, physical activity and health: Comparing three urban neighborhoods from Shiraz, Iran. Int. J. Urban Sci. 2014, 18, 19–30. [Google Scholar] [CrossRef]
- Lovasi, G.; Grady, S.; Rundle, A. Steps forward: Review and recommendations for research on walkability, physical activity and cardiovascular health. Public Health Rev. 2012, 33, 484–506. [Google Scholar] [CrossRef] [PubMed]
- Sallis, J.F.; Floyd, M.F.; Rodriguez, D.A.; Saelens, B.E. Role of built environments in physical activity, obesity, and cardiovascular disease. Circulation 2012, 125, 729–737. [Google Scholar] [CrossRef] [PubMed]
- Kim, Y.L. Seoul’s Wi-Fi Hotspots: Wi-Fi Access Points as an Indicator of Urban Vitality. 2018. Available online: https://www.sciencedirect.com/science/article/pii/S0198971517305203 (accessed on 16 January 2019).
- Andrienko, G.; Andrienko, N.; Hurter, C.; Rinzivillo, S.; Wrobel, S. Scalable Analysis of Movement Data for Extracting and Exploring Significant Places. 2013. Available online: https://ieeexplore.ieee.org/document/6361385 (accessed on 16 January 2019).
- Zhang, J.; Yanli, E.; Ma, J.; Zhao, Y.; Xu, B.; Sun, L.; Chen, J.; Yuan, X. Visual Analysis of Public Utility Service Problems in a Metropolis. 2014. Available online: https://ieeexplore.ieee.org/abstract/document/6876008 (accessed on 16 January 2019).
- Chen, S.; Yuan, X.; Wang, Z.; Guo, C.; Liang, J.; Wang, Z.; Zhang, X.L.; Zhang, J. Interactive Visual Discovering of Movement Patterns from Sparsely Sampled Geo-Tagged Social Media Data. 2016. Available online: https://ieeexplore.ieee.org/abstract/document/7192688 (accessed on 16 January 2019).
- Miranda, F.; Doraiswamy, H.; Lage, M.; Zhao, K.; Gonçalves, B.; Wilson, L.; Hsieh, M.; Silva, C.T. Urban Pulse: Capturing the Rhythm of Cities. 2017. Available online: https://ieeexplore.ieee.org/abstract/document/7539380 (accessed on 16 January 2019).
- Sulis, P.; Manley, E.; Zhong, C.; Batty, M. Using mobility data as proxy for measuring urban vitality. J. Spat. Inf. Sci. 2018, 16, 137–162. [Google Scholar] [CrossRef]
- Xu, X.; Xu, X.; Guan, P.; Ren, Y.; Wang, W.; Xu, N. The Cause and Evolution of Urban Street Vitality under the Time Dimension: Nine Cases of Streets in Nanjing City, China. Sustainability 2018, 10, 2797. [Google Scholar] [CrossRef]
- Khalili, A.; Fallah, S.N. Role of social indicators on vitality parameter to enhance the quality of women’s communal life within an urban public space (case: Isfahan’s traditional bazaar, Iran). Front. Archit. Res. 2018, 7, 440–454. [Google Scholar] [CrossRef]
- Baptista Neto, O.; Barbosa, H.M. Impacts of Traffic Calming Interventions on Urban Vitality. 2015. Available online: https://www.icevirtuallibrary.com/doi/abs/10.1680/jurdp.15.00007 (accessed on 16 January 2019).
- Anderson, J.; Ruggeri, K.; Steemers, K.; Huppert, F. Lively Social Space, Well-Being Activity, and Urban Design: Findings from a Low-Cost Community-Led Public Space Intervention. Environ. Behav. 2017, 49, 685–716. [Google Scholar] [CrossRef]
- Marquet, O.; Miralles-Guasch, C. Introducing urban vitality as a determinant of children’s healthy mobility habits: A focus on activity engagement and physical activity. 2016. Available online: https://www.tandfonline.com/doi/abs/10.1080/14733285.2016.1157572 (accessed on 16 January 2019).
- Hodson, C.B.; Sander, H.A. Green urban landscapes and school-level academic performance. Landsc. Urban Plan. 2017, 160, 16–27. [Google Scholar] [CrossRef]
- Wu, L.; Zhi, Y.; Sui, Z.; Liu, Y. Intra-urban human mobility and activity transition: Evidence from social media check-in data. 2014. Available online: https://journals.plos.org/plosone/article?id=10.1371/journal.pone.0097010 (accessed on 16 January 2019).
- Jurdak, R.; Zhao, K.; Liu, J.; AbouJaoude, M.; Cameron, M.; Newth, D. Understanding human mobility from twitter. 2015. Available online: https://journals.plos.org/plosone/article?id=10.1371/journal.pone.0131469 (accessed on 16 January 2019).
- Liu, X.; Kang, C.; Gong, L.; Liu, Y. Incorporating spatial interaction patterns in classifying and understanding urban land use. Int. J. Geogr. Inf. Sci. 2016, 30, 334–350. [Google Scholar] [CrossRef]
- Wu, C.; Ye, X.; Ren, F.; Wan, Y.; Ning, P.; Du, Q. Spatial and social media data analytics of housing prices in Shenzhen, China. 2016. Available online: https://journals.plos.org/plosone/article?id=10.1371/journal.pone.0164553 (accessed on 16 January 2019).
- Zhi, Y.; Li, H.; Wang, D.; Deng, M.; Wang, S.; Gao, J.; Duan, Z.; Liu, Y. Latent spatio- temporal activity structures: A new approach to inferring intra-urban functional regions via social media check-in data. 2016. Available online: https://www.tandfonline.com/doi/abs/10.1080/10095020.2016.1176723 (accessed on 16 January 2019).
Figure 1.
Quantitative distribution of published articles in urban vitality studies, 1998–2018.

Figure 2.
The density of main research countries in urban vitality studies, 1998–2018.

Figure 3.
The keywords co-occurrence network of urban vitality studies.


Table 1.
Top 10 journals ranked by total publications, 1998–2018.
| Rank | Journal | Quantity |
|---|---|---|
| 1 | Cities | 14 |
| 2 | Urban Forestry & Urban Greening | 10 |
| 3 | Urban Design International | 9 |
| 4 | Sustainability | 7 |
| 5 | PloS One | 6 |
| 6 | Transportation Research Record | 6 |
| 7 | Habitat International | 5 |
| 8 | Journal of Urban History | 5 |
| 9 | City Community | 4 |
| 10 | Environmental Pollution | 4 |
Table 2.
Top 10 most cited papers, 1998–2018.
| Rank | Title | Journal | Year | Quantity |
|---|---|---|---|---|
| 1 | The changing metabolism of cities | Journal of Industrial Ecology | 2007 | 445 |
| 2 | Urban development and the politics of a creative class: evidence from a study of artists | Environment and Planning A | 2006 | 376 |
| 3 | Effectiveness of counselling patients on physical activity in general practice: cluster randomized controlled trial | British Medical Journal | 2003 | 303 |
| 4 | Incorporating thermal regimes into environmental flows assessments: modifying dam operations to restore freshwater ecosystem integrity | Freshwater Biology | 2010 | 282 |
| 5 | The trajectories of European cities, 1960–2005 | Cities | 2007 | 219 |
| 6 | Amenities drive urban growth | Journal of Urban Affairs | 2002 | 188 |
| 7 | The influence of urban green environments on stress relief measures: A field experiment | Journal of Environmental Psychology | 2014 | 140 |
| 8 | Role of environmental estrogens in the deterioration of male factor fertility | Fertility and Sterility | 2002 | 139 |
| 9 | ’Grandparents are the next best thing’: Informal childcare for working parents in urban Britain | Journal of Social Policy | 2002 | 139 |
| 10 | Outdoor thermal comfort and outdoor activities: A review of research in the past decade | Cities | 2012 | 121 |
Table 3.
Top 10 productive countries in urban vitality studies, 1998–2018.
| Rank | Countries/Territories | Region | Quantity |
|---|---|---|---|
| 1 | USA | North America | 128 |
| 2 | Peoples R China | Asia | 48 |
| 3 | England | Europe | 40 |
| 4 | Australia | Oceania | 23 |
| 5 | The Netherlands | Europe | 23 |
| 6 | Italy | Europe | 19 |
| 7 | Germany | Europe | 15 |
| 8 | Spain | Europe | 15 |
| 9 | Iran | Central Asia | 14 |
| 10 | Portugal | Europe | 13 |
Table 4.
The keywords information for cluster 1.
| Number | Keywords | Occurrences | Total Link Strength |
|---|---|---|---|
| 1 | growth | 13 | 32 |
| 2 | quality | 11 | 40 |
| 3 | air-pollution | 10 | 34 |
| 4 | responses | 9 | 24 |
| 5 | biomonitoring | 8 | 23 |
| 6 | diversity | 8 | 19 |
| 7 | drought | 8 | 19 |
| 8 | dynamics | 5 | 11 |
| 9 | heavy-metals | 8 | 21 |
| 10 | climate-change | 7 | 25 |
| 11 | tree vitality | 7 | 8 |
| 12 | vegetation | 7 | 21 |
| 13 | chlorophyll fluorescence | 6 | 17 |
| 14 | forest | 6 | 18 |
| 15 | management | 6 | 11 |
| 16 | air pollution | 5 | 17 |
| 17 | ecosystem services | 5 | 14 |
| 18 | location | 5 | 21 |
| 19 | plants | 5 | 12 |
| 20 | trees | 5 | 9 |
Table 5.
The keywords information for cluster 2.
| Number | Keywords | Occurrences | Total Link Strength |
|---|---|---|---|
| 1 | city | 40 | 102 |
| 2 | vitality | 26 | 51 |
| 3 | cities | 24 | 79 |
| 4 | urban | 14 | 40 |
| 5 | space | 13 | 31 |
| 6 | public space | 11 | 18 |
| 7 | policy | 9 | 24 |
| 8 | culture | 8 | 8 |
| 9 | sustainable development | 7 | 12 |
| 10 | geography | 6 | 15 |
| 11 | neighborhoods | 6 | 13 |
| 12 | politics | 6 | 13 |
| 13 | technology | 6 | 16 |
| 14 | urban space | 6 | 6 |
| 15 | gentrification | 5 | 18 |
| 16 | infrastructure | 5 | 16 |
| 17 | space syntax | 5 | 5 |
| 18 | urban development | 5 | 8 |
Table 6.
The keywords information for cluster 3.
| Number | Keywords | Occurrences | Total Link Strength |
|---|---|---|---|
| 1 | environment | 17 | 50 |
| 2 | community | 16 | 28 |
| 3 | sustainability | 16 | 34 |
| 4 | place | 9 | 20 |
| 5 | urban regeneration | 8 | 14 |
| 6 | governance | 7 | 11 |
| 7 | model | 7 | 15 |
| 8 | travel | 7 | 30 |
| 9 | accessibility | 6 | 16 |
| 10 | areas | 6 | 19 |
| 11 | climate change | 6 | 18 |
| 12 | migration | 6 | 13 |
| 13 | transportation | 6 | 20 |
| 14 | urban form | 6 | 28 |
| 15 | urban planning | 6 | 10 |
| 16 | crime | 5 | 12 |
| 17 | gender | 5 | 19 |
| 18 | resilience | 5 | 8 |
Table 7.
The keywords information for cluster 4.
| Number | Keywords | Occurrences | Total Link Strength |
|---|---|---|---|
| 1 | Built Environment | 14 | 68 |
| 2 | Physical-activity | 14 | 51 |
| 3 | Urban Vitality | 13 | 41 |
| 4 | Impact | 12 | 25 |
| 5 | Neighborhood | 11 | 54 |
| 6 | United-States | 11 | 30 |
| 7 | Design | 10 | 39 |
| 8 | Behavior | 9 | 30 |
| 9 | Land-use | 8 | 40 |
| 10 | Urban Design | 8 | 34 |
| 11 | Walkability | 6 | 31 |
| 12 | Walking | 6 | 27 |
| 13 | Walking Activity | 6 | 34 |
| 14 | Density | 5 | 18 |
| 15 | Determinants | 5 | 19 |
| 16 | Older-adults | 5 | 17 |
Table 8.
The keywords information for cluster 5.
| Number | Keywords | Occurrences | Total Link Strength |
|---|---|---|---|
| 1 | China | 19 | 60 |
| 2 | Quality of Life | 13 | 46 |
| 3 | Quality-of-Life | 13 | 35 |
| 4 | Population | 8 | 30 |
| 5 | Sf-36 | 8 | 19 |
| 6 | Adults | 7 | 30 |
| 7 | Satisfaction | 7 | 18 |
| 8 | Mortality | 6 | 21 |
| 9 | Risk | 6 | 12 |
| 10 | Validity | 6 | 24 |
| 11 | Women | 6 | 9 |
| 12 | Health-related Quality of Life | 5 | 15 |
| 13 | Outcomes | 5 | 15 |
| 14 | People | 5 | 18 |
| 15 | Reliability | 5 | 20 |
| 16 | Survey Sf-36 | 5 | 21 |
Table 9.
The keywords information of cluster 6.
| Number | Keywords | Occurrences | Total Link Strength |
|---|---|---|---|
| 1 | Health | 18 | 46 |
| 2 | Stress | 13 | 36 |
| 3 | Benefits | 7 | 28 |
| 4 | Exposure | 6 | 14 |
| 5 | Green space | 5 | 26 |
| 6 | Urban Environment | 5 | 15 |
© 2019 by the authors. Licensee MDPI, Basel, Switzerland. This article is an open access article distributed under the terms and conditions of the Creative Commons Attribution (CC BY) license (http://creativecommons.org/licenses/by/4.0/).
Share and Cite
MDPI and ACS Style
Shi, J.-g.; Miao, W.; Si, H. Visualization and Analysis of Mapping Knowledge Domain of Urban Vitality Research. Sustainability 2019, 11, 988. https://doi.org/10.3390/su11040988
AMA Style
Shi J-g, Miao W, Si H. Visualization and Analysis of Mapping Knowledge Domain of Urban Vitality Research. Sustainability. 2019; 11(4):988. https://doi.org/10.3390/su11040988
Chicago/Turabian StyleShi, Jian-gang, Wei Miao, and Hongyun Si. 2019. "Visualization and Analysis of Mapping Knowledge Domain of Urban Vitality Research" Sustainability 11, no. 4: 988. https://doi.org/10.3390/su11040988
Note that from the first issue of 2016, this journal uses article numbers instead of page numbers. See further details here.