Justice Implications of Clean Energy Policies and Programs in the United States: A Theoretical and Empirical Exploration

1
Department of Social Sciences, Michigan Technological University, Houghton, MI 49931, USA
2
School of Public and Environmental Affairs, Indiana University-Purdue University Indianapolis, Indianapolis, IN 46202, USA
*
Author to whom correspondence should be addressed.
Sustainability 2019, 11(3), 807; https://doi.org/10.3390/su11030807
Submission received: 17 December 2018
/
Revised: 24 January 2019
/
Accepted: 31 January 2019
/
Published: 3 February 2019
(This article belongs to the Section Energy Sustainability)
Abstract
:This paper offers both theoretical and empirical analyses to explore energy justice from a policy perspective. We first propose a framework that explicitly connects core functions of clean energy policy instruments (i.e., regulation, financial incentive, government provision, information, and education program) to philosophical groundings of energy justice—distributive, procedural, and recognition justice. To empirically explore distributive energy justice, we examine the racial and socioeconomic disparities in three government-driven clean energy programs in the United States, including (1) the American Recovery and Reinvestment Act (ARRA) smart-grid investment grant (SGIG); (2) utility smart-meter roll out programs; and (3) city government adoption of green buildings. Results showed that the amount of ARRA funding awarded to utilities was closely related to racial composition. Inequalities were also found in utility smart-meter programs. Utilities operating in communities with a larger Hispanic population were less likely to initiate smart-meter roll out. The intensity of smart-meter technology implementation was positively correlated with education levels. Our third empirical case showed that government procurement policy can improve distributive equity for energy-efficient buildings. However, its spillover effects on the private sector can result in more adoptions in areas with fewer minorities and more highly-educated residents.
1. Introduction
Rooted in and built upon environmental and climate justice research, the energy justice literature focuses on equity issues in the processes of energy production, distribution, consumption, and system transition. Sovacool and his colleagues [1] define energy justice as “a global energy system that fairly distributes both the benefits and burdens of energy services, and one that contributes to more representative and inclusive energy decision-making”. Built upon Sovacool’s conceptualization of energy justice, Hernández argues that four basic rights to energy justice are essential: right to healthy and sustainable energy production, right to best available energy infrastructure, right to affordable energy, and right to uninterrupted energy service [2].
Energy justice can be examined through the lenses of three philosophic tenets in social justice literature: distributive, recognition and procedural justice. Distributive justice deals with the distribution of material outcomes or public goods [3]. Recognition justice considers which social groups are ignored or misrepresented [4]. Procedural justice calls for more democracy, openness, and inclusion in processes of decision-making [5]. The three tenets have been applied to investigate equity issues throughout the whole energy system, from the siting of infrastructure [6], to the extraction of energy resources [7], to energy consumption [8].
When challenges in energy transition are reframed into justice themes, public policy is often considered as the solution to correct the injustices [3]. However, policies intended to transform the energy system may present justice issues themselves [4,9]. Environmental and energy economists have long studied the distributive impacts of energy and carbon taxes [10,11,12], although their analyses are often based on hypothetical policies and models. A growing number of studies have empirically investigated injustices associated with energy and climate policies in the real-world. For instance, Grover and Daniels [13] demonstrated substantial inequalities in the distribution of feed-in tariff benefits in the UK and Wales. Walker and Day [5] investigated the injustice related to the fuel poverty policy in the UK.
With increasing government activities driving clean energy transition, there is an urgent need to understand energy justice from a policy perspective. In this paper, we explore this important but overlooked dimension of energy justice by examining equity concerns embedded in clean energy policy design and implementation in the United States. We focus on clean energy policies and programs for two reasons. First, low-carbon energy technology innovations are highly relevant for climate justice because of their capability to change the costs and benefits of greenhouse gases emission reduction scenarios [14]. They can also affect communities’ climate change adaptation capability. Secondly, the development of clean energy reduces environmental pollution from fossil fuel-based power plants. The investment and siting decisions for clean energy technologies can have additional implications for distributive environmental justice. Thirdly, access to best available energy infrastructure has not been extensively studied compared to other basic rights in energy justice, such as access to affordable energy [5,15].
This paper is structured as follows. First, we discuss when and where equity issues arise in various clean energy policy contexts. We then propose a framework for analyzing key justice questions in the design and implementation of clean energy policies and programs. The framework explicitly connects core functions of policy instruments (regulation, financial incentive, government provision, information, and education) to the three energy justice tenets (i.e., distributive, recognition, and procedural justice). In Section 3 and Section 4, we offer three brief empirical analyses to investigate distributive justice concerns in real-world clean energy policies and programs in the United States: (1) the American Recovery and Reinvestment Act (ARRA) smart-grid investment grant (SGIG); (2) American utility smart-meter roll out programs; and (3) American city adoption of green buildings. We conclude this paper by revisiting our empirical results in light of our framework.
2. Theoretical Framework
In recent years, the energy democracy movement in the United States, Europe, and other places in the world has pushed forward a systematic agenda of energy transition, which aims to decentralize renewable energy production, empower citizens to become prosumers, create green jobs, and support local community economic development [16]. This movement further calls for and justifies policy integration that links social justice and economic equity with clean energy transitions [16]. Miller et al. [17] argue that the transformation of the energy sociotechnical system would likely redefine energy politics at the local, national, and global levels in the future. An emerging group of studies have pointed out the need for “justice-aware” energy policymaking, and discussed the ways to incorporate justice considerations in energy decision-making [1,16].
Munro et al. [18] argue that recognition justice is critical in energy policy development as it enables epistemological reflexivity and prevents marginalizing the knowledge, experience, and voices of the energy-poor. Alvial-Palavicino and Ureta examine how justice claims can be incorporated into the development and adoption of electricity tariff policies [19]. Sovacool and Dworkin [3] argue that energy decision-making shall consider eight aspects of energy justice, including availability, affordability, due process, good governance, sustainability, and intergenerational and intragenerational equity and responsibility. Islar et al. use the Sovacool and Dworkin [3] principles to evaluate the feasibility of energy justice in Nepalese national energy policies [20]. Regardless of these scholarly endeavors, there is a lack of systemic or comprehensive knowledge about how policy design elements are related to the different philosophic tenets of energy justice concerns.
To establish a theoretical framework in which to organize the wide array of clean-energy-related policies and programs with prominent justice components, we propose beginning with a standard taxonomy of common policy instruments (see, [21,22]) in the clean energy policy regime in the United States. Here, clean energy policies are defined as those that promote the adoption and diffusion of sustainable or low-carbon energy technologies, such as energy efficiency (EE), renewable energy (RE), smart grids, electric vehicles, etc. Following Bardach and Patashnik [23] and Vedung [24], we group clean energy policy measures into four broad categories—regulatory, financial, government provision, and information and education policies. Of course, some policies can overlap multiple categories. (See more detailed discussions of clean energy policy instruments in the US by Carley and colleagues [23,24]).
Design of clean energy policy instruments often involves critical elements or parameters that can affect distributive, procedural or other aspects of equity and justice in the policy. In the following section, we provide an overview of when and where injustices may emerge in various clean energy policy contexts, and what policy design elements could potentially promote energy justice. Table 1 provides a summary of our discussion, and links these example policy aspects to the three tenets in energy justice.
2.1. Regulatory Instruments
In the United States, state public service commissions (PSCs) closely regulate investment decisions, operations, and electricity rates of investor owned utilities (IOUs), which serve over seventy percent of customers in the United States in 2014 [25]. Regulations and rules adopted by PSCs have an influential role in utility clean energy programs [26,27]. For grid infrastructure investment, IOUs need to get approval from PSCs and recover project costs by raising electric rates. Equity concerns are twofold here: (1) whether the low-income groups are more adversely harmed by price increases; and (2) whether the benefits of grid improvements are equally shared among communities. Most IOUs are required by law to offer “just and reasonable rates” to all customers, with various levels of low-income support provided to the poor, such as discounted rates, arrearage forgiveness, limitations on service termination, and low/no cost energy efficiency [28]. Nonetheless, low-income groups are often more likely to fall behind on utility payment and/or experience utility shut-offs [2]. In terms of the siting of clean energy infrastructure, empirical evidence shows that procedural justice in the siting processes and permitting decisions is necessary for a more effective and fair project development [29].
States also establish mandatory targets or quotas to achieve a certain market share of clean energy. Typical examples include renewable portfolio standard (RPS) and energy efficiency resource standard (EERS). To promote efficiency results, penalties are often included in RPS and EERS policy design. Utilities have to make alternative compliance payments (ACPs) to the state in order to make up any deficit in the compliance obligation under relevant legislation; moreover, civil penalties may exist as the second-tier consequence of failing to meet mandatory targets [30]. The design of ACPs allows society to value fossil-fuel-based energy source at its full cost, which is an indicator of justice throughout the energy supply chain [31]. How penalty funds are spent also have important justice implications. Targeted redistribution allows clean energy to be subsidized by fossil-fuel-based power generation. It can also reduce income inequality in clean energy financing. For instance, Massachusetts uses the ACP for RPS to fund its solar loan program. Fixed low-interest loans are provided to residents purchasing solar photovoltaic (PV) systems, and income-based loan support is available to enable access to solar PV systems by low-income families [32]. (Households with incomes less than 80% of the state median income are eligible for a 30% loan principal paid by the Solar Loan Program).
Another type of regulation governs access to an electric grid. Like other monopolies, electric utility companies often dominate the electricity market. Consumers have limited access to the power generation and distribution systems. Net metering policies and interconnection standards have been adopted by many American states to encourage customer-owned distributed energy systems. Net metering policies allow customers to use power generated from their on-site facilities to offset their electricity consumption and sell excess generation to the utility at a predetermined price. Interconnection standards establish standardized processes and technical requirements for connecting distributed generation (DG) systems to the electric grid. Both policies enhance self-energy dependence and can contribute to the notion of “energy democracy” [33]. However, these policies can have different impacts on social groups. Empirical evidence already shows that high-usage customers benefit more from the net metering program than low-usage customers [34]. While the poor often have limited upfront capital for distributed renewables, these policies may unintentionally benefit the wealthy households more than the poor, thus widening the gaps in accessing clean energy infrastructure across communities.
2.2. Financial Incentives
Government financial incentives for clean energy include grant and loan programs, tax credits and rebates, and feed-in-tariffs (FITs). On the one hand, financial incentives can enhance distributive justice as they lower the capital barrier and encourage universal access to decentralized, sustainable, and affordable energy sources [35]. On the other hand, public funds are often sourced from tax revenues or electricity tariffs paid by all consumers, and then transferred to clean energy developers. Under a high FIT scheme, for instance, producers may be overcompensated while consumers bear the cost of technology development [36]. The low-income groups can be disproportionally affected by rate increases. In the long term, when costs of renewable energy production decrease, transferring funds from consumers to renewable energy producers can become unfair. Deliberate policy design, especially the payment structure and payment duration, is essential to ensure distributive justice of financial policies.
Beneficiaries of financial incentives highly depend on policy design elements such as the eligibility and selection criteria. Borenstein [37] demonstrates that electric rate design in California particularly influences which customers receive tax credits and other incentives. Some empirical studies conclude that financial incentives for clean energy technologies tend to benefit wealthy families [37,38]. To help overcome capital barriers and promote distributive justice, some financial policies (e.g., the federal Weatherization Assistance Program and the EPA’s Clean Energy Incentive Program) provide funding for RE and EE projects to only low-income families. Some states proposed a higher percent RE tax credit for low-income families. For instance, Maryland SB 926 proposed a 50% credit for low-income communities and a 35% credit elsewhere. Others (e.g., the Energy Loan Program in Missouri) target energy saving investments in public schools, higher education institutions, not-for-profit hospitals, and local governments.
The job and employment effects of government subsidies create second-tier justice concerns. Jobs can be shifted away from fossil fuel related sectors to clean energy related sectors under government financial incentives. There may be also geographical shifts in employment. For instance, a majority of the operations and maintenance (O&M) jobs for renewable energy systems were based on established wind plants in rural and remote areas [39]. Some other studies reveal that 73.6% of the solar workforce in the U.S. in 2016 were white [40]. Black or African American and Hispanic accounted for 6.6% and 17.2% of the total solar workforce, respectively [40]. To promote social equity, the design of financial incentives needs to guarantee that local residents and minority groups are equally benefited.
2.3. Government Provision and Procurement
Government provision of clean energy can affect multiple aspects of the energy market and different social groups. Government-owned utility companies (mostly municipal utilities) are often responsible for local level clean energy technology deployment and electricity service provision. How retail electricity prices are set, what renewable energy sources to invest, and where to site the infrastructure all raise distributive justice concerns. Granting access to renewable resources on public lands and building transmission lines to transport electricity from remote generation facilities can particularly influence the rural communities [41]. Inviting inputs from diverse stakeholders and ensuring that local residents are represented in the siting processes can enhance procedural and recognition justice [42].
Public procurement policies for energy efficient technologies, green buildings, and other clean energy technologies have been adopted at the federal, state, and local levels. The Energy Policy Act 2005 for instance, requires federal agencies to procure EE products, photovoltaic solar electric systems, fuel cell vehicles, and hydrogen energy systems. In 2015, Executive Order 13693 set up an RE target of 30% by 2025 for all federal agencies. In addition to clean energy systems, government adoption of green buildings is common at the state and city level (see Matisoff et al. [43] for a comprehensive review).
Procurement policies have distributive equity concerns as they can affect the amount, type, location, and public users of sustainable energy technologies that are being adopted. This can be siting decisions and which communities get to enjoy the greener facilities, but it can also be the spillover—as procurement can spur local markets to develop and then the private-sector starts producing more of the greener infrastructure [44,45]. Procurement policies might also involve procedural and recognition issues if the process by which procurement decisions are made does or does not involve certain groups. If minority-owned business enterprises (MBEs), for instance, are too small to do green energy supply, then they might be at a disadvantage in getting government contracts. The Energy Policy Act 2005 provides training and assistance to help small businesses engage in clean energy public procurement projects. Some procurement policies specify a percentage of contracts awarded to women and MBE firms, which address procedural and recognition justice. Whether a state or local government has MBE certification may also promote the inclusion of diverse social groups in the public contracting and procurement processes [46].
2.4. Information and Education Policy
Information and education policy provides the public with knowledge of the benefits and potential of clean energy technologies, as well as the availability of government incentives and assistance. It also equips the public with knowledge and expertise that allow them to engage in energy decision-making. High levels of community involvement, education, and information on energy issues promote procedural justice [4], which may then contribute to fair and equitable outcomes in the energy sector [31,47]. Certain social groups particularly lack information about clean energy technologies, such as the young and less educated groups [48]. Specially designed information and education policies targeting these groups can enhance recognition justice.
Most justice implications discussed above come directly from policy designs. There are also distributive impacts due to price effects, where policies affect market prices faced by consumers and firms. Studies using economic modeling approaches have shown varying impacts of clean energy policies on electricity prices [49,50]. Energy justice scholars and policymakers may benefit from working with economists to identify and explore clean energy policy proposals that reconcile equity and efficiency.
3. Empirical Case Studies
The three philosophical tenets—distributive justice, recognition justice, and procedural justice— are equally important in understanding energy justice. To provide more empirical evidence of how the distributive justice lens can be applied to clean energy policies and programs, this section presents three case study analyses. Our analysis focuses only on distributive impacts pertaining to the access to modern energy infrastructure and services in the United States, which is heavily influenced by government regulations and incentives [27]. It is noteworthy that this is neither a comprehensive nor a generalizable justice evaluation for all clean energy programs. Instead, our goal is to conduct an exploratory case analyses to understand whether poor or minority groups are less likely to benefit from clean energy technology deployment programs driven by different categories of public policies. Our focus on distributive energy justice does not imply that we privilege distributive justice over procedural or recognitional justice. In doing so, the case studies provide insights on the distribution of benefits of government energy policies and programs. This supplements the empirical literature of distributive energy justice that focuses on the distribution of risks and costs of energy policies, such as in the case of shale gas policy [7] and solar roll-out programs [51].
The three empirical cases selected represent three different clean energy programs at the federal, municipal, and utility levels in the United States. They allow us to examine closely social justice concerns and consequences related to clean energy policies and programs. The US federal government financial investment in “smart grids” and utility smart-meter programs offer prime examples of financial incentives and utility regulations affecting a transition to clean energy with important equity implications. In addition, where municipal governments build and use green buildings have important energy equity implications that directly follow from procurement policies.
3.1. An Overview of the Three Empirical Cases
Case 1: Political distribution of ARRA SGIG. Our 1st empirical case analyzes distributive justice implications of clean energy financial incentives, with a focus on government provision of grants and matching funds. In particular, we examine the fairness of the political distribution of the Smart Grid Investment Grant (SGIG) in the United States, the largest program for electric power grid modernization efforts under the American Recovery and Reinvestment Act (ARRA) of 2009 [52]. The Office of Electricity Delivery and Energy Reliability (OE) at the Department of Energy (DOE) used a merit-based, competitive process to select and fund SGIG projects. Ninety-nine projects were selected from over 400 proposals submitted by electric utilities and other eligible organizations, with a total investment of 8 billion dollars [53]. The ARRA SGIG represents one of the largest public investments in clean energy technologies in the world. How funds have been transferred from the federal government to utility companies all over the country may raise important equity concerns. In this case analysis, we identify characteristics of utilities that benefit the most and least under this federal financial incentive, including utility ownership, and the racial composition and income levels of communities served by utilities.
Case 2: Utility smart meter roll out. Our 2nd empirical case focuses on distributive justice of clean energy technology deployment programs led by electric utilities. As discussed in Section 2, utility investment in grid infrastructure improvement is often heavily regulated by state public service commissions or local governments. In this case study, we investigate whether or not closely regulated utility clean energy programs leads to uneven deployment of clean energy infrastructure among social groups. We focus particularly on smart meters (also known as advanced metering infrastructure (AMI)), which are considered as the cornerstone and enabling technology in a smart grid system. Smart meters have been installed by many utilities in the US since the early 2000s, and the deployment process has been heavily influenced by public policies [54]. We test whether or not utility smart meter programs are rolled out in selected communities, and whether utility regulation by public service commissions or local governments has resulted in social inequality in community access to smart meters.
Case 3: Municipal government adoption of green buildings. Our 3rd empirical case examines distributive justice of government procurement policies, particularly municipal government adoption of green buildings. As buildings account for a very large share of energy consumption, high performing and sustainable buildings play an important role in residential and commercial energy efficiency and distributed renewable energy development. Twenty-four states and over one hundred cities in the United States have adopted mandates that require government buildings to be Leadership in Energy and Environmental Design (LEED) certified (or equivalent) [43]. This regional public procurement policy may lead to a cluster of green building in some communities but not others. In this case analysis, we use urban LEED certification data to understand where public green buildings have been adopted, and whether there is any difference in justice implications between public and private adoptions.
3.2. Data and Methods
The current methodological approach of energy justice analysis differs greatly from that of environmental justice [8]. A large group of energy justice studies focuses on the right to affordable energy, and the intersection of energy and poverty [5,15,55]. Some have examined whether communities bear different costs of and face different risks from clean energy programs [7,51]. In the environmental justice literature, scholars have extensively investigated the inequalities in the siting of energy facilities, such as fossil-fuel-based power plants [56] and nuclear energy plants [57]. There has been a common omission in current energy justice studies regarding access to sustainable energy infrastructure, or the distribution of benefits of government-driven clean energy programs.
To understand the justice implications of clean energy programs, we propose to draw upon environmental justice discourse, and posit clean energy infrastructure as a type of environmental amenity that can potentially reduce air pollution and adverse health effects for the public. The goal of our empirical case studies is to explore the distributive justice implications of clean energy programs in the United States, with a focus on the distribution of program benefits. This study hence improves the understanding of racial and socioeconomic disparities in community access to modern sustainable energy infrastructure, and contributes to the literature that links environmental justice and energy justice.
We follow the conventional statistical approach widely used in environmental justice studies (see for instance [58,59]) in our research design, data collection, and analysis. Specifically, we identify which communities benefit from clean energy programs and compare the socio-economic and racial characteristics of those communities to communities that do not benefit. Evidence of injustice is defined as when communities that benefit from clean energy programs have significantly higher income levels and/or lower percentages of minority population. We do not consider how risks and hazards of the energy system are more broadly (e.g., the exposure to air pollution associated with electricity generation) distributed among communities.
3.2.1. Unit of Analysis
Unit of analysis in conventional environmental justice analysis refers to the choice of areal unit at which demographic data are presented and described [58]. It also defines the geographical boundary for the “community” analyzed in statistical analysis [58].
For Case 1, we investigate whether racial and socioeconomic characteristics of communities served by utilities receiving federal ARRA SGIG grants are significantly different from those without SGIG funding. Here, the unit of analysis was individual utility. We used ArcGIS to link utility service boundary maps, census tract boundary maps, and tract-level demographics, which allowed us to calculate utility level demographics. We then integrated utility level demographics with utility level SGIG funding data.
For Case 2, the unit of analysis was also individual utility. Based on ArcGIS work in Case 1, we integrated utility level demographics with utility level AMI meters roll out information. This allowed us to identify utility-level demographic characteristics associated with smart meter deployment.
The analysis for Case 3 was at the metropolitan and micropolitan statistical area (MMSA) level, which is also known as “core based statistical area” (CBSA). Each CBSA contains at least one urban area of 10,000 or more population [60]. Geographical boundary maps and demographics for MMSA were collected from the census bureau, which were then linked to LEED building certification data in ArcGIS.
3.2.2. Explanatory Variables
Standard environmental justice analysis investigates disproportionate distribution of environmental hazards on minority and low-income communities [61,62]. Following this approach, we tested racial and income inequity in our three cases. For the race effect, two variables representing ethnic minority groups were used in this study: the proportion of the population identified as Hispanic and the proportion of the population identified as Black (See Table 2 for detailed information on the variables’ description and data sources). For the income effect, we used natural logarithm of average family income (Case 1 and Case 2) and medium household income (Case 3) as the operational variables. Due to data availability at different areal units, the operationalization of explanatory variables varies across the three cases.
Several other important socioeconomic factors that may influence clean energy technology deployment were also included in our statistical models. Education level likely affects public perception of green technologies, such as in the cases of renewable energy [63], water recycling and desalination [64], and carbon capture and storage [65]. In Case 1 and Case 2, education level was measured by the share of population who had graduated high school. In Case 3, education level was measured by the share of population who had a bachelor’s degree or higher.
In Case 1, in order to consider the political context of stimulus funding redistribution, we included an election variable in the model. It was measured by the percentage of people voting for Obama in the 2012 election in a given utility service territory. We first obtained county-level election data from The Guardian [66], and then used ArcGIS to link the county-level data with utility service boundary maps to calculate the utility-level election data.
Population and population density may affect energy service requirements by local communities, and it is often a determinant for energy infrastructure design and development [67]. In Case 1 and Case 2, we measure population density by total number of people per square meter. Natural logarithm of density and population were controlled for in statistical models of Case 1 and Case 2. In Case 3, we controlled for population, population change between 2000 and 2005 (a time period prior to most LEED certifications), and concurrent population change between 2005 and 2013, as population dynamics are likely to correlate with construction of new buildings in a region.
In Case 1 and Case 2, we also empirically tested the impact of utility ownership on the access to energy-specific federal grants and utility clean energy investments. A dummy variable for investor-owned utilities (IOUs) was included in utility-level models. Descriptive statistics for all variables are presented in Table 3.
3.2.3. Regression Models and Dependent Variables
In Case 1, federal subsidies for smart grid technologies were distributed through utilities in the US. We used a two-stage double hurdle model to identify communities that were particularly benefiting from the distribution of ARRA funding. The model was first proposed by Cragg [68] in 1971 to allow for two independent processes. Using the two-stage double hurdle model hence allows us to explore whether community demographic characteristics play different roles in the recipient selection and grant distribution processes.
The first process was the decision to choose utility recipients for ARRA SGIG grants. The dependent variable was dichotomous, measuring whether or not a utility was selected for a SGIG grant. The second process measured the amount of ARRA SGIG grant awarded to a utility. The dependent variable was a continuous variable measuring per capita dollar amount of an ARRA SGIG grant received by a utility. Per unit subsidy has been used by past studies examining policy impact on clean technology adoption (i.e., Kerosene subsidies in India [69]). Data about ARRA SGIG utility recipients and dollar amounts of awarded grants were collected and compiled from the DOE website.
Similarly in Case 2, we estimate a two-stage double hurdle model for utility smart meter roll out. In the first stage, the decision to deploy smart meters had to be made. The dependent variable measured whether or not AMI meter roll out had taken place in a given utility service territory. It was coded as 1 if the number of AMI meters installed by the utility was positive, and 0 otherwise. The second stage concerned the “intensity” of technology diffusion or market penetration of AMI meters. How many smart meters to install may depend on various factors such as funding availability, utility decision, and social acceptance. The dependent variable for the second stage was the AMI meter penetration rate in a utility service territory. In the literature, technology penetration rate is a widely used indicator of accessibility to clean technologies [27,70]. Total AMI meter counts and total meter counts for each electric utility in 2015 were compiled from File 8 of Form EIA-861 from U.S. Energy Information Administration (EIA).
When technology adoption is measured by count variables (i.e., the number of solar PV arrays adopted by a residential sector [38]), negative binomial models are often estimated. For Case 3, we followed this approach and estimated negative binomial models to identify potential associations between demographic variables and the adoption of green buildings in American metropolitan and micropolitan statistical areas. We differentiated between public and private adoptions by using two dependent variables: counts of all LEED certified buildings and counts of only government-owned LEED certified buildings in a metropolitan or micropolitan statistical area.
All statistical models in this study were estimated using Stata. Sensitivity analyses were conducted and results are included in the Supplementary Materials.
3.2.4. Data Collection and Integration
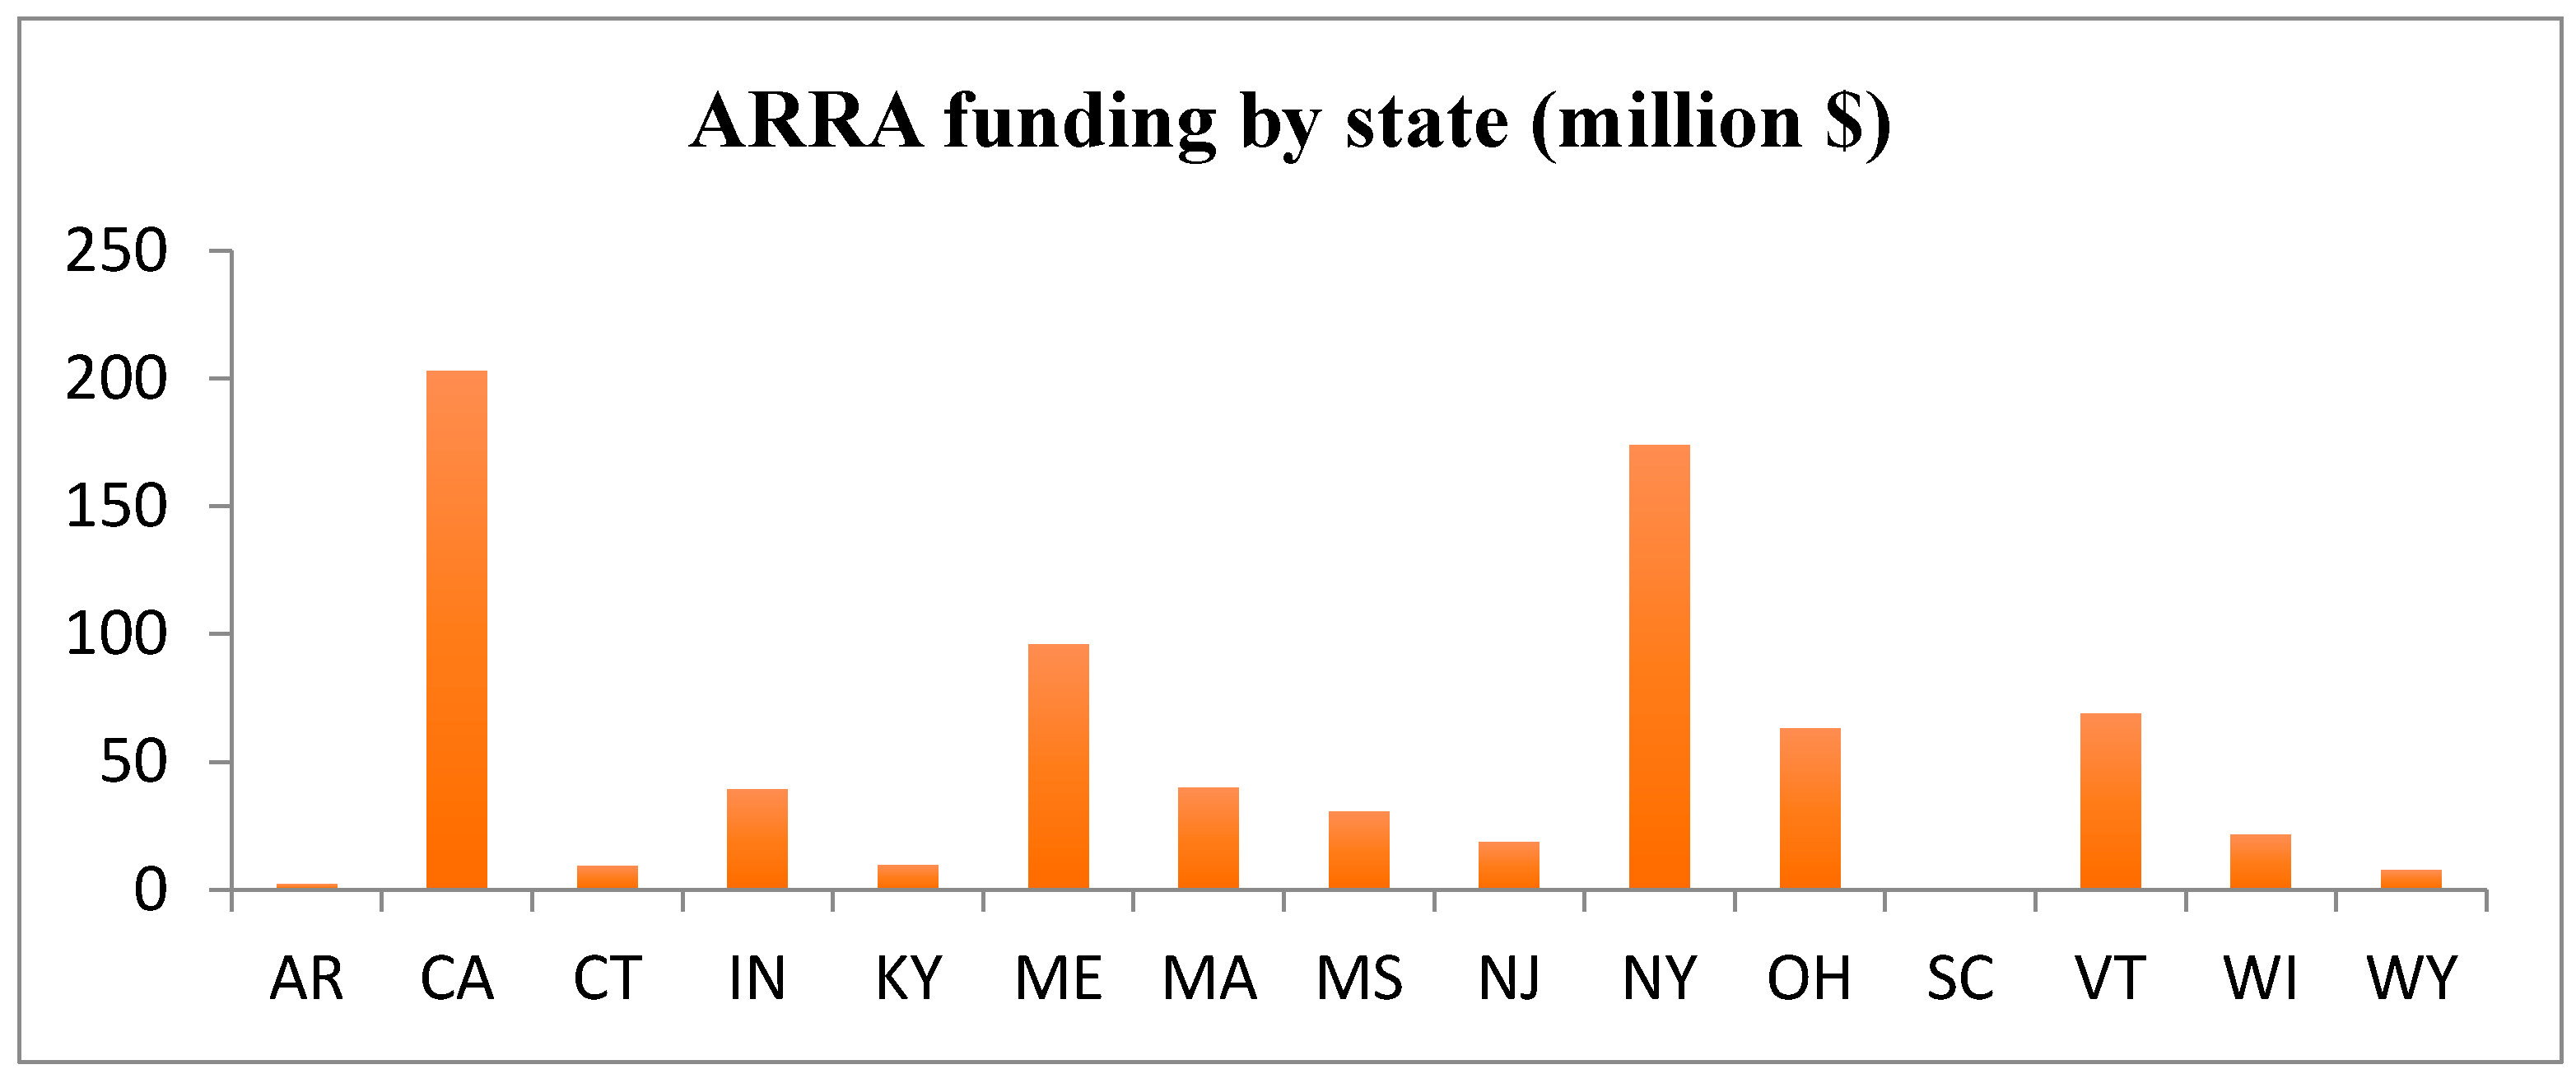
The areal unit of Case 1 and 2 is utility service territory. We requested state electric utility service territory maps from public service commissions or the geographic information system (GIS) offices of all fifty states. We were able to obtain GIS shapefiles from fifteen states, including Arkansas, California, Connecticut, Indiana, Kentucky, Maine, Minnesota, Mississippi, New Jersey, New York, Ohio, South Carolina, Vermont, Wisconsin, and Wyoming. These fifteen states are pretty representative of the nation, with a high level of diversity in geographical location, climate zone, political ideology, income, and ethnic groups in our data. In 2016, 36.8% of the US population lived in these fifteen states. Utilities from the fifteen states received $783.3 million in ARRA SGIG, accounting for 23.0% of the total. (See Figure 1 for details about ARRA SGIG projects in the fifteen states). For Case 1, two states (CT and WI) were dropped from the dataset, as some of their SGIG recipients were companies owned by multiple utilities.
Census tract geographical boundary maps and tract level demographic data were obtained from the Census Bureau. We used ArcGIS and an area weighting approach to aggregate tract-level demographic data and county-level election data to utility level. The list of utilities receiving SGIG funding and the amount of SGIG funding received by each utility was obtained from the smartgrid.gov website. Data on the count of smart meters installed by each utility were obtained from the US Energy Information Administration.
Case 3 focuses on city-level green building adoptions in the United States. We collected boundary maps and demographic data for US metropolitan and micropolitan statistical areas from the Census Bureau. The LEED dataset was collected from the US Green Building Council (USGBC), which includes addresses and owner types for all buildings certified under the LEED New Construction (NC) v2.0–v2.2 standards. In light of other labeling schemes for energy-efficient buildings (e.g., EnergyStar), we use a consistent definition of new green buildings based on these LEED NC standards—a prominent certification system starting in 2004 and lasting for a decade. LEED certified buildings were geocoded in ArcGIS. The total counts of government-owned LEED buildings and all LEED buildings in each metropolitan or micropolitan statistical area were then calculated in ArcGIS and used as dependent variables for Case 3.
4. Results and Discussion
4.1. Case 1: Political Distribution of ARRA SGIG
The estimated coefficients for income are negative in both stages of Case 1, but only significant in Stage 1 (Table 4). Hispanic and Black are all negative, but only the Hispanic variable is significant in Stage 2 of Case 1. The results demonstrate that utilities serving lower-income communities are more likely to receive SGIG funding. Yet, conditional on their receiving SGIG, utilities operating in areas with smaller shares of Hispanic population tend to receive more federal funding.
There are several reasons why projects involving more low-income customers are more likely to be selected for the SGIG. First, energy infrastructure in low-income communities may face more severe problems with aging and inadequacy in providing accurate electric bills than that in other communities. These communities often need investments in grid upgrades the most. Utilities serving those areas may take the SGIG application opportunity to plan and propose for grid infrastructure updates, leveraging federal funds to equip low-income communities with resilient and sustainable energy infrastructure. For instance, Entergy New Orleans in Louisiana has particularly highlighted in their SGIG project description that funds will be used to install smart grid technologies for low-income families to reduce energy use and electricity costs [71].
Second, studies have shown that low-income consumers often have less awareness of and favorable feelings toward smart-grid and smart-meter technologies [72]. Without support from public funds, the low-income communities may be left behind in the nation’s grid modernization process. The inclination of the DOE to award smart grid funds to lower-income groups hence contributes to a more equal outcome in infrastructure development across income groups. A closer examination of the SGIG selection criteria reveals important justice components in policy design. The SGIG policy states that selected projects shall promote power quality for all types of consumers, enable informed participation by consumers, accommodate different types of electricity generation and storage options, and enhance system efficiency and resilience [73]. The selection of SGIG recipients shall ensure “an efficacious portfolio of SGIG projects”, with a diversity in organization types, sizes, and geographic areas [73]. The evidence in Table 4 suggests that this directive was not idle rhetoric, at least for low-income communities.
Results for Stage 2 in Case 1 show that, among all recipients, utilities serving a larger Hispanic community tends to be funded on smaller-scale SGIG projects. Utilities serving larger Hispanic populations may face greater opposition from their customers for modern energy infrastructure and services. A lack of technical experience combined with a large, inexperienced customer segment may restrict these utilities to pilot- or smaller-scale smart-grid deployments.
The percentage of population that voted for Obama in 2012 and total population served by the utility affect the SGIG program selection, but not the amount of funding awarded. Utilities receiving SGIG funding are more likely to operate in areas with more liberal voters, and they are also more likely to serve a larger group of customers. Population density, education, or utility ownership did not have significant impact on who was awarded SGIG funding or the amount of funding awarded.
4.2. Case 2: Utility Smart Meter Roll Out
Case 2 exhibits some inequalities in utility smart meter deployment. The estimated coefficient for Hispanic is negative and significant in Stage 1 of Case 2. This indicates that utilities serving smaller Hispanic populations are more likely to initiate smart meter roll out in their service territory. The technology deployment process, closely regulated by public service commissions or local governments, has led to racial inequity in the siting of clean energy infrastructure.
It is usually large cities, such as Houston and Los Angeles, that are more likely to attract Hispanic population. Most of the Hispanic population resides in urban areas [74]. This indicates that utilities serving the urban Hispanic population may be lagging behind in providing up-to-date modern intelligent energy infrastructure to their customers. Given the data and analysis in Case 2, these utilities may have difficulties keeping pace with new infrastructure deployment demands within a high population growth region. Alternatively, language barriers or other priorities may mean these utilities face less pressure to install this technology. Future research is needed to investigate whether demographic changes in these cities likely exaggerate the racial inequalities in access to clean energy technology infrastructure.
As of 2012, over 80% of smart meters were installed by IOUs [75]. For these privately-owned companies, smart-meter and smart-grid investments are reviewed in the context of general rate case proceedings. To ensure cost-effective technology deployment, state public service commissions (e.g., Ohio Case No. 05-1500-EL-COI) often require IOUs to identify and group customer classes, and to evaluate costs and benefits accrued to customers, before they invest in smart meters. This policy design may explain the results of Stage 1 in Case 2, as utilities’ cost-benefit analysis (CBA) results for smart-meter investment vary greatly, depending on the racial and socioeconomic characteristics of their customer groups. Some disadvantaged and vulnerable communities (e.g., Hispanics) may be left behind in the grid modernization process if they cannot pass CBA tests required by utility regulators. Although the intent of a cost-benefit test for utility investments is to make sure energy services are affordable to all people, this policy design choice may have impaired racial equality in utility clean energy deployment.
Publicly owned utilities, especially municipally-owned utilities, often operate as a functional unit of city governments. Their governance structures are similar to other local government agencies. Energy customers are also voters who elect the officials governing the utility. Therefore, municipal utilities tend to be more responsive and flexible to customer needs, and more innovative in deploying clean energy technologies [76]. This explains the significant and negative coefficients for the IOU variable in Case 2: publicly-owned utilities are more likely to start smart-meter roll out and are more successful in technology implementation than IOUs. Another reason might be that IOUs have to go through the regulatory hurdle to make new investments, while municipally owned utilities and cooperatives do not.
Results for Stage 2 in Case 2 in Table 4 show that, after utilities commit themselves in smart-meter deployment, there is no significant disparity in technology penetration across racial or socioeconomic groups. In the technology implementation process, many state PSCs require utilities to provide a smart meter opt-out option (i.e., Michigan PSC Order (September 11, 2012), Case No. U-17000). This allows customers to quit smart meters and keep their traditional analog meters. Opt-out options recognize different public perceptions of new technologies, which may have contributed to the equity and fairness in smart meter implementation (i.e., recognition justice).
In addition, the estimated coefficient for education is positive and significant in Stage 2, Case 2. This shows that education plays a positive role in technology implementation: better-educated communities are associated with higher smart-meter penetration rates. This confirms previous findings on the positive role of education on social acceptance of clean energy technology [77].
Estimated coefficients for density are negative and significant in both Stages of Case 2. Density matters for both the initiation of smart-meter roll out projects and the intensity of technology implementation. Smart meters seem to diffuse slower in more densely populated areas. Utilities with low-customer densities or geographically dispersed territories may have the greatest savings potential for smart meters: it is much easier for them to justify their investment based on operational cost saving (i.e., avoided meter reading, remote connections/disconnections) [78].
4.3. Case 3: Municipal Government Adoption of Green Buildings
Results of the third empirical case are presented in Table 5. We find that total counts of green buildings (both total LEED and government-owned LEED) are highly and positively correlated with population growth rates of metropolitan or micropolitan statistical areas between 2005 and 2013. Unsurprisingly, fast-growing urban areas tend to see more new construction, and thus are more likely to see more new green (e.g., energy efficient) building construction. Conditional on that background growth rate, new green-certified buildings show very strong tendencies to be located in areas with fewer minorities and with more highly educated residents, although the income effect is not significant. The subset of those buildings that are government owned, however, tend to be more equally distributed across both income and racial groups. Thus, while government-owned LEED buildings still tend to be built in more highly-educated urban areas, they are at least neutral with respect to race and income. The private sector, on the other hand, exhibits a tendency to certify new green buildings in more white urban areas. The significant race and education factors, combined with an insignificant role of income, raise important justice concerns and warrant additional investigation about causes.
Public green procurement policies can have positive spillover effects on private-sector demand for green infrastructure [45]. What the results in Table 5 show, however, may warrant concern from the perspective of equity. The neutrality (with respect to common EJ variables) of the government procurement evident in Table 5 is not matched by the overall adoption of green buildings, which suggests that stimulating the private sector may not translate into similar neutrality of adoption. Public procurement may spur inequitable private adoption spillovers. It also may be the case that much of the government-owned LEED building adoption is driven by state and local rules that tend to bind only on government buildings (rather than private sector building stock). Thus, Table 5 results may reflect a difference in the urban areas that have stricter requirements for new public building construction as much as it does a bias in how public procurement stimulates adoption in the private sector. Although governments have often used procurement policies to promote equality on the basis of race, ethnicity, and gender [79], our results show that the ultimate impact of government procurement on green building adoptions can be unequal.
5. Conclusions
Sustainable energy transition efforts driven by multi-level government actions can have significant justice implications. This paper offers both theoretical and empirical analyses that contribute to the emerging energy justice literature from a policy perspective. We first propose a policy evaluation framework that explicitly links clean energy policy design choices to important justice considerations. Critical policy design choices that can bear on important justice considerations are discussed. To offer more empirical evidence, our empirical cases then explore the distributive justice implications of three clean energy policies and programs at the federal, utility, and city levels in the US. Based on our theoretical framework and three empirical cases, we conclude this paper by offering several implications for equitable energy policymaking. We are limiting our conclusions to the three cases, and this is not an attempt to generalize across all energy programs and policies.
First, examining energy justice from a policy perspective can be complicated, as inequalities can occur in different dimensions. Public policies can directly affect who deploys clean energy through incentives and regulations. They also have indirect justice implications through their influence on energy market prices or private sector adoption of clean energy. The distribution of policy costs may raise additional justice concerns (See Granqvist and Grover [51], for instance, for a discussion of how the large cost of clean energy infrastructure can and should be fairly distributed across social groups). Moreover, some policy impacts are second-order environmental benefits resulting from the replacement of fossil fuel generation by clean energy. Future extension to this work should explore whether or not ensuring distributive justice in clean energy investments and regulation outcomes improves the second-order environmental justice.
Second, our empirical analyses show that clean energy program designs incorporate justice components to varying degrees in our cases. Guided by the policy goal of diversity and inclusion, the selection of SGIG projects tends to favor low-income groups, although the Hispanic population is in a disadvantaged position in terms of the amount of funding received. Regulation of clean energy investments by IOUs often follows the dominant economic approach that pursues efficient outcomes. There is little attention in policy design in these areas to fulfill justice principles. Utility regulation likely produces inequality in the decision of technology rollouts. Public procurement at the state and city levels lead to a relatively equal distribution of LEED certified public buildings, but this does not translate into equal adoptions by the private sector. While the primary goal of these policies is to facilitate energy transition and climate mitigation, more attention may be needed to more evenly spread the gains beyond the advantaged and politically vital groups in society.
Third, our theoretical discussion tentatively links policy design choices to various aspects of energy justice. Policies affecting energy justice can take many forms, and we offered brief examples of financial, regulatory, and procurement aspects. Each revealed some core theoretical justice elements in addition to empirical evidence on equity concerns. It serves as an important step to integrate energy justice considerations in energy policy making. However, it is not the goal of this study to establish causal relationships between policy design variables and distributive justice outcomes. Future work could also investigate the links between procedural/recognition justice and distributive justice.
While our study provides insights into three empirical clean energy programs, it should be considered only a first step in examining energy justice from a policy perspective. These cases emphasize governmental actors, but many critical justice aspects of clean energy policies and programs involve nongovernmental actors like households and private utilities. Even as clean energy programs can more or less promote equitable distributions, power and governance structures in the context of broader institutions (e.g., regulated markets, taxation systems) recommend more comprehensive examinations.
Future research should investigate other widely adopted clean energy policies and programs, such as net metering policies, electric vehicle tax credits and home retrofit offerings. While our study of all utilities in fifteen US states provides important information at a statistical level, future research can develop more comprehensive datasets for a nationwide analysis. In addition, energy justice analysis at different levels of spatial specificity, for instance, the census tract or block levels, should be conducted. Where good data are available, additional studies could focus on individual household level, examine specific clean energy technology adoption options, and how technology deployment correlates with household socioeconomic and racial characteristics.
Supplementary Materials
Supplementary materials can be accessed at: https://www.mdpi.com/2071-1050/11/3/807/s1.
Author Contributions
Conceptualization, S.Z. and D.S.N.; methodology, S.Z. and D.S.N.; formal analysis, S.Z.; writing—original draft preparation, S.Z. and D.S.N.; writing—review and editing, S.Z. and D.S.N.; supervision, D.S.N.
Funding
This research was funded by the Political Economy and Environmental Research Fellowship at the School of Public and Environmental Affairs, Indiana University-Purdue University Indianapolis.
Acknowledgments
The authors would like to thank the editors and anonymous reviewers for their constructive comments that help greatly improve the final version of this paper. They also would like to thank participants in the APPAM 2017 conference panel “Accelerating Adoption: Design and Impacts of Clean Energy Policy” for their constructive comments and suggestions. Finally, the authors would like to thank Chaise Cope for her excellent research assistance. The authors are responsible for any remaining errors.
Conflicts of Interest
The authors declare no conflict of interest. The funders had no role in the design of the study; in the collection, analyses, or interpretation of data; in the writing of the manuscript, or in the decision to publish the results.
References
- Sovacool, B.K.; Burke, M.; Baker, L.; Kotikalapudi, C.K.; Wlokas, H. New frontiers and conceptual frameworks for energy justice. Energy Policy 2017, 105, 677–691. [Google Scholar] [CrossRef] [Green Version]
- Hernández, D. Sacrifice along the energy continuum: A call for energy justice. Environ. Justice 2015, 8, 151–156. [Google Scholar] [CrossRef] [PubMed]
- Sovacool, B.; Dworkin, M. Energy justice: Conceptual insights and practical applications. Appl. Energy 2015, 142, 435–444. [Google Scholar] [CrossRef]
- Jenkins, K.; McCauley, D.; Heffron, R.; Stephan, H.; Rehner, R. Energy justice: A conceptual review. Energy Res. Soc. Sci. 2016, 11, 174–182. [Google Scholar] [CrossRef] [Green Version]
- Walker, G.; Day, R. Fuel poverty as injustice: Integrating distribution, recognition and procedure in the struggle for affordable warmth. Energy Policy 2012, 49, 69–75. [Google Scholar] [CrossRef]
- Gross, C. Community perspectives of wind energy in Australia: The application of a justice and community fairness framework to increase social acceptance. Energy Policy 2007, 35, 2727–2736. [Google Scholar] [CrossRef]
- Cotton, M. Fair fracking? Ethics and environmental justice in United Kingdom shale gas policy and planning. Local Environ. 2017, 22, 185–202. [Google Scholar] [CrossRef]
- Hall, S.M. Energy justice and ethical consumption: Comparison, synthesis and lesson drawing. Local Environ. 2013, 18, 422–437. [Google Scholar] [CrossRef]
- McCauley, D.A.; Heffron, R.J.; Stephan, H.; Jenkins, K. Advancing energy justice: The triumvirate of tenets. Int. Energy Law Rev. 2013, 32, 107–110. [Google Scholar]
- Speck, S. Energy and carbon taxes and their distributional implications. Energy Policy 1999, 27, 659–667. [Google Scholar] [CrossRef]
- Rausch, S.; Metcalf, G.E.; Reilly, J.M. Distributional impacts of carbon pricing: A general equilibrium approach with micro-data for households. Energy Econ. 2011, 33, S20–S33. [Google Scholar] [CrossRef] [Green Version]
- Fischer, C.; Pizer, W.A. Equity Effects in Energy Regulation; National Bureau of Economic Research: Cambridge, MA, USA, 2017.
- Grover, D.; Daniels, B. Social equity issues in the distribution of feed-in tariff policy benefits: A cross sectional analysis from England and Wales using spatial census and policy data. Energy Policy 2017, 106, 255–265. [Google Scholar] [CrossRef]
- Klinsky, S.; Dowlatabadi, H. Conceptualizations of justice in climate policy. Clim. Policy 2009, 9, 88–108. [Google Scholar] [CrossRef]
- Walker, G.; Simcock, N.; Day, R.J.E.R.; Science, S. Necessary energy uses and a minimum standard of living in the United Kingdom: Energy justice or escalating expectations? Energy Res. Soc. Sci. 2016, 18, 129–138. [Google Scholar] [CrossRef] [Green Version]
- Burke, M.J.; Stephens, J.C. Energy democracy: Goals and policy instruments for sociotechnical transitions. Energy Res. Soc. Sci. 2017, 33, 35–48. [Google Scholar] [CrossRef]
- Miller, C.A.; Iles, A.; Jones, C.F. The social dimensions of energy transitions. Sci. Cult. 2013, 22, 135–148. [Google Scholar] [CrossRef]
- Munro, P.; van der Horst, G.; Healy, S. Energy justice for all? Rethinking Sustainable Development Goal 7 through struggles over traditional energy practices in Sierra Leone. Energy Policy 2017, 105, 635–641. [Google Scholar] [CrossRef]
- Alvial-Palavicino, C.; Ureta, S. Economizing justice: Turning equity claims into lower energy tariffs in Chile. Energy Policy 2017, 105, 642–647. [Google Scholar] [CrossRef] [Green Version]
- Islar, M.; Brogaard, S.; Lemberg-Pedersen, M. Feasibility of energy justice: Exploring national and local efforts for energy development in Nepal. Energy Policy 2017, 105, 668–676. [Google Scholar] [CrossRef]
- Vedung, E. Policy instruments: Typologies and theories. In Carrots, Sticks, and Sermons: Policy Instruments and Their Evaluation; Bemelmans0Widec, M.-L., Rist, R.C., Vedung, E., Eds.; Transaction Publishers: New Brunswick, NJ, USA, 1998; pp. 21–58. [Google Scholar]
- Bardach, E.; Patashnik, E.M. A Practical Guide for Policy Analysis: The Eightfold Path to More Effective Problem Solving; CQ Press: Washington, DC, USA, 2015. [Google Scholar]
- Carley, S. The era of state energy policy innovation: A review of policy instruments. Rev. Policy Res. 2011, 28, 265–294. [Google Scholar] [CrossRef]
- Carley, S.; Browne, T.R. Innovative US energy policy: A review of states’ policy experiences. Wiley Interdiscip. Rev. 2013, 2, 488–506. [Google Scholar] [CrossRef]
- American Public Power Association. 2016–2017 Public Power Annual Directory & Statistical Report; American Public Power Association: Arlington, VA, USA, 2017. [Google Scholar]
- Hirst, E.; Brown, M. Closing the efficiency gap: Barriers to the efficient use of energy. Resour. Conserv. Recycl. 1990, 3, 267–281. [Google Scholar] [CrossRef]
- Zhou, S.; Matisoff, D.C. Advanced Metering Infrastructure Deployment in the United States: The Impact of Polycentric Governance and Contextual Changes. Rev. Policy Res. 2016, 33, 646–665. [Google Scholar] [CrossRef]
- Oppenheim, J. The United States regulatory compact and energy poverty. Energy Res. Soc. Sci. 2016, 18, 96–108. [Google Scholar] [CrossRef]
- Ottinger, G.; Hargrave, T.J.; Hopson, E. Procedural justice in wind facility siting: Recommendations for state-led siting processes. Energy Policy 2014, 65, 662–669. [Google Scholar] [CrossRef]
- Glatt, S.; Schwentker, B. State Energy Efficiency Resource Standards Analysis; Department of Energy: Washington, DC, USA, 2010.
- Heffron, R.J.; McCauley, D. Achieving sustainable supply chains through energy justice. Appl. Energy 2014, 123, 435–437. [Google Scholar] [CrossRef]
- MassSolarLoan. Loan Support Incentives. Available online: https://www.masssolarloan.com/loan-support-incentives (accessed on 17 December 2018).
- Farrell, J. Beyond Utility 2.0 to Energy Democracy; Institute for Local Self-Reliance: Minneapolis, MN, USA, 2014. [Google Scholar]
- Darghouth, N. The Impact of Rate Design and Net Metering on the Bill Savings from Distributed PV for Residential Customers in California. Energy Policy 2010, 39, 5243–5253. [Google Scholar] [CrossRef]
- Brown, M.A. Market failures and barriers as a basis for clean energy policies. Energy Policy 2001, 29, 1197–1207. [Google Scholar] [CrossRef]
- Lesser, J.A.; Su, X. Design of an economically efficient feed-in tariff structure for renewable energy development. Energy Policy 2008, 36, 981–990. [Google Scholar] [CrossRef]
- Borenstein, S. Private net benefits of residential solar PV: The role of electricity tariffs, tax incentives, and rebates. J. Assoc. Environ. Resour. Econ. 2017, 4, S85–S122. [Google Scholar] [CrossRef]
- Kwan, C.L. Influence of local environmental, social, economic and political variables on the spatial distribution of residential solar PV arrays across the United States. Energy Policy 2012, 47, 332–344. [Google Scholar] [CrossRef]
- Wiser, R.; Barbose, G.; Heeter, J.; Mai, T.; Bird, L.; Bolinger, M.; Carpenter, A.; Heath, G.; Keyser, D.; Macknick, J. A Retrospective Analysis of the Benefits and Impacts of US Renewable Portfolio Standards; Lawrence Berkeley National Laboratory, National Renewable Energy Laboratory: Berkeley, CA, USA, 2016.
- The Solar Foundation. National Solar Jobs Census 2016; The Solar Foundation: Washington, DC, USA, 2016. [Google Scholar]
- Bhattacharyya, S.C. Energy access problem of the poor in India: Is rural electrification a remedy? Energy Policy 2006, 34, 3387–3397. [Google Scholar] [CrossRef]
- Ottinger, G. The winds of change: Environmental justice in energy transitions. Sci. Cult. 2013, 22, 222–229. [Google Scholar] [CrossRef]
- Matisoff, D.C.; Noonan, D.S.; Flowers, M.E. Policy Monitor—Green Buildings: Economics and Policies. Rev. Environ. Econ. Policy 2016, 10, 329–346. [Google Scholar] [CrossRef] [Green Version]
- May, P.J.; Koski, C. State environmental policies: Analyzing green building mandates. Rev. Policy Res. 2007, 24, 49–65. [Google Scholar] [CrossRef]
- Simcoe, T.; Toffel, M.W. Government green procurement spillovers: Evidence from municipal building policies in California. J. Environ. Econ. Manag. 2014, 68, 411–434. [Google Scholar] [CrossRef] [Green Version]
- NAACP. Just Energy Policies: Reducing Pollution and Creating Jobs; National Association for the Advancement of Colored People, Environmental and Climate Justice Program: Baltimore, MD, USA, 2013. [Google Scholar]
- Sovacool, B.K.; Dworkin, M.H. Global Energy Justice; Cambridge University Press: Cambridge, UK, 2014. [Google Scholar]
- Menegaki, A.N. A social marketing mix for renewable energy in Europe based on consumer stated preference surveys. Renew. Energy 2012, 39, 30–39. [Google Scholar] [CrossRef]
- Palmer, K.; Paul, A.; Woerman, M.; Steinberg, D.C. Federal policies for renewable electricity: Impacts and interactions. Energy Policy 2011, 39, 3975–3991. [Google Scholar] [CrossRef]
- Sáenz de Miera, G.; del Río González, P.; Vizcaíno, I. Analysing the impact of renewable electricity support schemes on power prices: The case of wind electricity in Spain. Energy Policy 2008, 36, 3345–3359. [Google Scholar] [CrossRef]
- Granqvist, H.; Grover, D. Distributive fairness in paying for clean energy infrastructure. Ecol. Econ. 2016, 126, 87–97. [Google Scholar] [CrossRef] [Green Version]
- Energy.gov. Recovery Act: Smart Grid Investment Grant (SGIG) Program. Available online: https://energy.gov/oe/information-center/recovery-act-smart-grid-investment-grant-sgig-program (accessed on 17 March 2017).
- DOE. Smart Grid Investment Grant Program—Progress Report July 2012; Office of Electricity Delivery & Energy Reliability, U.S. Department of Energy: Washington, DC, USA, 2012.
- Energy Information Administration. Electricity Monthly Update. Available online: https://www.eia.gov/electricity/monthly/update/archive/december2011/ (accessed on 16 January 2019).
- Sovacool, B.K. Fuel poverty, affordability, and energy justice in England: Policy insights from the Warm Front Program. Energy 2015, 93, 361–371. [Google Scholar] [CrossRef]
- Faber, D.R.; Krieg, E.J.J.E.H.P. Unequal exposure to ecological hazards: Environmental injustices in the Commonwealth of Massachusetts. Environ. Health Perspect. 2002, 110, 277–288. [Google Scholar] [CrossRef] [PubMed]
- Endres, D. From wasteland to waste site: The role of discourse in nuclear power’s environmental injustices. Local Environ. 2009, 14, 917–937. [Google Scholar] [CrossRef]
- Mennis, J. Using geographic information systems to create and analyze statistical surfaces of population and risk for environmental justice analysis. Soc. Sci. Q. 2002, 83, 281–297. [Google Scholar] [CrossRef]
- Jerrett, M.; Burnett, R.T.; Kanaroglou, P.; Eyles, J.; Finkelstein, N.; Giovis, C.; Brook, J.R.J.E. A GIS–environmental justice analysis of particulate air pollution in Hamilton, Canada. Environ. Plan. A Econ. Space 2001, 33, 955–973. [Google Scholar] [CrossRef]
- U.S. Census Bureau. Metropolitan and Micropolitan. Available online: https://www.census.gov/programs-surveys/metro-micro/about.html (accessed on 21 January 2019).
- Baden, B.M.; Noonan, D.S.; Turaga, R.M.R. Scales of justice: Is there a geographic bias in environmental equity analysis? J. Environ. Plan. Manag. 2007, 50, 163–185. [Google Scholar] [CrossRef] [Green Version]
- Hilmers, A.; Hilmers, D.C.; Dave, J. Neighborhood disparities in access to healthy foods and their effects on environmental justice. Am. J. Public Health 2012, 102, 1644–1654. [Google Scholar] [CrossRef]
- Longo, A.; Markandya, A.; Petrucci, M. The internalization of externalities in the production of electricity: Willingness to pay for the attributes of a policy for renewable energy. Ecol. Econ. 2008, 67, 140–152. [Google Scholar] [CrossRef] [Green Version]
- Dolnicar, S.; Schäfer, A.I. Desalinated versus recycled water: Public perceptions and profiles of the accepters. J. Environ. Manag. 2009, 90, 888–900. [Google Scholar] [CrossRef]
- Poumadère, M.; Bertoldo, R.; Samadi, J. Public perceptions and governance of controversial technologies to tackle climate change: Nuclear power, carbon capture and storage, wind, and geoengineering. Wiley Interdiscip. Rev. Clim. Chang. 2011, 2, 712–727. [Google Scholar] [CrossRef]
- Guardian, T. Full US 2012 Election County-Level Results to Download. Available online: https://www.theguardian.com/news/datablog/2012/nov/07/us-2012-election-county-results-download (accessed on 17 December 2018).
- Jaccard, M.; Failing, L.; Berry, T. From equipment to infrastructure: Community energy management and greenhouse gas emission reduction. Energy Policy 1997, 25, 1065–1074. [Google Scholar] [CrossRef]
- Cragg, J.G. Some statistical models for limited dependent variables with application to the demand for durable goods. Econom. J. Econom. Soc. 1971, 39, 829–844. [Google Scholar] [CrossRef]
- Gangopadhyay, S.; Ramaswami, B.; Wadhwa, W.J.E.P. Reducing subsidies on household fuels in India: How will it affect the poor? Energy Policy 2005, 33, 2326–2336. [Google Scholar] [CrossRef]
- Wang, H.; Nakata, T. Analysis of the market penetration of clean coal technologies and its impacts in China’s electricity sector. Energy Policy 2009, 37, 338–351. [Google Scholar] [CrossRef]
- DOE. Recovery Act Selections for Smart Grid Investment Grant Awards—By Category. Available online: https://www.energy.gov/sites/prod/files/SGIG%20Awards%20by%20Category%202011%2011%2015.pdf (accessed on 21 January 2019).
- SGCC. Spotlight on Low Income Consumers Final Report; Smart Grid Consumer Collaborative: Pittsburgh, PA, USA, 2013. [Google Scholar]
- DOE. Recovery Act Financial Assistance Funding Opportunity Announcement; U. S. Department of Energy, Office of Electricity Delivery and Energy Reliability: Washington, DC, USA, 2009.
- Pew Research Center. Demographic and Economic Trends in Urban, Suburban and Rural Communities. Available online: http://www.pewsocialtrends.org/2018/05/22/demographic-and-economic-trends-in-urban-suburban-and-rural-communities/ (accessed on 21 January 2019).
- EIA. Electric Power Sales, Revenue, and Energy Efficiency Form EIA-861 Detailed Data Files. Available online: http://www.eia.gov/electricity/data/eia861/index.html (accessed on 13 March 2017).
- NREL. Lessons Learned: Community Solar for Municipal Utilities; National Renewable Energy Laboratory: Lakewood, CO, USA, 2017.
- Stigka, E.K.; Paravantis, J.A.; Mihalakakou, G.K. Social acceptance of renewable energy sources: A review of contingent valuation applications. Renew. Sustain. Energy Rev. 2014, 32, 100–106. [Google Scholar] [CrossRef]
- DOE. Smart Grid Investment Grant Program Final Report; Office of Electricity Delivery & Energy Reliability, Department of Energy: New York, NY, USA, 2016.
- McCrudden, C. Using public procurement to achieve social outcomes. Nat. Resour. Forum 2004, 28, 257–267. [Google Scholar] [CrossRef]
Figure 1.
ARRA SGIG funding in selected states.


Table 1.
Examples of justice considerations in clean energy policy design and implementation.
| General Category | Policy Instruments | Policy Design Options | Energy Justice Tenets |
|---|---|---|---|
| Regulatory | Utility regulation | Electricity prices | Distributive |
| Siting of energy infrastructure | Distributive; procedural | ||
| Mandatory targets and quotas | Target setting | Distributive | |
| Penalty | Distributive | ||
| Redistribution of penalty funds | Distributive | ||
| Opt-out options | Recognition | ||
| Eligibility of technologies and systems | Distributive | ||
| Net metering or distributed generation compensation rules | REC ownership | Recognition | |
| Buy-back prices | Distributive | ||
| Eligibility of technologies and systems | Distributive | ||
| Interconnection standards | Application information and procedures | Procedural | |
| Agreement form | Procedural | ||
| Eligibility of technologies and systems | Distributive | ||
| Financial | Loans, grants, tax credits, rebates, and feed-in tariffs | Eligibility and selection criteria | Distributive |
| Payment levels | Distributive | ||
| Eligibility of technologies and systems | Distributive | ||
| Program caps | Distributive | ||
| Funding options | Distributive | ||
| Government provision | Supply | Quality, prices of energy supplied | Distributive |
| Where, how to extract fuel | All | ||
| Procurement | Procurement training and assistance | Procedural; recognition | |
| Privilege for women or minority-owned businesses | Distributive | ||
| Information and education | Labels, public information campaigns | Information dissemination | Procedural |
| Target group selection | Recognition |
Table 2.
Variable description and sources.
| Variable | Description | Source | |
|---|---|---|---|
| Case 1 & Case 2 | ARRA dummy | Whether or not a utility received ARRA Smart Grid Investment Grant funding | Energy.gov |
| Per capita ARRA | Per capita dollar Recovery Act funds received by a utility | Energy.gov | |
| AMI penetration rates | Share of AMI meters in 2015, measured as total AMI meter counts divided by total customers | EIA 861 Form: File 8, File 2 | |
| AMI dummy | Whether or not smart meter roll out is taken place in 2015 | EIA 861 Form: File 8, File 2 | |
| Hispanic | Share of population identifying self as Hispanic or Latino | 2006–10 American Community Survey | |
| Black | Share of population identifying self as Black or African American | 2006–10 American Community Survey | |
| Income | Average family income ($) (log) | 2006-1–0 American Community Survey | |
| Density | Population density (log), measured as total population divided by utility service territory area (in square meters) | 2006–10 American Community Survey | |
| Population | Total population in the utility service territory area (log) | 2006–10 American Community Survey | |
| High school | Share of population who have graduated high school | 2006–10 American Community Survey | |
| IOU | Whether or not an investor-owned utility | EIA 861 Form: File 2 | |
| Obama vote | Share of population voted for Obama in 2012 | The Guardian | |
| Case 3 | GovLEED | Total number of government-owned buildings certified under the LEED NC v2.0–v2.2 standards | USGBC |
| TotalLEED | Total number of buildings certified under the LEED NC v2.0–v2.2 standards | USGBC | |
| Hispanic | Percent population identifying self as Hispanic or Latino (%) | 2013 American Community Survey | |
| Black | Percent population identifying self as Black or African American (%) | 2013 American Community Survey | |
| Population | Total population (log) | 2013 American Community Survey | |
| College | Percent bachelor’s degree or higher (%) | 2013 American Community Survey | |
| mIncome | Median Households income ($) (log) | 2013 American Community Survey | |
| %popchg00–05 | Percent population change between 2000 and 2005 (%) | Census 2000, Census 2005 | |
| %popchg05–13 | Percent population change between 2005 and 2013 (%) | Census 2005, Census 2013 |
Table 3.
Descriptive Statistics.
| Variables | Obs. | Mean | SD Dev | Min | Max | |
|---|---|---|---|---|---|---|
| Case 1 & Case 2 | ARRA dummy | 474 | 0.034 | 0.181 | 0.000 | 1.000 |
| Per capita ARRA | 474 | 4.559 | 31.347 | 0.000 | 375.227 | |
| AMI dummy | 474 | 0.405 | 0.491 | 0.000 | 1.000 | |
| AMI penetration rates | 474 | 0.298 | 0.444 | 0.000 | 1.000 | |
| Hispanic | 474 | 0.067 | 0.113 | 0.005 | 0.913 | |
| Black | 474 | 0.071 | 0.128 | 0.000 | 0.826 | |
| Income | 474 | 11.124 | 0.231 | 9.954 | 12.245 | |
| Density | 474 | −10.032 | 1.786 | −15.290 | −5.228 | |
| Population | 474 | 9.457 | 2.612 | 0.834 | 16.381 | |
| High school | 474 | 0.355 | 0.070 | 0.056 | 0.507 | |
| IOU | 474 | 0.105 | 0.308 | 0.000 | 1.000 | |
| Obama vote | 473 | 0.450 | 0.125 | 0.178 | 0.849 | |
| Case 3 | GovLEED | 515 | 2.907 | 7.354 | 0.000 | 65.000 |
| TotalLEED | 515 | 7.122 | 17.212 | 0.000 | 142.000 | |
| Hispanic | 515 | 12.577 | 17.534 | 0.400 | 99.500 | |
| Black | 514 | 10.977 | 11.219 | 0.300 | 63.400 | |
| Population | 515 | 12.339 | 1.093 | 10.898 | 16.809 | |
| College | 515 | 24.975 | 8.247 | 9.300 | 58.500 | |
| mIncome | 515 | 10.748 | 0.219 | 9.423 | 11.424 | |
| %popchg00–05 | 465 | 1.615 | 6.398 | −16.696 | 29.917 | |
| %popchg05–13 | 467 | 11.749 | 16.692 | −42.541 | 258.584 |
Table 4.
Results of Case 1 and 2: SGIG funding and AMI roll-out.
| Case 1: Distribution of Federal Financial Incentives (Craggit Model) | Case 2: Utility Smart Meter Roll Out (Craggit Model) | |||
|---|---|---|---|---|
| VARIABLES | Stage 1: Whether or not a Utility Received SGIG Funding | Stage 2: Per capita Dollar SGIG Received by a Utility | Stage 1: AMI Roll out Decision | Stage 2: AMI Penetration Rates |
| Hispanic | −0.470 | −897.7 * | −1.313 * | 0.0663 |
| (1.139) | (487.5) | (0.728) | (0.469) | |
| Black | −2.293 | −287.7 | 0.270 | 0.304 |
| (1.421) | (417.1) | (0.589) | (0.320) | |
| Income | −1.614 * | −141.6 | 0.551 | 0.146 |
| (0.946) | (491.5) | (0.380) | (0.211) | |
| Density | 0.0831 | 39.51 | −0.149 *** | −0.0415 * |
| (0.0855) | (28.39) | (0.0395) | (0.0241) | |
| Population | 0.318 *** | −33.93 | 0.278 *** | −0.0226 |
| (0.112) | (36.75) | (0.0325) | (0.0205) | |
| High School | −2.175 | −788.0 | 0.133 | 1.142 * |
| (3.002) | (1167) | (1.238) | (0.685) | |
| IOU | −0.102 | −121.8 | −0.542 ** | −0.464 *** |
| (0.434) | (80.16) | (0.228) | (0.144) | |
| Obama vote | 3.129 ** | 315.0 | ||
| (1.218) | (512.5) | |||
| Constant | 12.93 | 2722 | −10.49 ** | −1.510 |
| (10.62) | (5120) | (4.572) | (2.539) | |
| Observations | 473 | 473 | 474 | 474 |
Standard errors in parentheses. *** p < 0.01, ** p < 0.05, * p < 0.1.
Table 5.
Results of Case 3: new LEED building construction.
| VARIABLES | Government-Owned LEED Buildings (Negative Binomial) | Total LEED Buildings (Negative Binomial) | ||||
|---|---|---|---|---|---|---|
| (1) | (2) | (3) | (1) | (2) | (3) | |
| Hispanic | 0.00550 | 0.00258 | 0.00275 | −0.00769 *** | −0.00916 *** | −0.00938 *** |
| (0.00395) | (0.00428) | (0.00416) | (0.00275) | (0.00299) | (0.00287) | |
| Black | −0.000462 | −0.00131 | −0.00434 | −0.0142 *** | −0.0155 *** | −0.0162 *** |
| (0.00617) | (0.00643) | (0.00642) | (0.00421) | (0.00435) | (0.00434) | |
| Population | 0.851 *** | 0.883 *** | 0.898 *** | 0.950 *** | 0.973 *** | 0.972 *** |
| (0.0620) | (0.0698) | (0.0673) | (0.0408) | (0.0449) | (0.0436) | |
| College | 0.0658 *** | 0.0691 *** | 0.0658 *** | 0.0589 *** | 0.0593 *** | 0.0587 *** |
| (0.00849) | (0.00884) | (0.00883) | (0.00577) | (0.00599) | (0.00594) | |
| mIncome | −0.115 | −0.500 | −0.470 | −0.0287 | −0.235 | −0.239 |
| (0.391) | (0.422) | (0.419) | (0.272) | (0.291) | (0.287) | |
| %popchg0005 | 0.00799 | −0.000504 | ||||
| (0.0102) | (0.00682) | |||||
| %popchg0513 | 0.0135 *** | 0.00421 * | ||||
| (0.00488) | (0.00245) | |||||
| Constant | −10.88 *** | −7.216 * | −7.778 * | −11.71 *** | −9.755 *** | −9.734 *** |
| (3.870) | (4.174) | (4.122) | (2.709) | (2.911) | (2.854) | |
| Observations | 514 | 464 | 466 | 514 | 464 | 466 |
Standard errors in parentheses. *** p < 0.01, ** p < 0.05, * p < 0.1.
© 2019 by the authors. Licensee MDPI, Basel, Switzerland. This article is an open access article distributed under the terms and conditions of the Creative Commons Attribution (CC BY) license (http://creativecommons.org/licenses/by/4.0/).
Share and Cite
MDPI and ACS Style
Zhou, S.; Noonan, D.S. Justice Implications of Clean Energy Policies and Programs in the United States: A Theoretical and Empirical Exploration. Sustainability 2019, 11, 807. https://doi.org/10.3390/su11030807
AMA Style
Zhou S, Noonan DS. Justice Implications of Clean Energy Policies and Programs in the United States: A Theoretical and Empirical Exploration. Sustainability. 2019; 11(3):807. https://doi.org/10.3390/su11030807
Chicago/Turabian StyleZhou, Shan, and Douglas S. Noonan. 2019. "Justice Implications of Clean Energy Policies and Programs in the United States: A Theoretical and Empirical Exploration" Sustainability 11, no. 3: 807. https://doi.org/10.3390/su11030807
Note that from the first issue of 2016, this journal uses article numbers instead of page numbers. See further details here.