Affordability Assessment of Energy-Efficient Building Construction in Italy


1
School of Engineering, University of Basilicata, Viale dell’Ateneo Lucano, 85100 Potenza, Italy
2
Dipartimento di Scienze dell’Ingegneria Civile e dell’Architettura, Polytechnic of Bari, Via Amendola 126/b, 70126 Bari, Italy
3
Department of Architecture and Design, Sapienza University of Rome, Via Flaminia 359, 00196 Rome, Italy
4
Department of Environmental and Chemical Engineering, University of Calabria, Via Pietro Bucci Cubo 46B, 87036 Rende, Italy
*
Author to whom correspondence should be addressed.
Sustainability 2019, 11(1), 249; https://doi.org/10.3390/su11010249
Submission received: 2 November 2018
/
Revised: 13 December 2018
/
Accepted: 29 December 2018
/
Published: 7 January 2019
(This article belongs to the Special Issue Real Estate Economics, Management and Investments)
Abstract
:This research tries to investigate, in the current condition of the Italian real estate market, the economic advantage of investing in energy retrofitting of existing buildings or in expenditure aimed at obtaining higher energy performances in the construction phase of new buildings. A cost-benefit analysis is developed referring to the construction industry entrepreneur. Firstly, the increase in value due to a different measurement of the energy performance of new buildings or newly redeveloped residential buildings is achieved through an innovative statistical approach. Energy performance is measured by taking as a reference the category of energy certification, as required by European legislation. In the estimate of the contribution, the measurement of energy performance, expressed on an ordinal scale, is treated as a categorical variable in the implementation of an iterative regression model, called the alternating least squares model. Afterwards, this contribution is compared to the cost of sustainable building, trying to define a percentage increase in cost compared to a minimum condition according to different and increasing levels of energy performance. In the developed case studies, the comparison between likely benefits and investment spending showed that the entrepreneur would have no convenience at an expense for energy retrofitting while obtaining a positive balance in the construction phase of new buildings. The financial advantage grows if the investment is aimed at achieving the best energy performance and in areas where the price level of the real estate market is lower. The finding can be used as a guide for construction industry investors to make decisions in energy-efficient residential buildings production or transformation.
1. Introduction
Cities are among the main emissive sources of pollutants on Earth. Therefore, it is logical to think of actions needed to reduce this phenomenon by acting on one of the main sectors of energy consumption, private building. Energy improvement of the building stock, in addition to generating a direct economic benefit for people’s pockets, would produce greater energy security for the nation and would help to achieve the reduction target in CO2 emissions.
Behind the huge energy consumption of the residential sector, there is indeed much waste. Looking in particular at Italy (source ISTAT 2011), over 65% of the 12 million existing residential buildings were built more than 40 years ago before a law on the energy performance in the building sector was passed. According to ISTAT surveys, almost 3 million of the housing units in Italy fall within the last two energy performance categories, stressing the need for major refurbishment. Public Administrations (Regions, Provinces, Municipalities, etc.) which are responsible, at different levels, for the task of guiding and regulating construction activity, can promote a series of interventions aimed at increasing the energy efficiency of private buildings (through the enactment of state laws or regional building regulations, etc.). Administrations can on the one hand set rules or standards; on the other, they can encourage virtuous behavior. The obligations, such as that of respecting minimum levels of energy performance, obviously concern new construction, while the incentive to improve energy efficiency also involves refurbishment.
Both Europe and its individual states, including Italy, have allocated funds and created tools to promote the development of energy efficiency (thermal account, tax deductions, White Certificates, revolving funds, etc.).
In an era of environmental awareness and concerted action toward sustainable energy management, energy efficiency is a key challenge. Buildings account for 40% of the energy consumption in Europe [1], and residential homes contribute to around one sixth of emissions globally [2].
Literature has begun to emerge on the willingness to pay for energy efficiency [3,4,5,6,7,8,9,10], whether energy savings are considered in buying decisions [11,12], and if financing should stem from private or public sources [13,14,15,16].
The majority of empirical evidence on the impact of energy certificates on building prices supports the assumption that people are willing to pay extra for more efficient properties in both the commercial and residential sectors. Studies in the commercial sector, primarily in the United States, suggest that green offices acquire a price premium from 13% to 30% [17,18,19,20,21]. Similarly, positive results of a lower magnitude are observed in the residential sector. Studies on the influence of an energy certificate on the value of properties were conducted in The Netherlands and Ireland [9].
A wider study undertaken by the European Commission [8] compares residential premiums associated with Energy Performance Certificates (EPCs) in five European countries: Austria, Belgium, France, Ireland, and the UK. The sales price effects from increased energy efficiency are significant and positive in all cases apart from Oxford in the UK.
Further studies in Europe, Australia, the United States, and Singapore confirm findings that residential buyers are willing to pay a premium for energy-efficient housing [5,6,7,22,23,24,25,26,27,28], although some papers have produced more mixed results [11,12,29,30].
To ascertain the extent of the impact of energy efficient investments on the existing building stock, there has been a growing focus on measuring the impact of energy efficiency on the overall value of buildings [19,31,32].
By considering the building as a commodity and not as a property, the construction sector, nowadays strongly affected by the economic crisis, sees the topic of energy redevelopment as a great opportunity for its re-launch. However, although today the demand is conscious and oriented towards energy efficient living spaces, the investment in efficiency is always the consequence of a balance between revenues and costs. If building new buildings with high-energy performance involves an additional expenditure of a few percentage points, the refurbishment of the existing ones can instead cost a lot and make the operation uneconomical.
Therefore, the problem to be faced is how to evaluate the economic benefit of an investment in energy efficiency. On the one hand, it is necessary to estimate the costs required by the intervention and, on the other hand, the benefits that this investment generates. In this study, the costs of the intervention are not compared with the savings resulting from lower energy expenditure. Basically, the hypothesis is that the investment is not made by the owner of the house, rather by an entrepreneur in the building sector. The latter will have to evaluate, in the context of an urban transformation, if the economic advantage deriving from the sale of the transformed product with a given energy performance exceeds the cost to be incurred to reach that particular performance. In other words, the economic advantage must be commensurate with the increase in value that can be achieved from the energy efficiency of new buildings or those being transformed, measuring the marginal contribution to the price of residential property units, and subtracting from it the additional cost to realize such performances.
This paper aims to quantify the energy quality (performance) that, expressed on an ordinal scale, is treated as a categorical variable in a regression model implemented on purchase and sale prices. This contribution is compared to the cost of sustainable building production, trying to define a percentage increase in cost compared to a basic condition (minimum performance) in relation to the different and increasing levels of energy quality.
The paper is organized as follows. First of all, the methodology is described. Then, the models to calculate the marginal contribution to the price of the different energy performance of the building have been elaborated and applied to different case studies. In the same cases, the cost to achieve these performances has been estimated. Therefore, the results of the economic comparison are presented and discussed.
Finally, an overview of the work and its implications for the construction industry are explained.
2. Literature Review
The measurement is performed according to the scale of the energy performance of buildings required by Italian legislation. The latter has implemented the European Commission directive on “Energy Performance of Building (EPBD 2002/91/EC, recast in 2010/21/EU, 2018/844/UE). The EU Directive (EPBD) obliges real estate owners willing to sell or lease a property to obtain an EPC. There are numerous studies in literature [33,34,35,36,37,38] that have tried to evaluate the financial implications of energy labels in real estate market.
While most of the other studies employed a hedonic model to estimate the effect of EPC ratings on house prices [39,40,41,42], Brounen and Kok [4] and Robinson and Sanderford [43] use a logit regression model to explore the effects of the adoption of certificates in the real estate market, showing a positive correlation between sale prices and the highest categories of energy performance certificates.
Hyland et al. [9] show that the building’s energy efficiency has a significantly stronger positive effect in the real estate sales segment rather than in the rental market. In addition, authors have also highlighted the difference in the effect of energy efficiency in different market conditions, finding that the effect of the energy rating is generally stronger when the market conditions are worse. Das and Wiley [44] also come to similar conclusions; they report that the price premiums for sustainable building certification are dynamic and anti-cyclical. Robinson and McAllister [45] find there is a difference in price premiums between the different categories of properties. In particular, they report that the segment of buildings of higher value shows no price premium, while lower value categories do. They justify this evidence on the office real estate market by assuming that the concentrated offer of eco-labeled offices in large and high-quality buildings probably contributes to this phenomenon.
Adan and Fuerst provide similar indications regarding the residential market [46]. They show that where housing prices are low, energy efficiency measures produce an increase in the value of real estate compared to what happens in richer territorial contexts. According to the authors, this phenomenon is due to the greater potential gains from energy savings for lower-income households.
3. Methodology
In this study, the approach used to estimate the marginal contribution deriving from a different energy qualification of the building to the price of residential properties is originally compared to those used by the research in the literature.
In estimating this contribution, the measurement of energy quality, expressed on an ordinal scale (energy performance) is treated as a categorical variable in the implementation of a regression model. All the ordinal variables, used in the price function to describe the properties of the sample, were treated in the same way. This contribution is compared to the cost of sustainable building construction, trying to define a percentage increase in cost compared to a basic condition (minimum performance) according to the different and increasing levels of energy quality.
In the elaboration of mathematical-statistical models, such as regression, the use of variables not directly comparable with each other, as expressed on different measurement scales (cardinal and ordinal), is a problem that is often ignored. The ordinal scale makes it possible to measure the degrees of difference (i.e., “plus” or “minus”) but not the specific quantity of the differences (that is, how much “more” or “less”). The ordinal scale is, therefore, only a classification of preferences, just an order, and if the data is not adequately treated in the mathematical elaboration, the result can be distorted. In these circumstances, therefore, it is necessary to define a criterion for converting the ordinal measure to a metric scale, i.e., for transforming the data into quantitative measurements, graduated over the whole space of real numbers. This operation, called scaling, allows the assignment of numerical quantifications to the categories of ordinal variables to which metric properties are thus assigned. This makes it possible to use the standard statistical procedures correctly. However, the interpretation of the results obtained varies according to the technique used for scaling [47].
A simple scaling technique is the so-called “direct quantification” (classical scaling [48]) which hypothesizes that the modalities of a qualitative character are at the same distance. In this case, the transformation of the ordinal type judgment takes place on an equivalence scale, such as (1) Excellent; (2) Very good; (3); Good; (4) Poor; (5) Worst. This scaling mode is common in real estate estimates using regression techniques; for example the case of the evaluation of features such as brightness, view, quality of the finishes, level of maintenance, etc. [49].
The attribution of a metric measure in these cases assumes the essential hypothesis that there is equidistance between the categories. However, this hypothesis is not respected in many cases and this can lead to inconsistent results [50]. There are more sophisticated techniques of classical scaling that can provide new scores for ordinal measurements. The most used are the monotone regression of Kruskal [51], the scale models of evaluation in the Rasch analysis [52] and the psychometric approach of Thurstone [53]. Other approaches are those proposed by Guttman [54], Fisher [55] and Hayashi [56]. In recent years, the Data Theory Group of the Dutch University of Leiden has collected several optimal scaling techniques, available in the literature, in a single reference framework called the Gifi System [57]. The algorithm used in this work for the scaling (optimal) of qualitative variables uses an iterative method called alternating least squares (ALS) method. ALS are algorithms created with the aim of extending the techniques developed for the study of the relationships between quantitative variables in the multivariate analysis to qualitative data. They are based on the minimization of a loss function, with which the goodness of fit (distance) between the quantifications of the item categories and one or more latent/underlying variables (dimensions not directly observable) that represent the concept of interest is evaluated. Loss function is defined according to two parameters: one represents the parameter of the model to be developed (in this case the variable explained), while the other is the scaling vector for the qualitative variables (predictors).
The ALS are characterized by the alternation of two steps: the first one optimizes the scaling parameter, keeping the other fixed. In the second, however, the quantification of the response variable obtained in the previous step is fixed and the function is minimized with respect to the other parameter; the scaling levels and the regression coefficients are updated (one variable at a time). The steps are alternated until convergence. The updated quantifications are used to find a new solution, which is used in order to update the quantifications, and so on in an iterative way, until it converges towards a criterion (minimum error) that indicates the end of the process. The result provides the graphical representations of the quantifications, for each qualitative variable. The distinction between the different algorithms is due not only to the developing method, but also to the type of variables on which these algorithms are applicable. Within the ALS, the most used algorithms in literature are PRINCALS, HOMALS [58], MORALS [59], spline transformations [60,61,62], projection pursuit regression [63], ACE [64], and GAIM [65]. This study, which represents the first work in literature that employs this different approach for estimating the hedonic price of a real estate feature, uses in particular the MURALS algorithm [66,67] implemented in SPSS Categories.
Once the value differential, deriving from a different and better energy qualification, is estimated, it is compared to the cost of sustainable building production (understood as retrofitting or new construction), trying, even with regard to this aspect, to define a percentage increase cost measured starting from a basic condition (minimum EPC) and according to the different and increasing level of energy performance.
4. The Marginal Price of Energy Performance of a Building
4.1. The Data
The data derived from three different samples were processed, all containing information on properties for residential use, recently bought and sold, whose price and features are known. The first two samples belong to two different areas of the city of Bari (Puglia, Italy): the center and the suburban area (zones 1 and 4 of the zoning performed by the Real Estate Market Observatory of the Revenue Agency). These real estate units have the same geographical and economic context.
The third sample consists of buildings in Acri, a small city in the province of Cosenza (Calabria, Italy) with about 21,000 residents. The sample was taken in a district of the city where the buildings have a level playing field for what concerns the geographical and economic context. The building typology refers to reinforced concrete multi-storey buildings built over a longer period. This was taken into account in the estimative analysis considering the variable “age of the building” which is also considered a proxy variable of the maintenance status.
The number of data for the first sample (Central area of the city of Bari) consists of 101 real estate units, the second (suburban area of Bari) of 43 and the third (Acri) of 39.
In addition to the price, a series of variables were identified for each unit that, compared to the reference context, were initially deductively selected from those that best represent the mechanisms for real estate value formation. This choice is in line with Bourassa et al. (2003), who conclude that it is probably unhelpful to employ excessively elaborate statistical methods, underscoring the importance of the practical knowledge of real estate agents. Subsequently, the predictive variables were reduced to those statistically significant after a first elaboration conducted through linear regression on scaled variables with the classical scaling method (hypothesis of equidistance between scores).
The regression in the categories module does not use the constant term. This parameter takes into account any systematic but constant tendency in Y not explained by the variables. This limit does not allow immediate comparison with a standard regression model that works with quantitative variables and uses the constant term. Because of this condition, the module does not accept the assignment of scores equal to 0 even for numerical variables.
For the first sample (central Bari) the variables used are:
- -
- Surface, (numerical variable expressed in square meters);
- -
- Bathrooms (numeric variable 1–2); once the number of bathrooms in the apartment is defined, this number has been divided by the square meters of the surface; the following ordinal score has been attributed to this ratio: if less than 0.011 = 1 if greater than 0.011 = 2. The idea is that the number of bathrooms in ordinary conditions is proportional to the internal surface (if bigger than 90 square meters at least 2 toilets are required); if the coefficient is below that limit, it means that the unit has a lower endowment than ordinary condition;
- -
- Floor level (ordinal variable);
- -
- Elevator (numerical variable: Is there one? = 1 no, 2 yes);
- -
- Maintenance level (ordinal variable: mediocre 1, sufficient 2, good 3);
- -
- Energy performance (ordinal variable); In Italy energy performance is measured by assigning a performance class as prescribed by Legislative Decree no. 19 August 2005, n. 192 which contains the provisions for implementing Directive 2002/91/EC. (In this case from G to A with median in class F);
- -
- Age of the building (numerical variable measured as the difference between the date of the survey and the time of construction).
For the second sample (Bari peripheral zone) the explanatory variables used in the final elaborations were:
- -
- Surface (numerical variable expressed in square meters);
- -
- Floor level (ordinal variable);
- -
- Maintenance level (ordinal variable: mediocre 1, sufficient 2, good 3);
- -
- Energy performance (from class G to A+, with median in D).
While for the sample in the municipality of Acri, the model considered the following variables to predict the price:
- -
- Surface (numerical variable expressed in square meters);
- -
- Bathrooms (numeric variable 1–2);
- -
- Overlook (ordinal variable: 1 poor, 2 sufficient, 3 good/very good);
- -
- Presence of private parking;
- -
- Orientation (ordinal variable from North to South);
- -
- Energy performance (from class G to A, with median in E).
All the high real estate properties not considered in the estimate analysis are either coeteris paribus or not relevant for buyers and sellers and, therefore, do not come under the definition of the selling price.
4.2. Data Analysis
The three detected samples are presented through the tables of descriptive sample statistics (Table 1, Table 2 and Table 3).
The real estate data were processed through categorical regression and provided the results shown in the tables below (Table 4, Table 5 and Table 6). In the categorical regression, variables considered as ordinals determine the generation of a transformation graph that represents a piecewise monotonic function. Transformation plots illustrate the relationship between the quantifications and the original categories resulting from the optimal scaling level.
Although not statistically significant for some of the variables, the results obtained are comforting under the evaluation profile. In fact, the marginal prices of the real estate features are in line with the market evidence and in particular the energy performance variable. Therefore, the study has a more interpretative character of the property market. The determination index is higher in the samples from the city of Bari but not very significant for the city of Acri. Therefore, the model built on the two samples detected in the city of Bari assumes a greater predictive character than that of the city of Acri.
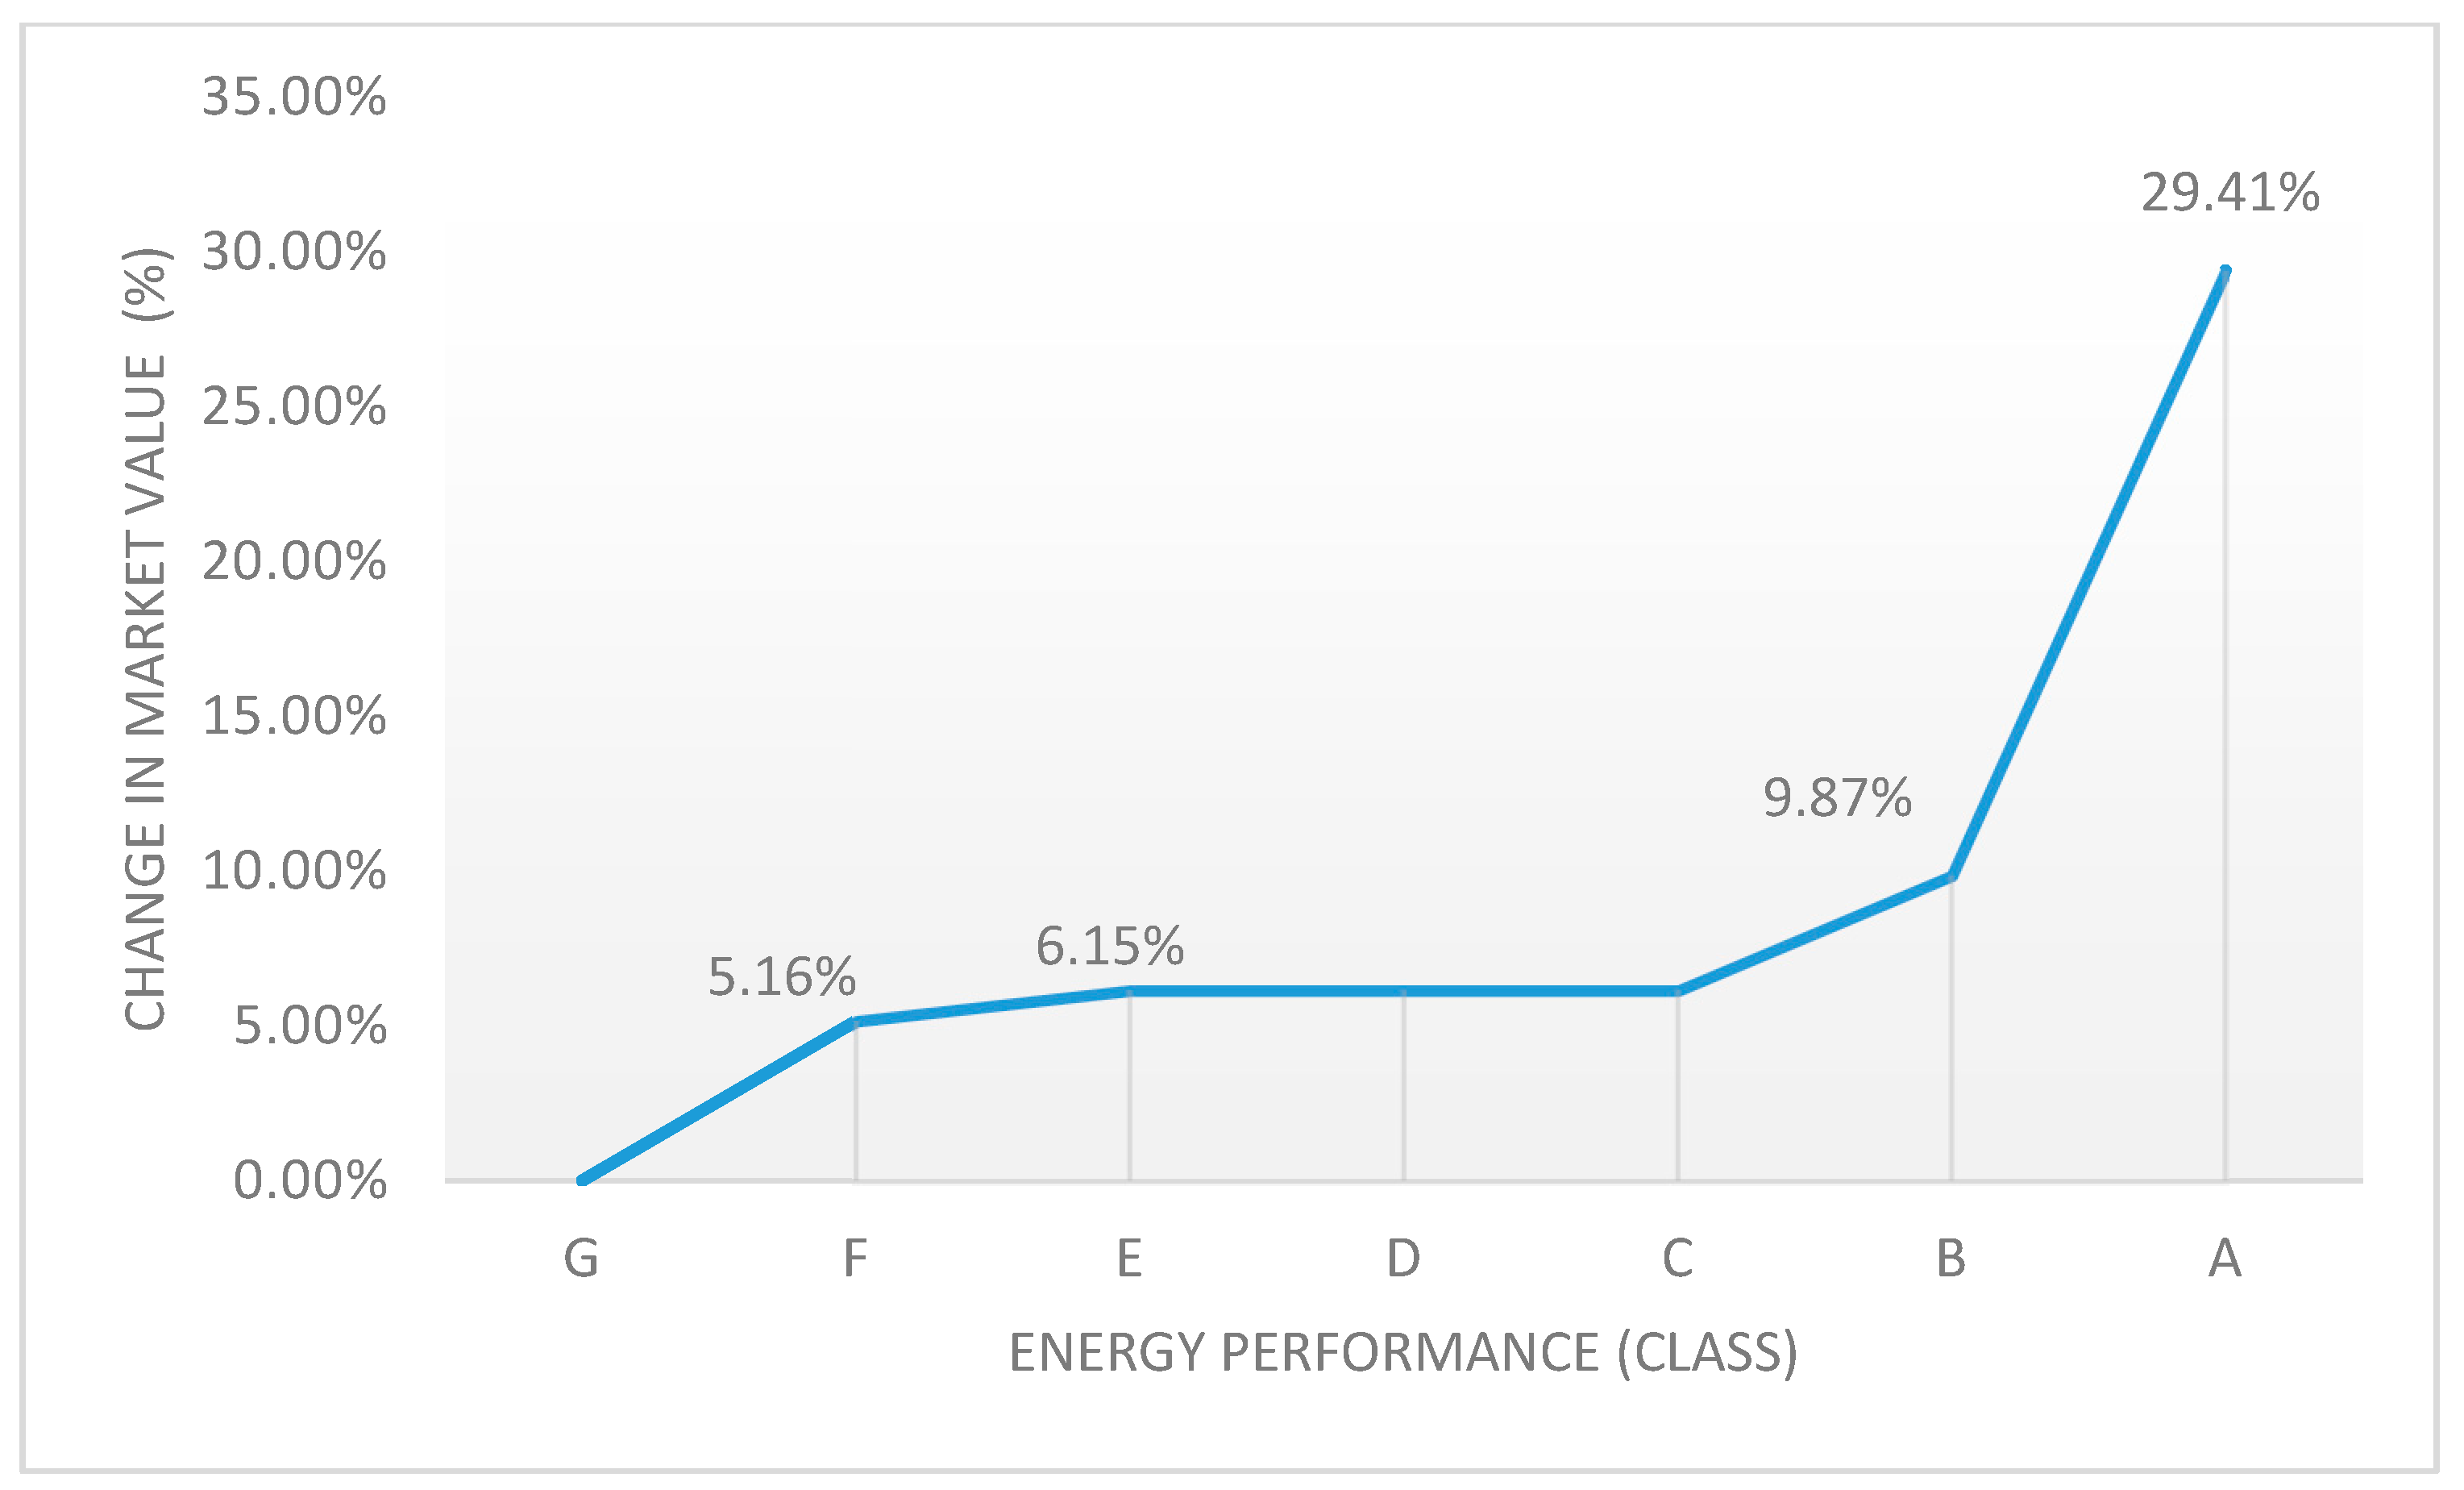
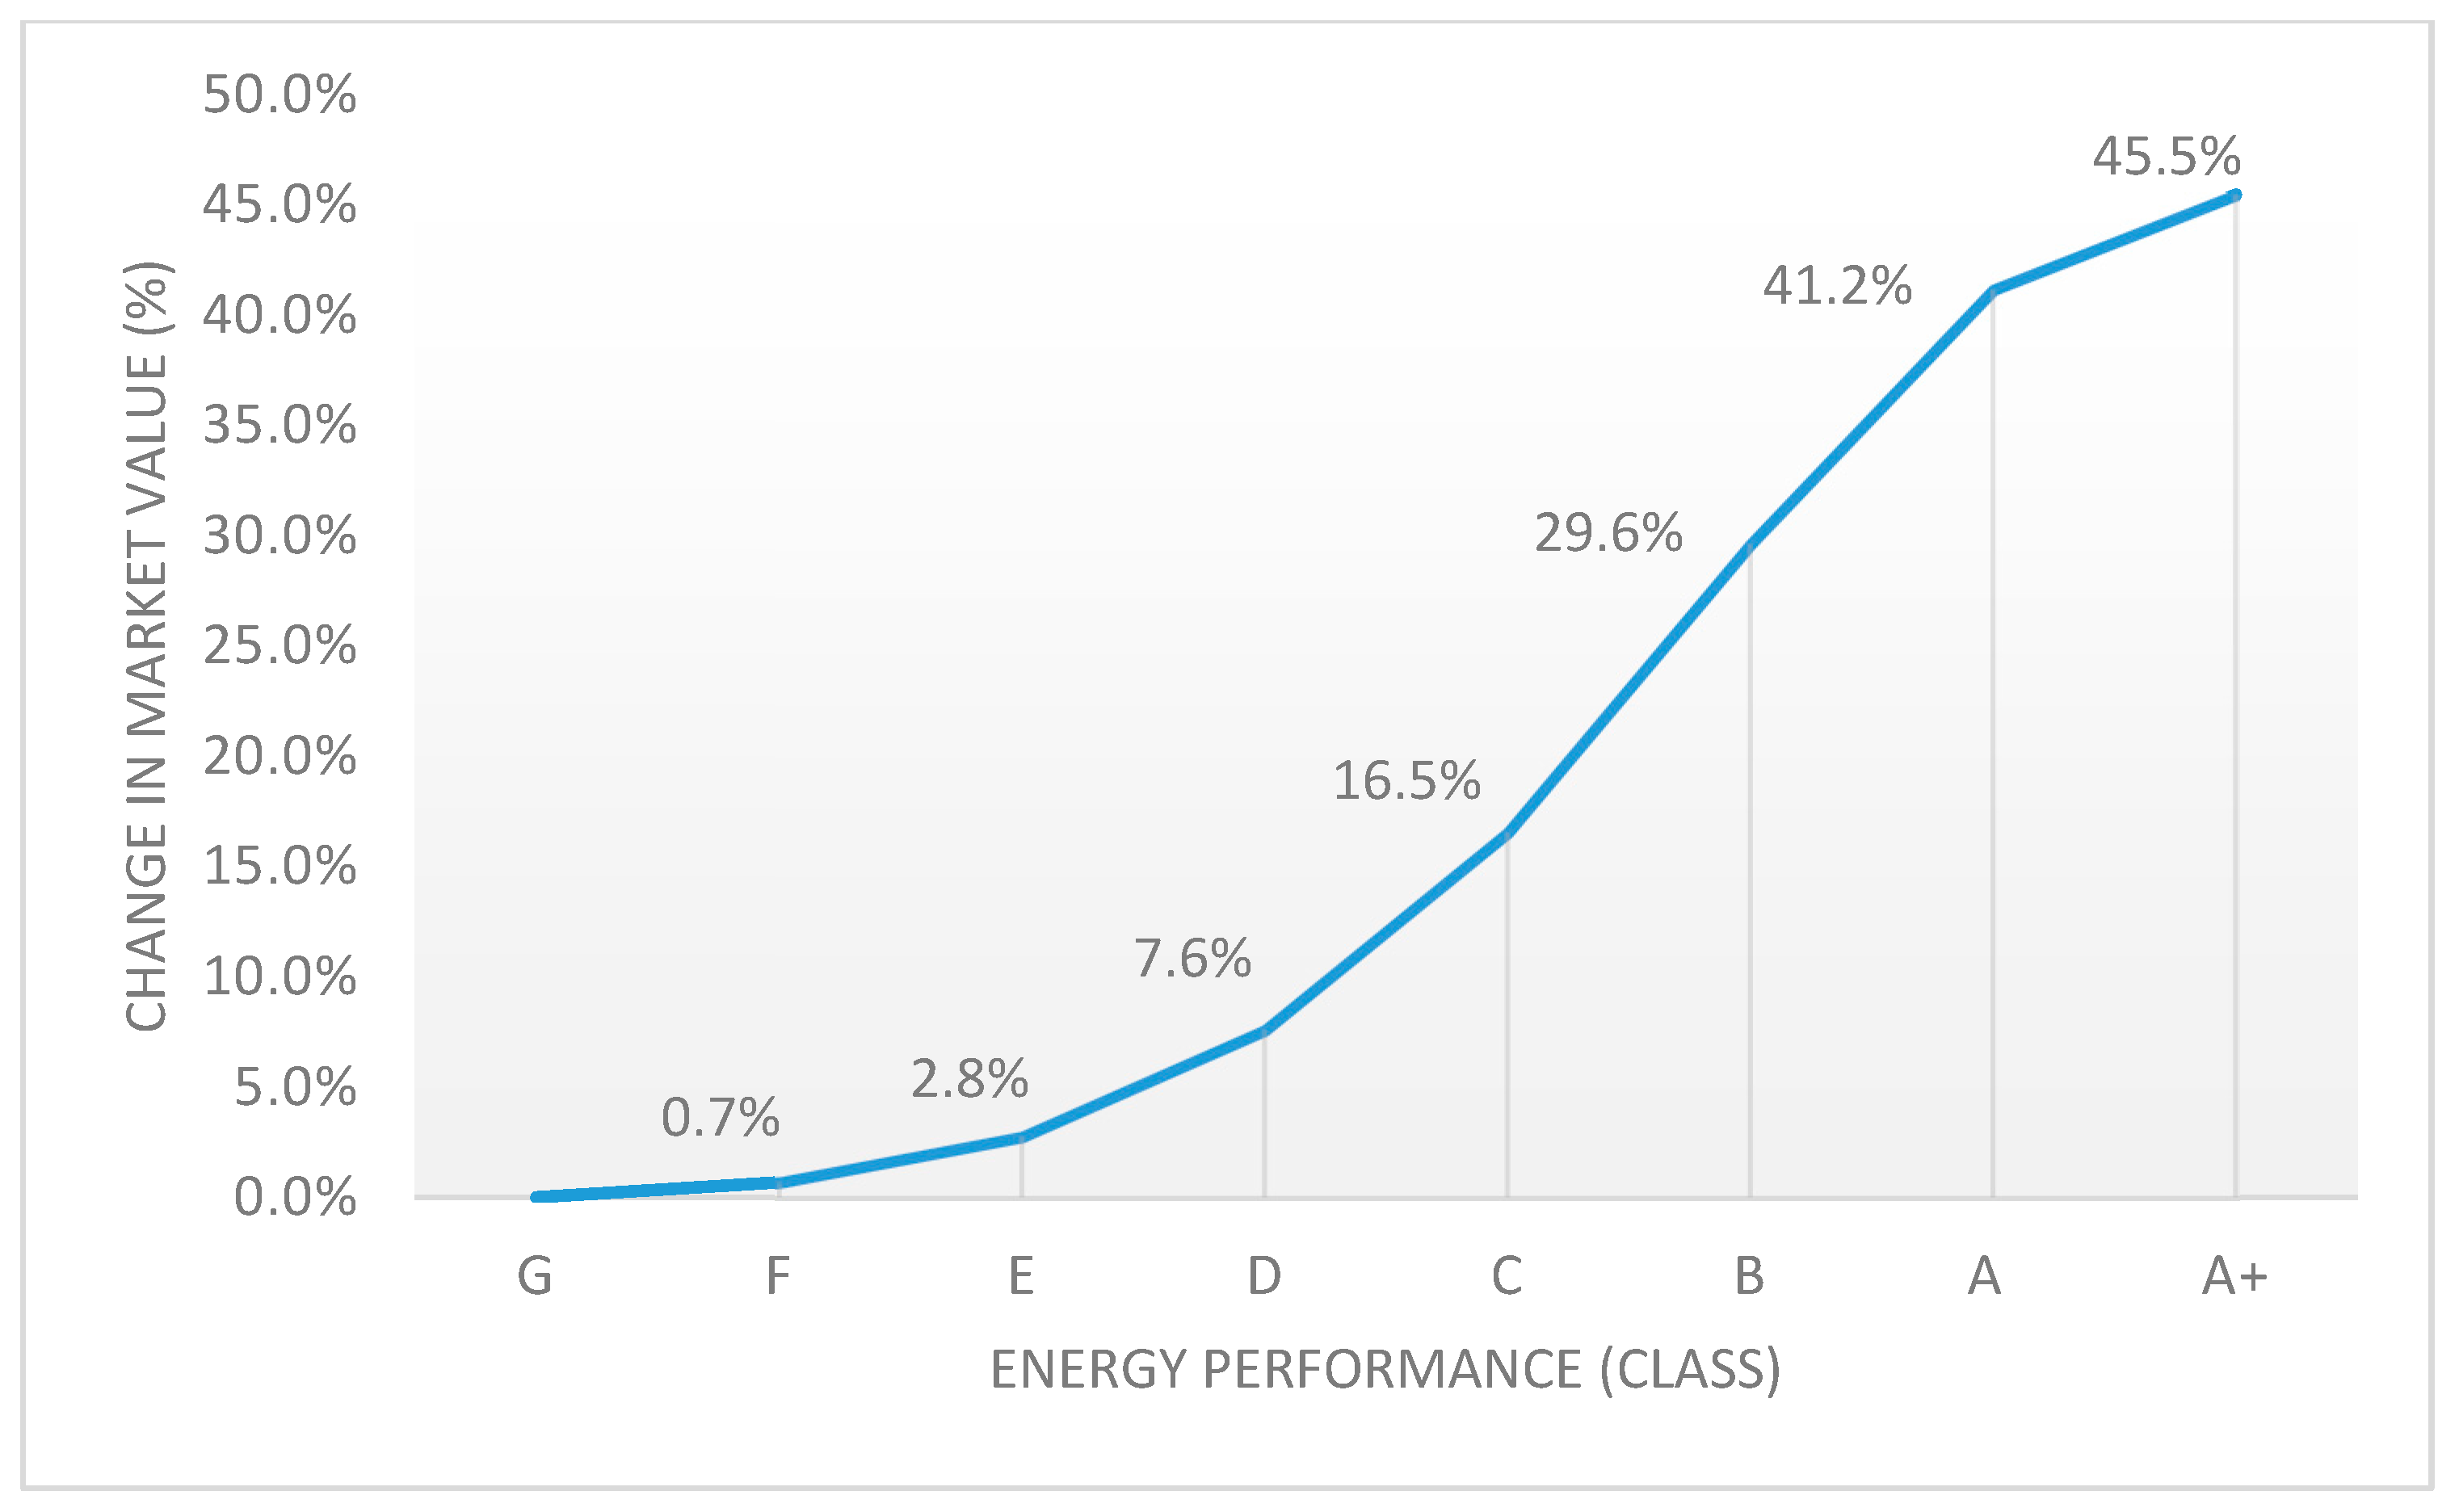
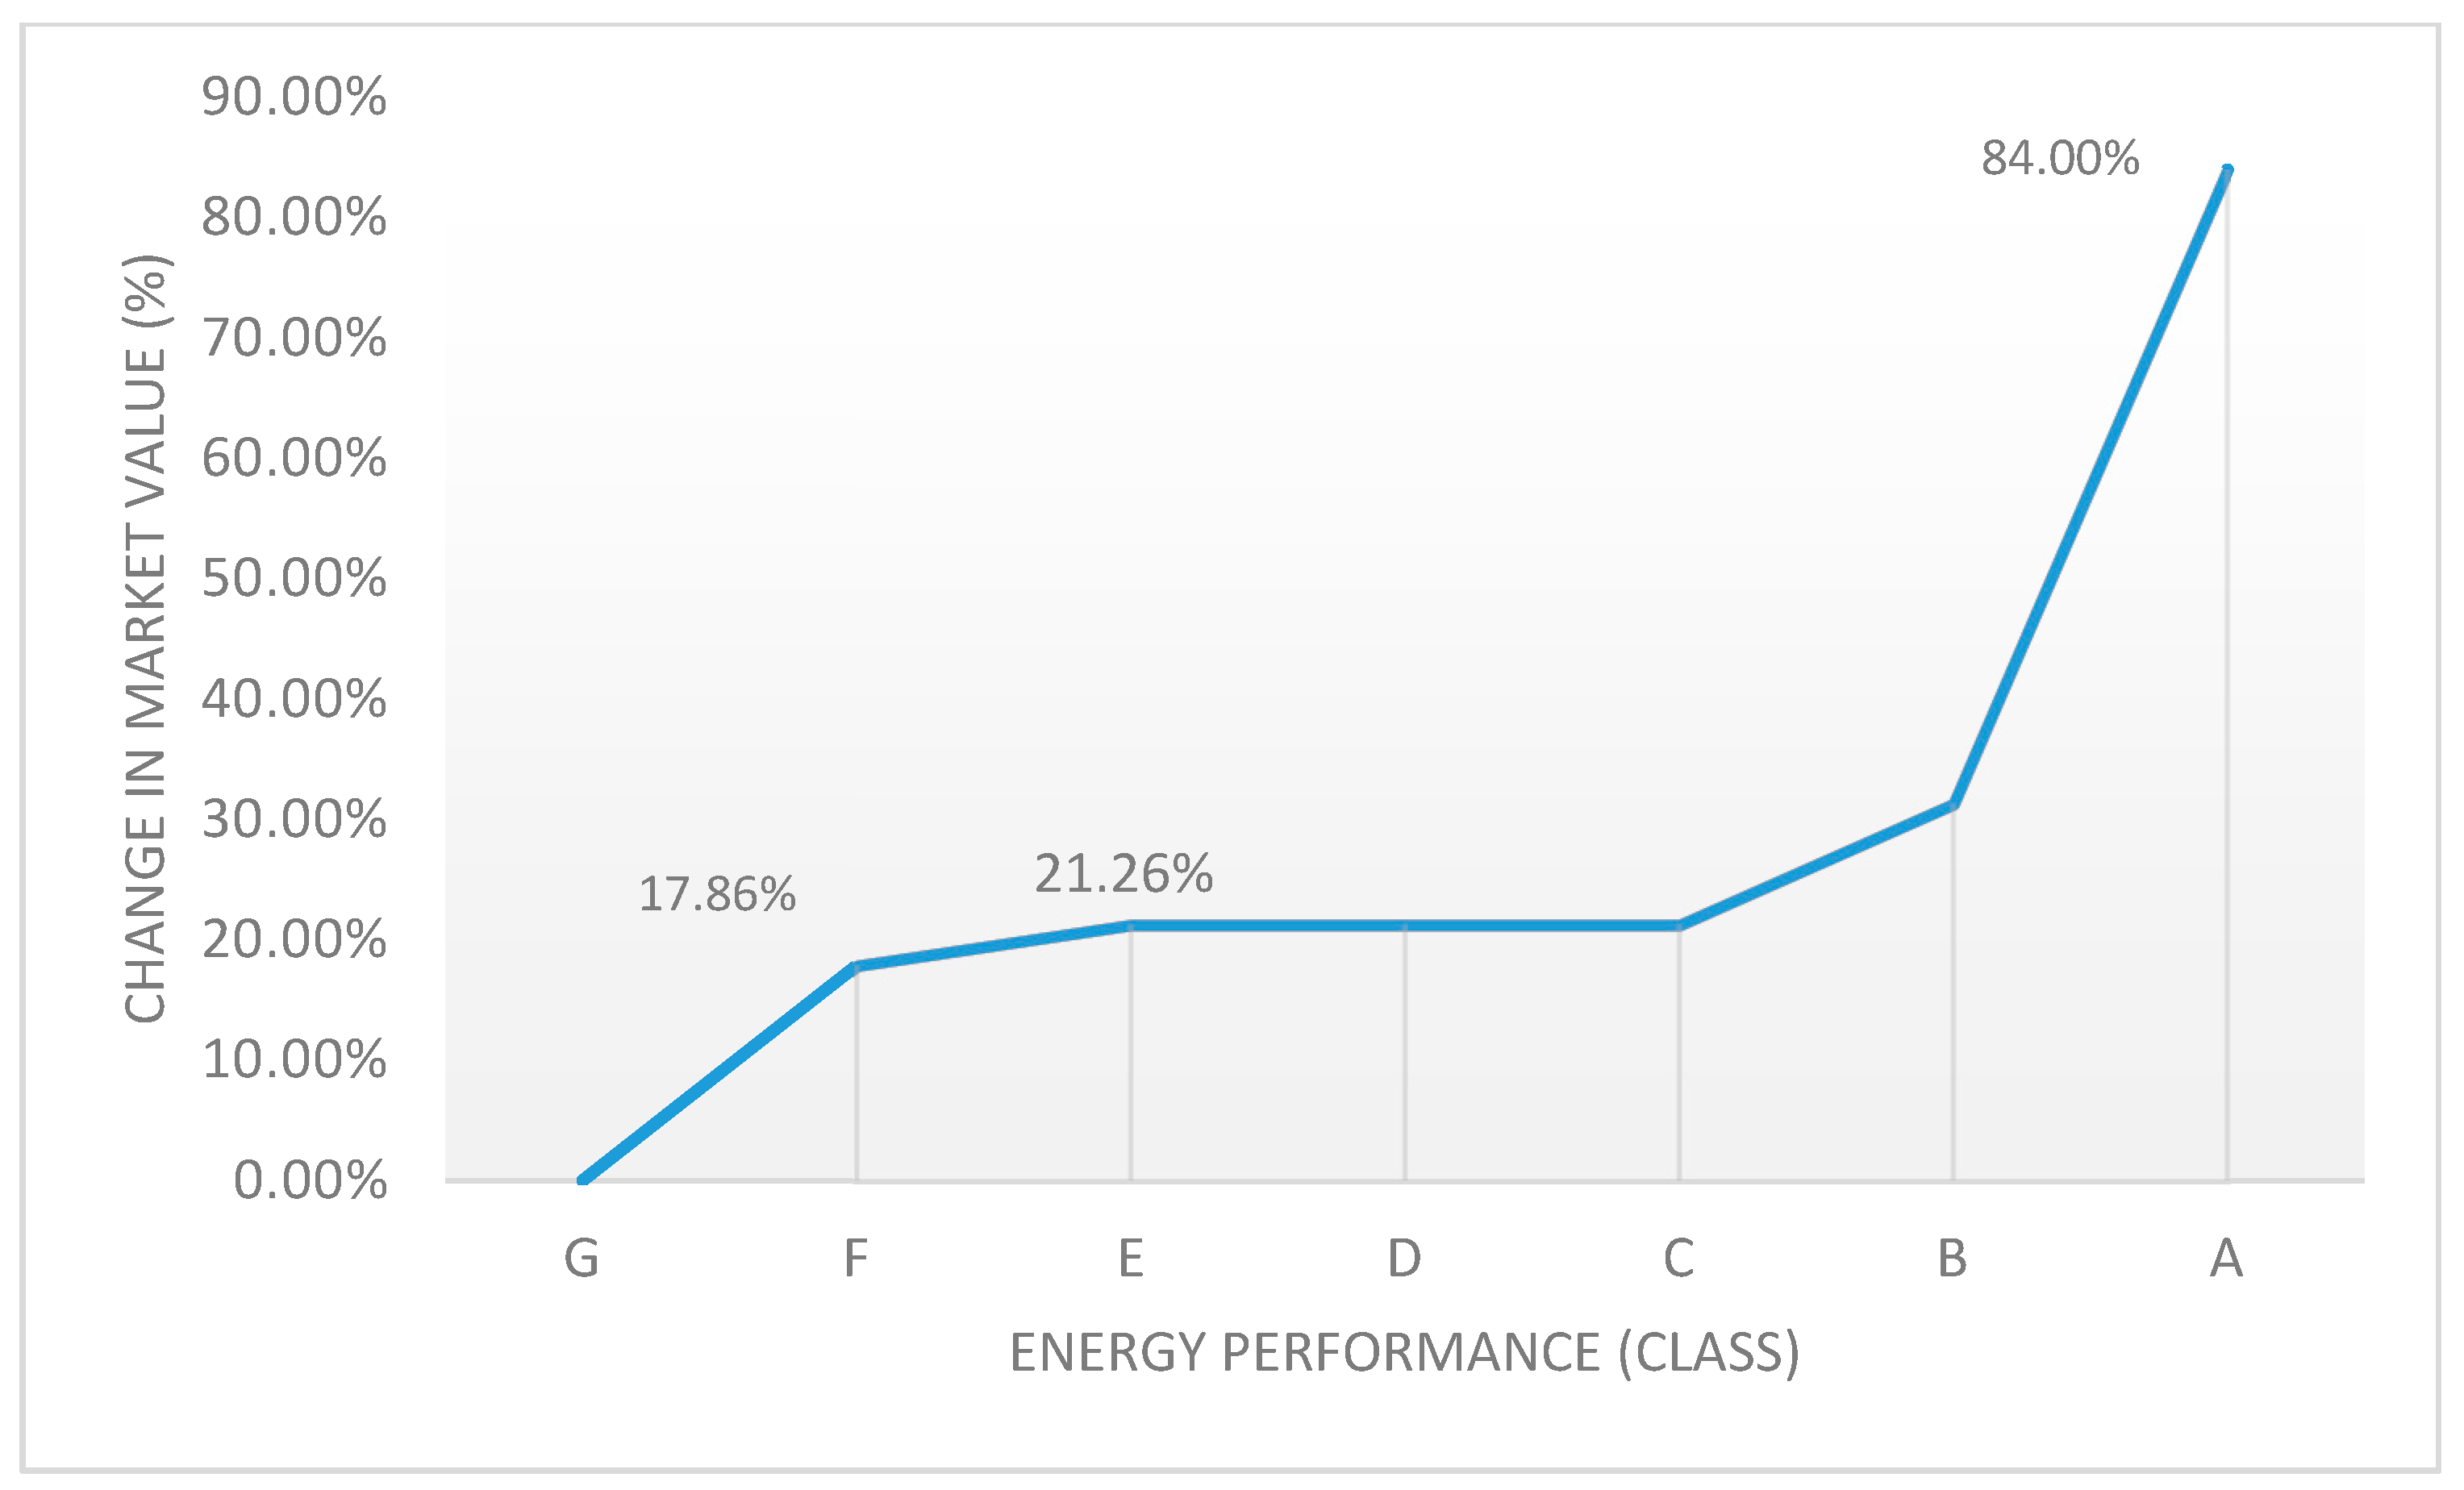
The Figure 1, Figure 2 and Figure 3 show the transformation graphs related to the energy performance variable. The quantification of the variable is expressed as a percentage: the percentage change in the market value of the property is measured in the transition from one energy performance to other.
4.3. Discussion
Comparing the results, first of all it is evident that when the average value of the housing unit increases, the variation of this value determined by a better energy performance decrease (both in percentage and in absolute terms). This confirms what is highlighted in other studies already cited [41,49]. This observation is validated by the fact that in the most valuable areas (for example the center compared to the suburbs), the processes that regulate the formation of value involve localization aspects in an important way, thus placing other characteristics, such as energy efficiency, on a secondary level. Another reason can be probably traced to the fact that the buildings with the best energy performance are those built more recently, generally located in new peripheral suburban areas, rather than in the saturated central areas. The graphs also show the perfect analogy of the piecewise monotonic function that characterizes the marginal contributions to the market value resulting from the different energy performance for Sample 1 (center of Bari) and Sample 3 (Acri). For both, an initial increase in value marks the transition from the last class G to the class F. The value increases by a minimum percentage in the transition from class F to the next and then remain unchanged up to class C. There is also a slight increase in value in the transition from C to B, while the last jump (from B to A) is what the market evaluates as the most important. The elaboration carried out on the periphery of Bari partially confirms this dynamic; in fact, it shows an exponential growth of the marginal contribution.
5. Cost Estimations
The estimation of cost differential to produce an energy efficient buildings or to transform existing buildings into NZEB (nearly zero energy building) with low or near-zero energy consumption, derives from the synthesis of researches and investigations developed by organizations, companies and associations active in the building production field or in general in sustainable economic development.
Dwaikat and Ali [68] report a detailed summary of the literature on cost comparative analysis of green buildings against similar non-green buildings. Results of 17 empirical studies show a significant gap in the quantified cost premium range. Among this research, the only one that examines residential buildings is the study of Kim et al. [69], which show that the incorporation of green systems causes the construction costs to increase by 10.77% more than traditional building.
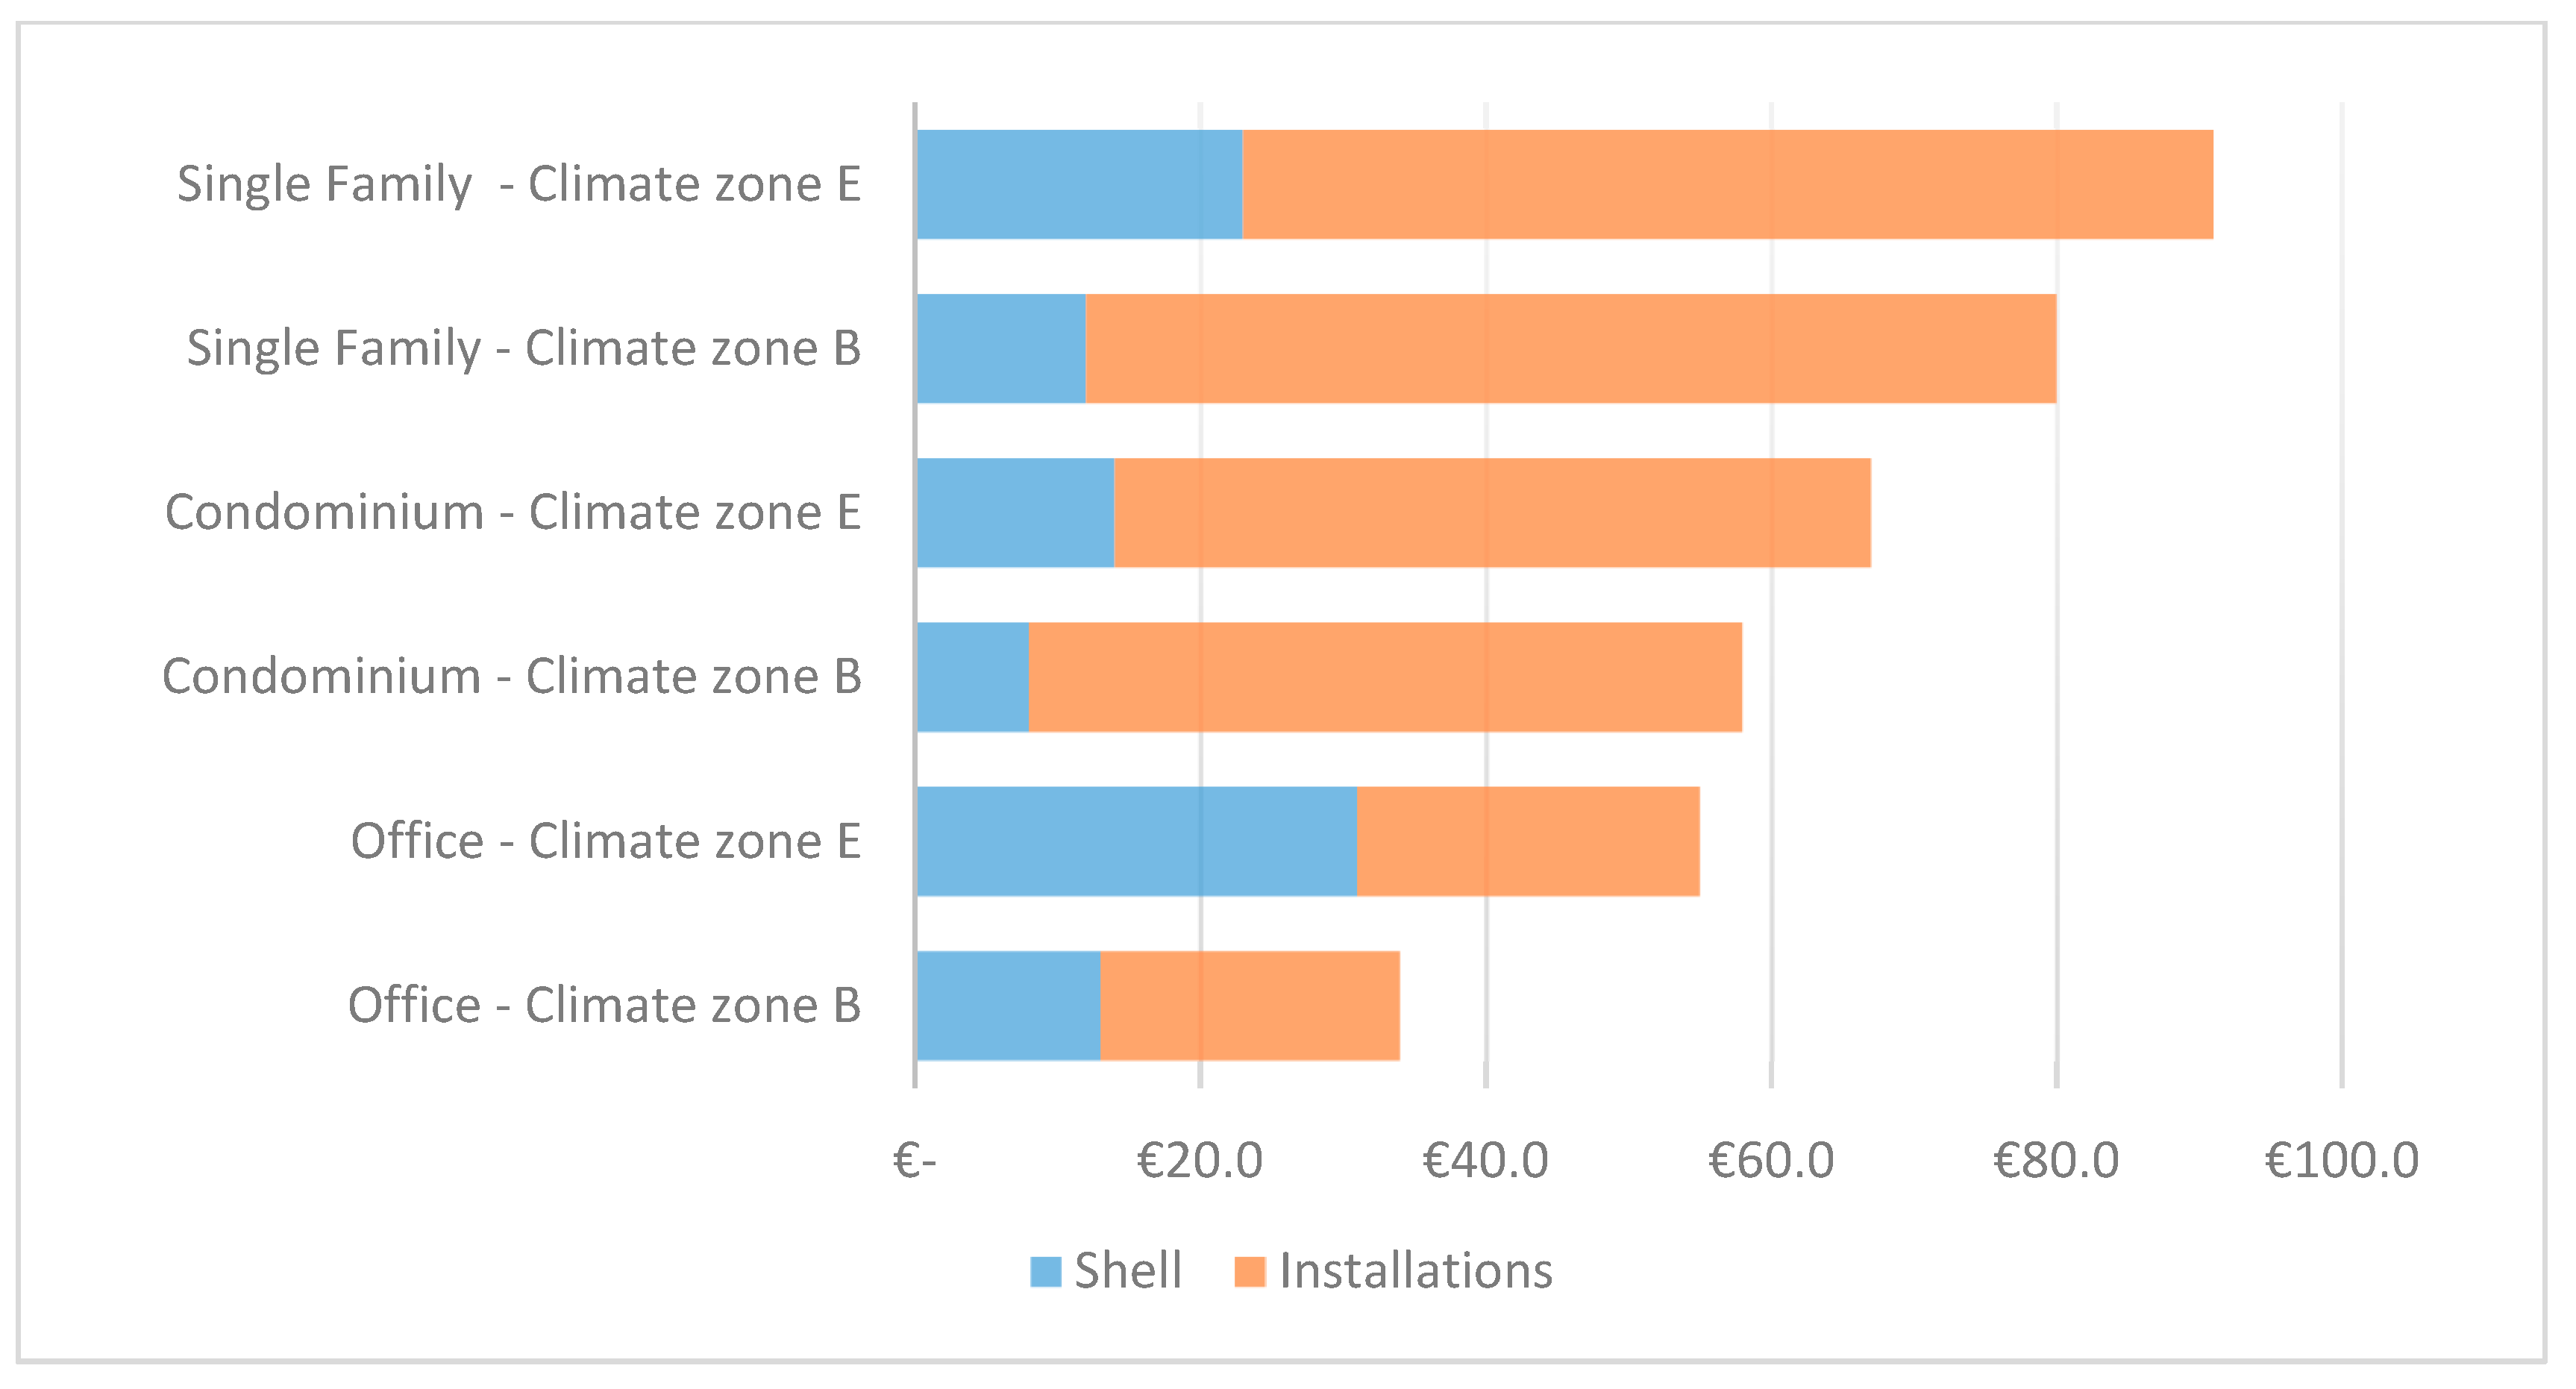
As regards Italy, ENEA (National Agency for New Technologies, Energy and Sustainable Economic Development) with 2016 Energy Efficiency Report, analyzes the costs, trends and new technologies of the green building sector. Figure 4 shows the additional costs to build a NZEB compared to an equally new building whose construction has, however, been limited to a minimum compliance with the current legislation on the energy issue. The report distinguishes different climatic zones (classification introduced by the Decree of the President of the Republic No. 412 of 26 August 1993) with different additional costs for the systems and the envelope (insulation).
In particular, the expenditure on the insulation is greater than the one for the systems only in the climate zone E and with reference to the office destination. The average cost to be incurred for condominium buildings is between 55 and 70 €/sq., depending on the climatic zones (B or E).
Furthermore, ENEA reports (Table 7) the percentage of additional cost to transform an existing building into NZEB in the context of general renovation work.
Besides, in this case the biggest expense always regards the systems and the higher percentages are those related to single-family residences.
Further sources of information regarding the expenses to be incurred to make a building energy-efficient are the engineering companies specializing in sustainable construction. For example, “La Casa Attiva—Società di Ingegneria” [70] carried out a comparative study of construction costs relating to buildings with different energy performances.
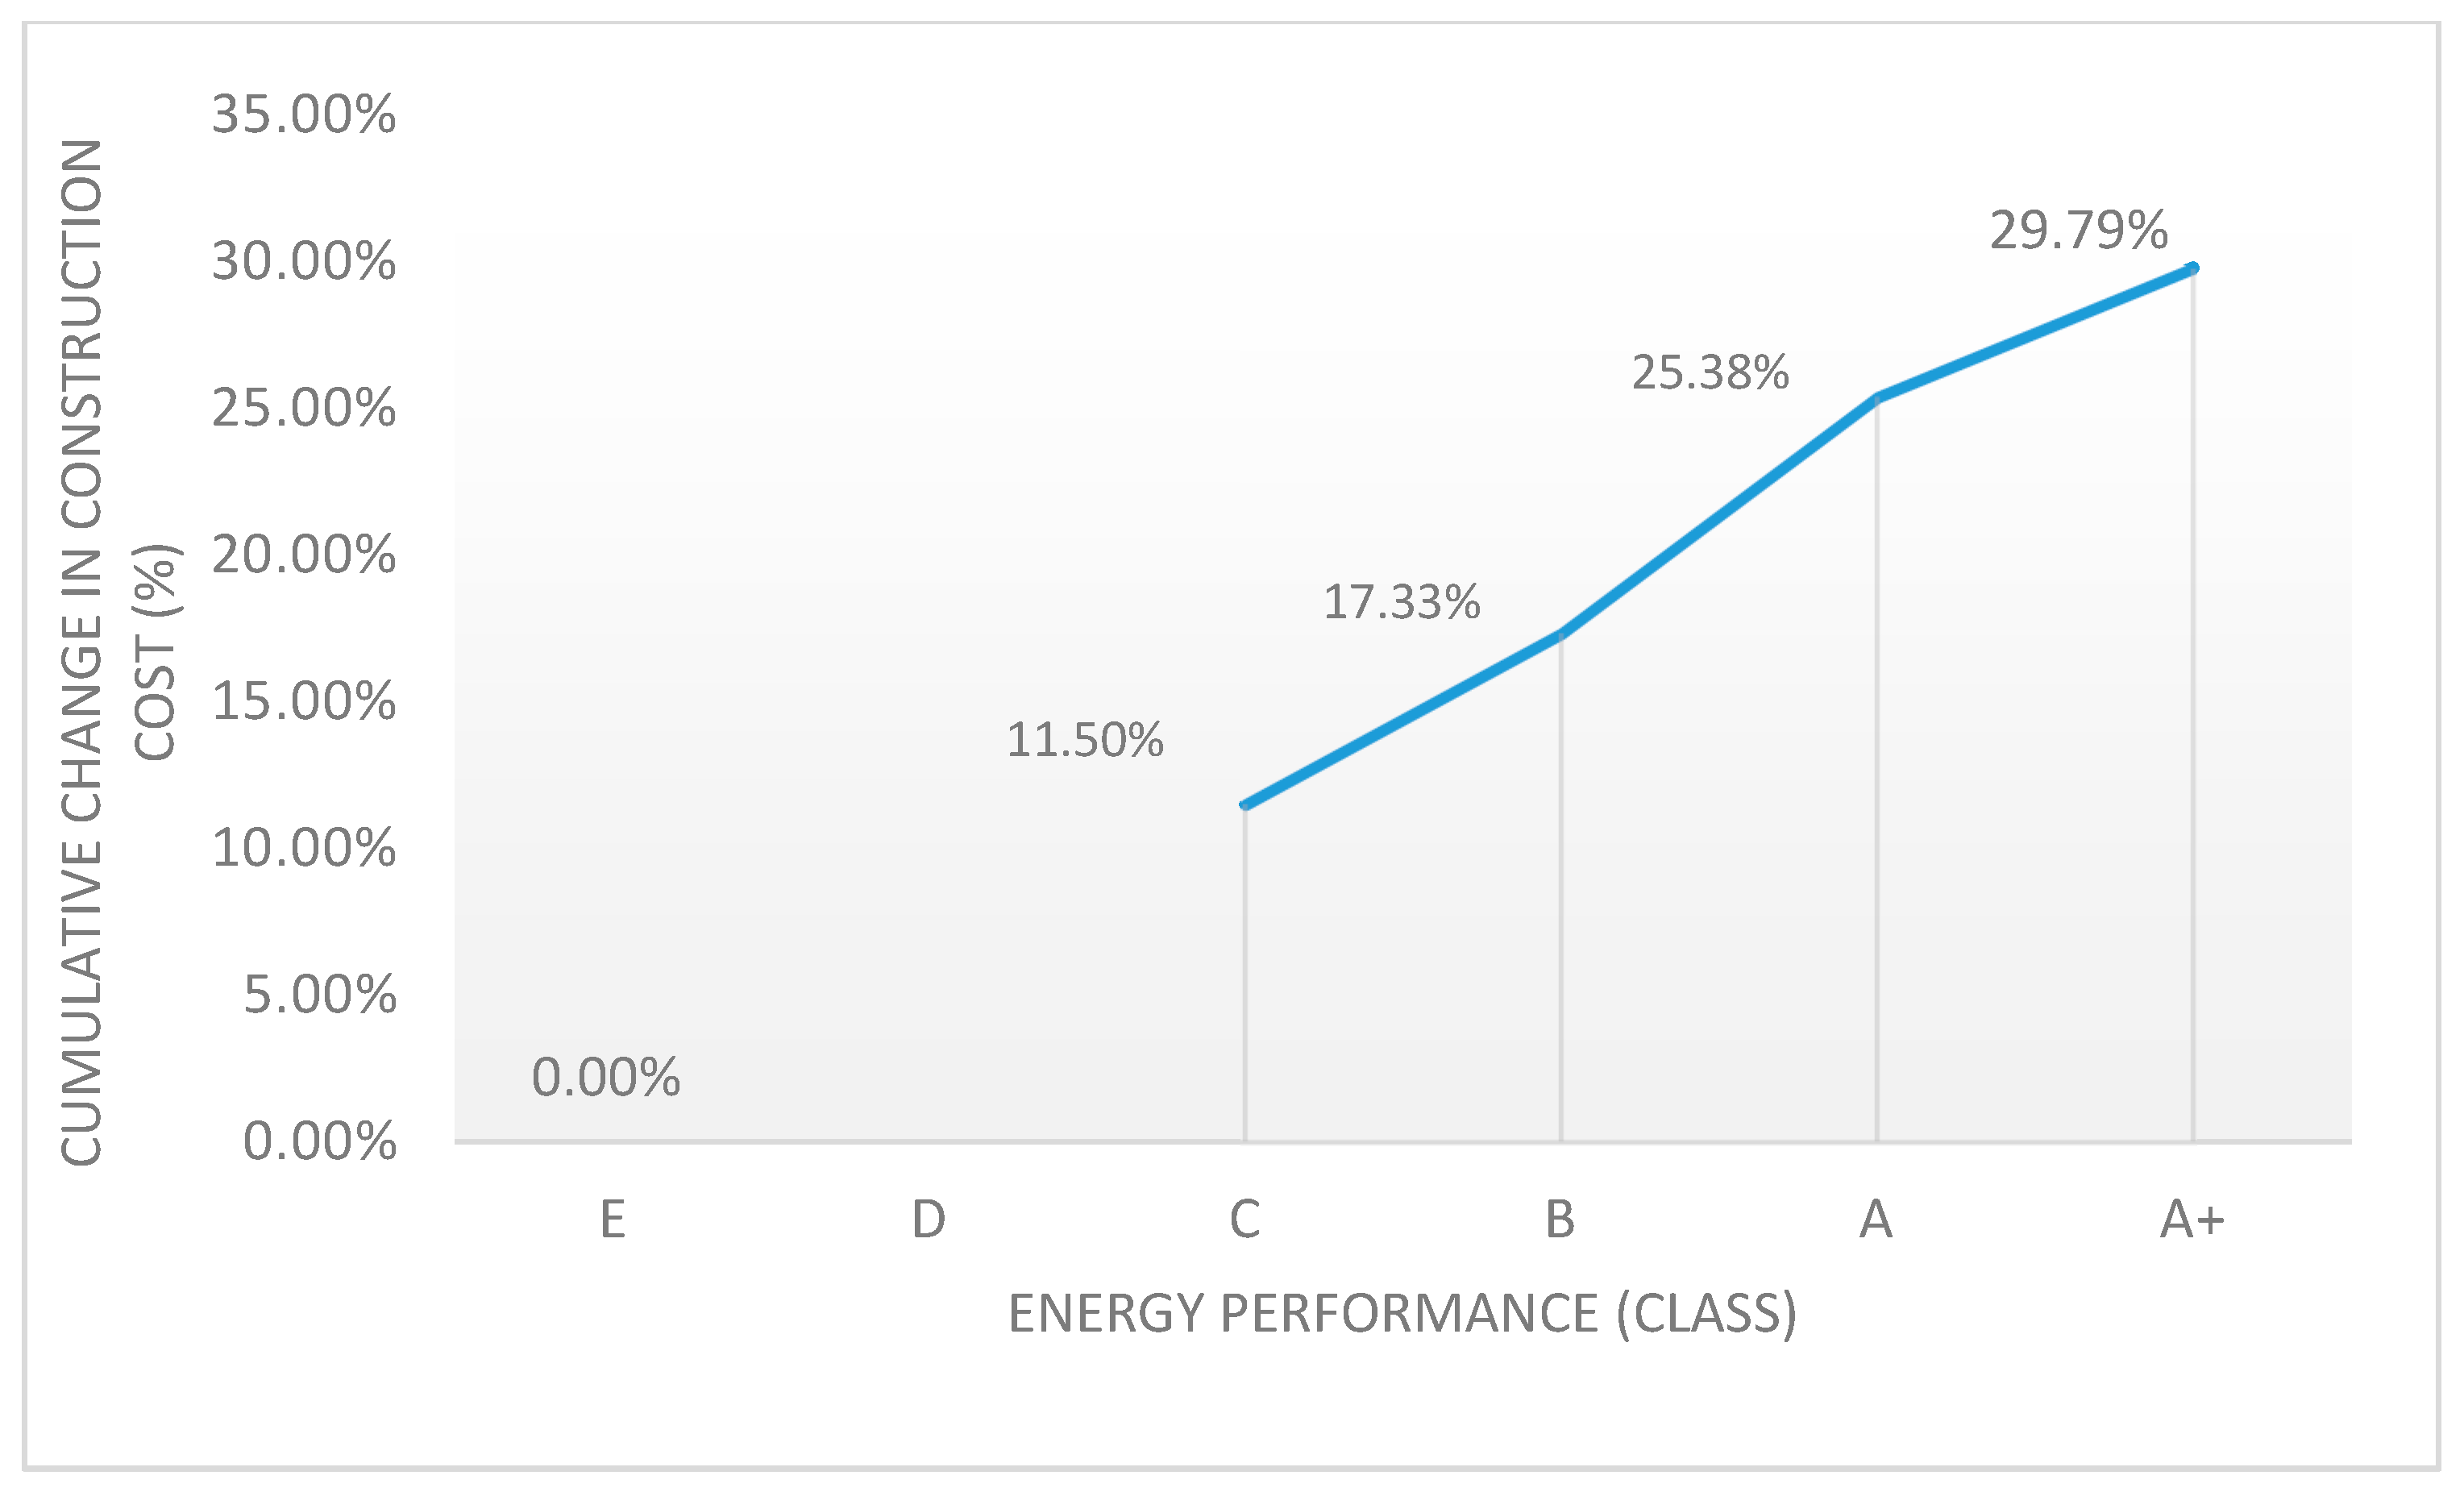
This survey shows a Unit Construction Cost (€/sq.), referred to 2012 and defined on the basis of the work necessary for the energy optimization of a new building located in a seismic risk area and climate zone D (central Italy), variable according to the energy performance of the building as reported in Table 8 (Figure 5).
Another source of information is the construction costs recorded by the Chamber of Commerce, Industry, Handicraft and Agriculture of Naples and the Building Manufacturers’ Association of the Province of Naples in 2014 (Report: “The price list for building typologies of Naples and Province”, June 2014). This report contains the summary data of bills of quantities drawn up for the construction of a new building for residential use with different construction solutions that define different final energy performances (Table 9), and bills of quantity relating to energy retrofitting work carried out on different types of public buildings (Table 10).
The collected data show a strong lack of homogeneity. In particular, the values recorded by the Ministry of Economic Development and reported by ENEA are very distant both in percentage and in absolute terms from the cases as reported in Table 8 and Table 10.
In this study, in order to operate with an adequate margin of error, the highest costs among those surveyed were taken as a reference.
In particular, the construction cost of a condominium building (in climate zone D—corresponding to that of the samples analyzed for the estimate of the increase in value) with a class G energy performance, is assumed to be now equal to about 900 €/sq. The additional costs necessary to obtain solutions with better energy performance are those shown in Table 11).
It is assumed instead that in the redevelopment of the existing residential building the cost to be incurred for the transition from class F to class B involves a unit expenditure of about €/sq. 735.00 (see Table 10).
6. Comparison between Costs and Increase in Market Value
Based on the results of the previous investigations and analysis, Table 12, Table 13 and Table 14 display the comparison between the financial advantage measured by the increase in market value of the residential unit and the cost necessary to the transition from a lower to a higher energy performance. The comparison is made for the different case studies and with reference both to the new building and to the retrofitting.
The results show that the investment of the building contractor is not convenient for energy redevelopment works on the existing building stock. The economic loss is very high in the central area of Bari and in the municipality of Acri while it is reduced in the suburbs of Bari. However, this type of analysis is limited to the transformation from class F to class B, having not disclosed information about the costs to be incurred for different energy retrofitting.
However, it is convenient to invest in the construction of new buildings with higher energy performance, especially if the energy performance of the building reaches the highest classes (B or A). The convenience in both percentage and absolute terms of the market value of the building is higher if we operate in less-qualified urban contexts, basically the places where the starting prices of the housing units are lower.
7. Conclusions
This work, through a cost-benefit analysis, measures the economic advantage of investment in energy-efficient building production or transformation with reference to the residential real estate market. Initially, the increase in value of the real estate units is measured, according to the different levels of energy performance as defined by Italian legislation. This measure was carried out in specific urban contexts in southern Italy. By using categorical regression, it is possible to represent the marginal price of the energy performance of a building with a piecewise monotonic function. The latter, in turn, allows which transformations have been rewarded by the market to be identified. Subsequently, the expenditure for energy retrofitting and, in the case of new construction, the increase in expenditure for the achievement of several levels of energy performance were recorded and estimated.
In the cases investigated, the comparison between the possible benefits and the actual investment has shown that the entrepreneur would gains no benefit from the expense of energy retrofitting while obtaining a positive balance in the construction phase of new buildings. The financial advantage grows if the investment is aimed at achieving the best energy performance and in areas where the price level of the real estate market is lower.
The negative results, related to energy retrofitting operations, seem to contrast with what is highlighted by other research [71].
It is important to point out that this study addresses the issue from the point of view of the building contractor and not from that of the owner. For the latter, the benefits of an energy retrofitting operation are not commensurate with the increase in property value. Rather, they include savings from reduced energy and water consumption, and waste production; lower maintenance operations and costs; and enhanced occupant productivity and health.
Furthermore, in Italy as in other countries there are several tax incentives to encourage owners to invest in retrofitting existing real estate assets, but these incentives, which represent additional benefits, cannot be used by investors, at least not directly.
Indirectly energy-efficient construction in Italy is incentivized through the deduction in income tax equal to 50% VAT paid at the time of purchase of the property, built or refurbished, in class B and A, if sold by a construction company.
The finding can be used as a guide for construction industry investors to make decisions about their investments in building production or transformation.
Author Contributions
Conceptualization, data curation, investigation, validation and writing—review and editing, all the authors; methodology and writing—original draft preparation, B.M.
Funding
This research received no external funding.
Conflicts of Interest
The authors declare no conflict of interest.
References
- European Commission (EC). Directive 2010/31/EU of the European Parliament and of the Council (Recast); EC: Brussels, Belgium, 2010. [Google Scholar]
- International Energy Agency (IEA). CO2 Emissions from Fuel Combustion—Highlights; International Energy Agency: Paris, France, 2013. [Google Scholar]
- Banfi, S.; Farsi, M.; Filippini, M.; Jakob, M. Willingness to pay for energy saving measures in residential buildings. Energy Econ. 2008, 30, 503–516. [Google Scholar] [CrossRef]
- Brounen, D.; Kok, N. On the economics of energy labels in the housing market. J. Environ. Econ. Manag. 2011, 62, 166–179. [Google Scholar] [CrossRef] [Green Version]
- Cajias, M.; Piazolo, D. Green performs better: Energy efficiency and financial return on buildings. J. Corp. Real Estate 2013, 15, 53–72. [Google Scholar] [CrossRef]
- Cerin, P.; Hassel, L.; Semenova, N. Energy Performance and Housing Prices. Sustain. Dev. 2014, 22, 404–419. [Google Scholar] [CrossRef]
- Department of Energy and Climate Change. An Investigation of the Effect of EPC Ratings on House Prices; Department of Energy and Climate Change: London, UK, 2013. [Google Scholar]
- European Commission (EC). Energy Performance Certificates in buildings and Their Impact on Transaction Prices and Rents in Selected EU Countries; EC: Brussels, Belgium, 2013. [Google Scholar]
- Hyland, M.; Lyons, R.C.; Lyons, S. The value of domestic building energy efficiency—Evidence from Ireland. Energy Econ. 2013, 40, 943–952. [Google Scholar] [CrossRef]
- Popescu, D.; Bienert, S.; Schützenhofer, C.; Boazu, R. Impact of energy efficiency measures on the economic value of buildings. Appl. Energy 2012, 89, 454–463. [Google Scholar] [CrossRef]
- Amecke, H. The impact of energy performance certificates: A survey of German homeowners. Energy Policy 2012, 46, 4–14. [Google Scholar] [CrossRef]
- Murphy, L. The Influence of the Energy Performance Certificate: The Dutch Case. Energy Policy 2014, 67, 664–672. [Google Scholar] [CrossRef]
- Allcot, H.; Greenstone, M. Is there an Energy Efficiency Gap? J. Econ. Perspect. 2012, 26, 3–28. [Google Scholar] [CrossRef]
- European Commission (EC). Financial Support for Energy Efficiency in Buildings; EC: Brussels, Belgium, 2013. [Google Scholar]
- Gillingham, K.; Newell, R.; Palmer, K. Energy Efficiency Economics and Policy. Annu. Rev. Resour. Econ. 2009, 1, 597–620. [Google Scholar] [CrossRef] [Green Version]
- Gillingham, K.; Harding, M.; Rapson, D. Split Incentives in Residential Energy Consumption. Energy J. 2012, 33, 37–62. [Google Scholar] [CrossRef]
- Chegut, A.; Eichholtz, P.; Kok, N. The value of green buildings: New evidence from the United Kingdom. In Proceedings of the International AREUEA Meeting, Rotterdam, The Netherlands, 17–19 June 2010. [Google Scholar]
- Eichholtz, P.; Kok, N.; Quigley, J.M. Doing Well by Doing Good: Green Office Buildings. Am. Econ. Rev. 2010, 100, 2494–2511. [Google Scholar] [CrossRef]
- Fuerst, F.; McAllister, P. Green Noise or Green Value? Measuring the Effects of Environmental Certification on Office Values. Real Estate Econ. 2011, 39, 45–69. [Google Scholar] [CrossRef]
- Miller, E.; Buys, L. Retrofitting commercial office buildings for sustainability: Tenants’ perspectives. J. Prop. Investig. Financ. 2008, 26, 552–561. [Google Scholar] [CrossRef]
- Pivo, G.; Fisher, J. Income, Value and Returns on Socially Responsible Office Properties. J. Real Estate Res. 2010, 32, 243–269. [Google Scholar]
- Deng, Y.; Li, Z.; Quigley, J.M. Economic Returns to Energy-Efficiency Investments in the Housing Market: Evidence from Singapore. Reg. Sci. Urban Econ. 2011, 42, 506–515. [Google Scholar] [CrossRef]
- Högberg, L. The impact of energy performance on single-family home selling prices in Sweden. J. Eur. Real Estate Res. 2013, 6, 242–261. [Google Scholar] [CrossRef]
- Kahn, M.E.; Kok, N. The Value of Green Labels in the Californian Housing Market; Working Paper; U.S. Green Building Council: Washington, DC, USA, 2012. [Google Scholar]
- Jensen, O.M.; Hansen, A.R.; Kragh, J. Market response to the public display of energy performance rating at property sales. Energy Policy 2016, 93, 229–235. [Google Scholar] [CrossRef]
- Fuerst, F.; McAllister, P. The impact of Energy Performance Certificates on the rental and capital values of commercial property assets. Energy Policy 2011, 39, 6608–6614. [Google Scholar] [CrossRef]
- Fuerst, F.; McAllister, P.; Nanda, A.; Wyatt, P. Energy performance ratings and house prices in Wales: An empirical study. Energy Policy 2016, 92, 20–33. [Google Scholar] [CrossRef]
- Walls, M.; Palmer, K.; Gerarden, T. Is Energy Efficiency Capitalized into Home Prices? Evidence from Three US Cities; Resources for the Future Discussion Paper; Resources for the Future: Washington, DC, USA, 2013. [Google Scholar]
- Yoshida, J.; Sugiura, A. Which ‘Greenness’ is Valued? Evidence from Green Condominiums in Tokyo; Munich Personal RePEc Archive: Munich, Germany, 2010. [Google Scholar]
- Fuerst, F.; McAllister, P. New evidence on the green building rent and price premium. In Proceedings of the Annual Meeting of the American Real Estate Society, Monterey, CA, USA, 1–4 April 2009. [Google Scholar]
- Eichholtz, P.; Kok, N.; Quigley, J.M. Why Do Companies Rent Green? Real Property and Corporate Social Responsibility; Berkeley Program on Housing and Urban Policy Working Paper W09-004; University of California: Berkeley, CA, USA, 2009. [Google Scholar]
- Zalejska-Jonsson, A.; Lind, H.; Hintze, S. Low-energy versus conventional residential buildings: Cost and profit. J. Eur. Real Estate Res. 2012, 5, 211–228. [Google Scholar] [CrossRef]
- Mudgal, S.; Lyons, L.; Cohen, F.; Lyons, R.; Fedrigo-Fazio, D. Energy Performance Certificates in Buildings and Their Impact on Transaction Prices and Rents in Selected EU Countries. Available online: https://ec.europa.eu/energy/sites/ener/files/documents/20130619-energy_performance_certificates_in_buildings.pdf (accessed on 1 October 2018).
- Bloom, B.; Nobe, M.C.; Nobe, M.D. Valuing green home designs: A study of Energy Star homes. J. Sustain. Real Estate 2011, 3, 109–126. [Google Scholar]
- Wiley, J.A.; Benefield, J.D.; Johnson, K.H. Green design and the market for commercial office space. J. Real Estate Finance Econ. 2010, 41, 228–243. [Google Scholar] [CrossRef]
- Fuerst, F.; McAllister, P. An investigation of the effect of eco-labeling on office occupancy rates. J. Sustain. Real Estate 2009, 1, 49–64. [Google Scholar]
- Forestiero, G.; De Ruggiero, M.; Manganelli, B.; Salvo, F. Buildings energy performance in a market comparison approach. Buildings 2017, 7, 16. [Google Scholar]
- Malerba, A.; Massimo, D.E.; Musolino, M.; Nicoletti, F.; De Paola, P. Post Carbon City: Building valuation and Energy Performance Simulation Programs. Smart Innov. Syst. Technol. 2019, 101, 513–521. [Google Scholar] [CrossRef]
- Dermisi, S.V. Effect of LEED ratings and levels on office property assessed and market values. J. Sustain. Real Estate 2009, 1, 23–47. [Google Scholar]
- Kok, N.; Jennen, M. The impact of energy labels and accessibility on office rents. Energy Policy 2012, 46, 489–497. [Google Scholar] [CrossRef]
- Newell, G.; MacFarlane, J.; Walker, R. Assessing energy rating premiums in the performance of green office buildings in Australia. J. Prop. Invest. Finance 2014, 32, 352–370. [Google Scholar] [CrossRef]
- Fregonara, E.; Rolando, D.; Semeraro, P. Energy performance certificates in the Turin real estate market. J. Eur. Real Estate Res. 2017, 10, 149–169. [Google Scholar] [CrossRef]
- Robinson, S.J.; Sanderford, A.R. Green Buildings: Similar to Other Premium Buildings? J. Real Estate Financ. Econ. 2016, 52, 99–116. [Google Scholar] [CrossRef]
- Das, P.; Wiley, J.A. Determinants of Premia for Energy-Efficient Design in the Office Market. J. Prop. Res. 2014, 31, 64–86. [Google Scholar] [CrossRef]
- Robinson, S.; McAllister, P. Heterogeneous Price Premiums in Sustainable Real Estate? An Investigation of the Relation between Value and Price Premiums. J. Sustain. Real Estate 2015, 7, 1–20. [Google Scholar]
- Adan, H.; Fuerst, F. Modelling energy retrofit investments in the UK housing market: A microeconomic approach. Smart Sustain. Built Environ. 2015, 4, 251–267. [Google Scholar] [CrossRef]
- Schrödera, C.; Yitzhakib, S. Revisiting the evidence for cardinal treatment of ordinal variables. Eur. Econ. Rev. 2017, 92, 337–358. [Google Scholar] [CrossRef] [Green Version]
- Likert, R. A Technique for the Measurement of Attitudes. Arch. Psychol. 1932, 140, 1–55. [Google Scholar]
- Cronan, T.P.; Epley, D.R.; Perry, L.G. The Use of Rank Transformation and Multiple Regression Analysis In Estimating Residential Property Values With A Small Sample. J. Real Estate Res. 1986, 1, 19–31. [Google Scholar]
- Nishisato, S. On the Scaling of Ordinal Measurement: A Dual-Scaling Perspective. In Contemporary Psychometrics; Maydeu-Olivares, A., McArdle, J.J., Eds.; Lawrence Erlbaum Associates: Mahwah, NJ, USA, 2005; pp. 479–507. [Google Scholar]
- Kruskal, J.B. Analysis of Factorial Experiments by Estimating Monotone Transformations of the data. J. R. Stat. Soc. 1965, 27, 251–263. [Google Scholar] [CrossRef]
- Wright, B.D.; Masters, G.N. Rating Scale Analysis. Rasch Measurement; Mesa Press.: Chicago, IL, USA, 1982. [Google Scholar]
- Zanella, A. Introduzione alla Misurazione della Customer Satisfaction. In Valutazione Della Qualità e Customer Satisfaction: Il Ruolo Della Statistica—Aspetti Oggettivi e Soggettivi della Qualità; Vita e Pensiero: Milano, Italy, 1999; pp. 217–231. [Google Scholar]
- Guttman, L. The quantification of a class of attributes: A theory and method of scale construction. In The Prediction of Personal Adjustment; Horst, P., Ed.; Social Science Research: Council, NY, USA, 1941; pp. 319–348. [Google Scholar]
- Fisher, R.A. Statistical Methods for Research Workers; Oliver and Boynd: London, UK, 1946. [Google Scholar]
- Hayashi, C. On the prediction of phenomena from qualitative data and the quantification of qualitative data from the mathematico-statistical point of view. Ann. Inst. Stat. Math. 1952, 3, 69–98. [Google Scholar] [CrossRef]
- Gifi, A. Nonlinear Multivariate Analysis; Wiley: Chichester, UK, 1990. [Google Scholar]
- De Leeuw, J.; Van Ruckevorsel, J. HOMALS and PRINCALS Some Generalizations of Principal Component Analysis. In Data Analysis and Informatics; Diday, E., Ed.; North-Holland: Amsterdam, The Netherlands, 1980. [Google Scholar]
- Young, F.W.; De Leeuw, J.; Takane, Y. Regression with qualitative and quantitative variables: An alternating least squares method with optimal scaling features. Psychometrika 1976, 41, 505–529. [Google Scholar] [CrossRef]
- Winsberg, S.; Ramsay, J. Monotonic transformations to additivity using splines. Biometrica 1980, 67, 669–674. [Google Scholar] [CrossRef]
- Ramsay, J. Monotone regression splines in action. Statist. Sci. 1988, 4, 425–441. [Google Scholar] [CrossRef]
- Del Giudice, V.; Manganelli, B.; De Paola, P. Spline smoothing for estimating hedonic housing price models, in Lecture Notes in Computer Science. In Proceedings of the 15th International Conference on Computational Science and its Applications, ICCSA 2015, Banff, AL, Canada, 22–25 June 2015; Volume 9157, pp. 210–219. [Google Scholar]
- Friedman, J.; Stuetzle, W. Projection pursuit regression. J. Am. Stat. Assoc. 1981, 76, 817–823. [Google Scholar] [CrossRef]
- Breiman, L.; Friedman, J.H. Estimating optimal transformation for multiple regression and correlation (with discussion). J. Am. Stat. Assoc. 1985, 80, 580–619. [Google Scholar] [CrossRef]
- Hastie, T.J.; Tibshirani, R.J. Generalized Additive Models; Chapman and Hall/CRC: Boca Raton, FL, USA, 1990. [Google Scholar]
- Van der Kooij, A.J.; Meulman, J.J. MURALS: Multiple regression and optimal scaling using alternating least squares”. In Softstat 1997; Faulbaum, E., Bandilla, W., Eds.; Lucius & Lucius: Stuttgart, Germany, 1997; pp. 99–106. [Google Scholar]
- Van der Kooij, A.J.; Meulman, J.J. Regression with optimal scaling. In SPPS Categories 10.0; Meulman, J.J., Heiser, W.J., Eds.; SPSS Inc.: Chicago, IL, USA, 1999; pp. 1–8, 77–101. [Google Scholar]
- Dwaikat, L.N.; Ali, K.N. Green Buildings Cost Premium: A Review of Empirical Evidence. Energy Build. 2016, 110, 396–403. [Google Scholar] [CrossRef]
- Kim, J.L.; Greene, M.; Kim, S. Cost comparative analysis of a new green building code for residential project development. J. Constr. Eng. Manag. 2014, 140, 05014002. [Google Scholar] [CrossRef]
- La Casa Attiva—Società di Ingegneria. Indagine Costo Costruzione Edilizia Sostenibile, 2017. Available online: http://www.lacasaattiva.it/sites/default/files/files/Indagine%20costi%20costruzione%20edilizia%20sostenibile.pdf (accessed on 31 September 2017).
- Kats, G.; Capital, E. Green Building Costs and Financial Benefits; Massachusetts Technology Collaborative: Boston, MA, USA, 2003. [Google Scholar]
Figure 1.
Marginal price of energy performance of building for Sample 1 (Bari—central area).

Figure 2.
Marginal price of energy performance of building for Sample 2 (Bari—suburban area).

Figure 3.
Marginal price of energy performance of building for Sample 3 (Acr—Calabria).

Figure 4.
Additional unit costs (per sq.) to build a nearly zero energy building (NZEB) (source: National Agency for New Technologies, Energy and Sustainable Economic Development (ENEA)).
Figure 4.
Additional unit costs (per sq.) to build a nearly zero energy building (NZEB) (source: National Agency for New Technologies, Energy and Sustainable Economic Development (ENEA)).

Figure 5.
Variation of construction costs for different energy performance of buildings (source: La Casa Attiva—Società di Ingegneria).
Figure 5.
Variation of construction costs for different energy performance of buildings (source: La Casa Attiva—Società di Ingegneria).


Table 1.
Descriptive statistics of Sample 1 (Bari—central area).
| Min | Max | Average | Median | Std. Error | Std. Deviation | |
|---|---|---|---|---|---|---|
| Price (€) | 19,000 | 690,000 | 228,475.25 | 225,000 | 13,743.21 | 138,117.5292 |
| Surface (square meters) | 18 | 235 | 100.92 | 99 | 4.49908 | 45.21519 |
| Bathroom (number) | 1 | 2 | 1.7624 | 2 | 0.04256 | 0.42775 |
| Level_Floor (level) | 1 | 12 | 3.9208 | 3 | 0.22937 | 2.30514 |
| Elevator (1–2) | 1 | 2 | 1.7129 | 1 | 0.04524 | 0.45468 |
| Maintenance (score) | 1 | 3 | 2.1683 | 2 | 0.07587 | 0.76249 |
| Energy performance (score) | 1 | 7 | 2.8416 | 2 | 0.19887 | 1.99866 |
| Age (number) | 1 | 117 | 49.703 | 51 | 2.59209 | 26.05016 |
Table 2.
Descriptive statistics of Sample 2 (Bari—suburban area).
| Min | Max | Average | Median | Std. Error | Std. Deviation | |
|---|---|---|---|---|---|---|
| Price (€) | 25,000 | 250,000 | 128,906.98 | 135,000.00 | 10,256.88 | 67,258.85 |
| Surface (square meters) | 20 | 120 | 70.8605 | 70 | 3.69888 | 24.25517 |
| Level_Floor (level) | 1 | 9 | 2.5814 | 2 | 0.27689 | 1.81571 |
| Maintenance (score) | 1 | 3 | 2.3023 | 3 | 0.12687 | 0.83195 |
| Energy performance (score) | 1 | 8 | 3.5581 | 4 | 0.37547 | 2.46212 |
Table 3.
Descriptive statistics of Sample 3 (Acri—Calabria).
| Min | Max | Average | Median | Std. Error | Std. Deviation | |
|---|---|---|---|---|---|---|
| Price (€) | 60,900 | 198,000 | 115,992.641 | 109,140 | 5685.49788 | 35,505.9229 |
| Surface (square meters) | 89 | 146.7 | 113.9762 | 108 | 2.39303 | 14.9445 |
| Views (number) | 1 | 3 | 2.0769 | 2 | 0.10637 | 0.6643 |
| Car parking (1–3) | 1 | 3 | 1.9231 | 2 | 0.12928 | 0.80735 |
| Orientation (score) | 1 | 5 | 2.5641 | 3 | 0.21037 | 1.31379 |
| Energy performance (score) | 1 | 7 | 3.0256 | 3 | 0.2636 | 1.64616 |
Table 4.
Results of categorical regression on Sample 1 (Bari—central area).
| Multiple R | R Square | Adjusted R Square | |||
|---|---|---|---|---|---|
| 0.924 | 0.854 | 0.834 | |||
| Standardized Coefficients | df | F | Sig. | ||
| Beta | Std. Error | ||||
| Surface | 0.803 | 0.076 | 1 | 112.558 | 0.000 |
| Bath | 0.038 | 0.054 | 1 | 0.490 | 0.486 |
| Level_Floor | 0.046 | 0.089 | 3 | 0.261 | 0.854 |
| Elevator | 0.039 | 0.061 | 1 | 0.400 | 0.528 |
| Maintenance | 0.196 | 0.061 | 3 | 10.397 | 0.000 |
| Energy performance | 0.132 | 0.104 | 2 | 1.611 | 0.206 |
| Age | −0.069 | 0.124 | 1 | 0.307 | 0.581 |
Table 5.
Results of categorical regression on Sample 2 (Bari—suburban area).
| Multiple R | R Square | Adjusted R Square | |||
|---|---|---|---|---|---|
| 0.921 | 0.848 | 0.807 | |||
| Standardized Coefficients | df | F | Sig. | ||
| Beta | Std. Error | ||||
| Surface | 0.362 | 0.108 | 1 | 11.139 | 0.002 |
| Level_Floor | 0.221 | 0.146 | 2 | 2.288 | 0.117 |
| Maintenance | 0.389 | 0.178 | 3 | 4.760 | 0.007 |
| Energy performance | 0.300 | 0.201 | 3 | 2.232 | 0.103 |
Table 6.
Results of categorical regression on Sample 3 (Acri—alabria).
| Multiple R | R Square | Adjusted R Square | |||
|---|---|---|---|---|---|
| 0.703 | 0.494 | 0.400 | |||
| Standardized Coefficients | df | F | Sig. | ||
| Beta | Std. Error | ||||
| Surface | 0.068 | 0.218 | 1 | 0.095 | 0.759 |
| Views | 0.263 | 0.243 | 1 | 1.169 | 0.288 |
| Car parking | 0.030 | 0.258 | 1 | 0.013 | 0.909 |
| Orientation | 0.431 | 0.281 | 1 | 2.362 | 0.134 |
| Energy performance | 0.453 | 0.313 | 2 | 2.090 | 0.140 |
Table 7.
Results of categorical regression on Sample 2 (Bari—Suburban area).
| Type | Single Family Building | Condominium Building | Office Building |
|---|---|---|---|
| Shell | 4.2% | 4.6% | 5.3% |
| Installations | 50.2% | 27.4% | 28.1% |
| Total | 22.0% | 14.6% | 14.0% |
Table 8.
Construction costs for different energy performance of buildings (source: La Casa Attiva—Società di Ingegneria).
Table 8.
Construction costs for different energy performance of buildings (source: La Casa Attiva—Società di Ingegneria).
| Energetic Performance | E | C | B | A | A+ |
|---|---|---|---|---|---|
| Insulated roofing slab | No | Yes * | Yes * | Yes * | Yes * |
| Insulated inter-floor slab | No | Yes * | Yes * | Yes * | Yes * |
| Insulated tread floor | No | Yes * | Yes * | Yes * | Yes * |
| Corrected thermal bridges | No | Yes * | Yes * | Yes * | Yes * |
| Solar thermal system ** | No | No | No | Yes | Yes |
| Unit cost (€/sq.) | 800 | 892 | 944 | 1020 | 1065 |
| % Variation | 0 | 11.5% | 5.8% | 8.1% | 4.4% |
| Cumulative% change | 0 | 11.5% | 17.3% | 25.4% | 29.8% |
* The thickness of the insulation varies; ** In addition to heating and domestic hot water.
Table 9.
Construction cost of a new building for residential use with different final energy performances (source: Chamber of Commerce, Industry, Handicraft and Agriculture of Naples).
Table 9.
Construction cost of a new building for residential use with different final energy performances (source: Chamber of Commerce, Industry, Handicraft and Agriculture of Naples).
| Type | Climate Zone | Use | Covered Surface (sq.) | Number of Floors | Unit Cost for Constructive Solution | |
|---|---|---|---|---|---|---|
| Energy Performance | ||||||
| C | A | |||||
| new building | C | residential | 510 | 5ag. + 1bt. | 1081 €/sq. | 1487 €/sq. |
| variation | 406 €/sq. | |||||
| % | 38% | |||||
Table 10.
Expenditure for energy retrofitting of buildings with different uses (source: Chamber of Commerce, Industry, Handicraft and Agriculture of Naples).
Table 10.
Expenditure for energy retrofitting of buildings with different uses (source: Chamber of Commerce, Industry, Handicraft and Agriculture of Naples).
| Cases | ||||
|---|---|---|---|---|
| Use | Barrack | Office | School | |
| Climate zone | D | D | D | Average |
| Covered area (sq.) | 345.00 | 205.00 | 270.00 | |
| Number of floors | 2.00 | 3.00 | 2.00 | |
| Level of energy performance | from E to B | from F to B | from F to B | |
| % Work cost for functional elements | ||||
| Thermal insulation of the roof | 16.01% | 6.99% | 11.07% | |
| Thermal insulation external walls | 36.01% | 47.04% | 37.28% | |
| High-performance fixtures | 11.95% | 16.27% | 10.53% | |
| Subtotal (shell) | 63.97% | 70.30% | 58.88% | 64.38% |
| High-efficiency boiler replacement | 6.19% | 4.68% | 4.53% | |
| Distribution system | 11.27% | 4.55% | 8.98% | |
| Heating/cooling system | 7.50% | 11.81% | 7.56% | |
| Interior lighting | 5.65% | 3.43% | 1.52% | |
| Outdoor lighting | 1.88% | 2.77% | 1.04% | |
| Solar collector installation | 3.54% | 2.46% | 2.38% | |
| Home automation/remote control | - | - | 15.12% | |
| Subtotal (installations) | 36.03% | 29.70% | 41.13% | 35.62% |
| Total | 100.00% | 100.00% | 100.00% | |
| Unit cost €/sq. | 522.00 € | 753.00 € | 932.00 € | 735.67 € |
Table 11.
Construction costs for different energy performance of buildings.
| Energy Performance | Additional Cost | Unit Cost | |
|---|---|---|---|
| % | €/sq. | €/sq. | |
| G | 900.00 | ||
| E | 7.5% | 67.50 | 967.50 |
| C | 11.5% | 111.26 | 1078.76 |
| A | 38.0% | 409.93 | 1488.69 |
| A+ | 4.5% | 66.99 | 1555.68 |
Table 12.
Cost-benefit analysis (case 1—central area of Bari).
| New Building | |||||
|---|---|---|---|---|---|
| Energy Performance | Variation (€/sq.) | ∆V − ∆C | |||
| From | To | Cost (∆C) | Market Value (∆V) | €/sq. | % On Value |
| G | E | 67.50 | 130.30 | 62.80 | 2.96% |
| G | C | 178.76 | 130.30 | −48.46 | −2.29% |
| G | A | 588.69 | 623.10 | 34.41 | 1.62% |
| Retrofitting | |||||
| F | B | 735.00 | 99.79 | −635.21 | −29% |
Table 13.
Cost-benefit analysis (case 2—suburban area of Bari).
| New Building | |||||
|---|---|---|---|---|---|
| Energy Performance | Variation (€/sq.) | ∆V − ∆C | |||
| From | To | Cost (∆C) | Market Value (∆V) | €/sq. | % On Value |
| G | E | 67.50 | 44.94 | −22.56 | −1.41% |
| G | C | 178.76 | 264.83 | 86.07 | 5.36% |
| G | A | 588.69 | 661.27 | 72.58 | 4.52% |
| G | A+ | 655.68 | 730.28 | 74.60 | 4.65% |
| Retrofitting | |||||
| F | B | 735.00 | 463.85 | −271.15 | −17% |
Table 14.
Cost-benefit analysis (case 3—Acri Calabria).
| New Building | |||||
|---|---|---|---|---|---|
| Energy Performance | Variation (€/sq.) | ∆V − ∆C | |||
| From | To | Cost (∆C) | Market value (∆V) | €/sq. | % On Value |
| G | E | 67.50 | 178.83 | 111.33 | 13.24% |
| G | C | 178.76 | 178.83 | 0.07 | 0.01% |
| G | A | 588.69 | 706.58 | 117.89 | 14.01% |
| Retrofitting | |||||
| F | B | 735.00 | 112.88 | −622.12 | −63% |
© 2019 by the authors. Licensee MDPI, Basel, Switzerland. This article is an open access article distributed under the terms and conditions of the Creative Commons Attribution (CC BY) license (http://creativecommons.org/licenses/by/4.0/).
Share and Cite
MDPI and ACS Style
Manganelli, B.; Morano, P.; Tajani, F.; Salvo, F. Affordability Assessment of Energy-Efficient Building Construction in Italy. Sustainability 2019, 11, 249. https://doi.org/10.3390/su11010249
AMA Style
Manganelli B, Morano P, Tajani F, Salvo F. Affordability Assessment of Energy-Efficient Building Construction in Italy. Sustainability. 2019; 11(1):249. https://doi.org/10.3390/su11010249
Chicago/Turabian StyleManganelli, Benedetto, Pierluigi Morano, Francesco Tajani, and Francesca Salvo. 2019. "Affordability Assessment of Energy-Efficient Building Construction in Italy" Sustainability 11, no. 1: 249. https://doi.org/10.3390/su11010249
Note that from the first issue of 2016, this journal uses article numbers instead of page numbers. See further details here.