Indoor Air Quality and Sustainability Management—Case Study in Three Portuguese Healthcare Units
by
 , , , , and
Ana Fonseca
* ,
,
Isabel Abreu
 ,
,
Maria João Guerreiro
 ,
,
Cristina Abreu
,
Ricardo Silva
and
Nelson Barros

UFP Energy, Environment and Health Research Unit (FP-ENAS), University Fernando Pessoa, 4249-004 Porto, Portugal
*
Author to whom correspondence should be addressed.
Sustainability 2019, 11(1), 101; https://doi.org/10.3390/su11010101
Submission received: 26 October 2018
/
Revised: 17 December 2018
/
Accepted: 18 December 2018
/
Published: 25 December 2018
(This article belongs to the Special Issue Sustainability in Healthcare Facilities)
Abstract
:Adequate management of indoor air quality (IAQ) in healthcare units has relevant impacts on sustainability performance due to its effects on patient safety, occupational health and safety, and energy consumptions. This study sought to identify improvement opportunities on IAQ management by collecting and analyzing experimental data of selected parameters in three healthcare units in Portugal: Two general hospitals and one primary healthcare center. Indoor air temperature, relative humidity, CO2, bacteria, and fungi concentrations were measured in summer and winter campaigns in June/July 2017 and in January/March 2018. Results show that the exclusive use of natural ventilation is not adequate when the affluence of users is high, but the analyzed parameters revealed acceptable results under low occupation intensity conditions. Results also show that keeping low indoor air relative humidity has a significant impact in reducing fungi concentration and that there is a significant correlation at the 0.05 level between indoor air CO2 concentration and bacterial loads. Therefore, as opportunities to improve sustainability, IAQ management in healthcare facilities should consider natural ventilation as a complement to mechanical ventilation systems and should focus on adequate control of indoor air relative humidity and CO2 concentration to reduce the risk of airborne infections.
1. Introduction
Sustainable healthcare systems need to balance economic, social, and ecological interests, in a comprehensive approach and with a long-term focus [1]. Healthcare sustainability management faces the challenge of providing high quality healthcare services with limited financial resources, attending the needs and expectations of patients and healthcare professionals, and minimizing negative environmental impacts [1,2]. Europe uses about 10% of the Gross Domestic Product in construction and operation of healthcare buildings [3], and the shift of the healthcare market from volume-based to value-based demonstrates the importance of adequate sustainability management in healthcare organizations [4]. Sustainability management programs, with their corresponding control systems, are nowadays common practice in many healthcare facilities, with recognized positive effects on performance [2,4]. The comparison of different healthcare organizations practices is a relevant benchmarking tool to search for improvement opportunities regarding the environmental and societal quality of the service provided while enhancing adequate economic and financial performances [2,3].
It is widely recognized that healthcare facilities are major energy consumers [3,4,5,6,7] and, according to Carnero [2], European hospitals are responsible for 5% of the CO2 emissions of the European Union. In a benchmarking study with 55 Portuguese hospitals, Castro et al. [3] reported that energy consumption represents over 70% of the costs with utilities and waste management. The adoption of natural ventilation systems for indoor environmental quality management is one among many options to reduce energy consumption in healthcare facilities, contributing to their economic and environmental sustainability [2,6,8].
Indoor air quality (IAQ) is of great relevance for sustainability management in healthcare organizations, given its recognized influence on patient safety, occupational health, and productivity of healthcare professionals [6,9,10,11]. Indoor air contamination may be caused by several factors, namely: Outdoor pollutants, building materials, furnishing, and human activities [12,13,14,15,16]. The main health problems related to poor IAQ are headaches, dizziness, nausea, fatigue, eye, throat and skin irritations [10,12,14,15,16,17,18]. In healthcare facilities, a major concern for IAQ management is the aerial dissemination of microbiological pathogens in the clinical environment, causing nosocomial infections, particularly dangerous to immunocompromised patients [16,17,19,20,21,22]. Furthermore, the exposure to bacteria and fungi in indoor air is positively associated with work-related respiratory disease symptoms in hospital employees [23].
Ventilation systems play an important role in IAQ management, as they are used to provide thermal comfort by controlling temperature and humidity in indoor environments, and by diluting indoor air pollutants with outdoor air (if of good quality), lowering their concentration to minimize negative health impacts. The indoor CO2 concentration is an indicator of the level of ventilation with outdoor air, and is frequently used to characterize indoor air quality [12,13,24,25]. Inadequate ventilation is one of the causes of poor indoor air quality, with negative consequences for the health and wellbeing of the occupants [26,27]. Ventilation systems may use mechanical or natural forces to promote indoor airflow. Natural ventilation systems have zero energy costs but are difficult to predict and control [8,28]. In a research study involving mechanical and naturally ventilated buildings in Austria between 2010 and 2012, Wallner et al. [25] conclude that indoor air quality is significantly better in mechanically ventilated homes than in those using exclusively natural ventilation. On the other hand, Jurado et al. [12] report that the CO2 concentration levels in university classrooms in Brazil were significantly higher in rooms ventilated through air-conditioning when compared with naturally-ventilated classrooms. However, there is no evidence that these air-conditioning systems received fresh-air from the exterior.
The use of natural ventilation for IAQ management in healthcare facilities has been widely investigated: In 2007 the World Health Organization published a guideline document on infection prevention in healthcare and acknowledged the effectiveness of natural ventilation for infection control in healthcare facilities [29]; Escombe et al. [30] conducted a research study in eight hospitals in Peru, and their results show that natural ventilation reduces airborne infection transmission risks; Qian et al. [8] report field measurements in naturally ventilated hospital wards in Hong Kong showing that natural ventilation can achieve adequate ventilation rates for infection control; Gilkeson et al. [27] conducted experiments with a tracer gas in hospital wards in the UK, and concluded that natural ventilation is effective for controlling airborne infection risks. However, natural ventilation systems in healthcare facilities are not effective if the appropriate ventilation rates cannot be achieved, either due to window and door closing due to unfavorable outdoor meteorological conditions or to uncontrolled flow patterns [27,28]. One important factor to be considered in natural ventilation systems is outdoor air quality. Several studies report higher fungal concentration in naturally ventilated rooms, associated with outdoor fungal infiltration [12,25,31]. The influence of outdoor air in indoor fungal levels has been proven by several studies regarding IAQ in hospitals [17,24,31].
The aim of this study was to identify improvement opportunities in IAQ management in healthcare facilities through the measurement of indoor air parameters relevant for the exposure risks of patients and healthcare staff. For this purpose, sampling campaigns were performed in three Portuguese healthcare units with different characteristics, to measure indoor and outdoor air microbiological loads. At the same time, other indoor air parameters that could be controlled by IAQ management were also measured: Temperature, relative humidity, and CO2 concentration. The sampling campaigns were planned to compare the referred parameters in selected rooms performing similar activities, located in different healthcare units, and also to compare the IAQ parameters of a given location under different activity conditions (normal and emergency/urgent care), and during different seasonal periods (winter/summer). Results suggest that the use of natural ventilation should be considered as a complement to mechanical ventilation systems in IAQ management in healthcare facilities, reducing energy consumption and therefore improving environmental and economic sustainability performances. Results also show that adequate control of relative humidity and CO2 concentration in the indoor air of healthcare facilities could effectively reduce the risk of airborne infections.
2. Materials and Methods
2.1. Healthcare Units
This study focuses on the characterization of selected IAQ parameters in three healthcare units located in the northwest region of Portugal: Two general hospitals (H1 and H2), and a health center (HC) that provides primary healthcare for outpatients through planned consultations and treatments, and also acts as an urgent care center. The healthcare units under study are within 20 km distance of each other.
H1 has 190 beds, 515 healthcare workers, and was inaugurated in 2012. H2 operates in a 20-year-old building with a total of 350 beds and counts 1800 healthcare workers. The health center HC serves a population of 30,000 inhabitants and counts 135 healthcare workers, operating in a building from the XIX century. In the health center HC, primary healthcare services are available on week days, and urgent care is available on week nights and weekends.
In hospitals, H1 and H2 indoor air quality are assured by mechanical ventilation, with air treatment units located on the top floor of the buildings. Ventilation flows are operated according to procedures defined by the ventilation and air conditioning project engineers. Natural ventilation may occur through window and door opening, although there is no specific procedure defined for this process. No mechanical ventilation system exists in the health center HC: Indoor air renovation depends exclusively on natural ventilation, and thermal comfort is controlled with window air-conditioners. Again, there is no specified procedure regarding the frequency of window or door opening for indoor air renovation.
2.2. IAQ Characterization Campaigns
Indoor and outdoor air bacteria and fungi concentrations were measured with a SAS DUO 360 air sampler (VWR International, Milan, Italy) that collected 200 L air samples, at a flow rate of 180 L·min−1, in tryptic soy agar (TSA) for bacteria and malt extract agar (MEA) for fungi. The samples were then incubated at 37 °C (for bacteria) and at 25 °C (for fungi) to quantify colony-forming units. When the air sample was collected for the microbiological determinations, other indoor air parameters, in the scope of IAQ management, were registered: Temperature, relative humidity, and CO2 concentration. These parameters were measured using a calibrated KIMO probe connected to a data logger KIMO AQ 200 (Saurmann Industrie, Chevry-Cossigny, France).
Sampling followed the technical recommendations of the ISO 16000 series [32,33,34]: The measurement location in each room was separated by at least 1 to 2 m from the walls, the influence of possible interferences was avoided, and the sampling devices were located 1.5 m above ground level for evaluation at the breathing zone. In all campaigns in hospitals H1 and H2, duplicate samples were collected to ensure sampling accuracy. However, in the health center HC it was not possible to collect duplicate samples due to experimental constrains.
The time of the day selected for sampling followed the recommendations of the healthcare staff and management, in order to be representative of typical conditions in each sampled room: All rooms had been in regular use for at least two hours, and room occupancy was stable during sample collection.
Campaigns were planned to characterize the selected IAQ parameters on:
- (1)
- Similar rooms in different healthcare units: Consulting, treatment, and waiting rooms at H1, H2 and HC, and hospital wards at H1and H2;
- (2)
- Similar rooms under different weather conditions: Summer and winter campaigns at the general hospitals H1 and H2;
- (3)
- The same healthcare unit under different working conditions: At HC and H2, campaigns were performed both during normal operation and emergency/urgent care assistance.
The summer campaigns took place in June and July 2017, and the winter campaigns were performed between January and March 2018.
2.3. Data Analysis
The Shapiro-Wilk test was used to analyze the normality of the experimental data. The results obtained enabled the utilization of parametric statistical tests [35]. The results obtained for the selected indoor air quality parameters (air temperature, relative humidity, CO2 concentration, bacteria, and fungi concentrations) were compared by two-way analysis of variance (ANOVA) for different healthcare units (H1, H2, and HC) operating in different conditions (normal and emergency/urgent care). Due to the presence of interaction effects, data were separated into groups: Different healthcare units and working conditions were compared separately using one-way ANOVAs with Tukey post hoc comparisons. A t-test was used to compare the results of all measured parameters between summer and winter seasons for the two hospitals operating under normal conditions. To analyze the relation between indoor air measured parameters, the Pearson correlation test was applied to all results. Statistical analysis was carried out with IBM Statistical Package for the Social Sciences (SPSS Statistics) version 25.
3. Results
The results obtained with the indoor sampling campaigns for all locations and analyzed parameters are presented in Table 1. Results show that indoor CO2 concentration varied between 405 ppm and 1870 ppm; indoor air temperature between 19.3 °C and 25.8 °C; indoor air relative humidity between 25.8% and 65.5%; indoor air microbiological loads varied between 85 CFU·m−3 and 585 CFU·m−3 for bacteria, and between 5 CFU·m−3 and 395 CFU·m−3 for fungi. Room occupancy was a concern in the IAQ characterization campaigns and, therefore, similar rooms were analyzed in equivalent occupancy ranges (Table 1).
Portuguese legislation on indoor air quality [36] sets the limit of 1250 ppm for CO2 concentration, requires fungi concentration to be lower in indoor air than in outdoor air (fungi in-out < 0 CFU·m−3), and sets the difference between bacteria concentration in indoor air and outdoor air (bact in-out) to be below 350 CFU·m−3. The results presented in Table 1 show that limits provided by the Portuguese legislation were exceeded in two rooms in hospital H2 and in four rooms in the health center HC. In hospital H1 all results obtained were in compliance with the Portuguese legislation.
Nonetheless, the European Standard EN 15251-2007 recommends that in category I buildings (occupied by very sensitive and fragile persons), indoor air relative humidity should be kept between 30% and 50%, and indoor air temperature between 21.0 °C and 25.5 °C [37]. These values were not always verified at these healthcare facilities: In the health center HC, indoor air relative humidity was systematically above 50%, H2 showed several results in which indoor air relative humidity was below 30% in the winter season, and in H1 all sampled rooms had indoor air relative humidity above 50% in the summer.
3.1. Comparison of Analyzed IAQ Conditions in the Three Healthcare Units
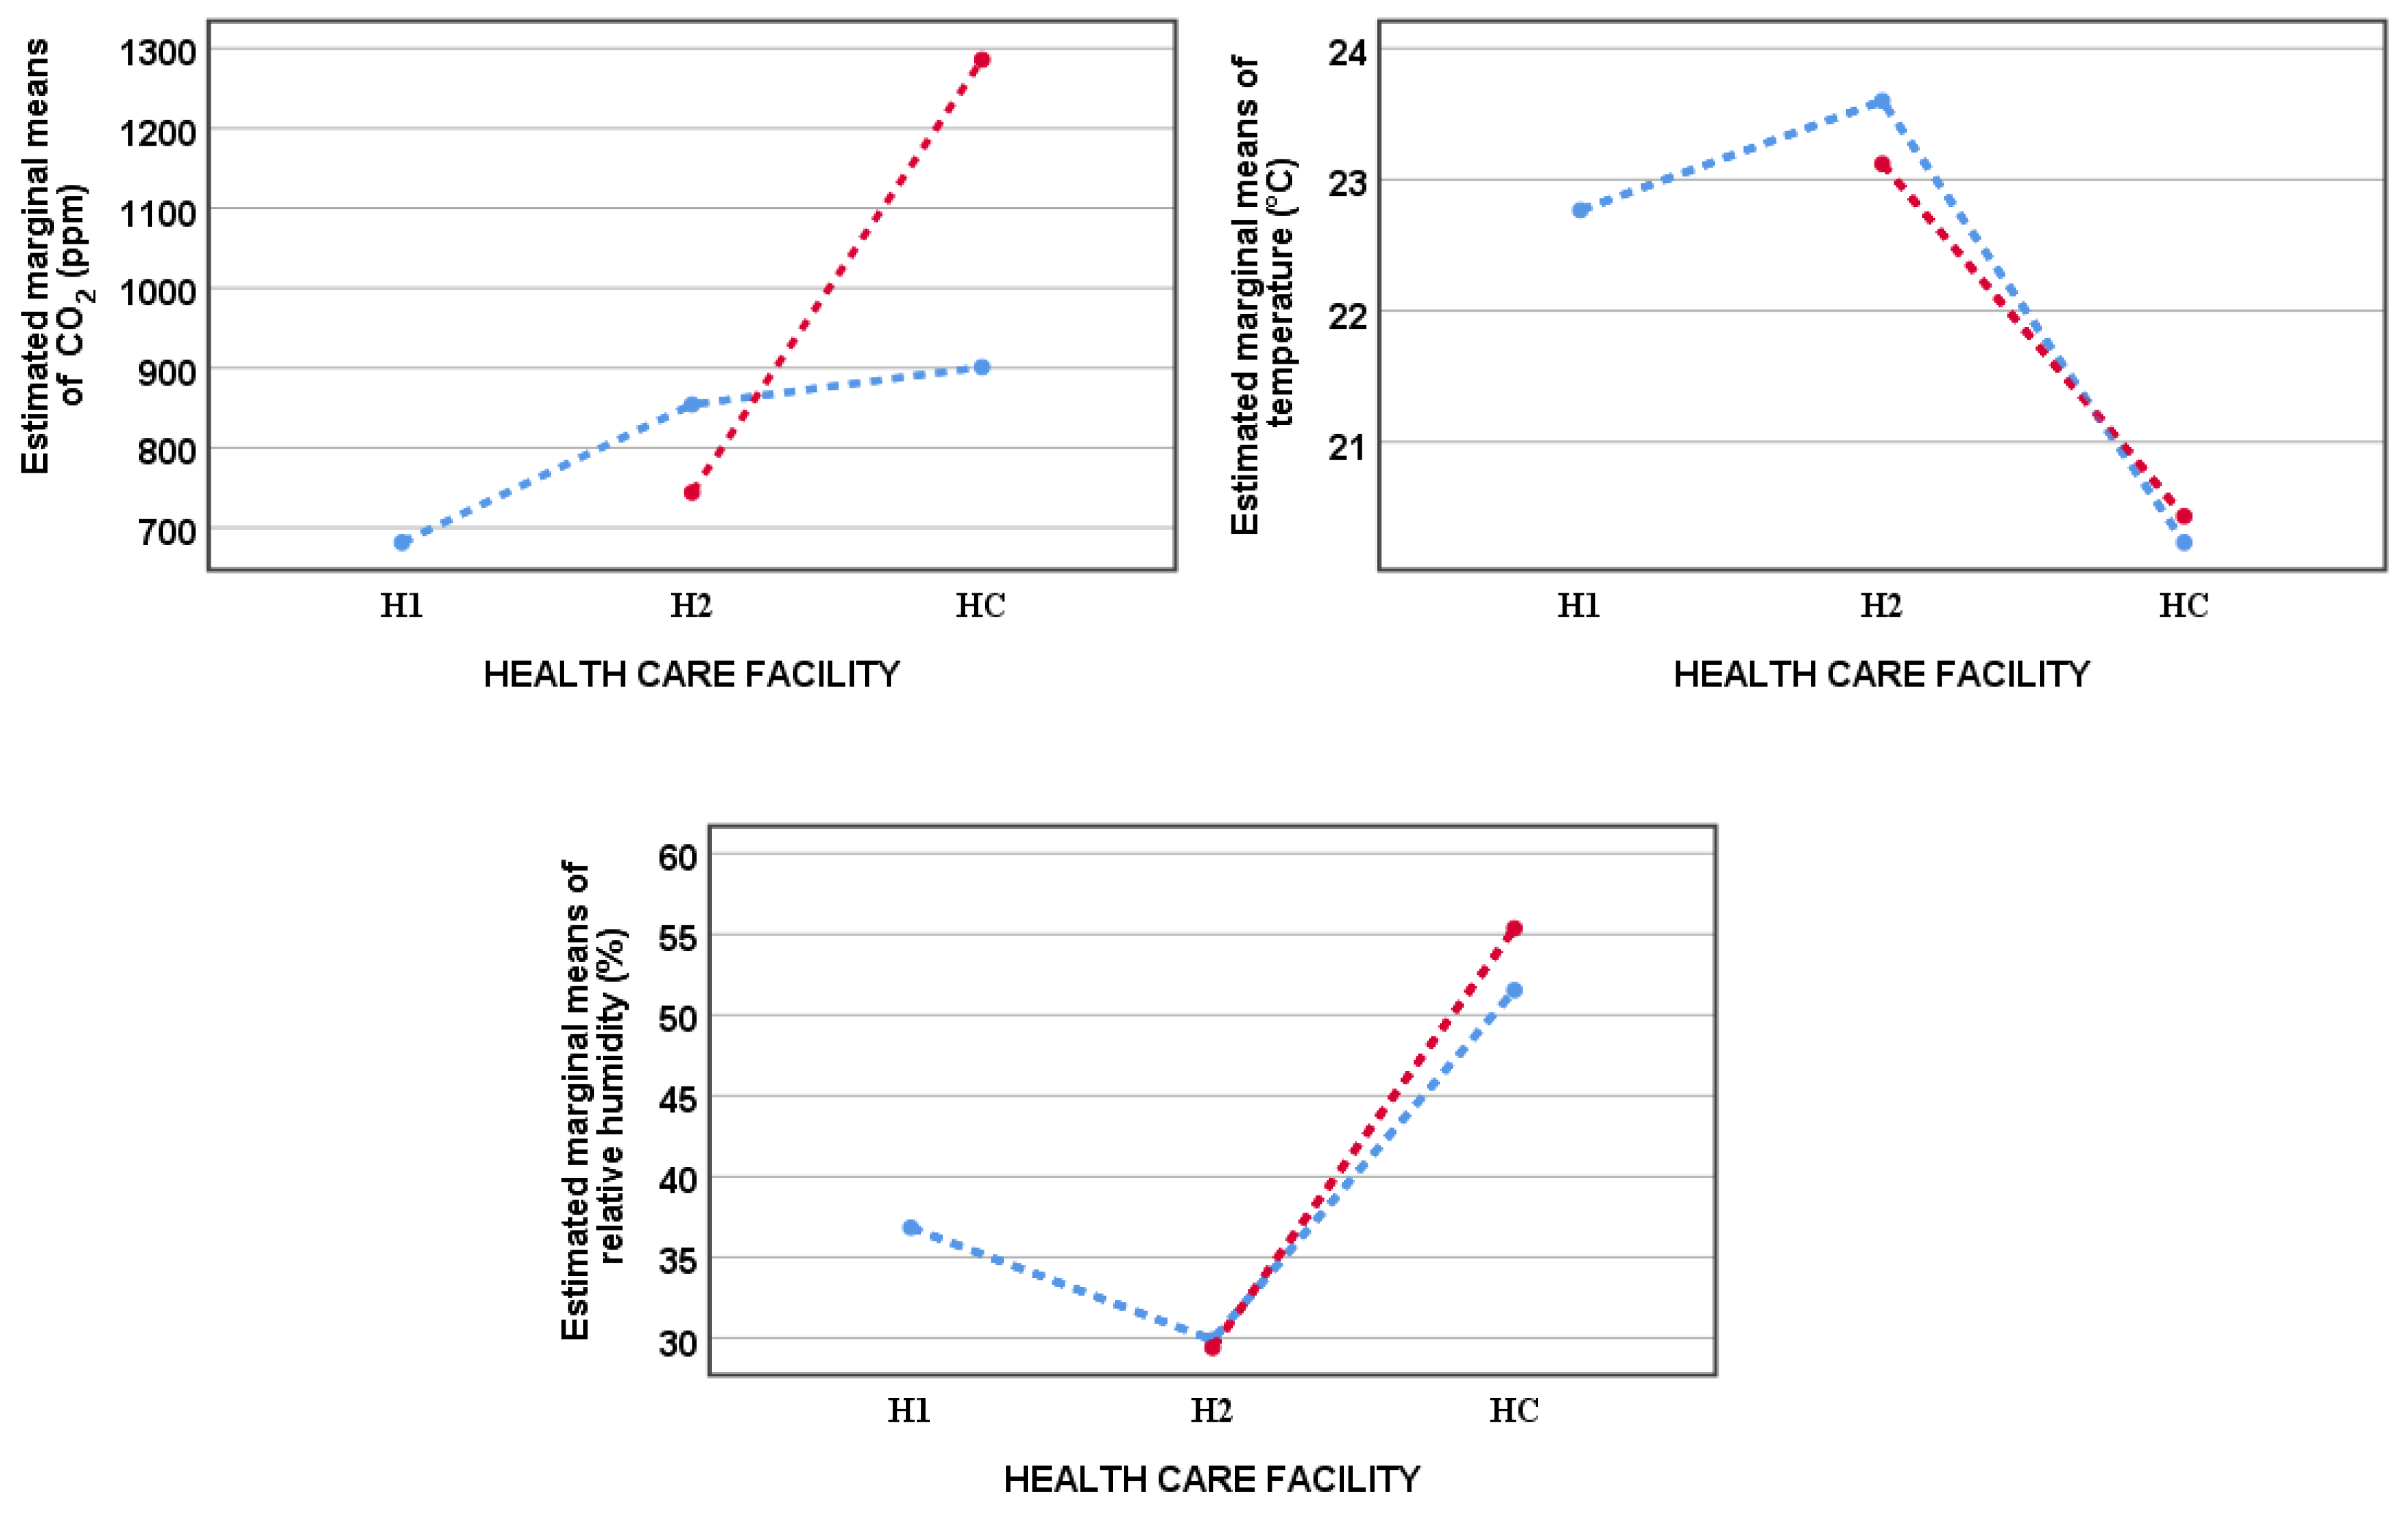
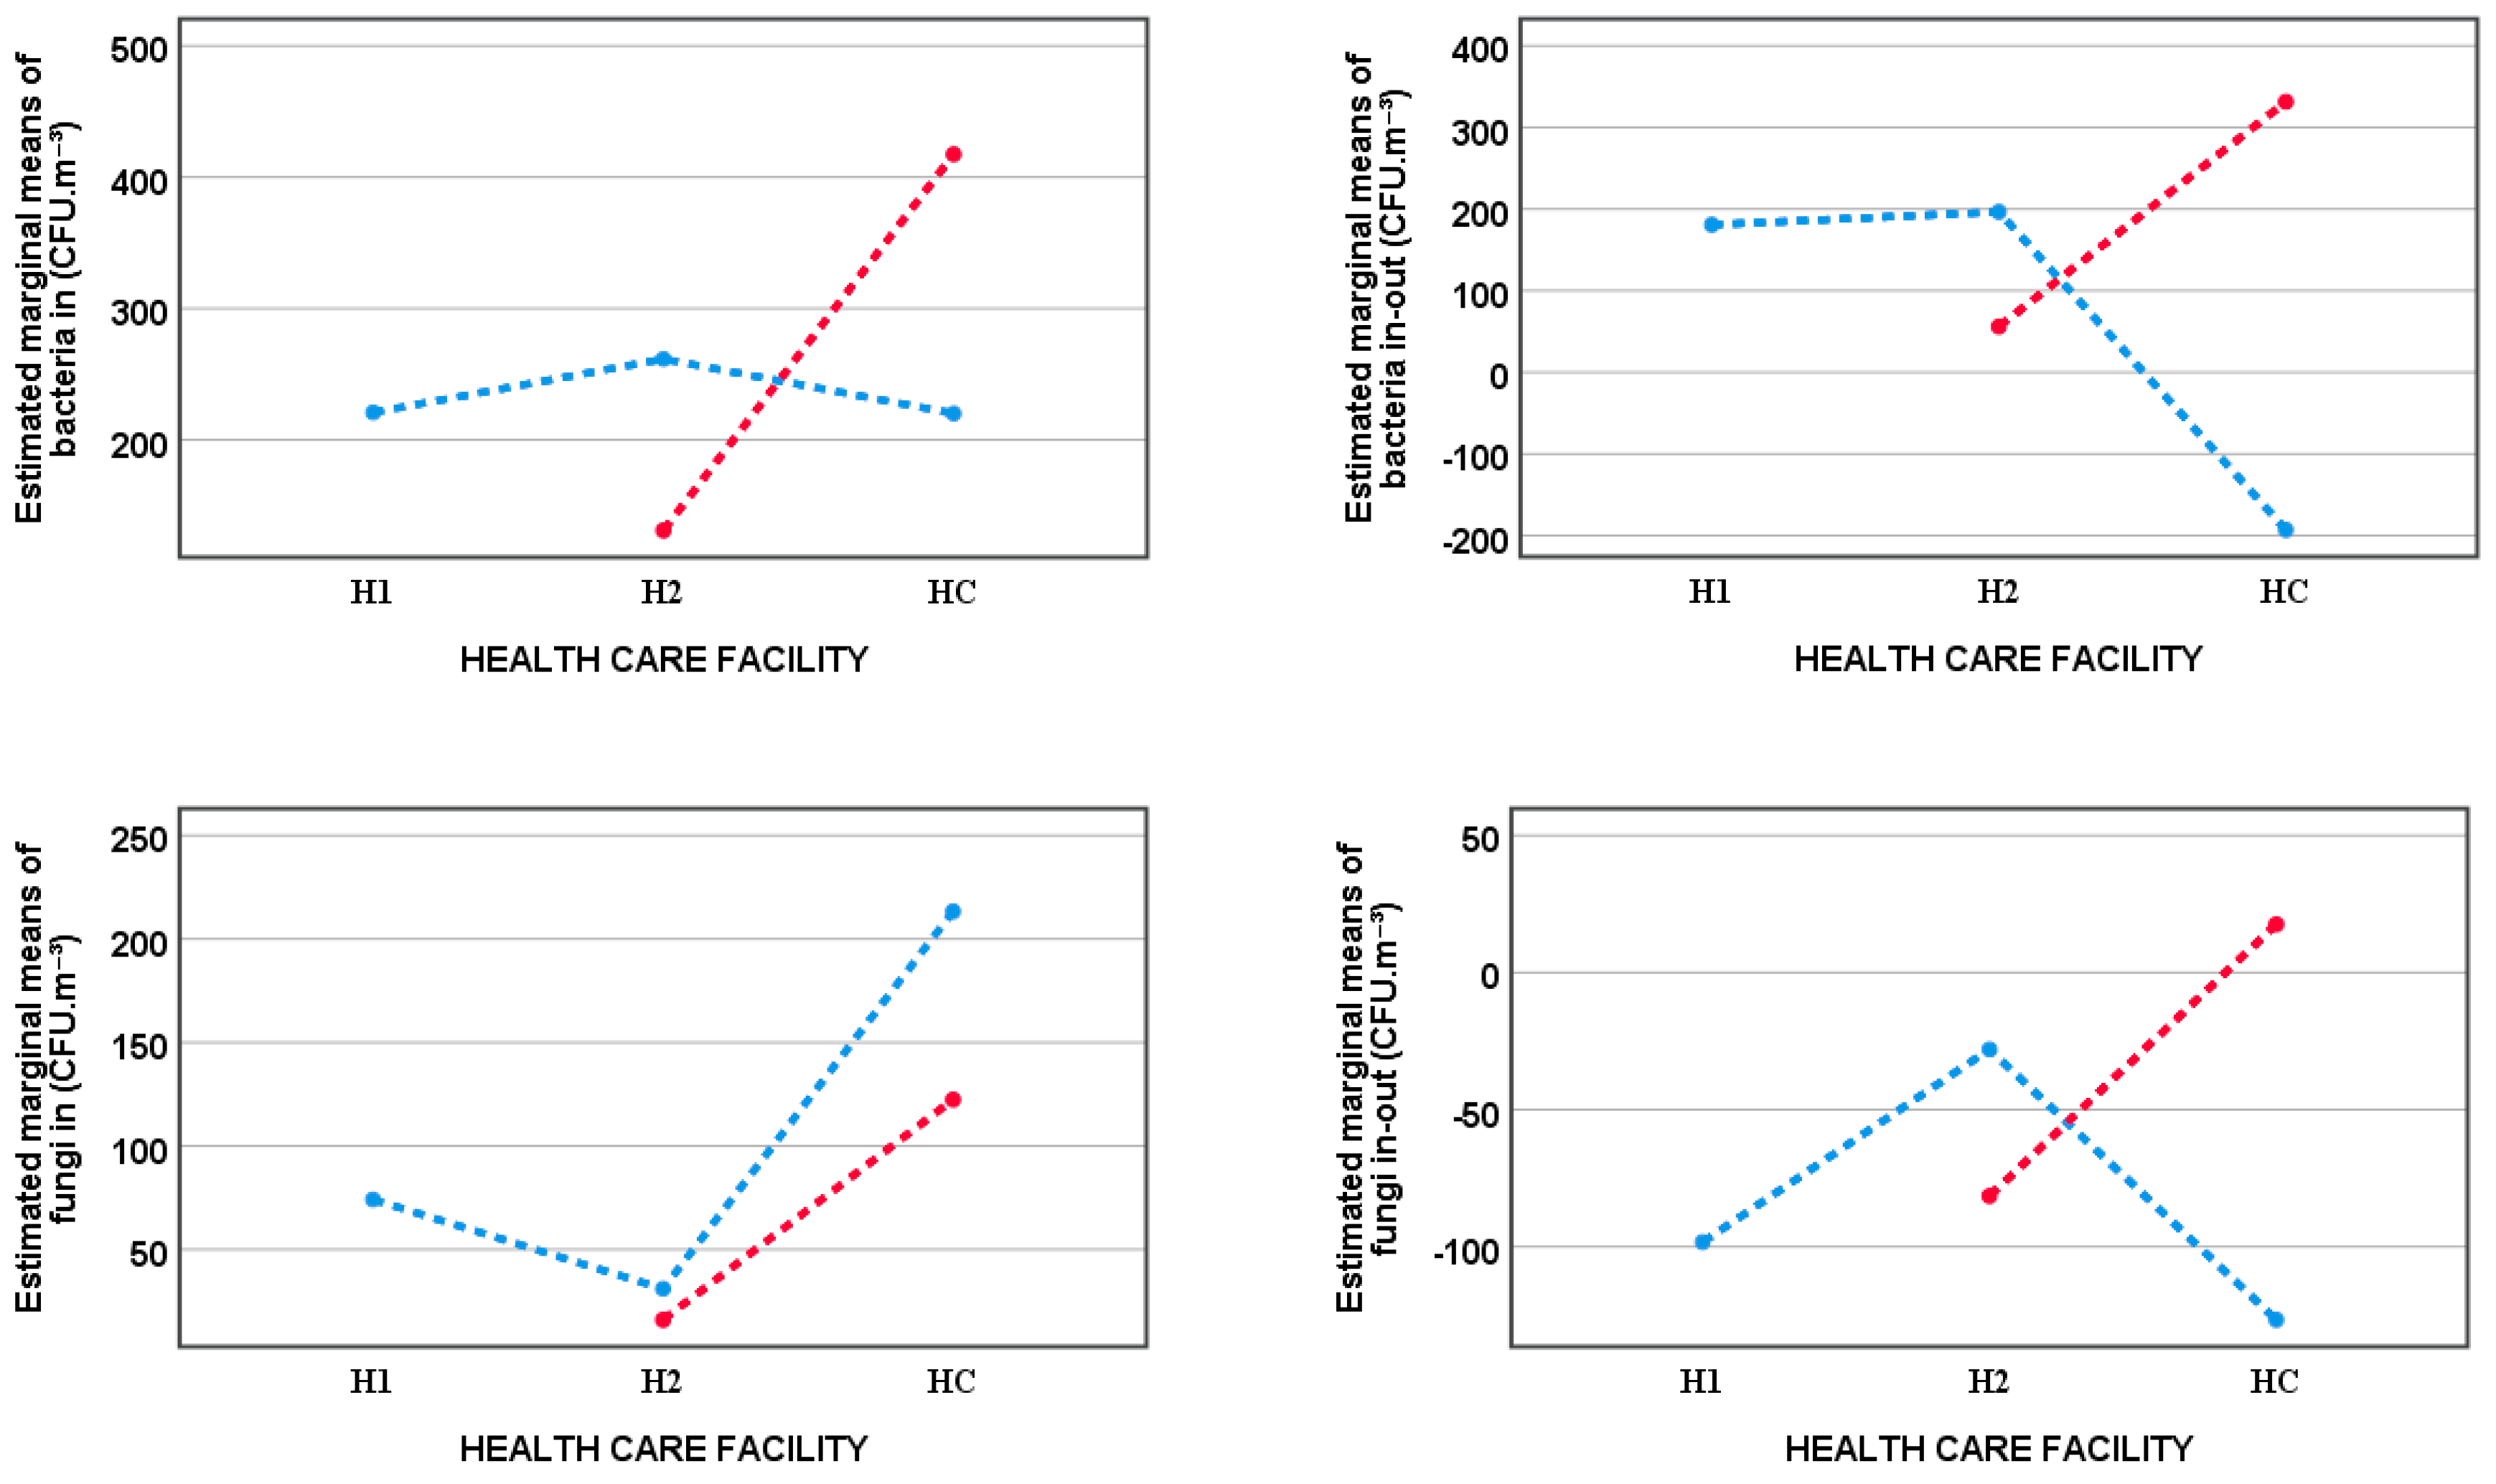
Results from the winter campaigns were classified in five groups: Normal working conditions for H1, for H2 and for HC, and emergency/urgent care for H2 and for HC. A two-way ANOVA showed that there is an interaction between the effects of the factors “healthcare unit” and “working condition” on most of the analyzed parameters, except for indoor air temperature and relative humidity (Table 2). Figure 1 and Figure 2 show the estimated marginal means for the analyzed parameters for the five groups considered in this analysis. This type of graph is recommended for analyzing the results of a two-way ANOVA since it enables an easy interpretation of the interaction between the two independent variables: Non-parallel lines suggest the existence of relevant interactions [38].
Given that the effect of the factor “healthcare unit” depends on the effect of the factor “working conditions”, a one-way ANOVA tested differences in the results, considering these factors separately: All analyzed parameters were compared in the three healthcare units under normal working conditions for H1, H2, and HC, and, when significantly different, healthcare units were compared in pairs using Tukey post hoc (Table 2). The analyzed parameters in hospital H2 and the health center HC under emergency/urgent care conditions were also compared (Table 2). The analysis of Figure 1 and Figure 2, combined with the results of these statistical tests (p-values and partial eta squared), show that:
- (1)
- Under normal working conditions, the two hospitals showed no differences on most analyzed parameters, with the exception of indoor air relative humidity (higher in hospital H1), and the difference fungi in-out (higher in hospital H2).
- (2)
- Under normal working conditions, most of the analyzed parameters in the health center HC were different from those of hospitals H1 and H2: Air temperature and the bacteria in-out difference were lower in HC, whereas relative humidity and fungi concentration were higher in HC. No significant differences were found in indoor air CO2 and bacteria concentrations between HC and hospitals H1 and H2, and in the fungi in-out difference between HC and hospital H1.
- (3)
- Under emergency/urgent care conditions, all the analyzed parameters showed significant differences when comparing the health center HC with hospital H2: HC showed higher results for indoor air CO2, bacteria and fungi concentrations, relative humidity, and for the bacteria in-out and fungi in-out differences; indoor air temperature was lower in HC.
To exclude the effect of the “healthcare unit” factor, a one-way ANOVA compared the results of the analyzed parameters in hospital H2 under normal and under emergency/urgent care working conditions. The same test was performed on the analyzed parameters in the health center HC for both these working conditions (Table 2).
- (1)
- In hospital H2 significant differences were found between microbiological parameters under normal and under emergency/urgent care working conditions: Indoor air bacteria concentration, bacteria in-out and fungi in-out differences were higher under normal working conditions.
- (2)
- In the health center HC, the higher values obtained for bacteria in-out and fungi in-out in emergency/urgent care situations are statistically relevant. Although Figure 1 and Figure 2 show higher values for indoor air CO2 and bacteria concentrations in emergency/urgent care conditions, these differences are not significant at a 0.05 significance level.
3.2. Seasonal Variation of IAQ
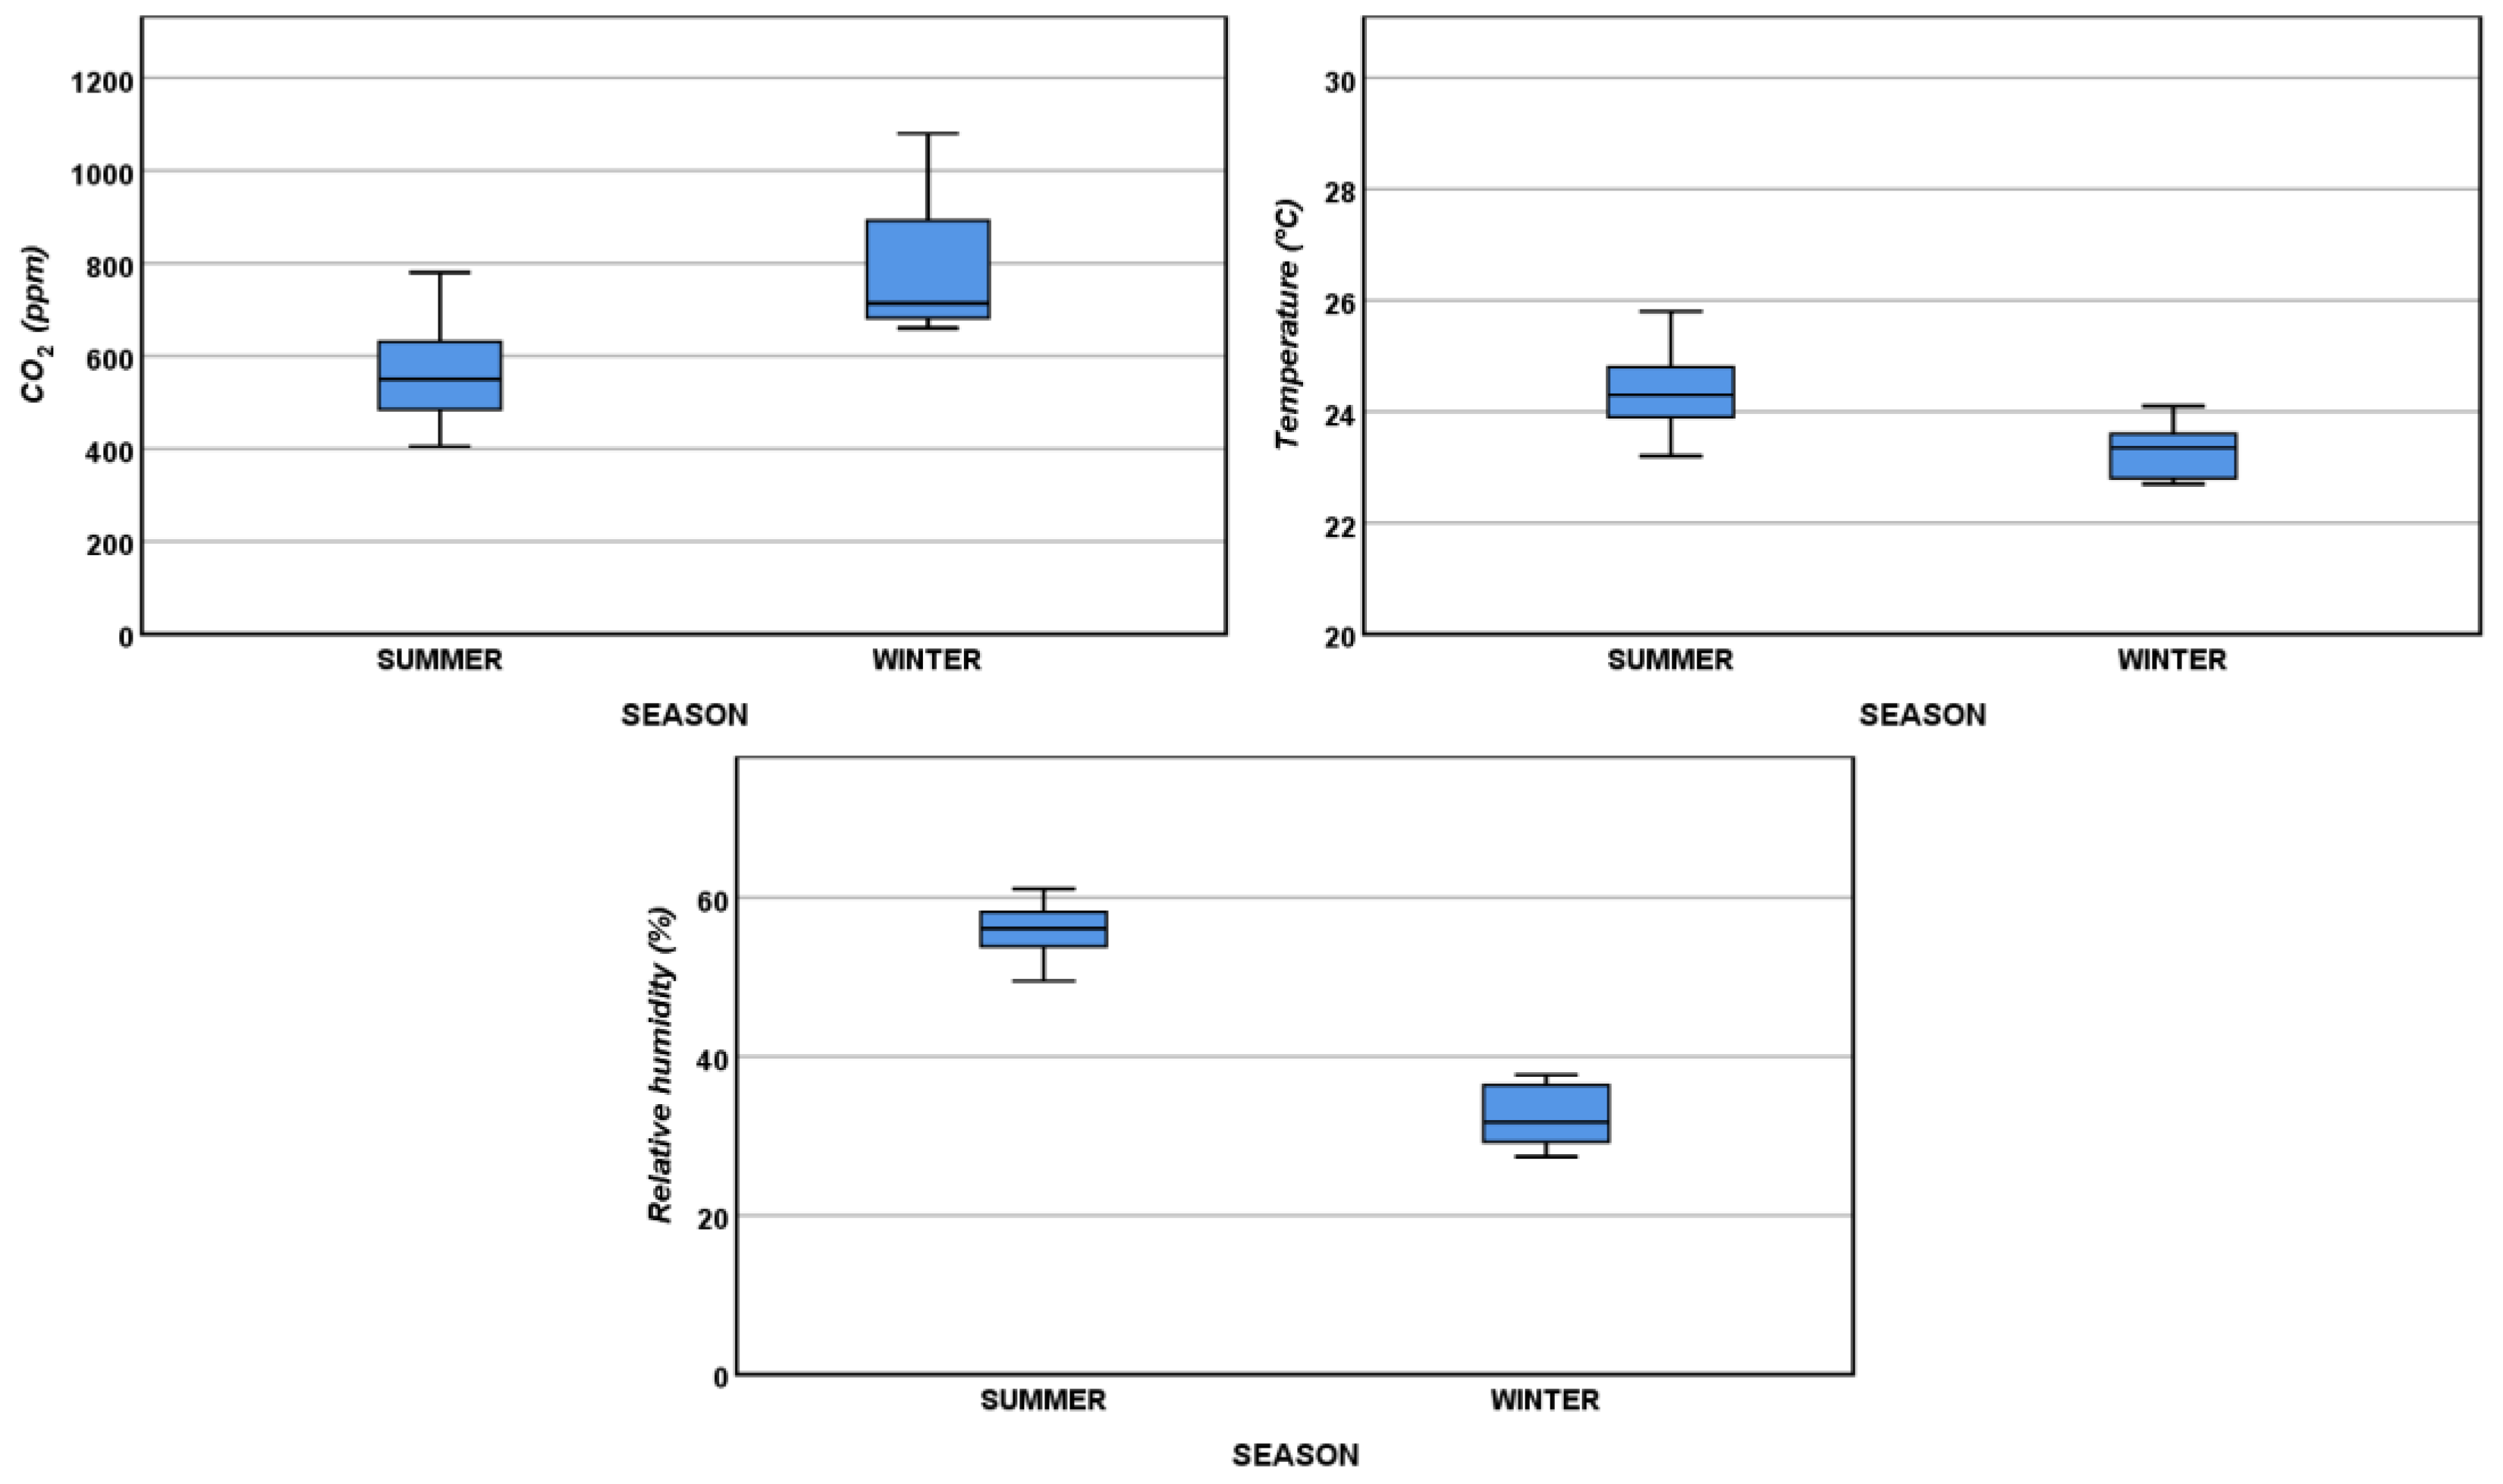
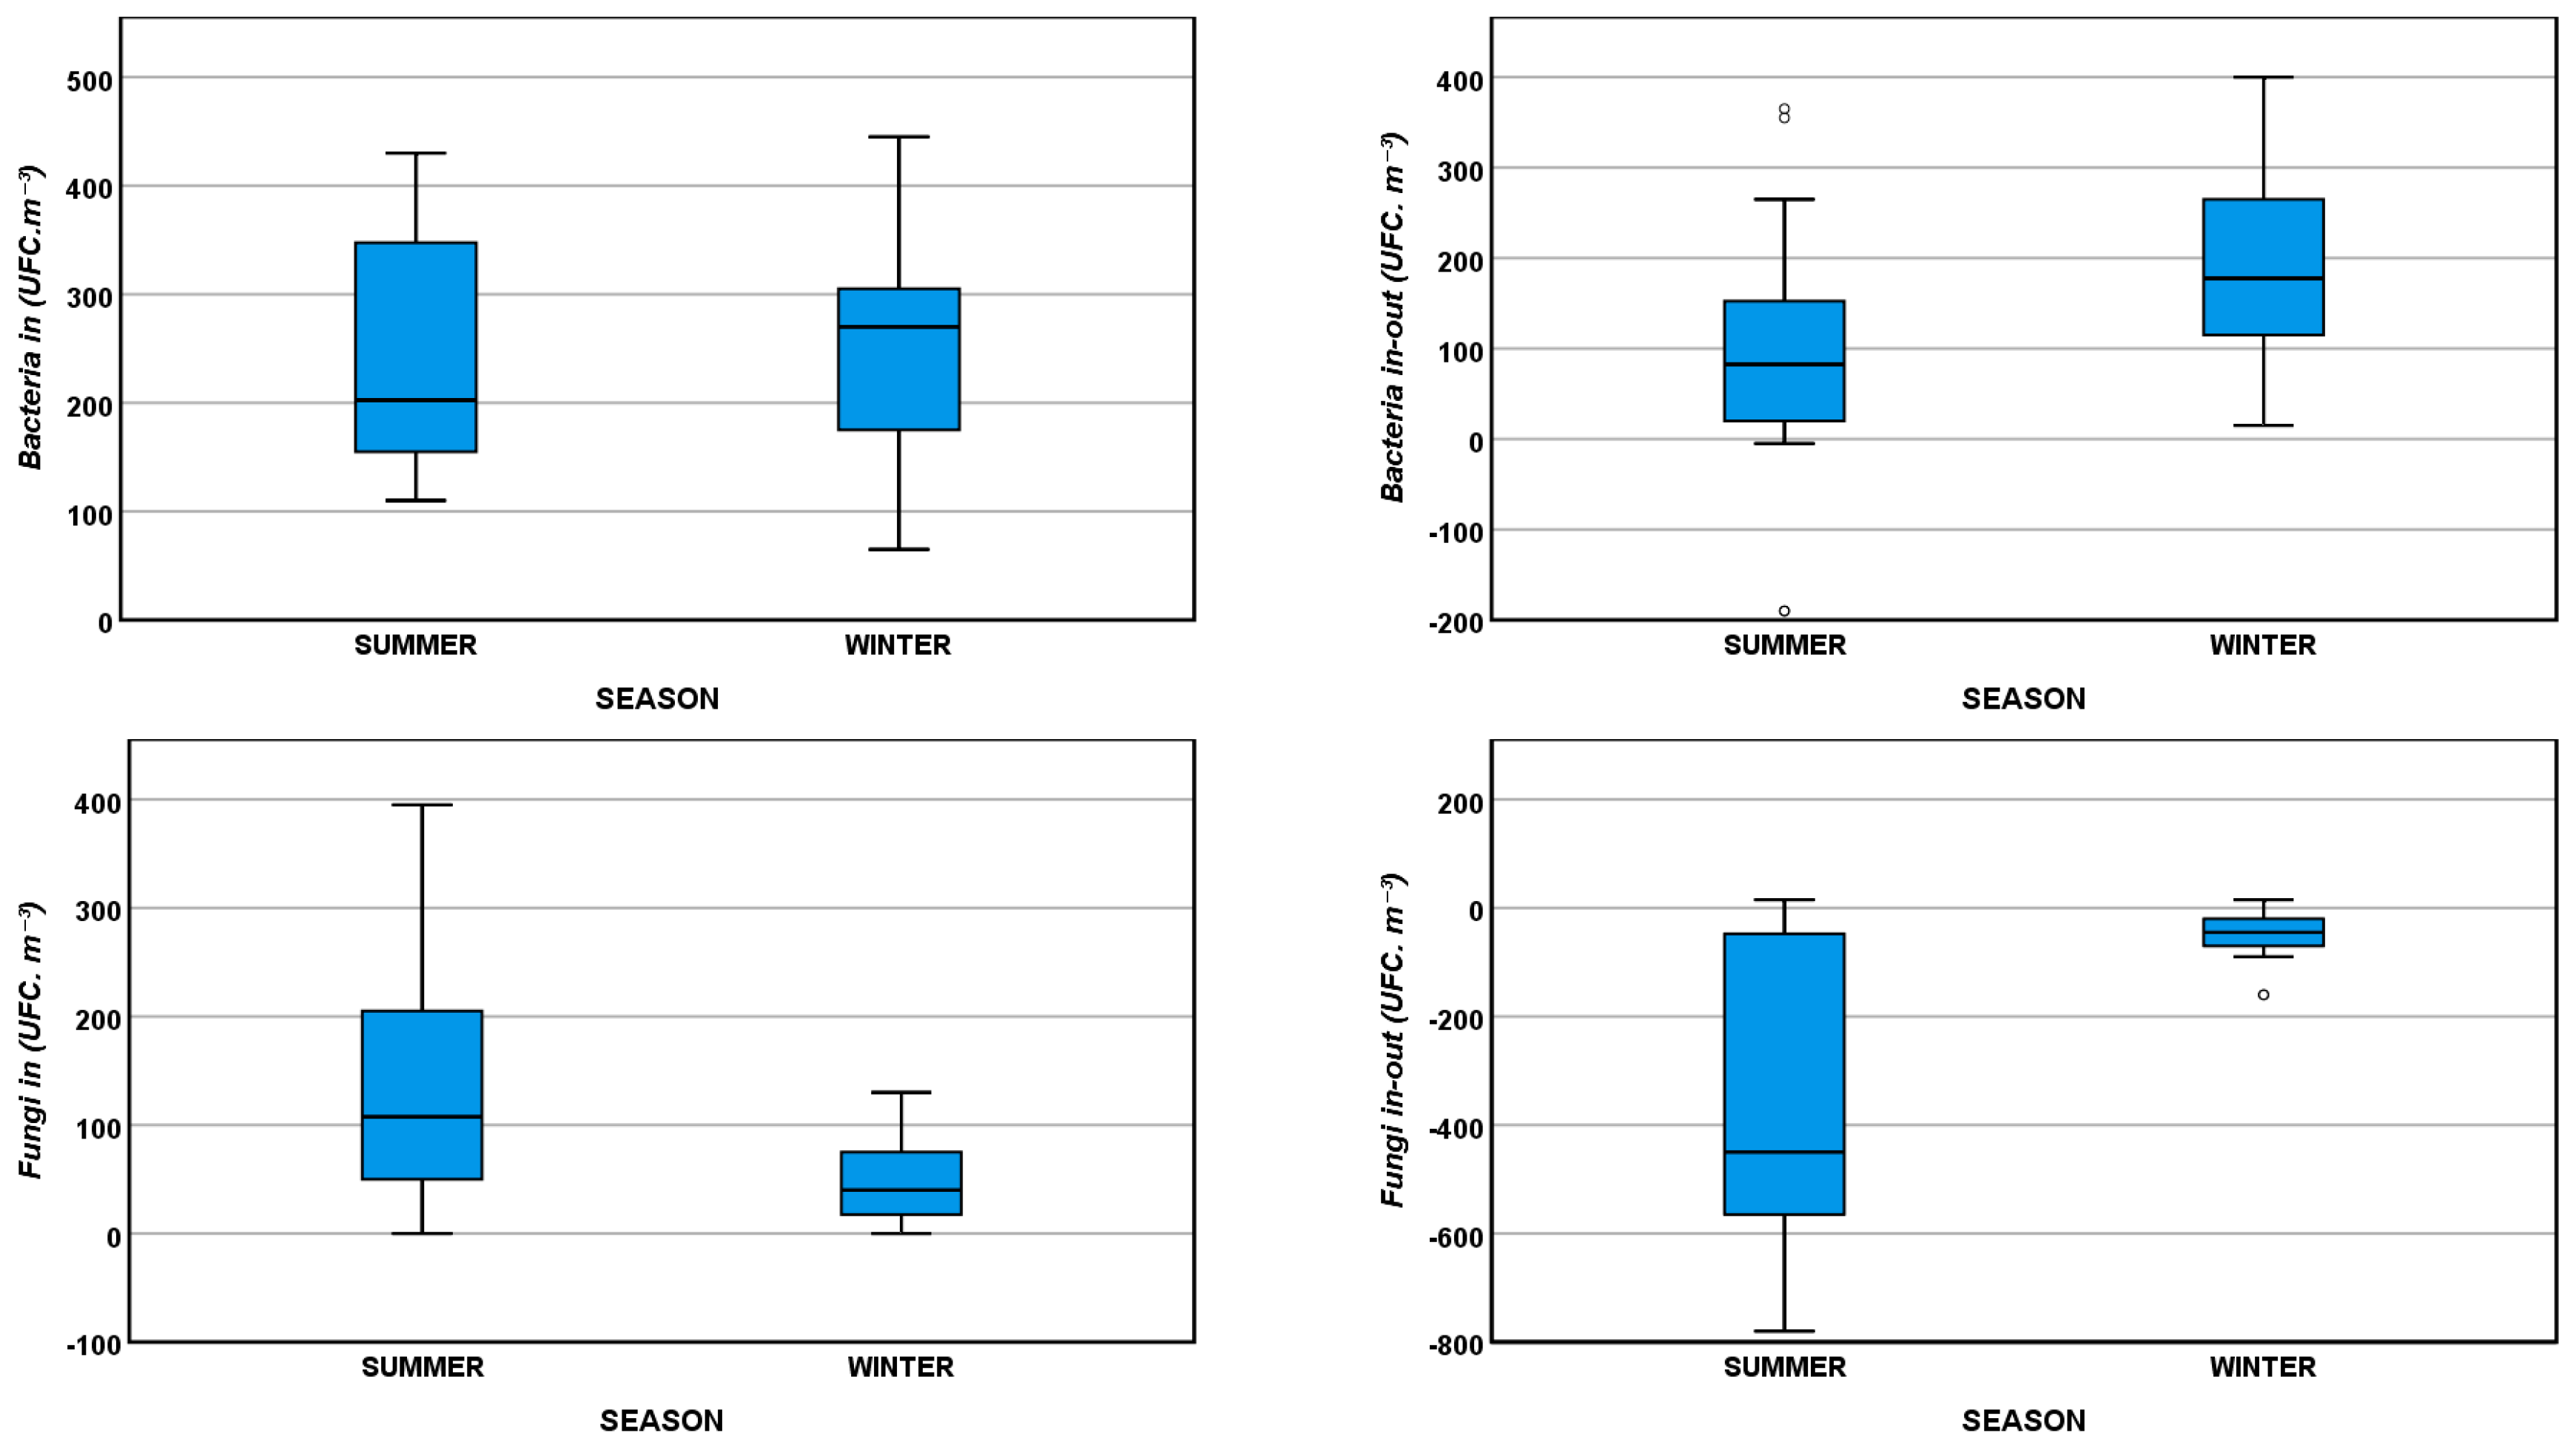
In selected rooms in hospitals H1 and H2, IAQ characterization campaigns were performed both in the summer and winter seasons. Given that in the previous section it was shown that, under normal working conditions, both hospitals had similar results for the analyzed parameters, all the results of hospitals H1 and H2 obtained for normal working conditions were used to analyze seasonal variations of IAQ. Figure 3 and Figure 4 present the boxplots for the analyzed parameters, showing that indoor air temperature and indoor relative humidity are higher in the summer, indoor air CO2 concentrations are higher in the winter, and indoor fungi concentrations are higher in the summer. Figure 4 also shows that the differences found between indoor and outdoor microbiological loads are higher in the winter when windows are more frequently closed and, therefore, less outside air is introduced by natural ventilation processes.
A t-test confirmed significant differences (p <0.05) between summer and winter results for most parameters analyzed (Table 3), with the exception of indoor bacteria concentrations.
4. Discussion
The experimental results obtained show that healthcare units using mechanical ventilation (hospitals H1 and H2) have similar IAQ conditions, for the parameters under study, and are generally in compliance with the recommended standards for IAQ in healthcare units regarding indoor air CO2 concentration and microbiological loads [36,37].
Given that in emergency/urgent care assistance the affluence of users is high, the occupation intensity is higher under these working conditions: The number of different people present inside the room during one working hour is expected to be higher in emergency/urgent care conditions. In hospital H2, the good results for the analyzed parameters found under emergency/urgent care conditions show that mechanical ventilation controls were effective even for high occupation intensity patterns. On the other hand, the natural ventilation system of the health center HC showed limitations in providing adequate IAQ during emergency/urgent care attendance: In some cases, indoor air CO2 concentrations and microbiological loads exceeded limits established by the Portuguese legislation.
The compliance with the 30 to 50% recommended values for indoor air relative humidity [37] seems to be a challenge for IAQ control systems: In hospital H1 the ventilation systems are capable of providing adequate values for indoor air relative humidity in the winter, but fail to keep this parameter below 50% in the summer; on the other hand, the ventilation system of hospital H2 shows a good performance regarding indoor air relative humidity in the summer, but in the winter this parameter is systematically below 30%. Low outdoor humidity in cold seasons, typical of the Portuguese climate characteristics, combined with indoor heating, may explain these low indoor air relative humidity values, which may threaten occupants health causing skin problems, nasal dryness, and nasal congestion [21,39]. On the other hand, high indoor air relative humidity promotes the growth and transfer of airborne microorganisms and therefore increases the risk of infection [17,21,28,40].
Microbiological loads in indoor air are of the utmost importance in healthcare units since the aerial dissemination of pathogens is a major cause of nosocomial infections. The presence of fungi in indoor air results mainly from outdoor air contamination, combined with the occurrence of favorable environmental conditions, namely high temperature and relative humidity [12,17,25,28,31,40,41]. Figure 5 shows the experimental results of indoor air relative humidity and indoor fungi concentration, illustrating a significant moderate positive correlation between these IAQ parameters (ρPearson = 0.562, p-value (two-tail) = 0.002). The highest values for indoor fungi concentration occur for relative humidity above 50% (Figure 5). Therefore, keeping indoor air relative humidity below this value is expected to reduce airborne infection transmission risks.
In indoor air, people are the main source of bacteria and CO2, and therefore both these parameters are related to indoor activities and occupation patterns [24,40,41]. Yang et al. [24] report a positive correlation between indoor air CO2 concentration and bacteria concentration, suggesting that CO2 concentration could be used as an indicator of indoor air bacterial contamination. The confirmation of this correlation could be of great importance in healthcare sustainability management since real-time monitoring of CO2 concentration is technically viable and cost effective, and could provide real-time information regarding indoor air bacterial quality. The experimental results obtained in the present study were used to test this correlation between indoor air CO2 and bacteria concentrations. The results (Figure 6) confirm a significant moderate positive correlation (ρPearson = 0.526, p-value (two-tail) = 0.004) described in Yang et al. [24]. Despite the high data dispersion illustrated in Figure 6, this positive correlation—obtained with data from different healthcare units, with different occupation intensities, and in different seasons—suggests that monitoring indoor CO2 concentration and implementing control practices targeting lower CO2 concentration values, would lower the probability of achieving high bacterial loads, and therefore reduce the risks of transmitting airborne infections.
IAQ characterization campaigns revealed seasonal variation for most of the analyzed parameters, as reported in other studies focusing IAQ in healthcare units [40,41,42]. The higher values obtained for indoor air CO2 concentrations in the winter are explained by the decreased frequency in window and door opening due to external unfavorable weather conditions. On the other hand, in the summer, the higher values of indoor air temperature and relative humidity result in an increase in microbiological loads, particularly detected in fungi concentration. Other studies also report indoor air fungi concentrations in healthcare facilities to be higher in the summer [40,42]. The effect of higher temperature and relative humidity on indoor air bacteria concentration in the summer is balanced with the decreased door and window opening in the winter, and therefore the seasonal effect on this parameter is not clear in our results.
5. Conclusions
The results obtained in this study show that there are improvement opportunities for sustainability management on the scope of IAQ monitoring and control in healthcare facilities.
Natural ventilation mechanisms are cost-effective solutions to control IAQ, and the results of the sampling campaigns in the health center HC under normal working conditions show its effectiveness for the parameters analyzed in this study. However, results have also shown that using exclusively natural ventilation failed to assure adequate IAQ conditions in the higher occupation intensity patterns occurring in emergency/urgent care situations. With adequate outdoor air quality conditions, there is an interesting potential in the use of natural ventilation as a complement to mechanical ventilation in IAQ management in healthcare facilities, reducing energy consumption and therefore improving environmental and economic sustainability performances.
The effect of indoor air relative humidity in indoor fungi concentration is widely described in the literature, as stated above. Although the recommended values for indoor air relative humidity in healthcare facilities are in the range 30–50%, our results show that keeping relative humidity closer to the lower limit has a significant effect on reducing fungi concentration, consequently lowering the risk of airborne infections. Adequate control of indoor relative humidity is particularly important in the summer months when fungal concentrations tend to be higher.
The positive correlation found in our results between indoor air CO2 and bacteria concentrations indicates that real-time monitoring and control of CO2 loads in healthcare facilities is an adequate and cost-effective solution that would also lower the probability of nosocomial infections.
The conclusions of this research are limited to the assumption that the results obtained are representative of the typical IAQ conditions of each sampled room. Although this study comprised measurement campaigns in several rooms of three different healthcare units, with different IAQ control mechanisms, and in different working conditions, the generalization of these conclusions requires further studies focusing IAQ characterization campaigns in other healthcare units. In addition, the characterization of the fungi and bacteria species present in indoor air of healthcare units could provide relevant information regarding the risk of airborne infections, and therefore is suggested as future research.
Author Contributions
Conceptualization, A.F., I.A., M.J.G., C.A. and N.B.; formal analysis, I.A. and M.J.G.; investigation, A.F., I.A., M.J.G., C.A., R.S. and N.B.; methodology, A.F., I.A., M.J.G., C.A., R.S. and N.B.; project administration, A.F.; validation, N.B.; writing—original draft, A.F. and I.A.; writing—review and editing, M.J.G., C.A., R.S. and N.B.
Funding
This research was funded by national funds provided by FCT—Fundação para a Ciência e a Tecnologia, in the scope of FCT Project UID/Multi/04546/2016.
Acknowledgments
The authors wish to acknowledge the participation of the healthcare units in this study, and the collaboration of the healthcare units’ staff during the sampling campaigns.
Conflicts of Interest
The authors declare no conflict of interest.
References
- Fischer, M. Fit for the future? A new approach in the debate about what makes healthcare systems really sustainable. Sustainability 2015, 7, 294–312. [Google Scholar] [CrossRef]
- Carnero, M.C. Assessment of Environmental Sustainability in Health Care Organizations. Sustainability 2015, 7, 8270–8291. [Google Scholar] [CrossRef] [Green Version]
- de Castro, M.F.; Mateus, R.; Serôdio, F.; Bragança, L. Development of benchmarks for operating costs and resources consumption to be used in healthcare building sustainability assessment methods. Sustainability 2015, 7, 13222–13248. [Google Scholar] [CrossRef]
- Naranjo-Gil, D. The role of management control systems and top teams in implementing environmental sustainability policies. Sustainability 2016, 8, 359. [Google Scholar] [CrossRef]
- García-Sanz-Calcedo, J.; Al-Kassir, A.; Yusaf, T. Economic and Environmental Impact of Energy Saving in Healthcare Buildings. Appl. Sci. 2018, 8, 440. [Google Scholar] [CrossRef]
- Liu, Y.; Wang, Z.; Zhang, Z.; Hong, J.; Lin, B. Investigation on the Indoor Environment Quality of health care facilities in China. Build. Environ. 2018, 141, 273–287. [Google Scholar] [CrossRef]
- Kim, J.-R.; Jeon, E.-C.; Cho, S.; Kim, H. The Promotion of Environmental Management in the South Korean Health Sector—Case Study. Sustainability 2018, 10, 2081. [Google Scholar] [CrossRef]
- Qian, H.; Li, Y.; Seto, W.H.; Ching, P.; Ching, W.H.; Sun, H.Q. Natural ventilation for reducing airborne infection in hospitals. Build. Environ. 2010, 45, 559–565. [Google Scholar] [CrossRef]
- Nimlyat, P.S.; Kandar, M.Z. Appraisal of indoor environmental quality (IEQ) in healthcare facilities: A literature review. Sustain. Cities Soc. 2015, 17, 61–68. [Google Scholar] [CrossRef]
- Loupa, G.; Fotopoulou, S.; Tsagarakis, K.P. A tool for analysing the interdependence of indoor environmental quality and reported symptoms of the hospitals’ personnel. J. Risk Res. 2017, 20, 678–691. [Google Scholar] [CrossRef]
- Frontczak, M.; Wargocki, P. Literature survey on how different factors influence human comfort in indoor environments. Build. Environ. 2011, 46, 922–937. [Google Scholar] [CrossRef]
- Jurado, S.R.; Bankoff, A.D.P.; Sanchez, A. Indoor air quality in Brazilian universities. Int. J. Environ. Res. Public Health 2014, 11, 7081–7093. [Google Scholar] [CrossRef] [PubMed]
- Widder, S.H.; Haselbach, L. Relationship among concentrations of indoor air contaminants, their sources, and different mitigation strategies on indoor air quality. Sustainability 2017, 9, 1149. [Google Scholar] [CrossRef]
- EPA-United States Environmental Protection Agency. Fundamentals of Indoor Air Quality in Buildings. Available online: https://www.epa.gov/indoor-air-quality-iaq/fundamentals-indoor-air-quality-buildings (accessed on 23 December 2018).
- World Health Organization. WHO Guidelines for Indoor Air Quality: Selected Pollutants; World Health Organization: Copenhagen, Denmark, 2010; ISBN 978-92-890-0213-4. [Google Scholar]
- World Health Organization. WHO Guidelines for Indoor Air Quality: Dampness and Mould; World Health Organization: Copenhagen, Denmark, 2009; ISBN 978-92-890-4168-3. [Google Scholar]
- El-Sharkawy, M.; Noweir, M.H. Indoor air quality levels in a University Hospital in the Eastern Province of Saudi Arabia. J. Fam. Community Med. 2014, 21, 39–47. [Google Scholar] [CrossRef] [PubMed]
- Wallner, P.; Tappler, P.; Munoz, U.; Damberger, B.; Wanka, A.; Kundi, M.; Hutter, H.P. Health and wellbeing of occupants in highly energy efficient buildings: A field study. Int. J. Environ. Res. Public Health 2017, 14, 314. [Google Scholar] [CrossRef]
- Li, Y.; Leung, G.M.; Tang, J.W.; Yang, X.; Chao, C.Y.H.; Lin, J.Z.; Lu, J.W.; Nielsen, P.V.; Niu, J.; Qian, H.; et al. Role of ventilation in airborne transmission of infectious agents in the built environment—A multidisciplinary systematic review. Indoor Air 2007, 17, 2–18. [Google Scholar] [CrossRef]
- Bekkari, H.; Benchemsi, N.; Touijer, H.; Berrada, S.; Maniar, S.; Ettayebi, M.; El Ouali Lalami, A. Microbial analysis of air in a public hospital in the city of Fez, Morocco. Int. J. Pharm. Clin. Res. 2016, 8, 533–537. [Google Scholar]
- Ikhtiar, M.; Alzad, H.; Paramita, S. Microbiological Assessment of Indoor Air of Takalar County Hospital Wards in South Sulawesi, Indonesia. Sci. J. Public Heal. 2017, 5, 172–177. [Google Scholar] [CrossRef]
- Beggs, C.; Knibbs, L.D.; Johnson, G.R.; Morawska, L. Environmental contamination and hospital-acquired infection: Factors that are easily overlooked. Indoor Air 2015, 25, 462–474. [Google Scholar] [CrossRef]
- Cox-Ganser, J.M.; Rao, C.Y.; Park, J.H.; Schumpert, J.C.; Kreiss, K. Asthma and respiratory symptoms in hospital workers related to dampness and biological contaminants. Indoor Air 2009, 19, 280–290. [Google Scholar] [CrossRef]
- Yang, C.-T.; Liao, C.-J.; Liu, J.-C.; Den, W.; Chou, Y.-C.; Tsai, J.-J. Construction and Application of an Intelligent Air Quality Monitoring System for Healthcare Environment. J. Med. Syst. 2014, 38, 15–25. [Google Scholar] [CrossRef] [PubMed]
- Wallner, P.; Munoz, U.; Tappler, P.; Wanka, A.; Kundi, M.; Shelton, J.F.; Hutter, H.P. Indoor environmental quality in mechanically ventilated, energy-efficient buildings vs. Conventional buildings. Int. J. Environ. Res. Public Health 2015, 12, 14132–14147. [Google Scholar] [CrossRef] [PubMed]
- Hellgren, U.M.; Hyvärinen, M.; Holopainen, R.; Reijula, K. Perceived indoor air quality, air-related symptoms and ventilation in finnish hospitals. Int. J. Occup. Med. Environ. Health 2011, 24, 48–56. [Google Scholar] [CrossRef] [PubMed]
- Gilkeson, C.A.; Camargo-Valero, M.A.; Pickin, L.E.; Noakes, C.J. Measurement of ventilation and airborne infection risk in large naturally ventilated hospital wards. Build. Environ. 2013, 65, 35–48. [Google Scholar] [CrossRef] [Green Version]
- Yau, Y.H.; Chandrasegaran, D.; Badarudin, A. The ventilation of multiple-bed hospital wards in the tropics: A review. Build. Environ. 2011, 46, 1125–1132. [Google Scholar] [CrossRef]
- World Health Organization. WHO Interim Guidelines—Infection Prevention and Control of Epidemic- and Pandemic-Prone Acute Respiratory Diseases in Health Care; World Health Organization: Geneva, Switzerland, 2007. [Google Scholar]
- Escombe, A.R.; Oeser, C.C.; Gilman, R.H.; Navincopa, M.; Ticona, E.; Pan, W.; Martínez, C.; Chacaltana, J.; Rodríguez, R.; Moore, D.A.J.; et al. Natural ventilation for the prevention of airborne contagion. PLoS Med. 2007, 4, 0309–0317. [Google Scholar] [CrossRef]
- Jung, C.C.; Wu, P.C.; Tseng, C.H.; Su, H.J. Indoor air quality varies with ventilation types and working areas in hospitals. Build. Environ. 2015, 85, 190–195. [Google Scholar] [CrossRef]
- ISO 16000-17: Indoor Air Part 17: Detection and Enumeration of Moulds–Culture-Based Method; ISO: Geneva, Switzerland, 2008.
- ISO 16000-18: Indoor Air Part 18: Detection and Enumeration of Moulds–Sampling by Impaction; ISO: Geneva, Switzerland, 2011.
- ISO 16000-26: Indoor Air Part 26: Sampling Strategy for Carbon Dioxide; ISO: Geneva, Switzerland, 2012.
- Blanca, M.J.; Alarcón, R.; Arnau, J.; Bono, R.; Bendayan, R. Non-normal data: Is ANOVA still a valid option? Psicothema 2017, 29, 552–557. [Google Scholar] [CrossRef]
- Portuguese Government. Ordinance n.o. 353-A/2013. Diario da Republica. n.o.235, Supplement, 1st Serie of 2013-12-04. Available online: https://dre.pt/application/file/136515. (accessed on 23 December 2018).
- EN 15251-2007: Indoor Environmental Input Parameters for Design and Assessment of Energy Performance of Buildings Addressing Indoor Air Quality, Thermal Environment, Lighting and Acoustics; European Committee for Standardization: Brussels, Belgium, 2007.
- Keppel, G.; Wickens, T.D. Design and Analysis: A Researcher’s Handbook; Pearson Prentice Hall: Upper Saddle River, NJ, USA, 2004. [Google Scholar]
- Reinikainen, L.M.; Jaakkola, J.J.K. Significance of humidity and temperature on skin and upper airway symptoms. Indoor Air 2003, 13, 344–352. [Google Scholar] [CrossRef]
- Park, D.U.; Yeom, J.K.; Lee, W.J.; Lee, K.M. Assessment of the levels of airborne bacteria, gram-negative bacteria, and fungi in hospital lobbies. Int. J. Environ. Res. Public Health 2013, 10, 541–555. [Google Scholar] [CrossRef]
- Cabo Verde, S.; Almeida, S.M.; Matos, J.; Guerreiro, D.; Meneses, M.; Faria, T.; Botelho, D.; Santos, M.; Viegas, C. Microbiological assessment of indoor air quality at different hospital sites. Res. Microbiol. 2015, 166, 557–563. [Google Scholar] [CrossRef] [PubMed]
- Sautour, M.; Sixt, N.; Dalle, F.; L’Ollivier, C.; Fourquenet, V.; Calinon, C.; Paul, K.; Valvin, S.; Maurel, A.; Aho, S.; et al. Profiles and seasonal distribution of airborne fungi in indoor and outdoor environments at a French hospital. Sci. Total Environ. 2009, 407, 3766–3771. [Google Scholar] [CrossRef] [PubMed]
Figure 1.
Estimated marginal means for physical and chemical parameters in the winter season, under normal working conditions (blue dotted line) and under emergency/urgent care assistance (red dotted line).
Figure 1.
Estimated marginal means for physical and chemical parameters in the winter season, under normal working conditions (blue dotted line) and under emergency/urgent care assistance (red dotted line).

Figure 2.
Estimated marginal means for microbiological parameters in the winter season, under normal working conditions (blue dotted line) and under emergency/urgent care assistance (red dotted line).
Figure 2.
Estimated marginal means for microbiological parameters in the winter season, under normal working conditions (blue dotted line) and under emergency/urgent care assistance (red dotted line).

Figure 3.
Boxplots of the results obtained for physical and chemical parameters obtained in hospitals H1 and H2, under normal working conditions, in the summer and winter seasons.
Figure 3.
Boxplots of the results obtained for physical and chemical parameters obtained in hospitals H1 and H2, under normal working conditions, in the summer and winter seasons.

Figure 4.
Boxplots of the results obtained for microbiological parameters obtained in hospitals H1 and H2, under normal working conditions, in the summer and winter seasons.
Figure 4.
Boxplots of the results obtained for microbiological parameters obtained in hospitals H1 and H2, under normal working conditions, in the summer and winter seasons.

Figure 5.
Correlation between indoor fungi concentration and indoor relative humidity.

Figure 6.
Correlation between indoor bacteria concentration and indoor air CO2 concentration.


Table 1.
Global results of the indoor air quality (IAQ) characterization campaigns in the three healthcare units (in bold—value exceeding limits provided by legal acts).
Table 1.
Global results of the indoor air quality (IAQ) characterization campaigns in the three healthcare units (in bold—value exceeding limits provided by legal acts).
| Date | Health Unit | Season | Working Condition | Type of Room | Occupancy Range | CO2 (ppm) | T (°C) | Relative Humidity (%) | Bacteria in (CFU·m−3) Mean ± Std. | Bacteria out (CFU·m−3) Mean ± Std | Fungi in (CFU·m−3) Mean ± Std | Fungi out (CFU·m−3) Mean ± Std |
|---|---|---|---|---|---|---|---|---|---|---|---|---|
| 20 June 2017 | H1 | Summer | Normal | Consulting | 1–2 | 630 | 23.6 | 61.1 | 128 ± 11 | 73 ± 32 | 8 ± 11 | 515 ± 7 |
| Ward | 1–2 | 550 | 23.2 | 55.5 | 140 ± 42 | 65 ± 7 | ||||||
| 26 June 2017 | H2 | Summer | Normal | Consulting | 1–2 | 632 | 24.2 | 49.5 | 423 ± 11 | 63 ± 18 | 33 ± 11 | 28 ± 4 |
| Ward | 2–4 | 780 | 25.8 | 56.1 | 298 ± 4 | 193 ± 32 | 153 ± 11 | 200 ± 7 | ||||
| 30 June 2017 | H2 | Summer | Normal | Ward | 2–4 | NA | NA | NA | 240 ± 21 | 105 ± 35 | 208 ± 4 | 283 ± 46 |
| 26 July 2017 | H1 | Summer | Normal | Physioth. gym | 2–4 | 528 | 24.8 | 56.5 | 408 ± 18 | 253 ± 138 | 395 ± 0 | 823 ± 39 |
| Ward | 1–2 | 441 | 24.3 | 52.2 | 170 ± 14 | 190 ± 21 | ||||||
| Day-care room | 2–4 | 405 | 24.8 | 59.9 | 155 ± 7 | 65 ± 7 | ||||||
| 29 January 2018 | H1 | Winter | Normal | Consulting | 1–2 | 718 | 22.8 | 36.6 | 105 ± 57 | 40 ± 14 | 108 ± 32 | 173 ± 4 |
| Nebulizer room | 1–2 | 666 | 22.8 | 36.2 | 253 ± 39 | 103 ± 11 | ||||||
| Ward | 1–2 | 660 | 22.7 | 37.7 | 305 ± 0 | 13 ± 4 | ||||||
| 2 February 2018 | H2 | Winter | Normal | Respirat. Physioth. | 10–20 | 1080 | 23.3 | 31.6 | 305 ± 21 | 48 ± 4 | 50 ± 21 | 53 ± 11 |
| Nebulizer room | 1–2 | 698 | 23.4 | 27.4 | 123 ± 46 | 33 ± 18 | ||||||
| Consulting | 1–2 | 745 | 23.8 | 27.8 | 410 ± 49 | 5 ± 7 | ||||||
| Ward | 2–4 | 1039 | 23.4 | 31.9 | 230 ± 42 | 108 ± 32 | 23 ± 4 | 55 ± 35 | ||||
| Treatment room | 1–2 | 709 | 24.1 | 30.7 | 240 ± 63 | 75 ± 42 | 45 ± 0 | 98 ± 11 | ||||
| Emergency | Waiting room | 10–20 | 1140 | 21.7 | 37.2 | 190 ± 7 | 40 ± 7 | |||||
| Nebulizer room | 10–20 | 698 | 23.0 | 29.3 | 85 ± 14 | 13 ± 4 | ||||||
| Treatment room | 1–2 | 672 | 24.0 | 27.8 | 150 ± 42 | 5 ± 0 | ||||||
| Treatment room | 1–2 | 590 | 23.0 | 26.9 | 93 ± 25 | 18 ± 11 | ||||||
| Consulting | 1–2 | 620 | 23.9 | 25.8 | 138 ± 4 | 5 ± 0 | ||||||
| 2 March 2018 | HC | Winter | Normal | Treatment room | 1–2 | 856 | 19.5 | 52.7 | 167 | 413 | 247 | 340 |
| Consulting | 1–2 | 984 | 21.0 | 51.0 | 133 | 200 | ||||||
| Waiting room | 5–10 | 863 | 20.2 | 50.9 | 360 | 193 | ||||||
| 5 March 2018 | HC | Winter | Emergency | Treatment room | 1–2 | 930 | 20.1 | 52.1 | 220 | 50 | 50 | 50 |
| Consulting | 1–2 | 1059 | 20.5 | 51.4 | 585 | 140 | ||||||
| Waiting room | 10–20 | 1212 | 19.3 | 54.4 | 295 | 75 | ||||||
| 17 March 2018 | HC | Winter | Emergency | Treatment room | 1–2 | 1497 | 22.1 | 54.5 | 500 | 140 | 207 | 187 |
| Waiting room | 10–20 | 1860 | 19.3 | 65.5 | 487 | 140 | ||||||
| Consulting | 1–2 | 1157 | 21.3 | 54.3 | NA | NA |
In—indoor air; out—outdoor air; std—standard deviation; NA—not available; Physioth. Gym—Physiotherapy Gymnasium; Respirat. Physioth.—Respiratory Physiotherapy room.
Table 2.
Results of the statistical tests used to compare the analyzed parameters in the three healthcare units in the winter season.
Table 2.
Results of the statistical tests used to compare the analyzed parameters in the three healthcare units in the winter season.
| CO2 | Temperature | Relative Humidity | Bacteria in | Bacteria in-out | Fungi in | Fungi in-out | |||
|---|---|---|---|---|---|---|---|---|---|
| Health Unit * Working Condition | Two-way ANOVA p-value a | 0.040 | 0.390 | 0.239 | 0.001 | 0.000 | 0.016 | 0.000 | |
| Normal | One-way ANOVA p-value a/Partial Eta Squared | 0.179/0.349 | 0.000/0.931 | 0.000/0.976 | 0.705/0.043 | 0.000/0.659 | 0.000/0.812 | 0.001/0.609 | |
| H1–H2 | Post-hoc Tuckey p-value a | 0.078 | 0.001 | 0.959 | 0.057 | 0.004 | |||
| H1–HC | 0.000 | 0.000 | 0.001 | 0.000 | 0.514 | ||||
| H2–HC | 0.000 | 0.000 | 0.000 | 0.000 | 0.002 | ||||
| Emergency | H2–HC | One-way ANOVA p-value a/Partial Eta Squared | 0.014/0.507 | 0.002/0.671 | 0.000/0.896 | 0.000/0.711 | 0.000/0.715 | 0.000/0.688 | 0.000/0.729 |
| H2 | Normal–Emergency | One-way ANOVA p-value a/Partial Eta Squared | 0.426/0.081 | 0.308/0.129 | 0.836/0.006 | 0.002/0.419 | 0.002/0.420 | 0.066/0.176 | 0.000/0.637 |
| HC | Normal–Emergency | 0.102/0.336 | 0.790/0.011 | 0.255/0.180 | 0.109/0.371 | 0.002/0.829 | 0.058/0.477 | 0.004/0.772 | |
a In bold, p-values lower than 0.05.
Table 3.
T-test values for summer and winter IAQ parameters considering data from both hospitals operating under normal working conditions.
Table 3.
T-test values for summer and winter IAQ parameters considering data from both hospitals operating under normal working conditions.
| Parameter | t | p-Value (Two-Tail) a |
|---|---|---|
| CO2 (ppm) | −2.84 | 0.014 |
| Temperature (°C) | 3.08 | 0.009 |
| Relative Humidity (%) | 11.3 | 0.000 |
| Bacteria in (CFU·m−3) | −0.0325 | 0.974 |
| Bacteria in-out (CFU·m−3) | −2.20 | 0.036 |
| Fungi in (CFU·m−3) | 2.86 | 0.010 |
| Fungi in-out (CFU·m−3) | −4.34 | 0.001 |
a In bold, p-values lower than 0.05.
© 2018 by the authors. Licensee MDPI, Basel, Switzerland. This article is an open access article distributed under the terms and conditions of the Creative Commons Attribution (CC BY) license (http://creativecommons.org/licenses/by/4.0/).
Share and Cite
MDPI and ACS Style
Fonseca, A.; Abreu, I.; Guerreiro, M.J.; Abreu, C.; Silva, R.; Barros, N. Indoor Air Quality and Sustainability Management—Case Study in Three Portuguese Healthcare Units. Sustainability 2019, 11, 101. https://doi.org/10.3390/su11010101
AMA Style
Fonseca A, Abreu I, Guerreiro MJ, Abreu C, Silva R, Barros N. Indoor Air Quality and Sustainability Management—Case Study in Three Portuguese Healthcare Units. Sustainability. 2019; 11(1):101. https://doi.org/10.3390/su11010101
Chicago/Turabian StyleFonseca, Ana, Isabel Abreu, Maria João Guerreiro, Cristina Abreu, Ricardo Silva, and Nelson Barros. 2019. "Indoor Air Quality and Sustainability Management—Case Study in Three Portuguese Healthcare Units" Sustainability 11, no. 1: 101. https://doi.org/10.3390/su11010101
Note that from the first issue of 2016, this journal uses article numbers instead of page numbers. See further details here.