Article

Markov-Chain Simulation-Based Analysis of Human Resource Structure: How Staff Deployment and Staffing Affect Sustainable Human Resource Strategy

by
Tamás Bányai
1,*,
Christian Landschützer
2 and
Ágota Bányai
1
1
Institute of Logistics, University of Miskolc, 3515 Miskolc, Hungary
2
Institute of Logistics Engineering, Graz University of Technology, 8010 Graz, Austria
*
Author to whom correspondence should be addressed.
Sustainability 2018, 10(10), 3692; https://doi.org/10.3390/su10103692
Submission received: 8 September 2018 / Revised: 9 October 2018 / Accepted: 11 October 2018 / Published: 15 October 2018
(This article belongs to the Special Issue Sustainable Human Resource Management)

Abstract

:
Manufacturing and service processes are composed of several elements: Technical, financial, logistics, information and human resources. Staff deployment and staffing is an essential problem in the human resource management domain because the structure of employees would be continuously in an optimal relationship to the jobs to be performed. This paper proposes a conceptual model for the analysis of human resource deployment processes. After a systematic literature review, it was found that algorithms are important tools for the design and control of human resource problems since a wide range of models determines an optimization problem. According to that, the main focus of this research is the modelling and analysis of human resource deployment processes of manufacturing companies using Markov-chain mathematics, also taking into account the absorbing phenomena of employees’ promotion. The main contribution of this article includes the model framework of Markov-chain simulation of a human resource deployment problem; the mathematical description of different human resource deployment strategies with subdiagonal and superdiagonal promotion matrices; the computational results of the described model with different datasets and scenarios. In the case of a given human resource strategy, the Markovian human resource deployment process of a company was analyzed. The analyzed model was the HR deployment of assembly line operators in a multinational company, including six levels of promotion. The results of the scenario analysis show that promotion and recruitment rates have a great impact on the future employees’ structure.

1. Introduction

Each factory, manufacturing plant and service company needs a flexible and reliable resource supply to serve production and service processes efficiently. Manufacturing systems are composed of several elements: Technical, financial, logistics, information and human resources. Staff deployment is an essential problem in human resource management domain because the structure of employees and its labor costs would be continuously in an optimal relation to the jobs to be performed [1]. Human resource management can be described as a staffing problem, where the future needs and present situation of the organization have to be taken into consideration. However, the financial aspects have priority within the frame of a human resource deployment process, but the strategy has to be taken into consideration with other important policies, like respect of will, the significance of abilities and stable employment. Enterprises have to conduct necessary training and knowledge sharing activities for all the job grades in its in-house ranking system. What factors affect employees’ decision to stay with or leave a company? Researchers have long delved into these questions and have put forth a huge number of scenarios to describe the relationship between human resource strategy and employee turnover. There are different programs to strengthen the relationship between employees and employers. The human resource strategy can be described and modified by the aid of the application of programs [2], like BambooHR, Zugata, Teamtailor or Zoho recruit. In the case of a given human resource strategy, it is possible to analyze the Markovian human resource deployment process of a company, and future development plans can be worked out to optimize the required human resource structure. There are different areas, where human resource management can improve the sustainability of a company: Leadership development, training and development, change management, collaboration and teamwork, talent management, diversity and multiculturalism, ethics and governance, creating and inculcating values, health and safety, workforce engagement [3].
The main goal of this research work is to develop a methodology, which makes it possible to analyze the impact of factors of different human resource strategies on the dynamic and structure of human resources. As the literature review shows, previous studies focused mainly on the optimization of human resource structure on conventional deterministic environment. However, studies on the human resource management on stochastic environment have barely been addressed.
This paper is organized as follows. Section 2 presents a literature review, which systematically summarizes the research background of human resource management and Markov-chain based optimization. Section 3 describes the model framework of Markov-chain simulation of human resource analysis of employees’ deployment strategies. Section 4 demonstrates the analysis of numerical scenarios of the described Markov-chain simulation with different datasets, where results and outcomings are also illustrated. Based on this evaluation, it appears that the impact of the human resource development program on both short-term and long-term objectives can be clearly determined that will be helpful for decision making in the development of human resource strategies. Conclusions and future research directions are discussed in the last section.

2. Literature Review

Since our study embraces two related research streams, namely human resource management and Markov-chain models, we provide a brief review on each stream before elaborating on the model. Within the frame of this chapter, we are focusing on the previous research results. Our used methodology of a structured literature review includes four important aspects [4]: (1) Search for articles in databases and other sources, like Scopus; (2) reduce the number of articles by reading the abstract and identifying the main topic; (3) define a methodology to analyze the chosen articles; (4) describe the main scientific results and identify the scientific gaps and bottlenecks.

2.1. Human Resources in Production and Logistics

Firstly, the relevant terms were defined. It is a crucial phase of the review because there are excellent review articles in the field of human resource optimization and Markov-chain modelling and we did not want to produce an almost similar review, but we applied the presented methodology in reference [5]. Based on the topic of our research the following keywords were used to search in the Scopus database: “human resource” AND “optimization” OR “manufacturing” OR “logistics.” Initially, 138 articles were identified. This list was reduced to 47 articles selecting journal articles only. Our search was conducted in June 2018; therefore, new articles may have been published since then. The reduced articles can be classified depending on the subject area. Figure 1 demonstrates the classification of these 47 articles considering seven subject areas. This classification shows the majority are engineering, business and computer sciences.
As Figure 2 shows, the human resource optimization in manufacturing and logistics domain has been researched in the past years. The first article in this field was published in 1990 in the field of production planning in flexible manufacturing systems [6] and it was focusing on the impact of the variable processing time of operators. The number of published papers has been increased in the last years; it shows the importance of this research field.
The distribution of the most frequently used keywords, except keywords used to search in Scopus, is depicted in Figure 3. As the keywords show, the human resource optimization has a great impact on competition (e.g., in manufacturing and manufacturing related domains). A wide range of solution methods is based on decision-making tools and heuristic algorithms.
We added five other articles selected through separated search, so the final list for classification and evaluation from the point of view of scientific results includes 52 articles related to human resource optimization.

2.2. State of the Art in Human Resource Research

The increased complexity of industrial and service processes led to the application of sophisticated solution methods and procedures to optimize the related human resource management problems. Heuristic optimization methods are used to solve NP-hard problems of human resource optimization [7]. The application of scheduling navigation system for optimization of mold-manufacturing scheduling problems [8] is based on genetic algorithm (GA).
Evolutionary heuristic methods make it possible to model dynamic integrated forward/reverse logistics network for 3rd party logistics (3PL) providers, where GA optimizes the network plan to help in the determination of resource plans for capacities of technical and human resources [9]. Ant colony based heuristics support open shop scheduling problems with a multi-skills resource constraint [10] and the solution of operating room surgery scheduling [11]. Scheduling of temporary and skilled-workers in dynamic cellular manufacturing systems can be solved by hybrid algorithms [12]. Bi-criteria and multi-criteria algorithms are also used to optimize employees’ structure, like the allocation problem of cross-trained workers from the point of view of operational and human resource aspects [13]. Simulation-based methods support the optimization of online assignment of multi-skilled workers in manufacturing systems, where unpredictable events over time can be taken into consideration [14]. Fuzzy models are used to optimize the transportation of relief materials and human resources from distribution centers to delivery points, where total cost and time window of operations are taken into consideration as an objective function of the bi-criteria transportation problem [15]. Fuzzy mathematics is suitable for ERP system selection [16]. The management and operational success requirements of the 3PL industry include the professional capability of service personnel and the operational process optimization. The fuzzy quality function deployment (FQFD) approach can support the identification of these requirements for improving the management and operational success [17]. Artificial intelligence solutions, especially expert systems, are also used in the human resource management domain to support the adequate selection and appointment of jobs applicants and employees from the point of view job rotation, recruitment, training, evaluation and job classification.
The 3rd and 4th party logistics (3PL and 4PL) service is an area of research which has seen remarkable growth over the last few years. Researchers investigated the advantages of optimized human resource management focusing on supply chain networks [18,19], in-plant transportation processes in logistics facilities [20] and general logistics related operation [21]. The human resource optimization has a great impact on different logistics related design problems, like scheduling and routing. The routing problem means departure time optimization with a better assignment of human resources to required demands [22]. The scheduling related human resource optimization problems are focusing on the following fields: Assembly line balancing [23], human resources scheduling to improve the product quality according to exhaustion limit [24], scheduling and staffing of IT projects [25]. One of the first studies linking scheduling problem to the operators of machines described pseudo polynomial algorithms for two-machine and three-machine problems [26].
It remains a key challenge for companies to develop networking strategies for their technological and logistic operations required to fulfill customers’ orders. In recent years, there have been many studies focusing on solving human resource domain of networking problems, like the analysis of the network structure of value activity in manufacturing clusters from the point of view value creation of human resources [27], optimization methodology to design networks of manufacturing facilities taking human resource competencies into account [28] and solving time-varying resource-constrained scheduling problems [29,30].
There are different fields of human resource optimization, where the technological environment has a special impact on human resource strategies, like container terminals [31], coal mines [32], mold-manufacturing [33] or health care [34].
The globalization of production and service processes shows that enterprises have to change their human resource strategies. Case studies explain the importance of human resource optimization in almost all fields of economy all over the world: City e-commerce competitiveness evaluation in 32 cities of China describes the importance of economic, logistics, information, business, innovation and human resources [35], development of a human resource competency enhancement model of physical infrastructure and asset management in Taiwan [36] and resource allocation in worldwide sourcing planning [37].
In the last decades, human resource management practices have been developed, trying to integrate economical, ecological and quality related aspects. In this context, the principles of human resource management underline the importance of financial optimization based on minimum cost flow network [25], safety and ergonomics [38], quality of work life for staff and sustainability [39,40], sociotechnical relations [41] and the quality of products, services and processes [42]. The quality function deployment technique can be used to maximize overall customer satisfaction in product design, while human resource has to be taken into consideration [43]. Human resource management optimization is important not for multinational companies [44] but also for small and medium-sizes enterprises (SMEs) [45].
The design, development, re-engineering, and operation of production and service processes are based on the enterprise resource planning (ERP) system. The efficiency of ERP systems can be increased by the application of special tools and methods, like total quality; six sigma, kaizen, lean, production smoothing, production smoothing and design for manufacturability. These methods can support the human resource decision as an integrated part of the enterprise strategy [46].
Human resource management related studies include the subprocesses of the whole supply chain and hyperconnected logistic systems from product design [47] and product innovation [48], through manufacturing and assembly [49] to distribution [50], but we can find papers describing integrated approaches [51,52]. Integrated approaches are important because bottlenecks have a great impact on the efficiency of the whole supply chain [53]. Hyperconnected logistics and manufacturing systems have to train and cross-train more and more employees. The related decisions are often made in a qualitative fashion by human resource or personnel managers, especially in the field of flexible workforce development [54]. The linkages between personality and knowledge sharing behaviour in the workplace play an important role of this human resource deployment [55], while the specificity of knowledge management becomes more and more important in the different field of production and services [56].

2.3. Markov-Chain Modelling

The following keywords were used to search in the Scopus database: “Markov-chain” AND “optimization.” The initially found documents were limited to the journal articles in English in the field of engineering and economic sciences. After reading the abstract, 17 articles were identified.
Markov-chain is suitable to model a wide range of practical problems and applications in the field of informatics and telecommunication, electrical engineering, economics and engineering. Novel cloud data center resource scheduling optimization model was worked out based on the integration of kernel principal component analysis (KPCA) and Markov-chain modelling [57]. Electromagnetic topology optimization can be supported by a large-step Markov-chain (LSMC) based novel local optimization algorithm [58]. Markov-chain can be used to optimize the dual-index policy in the field of stochastic inventory control, where the results are generalizable to accommodate stochastic regular lead times and provide an approximate evaluation method [59].
Markov-chain is also used to optimize constrained problems both nonstationary [60] and stochastic systems [61,62], where radial basis function neural network (RBFNN) supports the optimization of stochastic constrained dynamic systems with embedded Markov-chain.
Algorithms including Markov models can solve multi-objective optimization problems [63] with non-homogeneous state space [64,65] in a dynamic environment [66]. Simulation-based optimization algorithms for Markov-chains help to maximize the average reward of a parameterized Markov-chain [67,68]. Markov-chain models can be combined with Monte Carlo algorithms to solve global stochastic optimization problems defined over continuous domains [69]. An important scientific issue is the control of Markovian processes. Optimization-oriented algorithms can support the adaptive control of Markov-chains [70]. However, heuristic and metaheuristic algorithms are suitable tools for the optimization of objects and systems, especially in the case of NP-hard problems, but the comparison of them from the point of view of convergence and required computation time is essential.
Optimization problems can be also solved with algorithms based on Markov-chain modelling: Memory-based evolutionary approach was intended for applying the Bayesian optimization algorithm (BOA) in dynamic environments, where the run of BOA is modelled as the movements in a Markov-chain [71]; population-based heuristics, like particle swarm optimization (PSO) algorithm can be combined with Markov-chain analysis [72]; Markov-chain algorithm can be optimized to control the convergence [68]; group method of data handling (GMDH) optimization is Markovian.

2.4. Consequences of Literature Review

More than 50% of the articles were published in the last five years. This result indicates the scientific potential of this research field. The articles that addressed the optimization of human resource structure are focusing on conventional static and deterministic environment, but none of the articles aimed to identify the optimization aspects of dynamic, stochastic human resource deployment problems. Therefore, deployment and recruitment problems of human resource strategies still need more attention and research. It was found that algorithms are important tools for the design and control of human resource problems since a wide range of models determines an optimization problem. According to that, the main focus of this research is the modelling and analysis of human resource deployment processes of manufacturing companies using Markov-chain mathematics, also taking into account the absorbing phenomena of employees’ promotion.
As a consequence, the main contributions of this article are the following: (1) The model framework of Markov-chain simulation of the human resource deployment problem; (2) mathematical description of different human resource deployment strategies with subdiagonal and superdiagonal promotion matrices; (3) computational results of the described model with various datasets and scenarios.

3. Materials and Methods

In this section, we present the basic ideas which allow us to model and simulate the deployment of human resources through a time window based on absorbing Markov-chain simulation in the case of superdiagonal, subdiagonal and standard promotion matrices.
The promotion matrix describes the promotion possibilities of employees. There are three different strategies in a hierarchical HR promotion system. In the case of the first strategy employees can promote to the next level of employment; therefore, the promotion matrix is superdiagonal:
P = [ p i , j ]   w h e r e   { p i , j 0 j = i     j = i + 1 p i , j = 0 j i     j i + 1   i , j = 1 m .
In the second case, employees can promote to the next level, but there are also backtrack possibilities to the preceding level. In this case, the promotion matrix consists of diagonal, superdiagonal and subdiagonal elements. Diagonal elements represent that employees remain in the same position; superdiagonal elements describe the possibilities of promoting to the next employment level, while subdiagonal elements show the options of backtrack to the preceding level:
P = [ p i , j ]   w h e r e   { p i , j 0 j = i     j = i ± 1 p i , j = 0 j i     j i ± 1   i , j = 1 m .
In the third case, employees can promote and backtrack more levels in the hierarchical structure of positions. Equation (3) shows the structures of superdiagonal and subdiagonal promotion matrices in the case of three possible levels.
P s u p d i a g = [ p 1 , 1 0 p 1 , 2 0 0 0 p 2 , 2 0 p 2 , 3 0 0 0 p 3 , 3 0 ] P s u b d i a g = [ p 1 , 1 0 0 0 p 2 , 1 0 p 2 , 2 0 0 0 p 3 , 2 0 p 3 , 3 0 ] .
In this approach, we can use either absorbing or non-absorbing promotion matrices depending on the promotion strategy. If employees can departure from an employment level and leave the system, then we are using absorbing promotion matrix, and the model can be described as an absorbing Markov-chain (AMC). In the case of absorbing Markov-chain, we can define an additional promotion matrix describing absorbing states of the chain:
A = [ a 1 , 1 a 2 , 1 a 3 , 1     a 1 , 2 a 2 , 2 a 3 , 2     a 1 , 3 a 2 , 3 a 3 , 3 ] ,
where
j = 1 m a i , j = 1 j = 1 m p i , j j .
The most important factors of a human resource strategy are the following: Legal requirement, employee engagement, career advancement programs, corporate image and performance management system [73]. We can describe these factors and their sub-factors through the aid of matrices representing the opportunities of their occurrence. As an example, Table 1 depicts an extended promotion matrix including transitive and absorbing components and their stochastic variables. The above-mentioned factors influence the promotion and deployment of human resources. This process is described with the extended promotion matrix. If there is a difference between simulated and planned HR number and structure, we can modify our HR strategy. This change in the HR strategy leads to changes in the extended promotion matrix, and the Markov-chain based simulation gives the modified number and structure of human resources.
For example, if the simulated number of supervisors is smaller than the planned, then the promotion possibility of technicians to become a supervisor must be increased.
The employer structure E = ( e k , i ) describes the number of employees in the kth iteration of Markov-chain simulation. The recruitment rate r ¯ = ( r i ) defines the possibilities of recruiting a given level of employers, where
i = 1 m r i = 1 .
The recruitment rate can be taken into consideration either as a vector or as a matrix. If the recruitment rate is given as a vector, then it is constant in the time window of simulation. If we define the recruitment rate as a matrix, we can take into consideration the dynamic changes through the Markov-chain simulation, where the recruitment rate can be calculated as follows:
R = [ r k , i ] ,   w h e r e   { r k , i = r i i = 1 r k , i = e k 1 , i i = 1 m e k 1 , i 1 < i m   k = 1 n
and
i = 1 m r k , i = 1   k .
Table 2 demonstrates the recruitment rate matrix. The first row shows the initial recruitment rate in the case of four different position. For example, the 0.25 value in the first line defines that 25% of the recruited persons is suitable to hold down the job as technician. The following rows describe the dynamic characteristics of the recruitment rate, which means that the recruitment rates can be changed through the simulation time window.
The planned HR structure of employers p ¯ = ( p i ) is based on the HR strategy of the company and consists of the planned number of employees for each level. The deployment of the total number of employees can be calculated as a linear function as follows:
p k d e p = i = 1 m e 1 i + ( k 1 ) i = 1 m p i i = 1 m e 1 , i n 1 , 1 k n .
For the difference between the planned and simulated number of employees in the kth iteration we write
e k d i f = i = 1 m e k , i p k d e p .
Now the difference between the planned and simulated number of employees at the end of the simulation will be
e n d i f = p n d e p i = 1 m e n , i .
The number of employees to be recruited depends on two different parameters. The first one is the required deployment rate to have reached the planned number and structure of employees until the end of the time window. The number of employees to be recruited in the kth stage of the time window can be calculated as follows:
p k d e p = p k d e p p k 1 d e p , 1 k n .
For the other parameter, that is the number of employees left the system, we write
L = [ l k , i ] , w h e r e   { l k , i = e k 1 , i j = 1 m a i , j 2 k n l k , i = 0 k = 1   i = 1 m .
The number of employees to be recruited in the kth time window can be calculated as follows:
e k = i = 1 m l k , i + p k d e p w h e r e 1 k n .
The structure of employees calculated with the recruitment rate in the kth time window is posed as follows:
e k , i * = e k r k , i w h e r e 1 k n .
Within the frame of the next section, two scenarios demonstrate the practical usability of the above described mathematical model.

4. Results

The above described Markov-chain model makes it possible to analyze the deployment of human resource through time, depending on a wide range of parameters influencing the deployment process, like recruitment rate, the structure of promotion matrix, planned structure size of human resources or relationship among transitions and absorbing elements of promotion matrix. Within the frame of this section, two scenarios will be analyzed.

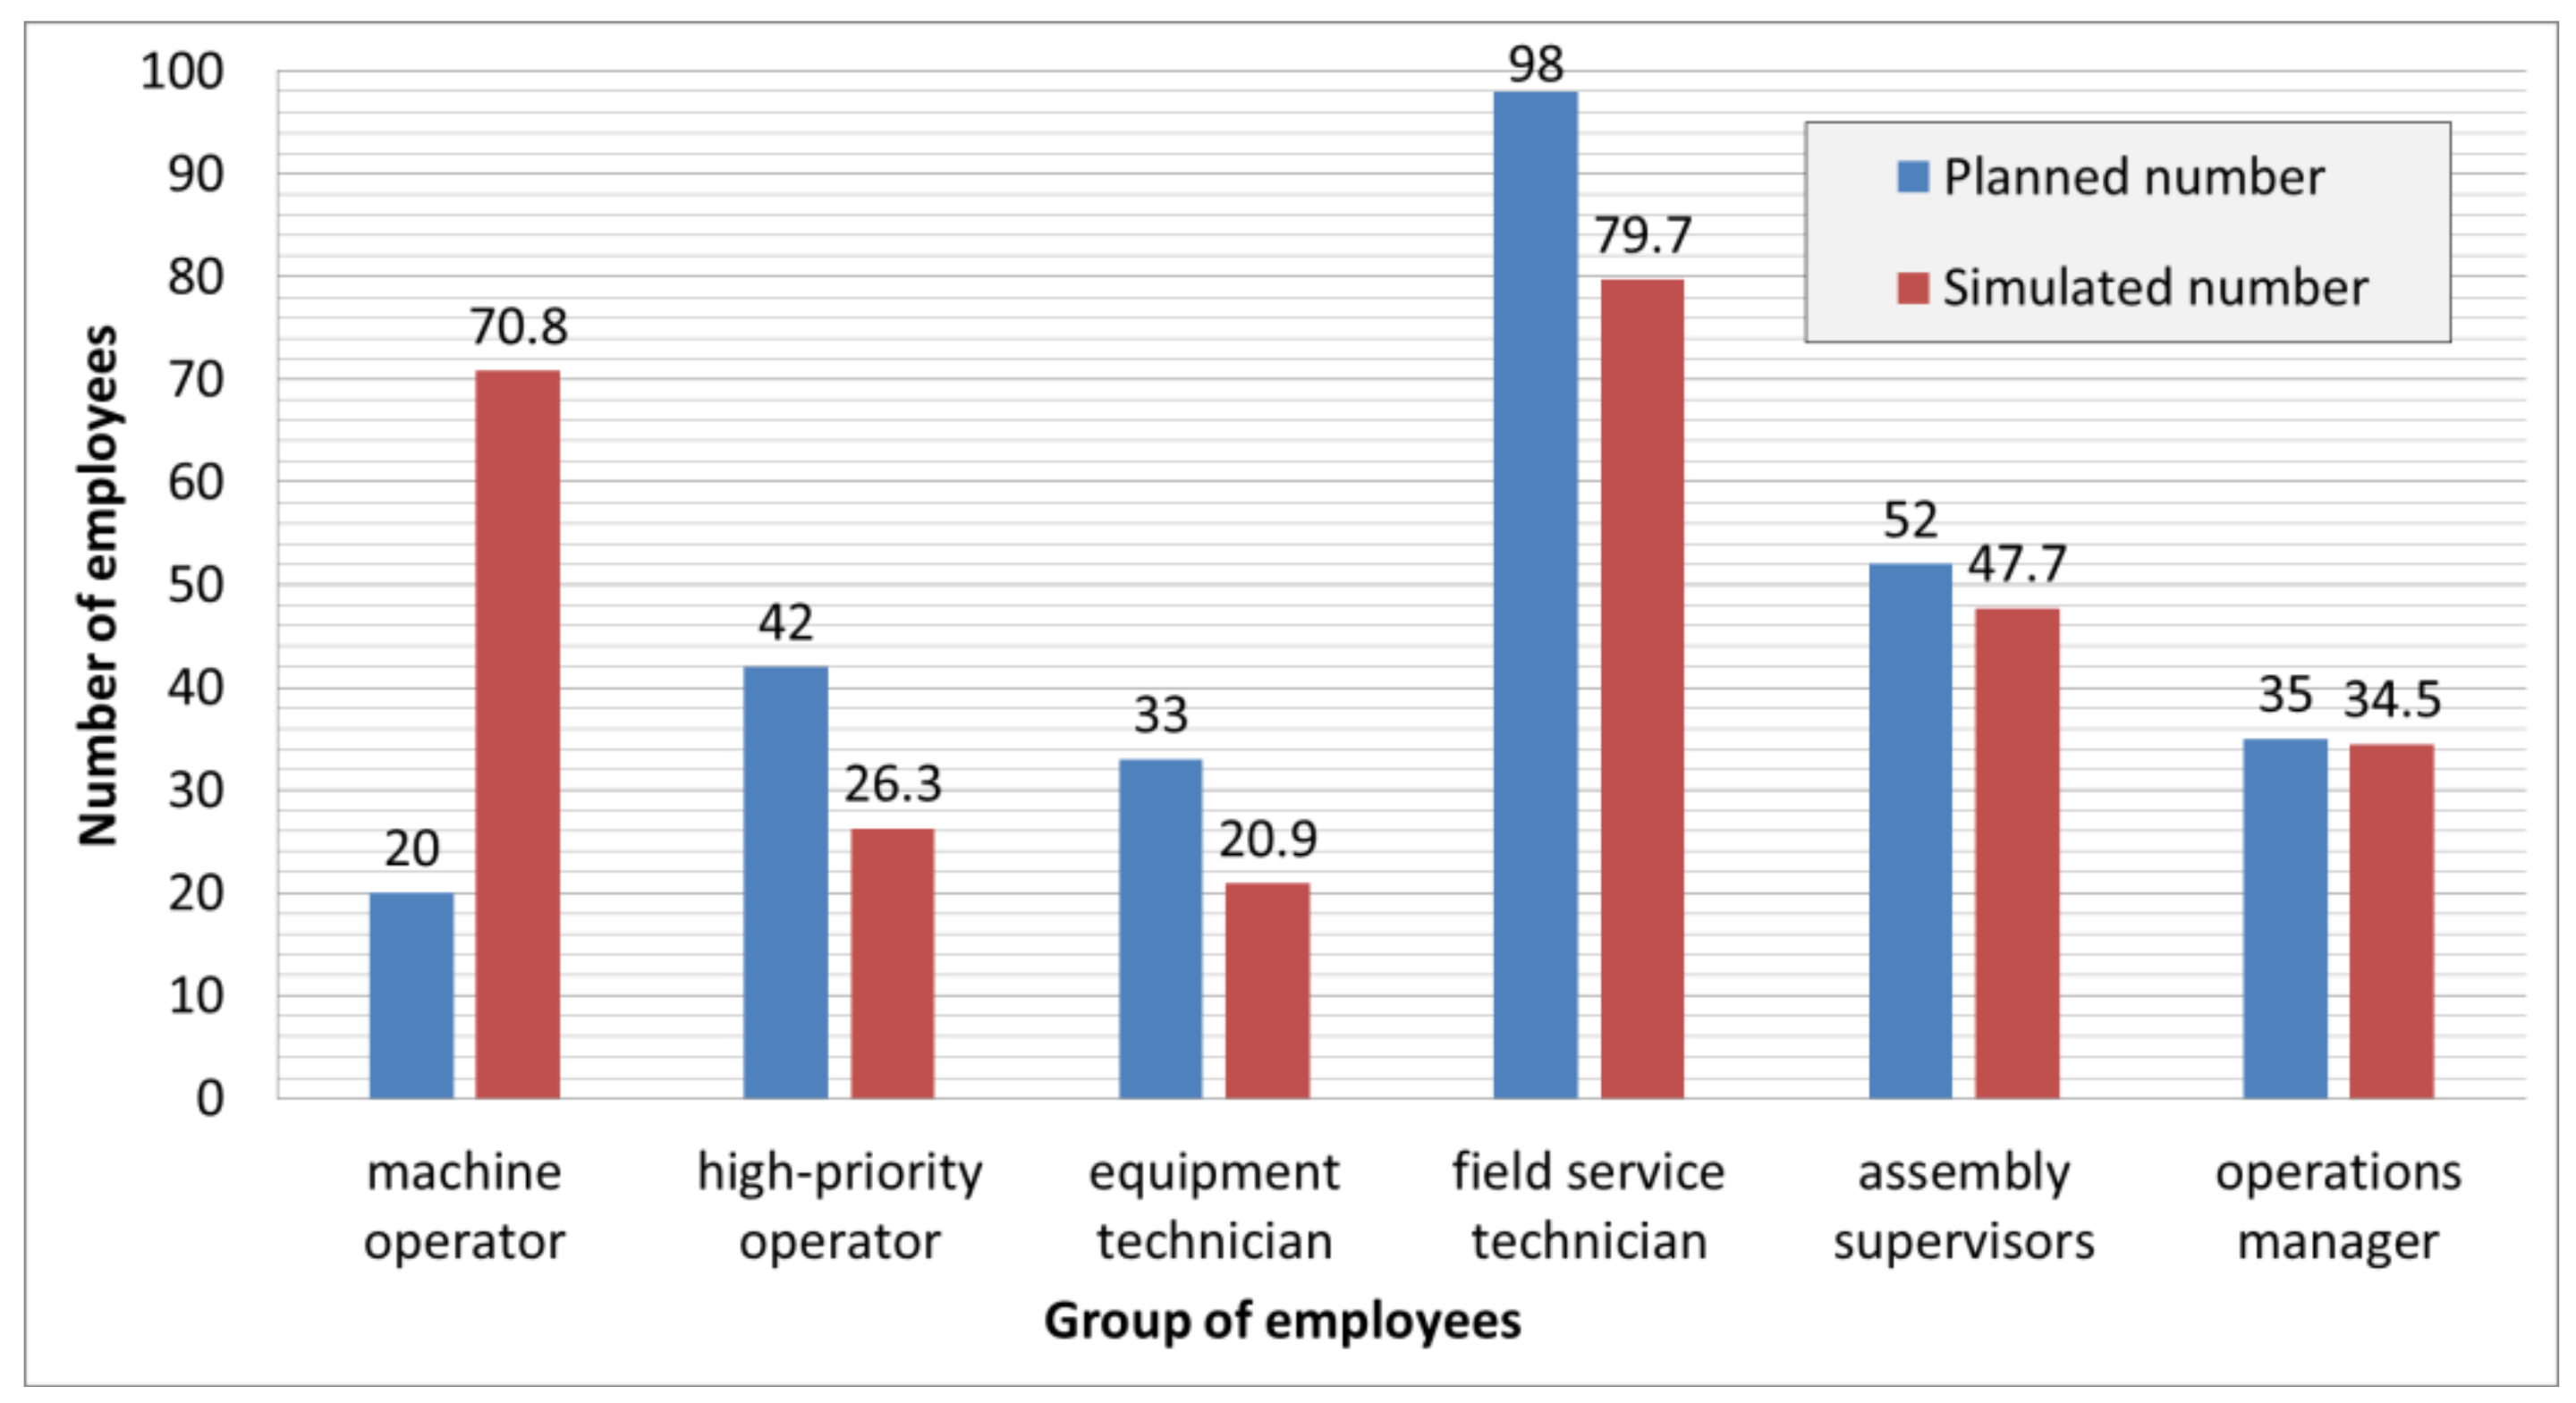
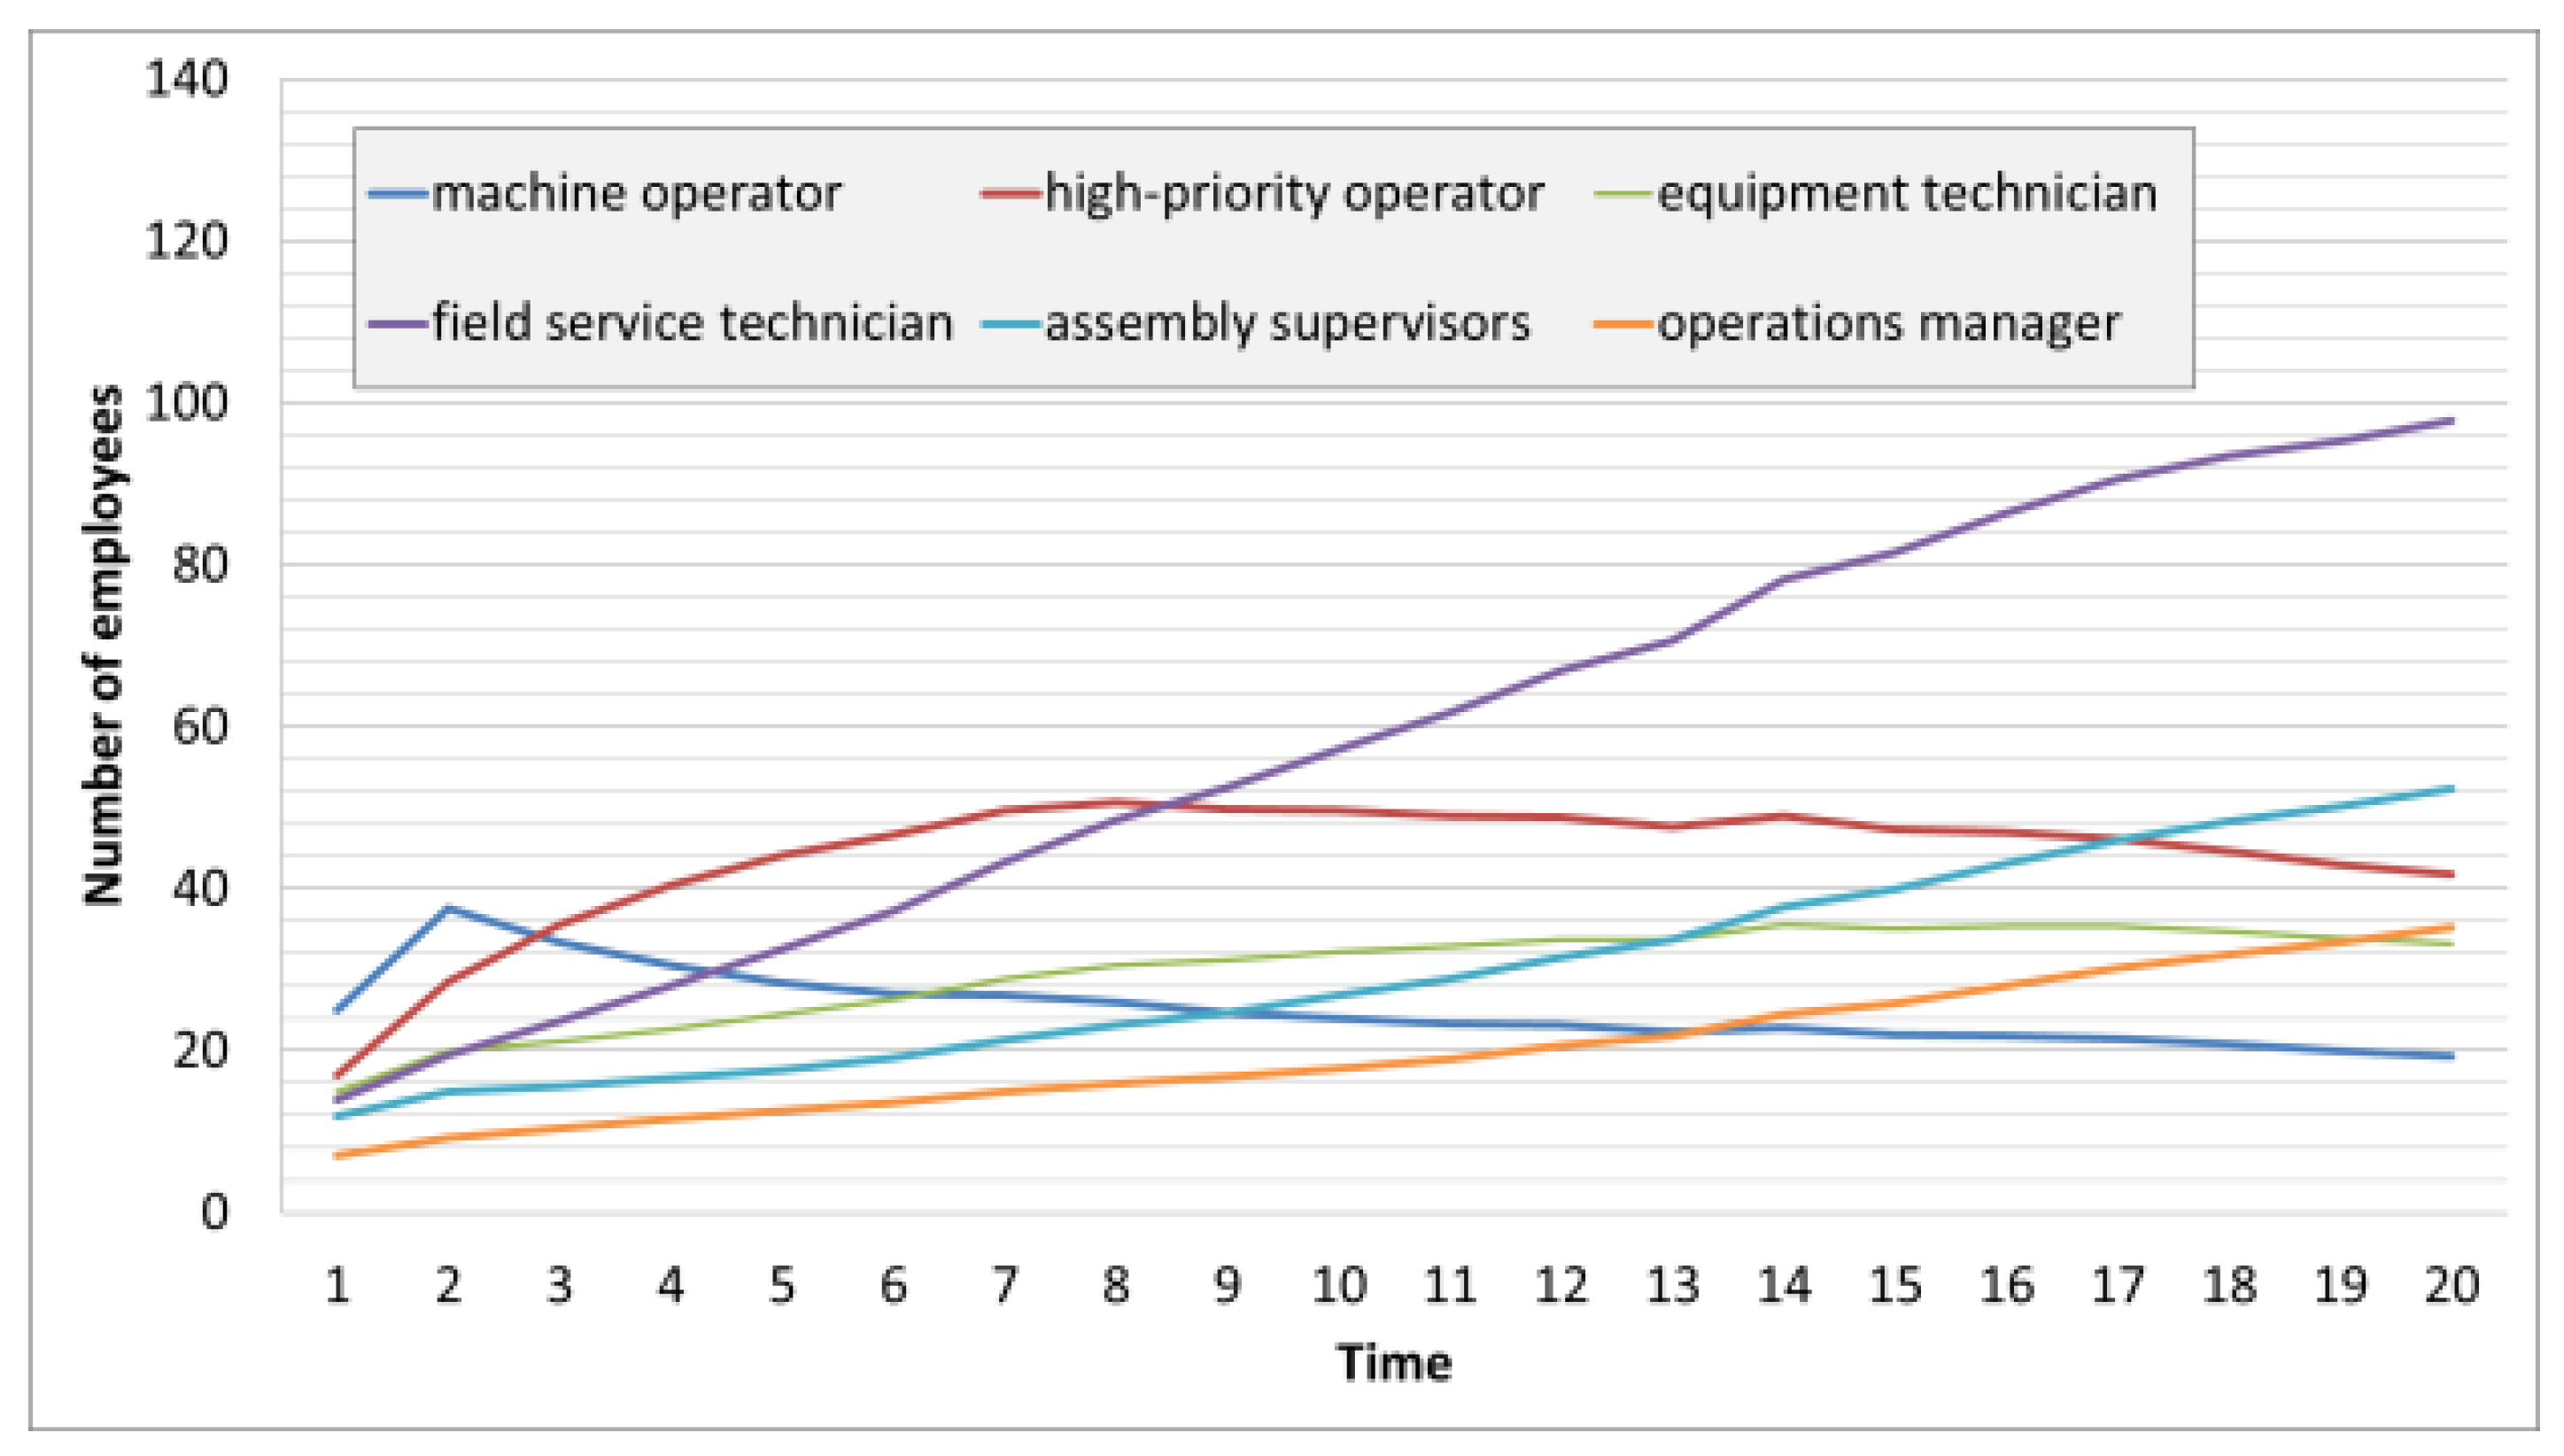
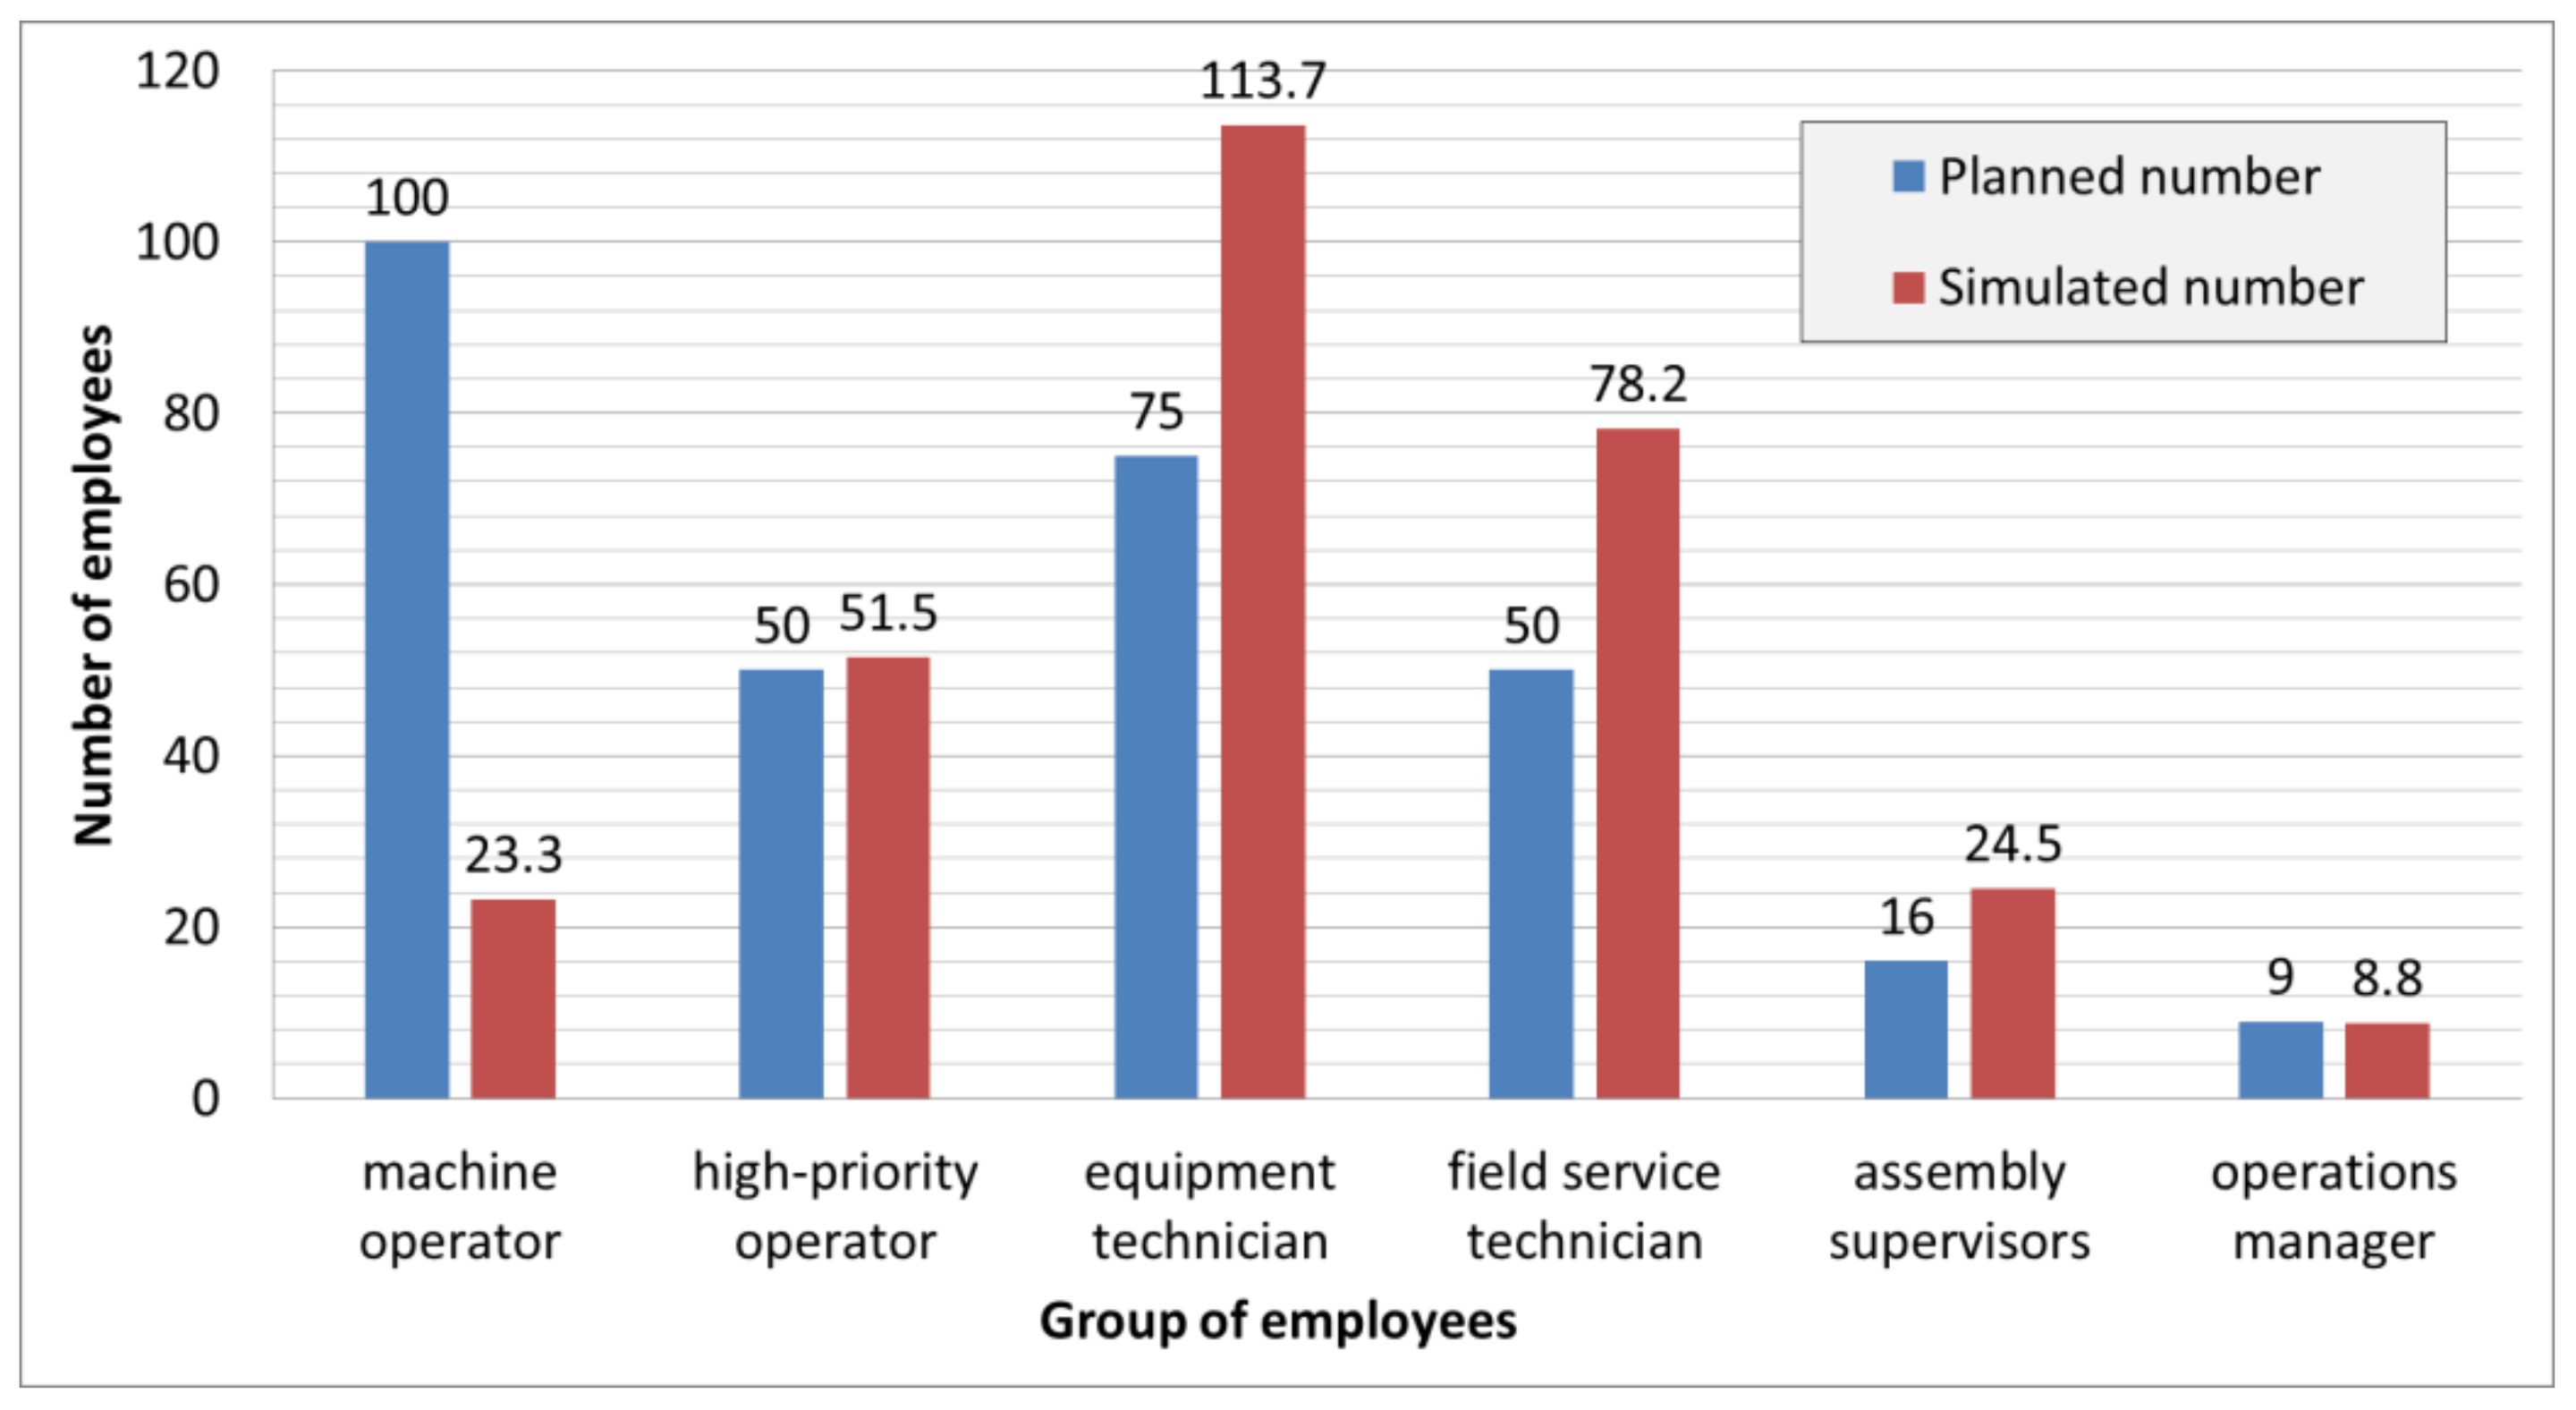
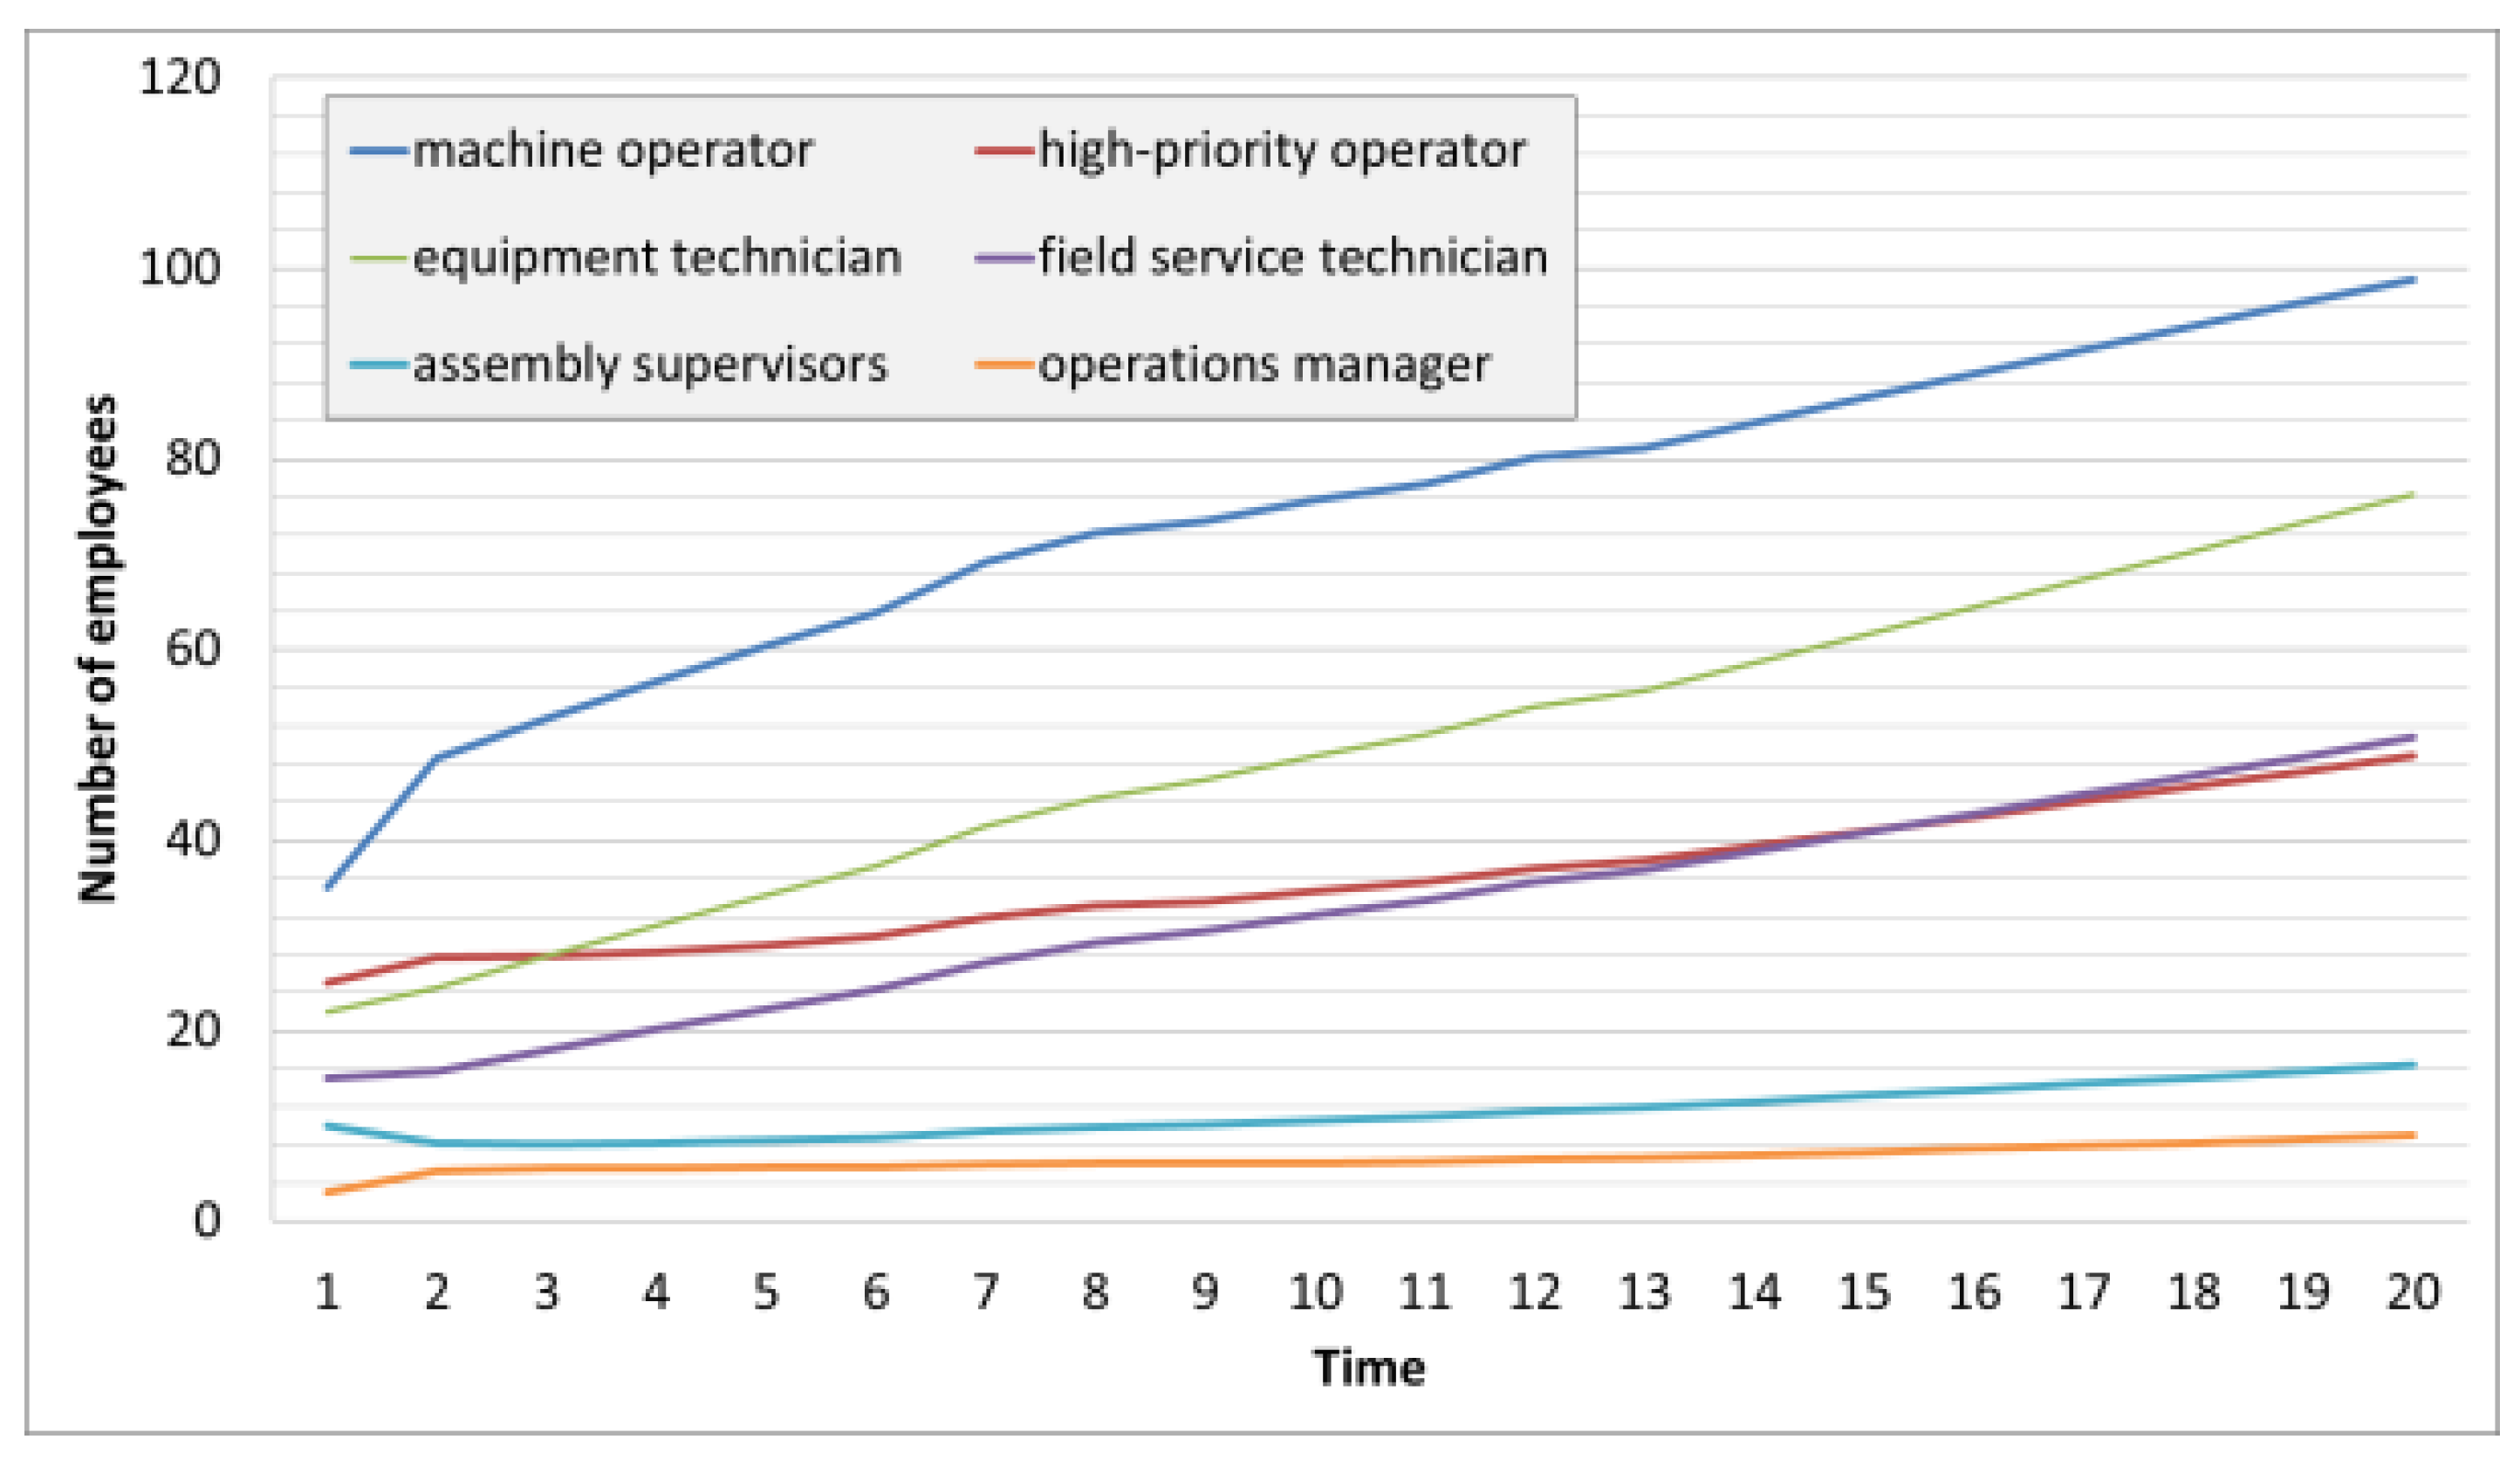
4.1. Scenario 1: Superdiagonal Promotion Matrix with Dynamic Recruitment Rate

Scenario 1 describes a general model of the HR deployment of assembly line operators in a multinational company. There are six levels of promotion: Machine operator, high-priority operator, equipment technician, field service technician, assembly supervisor, operations manager. Employees can promote only to the next level of employment; therefore, the promotion matrix can be described as a superdiagonal matrix (Equation (16) P matrix), where, e.g., p 4 , 4 = 0.80 means that there is an 80% of probability that a field service technician will not be promoted within the time window. Additionally, the p 4 , 5 = 0.10 means, that there is a 10% of probability that a field service technician will be promoted to an assembly supervisor. The elements of this matrix describe transitive states of the deployment process. The employees leave the firm for many reasons, like unchallenged by the work, no path to continued growth, financial reasons and lack of recognition of performance. The additional promotion matrix (Equation (16) A matrix) consists of the absorbing elements of this scenario describing the process and reasons why employees quit their job:
P = [ 0.80 0.05 0.00 0.00 0.70 0.10 0.00 0.00 0.70 0.00 0.00 0.00 0.00 0.00 0.00 0.20 0.00 0.00 0.00 0.00 0.00 0.00 0.00 0.00 0.00 0.00 0.00 0.80 0.10 0.00 0.00 0.70 0.20 0.00 0.00 0.60 ] A = [ 0.050 0.025 0.020 0.020 0.025 0.025 0.025 0.050 0.030 0.030 0.050 0.000 0.050 0.000 0.000 0.060 0.120 0.080 0.050 0.000 0.000 0.040 0.105 0.095 ] .
where e.g., a 2 , 3 = 0.03 means that 3% of the employees quit their job by reason of financial instability.
The company has 25 machine operators, 17 high-priority operators, 15 equipment technicians, 14 field service technicians, 12 assembly supervisors and seven operations managers. The company wants to reach, at the end of the time window of 20 months, a total number of 280 employees, while they need 20 machine operators, 42 high-priority operators, 33 equipment technicians, 98 field service technicians, 52 assembly supervisors and 35 operations managers. The initial recruitment rate for the six different positions is given by the first row of the recruitment rate matrix:
R = [ 0.40 0.20 0.15 0.10 0.10 0.05 ] .
The simulation of the described absorbing Markov-chain model makes it possible to analyze the career path of the employees and the success of the company’s HR strategy and HR deployment process. As Table 3 shows, the AMC simulation calculates the future distribution of human resources and the last column of the employment matrix describes the final results of HR deployment. In this scenario, the simulated number of employees is the following at the end of the time window: A total of 71 machine operators, 26 high-priority operators, 21 equipment technicians, 80 field service technicians, 48 assembly supervisors and 34 operations managers. The recruitment rate was changed through the AMC simulation by Equation (7). As the simulated recruitment rate matrix shows (Table 3), the recruitment rate is dynamic because it is a function of the total number of employees and the recruited number of employees for a given position.
Figure 4 shows the deployment of employees for each position and demonstrates that the number of employees is a non-linear function. Figure 5 describes the difference between the planned and simulated number of employees. The difference between the planned and the simulated number of employees is the following: Machine operators (448%), high-priority operators (79%), equipment technicians (80%), field service technicians (24%), assembly supervisors (110%) and operations managers (140%). Several cases can cause the high difference between planned and simulated HR distribution, like the wrong recognition of employees’ job performance, a bad career path (described by the promotion matrix), or the high rate of employees that left the company (described by the additional promotion matrix).
By modifying the elements of the promotion matrix, it is possible to change the career path of employees and restructure their distribution (Figure 6 and Figure 7).
Increasing the promotion probability of machine operators to high-priority operators from 5% to 25%, and increasing the non-promotion actions within the frame of the time window from 80% to 60%, the AMC simulation led to a restructured human resource distribution, as shown in Table 3.
The difference between the planned and the simulated number of employees is the following in the case of the modified dataset: Machine operators (97%), high-priority operators (100%), equipment technicians (101%), field service technicians (100%), assembly supervisors (101%) and operations managers (101%). As these proportions show, the restructuring and deployment of promotion strategy can be influenced by the human resource promotion strategy.

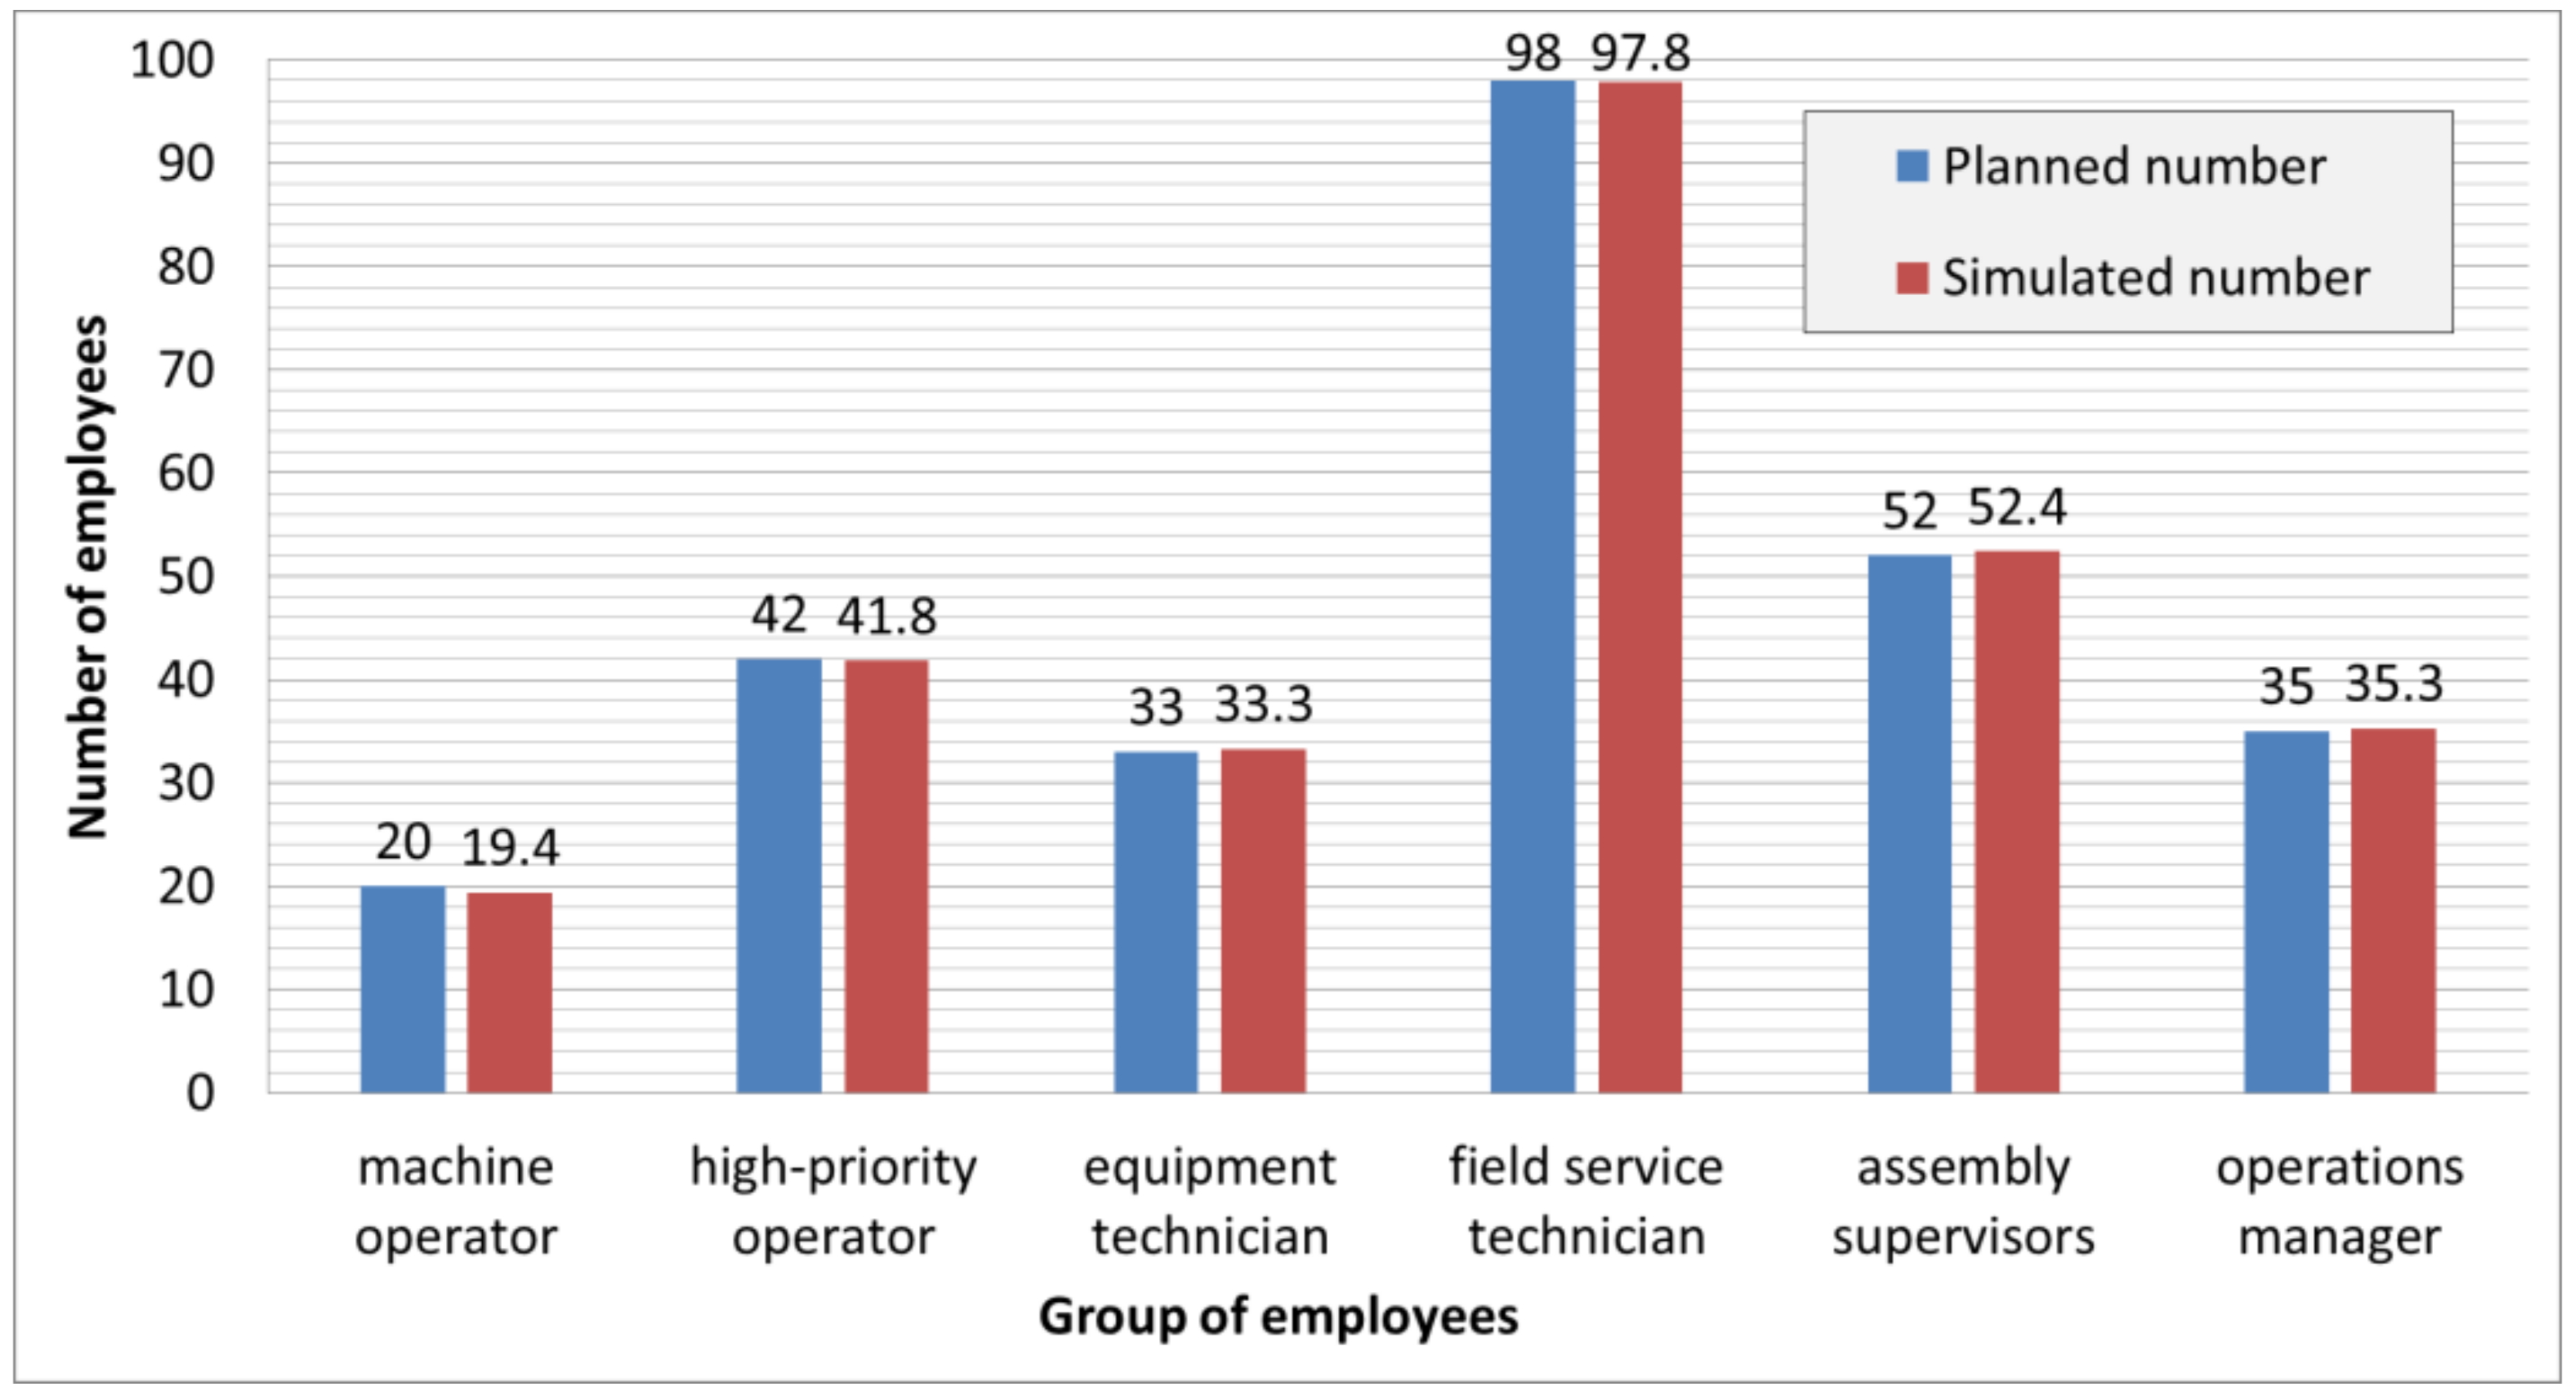
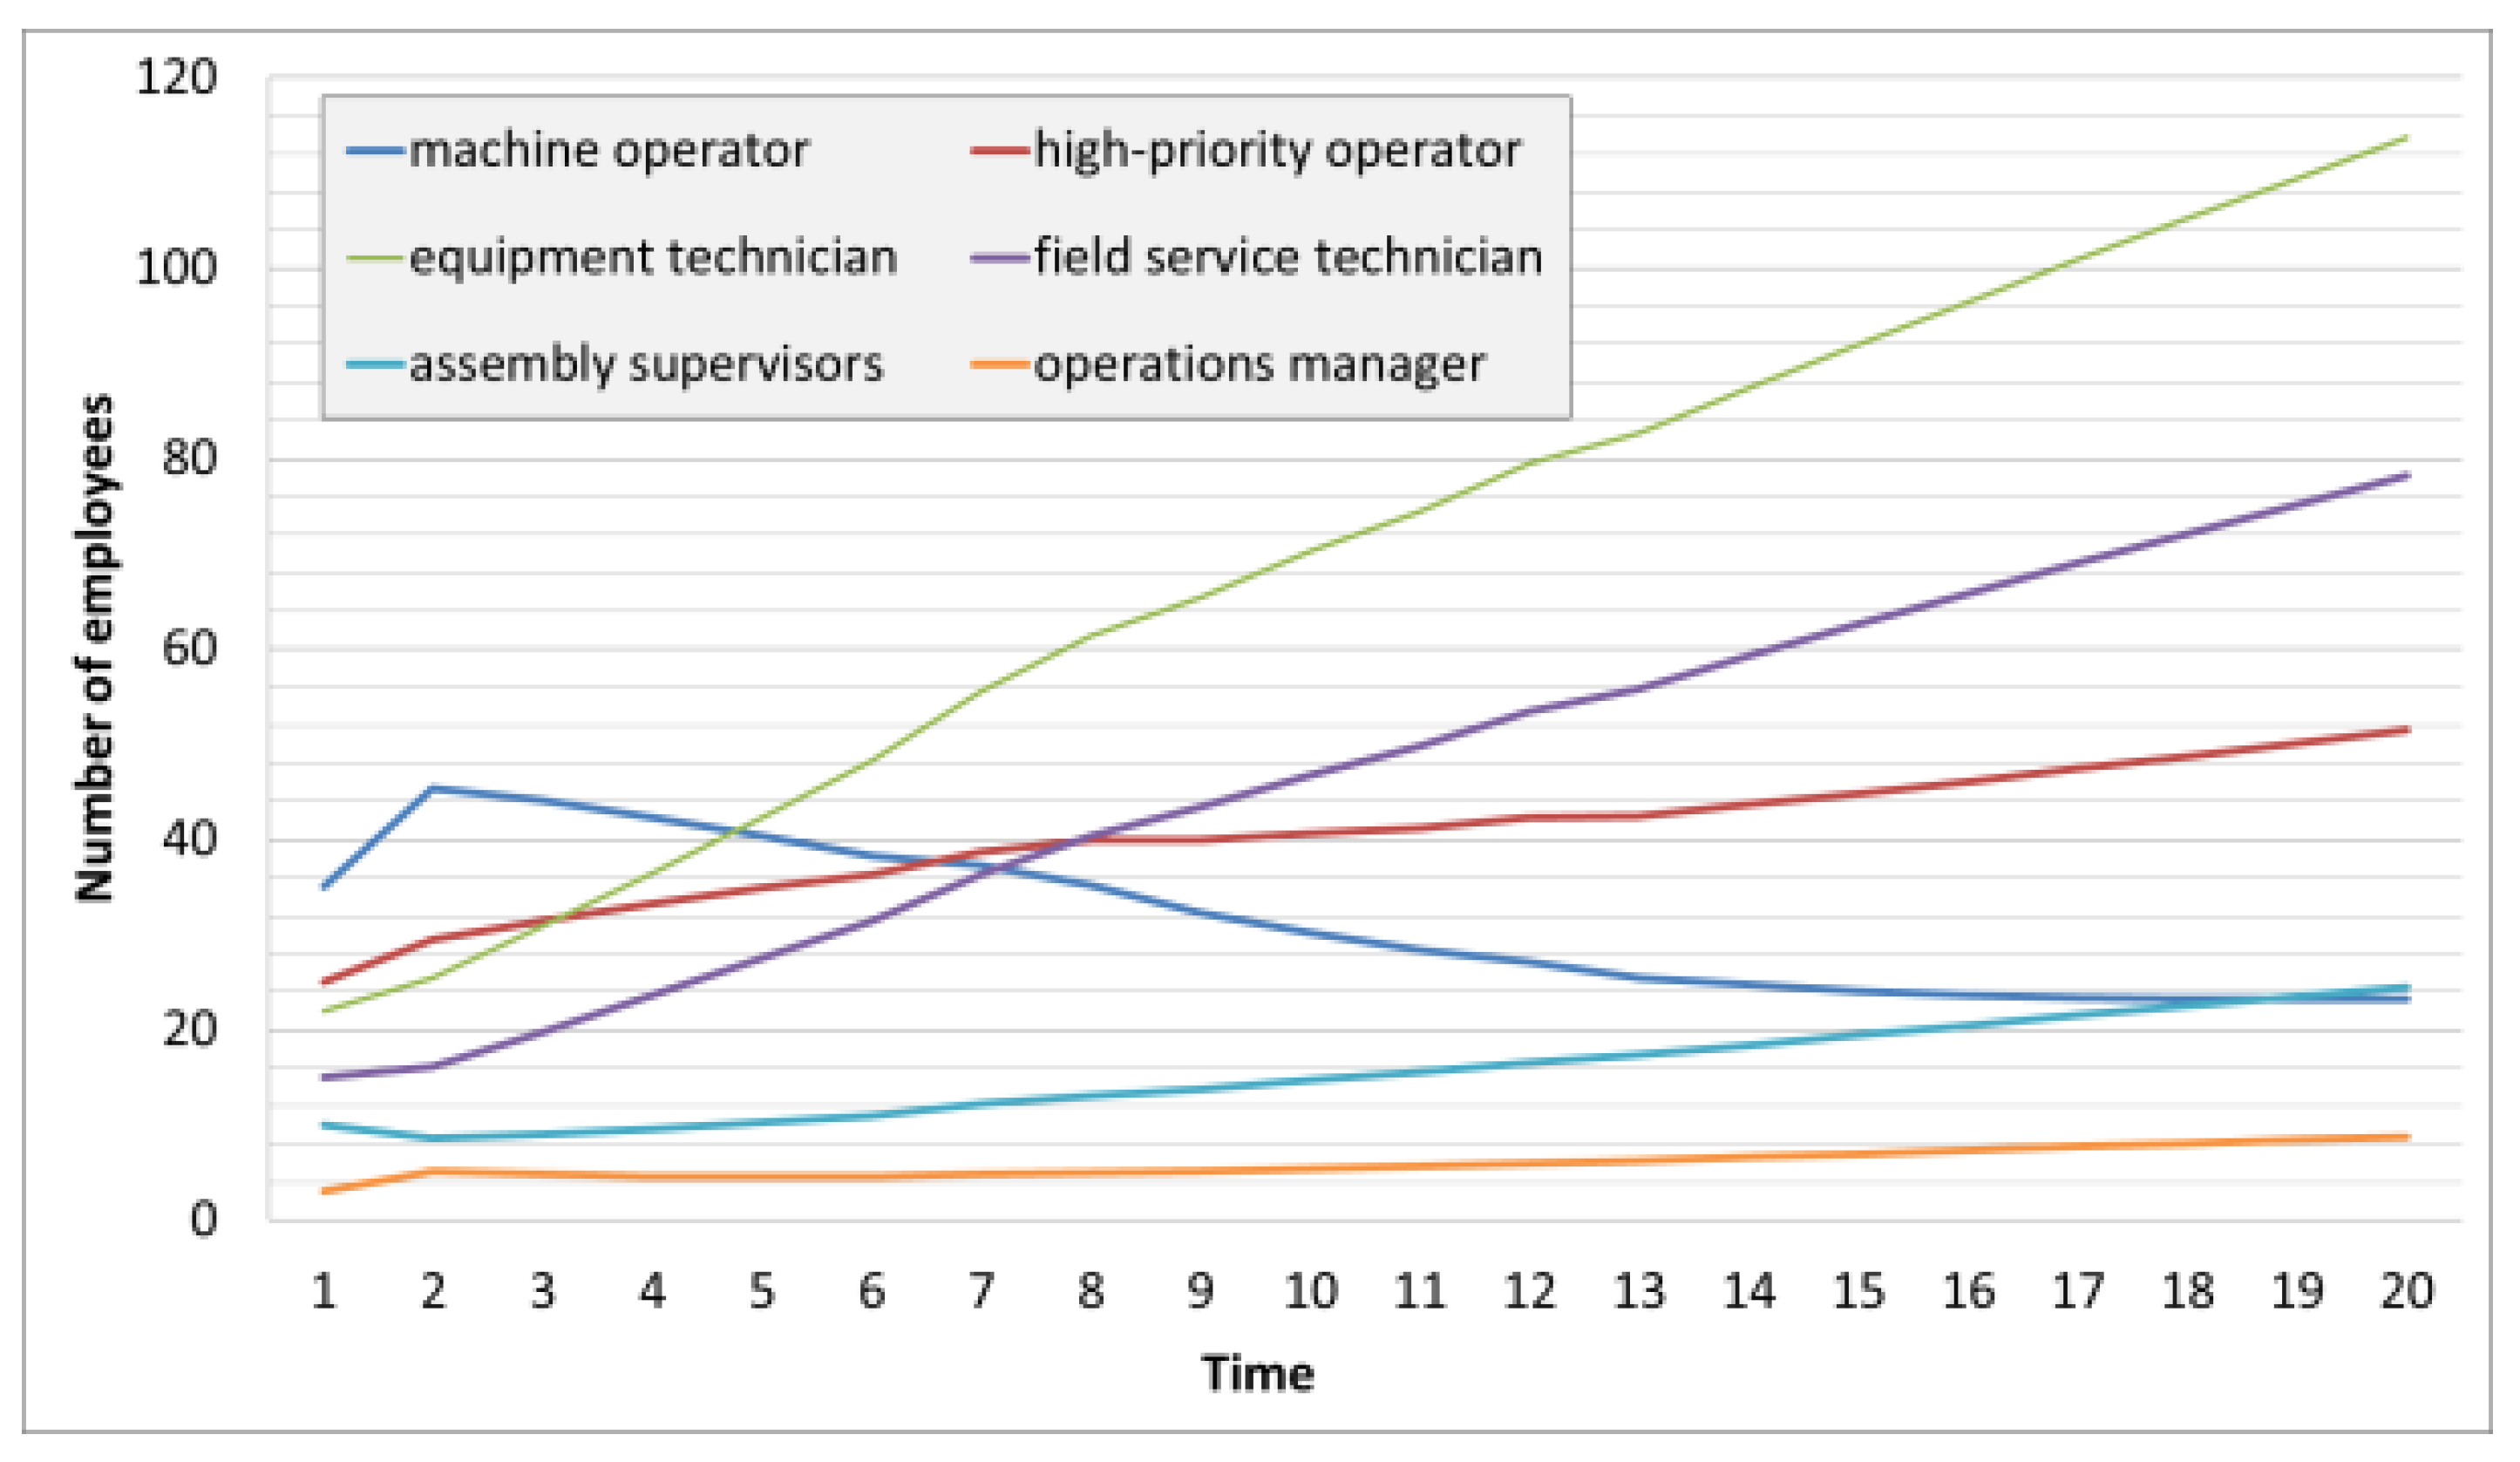
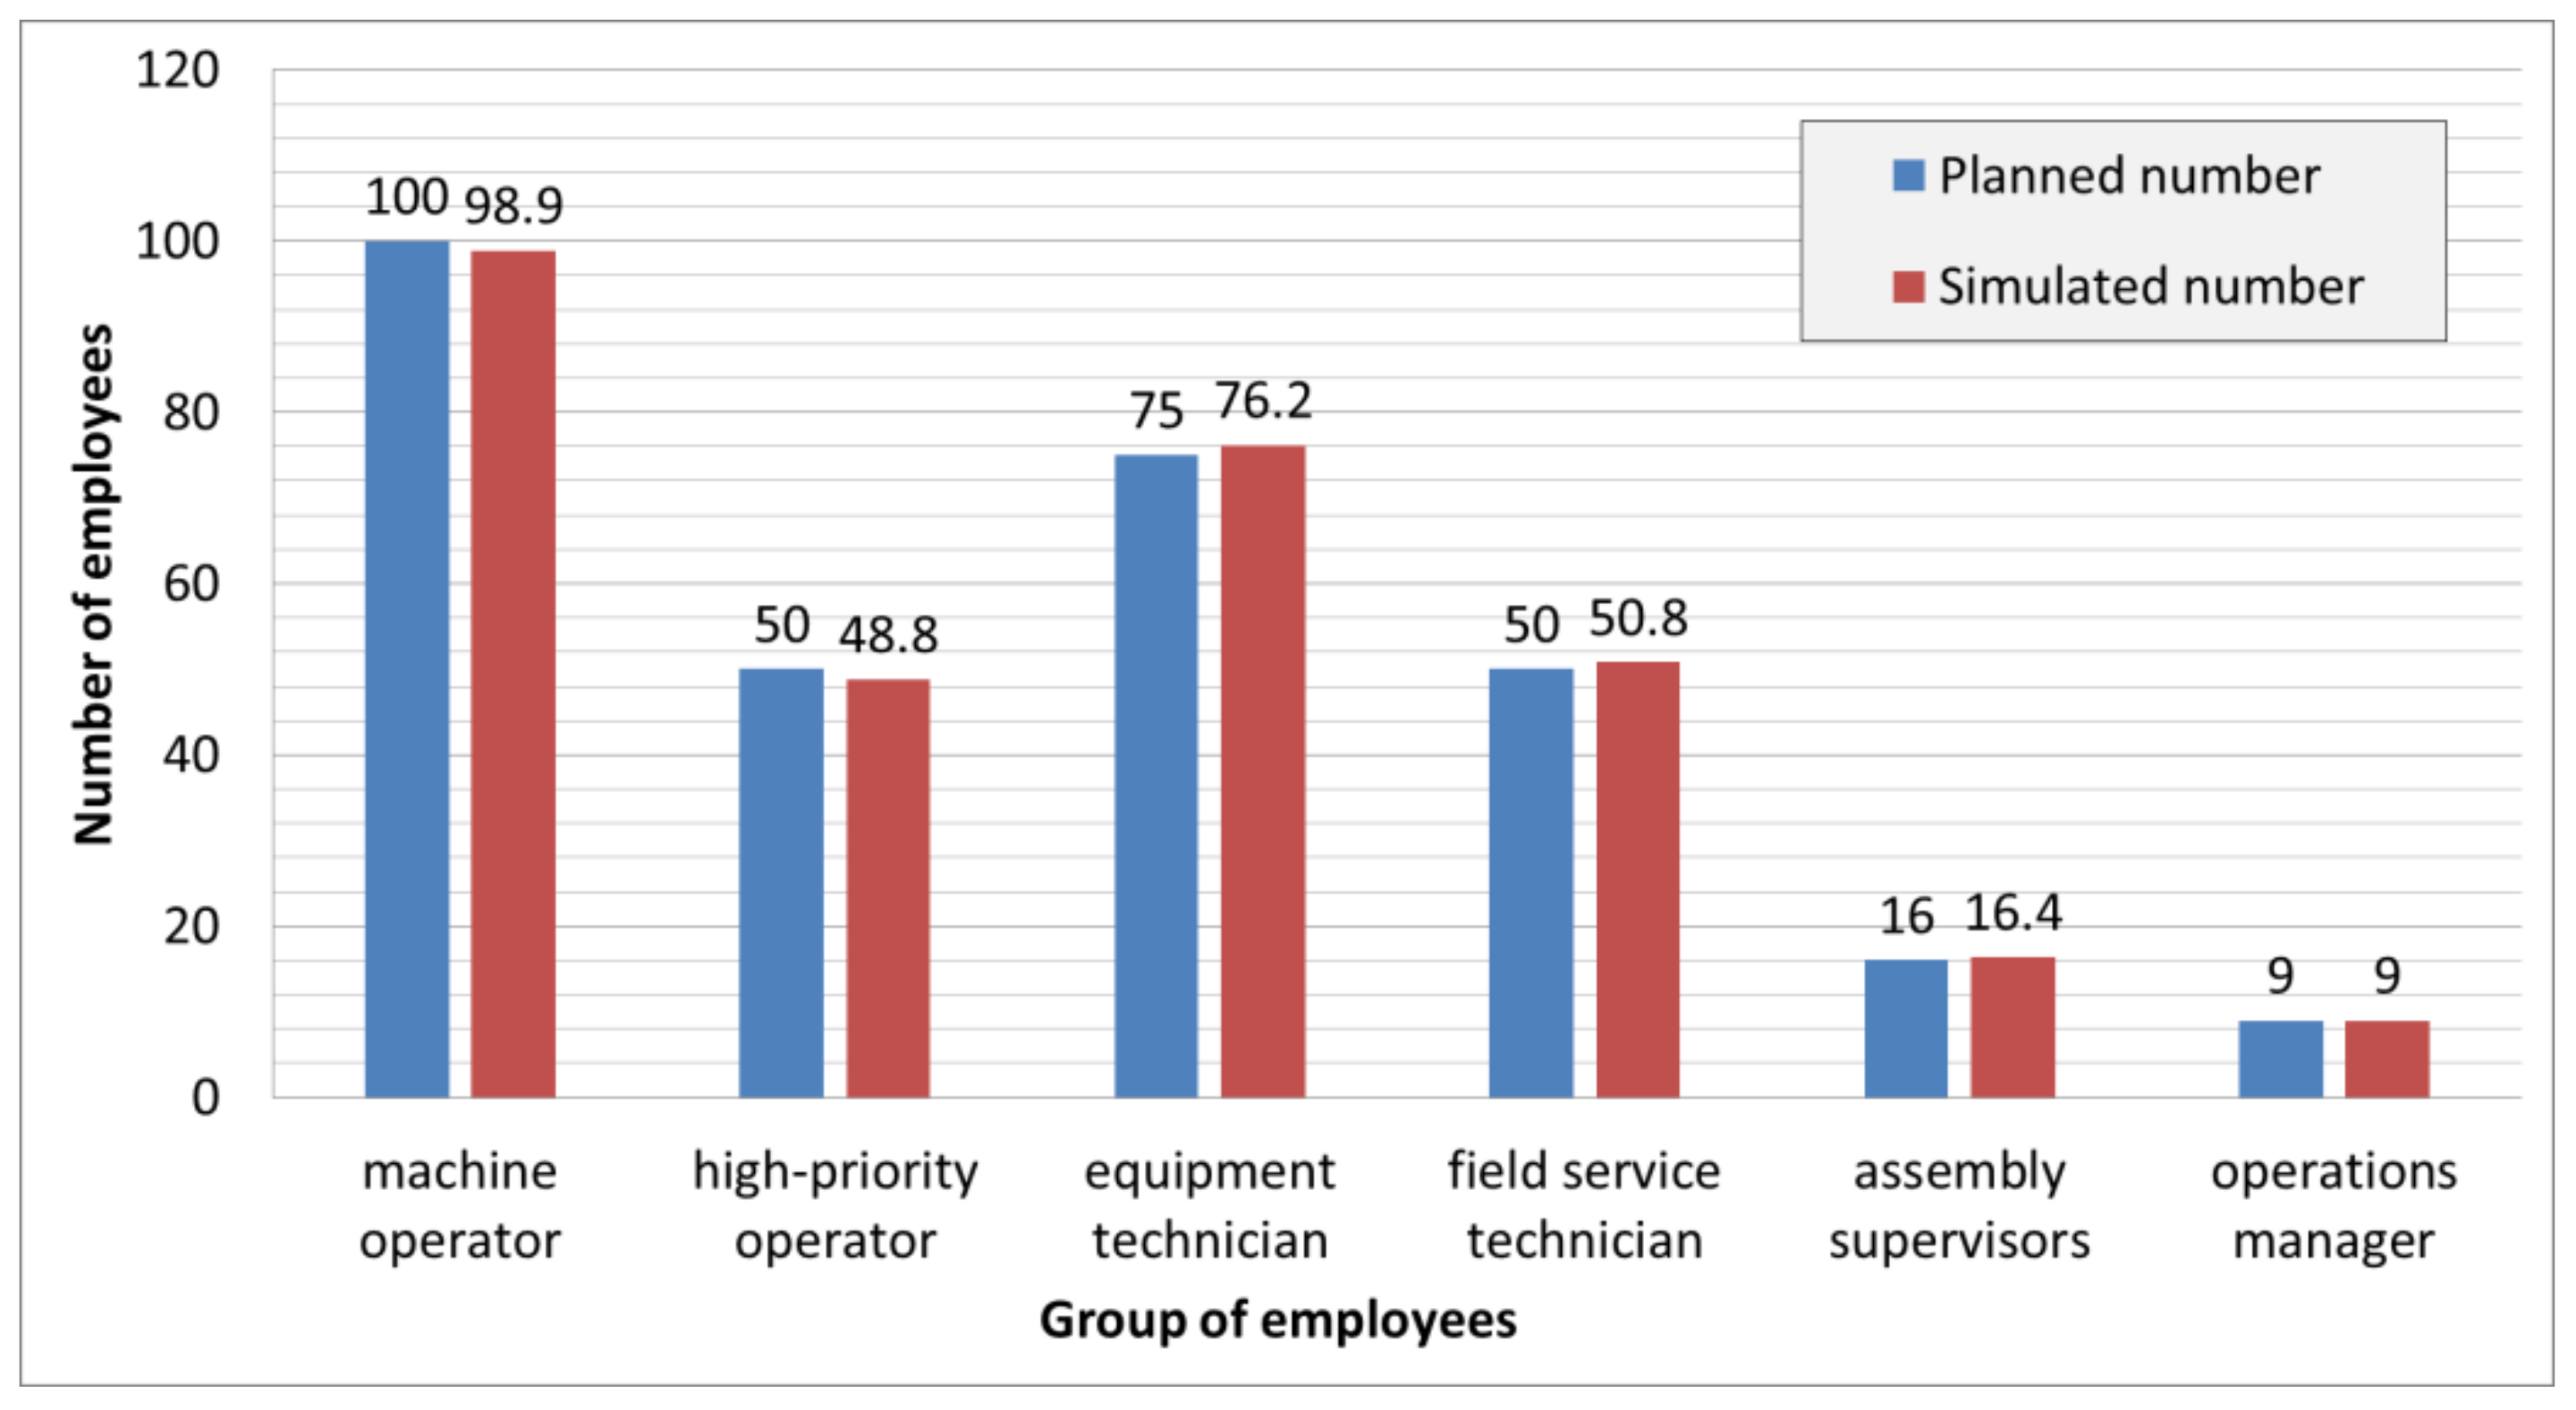
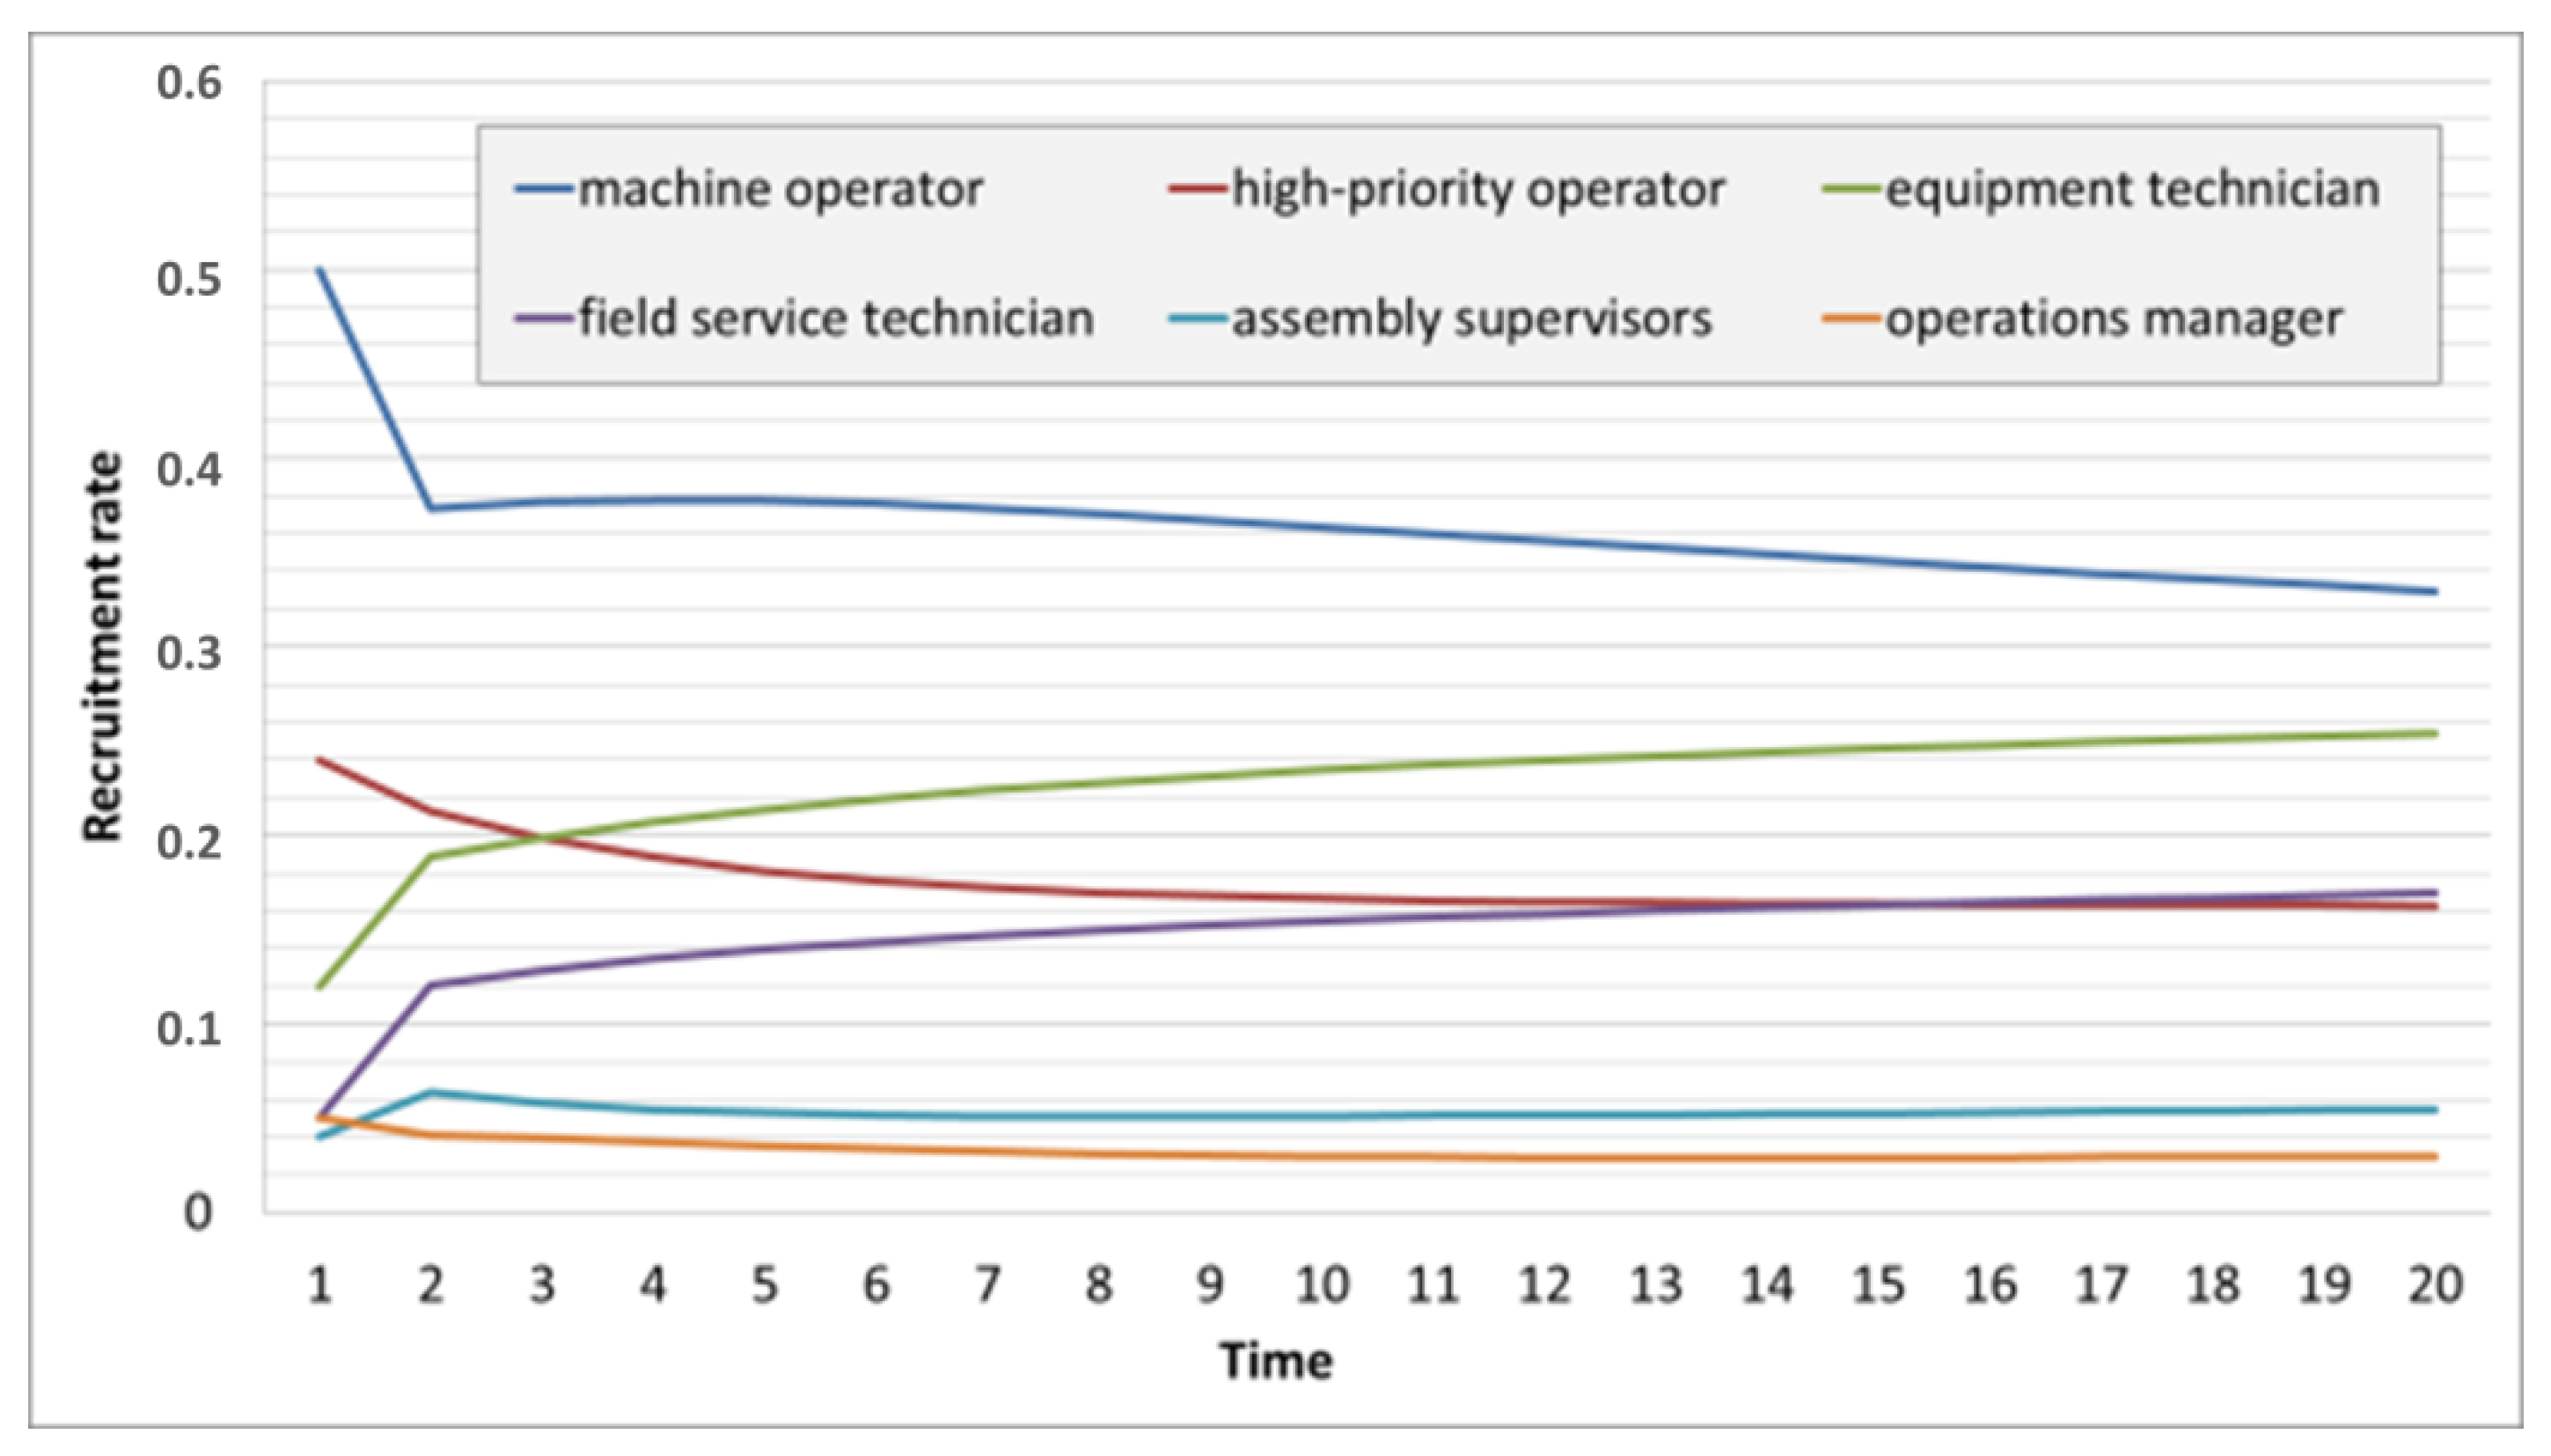
4.2. Scenario 2: Promotion Matrix with Sub- and Superdiagonal Elements with Dynamic Recruitment Rate

Scenario 2 describes a general model of the HR deployment of assembly line operators in a multinational company, where the promotion has the same six levels as in Scenario 1 and employees can promote only one level up and down, therefore, the promotion matrix can be described as a matrix with sub- and superdiagonal elements, while the additional promotion matrix including probabilities of leave the firm has the same structure:
P = [ 0.60 0.05 0.00 0.10 0.60 0.10 0.00 0.10 0.60 0.00 0.00 0.00 0.00 0.00 0.00 0.20 0.00 0.00 0.00 0.00 0.30 0.00 0.00 0.00 0.00 0.00 0.00 0.50 0.10 0.00 0.20 0.50 0.20 0.00 0.10 0.30 ] A = [ 0.050 0.225 0.050 0.050 0.025 0.025 0.025 0.050 0.030 0.070 0.050 0.000 0.050 0.000 0.000 0.060 0.120 0.280 0.050 0.000 0.100 0.040 0.105 0.095 ] .
The company has 35 machine operators, 25 high-priority operators, 22 equipment technicians, 15 field service technicians, 10 assembly supervisors and three operations managers. The company wants to reach, at the end of the time window of 20 months, a total number of 300 employees, while they need 100 machine operators, 50 high-priority operators, 75 equipment technicians, 50 field service technicians, 16 assembly supervisors and nine operations managers. The initial recruitment rate for the six different positions is given by the first row of the recruitment rate matrix:
R = [ 0.50 0.24 0.12 0.05 0.04 0.05 ] .
In this Scenario the simulated number of employees is the following at the end of the time window: A total of 23 machine operators, 51 high-priority operators, 114 equipment technicians, 78 field service technicians, 25 assembly supervisors and nine operations managers. The recruitment rate shows the same dynamic characteristics as in the case of Scenario 1 (Table 4).
Figure 8 shows the deployment of employees for each position and demonstrates that the number of employees is a non-linear function. Figure 9 describes the difference between the planned and simulated number of employees.
The difference between the planned and the simulated number of employees is not as high as in the case of Scenario 1, but not eligible, especially in the case of high positions in the career path: Machine operators (102%), high-priority operators (114%), equipment technicians (139%), field service technicians (75%), assembly supervisors (58%) and operations managers (41%).
P = [ 0.80 0.05 0.00 0.10 0.60 0.10 0.00 0.10 0.60 0.00 0.00 0.00 0.00 0.00 0.00 0.20 0.00 0.00 0.00 0.00 0.15 0.00 0.00 0.00 0.00 0.00 0.00 0.65 0.10 0.00 0.10 0.50 0.20 0.00 0.10 0.50 ] A = [ 0.050 0.025 0.050 0.050 0.025 0.025 0.025 0.050 0.030 0.070 0.050 0.000 0.050 0.000 0.000 0.060 0.120 0.080 0.050 0.000 0.100 0.040 0.105 0.095 ] .
The high difference between the planned and simulated HR distribution is caused by the high rate of backtracking of field service technicians to equipment technicians and the high rate of leaving firm by operation managers through no path to continued growth. Modifying the critical parameters of the career path (Equation (20)) we can modify the HR structure, as Figure 10 and Figure 11 describe.
The difference between the planned and the simulated number of employees is the following in the case of the modified dataset: Machine operators (99%), high-priority operators (98%), equipment technicians (102%), field service technicians (101%), assembly supervisors (102%) and operations managers (100%). As these proportions show, the above described restructuring and deployment of promotion strategy has a great impact on the final structure of human resources.
As Figure 12 and Figure 13 demonstrate, the recruitment rate changed through time, while the number of employees that left the company continuously increased.
The above described scenarios validated the presented model based on Markov-chain simulation and justify the fact that the promotion of employees and the future structure of human resources are strongly influenced by the HR strategy.
To summarize, the proposed simulation model based on absorbing Markov-chain makes it possible to analyze the impact of human resource strategies in stochastic environment, where the effects of HRM factors can be described as statistical variables.
As the findings of the literature review show, the articles that addressed the analysis of human resource are focusing on conventional static and deterministic environments, but none of the articles aimed to identify the optimization aspects of dynamic, stochastic human resource deployment problems. The comparison of our results with those from other studies shows that the deployment and recruitment problems of human resource strategies still need more attention and research. The reason for this is that, in the case of large-sized stochastic systems, where the dynamic of the economic environment influences the required human resources, the stochastic parameters of strategy factors must be taken into consideration.
In spite of the small size of the demonstrated problems, these results show that the proposed method using absorbing Markov-chain simulation performs better than the traditional formal models to evaluate human resource management related problems. Traditional formal models are generally focusing on a special field of human resource management: Evaluation of various worker training scenarios for developing a flexible workforce [73], or the analysis of cognitive and psychosocial skills required for semi-skilled jobs [74], while our proposed evaluation method makes it possible to analyze a given human resource management strategy from different points of view: Aligning business and HR needs, required organizational performance, organizational design and structure, available resources, organizational development, compensation and benefits and organizational culture [75]. As the Markov-chain based mathematical model (see Equations (1)–(15)) shows, these aspects can be described by promotion matrices representing the different parts of the human resource strategy. The promotion matrices have elements, which are probability variables, so it is possible to describe human resource strategies in stochastic environments. The models were intended to assist human resource managers in deciding optimum strategic and tactical plans for human resource development according to the forecasted number and structure of human resources for a definite time window. The proposed method can obtain different promotion systems in a company. If employees can promote only to the next level of employment, then the promotion matrix can be described as a superdiagonal matrix, while in the case of backtrack possibilities, the promotion matrix has both subdiagonal and superdiagonal elements.
Our model is based on absorbing Markov-chains. This means that not only transitive but also absorbing sub-processes—reasons why employees quit their job—can also be taken into consideration. By modifying the elements of the promotion matrix, it is possible to change the career path of employees and restructure their distribution. The results of the Markov-chain simulations of both scenarios validate that the difference between the planned and the simulated number of employees can be decreased through changes in the promotion strategy.

5. Conclusions

Within the frame of this research work the authors developed a Markov-chain based simulation method, which makes it possible to simulate and analyze a given human resource strategy. More generally, this paper focused on the mathematical description of the framework of human resource strategies including financial, social, and technical factors and show their impact on the planned structure of human resources. Why is so much effort being put into this research? The role of the human resource management has changed in the last few years from the traditional “hire and fire” arm of the business to a strategic position [76].
The added value of the paper is the description of the absorbing Markov-chain based model of human resource deployment process, which makes it possible to describe the impact of pillars of human resource strategy when developing or refining them. The scientific contribution of this paper for researchers in this field is the mathematical modelling of stochastic human resource deployment processes based of absorbing Markov-chain. The results can be generalized, because the model can be applied for different fields of human resource management from small and middle-sized service companies to multinational production companies. Therefore, today’s human resource managers play a strategic role in the day-to-day operations of the business. The described method makes it possible to support managerial decisions; the human resource strategy can be influenced by the results of the above described contribution.
The corporate social responsibility and the sustainability of human resource management are generally integrated into a business model. This business model’s purpose of a company is to maximize returns to its shareholders while aspects of corporate social responsibilities are also taken into consideration. The analyses performed with the described Markov-chain based simulation makes it possible to optimize the human resource structure, while CSR aspects can be also considered.
However, there are also limitations of the study and the described model which shows directions for further research. Within the frame of this Markov-chain based model there are no optimization possibilities. The model makes it possible to analyze different human resource strategies (mathematically represented by matrices). In further studies, the model can be extended to a more complex model including optimization methods to find the optimal factors of the human resource management strategy, which means the optimization of promotion matrix. Second, this study only considered the stochastic parameters as probability variables. Fuzzy models can be also suitable for the description of stochastic environment, because Fuzzy models are based on degrees of truth while probability theory is interested in trying to make predictions about events from a state of partial knowledge [77]. This should be also considered in future research. The theory of perception driven process analysis is also a future research direction for the described topic [78].

Author Contributions

All of the authors have contributed equally in the research design and development, the data analysis, and the writing of the paper.

Funding

This project has received funding from the European Union’s Horizon 2020 research and innovation programme under grant agreement No 691942. This research was partially carried out in the framework of the Center of Excellence of Mechatronics and Logistics at the University of Miskolc.

Conflicts of Interest

The authors declare no conflict of interest. The funders had no role in the design of the study; in the collection, analyses, or interpretation of data; in the writing of the manuscript, or in the decision to publish the results.

References

  1. Houdek, P.; Koblovský, P. Behavioural economics of organization: Employees and managers. Ekon. Manag. 2017, 20, 4–15. [Google Scholar] [CrossRef]
  2. Ibrahim, O.; Nossei, A. A Combined AHP and Source of Power Schemes for Prioritising Requirements Applied on a Human Resources. MATEC Web Conf. 2016, 76, 04016. [Google Scholar] [CrossRef] [Green Version]
  3. Mazur, B. Sustainable human resource management in theory and practice. Econ. Manag. 2014, 1, 158–170. [Google Scholar] [CrossRef]
  4. Lage, M.; Filho, G. Variations of the Kanban system: Literature review and classification. Int. J. Prod. Econ. 2010, 125, 13–21. [Google Scholar] [CrossRef]
  5. Fiorini, P.C.; Jabbour, C.J.C. Information systems and sustainable supply chain management towards a more sustainable society: Where we are and where we are going. Int. J. Inform. Manag. 2017, 37, 241–249. [Google Scholar] [CrossRef] [Green Version]
  6. Dean, B.V.; Yu, Y.-M.; Schniederjans, M.J. A goal programming approach to production planning for flexible manufacturing systems. J. Eng. Technol. Manag. 1990, 6, 207–220. [Google Scholar] [CrossRef]
  7. Delgoshaei, A.; Ali, A. An applicable method for scheduling temporary and skilled-workers in dynamic cellular manufacturing systems using hybrid ant colony optimization and tabu search algorithms. J. Ind. Prod. Eng. 2017, 34, 425–449. [Google Scholar] [CrossRef]
  8. Jong, W.-R.; Lai, P.-J. The navigation process of mould-manufacturing scheduling optimisation by applying genetic algorithm. Int. J. Comput. Integr. Manuf. 2015, 28, 1331–1349. [Google Scholar] [CrossRef]
  9. Ko, H.J.; Evans, G.W. A genetic algorithm-based heuristic for the dynamic integrated forward/reverse logistics network for 3PLs. Comput. Oper. Res. 2007, 34, 346–366. [Google Scholar] [CrossRef]
  10. Campos Ciro, G.; Dugardin, F.; Yalaoui, F.; Kelly, R. Open shop scheduling problem with a multi-skills resource constraint: A genetic algorithm and an ant colony optimisation approach. Int. J. Prod. Res. 2016, 54, 4854–4881. [Google Scholar] [CrossRef]
  11. Xiang, W.; Yin, J.; Lim, G. An ant colony optimization approach for solving an operating room surgery scheduling problem. Comput. Ind. Eng. 2015, 85, 335–345. [Google Scholar] [CrossRef]
  12. Delgoshaei, A.; Ariffin, M.K.A.; Ali, A. A multi-period scheduling method for trading-off between skilled-workers allocation and outsource service usage in dynamic CMS. Int. J. Prod. Res. 2017, 55, 997–1039. [Google Scholar] [CrossRef]
  13. Brusco, M.J. A bicriterion algorithm for the allocation of cross-trained workers based on operational and human resource objectives. Eur. J. Oper. Res. 2015, 247, 46–59. [Google Scholar] [CrossRef]
  14. Ferjani, A.; Ammar, A.; Pierreval, H.; Elkosantini, S. A simulation-optimization based heuristic for the online assignment of multi-skilled workers subjected to fatigue in manufacturing systems. Comput. Ind. Eng. 2017, 112, 663–674. [Google Scholar] [CrossRef]
  15. Pramanik, S.; Jana, D.K.; Maiti, M. Bi-criteria solid transportation problem with substitutable and damageable items in disaster response operations on fuzzy rough environment. Soc. Econ. Plan. Sci. 2016, 55, 1–13. [Google Scholar] [CrossRef]
  16. Karande, P.; Chakraborty, S. A fuzzy-MOORA approach for ERP system selection. Decis. Sci. Lett. 2012, 1, 11–22. [Google Scholar] [CrossRef]
  17. Liao, M.-S.; Lin, S.-C.; Liang, G.-S.; Chen, C.-Y. Improving the management and operational success of the third party logistics industry in Taiwan: Application of fuzzy quality function deployment. J. Test. Eval. 2015, 43, 201–211. [Google Scholar] [CrossRef]
  18. Addo-Tenkorang, R.; Helo, P.T.; Kantola, J. Concurrent enterprise: A conceptual framework for enterprise supply-chain network activities. Enterp. Inf. Syst. 2017, 11, 474–511. [Google Scholar] [CrossRef]
  19. Pathak, S.; Mondal, S.S. A fuzzy optimization model to the aggregate production/distribution planning decision in a multi-item supply chain network. Int. J. Manag. Eng. Manag. 2012, 7, 163–173. [Google Scholar] [CrossRef]
  20. Lewczuk, K. The concept of genetic programming in organizing internal transport processes. Arch. Transp. 2015, 34, 61–74. [Google Scholar] [CrossRef]
  21. Stajniak, M.; Guszczak, B. Analysis of logistics processes according to BPMN Methodology. Adv. Eng. Res. 2011, 537–549. [Google Scholar] [CrossRef]
  22. Kramer, R.; Maculan, N.; Subramanian, A.; Vidal, T. A speed and departure time optimization algorithm for the pollution-routing problem. Eur. J. Oper. Res. 2015, 247, 782–787. [Google Scholar] [CrossRef] [Green Version]
  23. Koltai, T.; Tatay, V.; Kalló, N. Application of the results of simple assembly line balancing models in practice: The case of a bicycle manufacturer. Int. J. Comput. Integr. Manuf. 2014, 27, 887–898. [Google Scholar] [CrossRef]
  24. Jamshidi, R.; Seyyed Esfahani, M.M. Human resources scheduling to improve the product quality according to exhaustion limit. TOP 2013, 22, 1028–1041. [Google Scholar] [CrossRef]
  25. Kolisch, R.; Heimerl, C. An efficient metaheuristic for integrated scheduling and staffing IT projects based on a generalized minimum cost flow network. Nav. Res. Log. 2012, 59, 111–127. [Google Scholar] [CrossRef]
  26. Chen, J.; Lee, C.-Y. General multiprocessor task scheduling. Nav. Res. Logist. 1999, 46, 72–74. [Google Scholar] [CrossRef]
  27. Wang, W.; Huang, X.; Xie, J. Study on optimizing resources configuration of value activity network of manufacturing clusters. Kybernetes 2012, 41, 953–962. [Google Scholar] [CrossRef]
  28. Paquet, M.; Martel, A.; Montreuil, B. A manufacturing network design model based on processor and worker capabilities. Int. J. Prod. Res. 2008, 46, 2009–2030. [Google Scholar] [CrossRef]
  29. Forrai, M.K.; Kulcsár, G. A new scheduling software for supporting automotive component manufacturing. Lect. Notes Eng. 2017, F12, 257–274. [Google Scholar] [CrossRef]
  30. Forrai, M.K.; Kulcsár, G. Modelling and Solving an Extended Parallel Resource Scheduling Problem in the Automotive Industry. Acta Politech. Hung. 2017, 14, 27–46. [Google Scholar]
  31. Di Francesco, M.; Manca, A.; Zanda, S.; Zuddas, P. Planning and optimising manpower management in a transshipment container terminal. Eur. J. Ind. Eng. 2016, 10, 777–793. [Google Scholar] [CrossRef]
  32. Fang, L.; Li, X.; Li, A. Analysis of the symbiotic relationship between managers and staff with an application for coal mine safety management. Int. J. Eng. Res. Afr. 2015, 16, 156–165. [Google Scholar] [CrossRef]
  33. Jong, W.-R.; Lai, P.-J.; Lo, C.-W. Applying ant colony system algorithm in the navigation process for plastic injection mould manufacturing scheduling optimization. Int. J. Prod. Res. 2014, 52, 2530–2549. [Google Scholar] [CrossRef]
  34. Calciolari, S.; Ferrari, D.; Ortiz, L.G.; Meneguzzo, M. Organizing healthcare in remote rural areas: Comparing experiences of service delivery re-design. Int. J. Healthc. Manag. 2016, 9, 190–200. [Google Scholar] [CrossRef]
  35. Huang, L.; Zhao, W.; Xie, G.; Xie, H.; Yi, Q. Evaluating and optimizing city E-commerce competitiveness based on FA-CA Model: A case from 32 cities in China. Revista de la Facultad de Ingenieria 2017, 32, 298–308. [Google Scholar]
  36. Lee, K.K.; Shan, R.M.Y.; Leung, H.C.H.; Li, J.W.H. Competency enhancement model of physical infrastructure and asset management in compliance with PAS-55 for Hong Kong automotive manufacturing engineers. Lect. Notes Mech. Eng. 2015, 19, 729–737. [Google Scholar] [CrossRef]
  37. Lebreton, B.G.M.; Van Wassenhove, L.N.; Bloemen, R.R. Worldwide sourcing planning at Solutia’s glass interlayer products division. Int. J. Prod. Res. 2010, 48, 801–819. [Google Scholar] [CrossRef]
  38. Labuttis, J. Ergonomics as Element of Process and Production Optimization. Procedia Manuf. 2015, 3, 4168–4172. [Google Scholar] [CrossRef]
  39. Shibin, K.T.; Gunasekaran, A.; Papadopoulos, T.; Childe, S.J.; Dubey, R.; Singh, T. Energy sustainability in operations: An optimization study. Int. J. Adv. Manuf. Technol. 2016, 86, 2873–2884. [Google Scholar] [CrossRef]
  40. Ardeleanu, M.P. Corporate environmental sustainability. Qual. Access Success 2011, 12, 347–351. [Google Scholar]
  41. Huber, V.L.; Brown, K.A. Human resource issues in cellular manufacturing: A sociotechnical analysis. J. Oper. Manag. 1991, 10, 138–159. [Google Scholar] [CrossRef]
  42. Boon, B.H.; Sierksma, G. Team formation: Matching quality supply and quality demand. Eur. J. Oper. Res. 2003, 148, 277–292. [Google Scholar] [CrossRef]
  43. Lai, X.; Xie, M.; Tan, K.-C. QFD optimization using linear physical programming. Eng. Optim. 2006, 38, 593–607. [Google Scholar] [CrossRef]
  44. Marksberry, P.; Parsley, D. Managing the IE (Industrial Engineering) mindset: A quantitative investigation of Toyota’s practical thinking shared among employees. J. Ind. Eng. Manag. 2011, 4, 771–779. [Google Scholar] [CrossRef]
  45. Tamošiūnas, A. The integrative management model for restructuring small and medium-sized enterprises. Ekon. Manag. 2017, 20, 36–51. [Google Scholar] [CrossRef]
  46. Bányai, Á. How to support purchasing with ERP systems as integrator of novel logistic tools? Adv. Log. Syst. 2013, 7, 7–12. [Google Scholar]
  47. Dröge, C.; Jayaram, J.; Vickery, S.K. The ability to minimize the timing of new product development and introduction: An examination of antecedent factors in the North American automobile supplier industry. J. Prod. Innov. Manag. 2000, 17, 24–40. [Google Scholar] [CrossRef]
  48. Zhao, Z.; Wang, Y.; Sun, L. Study of integrated management mechanism and implement ways in reengineering product innovation process of manufacturing enterprises. Chin. J. Mech. Eng. 2000, 13, 127–132. [Google Scholar] [CrossRef]
  49. Chen, F.; Sekiyama, K.; Huang, J.; Sun, B.; Sasaki, H.; Fukuda, T. An assembly strategy scheduling method for human and robot coordinated cell manufacturing. Int. J. Intell. Comput. Cybern. 2011, 4, 487–510. [Google Scholar] [CrossRef]
  50. Cai, Y.; Huo, Y.-Z. Simulation and optimization of container terminal logistics system: An overview. J. Syst. Simul. 2009, 21, 2119–2124. [Google Scholar]
  51. Bányai, Á.; Illés, B.; Schenk, F. Supply chain design of manufacturing processes with blending technologies. Solid State Phenom. 2017, 261, 509–515. [Google Scholar] [CrossRef]
  52. Sandrea, M.; Boscán, M. The value chain in the clothing sector. Rev. Venez. Gerenc. 2004, 9, 336–353. [Google Scholar]
  53. Korponai, J.; Bányai, Á.; Illés, B. The effect of the safety stock on the occurrence probability of the stock shortage. Manag. Prod. Eng. Rev. 2017, 8, 69–77. [Google Scholar] [CrossRef]
  54. Manley, K.; Martin, A.; Jackson, C.; Wright, T. A realist synthesis of effective continuing professional development (CPD): A case study of healthcare practitioners’ CPD. Nurs. Educ. Today. 2018, 69, 134–141. [Google Scholar] [CrossRef] [PubMed]
  55. Anwar, C.M. Linkages between personality and knowledge sharing behaviour in workplace: Mediating role of affective states. Ekon. Manag. 2017, 20, 102–115. [Google Scholar] [CrossRef]
  56. Firlej, K.; Żmija, D. The specificity of knowledge management in the food industry in Poland. Ekon. Manag. 2017, 20, 83–97. [Google Scholar] [CrossRef]
  57. Jin, Z.; Xu, G.; Li, Y.; Liu, P. A novel cloud data center resource scheduling optimization model based on KPCA and Markov chain. Rev. Tec. Fac. Ing. Univ. 2016, 39, 87–95. [Google Scholar] [CrossRef]
  58. Im, C.-H.; Kim, H.-K.; Jung, H.-K. Electromagnetic topology optimization using large-step Markov chain method with novel local optimization algorithm. Int. J. Appl. Electromagn. 2003, 18, 259–267. [Google Scholar]
  59. Arts, J.; Van Vuuren, M.; Kiesmüller, G. Efficient optimization of the dual-index policy using Markov chains. IIE Trans. 2011, 43, 604–620. [Google Scholar] [CrossRef] [Green Version]
  60. Sragovich, V.G. Optimization with constraints on finite homogeneous Markov chains. Sov. J. Comput. Syst. Sci. 1985, 23, 96–102. [Google Scholar]
  61. Cheng, K.; Zhang, K.-J. Potentials based optimization with embedded Markov chain for stochastic constrained system. Nonlinear Dyn. 2012, 67, 1067–1073. [Google Scholar] [CrossRef]
  62. Svoboda, M. Stochastic model of short-term prediction of stock prices and its profitability in the Czech Stock Market. Ekon. Manag. 2016, 19, 188–200. [Google Scholar] [CrossRef]
  63. Clempner, J.B.; Poznyak, A.S. Multiobjective Markov chains optimization problem with strong Pareto frontier: Principles of decision making. Expert Syst. Appl. 2017, 68, 123–135. [Google Scholar] [CrossRef]
  64. Cao, X.-R. Optimization of average rewards of time nonhomogeneous Markov chains. IEEE Trans. Autom. Control 2015, 60, 1841–1856. [Google Scholar] [CrossRef]
  65. Cao, X.-R. State classification of time-nonhomogeneous Markov chains and average reward optimization of multi-chains. IEEE Trans. Autom. Control 2016, 61, 3001–3015. [Google Scholar] [CrossRef]
  66. Koutras, V.P.; Platis, A.N.; Gravvanis, G.A. On the optimization of free resources using non-homogeneous Markov chain software rejuvenation model. Reliab. Eng. Syst. Saf. 2007, 92, 1724–1732. [Google Scholar] [CrossRef]
  67. Campos-Náñez, E.; Patek, S.D. Dynamically identifying regenerative cycles in simulation-based optimization algorithms for Markov chains. IEEE Trans. Autom. Control 2004, 49, 1022–1025. [Google Scholar] [CrossRef]
  68. Meyn, S. Algorithms for optimization and stabilization of controlled Markov chains. Sadhana Acad. Proc. Eng. Sci. 1999, 24, 339–367. [Google Scholar] [CrossRef] [Green Version]
  69. Lecchini-Visintini, A.; Lygeros, J.; MacIejowski, J.M. Stochastic optimization on continuous domains with finite-time guarantees by Markov chain monte carlo methods. IEEE Trans. Autom. Control 2010, 55, 2858–2863. [Google Scholar] [CrossRef]
  70. Milito, R.A.; Cruz, J.B. An optimization-oriented approach to the adaptive control of Markov chains. IEEE Trans. Autom. Control 1987, 32, 754–762. [Google Scholar] [CrossRef] [Green Version]
  71. Kaedi, M.; Ghasem-Aghaee, N.; Ahn, C.W. Biasing the transition of Bayesian optimization algorithm between Markov chain states in dynamic environments. Inf. Sci. 2016, 334–335, 44–64. [Google Scholar] [CrossRef]
  72. Xu, G.; Wu, Z.-H.; Jiang, M.-Z. Premature convergence of standard particle swarm optimisation algorithm based on Markov chain analysis. Int. J. Wirel. Mob. Comput. 2015, 9, 377–382. [Google Scholar] [CrossRef]
  73. Stewart, B.D.; Webster, D.B.; Ahmad, S.; Matson, J.O. Mathematical models for developing a flexible workforce. Int. J. Prod. Econ. 1994, 36, 243–254. [Google Scholar] [CrossRef]
  74. Caple, D. Impact of New Technology on Job Design, Skill Profiling and Assessing the Physical, Cognitive and Psychosocial Impacts on the Workforce. Adv. Intell. Syst. 2019, 821, 87–91. [Google Scholar] [CrossRef]
  75. Developing HR Strategy: 8 Steps towards Delivering a Successful HR Strategy. Available online: https://www.personneltoday.com/hr/developing-hr-strategy-8-steps-towards-delivering-a-successful-hr-strategy/ (accessed on 9 October 2018).
  76. Thiefels, J. Five Pillars of Successful HR Strategy. Available online: https://www.achievers.com/blog/2018/01/5-pillars-successful-hr-strategy/ (accessed on 29 September 2018).
  77. Mark, C.C. Fuzzy Logic vs. Probability. Available online: http://goodmath.scientopia.org/2011/02/02/fuzzy-logic-vs-probability/ (accessed on 8 October 2018).
  78. Gubán, Á.; Kása, R.; Gubán, M. The theory of perception driven process logistification. In Proceedings of the 18th International Working Seminar of Production Economics, Innsbruck, Austria, 24–28 February 2014; Grubbström, R.W., Hinterhuber, H.H., Eds.; University Innsbruck: Innsbruck, Austria, 2014; pp. 1–12. [Google Scholar]
Figure 1. Classification of articles considering subject areas based on search in Scopus database.
Sustainability 10 03692 g001
Figure 2. Classification of articles by year of publication.
Sustainability 10 03692 g002
Figure 3. Classification of articles considering the used keywords.
Sustainability 10 03692 g003
Figure 4. Results of AMC simulation of Scenario 1 with the original dataset: Distribution of employees through the time window.
Sustainability 10 03692 g004
Figure 5. Results of AMC simulation of Scenario 1 with the original dataset: Planned and simulated number of employees in each group.
Sustainability 10 03692 g005
Figure 6. Results of AMC simulation of Scenario 1 with the original dataset: Distribution of employees through the time window.
Sustainability 10 03692 g006
Figure 7. Results of AMC simulation of Scenario 1 with the original dataset: Planned and simulated number of employees in each group.
Sustainability 10 03692 g007
Figure 8. Results of AMC simulation of Scenario 2 with the original dataset: Distribution of employees through the time window.
Sustainability 10 03692 g008
Figure 9. Results of AMC simulation of Scenario 2 with the original dataset: Planned and simulated number of employees in each group.
Sustainability 10 03692 g009
Figure 10. Results of AMC simulation of Scenario 2 with the original dataset: Distribution of employees through the time window.
Sustainability 10 03692 g010
Figure 11. Results of AMC simulation of Scenario 2 with the original dataset: Planned and simulated number of employees in each group.
Sustainability 10 03692 g011
Figure 12. Dynamic of parameters in Scenario 2: Dynamic of the recruitment rate.
Sustainability 10 03692 g012
Figure 13. Dynamic of parameters in Scenario 2: Number of employees left the firm through the time window of analysis.
Sustainability 10 03692 g013
Table 1. Extended promotion matrix.
OperatorTechnicianSupervisorLine ManagerUnchallenged by the WorkLack of RecognitionFinancial Reasons
Operator0.800.150.000.000.020.010.02
Technician0.000.850.120.000.010.010.01
Supervisor0.000.000.800.050.020.030.10
Line Manager0.000.000.000.800.040.050.11
Table 2. Recruitment rate.
OperatorTechnicianSupervisorLine Manager
10.600.250.100.05
20.620.230.110.04
...0.650.200.100.05
n0.700.180.080.04
Table 3. Employment matrix and recruitment rate matrix calculated by AMC simulation.
E123456R123456
12517151412710.40.20.150.10.10.05
242.623.620.119.4159.2220.330.180.150.150.120.07
345.623.720.723.715.710.530.330.170.150.170.110.08
448.523.921.228.116.711.740.320.160.140.190.110.08
551.224.121.632.517.912.750.320.150.140.20.110.08
653.724.321.936.919.413.860.320.140.130.220.110.08
757.625.222.842.421.715.370.310.140.120.230.120.08
859.825.422.946.723.716.580.310.130.120.240.120.08
960.42522.449.725.217.490.30.130.110.250.130.09
1061.725.122.253.227.118.6100.30.120.110.260.130.09
1162.7252256.429.119.9110.290.120.10.260.140.09
1264.525.42260.131.521.5120.290.110.10.270.140.1
1364.825.221.662.433.322.7130.280.110.090.270.140.1
1468.826.522.468.136.925.3140.280.110.090.270.150.1
1568.726.221.969.938.626.7150.270.10.090.280.150.11
1670.326.62273.341.128.6160.270.10.080.280.160.11
1771.326.9227643.430.5170.260.10.080.280.160.11
1871.326.721.677.54531.9180.260.10.080.280.160.12
1970.826.421.278.346.233.1190.260.10.080.280.170.12
2070.826.320.979.747.734.5200.250.090.070.280.170.12
Table 4. Employment matrix and recruitment rate matrix calculated by AMC simulation.
E123456R123456
13525221510310.50.240.120.050.040.05
245.429.525.516.18.555.0920.350.230.1960.1240.0660.039
344.131.530.819.89.014.830.310.230.220.1410.0640.034
442.433.336.523.69.574.6340.280.220.2430.1570.0640.031
540.434.942.427.510.24.5850.250.220.2650.1720.0640.029
638.336.448.231.5114.6260.230.210.2840.1850.0650.027
737.338.755.536.412.24.8870.20.210.30.1970.0660.026
835.239.961.340.413.15.0780.180.20.3150.2070.0670.026
932.34065.443.313.85.1890.160.20.3270.2170.0690.026
1030.240.770.246.814.75.42100.150.20.3380.2250.0710.026
1128.341.274.549.815.55.66110.130.190.3460.2320.0720.026
1227.142.379.553.516.66.01120.120.190.3530.2380.0740.027
1325.542.582.655.817.36.23130.110.180.3590.2430.0750.027
1424.743.787.459.218.46.6140.10.180.3640.2470.0770.027
1524.144.99262.619.46.97150.10.180.3680.250.0780.028
1623.746.196.565.920.57.35160.090.180.3710.2530.0790.028
1723.447.41016921.57.72170.090.180.3740.2560.080.029
1823.248.710572.222.58.09180.080.170.3760.2580.080.029
1923.250.110975.223.58.46190.080.170.3770.2590.0810.029
2023.351.511478.224.58.82200.080.170.3790.2610.0820.029

