An Approach to Discovering Product/Service Improvement Priorities: Using Dynamic Importance-Performance Analysis


1
School of International Business, Jinan University (Zhuhai Campus), Zhuhai 519070, China
2
Institute of Management Science and Engineering, Jinan University (Zhuhai Campus), Zhuhai 519070, China
3
University of Aberdeen Business School, Scotland AB24 5UA, UK
*
Author to whom correspondence should be addressed.
Sustainability 2018, 10(10), 3564; https://doi.org/10.3390/su10103564
Submission received: 27 August 2018
/
Revised: 22 September 2018
/
Accepted: 1 October 2018
/
Published: 5 October 2018
(This article belongs to the Section Economic and Business Aspects of Sustainability)
Abstract
:The cost budget and resources of a business are limited. In order to be competitive sustainably in the market, it is necessary for a businesses to discover the improvement priorities of their product/service features effectively and allocate their resources appropriately for higher customer satisfaction. Online customer review mining has been attracting increasing attention for businesses to discover priorities of product/service improvement from online customer reviews. Despite some prior related studies, their methods have several limitations, such as simply using the frequencies of mentioned product features in reviews as an indicator of importance; neglecting the market competition; and focusing only on the static importance and performance of the target product/service features. To address those limitations, this study proposes a novel approach to discovering a product/service’s improvement priorities through dynamic importance-performance analysis of online customer reviews. It first clusters similar features into a feature group and calculate the relative performance of the feature groups using sentiment analysis. Next, the importance of each feature group’s performance to overall customer satisfaction is measured by the factor categories based on the Kano’s model. The factor categories are determined by the significance values of each feature group in both positive and negative sentiment polarities derived from the constructed decision tree. Finally, feature improvement priorities of a target product/service will be discovered based on the dynamic performance trend and predicted importance using a dynamic importance-performance analysis. The evaluation results show that the dynamic importance-performance analysis approach proposed in this study is a much better approach for product/service improvement priorities discovering than the product opportunity mining approach proposed in the prior studies. This study makes new research contributions to automatic discovery of product/service improvement priorities from large-scale online customer reviews. The proposed approach can also be used for product/service performance monitoring and customer needs analysis to improve product/service design and marketing campaigns.
1. Introduction
In order to be competitive sustainably in the market, businesses need to understand customers’ needs and preferences continuously so as to design better products/service and gain competitive advantages. However, the cost budget and resources of a business are limited, it is necessary for businesses to discover the improvement priorities of its product/service features effectively and allocate their resources appropriately for higher customer satisfaction.
Online customer reviews (OCRs) have become a popular source for businesses to get feedback from their customers and improve their product/service quality [1]. To achieve this goal, a key task is to understand the strengths and weaknesses of their current products/service based on customers’ comments on products/service in OCRs [2]. The ever-increasing volume and unstructured textual content of OCRs, however, make navigation and analysis of OCRs and identification of customer experience with products/service very challenging and time consuming [3,4]. Therefore, there is an imperative need for effective and automated discovery of product/service features improvement priorities from OCRs. A common method for identifying customers’ feeling about products/service is sentiment analysis of OCRs, which is concerned with identifying emotions and opinions from textual review contents using natural language processing, text analytics, and computational linguistics [5,6]. Jeong et al. [7] classified sentiment analysis approaches into the lexicon-based [8,9], text classification-based [10], and deep learning-based approaches [11,12,13]. Such automated approaches need to be adapted in different contexts [14], such as different business domains in and objectives for which OCRs are analyzed, to ensure that they provide accurate practical implications.
To address this question, first of all, it should be considered that a purpose of discovering product/service’s improvement priorities is to examine the performance of a target product/service from the customers’ perspective, and to discover which product/service feature(s) should be improved first. In this regard, as prior studies have noted, a gap-based approach was proposed to direct product/service quality diagnosis and improvement towards a customer-oriented focus [15,16]. Similarly, a product opportunity mining approach combing the values of importance and satisfaction into a single metric was proposed [7]. These studies used the sentiment scores to measure the performance of each product/service feature and used the frequencies of the mentioned product/service features to measure their importance to customer satisfaction. Then they used an algorithm considering both the performance and importance of each product/service feature to determine which product/service feature(s) should be improved first. However, these studies have several limitations. First, they merely focused on the actual performance of each product/service feature, which means that they only measured the performance of the target product/service features themselves without comparing with other products/service in the market segment. Second, they calculated the frequency of mentioned product/service features in OCRs as an indicator of importance that how important each product/service feature’s performance is to overall customer satisfaction. However, it is a rough way to measure the importance. A product/service feature mentioned more does not mean that its performance has greater influence on overall customer satisfaction all the time. Maybe its performance only has greater influence on overall customer satisfaction when it is low or high. It has been recognized that the relationship between feature performance and overall customer satisfaction in the real world is nonlinear and asymmetrical [17,18]. To address the limitations of these studies, importance-performance analysis (IPA) is an appropriate approach to discover the improvement priorities of each product/service feature. IPA was first introduced by Martilla and James [19] as a framework for analyzing product/service’s features in order to identify the critical ones. It has been used and improved by many scholars in view of the limitations of the above studies. However, most IPAs have been based on a standardized questionnaire which inevitably requires considerable time and resources. It has not been applied to analyze OCRs and could not monitor dynamic change of the information in time.
Given these considerations, to help the businesses to be competitive sustainably in the market under certain cost budget and resources, this study proposes an approach to discovering product/service improvement priorities from OCRs using dynamic IPA. First of all, this study uses sentiment analysis to derive the feature performance of both the target product/service and its major competitors in the market segment from OCRs. The relative performances are calculated to further consider the situation of the market segment. The OCRs of the last three years are analyzed and the dynamic trends of each product/service feature’s relative performance are monitored. Second, a decision tree model is constructed based on the overall customer satisfaction and the OCRs’ sentiment polarities of each product/service feature. The importance of each product/service feature’s performance to overall customer satisfaction are then measured by the Kano’s model categories based on the significance values derived from the decision tree model. Similarly, the dynamic trends of each product/service feature’s importance are monitored and the future importance can be predicted based on the dynamic trends. Finally, the relative performance and predicted importance (Kano’s model categories) are subsequently used as coordinates for plotting product/service features in two-dimensions. The IPA map is graphically presented as grid divided into different quadrants and different strategies are proposed to handle features in different quadrants.
There are three elements of academic contribution of this study. First, to better discover product/service improvement priorities, the feature performance of both target product/service and its major competitors in the market segment are analyzed in this study, further considering the competition and overall situation in the market segment which most prior related studies neglected. Second, considering the real word situation that the relationship between feature performance and overall customer satisfaction is nonlinear and asymmetrical, this study derived the significance values of each product/service feature to overall customer satisfaction in both positive and negative sentiment polarities from the constructed decision tree model. Third, in order to apply IPA into OCR analysis for dynamic monitoring and more accurate product/service improvement priority discovery, the relative performance and importance are derived by sentiment analysis and decision tree modeling. The OCRs of the last three years are collected for dynamic analysis.
From a practical perspective, our approach helps the businesses to monitor the dynamic trend of customer needs and decide resource allocation and improvement priorities more effectively. It is an efficient approach for businesses to get higher customer satisfaction with limited resources and to be competitive sustainably in the market.
The rest of this paper is organized as follows. The following section describes the related works on this topic. Section 3 presents the proposed approach in detail. Section 4 uses a case study of Huawei P-series smartphones to verify the feasibility and validity of the proposed approach. Finally, implications of the findings and future directions are presented in Section 5.
2. Related Works
In recent years, OCRs have become a popular source for businesses to get feedback from their customers and to discover their product/service defects and improvement. Thus, this study proposes an approach to discovering product/service improvement priorities from OCRs using dynamic IPA. Three groups of related works for discovering product/service defects and improvement are reviewed here.
Firstly, several studies focused on classifying the product/service features that influence the customer satisfaction with the product/service and identifying the important ones. They used a topic model-based method, fuzzy method, or a new proposed framework to classify the product/service features extracted from OCRs and identified the important ones based on the mentioned frequencies principally. Li et al. [20] first extracted and grouped feature expressions simultaneously using a topic model-based method, and then used sentiment scores to measure customer satisfaction according to a product’s different features and provide opinion summaries. Guo et al. [21] classified the features of customer service voiced by hotel visitors using latent Dirichlet analysis and further identified the important ones using perceptual mapping. Besides, Wei et al. [1] proposed an automatic HQA method based on fuzzy methods to classify the product/service features that influence the customer satisfaction for automatic hotel service quality evaluating. Kang and Park [22] proposed a framework for measuring customer satisfaction of service based on the user generated contents using sentiment analysis and VIKOR approach. However, these studies mainly focused on how to better classify the product/service features that influence customer satisfaction and identity the important ones, without considering that the important product/service features to customer satisfaction may already have quite high performance so that it is wasteful to further allocate resources to improve them.
Secondly, some studies further identified the strengths and weaknesses of the product/service derived from OCRs and decided which product/service features should be improved based on not only the importance to customer satisfaction but also the performance of each product/service feature. They used the sentiment scores calculated by sentiment analysis of OCRs to measure the performance of each product/service feature and used the frequencies of the mentioned product/service features to measure their importance to customer satisfaction. Then they used an algorithm to calculate a value considering both the performance and importance of each product/service feature to determine which product/service feature(s) should be improved first. A gap-based approach was proposed to direct product or service quality diagnosis and improvement towards a customer-oriented focus [15,16]. The gap-based approach used the difference value between the customer expectation score and customer perception score of each product or service feature to identify those that are in most urgent need of improvement to yield better customer satisfaction. Similarly, a product opportunity mining approach combing the values of importance and satisfaction into a single metric was proposed to identify potential opportunities for product topics obtained from social media data from the customer perspective [7]. However, although these studies further considered the performance of each product/service feature, they merely measured the performance of the target product/service features themselves without comparing with other products/service in the market segment. Neglecting the situation of the market segment may easily lead to improper decision-making. Besides, they used the frequencies of the mentioned product/service features to measure their importance to customer satisfaction roughly. It has been recognized that the relationship between feature performance and overall customer satisfaction in the real world is nonlinear and asymmetrical [17,18]. It is necessary to differentiate the importance of each product/service feature to customer satisfaction when their performance are high and low.
Thirdly, before OCR mining, several studies have proposed some approaches to get feedback from their customers and discover their product/service defects and improvement based on the data collected by questionnaires. Importance-performance analysis (IPA) is one of the most effective ones. IPA was first introduced by Martilla and James [19] as a framework for analyzing product/service features in order to identify the critical ones. IPA measures the performance and importance of each product/service feature based on the scores filled in the questionnaires by customers and the calculated mean performance and importance scores are subsequently used as coordinates for plotting product/service features in two dimensions. An IPA map is graphically presented as a grid divided into four quadrants and different strategies will be proposed to handle features in different quadrants.
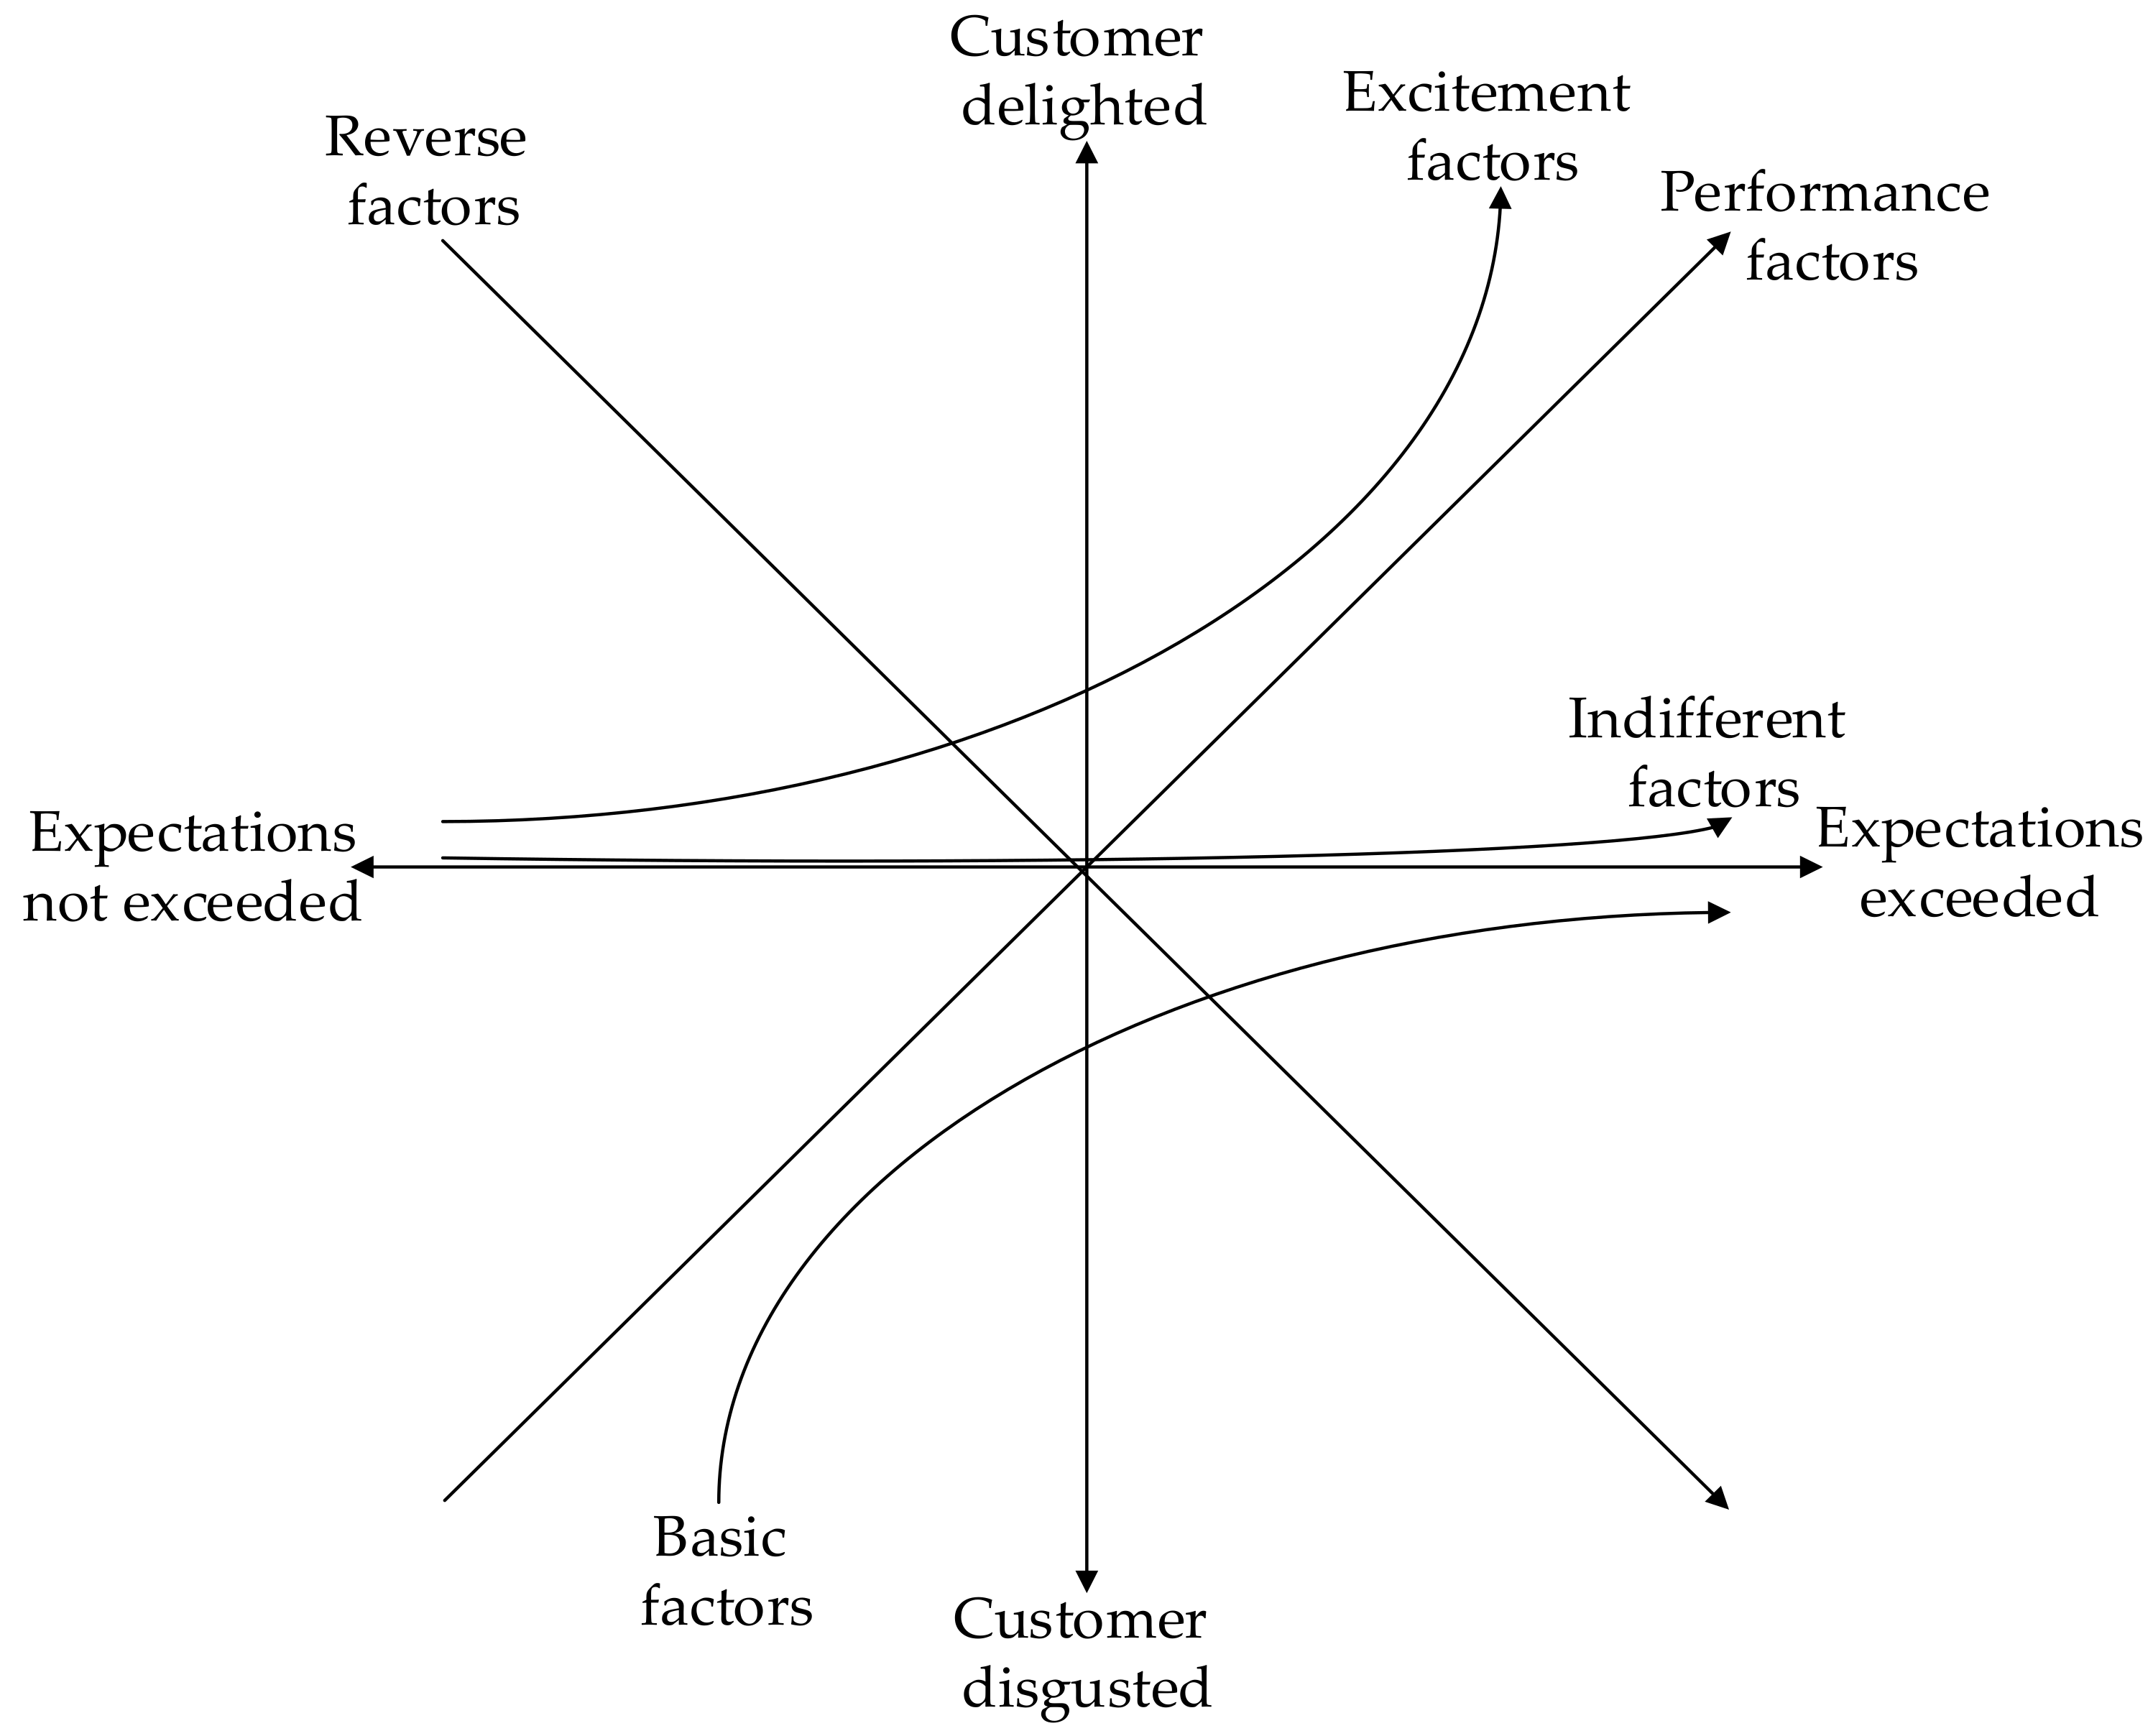
After decades of in-depth research on IPA, a lot of researchers have proposed methods for improving IPA from both importance and performance perspectives. More and more researchers derived importance of product/service features to customer satisfaction based on the three-factor theory developed by Kano et al. [17]. The theory states that the basic factors of customer satisfaction are minimum requirements. Customers are highly dissatisfied if the basic factors are not fulfilled. On the contrary, excitement factors of customer satisfaction are features that increase customer satisfaction greatly if they are fulfilled, but cause no dissatisfaction if they are not fulfilled. Furthermore, the performance of the performance factors of customer satisfaction have a linear correlation with customer satisfaction. The three-factor theory further expanded to five factors afterwards, and it is shown in Figure 1.
They derived the importance of product/service features to customer satisfaction based on three-factor theory by multiple regression [23,24,25,26,27], partial correlation [28,29,30,31], explicit and implicit importance matrix [32,33,34], or the ratio of satisfied coefficient and dissatisfied coefficient [35]. As for the revision of feature performance, Deng et al. [36] derived the performance of target product/service features relative to the best competitor. Taplin [37] used benchmarking against competitors to derive relative product/service feature performance. However, although IPA has been proved to be an effective approach to discover the improvement priorities of the product/service features, few studies applied it in OCR analysis [38,39]. IPA based on the data collected by questionnaires inevitably requires considerable time and resources, and it cannot monitor dynamic change of the information in time. The comparison of traditional IPA based on questionnaires and dynamic IPA based on OCRs is shown in Table 1.
It can be seen obviously from Table 1 that dynamic IPA is better than traditional IPA in several aspects. Therefore, in order to apply revised IPA into OCR analysis for automatic improvement priorities discovering and dynamic monitoring, it is a good idea to choose an appropriate method above to derive revised importance and relative performance of each product/service feature which can also be realized by text mining and processing.
3. Proposed Approach
The approach to discovering product/service improvement priorities from OCRs using dynamic IPA is built on three modules: sentiment analysis, decision tree modeling and IPA. First of all, this study uses sentiment analysis to derive the feature performance of both the target product/service and its major competitors in the market segment from OCRs. The relative performances are calculated by dividing the target product/service feature performance by the average feature performance of the major products/service in the market segment. OCRs from the past three years are analyzed and the dynamic trends of each product/service feature’s relative performance are monitored. Second, decision tree model is constructed based on the overall customer satisfaction and the OCRs’ sentiment polarities of each product/service feature. The significance values of each product/service feature to overall customer satisfaction in both positive and negative sentiment polarities are calculated. The importance of each product/service feature’s performance to overall customer satisfaction is then measured by the Kano’s model categories based on the significance values derived above. Similarly, the dynamic trends of each product/service feature’s importance are monitored and the future importance can be predicted based on the dynamic trends. Finally, the relative performance is divided into four groups based on their value sizes. The relative performance and predicted importance (Kano’s model categories) are subsequently used as coordinates for plotting product/service features in two-dimensions. The IPA map is graphically presented as grid divided into 16 areas and different strategies are proposed to handle features in different areas. The process of the proposed approach is shown in Figure 2.
3.1. Step 1: Data Collection and Processing
As the proposed approach not only focuses on the target product/service itself, but also considers its competitors in the market segment, the first step is to collect OCRs of the target product/service and its competitors in the market segment. Both the overall customer satisfaction rating and reviews need to be collected. These OCRs can be obtained via various online channels, such as e-commerce websites, online customer communities, and social media. Besides, the proposed approach considers the dynamic change of OCRs, so that the OCRs of products/service of recent generations (the last three years) should be collected as well.
Once a set of OCRs mentioned above has been prepared, the keywords of product/service features, opinions’ modifiers and opinions are extracted from OCRs, such as (screen, very, clear). Stanford CoreNLP is used to split sentences, segment words, POS tag and parse sentences, which is one of the most used natural language analysis toolkits. It is a fairly small and self-contained natural language analysis system that is easy to use. Furthermore, most users benefit greatly from the provision of a set of stable, robust, high quality linguistic analysis components, which can be easily invoked for common scenarios [40].
In order to better extract the keywords of product/service features, opinions’ modifiers, and opinions in Chinese OCRs, these keywords are extracted according to the extract rules of Language Technology Platform (LTP), which is an appropriate tool for Chinese natural language processing developed by Harbin Institute of Technology [41]. The tags of LTP’s sentences parsing are shown in Table 2.
As the tags of Stanford CoreNLP’s sentence parsing are similar with LTP’s, the extract rules of LTP can be applied into Stanford CoreNLP with some adjustment. There are two extract rules of LTP [41]. First, if the sentences parsing tag of a sentence is “SBV”, “ATT”, or “CMP”, the noun, gerund, or verb in the sentence are the keywords of product/service features and the corresponding adjectives are the keywords of opinions. Second, if the sentences parsing tag of a sentence is “ADV”, the corresponding adverb of the opinion keyword is its modifier. Based on these two extract rules, a set of vectors (feature, modifier, opinion) can be constructed from the OCRs.
Furthermore, the performance of each product/service feature are measured by the sentiment scores of the vectors (feature, modifier, opinion). According to Wu et al. [41], the opinion word’s sentiment score is calculated based on the similarity between the opinion words and the benchmark words which have obvious sentiment polarities as
where represents pairs of benchmark sentiment words derived from HowNet including one positive word and one negative word; represents a positive word and represents a negative word. and represent adjustable parameters to adjust the accuracy of the algorithm. and represent the similarity between the opinion word and the positive benchmark word and the similarity between the opinion word and the negative benchmark word respectively which is calculated based on Tongyici Cilin [42]. Tongyici Cilin includes not only the synonyms of a word, but also some generalized related words. The amount of the words included in it have been expanded to 70,000 by Harbin Institute of Technology.
Besides, considering the modifier of the opinion word, this study calculates its modifying strength according to its similarity to the benchmark word like the methodology mentioned above. Therefore, if both opinion word and its modifier appear in the vector (feature, modifier, opinion), the sentiment score of this vector is calculated by formula [41] or else .
where represents the modifying strength of the opinion’s modifier. represents the sentiment score of the opinion word calculated by formula (1). represents displacement index and is set as 0.5 here. In order to calculate conveniently, the modifying strengths of modifiers are divided into different degrees with a benchmark word in each degree as shown in Table 3.
When there are other modifiers, the similarity between these modifiers and benchmark words are calculated according to the similarity formula. The modifying degree of the benchmark word with the biggest similarity is used as the modifying degree of the modifiers. Besides, when there are negative modifiers, the sentiment score . After the process above, a set of vectors (feature, sentiment score) can be obtained and the performance of each product/service feature are measured by these sentiment scores.
3.2. Step 2: Performance Analysis
In this step, group-based sentiment scores are calculated to measure the performance of each target product/service’s feature group. The product/service features in the vectors obtained in Step 1 are divided into different groups according to the product/service hierarchy manually. After dividing the product/service features into groups, the average sentiment score of product/service features in each group is calculated as the performance of each target product/service’s feature group as
where represents the performance of the target product/service ’s feature group, represents the performance of the target product/service ’s feature belonging to the feature group, represents the amount of the features belonging to the feature group.
As mentioned above, the OCRs of the target product/service and its main competitors in the market segment are collected. Both the performance of the target product/service and the major products/service in the market segment are calculated. Relative performance is analyzed here rather than actual performance which neglects the comparison with target product/service’s major competitors in the market segment. The relative performance is calculated by Formula (4), developed by this study as
where represents the relative performance of the target product/service ’s feature group, represents the performance of the competitor’s feature group, represents the market share of the competitor, represents the amount of competitors in the market segment.
Relative performance of target product/service’s feature groups in the last three years is calculated and the dynamic trends of each feature group’s relative performance are drawn in the line chart. Problems of the target product/service can be detected by the identification of negative trends. Furthermore, performance comparisons of target product/service’s underperforming feature groups among the target product/service and its main competitors in the market segment are delineated by radar map in detail.
3.3. Step 3: Importance Analysis
In this step, considering the real word situation that the relationship between feature performance and overall customer satisfaction is nonlinear and asymmetrical, this study derived the significance values of each product/service feature to overall customer satisfaction in both positive and negative sentiment polarities from the constructed decision tree model. The importance of each product/service feature’s performance to overall customer satisfaction are then measured by the Kano’s model categories based on the significance values derived above.
The constructed decision tree model allows the consideration of the influence of the presence/absence of positive/negative OCRs of each product/service feature groups on overall customer satisfaction. In other words, this approach is able to identify non-linear dependencies between overall customer satisfaction and satisfaction with each product/service feature group. The decision tree model also allows the detection of the most significant product/service feature groups that are essential for the customers [43].
The decision tree in our research is constructed based on a C4.5 algorithm which is one of the most commonly-used algorithms in decision tree modelling proposed by Quinlan [44]. The independent variables of the decision tree are the customer satisfaction with each product/service feature group (presence/absence of positive and negative OCRs on each product/service feature groups) and the dependent variable of the decision tree is the overall customer satisfaction with the product/service (positive/negative). An example of the decision tree model’s data set is shown in Table 4.
Therefore, nodes of the decision tree are the variables of positive and negative OCRs on the feature groups. Edges of the tree are the values of the variables of positive and negative OCRs on the feature groups, i.e., 1 is presence, 0 is absence. Leaves present the sentiments of overall customer satisfaction in the OCRs, i.e., each branch leads to either a positive or a negative customer satisfaction. According to the C4.5 algorithm, the decision tree model is constructed according to gain ratio as
where represents the information entropy of the data set, the proportion of the th sample group is and represents the variables of positive and negative OCRs on the feature groups. Variable has possible values {} ( is two in this model, presence or absence) and represents the samples whose value of are . represents the information gain of variable and represents the intrinsic value of variable .
The alternative classifying variables are chosen from the variables whose information gain are higher than the average information gain first and then the variable whose gain ratio is the highest is chosen to be the classifying variable. Based on this classifying principle, the decision tree model is constructed and the rules of the decision tree can be extracted. One example of the constructed decision tree model and its rules is shown in Figure 3.
Besides, the significance of each product/service feature group can be calculated. Significance of each feature group shows how much the sentiment of an OCR depends on the feature group in positive and negative sentences. Setting the amount of feature groups as , then the amount of independent sentimental variables is . According to Yussupova et al. [45], the significance of variable m is calculated as
where represents the amount of nodes that were split by feature group , represents entropy of the parent node, split by feature group , represents entropy of the child nodes for , which was split by feature group , , represents the amount of examples in the corresponding nodes, represents the amount of child nodes for parent node.
Furthermore, according to each feature group’s significance values in both positive and negative sentiment polarities, the significances of each product/service feature performance on overall customer satisfaction are converted into the categories of the Kano’s model (shown in Figure 1) as each product/service feature’s importance to customer satisfaction. According to Füller and Matzler [35], if the significance value of positive sentiment polarity is significantly smaller than that of negative sentiment polarity, the feature group is classified into basic factor of customer satisfaction. If the significance value of positive sentiment polarity is similar to that of negative sentiment polarity, the feature group is classified into performance factor of customer satisfaction. If the significance value of positive sentiment polarity is significantly bigger than that of negative sentiment polarity, the feature group is classified into excitement factor of customer satisfaction. If both the significance value of positive sentiment polarity and negative sentiment polarity are close to 0, the feature group is classified into indifferent factor of customer satisfaction.
Similarly, the dynamic trend of the target product/service feature’s importance to customer satisfaction as well as that of the market segment can be analyzed. From the dynamic trend, the future importance of each product/service feature group to customer satisfaction can be predicted.
3.4. Step 4: Importance-Performance Analysis
In this step, the levels of relative performance of product/service feature are divided into four levels as ‘very low’, ‘low’, ‘high’, and ‘very high’ and feature groups were placed in twelve regions according to Lai et al. [33], as shown in Table 5. Different resources allocation strategies are recommended according to the relative performance and importance of the feature groups. For the basic factors of customer satisfaction, when the level of relative performance is ‘very low’, it is recommended that businesses should make more efforts to improve them. This is because the overall customer satisfaction is really low when the level of performance of basic factors is under the average level. When the level of relative performance is ‘low’, placing low priority on efforts to improve them is recommended. When the level of relative performance is ‘high’ or ‘very high’, it is recommended that businesses should ‘reduce’ or ‘slightly reduce’ their resources to them because exceeded performance does not increase customer satisfaction any more. For the performance factors of customer satisfaction, when the level of relative performance is ‘very low’ or ‘low’, it is recommended that businesses should improve resources or place low priority on efforts to improve their performance. This is because the efficiency to improve the overall customer satisfaction by improving performance factors is not low. When the level of relative performance is ‘high’ or ‘very high’, it is recommended that businesses should keep or reduce resources to improve their performance, because the efficiency to improve the overall satisfaction by improving performance factors is not high enough and there may be better way to improve the overall customer satisfaction by same amount of resources. There are two resources allocation strategies for the excitement factors of customer satisfaction when the level of relative performance is ‘very low’ or ‘low’. If firms have sufficient resources, it is recommended that they should make more effort to improve or largely improve their performance. This is because customers will only be satisfied when the level of performance of excitement factors exceeds the average level. On the other hand, if firms only have limited resources, firms should utilize their resources more effectively and they should concentrate their efforts on improving performance factors and keeping the performance of these excitement factors at the current level. Besides, when the level of performance is ‘high’ or ‘very high’, it is still necessary to keep or place a low priority on efforts to improve them, because there is still room for increasing satisfaction.
However, considering that there may be some product/service features belonging to indifferent factors of customer satisfaction, whose performance have no influence on overall customer satisfaction. For indifferent factors, it is recommended that businesses should reduce resources allocated on them no matter what performance levels of these product/service features are. Any resources allocated to improving these product/service features are wasteful as the performance of these product/service features cannot influence the overall customer satisfaction.
4. Case Study: Huawei P-Series Smartphones
In this section, in order to verify the feasibility and validity of the proposed approach, its process is illustrated using OCRs related to Huawei P-series smartphones and their major competitors in the market segment in the last three years. As smartphones have various features and a huge number of customers actively discuss it online, it is an appropriate product to demonstrate the improvement priorities discovering process clearly. Huawei P-series smartphones are popular smartphones and appropriate for the case study.
4.1. Data Collection and Processing
As Jingdong (https://www.jd.com) is one of the most commonly used e-commerce websites for customers to buy digital products in China and there are large-scale relatively effective OCRs, it is used as the data source of this case study.
To analyze the performance and importance of a target product and its major competitors in the market segment, based on the market positioning and pricing of Huawei P-series smartphones, the OCRs of Huawei P-series smartphones and the top sellers in the 2500–3500 RMB market segment in the last three years are collected. The amounts of each product’s OCRs collected are shown in Table 6 and Table 7.
Stanford CoreNLP is used to split sentences, segment words, POS tag and parse sentences, and keywords of product features, opinions, and opinions’ modifiers are extracted from the OCRs. The sentiment score of the vector (feature, modifier, opinion) is calculated according to Formulas (1) and (2) to measure the performance of each product feature. Some samples of Huawei P20’s extracted keywords and their sentiment scores are shown in Table 8.
In order to calculate the total sentiment score of the market segment, the market share based on the OCRs amounts are used as each product’s weight. As most of the OCRs of a product are positive, to calculate the significance of each product’s feature group in both sentiment polarities accurately, equal amounts of positive and negative OCRs were analyzed.
4.2. Performance Analysis
In order to derive the performance of the smartphone’s feature groups, the features are classified into feature groups. However, as the length of most sentences in Jingdong’s OCRs are short, the classification effects of the automatic algorithms completely dependent on computer are bad. Therefore, this study classified the features into feature groups manually according to Li et al. [46], which are shown in Table 9.
This study used some of the OCRs’ product features randomly as training samples to establish more accurate classification standards, and the rest of the product features are classified into feature groups automatically based on the classification standards established before.
The sentiment scores of the smartphone’s feature groups are calculated according to Formula (3) to measure the performance of each smartphone feature group. The actual performance of Huawei P-series smartphones’ feature groups and the 2500–3500 RMB market segment’s feature groups in the last three years are shown in Table 10 and Table 11.
The higher the value of actual performance is, the better the actual performance is. The negative value of actual performance means that customers are dissatisfied with the performance of the product feature and the lower the negative value of actual performance is, the more dissatisfied the customers are. Besides, if the value of the product feature’s actual performance is 0, it means that the product feature is not mentioned in the OCRs.
To analyze the dynamic actual performance trend of Huawei P-series smartphone feature groups, Figure 4 shows a line chart of their actual performance:
It can be seen from the line chart that the actual performance of “Basic function” improved in 2017 but decreased recently. The actual performance of “Performance”, “Customer feedback” kept decreasing from 2016 to 2018. These feature groups should be given more attention.
In order to compare with the major competitors in the market segment, the relative performance of Huawei P-series smartphones’ feature groups is assessed according to Formula (4), and the results are shown in Table 12.
If the values of the actual performance of both the target product feature and the market segment feature are positive, the higher the value of relative performance is, the better the relative performance of the target product feature is. On the contrary, if the values of the actual performance of both the target product feature and the market segment feature are negative, the lower the value of relative performance is, the better the relative performance of the target product feature is. Besides, when the value of relative performance is negative, the relative performance of the target product feature is high if the value of the actual performance of the target product feature is positive, while the relative performance of the target product feature is low if the value of the actual performance of the target product feature is negative.
To analyze the dynamic relative performance trend of Huawei P-series smartphones’ feature groups intuitively, a line chart is drawn based on their relative performance in Figure 5.
From the line chart can be seen that Huawei P-series smartphones’ relative performance of ‘beautify’, ‘basic function’, ‘data function’, and ‘entertainment function’ improved in 2017 but decreased recently while only “basic function” can be found this trend in the dynamic actual performance trend. Huawei P-series smartphones’ relative performance of ‘performance’ and ‘customer feedback’ kept decreasing from 2016 to 2018, which is consistent with the dynamic actual performance trend. These underperforming feature groups should be given more attention. Furthermore, to mine the details of these underperforming feature groups’ comparison with the major competitors in the market segment, a radar map of these underperforming feature groups is shown in Figure 6.
As shown in Figure 6, Xiaomi MIX2s performs pretty well in all these feature groups. The actual performance of Huawei P20 in these feature groups are similar to other competitors in the market segment except ‘performance’, which is significantly worse. Therefore, it is necessary for Huawei to improve its P20 smartphone’s ‘performance’ to catch up with its competitors.
4.3. Importance Analysis
By analyzing significance value of product’s feature groups on overall OCR’s sentiment in both negative and positive sentiment polarities, the importance of each feature group is converted into the Kano’s model categories according to each factor category’s characters. The importance analysis results of Huawei P-series smartphones in the last three years are shown in Table 13, Table 14 and Table 15.
The summarized importance analysis results of Huawei P-series smartphones’ feature groups in the last three years are shown in Table 16.
Similarly, the importance analysis results of the 2500–3500 RMB market segment’s feature groups in the last three years are shown in Table 17.
According to Table 16 and Table 17, the dynamic importance trends of ‘appearance design’, ‘basic function’, ‘data function’, ‘beautify’, ‘hardware’ of Huawei P-series smartphones are similar to that of the market segment. The future importance of these feature groups can be predicted as ‘excitement factor’, ‘excitement factor’, ‘indifferent factor’, ‘indifferent factor’, and ‘excitement factor’ in turn based simply on the trend. Besides, the importance of Huawei P-series smartphones’ ‘Entertainment function’ remains as ‘Indifferent factor’ in the last three years but is really different with the trends of the market segments. This maybe because Huawei P-series smartphones have been positioned in the photography enthusiasts’ market and their target customer group is indifferent with the ‘entertainment function’. Therefore, the future importance of Huawei P-series smartphones’ ‘entertainment function’ is still predicted as ‘indifferent factor’ and the future importance of its ‘photograph function’ is still predicted as ‘excitement factor’. As for ‘cost performance’, the importance of Huawei P-series smartphones changing from ‘excitement factor’ to ‘indifferent factor’ while the importance of market segment changes from ‘performance factor’ to ‘excitement factor’. This maybe because Huawei P-series smartphones are ahead of the market segment in ‘cost performance’ and they cannot improve customer’s satisfaction sharply anymore. Therefore, considering the situation of the market segment, the future importance of Huawei P-series smartphones’ ‘cost performance’ is predicted as the ‘performance factor’. Similarly, the future importance of Huawei P-series smartphones’ ‘phone accessories’, ‘performance’, and ‘sound’ are predicted as ‘performance factor’, ‘performance factor’, and ‘basic factor’ respectively. Furthermore, for ‘customer feedback’, the importance of Huawei P-series smartphones change to ‘Excitement factor’ while the importance of market segment changes to ‘indifferent factor’. This maybe because Huawei P-series smartphones are behind the market segment in ‘customer feedback’ and it is still a good choice to sharply improve customers’ satisfaction. Thus, the future importance of Huawei P-series smartphones’ ‘customer feedback’ is predicted as ‘excitement factor’. Similarly, the future importance of Huawei P-series smartphones’ ‘screen’ is predicted as ‘performance factor’.
4.4. Importance-Performance Analysis
The relative performance of Huawei P-series smartphones’ feature groups ranges from 0.449 to 1.861 and they are divided into four levels using the cross-points 0.775, 1.15, and 1.525. Considering the trend of the importance of both Huawei P-series smartphones’ and the 2500–3500 RMB market segment’s feature groups, the future Kano’s model categories of Huawei P-series smartphones’ feature groups are predicted based on them. After deriving the relative performance and predicted importance, the IPA strategy can be made according to Table 5. The results of the IPA of Huawei P-series smartphones’ feature groups are shown in Table 18.
Compared with the actual performance and relative performance, it can be seen that the actual performance of most feature groups is ‘very low’ or ‘low’. This is because only the actual performance of ‘appearance design’ is high so that the actual performance of other feature groups will be classified into ‘low’ or ‘very low’ group as the groups are classified by quartering the range. The result of IPA based on actual performance will be too concentrated and inaccurate. This problem can be solved by relative performance as it also considers the performance of the market segment, so that the distribution of performance will become more dispersive. Therefore, it is more effective to analyze importance-performance based on relative performance.
As the predicted importance of Huawei P-series smartphones’ ‘entertainment function’, ‘data function’, and ‘beautify’ are ‘indifferent factor’, resource allocation should be kept if its performance is ‘very low’ or ‘low’ and reduced if its performance is ‘high’ or ‘very high’. Otherwise, the resource allocated on them are wasted. Then, as the predicted importance of Huawei P-series smartphones’ ‘sound’ is ‘basic factor’, resource allocation should be reduced when its performance is ‘very high’. Because very high performance of ‘basic factor’ cannot improve customers’ satisfaction anymore, and a large amount of resource allocated on it is just wasteful. Besides, as the predicted importance of Huawei P-series smartphones’ ‘screen’, ‘phone accessories’, ‘performance’, and ‘cost performance’ are ‘performance factor’, resource allocation should be just put low priority if its performance is ‘low’ because there are some feature groups belonging to ‘excitement factor’ which are better choice to improve customers’ satisfaction sharply. However, if its performance is ‘very low’ such as ‘performance’, it is still a suboptimal choice to improve the resource allocated on it. However, if its performance has already been ‘high’, the resource allocated on it should just be kept such as ‘cost performance’. Furthermore, as the predicted importance of Huawei P-series smartphones’ ‘hardware’, ‘basic function’, and ‘customer feedback’ are ‘excitement factor’ and their performances are ‘very low’ or ‘low’, it is necessary to largely improve or improve the resource allocated on them. Because it is easy to improve the customers’ satisfaction sharply if the performance of them exceed the average value. However, as the predicted importance of Huawei P-series smartphones’ ‘appearance design’ and ‘photograph function’ are ‘excitement factor’ and their performances are ‘high’, resource allocation on them should be put low priority compared with ‘hardware’, ‘basic function’, and ‘customer feedback’.
4.5. Evaluation
From Section 4.1 to Section 4.4, the improvement priorities of Huawei P20’s 13 feature groups are discovered, so that the proposed approach is proved feasible. In order to further verify the validity of the proposed approach, the product opportunity mining approach proposed in prior studies and the approach proposed in this study are used to discover the improvement priorities of Huawei P10’s 13 feature groups for comparison. It can be seen in Table 7 that the market share of Huawei P-series smartphone increased from 13.05% in 2016 to 34.48% in 2018. Therefore, it can be believed that the actual decision of Huawei P10’s improvement priorities are effective, so that it can be the ground truth to justify which approach works better.
According to the product opportunity mining approach, the improvement priorities of feature groups are determined by the value calculated by the opportunity algorithm as [7]
The results of Huawei P10’s improvement priorities using the product opportunity mining approach are shown in Table 19.
According to the approach proposed by this study, the results of Huawei P10’s improvement priorities are shown in Table 20.
Comparing with the actual decision of Huawei P10’s improvement priorities, which approach works better can be justified clearly. This study counts the amount of the feature groups whose improvement priorities are matched with the actual decision to measure the validity of the approach. The actual decision of Huawei P10’s improvement priorities is shown in Table 21 according to the actual performance of Huawei P10 and Huawei P20.
Comparing the improvement priorities of Table 19 and Table 21, there are only four feature groups whose improvement priorities are matched with the actual decision, including ‘photograph function’, ‘beautify’, ‘hardware’, and ‘cost performance’. It can be believed that the accuracy rate of the product opportunity mining approach is only 30.8%. Comparing the improvement priorities of Table 20 and Table 21, there are eight feature groups whose improvement priorities are matched with the actual decision, including ‘appearance design’, ‘screen’, ‘entertainment function’, ‘phone accessories’, ‘beautify’, ‘performance’, ‘cost performance’, and ‘customer feedback’. It can be believed that the accuracy rate of the IPA approach is 61.5%. Therefore, it can be believed that the dynamic IPA approach proposed in this study is a much better approach for product/service improvement priorities discovering than the product opportunity mining approach proposed in the prior studies.
5. Discussion
An approach to discovering product/service improvement priorities from OCRs using dynamic importance-performance analysis was proposed in this study. As the building blocks of the approach, this study uses sentiment analysis, decision tree modeling, and importance-performance analysis. In terms of the specific steps of the approach, the features, modifiers, and opinions are extracted from the OCRs using Stanford CoreNLP. Similar features are divided into a feature group based on the need of analysis. The levels of performance and importance of each feature group are then calculated. The performance of the feature groups is measured by the average sentiment scores of each feature group calculated based on the similarity of the benchmark words using sentiment analysis. What’s more, relative performances are calculated as the ratio of target product/service’s performance to the market segment’s performance, considering the comparison with the major competitors in the market segment. The importance of the feature groups is measured based on Kano’s model deriving from decision tree modeling. Finally, the improvement priorities of target product/service’ feature groups are discovered from the dynamic performance trend and predicted importance using dynamic importance-performance analysis. The functionality of the approach was demonstrated herein using the data of Huawei P-series smartphones and their competitors in the market segment on Jingdong, one of the major e-commerce websites in China, between 2016 and 2018. The improvement priorities of Huawei P-series smartphones’ 13 feature groups were discovered through this case study and the approach proposed in this study was proved to be a much better approach for product/service improvement priorities discovering than the product opportunity mining approach proposed in the prior studies.
Besides, as mentioned in the Introduction section, the cost budget and resources of a business are limited, it is necessary for businesses to discover the improvement priorities of its product/service features effectively and allocate their resources appropriately for higher customer satisfaction. This research targeted 2500–3500 RMB market segment in the case study because it is more consistent with this situation, so that it is more suitable to verify the feasibility and validity of the proposed approach. In this market segment, the cost budget and resources of a business are limited, but it still has space and it is necessary to consider how to allocate these cost budget and resources on each product feature for higher customer satisfaction. However, if this research targets low end market segment, the cost budget and resources of a business may be too little to further consider how to allocate them in detail. The proposed approach may be less practical in this market segment. On the contrary, if this research targets high end market segment, the cost budget, and resources of a business are more sufficient, the business may just allocate the cost budget and resources on each product feature to make its product perfect. The proposed approach may be less practical in this market segment as well. However, considering the principle of profit maximization, businesses in each market segment try to satisfy their customers with less cost, so that our approach is still practical in each market segment. The proposed domain-independent approach contributes to the effective resource allocation and improvement priorities discovering across various domains, including not only products but also services, using the OCRs related to the target. It thereby assists businesses to improve customer satisfaction as much as possible under certain cost constraints and resources.
We expect that this study will make both academic and practical contributions to relevant fields. From an academic perspective, the proposed approach applies dynamic importance-performance analysis into OCRs analysis for improvement priorities discovering. Some limitations of the prior studies were revealed.
First, most of the prior studies focused only on the actual performance of the target product/service, while neglecting the comparison with the major competitors in the market segment. Compared to them, this study analyzes the performance of target product/service’s major competitors in the market segment as well and derives the relative performance of the target product/service.
Second, most of the prior studies derived the importance of the target product/service just based on the frequency of the mentioned features, leading to inaccurate importance judgment sometimes. Compared to them, this study uses decision tree modeling to derive the significance of each feature group in both positive and negative sentiment polarities and converts them into Kano’s model categories. Based on Kano’s model, feature groups belonging to different factors have different relationship between product/service performance and customer satisfaction. Thus, converting the importance of target product/service into Kano’s model categories helps to satisfy the customers more effectively.
Third, our approach applies dynamic importance-performance analysis into OCRs mining rather than analyzing the data collected from traditional questionnaires. Therefore, our approach can monitor the trends of customer needs in time and predict their needs more accurately.
From a practical perspective, our approach can be implemented as a software system for businesses. Because recent customer needs are more dynamic and businesses can only improve their products/service under certain cost budget and resources, our approach helps the businesses to monitor the dynamic trend of customer needs and decide resource allocation and improvement priorities more effectively. It is an efficient approach for businesses to get higher customer satisfaction with limited resources and to be competitive sustainably in the market.
Despite the contributions made by this study, further work still needs to be completed. First, in the proposed approach, the classification of features requires some degree of manual processing because it is inaccurate to classify totally by computers. Therefore, in future work, better classification algorithms need further research. Second, as there are insufficient effective features comparison opinion in OCRs, our approach can only calculate the relative performance as the ratio of target product/service’s performance to market segment’s performance. Thus, in future works, how to extract more effective features comparison opinion from OCRs and derive relative performance from them needs further research. Finally, our approach was applied to one example target product, but it has the potential to be applicable to various domains, such as service. Therefore, application studies in different domains will be conducted in further works.
Author Contributions
Conceptualization, J.W.; Data curation, R.Z.; Formal analysis, R.Z.; Methodology, J.W.; Project administration, Y.W.; Resources, Y.W.; Software, R.Z.; Supervision, Y.W. and J.C.; Writing—original draft, J.W.; Y.W., and J.C.; Writing—review and editing, J.W.; Y.W., and J.C.
Acknowledgments
This research was funded by the National Natural Science Foundation of China grant numbers 71772075, 71302153, and 71672074; the Technology R&D Foundation of Guangzhou, China grant number 201607010012; the Social Science Foundation of Guangzhou, China grant number 2018GZYB31; and the Foundation of Chinese Government Scholarship grant number 201806785010. Any opinions, findings, and conclusions or recommendations expressed in this paper are those of the authors and do not necessarily reflect the views of the above funding agencies.
Conflicts of Interest
The authors declare no conflict of interest.
References
- Wei, X.; Luo, X.; Li, Q.; Zhang, J.; Xu, Z. Online Comment-Based Hotel Quality Automatic Assessment Using Improved Fuzzy Comprehensive Evaluation and Fuzzy Cognitive Map. IEEE Trans. Fuzzy Syst. 2015, 23, 72–84. [Google Scholar] [CrossRef]
- Yu, K.T. A measurement model for service capability from the customer perspective. Serv. Bus. 2013, 7, 563–582. [Google Scholar] [CrossRef]
- Ziegler, C.N.; Skubacz, M.; Viermetz, M. Mining and Exploring Unstructured Customer Feedback Data Using Language Models and Treemap Visualizations. In Proceedings of the 2008 IEEE/WIC/ACM International Conference on Web Intelligence and Intelligent Agent Technology, Washington, DC, USA, 9–12 December 2008; pp. 932–937. [Google Scholar]
- Akehurst, G. User generated content: the use of blogs for tourism organisations and tourism consumers. Serv. Bus. 2009, 3, 51–61. [Google Scholar] [CrossRef]
- Pang, B.; Lee, L.; Vaithyanathan, S. Thumbs up?: Sentiment classification using machine learning techniques. In Proceedings of the 2002 Conference on Empirical Methods in Natural Language Processing, Philadelphia, PA, USA, 6–7 July 2002; pp. 79–86. [Google Scholar]
- Nasukawa, T.; Yi, J. Sentiment Analysis: Capturing Favorability Using Natural Language Processing. In Proceedings of the 2nd International Conference on Knowledge Capture, Sanibel Island, FL, USA, 23–25 October 2003; pp. 494–500. [Google Scholar]
- Jeong, B.; Yoon, J.; Lee, J.M. Social media mining for product planning: A product opportunity mining approach based on topic modeling and sentiment analysis. Int. J. Inf. Manag. 2017. [Google Scholar] [CrossRef]
- Baccianella, S.; Esuli, A.; Sebastiani, F. SentiWordNet 3.0: An enhanced lexical resource for sentiment analysis and opinion mining. In Proceedings of the International Conference on Language Resources & Evaluation, Valletta, Malta, 17–23 May 2010; pp. 83–90. [Google Scholar]
- Kang, D.; Park, Y. Measuring customer satisfaction of service based on an analysis of the user generated contents: Sentiment analysis and aggregating function based MCDM approach. In Proceedings of the IEEE International Conference on Management of Innovation & Technology, Bali, Indonesia, 6–8 June 2012; pp. 244–249. [Google Scholar]
- Taboada, M.; Brooke, J.; Tofiloski, M.; Voll, K.; Stede, M. Lexicon-based methods for sentiment analysis. Comput. Linguist. 2011, 37, 267–307. [Google Scholar] [CrossRef]
- Glorot, X.; Bordes, A.; Bengio, Y. Domain adaptation for large-scale sentiment classification: A deep learning approach. In Proceedings of the 28th International Conference on Machine Learning (ICML-11), Bellevue, WA, USA, 28 June–2 July 2011; pp. 513–520. [Google Scholar]
- Rahmathp, H.; Ahmad, T. Fuzzy based Sentiment Analysis of Online Product Reviews using Machine Learning Techniques. Int. J. Comput. Appl. Technol. 2014, 99, 9–16. [Google Scholar] [CrossRef] [Green Version]
- Santos, C.N.D.; Gattit, M. Deep Convolutional Neural Networks for Sentiment Analysis Of Short Texts. In Proceedings of the International Conference on Computational Linguistics, Dublin, Ireland, 23–29 August 2014; pp. 69–78. [Google Scholar]
- Fenn, J.; LeHong, H. Hype Cycle for Emerging Technologies; Gartner: Stamford, CT, USA, 2012. [Google Scholar]
- Miranda, M.D.; Sassi, R.J. Using Sentiment Analysis to Assess Customer Satisfaction in an Online Job Search Company. In Proceedings of the International Conference on Business Information Systems, Larnaca, Cyprus, 21–23 May 2014; pp. 17–27. [Google Scholar]
- Song, B.; Lee, C.; Yoon, B.; Park, Y. Diagnosing service quality using customer reviews: An index approach based on sentiment and gap analyses. Serv. Bus. 2016, 10, 775–798. [Google Scholar] [CrossRef]
- Kano, N.; Seraku, N.; Takahashi, F.; Tsuji, S. Attractive quality and must-be quality. Hinshitsu. J. Jpn. Soc. Qual. Control 1984, 14, 39–48. [Google Scholar]
- Matzler, K.; Sauerwein, E. The factor structure of customer satisfaction: An empirical test of the importance grid and the penalty-reward-contrast analysis. Int. J. Serv. Ind. Manag. 2002, 13, 314–332. [Google Scholar] [CrossRef]
- Martilla, J.A.; James, J.C. Importance-performance analysis. J. Mark. 1977, 41, 77–79. [Google Scholar] [CrossRef]
- Li, Z.; Liu, L.; Li, C. Analysis of Customer Satisfaction from Chinese Reviews using Opinion Mining. In Proceedings of the IEEE International Conference on Software Engineering & Service Science, Beijing, China, 23–25 September 2015; pp. 95–99. [Google Scholar]
- Guo, Y.; Barnes, S.J.; Jia, Q. Mining meaning from online ratings and reviews: Tourist satisfaction analysis using latent dirichlet allocation. Tourism Manag. 2017, 59, 467–483. [Google Scholar] [CrossRef]
- Kang, D.; Park, Y. Review-based measurement of customer satisfaction in mobile service: Sentiment analysis and VIKOR approach. Expert Syst. Appl. 2014, 41, 1041–1050. [Google Scholar] [CrossRef]
- Matzler, K.; Bailom, F.; Hinterhuber, H.H.; Renzl, B.; Pichler, J. The asymmetric relationship between attribute-level performance and overall customer satisfaction: A reconsideration of the importance-performance analysis. Ind. Mark. Manag. 2004, 33, 271–277. [Google Scholar] [CrossRef]
- Matzler, K.; Fuchs, M.; Schubert, A.K. Employee satisfaction: Does Kano’s model apply? Total Qual. Manag. Bus. Excell. 2004, 15, 1179–1198. [Google Scholar] [CrossRef]
- Fallon, P.; Schofield, P. The dynamics of destination attribute importance. J. Bus Res. 2006, 59, 709–713. [Google Scholar] [CrossRef]
- Pezeshki, V.; Mousavi, A.; Grant, S. Importance-performance analysis of service attributes and its impact on decision making in the mobile telecommunication industry. Meas. Bus. Excell. 2009, 13, 82–92. [Google Scholar] [CrossRef]
- Caber, M.; Albayrak, T.; Loiacono, E.T. The classification of extranet attributes in terms of their asymmetric influences on overall user satisfaction: An introduction to asymmetric impact-performance analysis. J. Travel Res. 2013, 52, 106–116. [Google Scholar] [CrossRef]
- Matzler, K.; Sauerwein, E.; Heischmidt, K.A. Importance-performance analysis revisited: The role of the factor structure of customer satisfaction. Serv. Ind. J. 2003, 23, 112–129. [Google Scholar] [CrossRef]
- Deng, W.J. Using a revised importance-performance analysis approach: The case of Taiwanese hot springs tourism. Tourism Manag. 2007, 28, 1274–1284. [Google Scholar] [CrossRef]
- Chen, X. The Modified Importance-performance Analysis Method and its Application in Tourist Satisfaction Research. Tourism Tribune 2013, 28, 59–66. [Google Scholar]
- Namhyun, K.; Ahn, Y.J.; Wicks, B.E. Local festival quality and the application of a revised importance-performance analysis: The case of the Jirisan Cheon-Wang festival. Event Manag. 2014, 18, 89–100. [Google Scholar]
- Alegre, J.; Garau, J. The factor structure of tourist satisfaction at sun and sand destinations. J. Travel Res. 2011, 50, 78–86. [Google Scholar] [CrossRef]
- Lai, I.K.W.; Hitchcock, M. A comparison of service quality attributes for stand-alone and resort-based luxury hotels in Macau: 3-Dimensional importance-performance analysis. Tourism Manag. 2016, 55, 139–159. [Google Scholar] [CrossRef]
- Cao, J.; Cao, X. Comparing importance-performance analysis and three-factor theory in assessing rider satisfaction with transit. J. Transp. Land Use. 2017, 10, 65–68. [Google Scholar] [CrossRef]
- Füller, J.; Matzler, K. Customer delight and market segmentation: An application of the three-factor theory of customer satisfaction on life style groups. Tourism Manag. 2008, 29, 116–126. [Google Scholar] [CrossRef]
- Deng, W.J.; Kuo, Y.F.; Chen, W.C. Revised importance-performance analysis: Three-factor theory and benchmarking. Serv. Ind. J. 2008, 28, 37–51. [Google Scholar] [CrossRef]
- Taplin, R.H. Competitive importance-performance analysis of an Australian wildlife park. Tourism Manag. 2012, 33, 29–37. [Google Scholar] [CrossRef]
- Hosseini, S.Y.; Bideh, A.Z. A data mining approach for segmentation-based importance-performance analysis (SOM–BPNN–IPA) a new framework for developing customer retention strategies. Serv. Bus. 2014, 8, 295–312. [Google Scholar] [CrossRef]
- Kaviania, M.A.; Abbasib, M.; Yusefib, M.M.; Zareinejada, M. Prioritizing operation strategies of companies using fuzzy AHP and importanceperformance matrix. Decis. Sci. Lett. 2014, 3, 353–358. [Google Scholar] [CrossRef] [Green Version]
- Manning, C.D.; Surdeanu, M.; Bauer, J.; Finkel, J.; Bethard, S.J. The Stanford CoreNLP Natural Language Processing Toolkit. In Proceedings of the 52nd Annual Meeting of the Association for Computational Linguistics: System Demonstrations, Baltimore, MD, USA, 22–27 June 2014. [Google Scholar]
- Wu, D.; Wang, Z.; Jiang, S.; Huang, S. Method for Obtaining Review-oriented Product Improved Requirements. J. Yangtze Univ. 2017, 14, 44–48. [Google Scholar]
- Tian, J.L.; Zhao, W. Words Similarity Algorithm Based on Tongyici Cilin in Semantic Web Adaptive Learning System. J. Jilin Univ. 2010, 28, 602–608. [Google Scholar]
- Myles, A.J.; Feudale, R.N.; Liu, Y.; Woody, N.A.; Brown, S.D. An introduction to decision tree modeling. J. Chemom. 2010, 18, 275–285. [Google Scholar] [CrossRef]
- Quinlan, J.R. C4.5: Programs for Machine Learning; Morgan Kaufmann Publishers Inc.: San Francisco, CA, USA, 1992; Volume 1. [Google Scholar]
- Yussupova, N.; Boyko, M.; Bogdanova, D.; Hilbert, A. A Decision Support Approach based on Sentiment Analysis Combined with Data Mining for Customer Satisfaction Research. Int. J. Adv. Intell. Syst. 2015, 8, 145–158. [Google Scholar]
- Li, C.; Pang, C.; Ling, Y.; Wang, Q. Research on Network Review Mining Based on Improved Feature Extraction and Clustering. J. Mod. Inf. 2018, 38, 68–74. [Google Scholar]
Figure 1.
Kano’s model of customer satisfaction.

Figure 2.
Process of the proposed approach.

Figure 3.
One example of the constructed decision tree model and its rules.

Figure 4.
Dynamic actual performance trend of Huawei P-series smartphones’ feature groups.

Figure 5.
Dynamic relative performance trend of Huawei P-series smartphones’ feature groups.

Figure 6.
Radar map of Huawei P20’s underperforming feature groups.


Table 1.
Comparison of traditional IPA and dynamic IPA.
| Traditional IPA | Dynamic IPA | |
|---|---|---|
| Data source | Questionaires | OCRs |
| The time spent collecting data | Lots of | Little |
| The difficulty of collecting data | Difficult | Easy |
| The number of samples | Small | Large |
| Sample representation | General | Good |
| Can monitor the trend of the feature’s importance and performance or not | No | Yes |
| The timeliness of the results | General | Good |
Table 2.
Tags of LTP’s sentence parsing.
| Tag | Description | Example |
|---|---|---|
| SBV | Subject–verb | I sent her a bunch of flowers (I←sent) |
| VOB | Verb–object | I sent her a bunch of flowers (sent→flowers) |
| IOB | Indirect–object | I sent her a bunch of flowers (sent→her) |
| ATT | Attribute | Red apples (red←apples) |
| ADV | Adverbial | Very beautiful (very←beautiful) |
| CMP | Complement | Run fast (run→fast) |
| COO | Coordinate | You and me (you→me) |
| HED | Head | The core of the whole sentence |
Table 3.
Benchmark words of modifiers in each modifying degree.
| Degree Modifier | Modifying Degree | Frequency Modifier | Modifying Degree |
|---|---|---|---|
| Slightly | 0.1 | Never | 0.1 |
| Relatively | 0.3 | Occasionally | 0.3 |
| Moderately | 0.5 | From time to time | 0.5 |
| Very | 0.7 | Often | 0.7 |
| Extremely | 0.9 | Always | 0.9 |
Table 4.
Example of the decision tree model’s data set.
| OCR 1 | OCR 2 | OCR 3 | OCR 4 | |
|---|---|---|---|---|
| Positive OCRs on feature group 1 | Presence | Absence | Absence | Absence |
| Negative OCRs on feature group 1 | Absence | Presence | Presence | Absence |
| Positive OCRs on feature group 2 | Absence | Absence | Absence | Presence |
| Negative OCRs on feature group 2 | Absence | Presence | Absence | Absence |
| Positive OCRs on feature group 3 | Presence | Absence | Absence | Presence |
| Negative OCRs on feature group 3 | Absence | Absence | Presence | Absence |
| Overall satisfaction | Positive | Negative | Negative | Positive |
Table 5.
Resources allocation of improved importance-performance analysis.
| Relative Performance | Importance Based on Kano’s Model | Resources Allocation |
|---|---|---|
| Very High | Basic factor | Reduce |
| Very High | Excitement factor | Keep |
| Very High | Performance factor | Keep/reduce |
| High | Basic factor | Slightly reduce |
| High | Excitement factor | Low priority |
| High | Performance factor | Keep/reduce |
| Low | Basic factor | Low priority |
| Low | Excitement factor | Keep/Improve |
| Low | Performance factor | Improve/low priority |
| Very Low | Basic factor | Improve |
| Very Low | Excitement factor | Keep/Largely improve |
| Very Low | Performance factor | Improve/low priority |
Table 6.
Amounts of the OCRs collected of Huawei P-series smartphones.
| Smartphone | Amount of Performance Analysis OCRs | Amount of Importance Analysis OCRs |
|---|---|---|
| Huawei P9 | 500 | 500 |
| Huawei P10 | 500 | 500 |
| Huawei P20 | 500 | 500 |
Table 7.
Amounts of the OCRs collected of the 2500-3500RMB market segment in the last three years.
| Smartphone | Market Share Based on the OCRs Amounts | Amount of Performance Analysis OCRs | Amount of Importance Analysis OCRs |
|---|---|---|---|
| Huawei P9 | 13.05% | 500 | 500 |
| Xiaomi MIX | 37.29% | 500 | 500 |
| One plus 3t | 16.95% | 500 | 500 |
| Meizu pro6plus | 14.07% | 500 | 500 |
| Iphone se | 18.64% | 500 | 500 |
| Market of 2016 | 100.00% | 2500 | 2500 |
| Huawei P10 | 16.33% | 500 | 500 |
| Xiaomi MIX2 | 19.96% | 500 | 500 |
| One plus 5t | 32.67% | 500 | 500 |
| Meizu pro7 | 4.72% | 500 | 500 |
| OPPO R11s | 13.61% | 500 | 500 |
| Vivo X20 | 12.70% | 500 | 500 |
| Market of 2017 | 100.00% | 3000 | 3000 |
| Huawei P20 | 34.48% | 500 | 500 |
| Xiaomi MIX2s | 8.28% | 500 | 500 |
| OPPO R15 | 19.31% | 500 | 500 |
| Vivo X21 | 37.93% | 500 | 500 |
| Market of 2018 | 100.00% | 2000 | 2000 |
Table 8.
Samples of Huawei P20’s extracted keywords and their sentiment scores.
| Product Feature | Opinion’s Modifier | Opinion | Sentiment Score |
|---|---|---|---|
| Design | Very | Good | 0.975946421 |
| Screen | Really | Satisfied | 0.80317549 |
| Appearance | Very | Beautiful | 0.943009505 |
| Photograph | - | Ok | 0.605575555 |
| Sound | Petty | Excellent | 0.898697897 |
| Price | Slightly | Expensive | 0.561163916 |
| Attitude | - | Nice | 0.8 |
| Speed | Not | Fast | −0.716483516 |
| Shell | Not | Good | −0.655862821 |
| AR | Very | Funny | 0.85755751 |
Table 9.
Feature groups of a smartphone.
| Product | Feature Group | Feature |
|---|---|---|
| Smartphone | Appearance design | Appearance, color, texture, material, hand feeling, size, style…… |
| Screen | Screen, resolution ratio, clarity, screen-to-body ratio, tonality…… | |
| Basic function | Call, message, signal, system, app, wifi, unlock…… | |
| Photograph function | Pixel, cameral, lens, zoom, photo, flashlight, image quality…… | |
| Entertainment function | Game, video, media…… | |
| Data function | Bluetooth, infrared ray…… | |
| Phone accessories | Earphone, charger, phone shell, data cable…… | |
| Beautify | Theme, interface, menu, wallpaper…… | |
| Performance | Performance, speed, battery life, response time, heat dissipation…… | |
| Sound | Sound, volume, tone quality, phone receiver, loudspeaker…… | |
| Hardware | Capacity, RAM, CPU, battery…… | |
| Cost performance | Cost performance, price…… | |
| Customer feedback | Quality, customer service, expressage, after-sales service…… |
Table 10.
Actual performance of Huawei P-series smartphones’ feature groups in the last three years.
Table 10.
Actual performance of Huawei P-series smartphones’ feature groups in the last three years.
| Feature Group | 2016 (P9) | 2017 (P10) | 2018 (P20) |
|---|---|---|---|
| Appearance design | 0.566992583 | 1.188344893 | 1.258443548 |
| Screen | 0.167008577 | 0.226207331 | 0.371792642 |
| Basic function | 0.221830768 | 0.854510157 | 0.451131152 |
| Photograph function | 0.10843468 | 0.304569266 | 0.50891252 |
| Entertainment Function | −0.013061765 | 0.126251492 | 0.026383249 |
| Data function | 0 | 0.053418696 | 0.053406085 |
| Phone accessories | 0.024604378 | 0.028922906 | 0.239386104 |
| Beautify | 0 | 0.088132614 | 0.080843453 |
| Performance | 0.884287155 | 0.832354478 | 0.203361245 |
| Sound | 0.034471416 | 0.050407872 | 0.189847345 |
| Hardware | 0.035624434 | 0.063153676 | 0.051754771 |
| Cost performance | 0.155618684 | 0.199886028 | 0.121622844 |
| Customer feedback | 0.855953845 | 0.652964849 | 0.389014621 |
Table 11.
Actual performance of the 2500–3500 RMB market segment’s feature groups in the last three years.
Table 11.
Actual performance of the 2500–3500 RMB market segment’s feature groups in the last three years.
| Feature Group | 2016 | 2017 | 2018 |
|---|---|---|---|
| Appearance design | 0.788727811 | 0.980004909 | 1.043565137 |
| Screen | 0.400346187 | 0.242137839 | 0.401362616 |
| Basic function | 0.204779052 | 0.58071919 | 0.407638969 |
| Photograph function | 0.115448113 | 0.233570277 | 0.340889478 |
| Entertainment function | 0.107316641 | 0.126618477 | 0.058747823 |
| Data function | 0.030384963 | 0.048012904 | 0.078944403 |
| Phone accessories | 0.082037724 | 0.071216133 | 0.216951936 |
| Beautify | 0.011271868 | 0.051572877 | 0.053607908 |
| Performance | 0.536634183 | 0.552513866 | 0.352849848 |
| Sound | 0.093964662 | 0.034292382 | 0.102002647 |
| Hardware | 0.24759827 | 0.234328501 | 0.078905767 |
| Cost performance | 0.120615984 | 0.165491256 | 0.102379197 |
| Customer feedback | 0.558303489 | 0.576625963 | 0.465206551 |
Table 12.
Relative performance of Huawei P-series smartphones’ feature groups in the last three years.
Table 12.
Relative performance of Huawei P-series smartphones’ feature groups in the last three years.
| Feature Group | 2016 (P9) | 2017 (P10) | 2018 (P20) |
|---|---|---|---|
| Appearance design | 0.718869774 | 1.212590756 | 1.205908001 |
| Screen | 0.417160404 | 0.934208928 | 0.926326038 |
| Basic function | 1.083268849 | 1.471468778 | 1.106692898 |
| Photograph function | 0.939250345 | 1.303972705 | 1.492895947 |
| Entertainment function | -0.121712391 | 0.997101647 | 0.44909322 |
| Data function | 0 | 1.112590399 | 0.676502487 |
| Phone accessories | 0.299915415 | 0.406128566 | 1.103406166 |
| Beautify | 0 | 1.708894658 | 1.508050883 |
| Performance | 1.647839782 | 1.506486134 | 0.57633933 |
| Sound | 0.366855106 | 1.469943733 | 1.86120018 |
| Hardware | 0.143879979 | 0.269509154 | 0.655906063 |
| Cost performance | 1.290199515 | 1.207834376 | 1.187964426 |
| Customer feedback | 1.533133613 | 1.132388916 | 0.836219138 |
Table 13.
Importance analysis results of Huawei P9’s feature groups.
| Feature Group | Sentiment of Mention | Significance Value | Kano’s Model Category |
|---|---|---|---|
| Appearance design | Negative | 0.004159456 | Basic factor |
| Positive | 0.08146499 | ||
| Screen | Negative | 0.000498731 | Excitement factor |
| Positive | 0.098549092 | ||
| Basic function | Negative | 0.007646257 | Basic factor |
| Positive | 0.000821285 | ||
| Photograph function | Negative | 0.686271337 | Excitement factor |
| Positive | 0.000458439 | ||
| Entertainment function | Negative | 0 | Indifferent factor |
| Positive | 0 | ||
| Data function | Negative | 0 | Indifferent factor |
| Positive | 0 | ||
| Phone accessories | Negative | 0.014501721 | Basic factor |
| Positive | 0.000477949 | ||
| Beautify | Negative | 0 | Indifferent factor |
| Positive | 0 | ||
| Performance | Negative | 0.006715531 | Excitement factor |
| Positive | 0.034118258 | ||
| Sound | Negative | 0.016669866 | Basic factor |
| Positive | 0 | ||
| Hardware | Negative | 0 | Excitement factor |
| Positive | 0.004364591 | ||
| Cost performance | Negative | 0 | Excitement factor |
| Positive | 0.003623902 | ||
| Customer feedback | Negative | 0.022306759 | Performance factor |
| Positive | 0.017351835 |
Table 14.
Importance analysis results of Huawei P10’s feature groups.
| Feature Group | Sentiment of Mention | Significance Value | Kano’s Model Category |
|---|---|---|---|
| Appearance design | Negative | 0.097065726 | Performance factor |
| Positive | 0.083848381 | ||
| Screen | Negative | 0.011340768 | Excitement factor |
| Positive | 0.097065726 | ||
| Basic function | Negative | 0.00045063 | Excitement factor |
| Positive | 0.131637182 | ||
| Photograph function | Negative | 0.008773121 | Performance factor |
| Positive | 0.005216532 | ||
| Entertainment function | Negative | 0 | Indifferent factor |
| Positive | 0 | ||
| Data function | Negative | 0 | Indifferent factor |
| Positive | 0 | ||
| Phone accessories | Negative | 0.000454302 | Performance factor |
| Positive | 0.000874522 | ||
| Beautify | Negative | 0.00045802 | Indifferent factor |
| Positive | 0 | ||
| Performance | Negative | 0.014782676 | Excitement factor |
| Positive | 0.074587728 | ||
| Sound | Negative | 0 | Indifferent factor |
| Positive | 0 | ||
| Hardware | Negative | 0.013522012 | Performance factor |
| Positive | 0.012216198 | ||
| Cost performance | Negative | 0 | Excitement factor |
| Positive | 0.310570032 | ||
| Customer feedback | Negative | 0.126261092 | Basic factor |
| Positive | 0.010875352 |
Table 15.
Importance analysis results of Huawei P20’s feature groups.
| Feature Group | Sentiment of Mention | Significance Value | Kano’s Model Category |
|---|---|---|---|
| Appearance design | Negative | 0.000230873 | Excitement factor |
| Positive | 0.006444414 | ||
| Screen | Negative | 0.009102692 | Basic factor |
| Positive | 0.002451384 | ||
| Basic function | Negative | 0.000810273 | Excitement factor |
| Positive | 0.002689993 | ||
| Photograph function | Negative | 0 | Excitement factor |
| Positive | 0.002007462 | ||
| Entertainment function | Negative | 0 | Indifferent factor |
| Positive | 0.00044575 | ||
| Data function | Negative | 0.00023308 | Indifferent factor |
| Positive | 0 | ||
| Phone accessories | Negative | 0 | Indifferent factor |
| Positive | 0 | ||
| Beautify | Negative | 0 | Indifferent factor |
| Positive | 0 | ||
| Performance | Negative | 0.965818632 | Basic factor |
| Positive | 0.004602878 | ||
| Sound | Negative | 0 | Indifferent factor |
| Positive | 0.000651821 | ||
| Hardware | Negative | 0.000235318 | Excitement factor |
| Positive | 0.000930476 | ||
| Cost performance | Negative | 0 | Indifferent factor |
| Positive | 0.000454181 | ||
| Customer feedback | Negative | 0.000839874 | Excitement factor |
| Positive | 0.002050896 |
Table 16.
Importance analysis results of Huawei P-series smartphones’ feature groups in the last three years.
Table 16.
Importance analysis results of Huawei P-series smartphones’ feature groups in the last three years.
| Feature Group | 2016 (P9) | 2017 (P10) | 2018 (P20) |
|---|---|---|---|
| Appearance design | Basic factor | Performance factor | Excitement factor |
| Screen | Excitement factor | Excitement factor | Basic factor |
| Basic function | Basic factor | Excitement factor | Excitement factor |
| Photograph function | Excitement factor | Performance factor | Excitement factor |
| Entertainment function | Indifferent factor | Indifferent factor | Indifferent factor |
| Data function | Indifferent factor | Indifferent factor | Indifferent factor |
| Phone accessories | Basic factor | Performance factor | Indifferent factor |
| Beautify | Indifferent factor | Indifferent factor | Indifferent factor |
| Performance | Excitement factor | Excitement factor | Basic factor |
| Sound | Basic factor | Indifferent factor | Indifferent factor |
| Hardware | Excitement factor | Performance factor | Excitement factor |
| Cost performance | Excitement factor | Excitement factor | Indifferent factor |
| Customer feedback | Performance factor | Basic factor | Excitement factor |
Table 17.
Importance analysis results of the 2500–3500 RMB market segment’s feature groups in the last three years.
Table 17.
Importance analysis results of the 2500–3500 RMB market segment’s feature groups in the last three years.
| Feature Group | 2016 | 2017 | 2018 |
|---|---|---|---|
| Appearance design | Excitement factor | Excitement factor | Excitement factor |
| Screen | Performance factor | Basic factor | Performance factor |
| Basic function | Excitement factor | Excitement factor | Excitement factor |
| Photograph function | Basic factor | Performance factor | Basic factor |
| Entertainment function | Performance factor | Indifferent factor | Excitement factor |
| Data function | Basic factor | Indifferent factor | Indifferent factor |
| Phone accessories | Basic factor | Basic factor | Excitement factor |
| Beautify | Indifferent factor | Indifferent factor | Excitement factor |
| Performance | Basic factor | Performance factor | Performance factor |
| Sound | Basic factor | Performance factor | Excitement factor |
| Hardware | Excitement factor | Basic factor | Excitement factor |
| Cost performance | Performance factor | Performance factor | Excitement factor |
| Customer feedback | Excitement factor | Excitement factor | Indifferent factor |
Table 18.
IPA of Huawei P-series smartphones’ feature groups.
| Feature Group | Actual Performance | Relative Performance | Importance | IPA Strategy | ||
|---|---|---|---|---|---|---|
| Mean | Level | Mean | Level | Predicted Kano’s Model Category | ||
| Appearance design | 1.258443548 | VH | 1.205908001 | H | Excitement | Low priority |
| Screen | 0.371792642 | L | 0.926326038 | L | Performance | Low priority |
| Basic function | 0.451131152 | L | 1.106692898 | L | Excitement | Improve |
| Photograph function | 0.50891252 | L | 1.492895947 | H | Excitement | Low priority |
| Entertainment function | 0.026383249 | VL | 0.44909322 | VL | Indifferent | Keep |
| Data function | 0.053406085 | VL | 0.676502487 | VL | Indifferent | Keep |
| Phone accessories | 0.239386104 | VL | 1.103406166 | L | Performance | Low priority |
| Beautify | 0.080843453 | VL | 1.508050883 | H | Indifferent | Reduce |
| Performance | 0.203361245 | VL | 0.57633933 | VL | Performance | Improve |
| Sound | 0.189847345 | VL | 1.86120018 | VH | Basic | Reduce |
| Hardware | 0.051754771 | VL | 0.655906063 | VL | Excitement | Largely improve |
| Cost performance | 0.121622844 | VL | 1.187964426 | H | performance | Keep |
| Customer feedback | 0.389014621 | L | 0.836219138 | L | Excitement | Improve |
Table 19.
Analysis results using the product opportunity mining approach.
| Feature Group | Importance | Satisfaction | Max(I-S,0) | Opportunity | Rank | Priorities |
|---|---|---|---|---|---|---|
| Appearance design | 9.6 | 10 | 0 | 9.6 | 2 | Improve |
| Screen | 2 | 1.701575675 | 0.298424325 | 2.298424325 | 9 | Keep |
| Basic function | 6.4 | 7.120679617 | 0 | 6.4 | 5 | Improve |
| Photograph function | 4.8 | 2.377446375 | 2.422553625 | 7.222553625 | 4 | Improve |
| Entertainment Function | 1.6 | 0.839457825 | 0.760542175 | 2.360542175 | 8 | Keep |
| Data function | 0 | 0.211275879 | 0 | 0 | 13 | Reduce |
| Phone accessories | 1.6 | 0 | 1.6 | 3.2 | 7 | Keep |
| Beautify | 0.8 | 0.510682984 | 0.289317016 | 1.089317016 | 11 | Reduce |
| Performance | 10 | 6.929587165 | 3.070412835 | 13.07041283 | 1 | Improve |
| Sound | 0.4 | 0.18530756 | 0.21469244 | 0.61469244 | 12 | Reduce |
| Hardware | 2 | 0.295239959 | 1.704760041 | 3.704760041 | 6 | Keep |
| Cost performance | 1.2 | 1.474554769 | 0 | 1.2 | 10 | Reduce |
| Customer feedback | 6.4 | 5.38235388 | 1.01764612 | 7.41764612 | 3 | Improve |
Table 20.
Analysis results using the IPA approach.
| Feature Group | Relative Performance | Level | Predicted Importance | Priorities |
|---|---|---|---|---|
| Appearance design | 1.212590756 | H | Performance factor | Keep |
| Screen | 0.934208928 | L | Excitement factor | Improve |
| Basic function | 1.471468778 | VH | Excitement factor | Keep |
| Photograph function | 1.303972705 | H | Performance factor | Keep |
| Entertainment Function | 0.997101647 | H | Indifferent factor | Reduce |
| Data function | 1.112590399 | H | Indifferent factor | Reduce |
| Phone accessories | 0.406128566 | VL | Performance factor | Improve |
| Beautify | 1.708894658 | VH | Indifferent factor | Reduce |
| Performance | 1.506486134 | VH | Performance factor | Reduce |
| Sound | 1.469943733 | VH | Indifferent factor | Reduce |
| Hardware | 0.269509154 | VL | Performance factor | Improve |
| Cost performance | 1.207834376 | H | Performance factor | Reduce |
| Customer feedback | 1.132388916 | H | Basic factor | Reduce |
Table 21.
The actual decision of Huawei P10’s improvement priorities.
| Feature Group | P10’s Actual Performance | P20’s Actual Performance | Priorities |
|---|---|---|---|
| Appearance design | 1.188344893 | 1.258443548 | Keep |
| Screen | 0.226207331 | 0.371792642 | Improve |
| Basic function | 0.854510157 | 0.451131152 | Reduce |
| Photograph function | 0.304569266 | 0.50891252 | Improve |
| Entertainment Function | 0.126251492 | 0.026383249 | Reduce |
| Data function | 0.053418696 | 0.053406085 | Keep |
| Phone accessories | 0.028922906 | 0.239386104 | Improve |
| Beautify | 0.088132614 | 0.080843453 | Reduce |
| Performance | 0.832354478 | 0.203361245 | Reduce |
| Sound | 0.050407872 | 0.189847345 | Improve |
| Hardware | 0.063153676 | 0.051754771 | Keep |
| Cost performance | 0.199886028 | 0.121622844 | Reduce |
| Customer feedback | 0.652964849 | 0.389014621 | Reduce |
© 2018 by the authors. Licensee MDPI, Basel, Switzerland. This article is an open access article distributed under the terms and conditions of the Creative Commons Attribution (CC BY) license (http://creativecommons.org/licenses/by/4.0/).
Share and Cite
MDPI and ACS Style
Wu, J.; Wang, Y.; Zhang, R.; Cai, J. An Approach to Discovering Product/Service Improvement Priorities: Using Dynamic Importance-Performance Analysis. Sustainability 2018, 10, 3564. https://doi.org/10.3390/su10103564
AMA Style
Wu J, Wang Y, Zhang R, Cai J. An Approach to Discovering Product/Service Improvement Priorities: Using Dynamic Importance-Performance Analysis. Sustainability. 2018; 10(10):3564. https://doi.org/10.3390/su10103564
Chicago/Turabian StyleWu, Jiacong, Yu Wang, Ru Zhang, and Jing Cai. 2018. "An Approach to Discovering Product/Service Improvement Priorities: Using Dynamic Importance-Performance Analysis" Sustainability 10, no. 10: 3564. https://doi.org/10.3390/su10103564
Note that from the first issue of 2016, this journal uses article numbers instead of page numbers. See further details here.