Assessment of Blue Carbon Storage Loss in Coastal Wetlands under Rapid Reclamation


1
Key Laboratory of Coastal and Wetland Ecosystems (Ministry of Education), College of the Environment and Ecology, Xiamen University, Xiamen 361102, China
2
Fujian Provincial Key Laboratory for Coastal Ecology and Environmental Studies, Xiamen University, Xiamen 361102, China
3
Coastal and Ocean Management Institute, College of Environment and Ecology, Xiamen University, Xiamen 361102, China
*
Author to whom correspondence should be addressed.
Sustainability 2018, 10(8), 2818; https://doi.org/10.3390/su10082818
Submission received: 13 June 2018
/
Revised: 4 August 2018
/
Accepted: 8 August 2018
/
Published: 9 August 2018
(This article belongs to the Special Issue Land Use/Cover Drivers and Impacts: New Trends and Experiences from Asia)
Abstract
:Highly productive coastal wetlands play an essential role in storing blue carbon as one of their ecosystem services, but they are increasingly jeopardized by intensive reclamation activities to facilitate rapid population growth and urbanization. Coastal reclamation causes the destruction and severe degradation of wetland ecosystems, which may affect their abilities to store blue carbon. To assist with international accords on blue carbon, we evaluated the dynamics of blue carbon storage in coastal wetlands under coastal reclamation in China. By integrating carbon density data collected from field measurement experiments and from the literature, an InVEST model, Carbon Storage and Sequestration was used to estimate carbon storage across the reclamation area between 1990 and 2015. The result is the first map capable of informing about blue carbon storage in coastal reclamation areas on a national scale. We found that more than 380,000 hectares of coastal wetlands were affected by reclamation, which resulted in the release of ca. 20.7 Tg of blue carbon. The carbon loss from natural wetlands to artificial wetlands accounted for 72.5% of total carbon loss, which highlights the major task in managing coastal sustainability. In addition, the top 20% of coastal wetlands in carbon storage loss covered 4.2% of the total reclamation area, which can be applied as critical information for coastal redline planning. We conclude that the release of blue carbon due to the conversion of natural wetlands exceeded the total carbon emission from energy consumption within the reclamation area. Implementing the Redline policy could guide the management of coastal areas resulting in greater resiliency regarding carbon emission and sustained ecosystem services.
1. Introduction
As the transition to a low-carbon society becomes a global sustainable goal in cities, removing atmospheric carbon dioxide and reducing carbon through nature-based solutions will be necessary to cope with climate change [1]. Coastal wetlands sequester and store 50% of the organic carbon in marine sediments within 0.2% of the ocean area [2]. They are efficient systems for carbon storage, where mangroves, tidal marshes and seagrasses store a large amount of blue carbon [3,4,5,6]. However, approximately 50% of blue carbon ecosystems have disappeared due to the direct and indirect influences of anthropogenic disturbances and climate change. Coastal habitats destruction and landscape change are the key factors in carbon estimation, which releases the carbon stored in soil back into the atmosphere at a dramatic scale [2,7]. As a global issue, blue carbon maintenance and restoration has become the focus of the government, public and researchers who seek to maintain ecosystem services.
Coastal wetlands are highly vulnerable ecosystems due to anthropogenic encroachment [8]. They are also considered as a cost-efficient response to reduce CO2 density and mitigate climate change owing to their high primary productivity, carbon density and carbon stock potential [9,10]. To date, there have been many studies concerning carbon storage in terrestrial urban areas [11,12,13], but there are only a limited number of studies about wetlands loss under urbanization. Blue carbon in coastal wetlands has become a main concern in recent years due to increasing threats of coastal development and climate change.
The carbon budget is often estimated in terms of global-scale fluxes with anthropogenic and abiotic-natural CO2 sources as the main types of carbon sources [14]. Still, many carbon transforming and restoration processes occur through localized sources, which brings challenges to the spatial measurement of carbon storage. Impacts of land use and land cover change (LUCC) on soil organic carbon are difficult to quantify, but the evaluation of such impacts is critical to understand carbon emissions in rapidly urbanizing areas [15]. Quantitative methods have been carried out on carbon storage processes and their interconnections with the landscape change in rapidly developing urban areas. The main methods of assessing carbon storage in relation to landscape changes include integrating remote sensing-based models with the InVEST model [16,17]. Another widely accepted approach is based on field measurement or reported data with statistical evaluation to understand its current state [18,19,20]. Most of the research on blue carbon storage places emphasis on regional scale dynamics. Only a few studies address large-scale changes (national/global scale) due to the differences of carbon density in different regions [11,21,22]. Integrating large-scale landscape changes into the assessment of carbon storage can provide a better overview of ecosystem services.
In China, typical landscape changes in coastal wetlands are known as coastal reclamation [23]. Large areas of reclamation can lead to irreversible degradation of ecosystem services [24,25,26], which in turn causes significant loss of blue carbon stock [27,28,29]. Approximately 950,000 hectares of coastal wetlands have been destroyed by land reclamation activities in China [30]. Newly built industrial complexes, highways and aquaculture feeding ponds occupy large areas of previous wetlands along the coastal zone [31]. The most extensive land redevelopment areas are located within rapid urbanizing metropolitans, such as the Bohai bay, the Yangzi River delta and the Pearl River delta. Even though some of the negative effects of coastal reclamation have been addressed by researchers, its impacts on carbon storage is still generally unknown.
Human activities of coastal development have significantly altered the coastal carbon trade-offs, resulting in increased problems in achieving coastal sustainability. Coastal reclamation, which is a common characteristic of urbanization in coastal areas, has become a new critical factor in triggering a reduction of soil carbon storage. Considering the significant impacts of coastal landscape change on the balance of carbon storage in coastal wetlands, we estimated the dynamics of spatial carbon storage in the coastal wetlands of mainland China. Based on data reported from field surveys on carbon density and the InVEST model of carbon storage analysis, we estimated blue carbon loss from the perspective of coastal reclamation on a national scale, which quantified carbon storage change under the influences of typical coastal development in China’s coastal cities in the last two decades. Ultimately, we identified the main sources of carbon loss among all types of landscape transformation regarding reclamation activities, which could provide spatial data for the most important regulation of coastal sustainable development policy in China: ‘Redline’.
2. Materials and Methods
2.1. Study Area
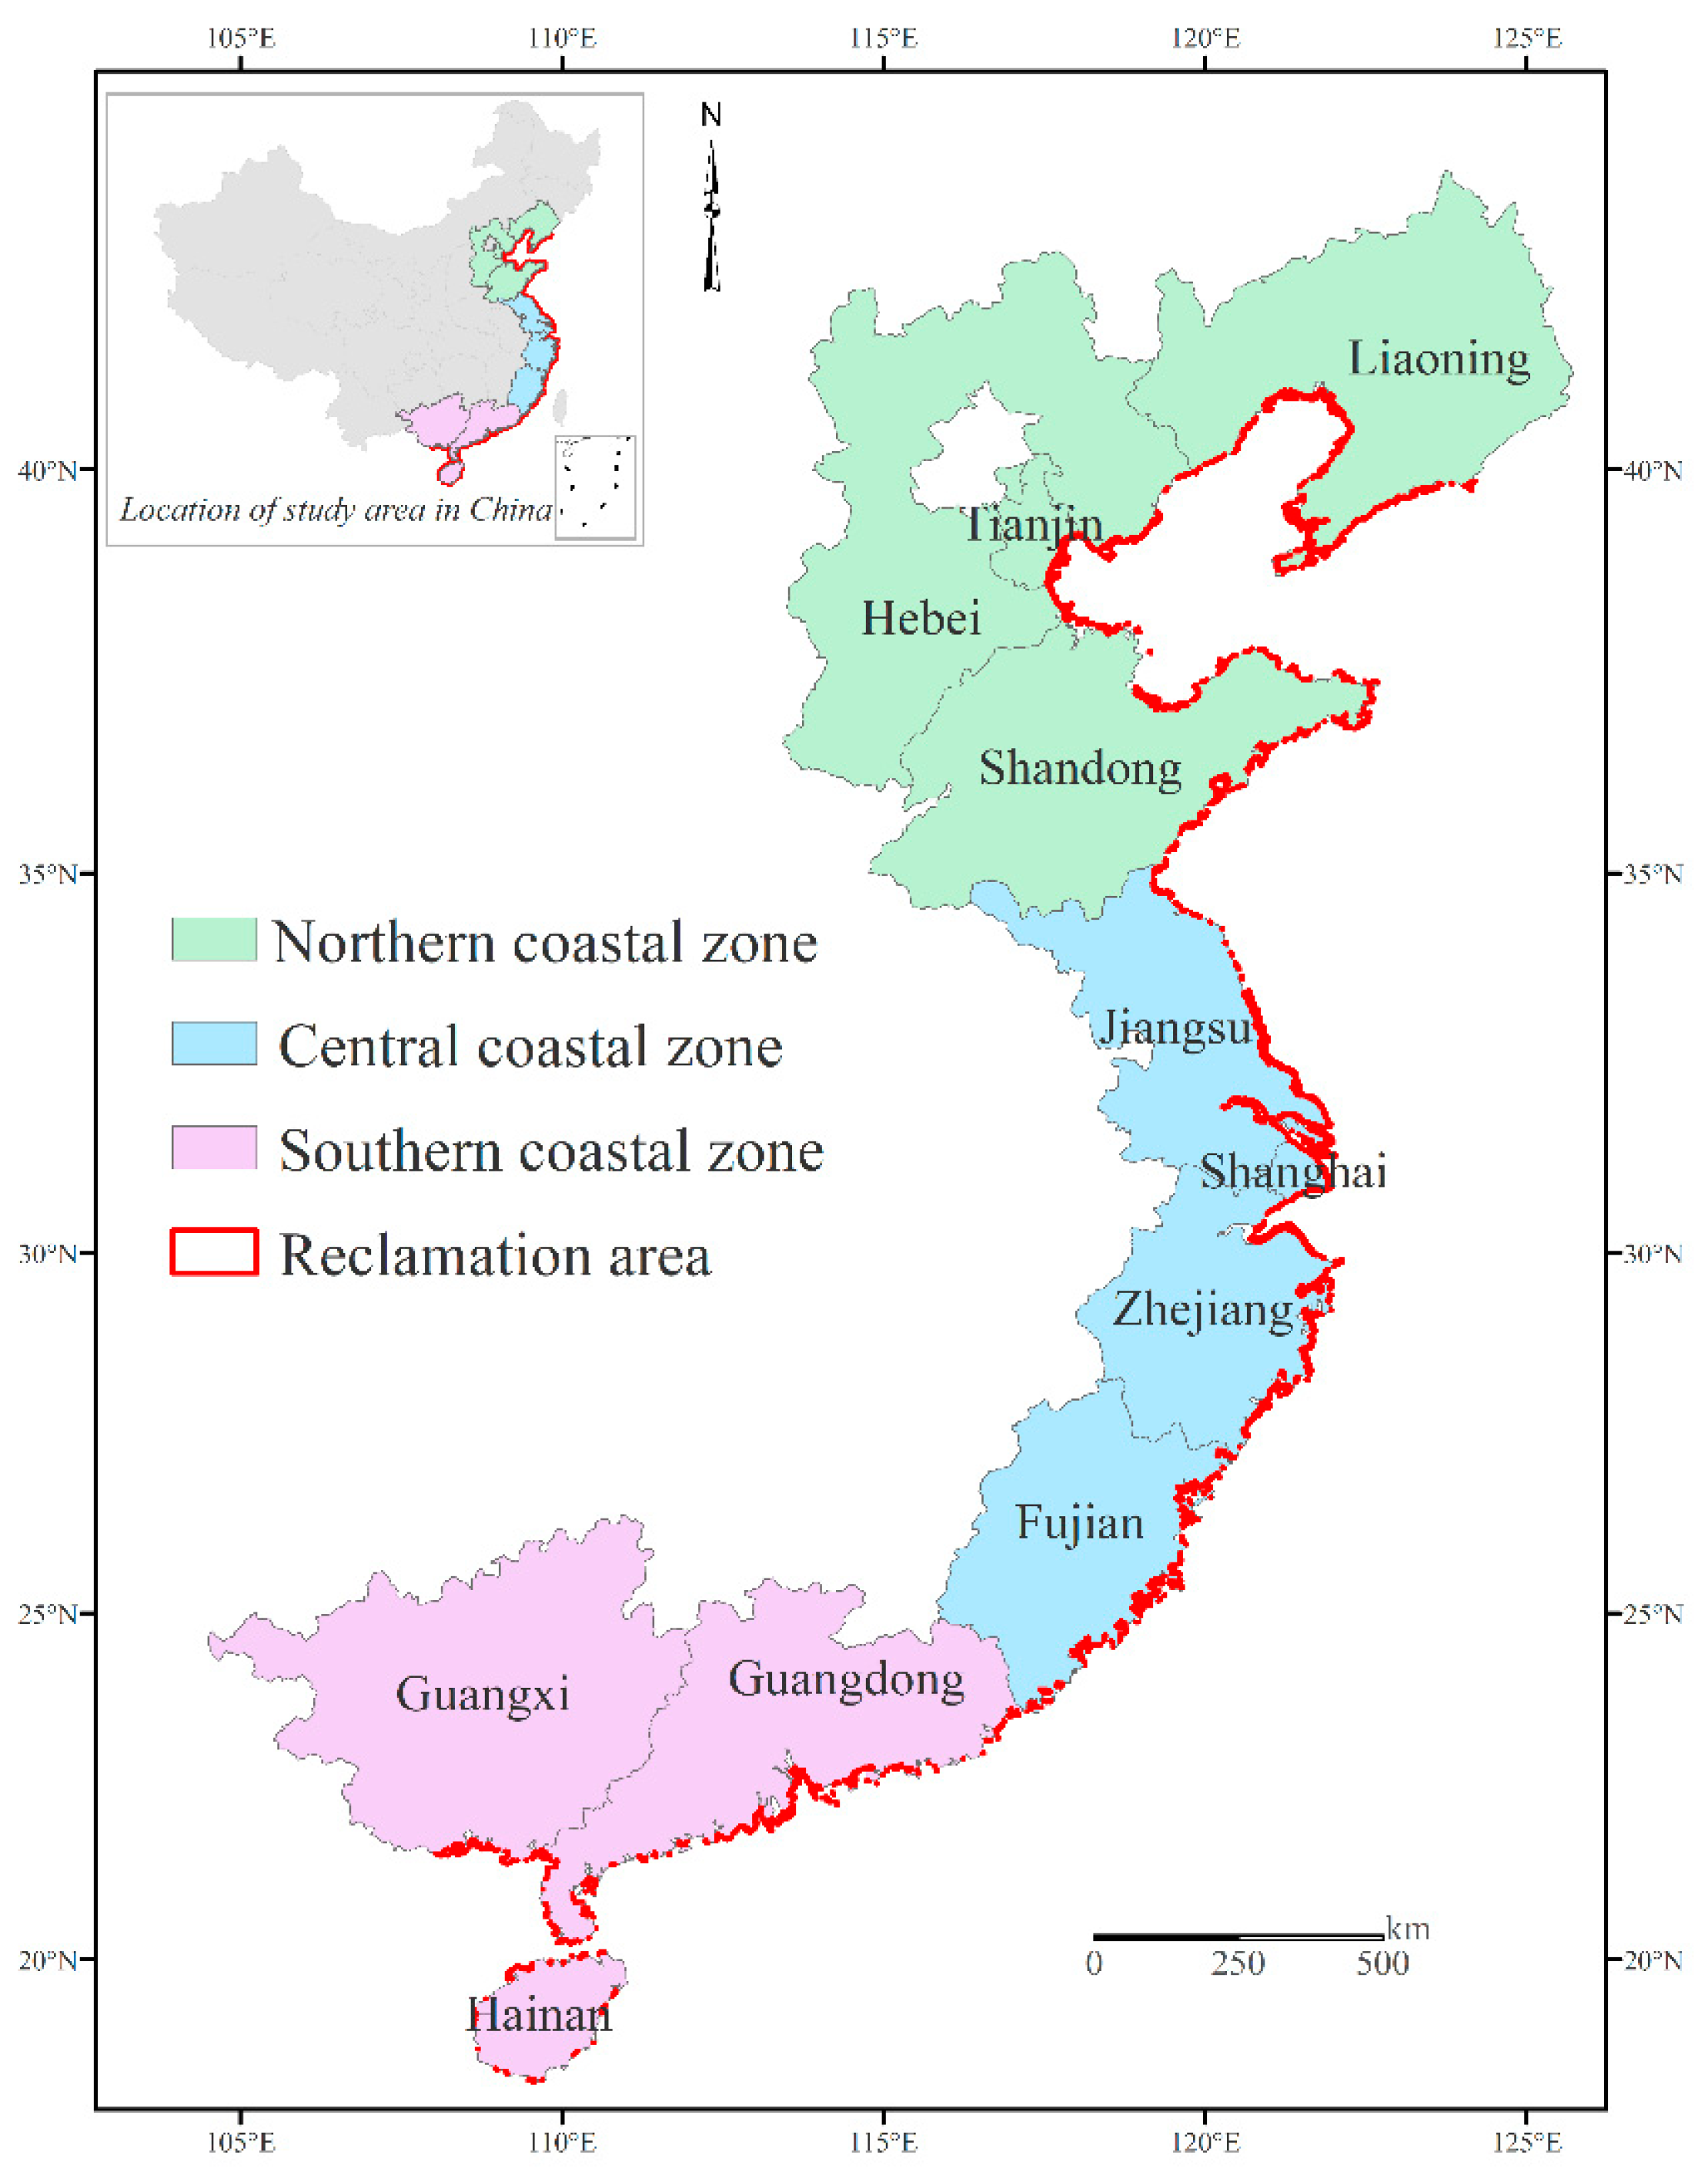
China’s rapid urbanization and economic development in coastal areas contributes to the second largest economy in the world. The rapid urbanization of coastal China is the most critical development issue in recent decades. Massive coastal land reclamation in the coastal areas of mainland China has resulted in major loss of natural habitats (Figure 1) [23]. Even though coastal reclamation has occurred in many other countries (e.g., Netherlands, England), the magnitude of the redeveloped area in China’s coastal zone has never been seen anywhere else. In total, 58% (8,010,000 ha) of coastal wetlands in China disappeared between 1950 and 2014, with land claim and infrastructure construction causing roughly 75% of wetlands loss [23,31,32]. According to the report from State Oceanic Administration, People’s republic of China in 2015, the impacts of coastal reclamation on ecosystem services resulted in the loss of wetlands of about $31,000 million, which accounts for 6% of the ocean economy in China [33].
The rapid urbanization of the coastal cities has been a feature of the past 20 years. Increasing population pressure and economic growth have resulted in the excessive expansion of terrestrial land toward the coastline. The most extensive reclamation areas are located in the coastal metropolises, with dramatic land claim occurring in Binhai new zone (Tianjin), Laizhou Bay (Shandong), Yancheng (Jiangsu), Hangzhou Bay (Zhejiang), Min River estuary (Fujian) and the Pearl River Delta (Guangdong). The high intensity of land reclamation has resulted in severe pressure and increasing vulnerability in coastal ecosystems, which has led to high ecosystem services loss [30]. More details on coastal reclamation data are provided in the next section and in the results.
Due to the variety of carbon densities in different regions, we divided the study area into three different zones on the basis of climatic zones and main vegetation types: the northern coastal zone (Liaoning, Tianjin, Hebei and Shandong province), the central coastal zone (Jiangsu, Shanghai, Zhejiang and Fujian province) and the southern coastal zone (Guangdong, Guangxi and Hainan province).
2.2. Methods of Estimating Carbon Storage in the Reclamation Area
In order to explore the specific dynamics of blue carbon storage in coastal reclamation areas on a national scale in China, we estimated carbon storage by using the InVEST model by collecting the carbon density value from published data in China’s coastal areas.
2.2.1. Integrating Reclamation and Coastal Wetlands Data
The coastal reclamation area was represented with vector data, which were calculated based on the extracted coastline data obtained by visual interpretation from 1990 to 2015 (Sajjad et al., [30]). The procedure used was to obtain an estimate of the total reclamation area by visual interpretation based on high-resolution satellite images (Google Earth images, Quick Bird and Landsat Thematic Mapper images). In this study, the landscape patterns in the coastal reclamation area were subdivided into seven types: arable land (AL, dryland and paddy field); forest land (FL, highly covered forests, open woodland and other forests); grassland (GL, natural and artificial grassland); built-up land (BL, urban and rural built-up area, transportation area and industrial area); natural wetland (NW, inland water, marsh land and mangrove); artificial wetland (AW, saltern land and aquaculture feeding ponds) and unused land (UL, bare land, rocks, newly claimed land). The value, used for coastal wetlands in 1990 in this study, was obtained from the wetlands map with 1*1 km resolution (provided by Niu et al.) [34]. In order to be integrated with reclamation data, coastal wetlands were classified into two types: natural wetland and artificial wetland. Ultimately, the landscape transformation of both natural and artificial wetlands to different reclamation landscape types was estimated through ArcGIS tool.
2.2.2. Evaluating Carbon Density and Storage
Carbon density is represented by carbon storage per unit area, indicating the total amount of carbon storage in specific ecosystems [35]. Due to the difficulties of obtaining the required parameters in different landscape patterns and biomasses, we summarized the results of carbon density in soil and biomass by using related research and a soil census on regional scales. All of the values of carbon density used in this study are published data based on field measurements in China’s coastal areas [36,37]. As the majority of data references are published in Chinese, we provided the details of references in the Supplementary Materials. In this study, the average values of carbon density were calculated based on all collected values of different landscape patterns in three different zones to allow for the considerable variations in carbon density between individual sampling sites along coastal areas (Table 1).
After collecting the carbon density in different landscape types, an InVEST model, Carbon Storage and Sequestration was used to estimate the amount of carbon currently stored in different landscapes in our study area. InVEST is a geospatial modeling tool, which has been widely used in evaluating the impacts of landscape change on ecosystem services developed by the Natural Capital Project [38]. The InVEST model provides spatially explicit impacts of different land uses on multiple ecosystem services. Carbon storage is one of the models provided to analyze the carbon stored in a landscape and quantifies the amount of sequestered carbon during trade-offs in ecosystems [39,40]. The carbon density of each landscape type and distribution map of land-use/land cover are used as the primary input data to estimate carbon storage in each grid cell. It estimates carbon storage in terms of four carbon pools (aboveground biomass, subsurface biomass, soil organic carbon and dead organic carbon). Aboveground biomass encompasses all living plants above the soil; belowground biomass comprises the living roots of all aboveground biomass; soil organic contains the organic components of soil; and dead organic carbon includes litter, lying and standing dead woods [41].
Due to the accessibility of data, carbon density in coastal wetlands was calculated only as aboveground biomass and soil organic carbon. The values of carbon density in different land use and cover types that we used in the InVEST model were the average literature values collected from related research in China’s coastal areas (Table 1). We estimated the change of carbon storage in coastal wetlands and the reclamation area by overlapping the carbon storage value in each cell of the study area in 1990 and 2015. The accumulated difference of carbon storage in the whole study area represents the overall change of carbon stock.
The carbon storage in the pool of aboveground biomass (Ca) and soil organic carbon (Cs) were aggregated over different land-use types to estimate carbon storage.
where represents the carbon density (Mg/ha) for landscape pattern i, and is the area of landscape pattern i. Afterwards, the total carbon storage in coastal wetlands (TC) was calculated as:
3. Results
3.1. Transformation Matrix between Landscape Patterns in the Reclamation Areas
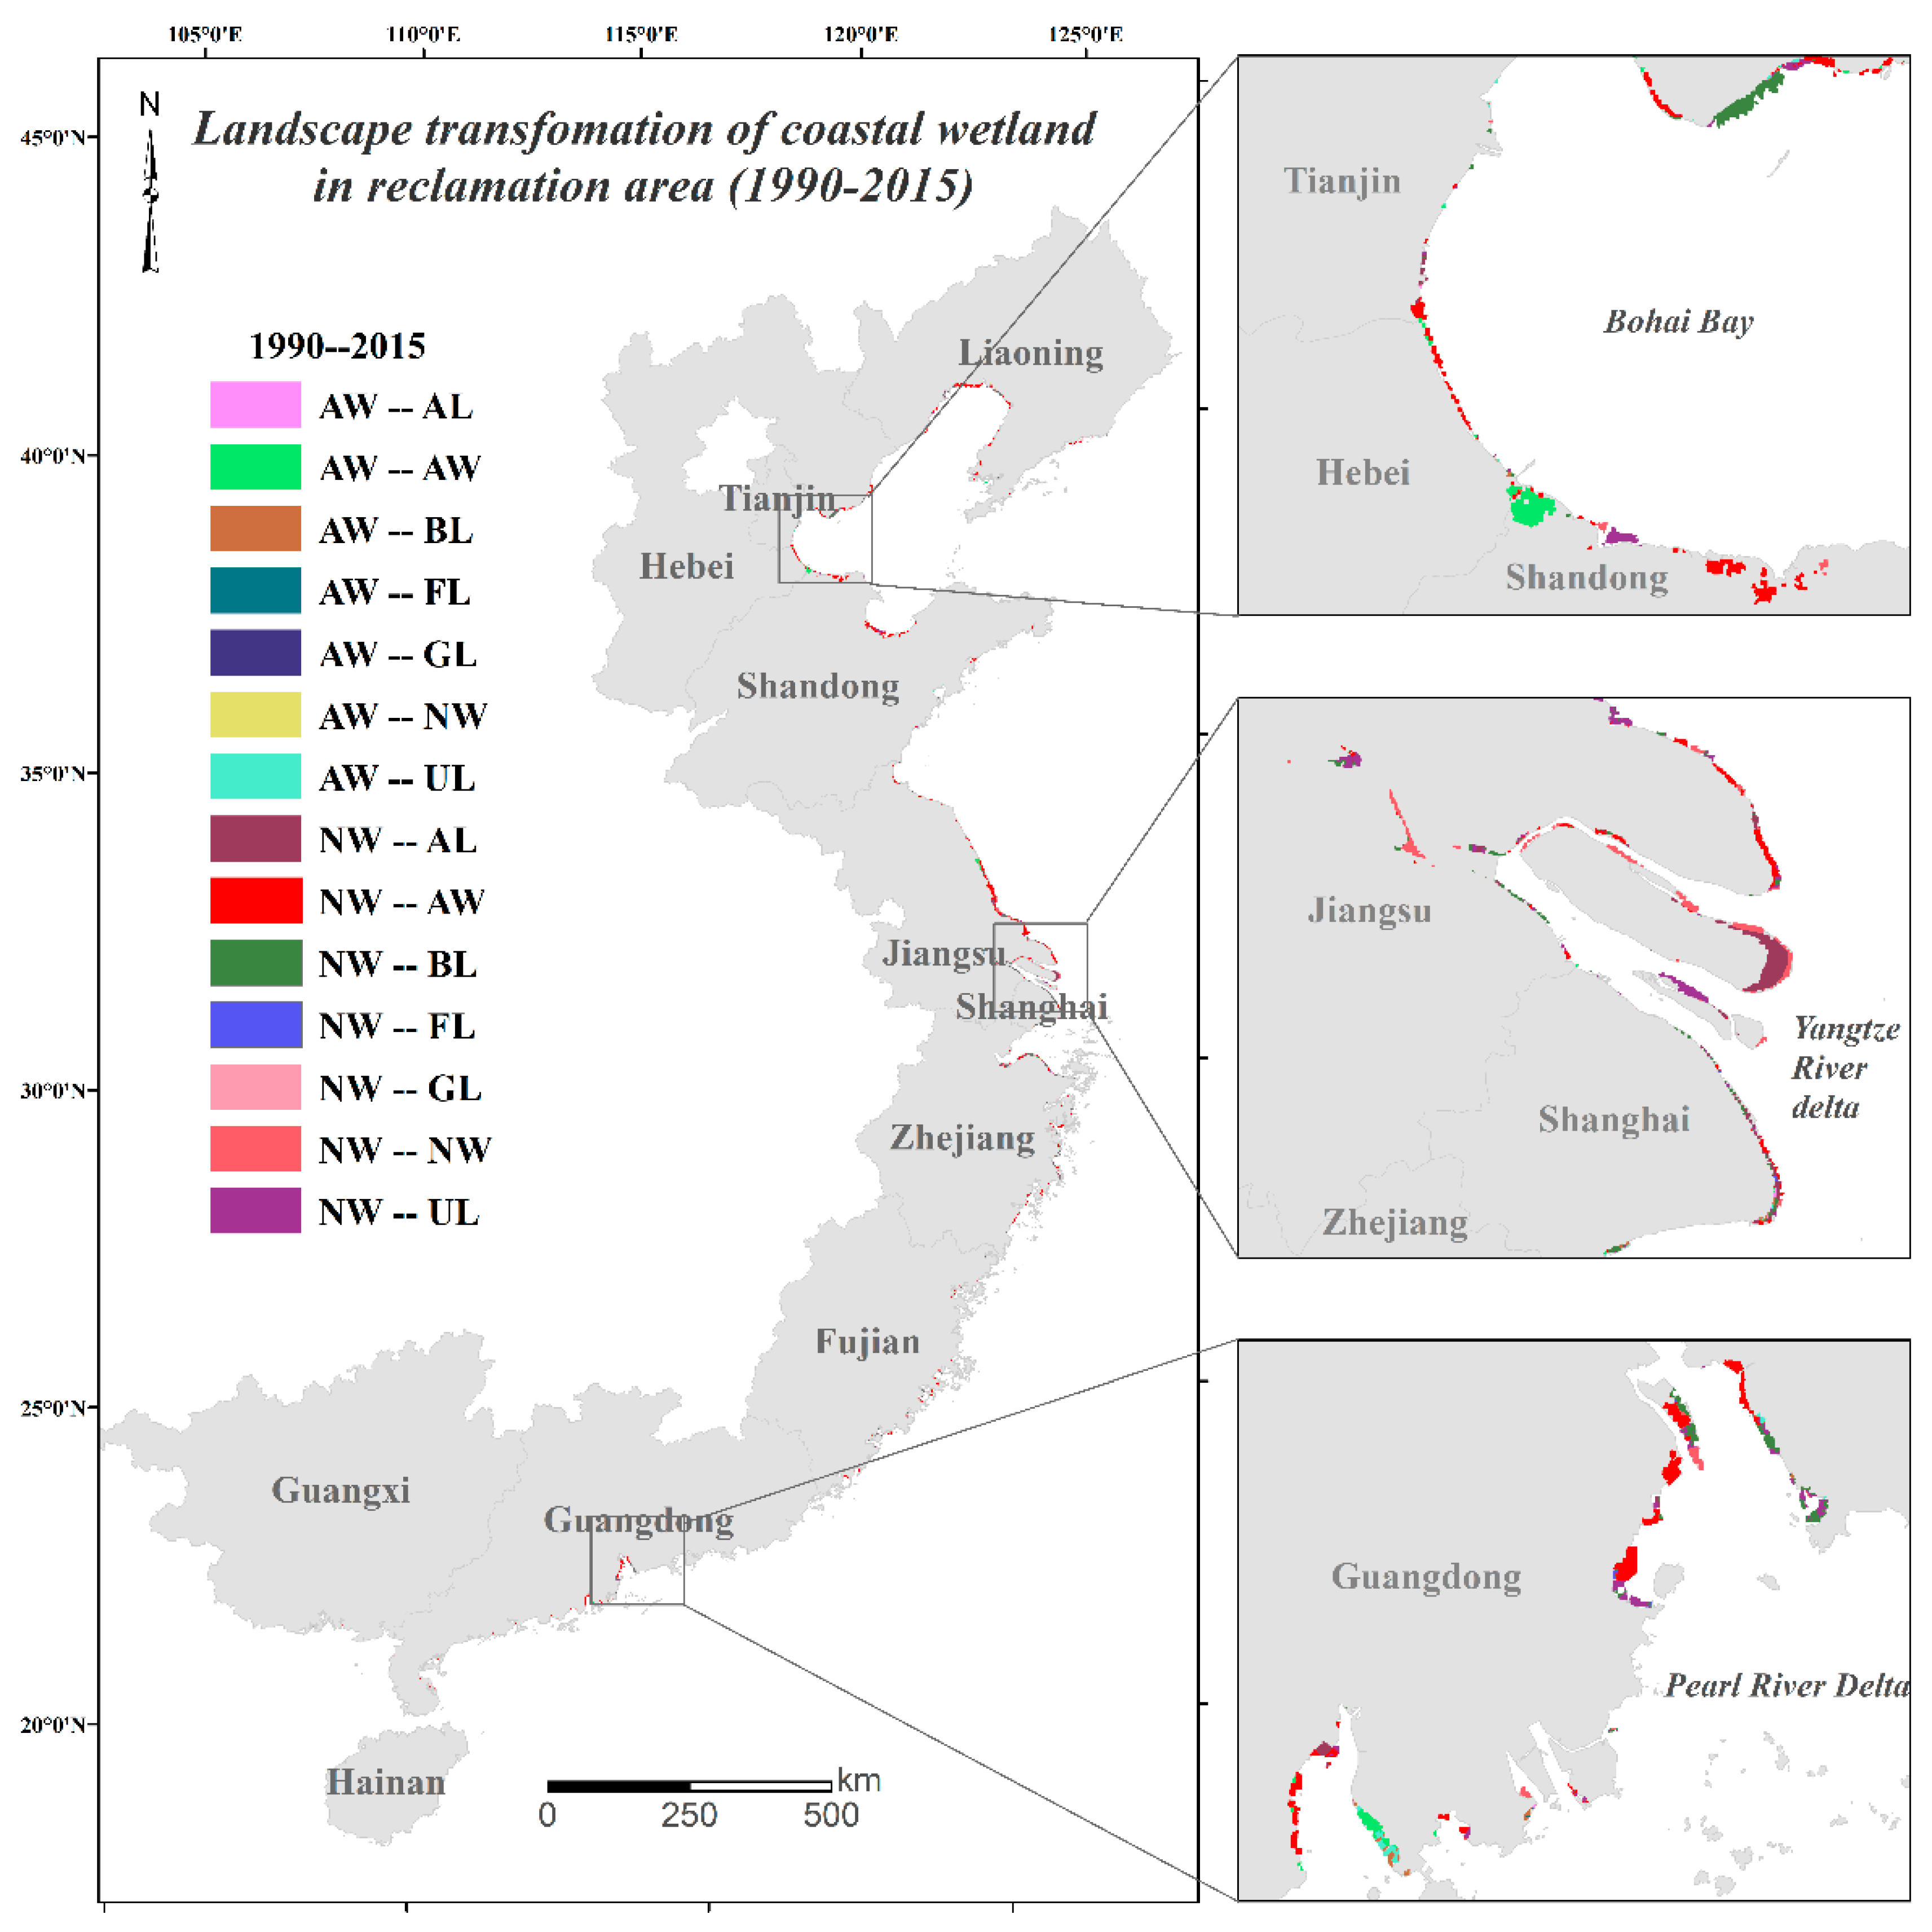
The transformation matrix quantified conversions of different landscape patterns between 1990 and 2015, which signifies the spatial distribution of the conversion of wetlands to different reclamation lands (details are provided in Supplementary Materials, Table S1). The results show that a total of 386,400 hectares (6.7%) of coastal wetlands were lost as a result of reclamation (Table 2). Among the transformations identified were 296,000 hectares of natural wetlands (NW) converted into other types of landscapes within the reclamation areas (Figure 2). Among all the landscape transformations of natural wetlands, the most significant change is that 48.0% of natural wetlands were converted to artificial wetlands (AW, including saltern lands and aquaculture ponds). The next largest changes were unused land (UL) that occupied 16.5% of natural wetlands, and 12.4% for built-up land (BL). Due to the dramatic landscape transformation in the reclamation area, only 13.0% of natural wetlands remained unchanged during this period. In addition, 11,000 hectares (24.9%) of artificial wetlands were converted into other types of land use. The expansion of built-up land occupied 7.7% of artificial wetlands, followed by 6.6% of unused land.
3.2. Loss of Blue Carbon Stock in the Coastal Reclamation Area
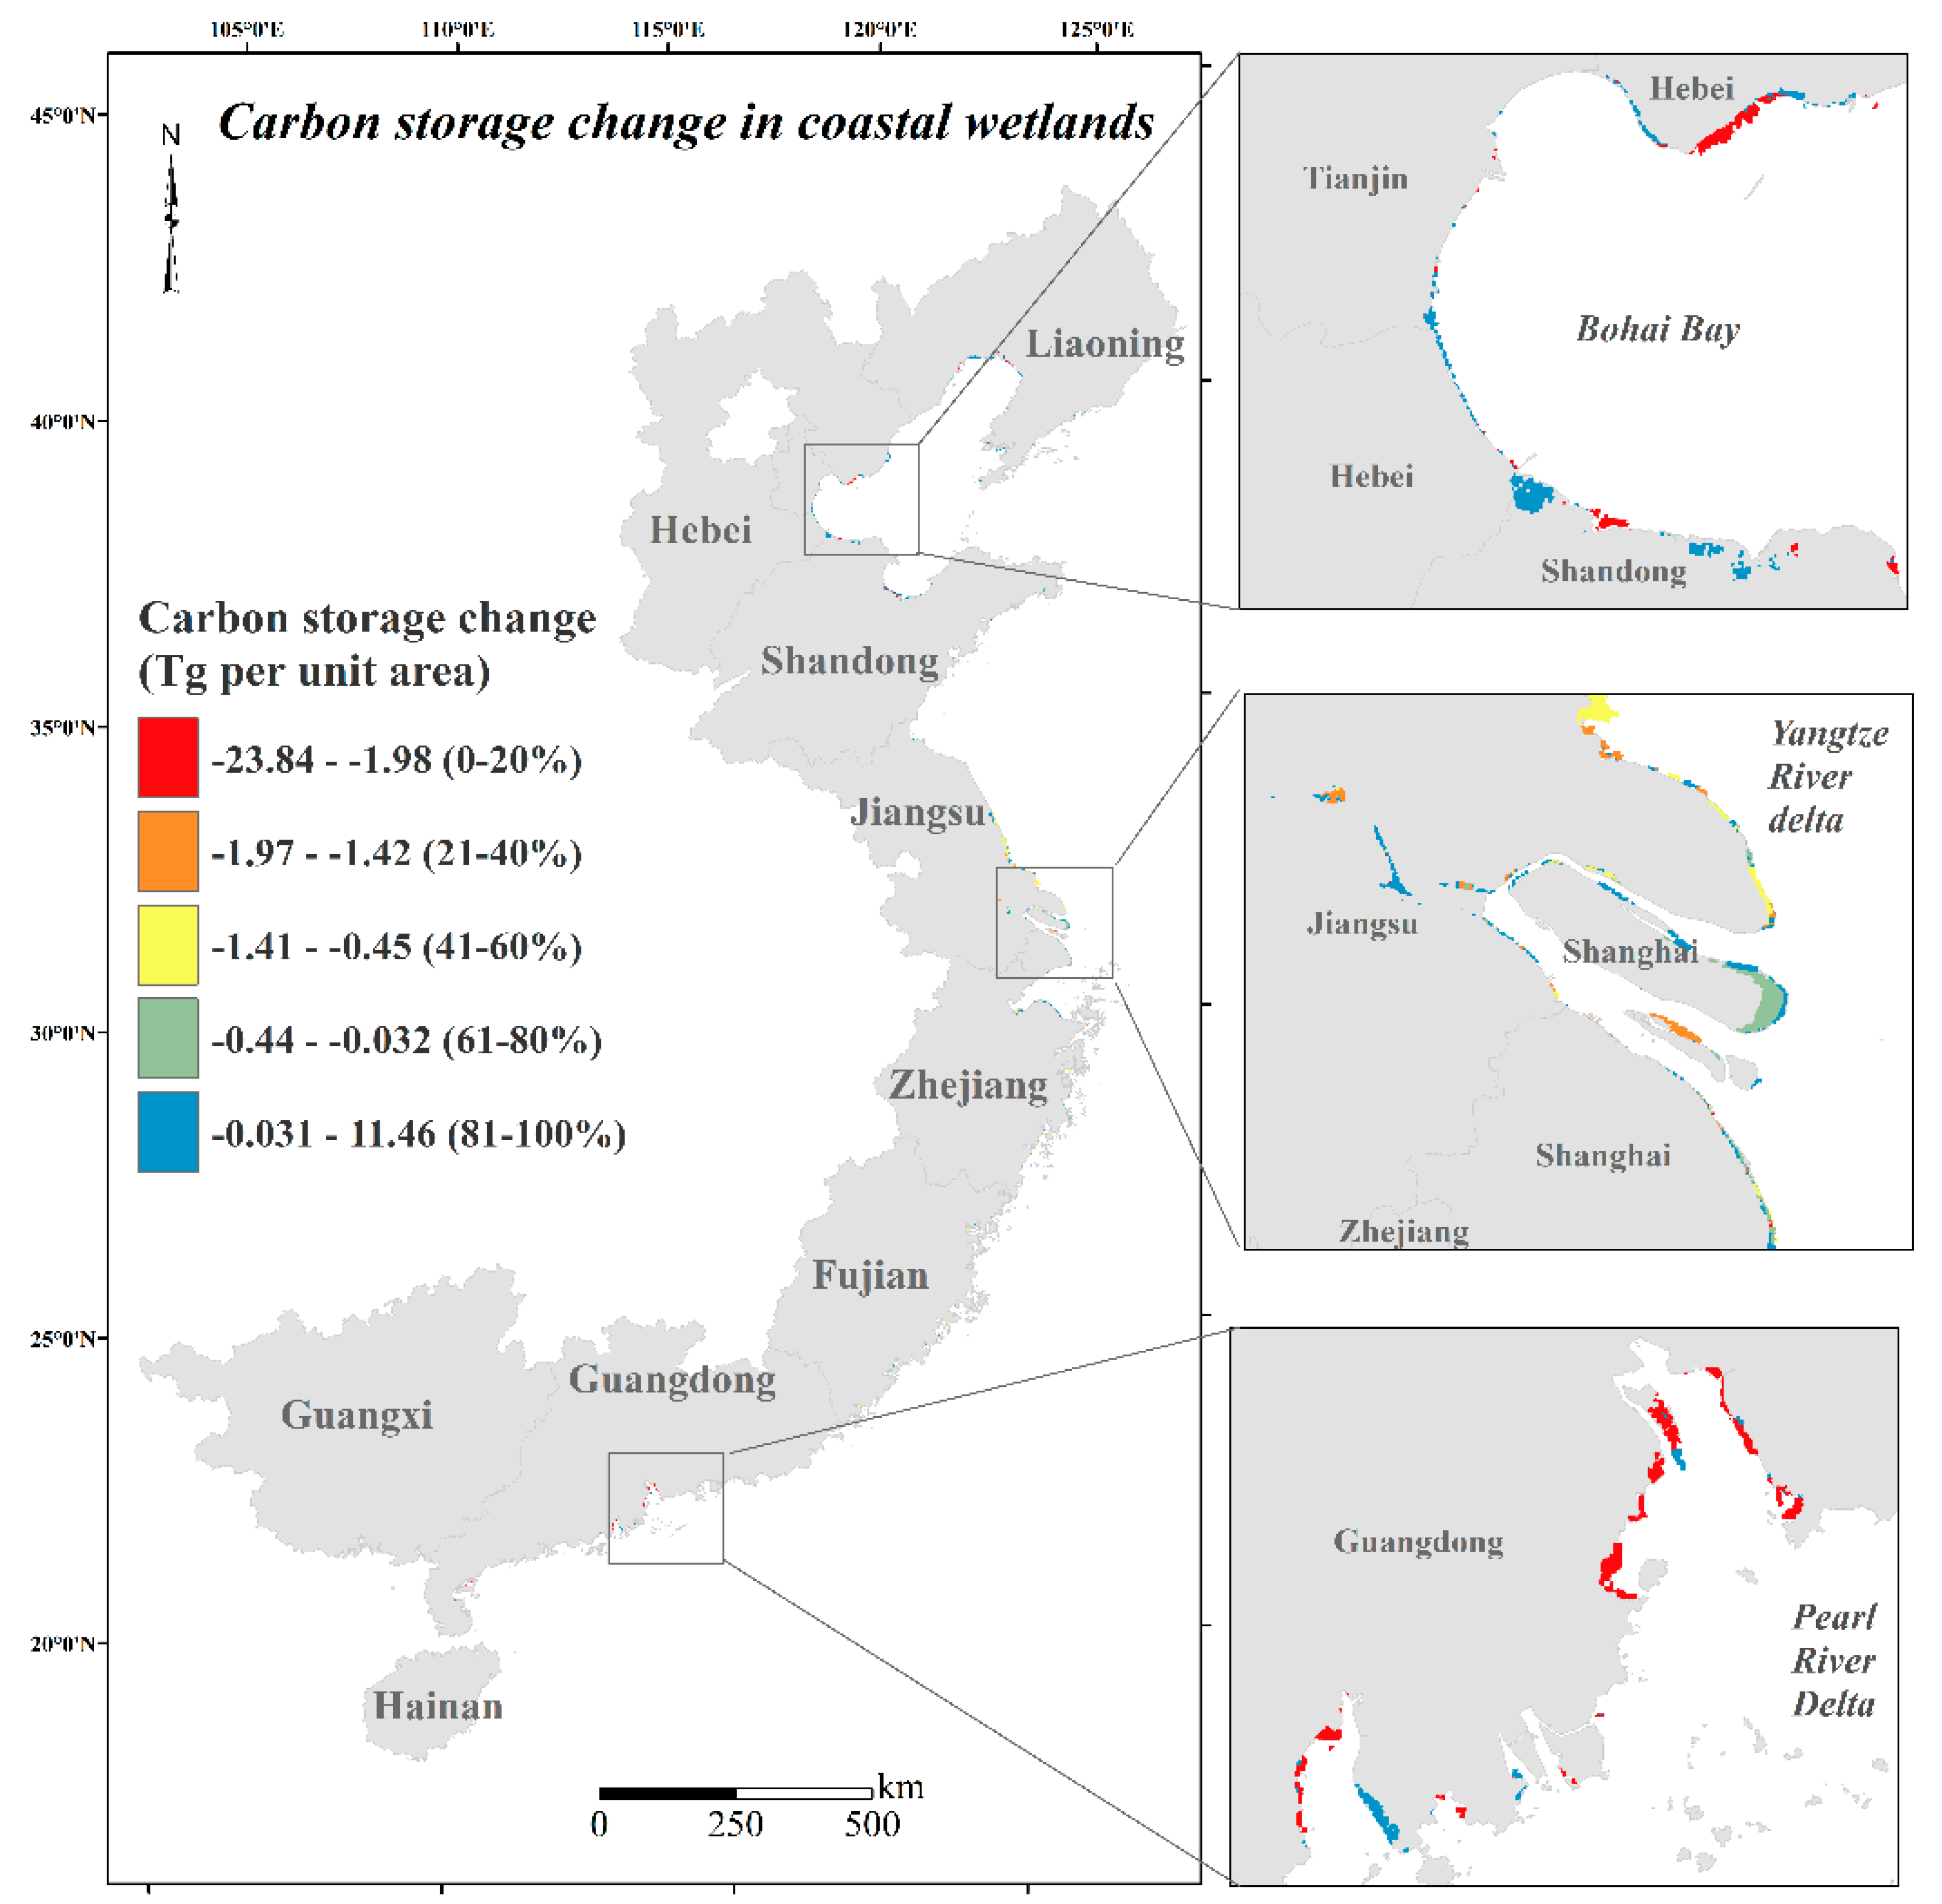
Based on the landscape transformations of wetlands, we quantified the total carbon storage in the land claimed area (Table 3 and Figure 3). Our results show that there was a dramatic decrease of blue carbon storage in this area, which changed from 36.6 Tg in 1990 to 16.0 Tg in 2015 with an annual carbon emission of 0.83 Tg. This signifies a large amount of carbon emission in coastal wetlands due to the loss of more than half of stored carbon. According to our analysis, carbon stocks in the northern coastal zone decreased by 7.0 Tg, 9.5 Tg in the central coastal zone and 4.2 Tg in the southern coastal zone. The most significant decrease of carbon storage was found in Bohai Bay, the Yangtze River Delta and the Pearl River Delta.
To understand the specific impacts of different types of landscape change on blue carbon loss, we identified carbon sources and carbon sinks according to the change of carbon stocks before and after reclamation. The main sources of carbon loss were landscape transformations of natural wetlands to artificial wetlands, which resulted in a decrease in carbon storage of 14.99 Tg. The transformation from artificial wetlands to types of reclamation land generated a 0.59 Tg increase of carbon stock. This means that the conversion of artificial wetlands resulted in an increased carbon sink. By contrast, the coastal reclamation of natural wetlands in all three coastal zones resulted in a reduction of organic carbon storage by 21.28 Tg, i.e., a potential release of the stored carbon into the environment.
3.3. Validation of Results
Because the land use and cover change data (distribution of coastal reclamation) is one of the main inputs in estimating carbon storage change, it may affect the accuracy of the results obtained in this study. The interpreted map of coastal reclamation in 2015 has been checked by field validation in all types of reclamation. Our validation results show that about 95% of the tested area is correctly interpreted. To quantify the reliability of quantified carbon storage in this study, we also compared the annual blue carbon storage (0.67 Mg/ha) in our research with similar estimation data in Jiangsu, a coastal province in the middle zone (0.44 Mg/ha) published by Chuai et al. [42]. Additionally, the carbon storage loss of 60 Tg/km2 quantified in this research is comparable with the results (53 Tg/km2) presented by He et al. in Beijing [17]. The comparison obtained suggests that our estimation is comparable with previous results in China’s coastal areas.
4. Discussion
4.1. Main Factors of Landscape Transformation in Carbon Storage Loss
The total carbon emission from energy consumption in all coastal Chinese provinces in 2014 was 1816.68 Tg (statistical data is provided in Supplementary Materials, Table S2). This results in an estimate of 13.42 Tg of carbon emission in the coastal reclamation area. Here, it was calculated that the transformation from wetlands to other land uses in the same region was 20.69 Tg. Thus, we found that coastal reclamation resulted in a larger reduction in carbon storage than the energy consumption in this area. Due to the large amount of carbon storage loss by coastal reclamation of natural wetlands, controlling the landscape transformation of natural wetlands is an important strategy in reducing carbon storage loss.
Blue carbon stored in coastal wetlands ranks among the most efficient sequestration systems on the planet, however, as a direct consequence of urban expansion in coastal cities, a large amount of blue carbon has been lost. This is a major environmental problem, since in addition to the loss of carbon storage, it also breaks the balance of many important ecosystem services in coastal areas. The spatial estimation of blue carbon changes, as a result of extensive reclamation, has been quantified in this study, which includes the specific dynamics of carbon storage in each type of landscape transformation. Landscape change is a major driver of carbon emissions, the carbon emission from loss of blue carbon contributes 150–1020 Tg of the total global anthropogenic carbon emitted [43]. The 21.28 Tg carbon loss triggered by coastal reclamation (6.67% of China’s wetlands) is equivalent to 2.08–14.18% of global blue carbon loss, which means that the changes to the Chinese coastal region represent a major fraction of the global coastal reclamation, thus having important impacts on our estimates of global blue carbon loss. Among all of these landscape transformations, the carbon loss from natural wetlands to artificial wetlands is the most important single change resulting in 72.45% of total carbon loss in China’s coastal wetlands. As one of the typical characteristics of coastal economic development in China, artificial feeding of aquaculture organisms in artificial wetlands becomes one of the main human disturbances in coastal areas. Therefore, recovering and controlling the development and operation of artificial wetlands can be the most efficient way of eliminating carbon loss in China. Stricter regulation of coastal feeding is needed to maintain sustainability in coastal ecosystems.
Due to the transition of economic development in the most developed metropolitan areas, the conversion into increased built-up lands is the second largest landscape transformation from natural wetlands. Large industrial complexes, coastal interstate highways, and airports have been built along the coastal zone, filling in sites that were occupied by natural wetlands. In total, 43.5% of coastal wetlands have been lost, notably the major loss of mangroves due to coastal expansion in many developing metropolitan areas [30,44]. The current status of blue carbon coastal wetlands in China reflects the serious conflict of human activities and natural habitats conservation. Areas of significant carbon storage loss (the top 20% of carbon loss shown in Figure 3 with red color) emphasize the most important priority sites in maintaining and recovering blue carbon in coastal areas.
4.2. Guidelines for Redline Area Planning in China’s Coastal Areas
The coastal wetlands with the top 20% of carbon storage loss covered only 4.2% of the total reclamation area. The majority of these high carbon loss areas were found in the Pearl River Delta and the Bohai Bay. The rest were scattered in other coastal areas. These areas represent the priority locations for regaining carbon in coastal areas where the local government and coastal development agencies should consider the importance of maintaining balances of carbon trade-offs in developing coastal systems. A great amount of new areas of dry land have appeared in metropolitan areas adjacent to the Bohai Bay, and in the Yangtze and Pearl River Delta [23,31]. Landscape conversion caused by rapid financial development and urbanization are key drivers of carbon emission [45,46], however, the changing patterns of carbon storage in these three regions were various. Among them, the Pearl River Delta had the smallest area of carbon loss, but the amount of carbon loss in the Pearl River Delta was the most significant. Therefore, conserving natural wetlands in the southern coastal zone is the most critical area in conserving ecosystem services of blue carbon storage along China’s coastline.
Due to the requirements of rapid urbanization development in these economic zones, increasing urban areas are built within the coastal shoreline. As much of the available suitable terrestrial land is already occupied, expanding reclamation into coastal wetlands is an economically effective (in the short term) way of gaining new built-up lands. Our estimation quantifies the effect of the increasing land reclamation pressure in coastal ecosystems by demonstrating the decrease in carbon storage due to reclamation activities in these areas. As of 2016, China’s central government has adopted new top-down policies that involves imposing a ‘Redline’, a boundary delineating a coastal strip in which to preserve existing natural coastal environments, both for ecosystem function and to reduce conflicts between natural processes and human settlements. It is suggested here that the areas which represent the top 20% of carbon loss derived from this study could be applied as one of the main factors to create the boundary of such a coastal strip of the redline area. Preserving these critical coastal ecosystems from rapid urbanization would reduce the loss of blue carbon storage, and would add a new dimension of spatial environmental planning considering blue carbon storage in the development of coastal sustainable plans.
A major challenge in this study was the lack of a spatially representative database of carbon density in China’s coastal wetlands, especially in artificial wetlands. This limitation could potentially lead to inaccuracies and biases in the estimates of carbon storage. Because of limited detailed and reliable data on carbon density, belowground biomass and dead organic carbon were not included in this study. In order to minimize this potential source of error, further experimental estimation of carbon stock of these two types of carbon biomasses and their transformations is needed to more accurately determine the changes in blue carbon storage under the influences of coastal reclamation.
5. Conclusions
One of the seldom considered consequences of the reclamation of natural wetlands in rapidly urbanizing coastal areas is the irreversible decrease of blue carbon stocks in wetland ecosystems. The release of blue carbon in coastal wetlands due to land reclamation in the past 25 years has resulted in a large and dramatic degradation of ecosystem services as a carbon source. Among all landscape transformations in reclamation areas, the conversion of natural wetlands to artificial wetlands was the largest single change resulting in a net increase of carbon storage. Our study suggests that the expansion of artificial wetlands is the main concern of carbon emission in the reclamation area. Appropriate regulations on the development and operation of artificial wetlands would help to sequester and store blue carbon and reduce the release of carbon dioxide into the atmosphere. Adding the consideration of carbon emission and sustained ecosystem service to the plans for the implementation of the Redline policy could guide the management of coastal areas for greater resiliency.
According to the comprehensive measurement of blue carbon storage in coastal wetlands, we defined the specific carbon sources of different anthropogenic activities and natural processes that release carbon dioxide, as well as carbon sinks that sequester carbon dioxide from the atmosphere. Because of the high carbon density in natural wetlands and much lower carbon density in artificial wetlands, landscape conversions of natural wetlands to artificial wetlands were the most critical change in carbon storage; on the other hand, landscape conversions of artificial wetlands to other land uses were characterized as carbon sinks. The identification of the carbon source and sink with quantified density can provide theoretical support in monitoring the carbon emission in response to coastal reclamation.
In recent years, the government of China has implemented new regulations concerning coastal reclamation. As a result, further coastal reclamation is strictly controlled by local and central governments. It is suggested that an accurate determination of carbon loss from land use changes should be included in the criteria for deciding Redline policies in addition to other considerations such as sea level rise and REDD. In particular, we advocate using the estimates of blue carbon change under coastal reclamation presented in this study as an important consideration for protecting critical coastal resources, predicting future scenarios based on the Ecological Civilization regulations in China. The accuracy of our approach should ideally be further improved by making more accurate estimates of carbon loss from natural wetlands by estimating mangroves, seagrasses and tidal marshes as well as adding belowground and dead organic carbon storage.
Supplementary Materials
The following are available online at https://www.mdpi.com/2071-1050/10/8/2818/s1, References used for carbon density, Table S1: Coastal reclamation area in coastal zones between 1990–2015, Table S2: Carbon emissions from energy consumption in China’s coastal area.
Author Contributions
Y.L. (Yangfan Li) constructed the main idea and Y.L. (Yi Li), J.Q., Z.L., and Y.L. (Yangfan Li) were responsible for the writing of the manuscript. Y.L. (Yi Li) and Q.J.H. conceived and developed the methodology and collected the data. All authors contributed critically to the drafts and gave final approval for publication.
Funding
This research was supported by the National Natural Science Foundation of China (NSFC) Grants (41671084) and China Postdoctoral Science Foundation (2018T110646).
Acknowledgments
Many thanks to Xiaoping Liu at Sun Yat-Sen University and his group members for their help in developing the methods of reclamation interpretation, and their contribution of half of the reclamation data. Thanks to Michael Krom from University of Haifa for his help with rewording our manuscript carried out while on a visiting professorship at Xiamen University.
Conflicts of Interest
The authors declare no conflicts of interest.
References
- Macreadie, P.I.; Nielsen, D.A.; Kelleway, J.J.; Atwood, T.B.; Seymour, J.R.; Petrou, K.; Connolly, R.M.; Thomson, A.C.; Trevathan-Tackett, S.M.; Ralph, P.J. Can we manage coastal ecosystems to sequester more blue carbon? Front. Ecol. Environ. 2017, 15, 206–213. [Google Scholar] [CrossRef]
- Duarte, C.M.; Losada, I.J.; Hendriks, I.E.; Mazarrasa, I.; Marbà, N. The role of coastal plant communities for climate change mitigation and adaptation. Nat. Clim. Chang. 2013, 3, 961–968. [Google Scholar] [CrossRef] [Green Version]
- Mcleod, E.; Chmura, G.L.; Bouillon, S.; Salm, R.; Björk, M.; Duarte, C.M.; Lovelock, C.E.; Schlesinger, W.H.; Silliman, B.R. A blueprint for blue carbon: Toward an improved understanding of the role of vegetated coastal habitats in sequestering CO2. Front. Ecol. Environ. 2011, 9, 552–560. [Google Scholar] [CrossRef] [Green Version]
- Duarte, C.M.; Kennedy, H.; Marbà, N.; Hendriks, I. Assessing the capacity of seagrass meadows for carbon burial: Current limitations and future strategies. Ocean Coast. Manag. 2013, 83, 32–38. [Google Scholar] [CrossRef] [Green Version]
- Locatelli, T.; Binet, T.; Kairo, J.G.; King, L.; Madden, S.; Patenaude, G.; Upton, C.; Huxham, M. Turning the tide: How blue carbon and Payments for Ecosystem Services (PES) might help save mangrove forests. Ambio 2014, 43, 981–995. [Google Scholar] [CrossRef] [PubMed]
- Huang, X.; Wang, X.; Li, X.; Xin, K.; Yan, Z.; Sun, Y.; Bellerby, R. Distribution Pattern and Influencing Factors for Soil Organic Carbon (SOC) in Mangrove Communities at Dongzhaigang, China. J. Coast. Res. 2017, 434–442. [Google Scholar] [CrossRef]
- Hu, M.; Ren, H.; Ren, P.; Li, J.; Wilson, B.J.; Tong, C. Response of gaseous carbon emissions to low-level salinity increase in tidal marsh ecosystem of the Min River estuary, southeastern China. J. Environ. Sci. 2017, 52, 210–222. [Google Scholar] [CrossRef] [PubMed]
- Laurance, W.F.; Dell, B.; Turton, S.M.; Lawes, M.J.; Hutley, L.B.; McCallum, H.; Dale, P.; Bird, M.; Hardy, G.; Prideaux, G.; et al. The 10 Australian ecosystems most vulnerable to tipping points. Biol. Conserv. 2011, 144, 1472–1480. [Google Scholar] [CrossRef]
- Doughty, C.L.; Langley, J.A.; Walker, W.S.; Feller, I.C.; Schaub, R.; Chapman, S.K. Mangrove range expansion rapidly increases coastal wetland carbon storage. Estuaries Coasts 2016, 39, 385–396. [Google Scholar] [CrossRef]
- Howard, J.; Sutton-Grier, A.; Herr, D.; Kleypas, J.; Landis, E.; Mcleod, E.; Pidgeon, E.; Simpson, S. Clarifying the role of coastal and marine systems in climate mitigation. Front. Ecol. Environ. 2017, 15, 42–50. [Google Scholar] [CrossRef] [Green Version]
- Macreadie, P.I.; Ollivier, Q.R.; Kelleway, J.J.; Serrano, O.; Carnell, P.E.; Ewers Lewis, C.J.; Atwood, T.B.; Sanderman, J.; Baldock, J.; Connolly, R.M.; et al. Carbon sequestration by Australian tidal marshes. Sci. Rep. 2017, 7, 44071. [Google Scholar] [CrossRef] [PubMed] [Green Version]
- Lovelock, C.E.; Fourqurean, J.W.; Morris, J.T. Modeled CO2 Emissions from Coastal Wetland Transitions to Other Land Uses: Tidal Marshes, Mangrove Forests, and Seagrass Beds. Front. Mar. Sci. 2017, 4, 143. [Google Scholar] [CrossRef]
- Arias-Ortiz, A.; Serrano, O.; Masqué, P.; Lavery, P.S.; Mueller, U.; Kendrick, G.A.; Rozaimi, M.; Esteban, A.; Fourqurean, J.W.; Marbà, N.; et al. A marine heatwave drives massive losses from the world’s largest seagrass carbon stocks. Nat. Clim. Chang. 2018, 8, 338–344. [Google Scholar] [CrossRef]
- Schwandner, F.M.; Gunson, M.R.; Miller, C.E.; Carn, S.A.; Eldering, A.; Krings, T.; Verhulst, K.R.; Schimel, D.S.; Nguyen, H.M.; Crisp, D.; et al. Spaceborne detection of localized carbon dioxide sources. Science 2017, 358, eaam5782. [Google Scholar] [CrossRef] [PubMed]
- Sanderman, J.; Hengl, T.; Fiske, G.J. Soil carbon debt of 12,000 years of human land use. Proc. Natl. Acad. Sci. USA 2017, 114, 9575–9580. [Google Scholar] [CrossRef] [PubMed] [Green Version]
- Liang, Y.; Liu, L.; Huang, J. Integrating the SD-CLUE-S and InVEST models into assessment of oasis carbon storage in northwestern China. PLoS ONE 2017, 12, e0172494. [Google Scholar] [CrossRef] [PubMed]
- He, C.; Zhang, D.; Huang, Q.; Zhao, Y. Assessing the potential impacts of urban expansion on regional carbon storage by linking the LUSD-urban and InVEST models. Environ. Model. Softw. 2016, 75, 44–58. [Google Scholar] [CrossRef]
- Sun, X.; Li, F. Spatiotemporal assessment and trade-offs of multiple ecosystem services based on land use changes in Zengcheng, China. Sci. Total Environ. 2017, 609, 1569–1581. [Google Scholar] [CrossRef] [PubMed]
- Lovelock, C.E.; Adame, M.F.; Bennion, V.; Hayes, M.; O’Mara, J.; Reef, R.; Santini, N.S. Contemporary rates of carbon sequestration through vertical accretion of sediments in mangrove forests and saltmarshes of South East Queensland, Australia. Estuaries Coasts 2014, 37, 763–771. [Google Scholar] [CrossRef]
- Alongi, D.M. Carbon cycling and storage in mangrove forests. Annu. Rev. Mar. Sci. 2014, 6, 195–219. [Google Scholar] [CrossRef] [PubMed]
- Leh, M.D.K.; Matlock, M.D.; Cummings, E.C.; Nalley, L.L. Quantifying and mapping multiple ecosystem services change in West Africa. Agric. Ecosyst. Environ. 2013, 165, 6–18. [Google Scholar] [CrossRef]
- Grafius, D.R.; Corstanje, R.; Warren, P.H.; Evans, K.L.; Hancock, S.; Harris, J.A. The impact of land use/land cover scale on modelling urban ecosystem services. Landsc. Ecol. 2016, 31, 1509–1522. [Google Scholar] [CrossRef] [Green Version]
- Ma, Z.; Melville, D.S.; Liu, J.; Chen, Y.; Yang, H.; Ren, W.; Zhang, Z.; Piersma, T.; Li, B. Rethinking China’s new great wall. Science 2014, 346, 912–914. [Google Scholar] [CrossRef] [PubMed]
- Kirwan, M.L.; Megonigal, J.P. Tidal wetland stability in the face of human impacts and sea-level rise. Nature 2013, 504, 53–60. [Google Scholar] [CrossRef] [PubMed]
- Richards, D.R.; Friess, D.A. Rates and drivers of mangrove deforestation in Southeast Asia, 2000–2012. Proc. Natl. Acad. Sci. USA 2016, 113, 344–349. [Google Scholar] [CrossRef] [PubMed]
- Wang, X.; Kuang, F.; Tan, K.; Ma, Z. Population trends, threats, and conservation recommendations for waterbirds in China. Avian Res. 2018, 9, 14. [Google Scholar] [CrossRef] [Green Version]
- Donato, D.C.; Kauffman, J.B.; Murdiyarso, D.; Kurnianto, S.; Stidham, M.; Kanninen, M. Mangroves among the most carbon-rich forests in the tropics. Nat. Geosci. 2011, 4, 293–297. [Google Scholar] [CrossRef]
- Hopkinson, C.S.; Cai, W.-J.; Hu, X. Carbon sequestration in wetland dominated coastal systems—A global sink of rapidly diminishing magnitude. Curr. Opin. Environ. Sustain. 2012, 4, 186–194. [Google Scholar] [CrossRef]
- Baccini, A.; Walker, W.; Carvalho, L.; Farina, M.; Sulla-Menashe, D.; Houghton, R.A. Tropical forests are a net carbon source based on aboveground measurements of gain and loss. Science 2017, 358, 230–234. [Google Scholar] [CrossRef] [PubMed]
- Sajjad, M.; Li, Y.; Tang, Z.; Cao, L.; Liu, X. Assessing hazard vulnerability, habitat conservation, and restoration for the enhancement of mainland China’s Coastal Resilience. Earths Future 2018, 6, 326–338. [Google Scholar] [CrossRef]
- Tian, B.; Wu, W.; Yang, Z.; Zhou, Y. Drivers, trends, and potential impacts of long-term coastal reclamation in China from 1985 to 2010. Estuar. Coast. Shelf Sci. 2016, 170, 83–90. [Google Scholar] [CrossRef]
- Cui, B.; He, Q.; Gu, B.; Bai, J.; Liu, X. China’s Coastal Wetlands: Understanding environmental changes and human impacts for management and conservation. Wetlands 2016, 36, 1–9. [Google Scholar] [CrossRef]
- Report on the Management of the Use of Sea Areas (2015); State Oceanic Administration, People’s Republic of China: Beijing, China, 2016.
- Niu, Z.; Zhang, H.; Wang, X.; Zhou, W. Mapping wetland changes in China between 1978 and 2008. Chin. Sci. Bull. 2012, 16, 1400–1411. (In Chinese) [Google Scholar] [CrossRef]
- Hinson, A.L.; Feagin, R.A.; Eriksson, M.; Najjar, R.G.; Herrmann, M.; Bianchi, T.S.; Kemp, M.; Hutchings, J.A.; Crooks, S.; Boutton, T. The spatial distribution of soil organic carbon in tidal wetland soils of the continental United States. Glob. Chang. Biol. 2017, 23, 5468–5480. [Google Scholar] [CrossRef] [PubMed]
- Yu, D.S.; Shi, X.Z.; Wang, H.J.; Sun, W.X.; Chen, J.M.; Liu, Q.H.; Zhao, Y.C. Regional patterns of soil organic carbon stocks in China. J. Environ. Manag. 2007, 85, 680–689. [Google Scholar] [CrossRef] [PubMed]
- Li, C.; Zhang, C.; Luo, G.; Chen, X.; Maisupova, B.; Madaminov, A.A.; Han, Q.; Djenbaev, B.M. Carbon stock and its responses to climate change in Central Asia. Glob. Chang. Biol. 2015, 21, 1951–1967. [Google Scholar] [CrossRef] [PubMed]
- Sharp, R.; Tallis, H.T.; Ricketts, T.; Guerry, A.D.; Wood, S.A.; Chaplin-Kramer, R.; Nelson, E.; Ennaanay, D.; Wolny, S. InVEST +VERSION+ User’s Guide; The Natural Capital Project; Stanford University: Stanford, CA, USA; University of Minnesota: Minneapolis, MN, USA; The Nature Conservancy: Arlington, VA, USA; World Wildlife Fund: Gland, Switzerland, 2015. [Google Scholar]
- Sil, Â.; Fonseca, F.; Gonçalves, J.; Honrado, J.; Marta-Pedroso, C.; Alonso, J.; Ramos, M.; Azevedo, J.C. Analysing carbon sequestration and storage dynamics in a changing mountain landscape in Portugal: Insights for management and planning. Int. J. Biodivers. Sci. Ecosyst. Serv. Manag. 2017, 13, 82–104. [Google Scholar] [CrossRef]
- Nelson, E.; Mendoza, G.; Regetz, J.; Polasky, S.; Tallis, H.; Cameron, D.; Chan, K.M.; Daily, G.C.; Goldstein, J.; Kareiva, P.M.; et al. Modeling multiple ecosystem services, biodiversity conservation, commodity production, and tradeoffs at landscape scales. Front. Ecol. Environ. 2009, 7, 4–11. [Google Scholar] [CrossRef] [Green Version]
- O’Rourke, S.M.; Angers, D.A.; Holden, N.M.; McBratney, A.B. Soil organic carbon across scales. Glob. Chang. Biol. 2015, 21, 3561–3574. [Google Scholar] [CrossRef] [PubMed]
- Chuai, X.; Huang, X.; Wang, W.; Wu, C.; Zhao, R. Spatial simulation of land use based on terrestrial ecosystem carbon storage in coastal Jiangsu, China. Sci. Rep. 2015, 4, 5667. [Google Scholar] [CrossRef] [PubMed]
- Pendleton, L.; Donato, D.C.; Murray, B.C.; Crooks, S.; Jenkins, W.A.; Sifleet, S.; Craft, C.; Fourqurean, J.W.; Kauffman, J.B.; Marbà, N.; et al. Estimating global “Blue Carbon” emissions from conversion and degradation of vegetated coastal ecosystems. PLoS ONE 2012, 7, e43542. [Google Scholar] [CrossRef] [PubMed] [Green Version]
- Liu, H.; Ren, H.; Hui, D.; Wang, W.; Liao, B.; Cao, Q. Carbon stocks and potential carbon storage in the mangrove forests of China. J. Environ. Manag. 2014, 133, 86–93. [Google Scholar] [CrossRef] [PubMed]
- Xu, C.; Pu, L.; Zhu, M.; Li, J.; Chen, X.; Wang, X.; Xie, X. Ecological security and ecosystem services in response to land use change in the coastal area of Jiangsu, China. Sustainability 2016, 8, 816. [Google Scholar] [CrossRef]
- Li, C.; Zhao, J.; Thinh, N.X.; Xi, Y. Assessment of the effects of urban expansion on terrestrial carbon storage: A case study in Xuzhou City, China. Sustainability 2018, 10, 647. [Google Scholar] [CrossRef]
Figure 1.
Land reclamation in coastal provinces of mainland China.

Figure 2.
Landscape transformation from coastal wetlands in the reclamation area (1990–2015). The legends in this figure represent landscape transformations from natural wetlands (NW) and artificial wetlands (AW) to other landscape types in coastal areas.
Figure 2.
Landscape transformation from coastal wetlands in the reclamation area (1990–2015). The legends in this figure represent landscape transformations from natural wetlands (NW) and artificial wetlands (AW) to other landscape types in coastal areas.

Figure 3.
Spatial distribution of carbon storage changes in coastal wetlands under reclamation (1990–2015).
Figure 3.
Spatial distribution of carbon storage changes in coastal wetlands under reclamation (1990–2015).


Table 1.
Carbon densities of different land use types in three coastal zones.
| Landscape Patterns | Zones | Aboveground Biomass (Mg/ha) | Soil Organic Carbon (Mg/ha) |
|---|---|---|---|
| Arable land (AL) | N | 5.7 * | 30.6 |
| M | 5.4 | 86.7 | |
| S | 3.4 | 25.2 | |
| Forest land (FL) | N | 26.5 * | 73.7 |
| M | 26.5 | 113.0 | |
| S | 26.5 * | 30.9 | |
| Grassland (GL) | N | 3.4 * | 37.4 |
| M | 3.4 * | 99.2 | |
| S | 3.4 * | 31.3 | |
| Built-up land (BL) | N | 4.8 * | 50.7 |
| M | 4.8 | 81.0 | |
| S | 4.8 * | 23.3 | |
| Natural wetland (NW) | N | 2.7 | 77.2 |
| M | 17.8 | 89.4 | |
| S | 112.8 | 164.3 | |
| Artificial wetland (AW) | N | 0 | 12.2 |
| M | 0 | 12.2 * | |
| S | 0 | 12.2 * | |
| Unused land (UL) | N | 0 | 19.8 |
| M | 0 | 51.0 | |
| S | 0 | 33.4 |
Note: N stands for northern coastal zone, M is middle coastal zone, and S is southern coastal zone, * represents using the average value due to the lack of enough local values. The literatures used in the table are provided in the Supplementary Materials. Most of these papers are published in Chinese journals and thus are not easily accessible.
Table 2.
Landscape transformation matrix from coastal wetlands in the reclamation area between 1995–2010 (hundred million ha).
Table 2.
Landscape transformation matrix from coastal wetlands in the reclamation area between 1995–2010 (hundred million ha).
| AL | FL | GL | BL | UL | NW | AW | |
|---|---|---|---|---|---|---|---|
| NW | 3.34 | 0.05 | 0.05 | 4.22 | 5.64 | 4.43 | 16.37 |
| 9.79% | 0.15% | 0.15% | 12.38% | 16.54% | 12.99% | 48.01% | |
| AW | 0.21 | 0.01 | 0.04 | 0.35 | 0.30 | 0.22 | 3.41 |
| 4.63% | 0.22% | 0.88% | 7.71% | 6.61% | 4.85% | 75.11% |
Table 3.
Carbon storage change due to landscape transformation in coastal wetlands.
| Landscape Transformation | Carbon Storage Change (Tg) | Total | ||
|---|---|---|---|---|
| Northern | Central | Southern | ||
| NW-AL | −0.04 | −0.48 | −0.18 | −0.7 |
| NW-FL | 0 | 0.01 | −0.03 | −0.02 |
| NW-GL | −0.00 | 0 | −0.01 | −0.01 |
| NW-CL | −0.45 | −0.45 | −0.78 | −1.68 |
| NW-AW | −5.22 | −7.37 | −2.4 | −14.99 |
| NW-UL | −1.49 | −1.59 | −0.83 | −3.91 |
| AW-AL | 0.01 | 0.15 | 0 | 0.16 |
| AW-FL | 0 | 0 | 0 | 0 |
| AW-GL | 0 | 0.04 | 0 | 0.04 |
| AW-CL | 0.04 | 0.12 | 0.01 | 0.17 |
| AW-NW | 0.12 | 0.05 | 0 | 0.17 |
| AW-UL | 0.01 | 0.02 | 0.03 | 0.06 |
| Total | −7.02 | −9.49 | −4.18 | −20.69 |
Note: “−” represents a decrease of carbon storage, “+” represents an increase of carbon storage.
© 2018 by the authors. Licensee MDPI, Basel, Switzerland. This article is an open access article distributed under the terms and conditions of the Creative Commons Attribution (CC BY) license (http://creativecommons.org/licenses/by/4.0/).
Share and Cite
MDPI and ACS Style
Li, Y.; Qiu, J.; Li, Z.; Li, Y. Assessment of Blue Carbon Storage Loss in Coastal Wetlands under Rapid Reclamation. Sustainability 2018, 10, 2818. https://doi.org/10.3390/su10082818
AMA Style
Li Y, Qiu J, Li Z, Li Y. Assessment of Blue Carbon Storage Loss in Coastal Wetlands under Rapid Reclamation. Sustainability. 2018; 10(8):2818. https://doi.org/10.3390/su10082818
Chicago/Turabian StyleLi, Yi, Jianhui Qiu, Zheng Li, and Yangfan Li. 2018. "Assessment of Blue Carbon Storage Loss in Coastal Wetlands under Rapid Reclamation" Sustainability 10, no. 8: 2818. https://doi.org/10.3390/su10082818
Note that from the first issue of 2016, this journal uses article numbers instead of page numbers. See further details here.