A Methodological Approach to Using Geodesign in Transmission Line Projects


1
Red Eléctrica de España (REE), Calle Anabel Segura 11, Edificio Albatros B, 4ª Planta, Alcobendas, Madrid 28108, Spain
2
ETSI en Topografía, Geodesia y Cartografía, Universidad Politécnica de Madrid, Calle Mercator 2, Madrid 28031, Spain
*
Author to whom correspondence should be addressed.
Sustainability 2018, 10(8), 2757; https://doi.org/10.3390/su10082757
Submission received: 16 July 2018
/
Revised: 31 July 2018
/
Accepted: 2 August 2018
/
Published: 4 August 2018
Abstract
:Numerous constraints affect the design of long linear infrastructures such as high-voltage transmission lines (HVTL): terrain slope, distances to urban centers or protected areas, stakeholders, administration, etc. These constraints must be studied as a whole to make the most appropriate decisions. In HVTL project development, a large volume of geodata is generated and analyzed in the project lifecycle. Each geodata scale is associated with a phase of the project and scale transitions correspond to changes in involved technical teams. Geodesign provides design frameworks and supporting technologies, so that professionals can share data and find designs suitable to the sustainability characteristics of each territory. This article proposes a geodesign workflow for developing HVTL projects, supported by methodologies and by automated model executions that guarantee the traceability of its development through the lifecycle stages. The aim is to minimize environmental, social, and local impacts, while providing stakeholders with tools for planning and decision-making. The workflow helps to integrate the geodesign’s principles, harmonizing corporate procedures throughout the project phases, taking into consideration constraints notified by stakeholders, through a design process guided by feedback-iteration- consensus mechanisms. As a result, it produces a transparent, visible, and improved participative workflow for developing new electric infrastructures.

1. Introduction
Modern societies rely on the supply of electric power as it, “plays a prominent role in maintaining the standard of living” [1]. As electricity is the engine of growth for any developing country, it is, in fact, impossible to sustain any sort of significant economic activity without an adequate and reliable power supply. The role of the electric power industry is key, as it helps make other economic sectors more competitive and meets the specific challenges posed by supply, provision of services, and production, which are important sectors themselves. Electric power is generally considered dynamizing factor for the entire economy and its infrastructures, and it is therefore assumed that its growth should be unimpeded [2]. To this end, and with these premises in mind, the inalienable objective of governmental energy policies should be to ensure that power is supplied in optimal conditions as far as safety, quality, and price.
Red Eléctrica de España (REE) [3], founded in the application of Law 49/1984 on 26 December 1985, was the first company in the world dedicated exclusively to transporting electric power and operating the electrical system.
As the company that manages Spain’s transmission network, REE is in charge of developing and expanding the network, applying homogenous and consistent criteria in maintaining the network in order to ensure the necessary reliability and availability. In Spain, this electric power transmission network is composed of over 42,000 km of high-voltage transmission lines that make up a reliable and safe lattice network, offering the electric system optimum quality and service.
There are many constraints that can impact design when constructing long linear infrastructures such as a new high-voltage transmission line (HVTL) spanning hundreds of kilometers. From the point of view of the various stakeholders involved, these constraints do not necessarily coincide; nevertheless, it is imperative to analyze them in their entirety throughout the project in order to make relevant decisions. For example, a cork oak forest or an archeological site are not significant from the point of view of electric infrastructure, but they are of great environmental value and cultural interest, respectively. Until now, it had not been possible to present the points of view of the various stakeholders involved in this type of project, simultaneously. Neither the governments nor the companies/organizations that plan and execute electric transmission infrastructures have access to the tools necessary to address the needs, restrictions, limitations, and wishes of every interest profile or stakeholder. By using planning support systems (PSS) and decision support systems (DSS), it is possible to reorient these projects in order to create a new methodology. This enables making decisions based on the actual conditions found on-site, so new projects are more solid and better organized, as well as more efficient and easier and quicker to track and manage. Our hypothesis is that representing and managing the various requirements of the stakeholders involved in this same context (geodesign), spontaneously creates a cooperative workflow that facilitates making decisions by consensus.
The transmission network is expanded through projects carried out for each new line, and, considering the progress made in the international business, this expansion should be based on corporately determined methodological approaches to managing the traceability of geospatial data for each project. Designing, proposing, and implementing a geodesign workflow for developing HVTL projects to help manage REE’s projected assets and service geographically, both in Spain and abroad.
“The essence of the GeoDesign concept is not new: it is present implicitly in the organic architecture of Frank Lloyd Wright (1867–1959)” [4]. “Whereas traditional planning and design processes separate context analysis, design, and evaluation into explicit steps, GeoDesign integrates the exploration of ideas with direct evaluation in the same moment, generating an advanced design solution” [5]. Geodesign “is design with the territory and for the territory and it aims at contextualized transformation of the landscape, respecting natural and cultural conditions” [6]. Steinitz [7,8] developed an experimental approach to landscape planning based on simulation modeling methods. This concept is gaining interest internationally thanks to the potential offered by the use geospatial technologies (methods and tools in “Science and Technology of Geospatial Information”) [9]. With this in mind, geodesign offers an efficient framework for defining regional and urban planning methodology, with the aim of sustainably integrating human activity with the environment, bearing cultural idiosyncrasies in mind and facilitating consensual decision-making.
Among the activities carried out by REE in exercising its responsibilities, we have chosen to focus on the power transmission grid, as in these long linear infrastructure projects it is necessary to seek a balance between transforming the affected territory and preserving the environmental, social, and cultural characteristics of the area. The projects consist of a succession of phases that progress in line with the flow of geospatial information (GI), with the geographical context of a given phase defined by the result of the previous phase, resulting increasingly detailed GI as the work scale increases [10]. The data models and formats of the results for each phase are known and well defined. Nevertheless, the procedure used to calculate each result depends on the personal criteria and know-how of the technician in charge. This results in a lack of homogeneity as far as the criteria used to analyze situations and make decisions, which is necessary in order to attain homogenous results throughout the corporation.
This led us to pose two research questions:
RQ1: Is it possible to implement a geodesign methodology based on an HVTL project workflow and integrate it in GeoRED (REE corporate GIS) as a PSS tool?
RQ2: Is it possible to harmonize treatment of GI in HVTL projects and integrate the GI life cycle into the geodesign workflow?
Each electrical transmission line project planned by REE and approved by the Council of Ministers is carried out following a lifecycle composed of five key phases: 1) Planning → 2) Study of Alternatives→ 3) Engineering Project Definition→ 4) Obtaining Permits → 5) Construction.
This project lifecycle synchronizes different types of information, such as: needs analyses and related technical documents, viability studies, documents for administrative processing, electrical and mechanical calculations for the line and its phase, analyses of the impacts on the territory and its inhabitants, and geospatial data to help explain the project in each of its phases. The geodesign processes proposed in the present article are based on the use of geographic data.
There are two facts worth noting that characterize the transitions between consecutive phases: the result of each phase delimits the geographic scope of the next phase, and the GI work scale grows as we progress from one phase in the model to the next.
Two fundamental types of interactions have been identified in the project lifecycle: the first occurs within each phase, with interactions between the various work teams, who represent all the stakeholders through the constraints previously noted and who are associated with the type of information used in that phase and with its corresponding scale; the second interaction is between the teams responsible for each phase. The geodesign workflow proposed for developing HVTL projects is mainly concerned with these two interactions.
Thus, the geoprocessing models support the first of these interactions, the results of which will serve as the basis for decision-making during each phase. The second interaction is based on the feedback–iteration–consensus triad, as is inevitable in any geodesign workflow. Since the result of each phase delimits and defines the scope of study of the following phase, this triad (feedback–iteration–consensus) appears spontaneously due to the adjustments necessary in order to adapt the results to each phase.
Given that, as a company, REE is in charge of expanding the national power transmission infrastructure, before carrying out any sort of analysis of the territory, it defines the specifications for any new HVTL infrastructure. All this in accordance with the established infrastructure requirements that define, or indirectly impose, the area to be studied. The present research applies a geodesign workflow for HVTL that is constrained by the need to minimize the impact on the environment, populated areas, and socioeconomic characteristics of the region and find the most cost-effective technical solution for building and maintaining the infrastructure.
To summarize, this paper makes the following original contributions:
- Proposing a methodological approach to using a geodesign workflow for HVTL projects.
- Presenting a corporate standardization of geospatial information in HVTL project design that facilitates the traceability of GI in each project.
- Consolidating the concept of geodesign in REE for projects with a strong territorial component.
- Progressively implementing and consolidating collaborative and PSS tools in the GeoRED corporate GIS.
The following sections of the paper focus, on the one hand, on the background and works related to the concept of geodesign—evincing the fact that technological development has favored the consolidation of geodata as a tool for territorial organization—and, on the other hand, on the methodologically outlined in the proposal for this research project, which focuses in detail on the particularities of each phase of REE’s new HVTL projects. By automating the various processes, the proposed geodesign workflow applies the GI workflow to an HVTL project from its governmental approval to its construction. This second part is composed of three chapters: the methodological approach that describes the proposed workflow; the workflow implementation with an explanation of how the workflow was implemented and discussed, and finally, the conclusions of the paper.
2. Background and Related Works
The introduction presents an approach to the concept of geodesign based on the contributions and clarifications proposed with regards to the concept by various authors over time [4,5,6,8,9].
As far back as 1969, Steinitz and Rogers [11] managed to synthesize the approaches of four specialties—landscape architecture, engineering, urban planning, and regional and urban design— into a coherent planning model. Although the planning and the set of tools to help implement it (PSS—planning support systems), adopting the best spatial decisions (DSS—decision support systems), and getting more groups to participate in decision-making (public participatory support systems) have been used and are mentioned in the literature.
From the “PSS” perspective, authors such as Harris [12], Vonk et al. [13], Kumar et al. [2], and Geertman and Stillwell [14] have analyzed the various methodologies used in computerized spatial and landscape planning, and presented the barriers to its widespread use. Steinitz [15], Abukhater and Walker [16] emphasize the need for geoscientists and design professionals to collaborate and work together: designing. They also further explored the concept of “planning with people and not just for people”, in all its various nuances. Aditya [17] defines the collaboration concept as a participatory geographic information system that can be used to make decisions. For authors such as Hanzl [18] and Kubicek [19], PSS is a general concept that describes software that supports urban planning, and they stress that PPGIS tools allow groups that could not participate in planning before the chance to do so thanks to the use of software and plugins that do not require costly licenses. Along this line, the evolution of desktop GIS—with costly licenses that, for this reason, may even be considered elitist [20]—towards web environments with map viewers both in two dimensions (2D) and in 3D, or Web-GIS analysis tools, etc. make it easier for people who are not specialized in the field, such as lawyers, politicians or citizens in general, to interpret planning [18].
This has coincided in time with a change of paradigm in planning processes motivated by society itself; whereas planning was once carried out by professionals with an inflexible structure, it is now a process of collective negotiation [21]. This change has resulted in the need to integrate new planning tools that facilitate communication and the sharing of information, guidelines, and ideas that intervene in these processes. All of this, without claiming to be exhaustive, constitutes part of the foundations of geodesign. Simultaneously, in the field of geoscience there is a bifurcation of the discipline of geovisualization and visual analytics that, together with DSS, defines the sub-discipline known as geovisual analytics for spatial decision support [22]. However, the field of geovisualization is not only related to planning, it is also a useful tool to help groups that are less specialized in planning to participate in decision-making.
Geovisualization thus converges with the concept of geodesign, which is materialized in advanced computer applications that provide support for more advanced planning and require the exhaustive collaboration of stakeholders. From this point of view, some authors, such as Flaxman [23], define geovisualization as a series of technologies and techniques that can be used to plan natural and built environments as part of a comprehensive process that includes conceptualization, analysis, design specification, stakeholder participation and collaboration, design creation, simulation and evaluation (among other stages); Dangermond [24] synthesized this by affirming that geovisualization makes it possible to include geographic analysis in the design process, supporting the vision expounded by McHarg [25], who defines the fields of landscape architecture, urban and spatial planning, and ecodesign, providing professionals involved in design with methodologies that help to exploit GI within their design workflows, thanks to the growth in GIS technologies. Complementing the DSS perspective, geodesign can be understood in a broader or stricter sense. In the first case, geodesign is conceived as a process for generating solutions to geospatial problems that, at various stages of the process, includes activities associated with design and decision-making. In a stricter sense, geodesign is specifically focused on the design stage, including creative design tasks (such as drawing), and on their corresponding methods and technologies for obtaining feedback to enable quick iterations and modifications in the design. A similar approach was taken by Flaxman [23]: “GeoDesign is a design and planning method which tightly couples the creation of design proposals with impact simulations informed by geographic contexts”, and by Ervin [26], for whom geodesign applies modern technologies that facilitate information, communication, and collaboration in order to enhance conventional environmental planning and design activities, offering impact analysis and simulations on demand in order to provide a more responsible and effectively integrating social values and scientific knowledge in the process of designing future alternative scenarios. However, when it comes to formalizing the role of geodesign Artz [27], Ball [28], and Dangermond [29], do not regard it simply as a theoretical concept but also as a practical method for measuring, modeling, interpreting, creating, and influencing decisions about activities such as agriculture, urban planning, and other disciplines.
With regards to geodesign models, Steinitz [15] proposed a (possibly visionary) generic framework, as an evolution of the concept of landscape design framework models developed in the book Alternative Futures for Changing Landscapes [30], for design projects that require iteration, feedback and collaboration. Steinitz’s framework is helpful in preparing studies that can be applied using different scales, ranging from the regional to the local, and introduces integrated collaboration as well as the participatory aspect. As a summary of this review of related works, and having identified paradigms, proposals, and models, the convergence and/or evolution of DSS, PSS, PGIS and PPGIS initiatives proposed by Steinitz [15] with regards to the concept of geodesign and the proposed methodology, or the geodesign framework, is also worth noting as a point of reference in this field.
Steinitz’s [15] methodology is based on a set of interrelated models, so that the design team takes a structured approach that is driven by decision-making and is different from typical design processes. In addition to this unique way of structuring the process before implementing it, after analyzing the geodesign process, it is evident that there are two more crucial components: digital technologies and collaborators.
Foster [31] compares the geodesign process with accepted design theories and proposes “creative problem-solving processes; design processes”. This work presents many similarities with five of the design processes studied [32,33,34,35,36,37]. However, for Foster [31] there is one vital difference that makes the geodesign process exceptional. This difference stems from the fact that the geodesign process is based on decision-making and carefully structured to facilitate its effective execution. Along with this unique structuring of the process before its implementation, an analysis of the geodesign process reveals two other essential components: collaboration and digital technologies.
There are increasingly more examples associated with regional, urban, and landscape planning. The geodesign framework proposed by Steinitz [15] was also applied in a lot of cases [4,38,39]. In one of these cases, the study looks at the results of a case in Brazil [4] in which the geodesign concept was applied early in the process in order to analyze the project’s capacity to balance urban transformation with the preservation of environmental features in the study area.
Although most examples of applied geodesign are associated with regional and urban planning, there are some studies of linear infrastructures that resemble our case. In it, we find some similarities as far as the consequences of building a new road or a new transmission line, due to changing conditions throughout the new infrastructure. Santini and Pecori [40] evaluate the positive and negative effects derived from implementing a tool for “expansion” or “new construction” of transportation infrastructures (in this case, roads) in an area. Their methodology provides in-depth information about the study area (including economic and environmental resources), confirming the varying degrees sensibility throughout the study area for the proposed linear infrastructure in response to a series of actions to be undertaken during the project in relation to the building of new roads, and assessing various location scenarios for the same kind of project or different potential impacts for the same location.
Given the scarce or non-existent documented history of applying geodesign environments to HVTL design, the present research proposes developing a new geodesign workflow based on the sequenced application of models such as the framework proposed by Steiniz [15], in which the GI workflow and traceability assumes a relevant role. The section that follows describes the methodological approach used to define the new geodesign workflow applied to HVTL projects.
3. Methodological Approach
Thanks to the relative maturity of the Information Society [41], there are many sources of digital data available for many regions of the planet, including geospatial regions. The Digital Earth concept introduced by Craglia et al. [42] is gradually becoming a reality, and there are both official and volunteer (for instance Openstreetmap.org) GI data available that can be analyzed or used to make decisions, specifically in geodesign and design processes.
Having previously established the GI workflows generated during the project phases of a new transmission line, these workflows are currently being implemented as a set of procedures to be followed in each new project. The company has implemented a corporate GIS (GeoRED) to facilitate management and storage of the all the GI. GeoRED was designed to meet the needs associated with stakeholder collaboration. The system is backed by GI that facilitates collaboration and understanding of geographic reality through the use of visual tools and maps as well as geoprocessing, creating a virtual meeting room that is accessible through the stakeholders’ offices, enabling the execution of iterative design cycles until participants reach a consensus [8]. GeoRED has the capacity to represent the requirements of the various stakeholders in a single environment. Thus, the virtual meeting room provides an alternative methodological approach to research on how to involve the various actors, from technical experts to local actors, in an open and participatory process. This participation facilitates transparency and visibility in the various decisions and responsibilities. Nevertheless, the platform design does not follow any particular geodesign workflow, nor does it follow homogenous procedures for each phase of the projects, and the procedures implemented depend on the criteria of the member of the technical staff in charge at each phase.
Considering that a new transmission line becomes one of the elements that structure “what is there” in the territory (along with natural features, transport links, buildings, etc.) and “what is happening” in the territory (how the territory behaves as far as its social, cultural, and economic activities), each phase incorporates the GI representing the constraints of the various groups and stakeholders involved, and it is necessary to use GI with increasingly more precise scales in the corresponding studies.
The proposal presented herein is based on applying different models, with homogenous procedures, in each of the phases described, which also provides a system for tracking the evolution of the HVTL project.
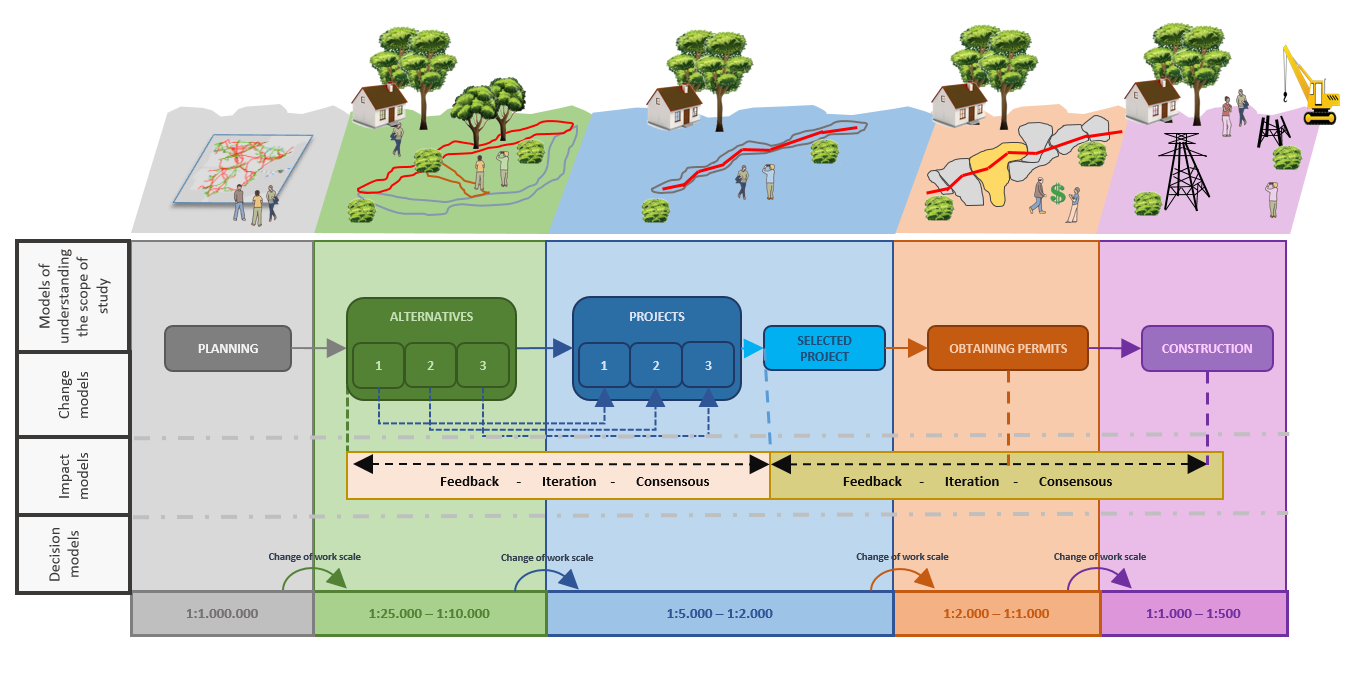
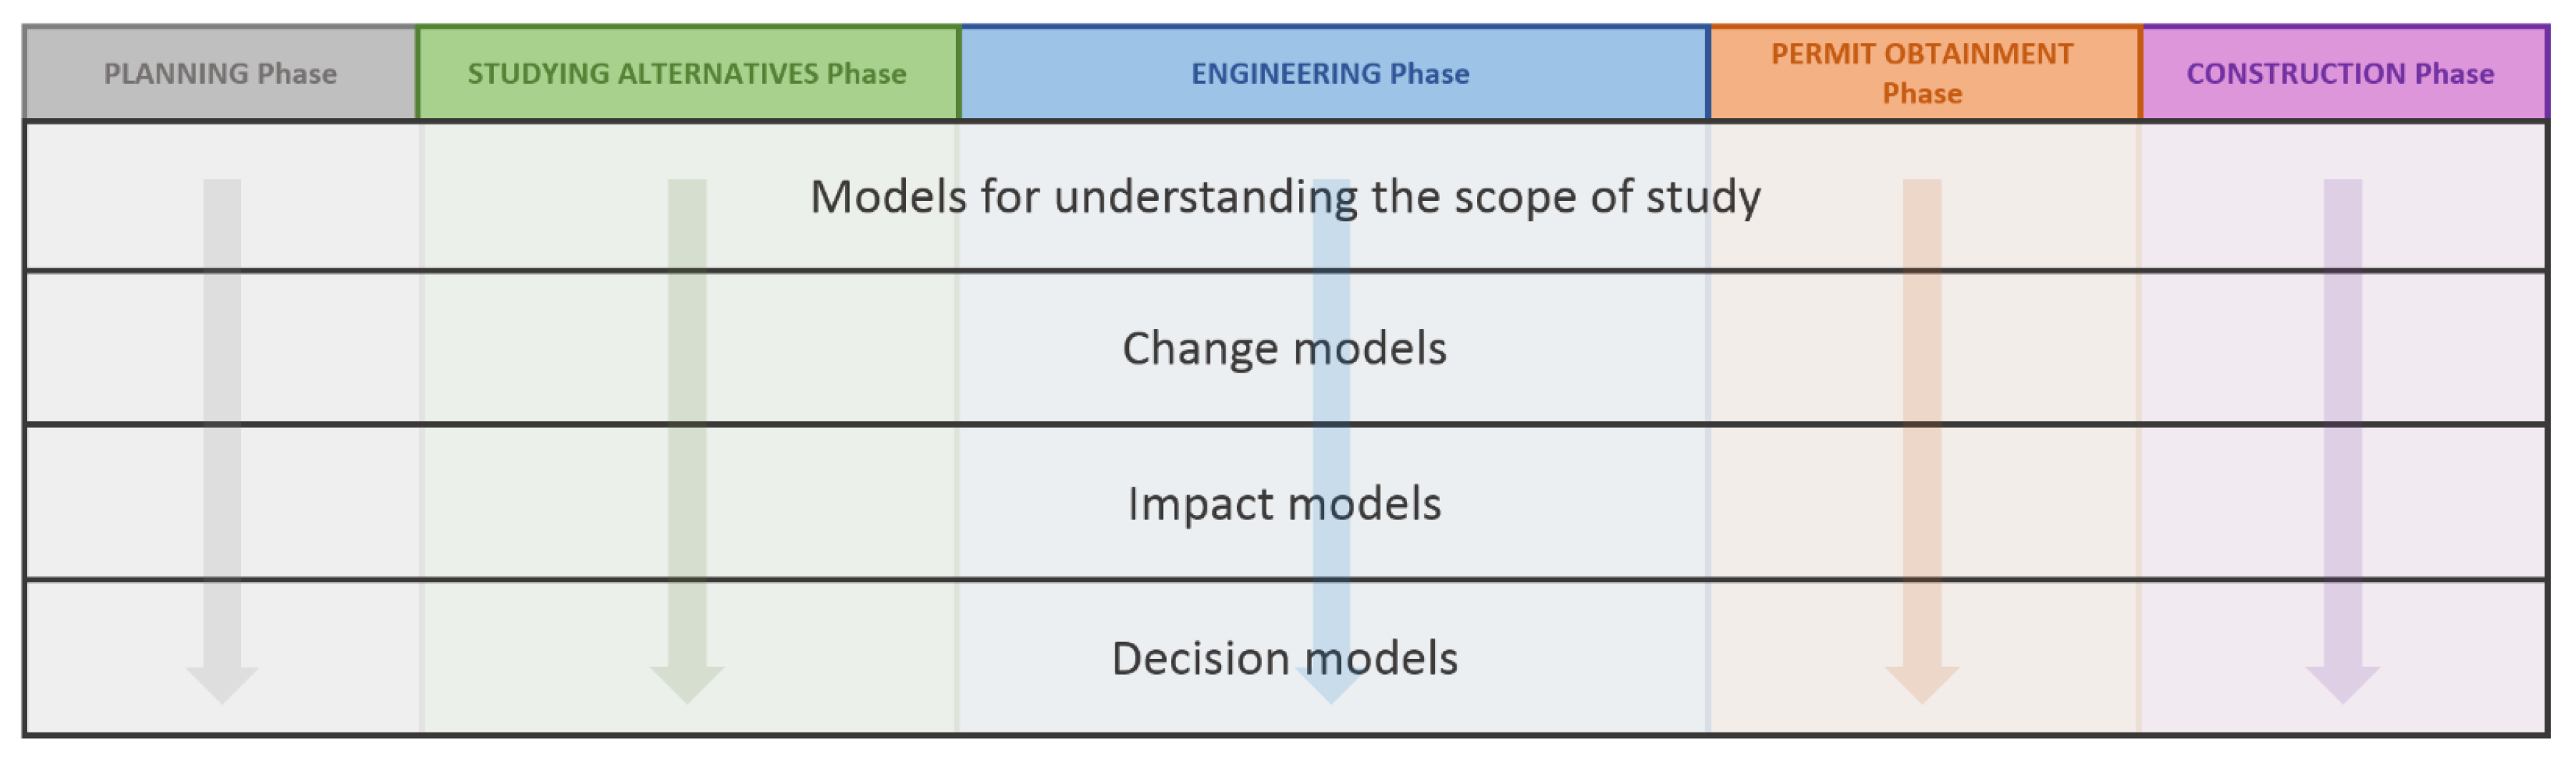
Within each phase, the new proposed models are dependent on the results of the previous models according to the GI workflow, as is also the case in the geodesign framework proposed by Steintz [15], though this framework does not define a strictly sequential order, since it allows for cycles and the back-loops between models, which, in fact, are very common in practice; if there data is missing or is insufficient to apply to a given model, then data acquisition becomes a priority activity. Or rather, if the processes cannot be modeled, specific work is carried out on some aspect of the HVTL project dynamics. Figure 1 indicates the kinds of models and the order of their application in each phase.
There are four types of models for all the phases. Figure 1 shows how the four types of models are applied transversally throughout the project and sequentially within each phase of the project.
The first type aim to explain the scope of the study in order to propose viable changes that establish the second type of models. The third type aim to evaluate the impacts that the changes proposed would have on the territory studied, and, lastly, the fourth type facilitates a decision that normally has a human component that is difficult to automate since, as is also true in the decision models proposed by Steintz [15], a decision is normally accompanied by a negotiation and final agreement.
Each project could be managed in multiple ways, nevertheless, considering the strong ties with the territory and the consequences of installing HVTLs, it seems appropriate to justify applying an HVTL geodesign workflow that supports corporate methodologies in a homogenous scenario with systematized tasks. An initial approach to the need for a geodesign workflow was carried out in 2012 [43] and in 2014 [44].
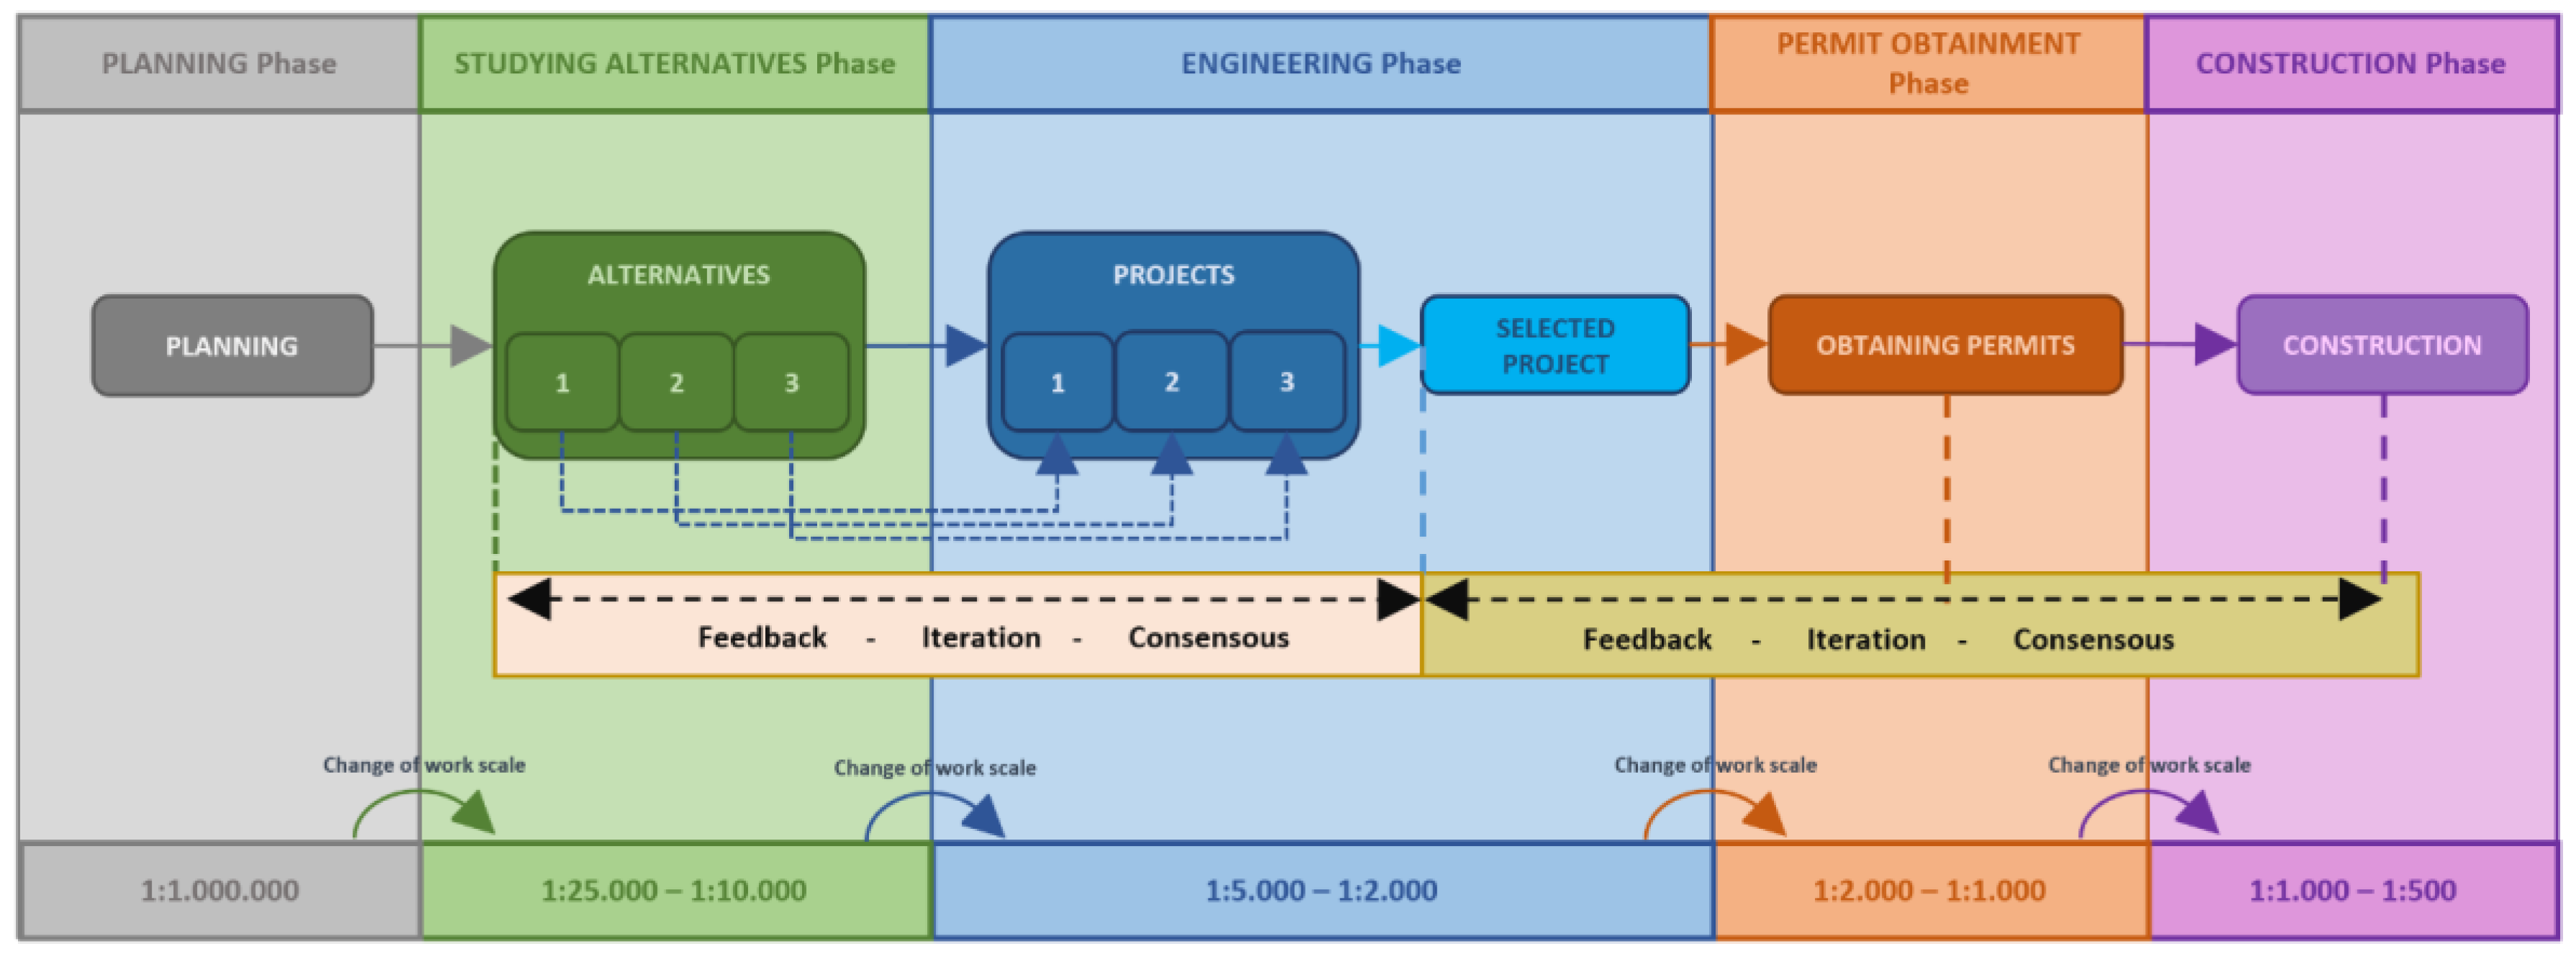
Foster [31] interprets the geodesign framework proposed by Steinitz [15] as a structure promoted by the people in charge of making decisions and carefully designed to facilitate its effective execution. With this objective, Figure 2 explains the flow of GI for the HVTL geodesign workflow proposed for REE, and the most common range of work scales in each phase of the project. In Spain, Law 21/2013, of 9 December 2013 [1], makes it obligatory to evaluate the environmental impact of at least three alternative projects, so the workflow manages at least three viable alternative corridors as a solution to accommodating the HVTL study project.
As in the model proposed in Steinitz’s A Framework for Geodesign [15], the work scale constrains the type of information used in the analysis for each phase. For an HVTL project, we inevitably move from smaller to larger scales, which means that GI becomes increasingly precise with each subsequent phase.
The HVTL geodesign workflow establishes the change of scale between the various phases. Thus, the scales used in the first few phases are much smaller than the ones used in the detail phases.
There are two different feedback–iteration–consensus processes. The first is between the studying alternatives and engineering phases. Once the alternative corridors have been defined, the engineering project is designed within these corridors. However, due to the existence of ‘micro’ environmental conditions (for example, protected species of flora), consensus must be reached with the other stakeholders involved in each case before consolidating the project. These conditions are detected when the GI work scale changes, since this substantially increases the quality of analysis. The second process occurs between the engineering, permit obtainment, and construction phases. During construction, the need may arise to make slight alterations in the project that must then be validated in the permit obtainment and engineering phases, for example displacing pylons within the alignment upon the affected plot owner’s request.
Each HVTL project is divided into five main phases, with the results of each phase used as input for the next phase: planning, study of alternatives, engineering project definition, obtaining permits, and construction. Considering the linear task workflow, each of the phases may be conceived as a different project, and each one may be associated with its discipline. Therefore, it is necessary to carry out a planning project in order to detect future power needs; a study of alternatives project obtaining at least three environmentally viable alternatives as a result; an engineering project for each of these environmental alternatives, one of which is ultimately be selected; a project for obtaining permits for the plots affected by the final project, and, lastly, a construction project.
The cartographical representation of the planning phase is an approximation. In the study of alternatives phase, the territory is analyzed using official cartographic sources that, at the level of territorial organization, already account for the territorial constraints that apply to the search for lower impact corridors. In the engineering phase, original GI is generated through classic topography, photogrammetry, or LiDAR flights, thus the GI describing the corridor with the lowest impact is truly rich in its level of detail. In the permit obtainment phase, two GI sources are combined: official Cadaster’s Online Site GI [45] and the GI resulting from the engineering phase. Finally, the construction phase relies on GI produced during the fieldwork carried out to rethink the project design.
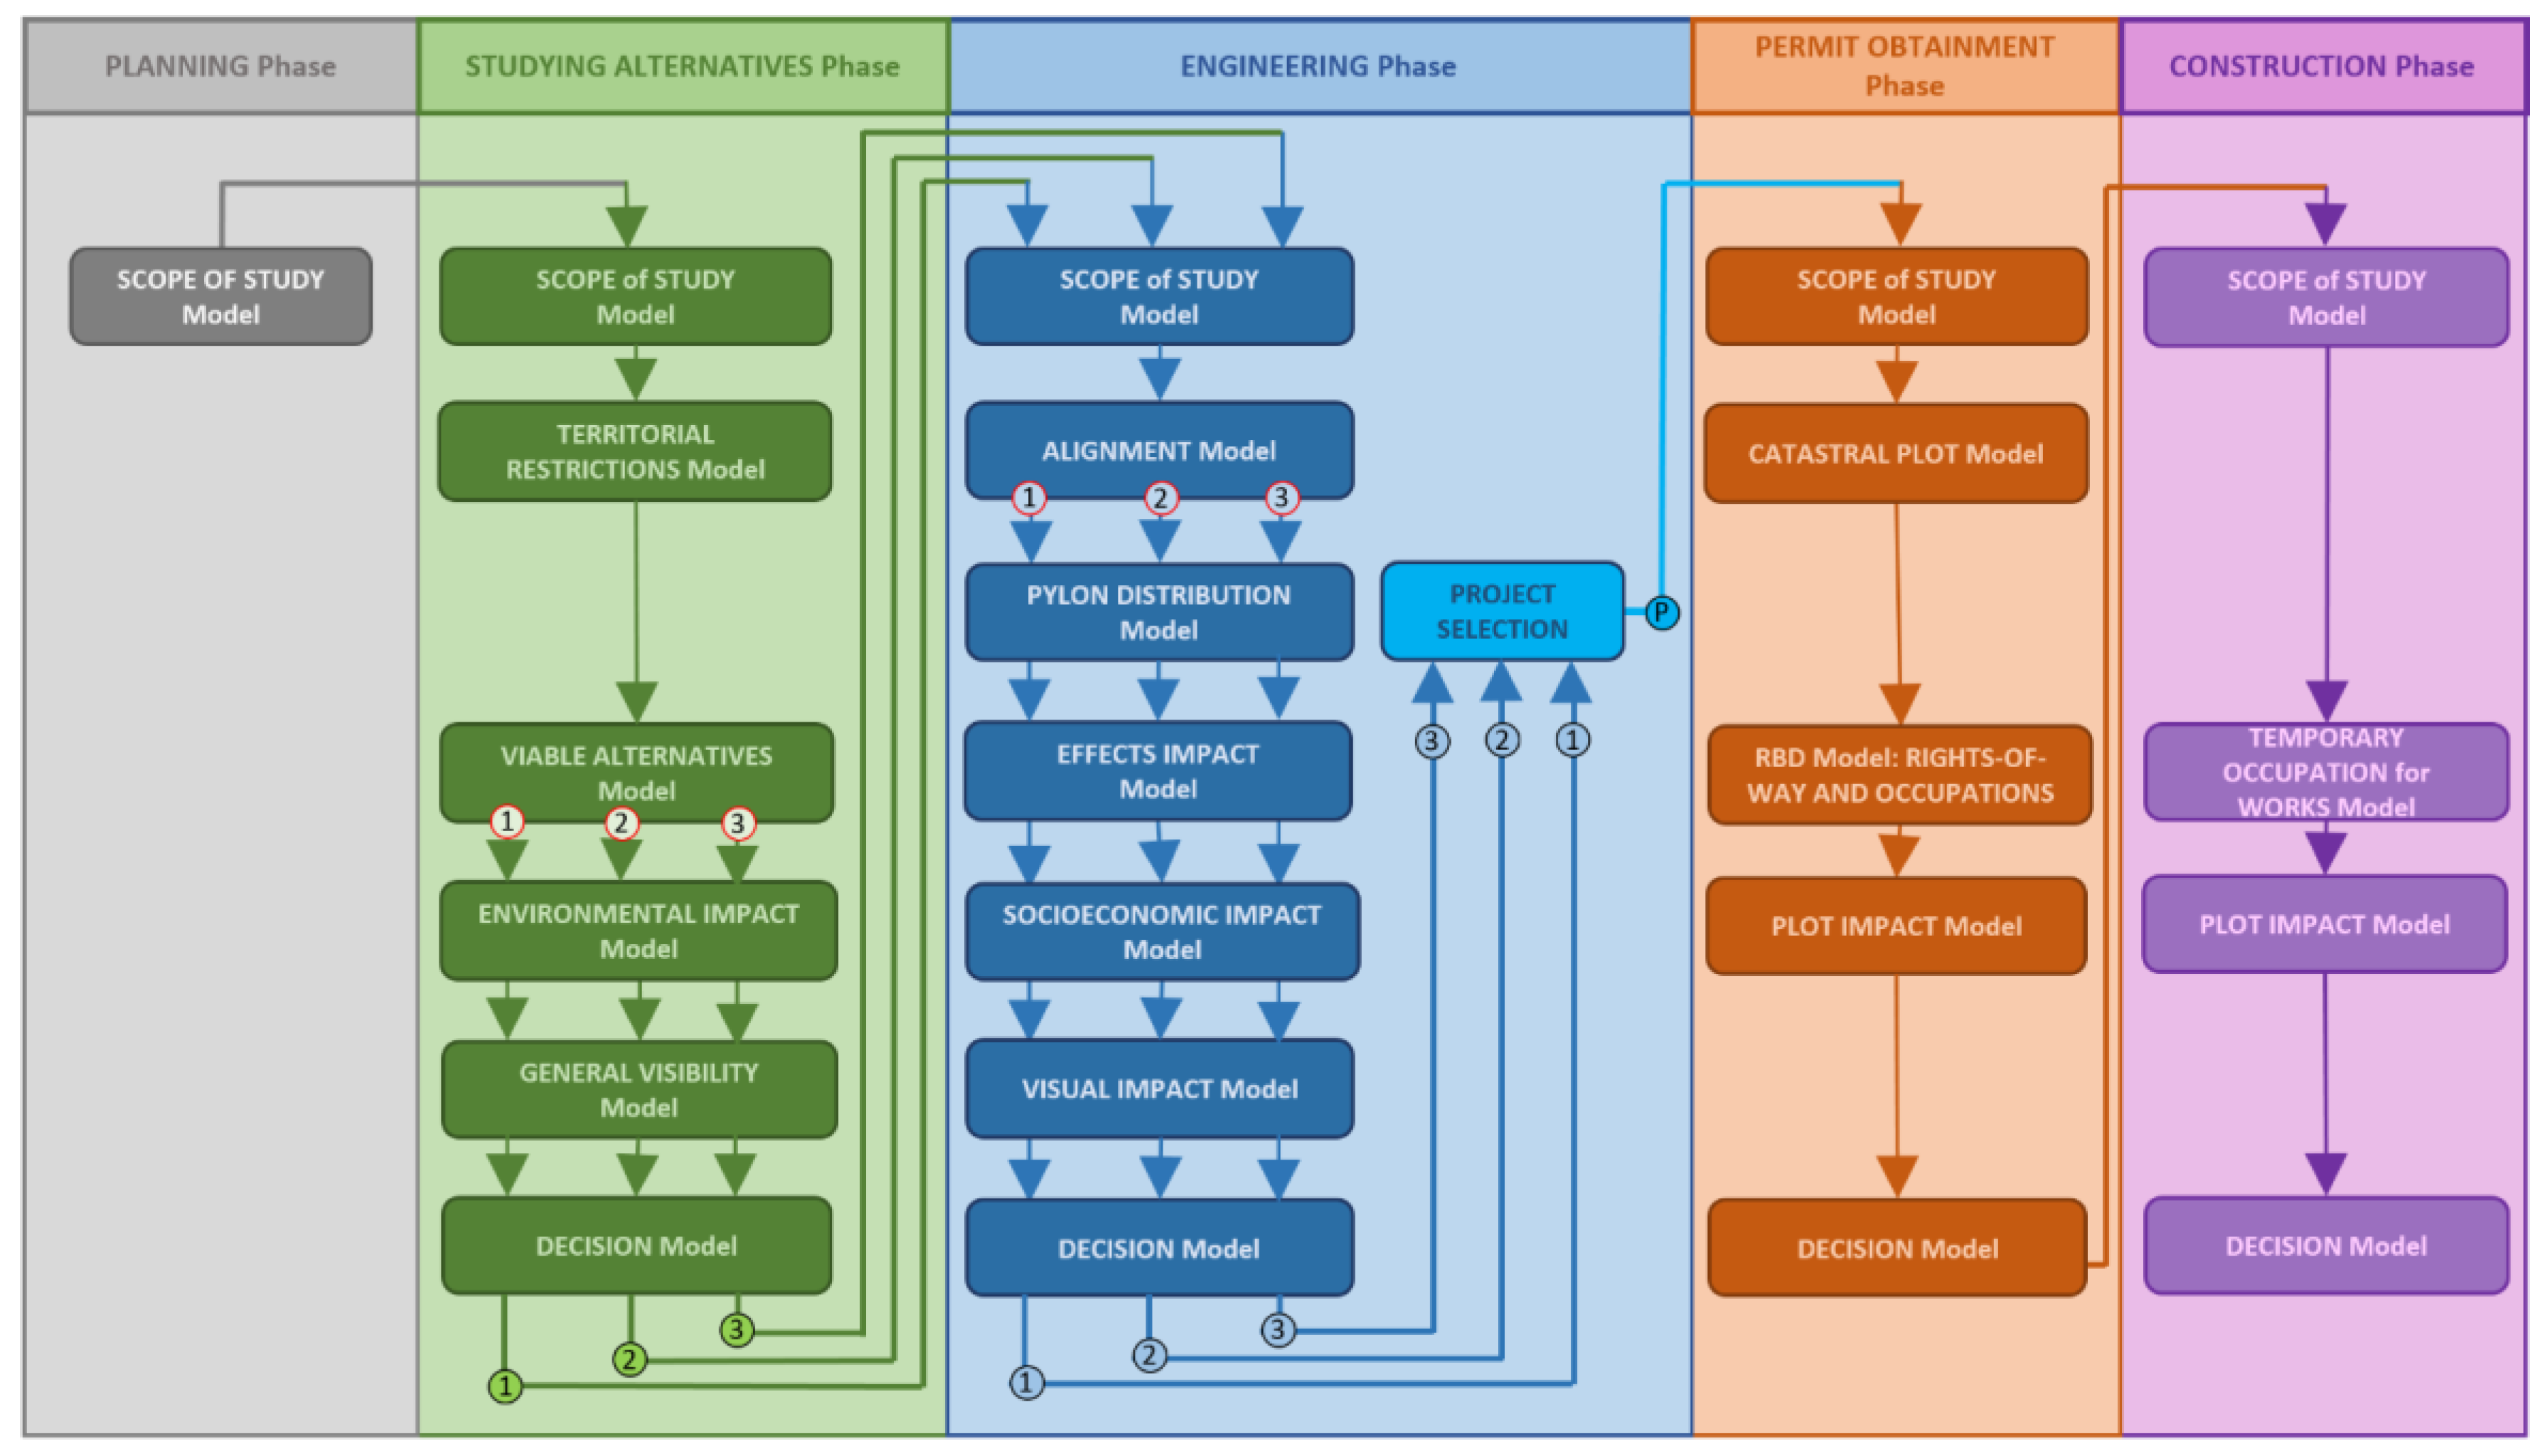
Each phase is analyzed sequentially, and the results of one phase become part of the next. In each phase, a set of models is sequenced that culminate in a final decision. For each phase, this sequence of models is correlated with the other phases, so that, for each project, it is possible to track the various project statuses through the GI that describes them.
Figure 3 offers a graphic detail of the methodological approach of the HVTL geodesign workflow for each phase and how the phases are sequenced.
Another objective is to manage the traceability of GI for the projects in order to analyze the current and previous statuses of each project so as to understand the specific decisions made in each phase.
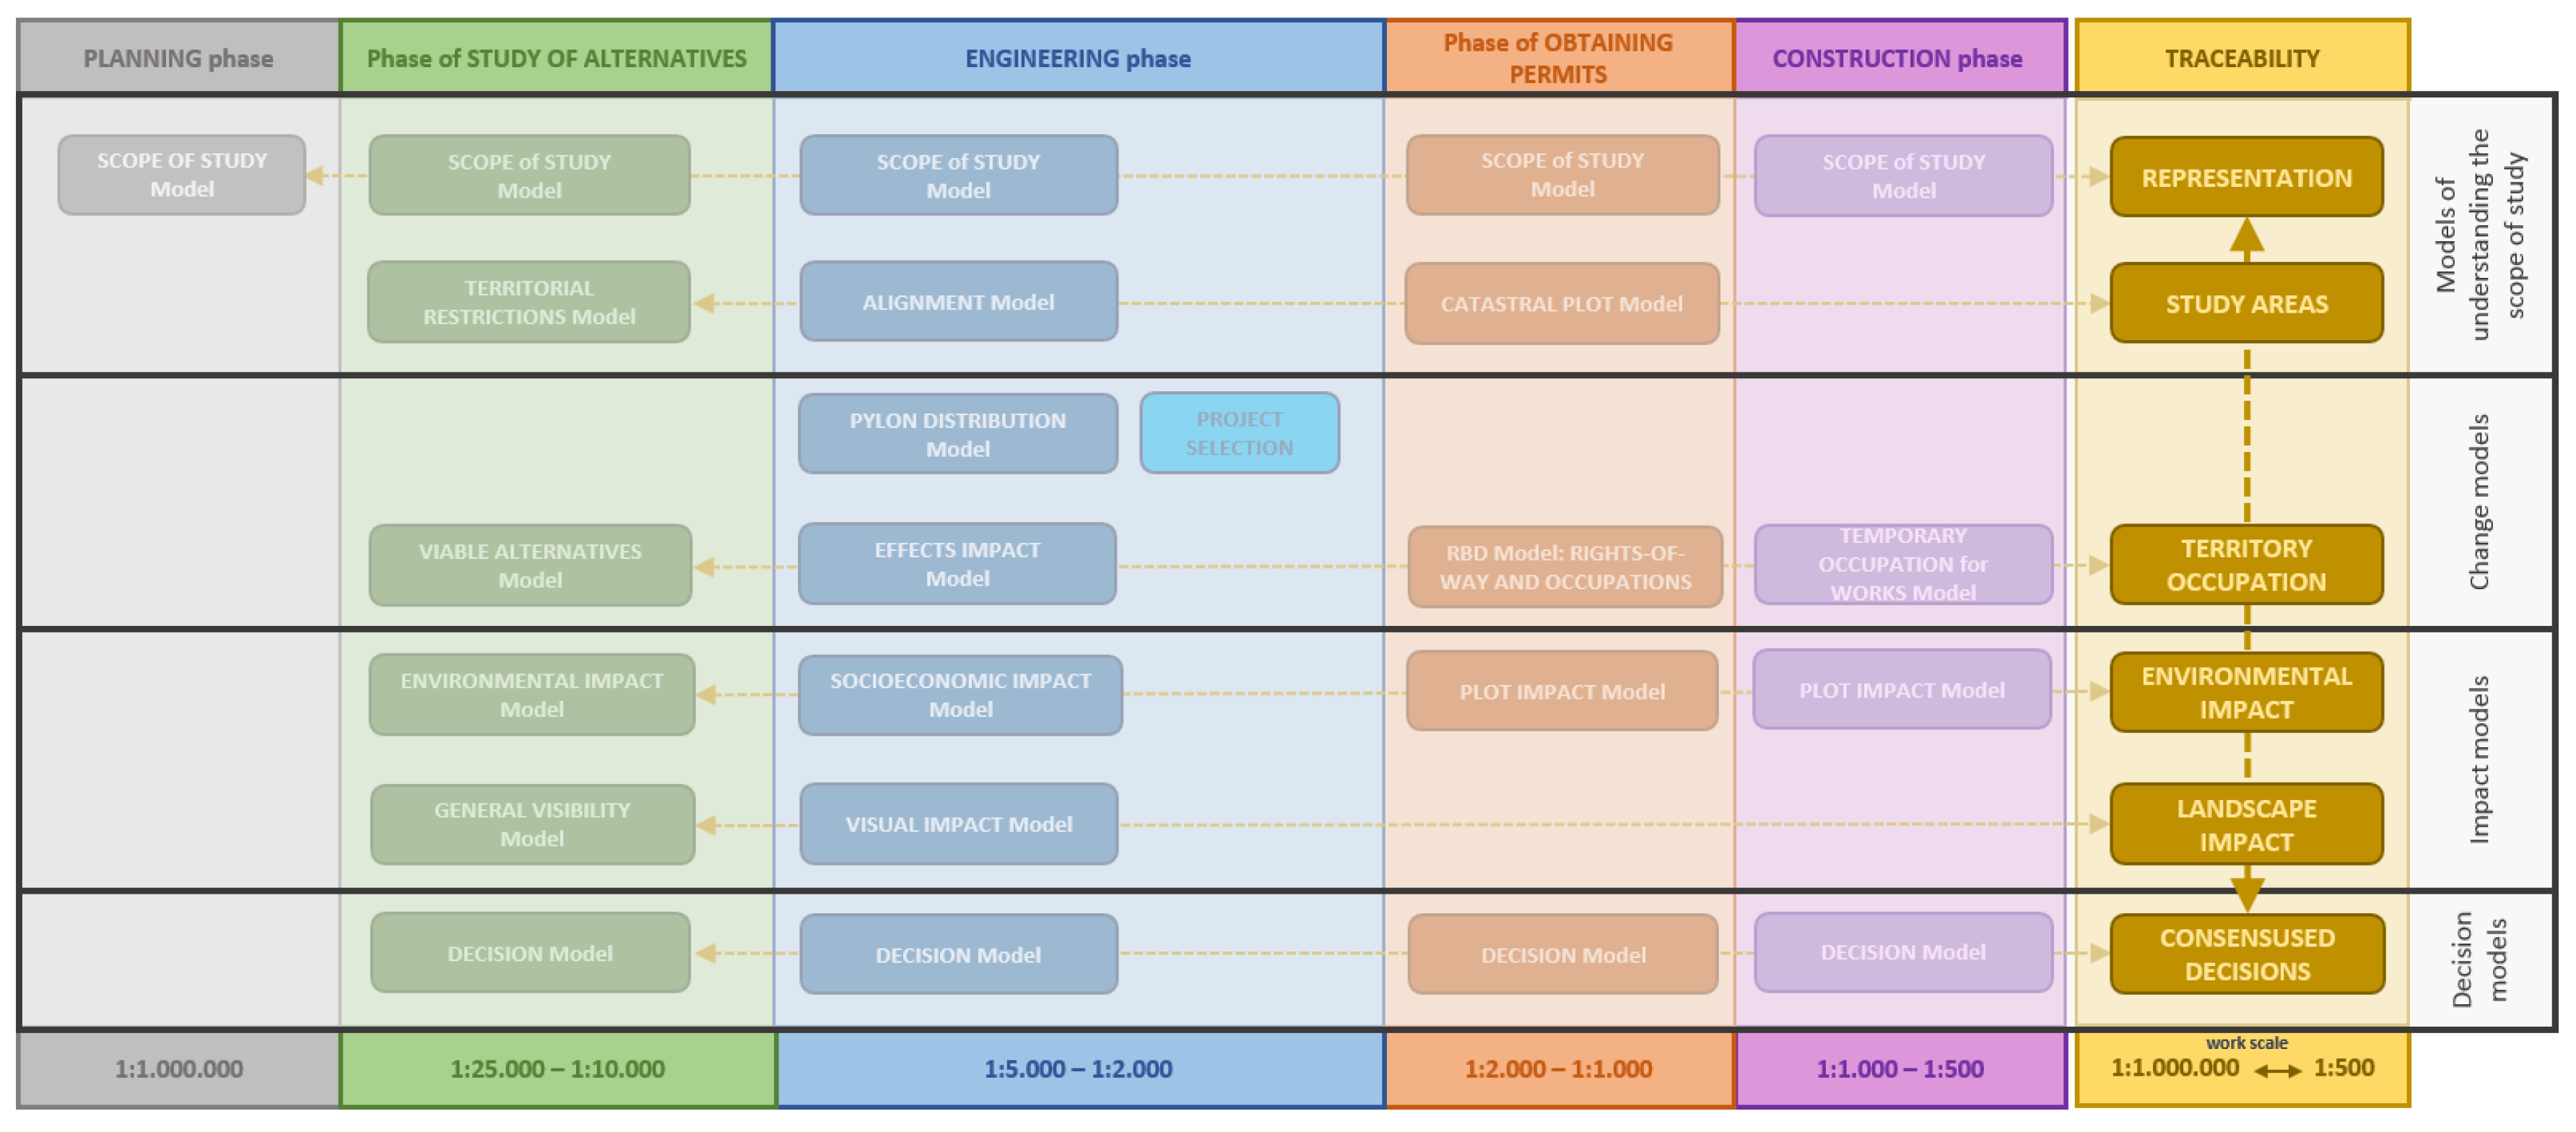
The traceability of the scope of study models shows how the work scales and detailed GI grow as the project progresses. The traceability of the study area models shows how the study areas are gradually defined and focused on increasingly concrete regions. Figure 4 shows how the models for each phase correlate to manage GI traceability, indicating the type of model for each of the models applied at each phase.
The traceability of the land occupation models (right-hand column in the table-figure) indicates how the new HVTL occupies the land in each phase. The traceability of the environmental impact models shows what the new HVTL means from the various points of view contemplated: including the perspective of the environment, in the study of alternatives; of the socio-economic context, in the engineering phase, and of the cadastral plots, in the permit obtainment and construction phases. The traceability of the landscape impact models shows how the visual area in the study of initial alternatives is concretized in the visibility of the pylons in the engineering phase, and, finally, we have the traceability of all the decisions reached in the process.
The next section outlines each of the five phases of the proposed methodological approach to designing HVTLs, specifying how the model defines the GI to be used and what GI is generated in each of the phases.
3.1. Planning Phase
The needs of the electric system—including reinforcing electric routes, supplying power to new locations, or expanding the layout of the transmission network (TN) itself to maintain supply quality—provide a plan for how the TN should evolve to be executed over the following years. Given this attribute, which has more to do with electricity than with the territory, in this phase, for each HVTL, the initial GI workflow serves only to indicate the future layout, with little precision. The work scale is therefore small, and given the TN maps generated by REE, is approximately 1:1,000,000. The scope of study model for this phase is based on the GI representing the voltage of the lines and their conditions (aerial, underground or underwater).
3.2. Studying Alternatives Phase
Once the power supply TN planning has been approved by the Council of Ministers, the main contribution to planning during this phase comes hand-in-hand with GI. This GI takes into account the constraints and restrictions that apply to the physical and biotic environments. A set of analyses is carried out resulting in at least three viable alternative corridors as a solution to accommodating the HVTL study project. In Spain, Law 21/2013, of 9 December 2013 [1], makes it obligatory to evaluate the environmental impact of at least three alternative projects.
During this phase, there is a qualitative leap in the level of detail of the GI, going from a scale of 1:1,000,000 to scales between 1:25,000 and 1:10,000, and the following models support this and help make decisions and justify solutions.
3.3. Engineering Phase
During this phase, a project is designed for each of the three alternatives proposed in the previous phase. The engineering study area is limited to the alternative corridors proposed.
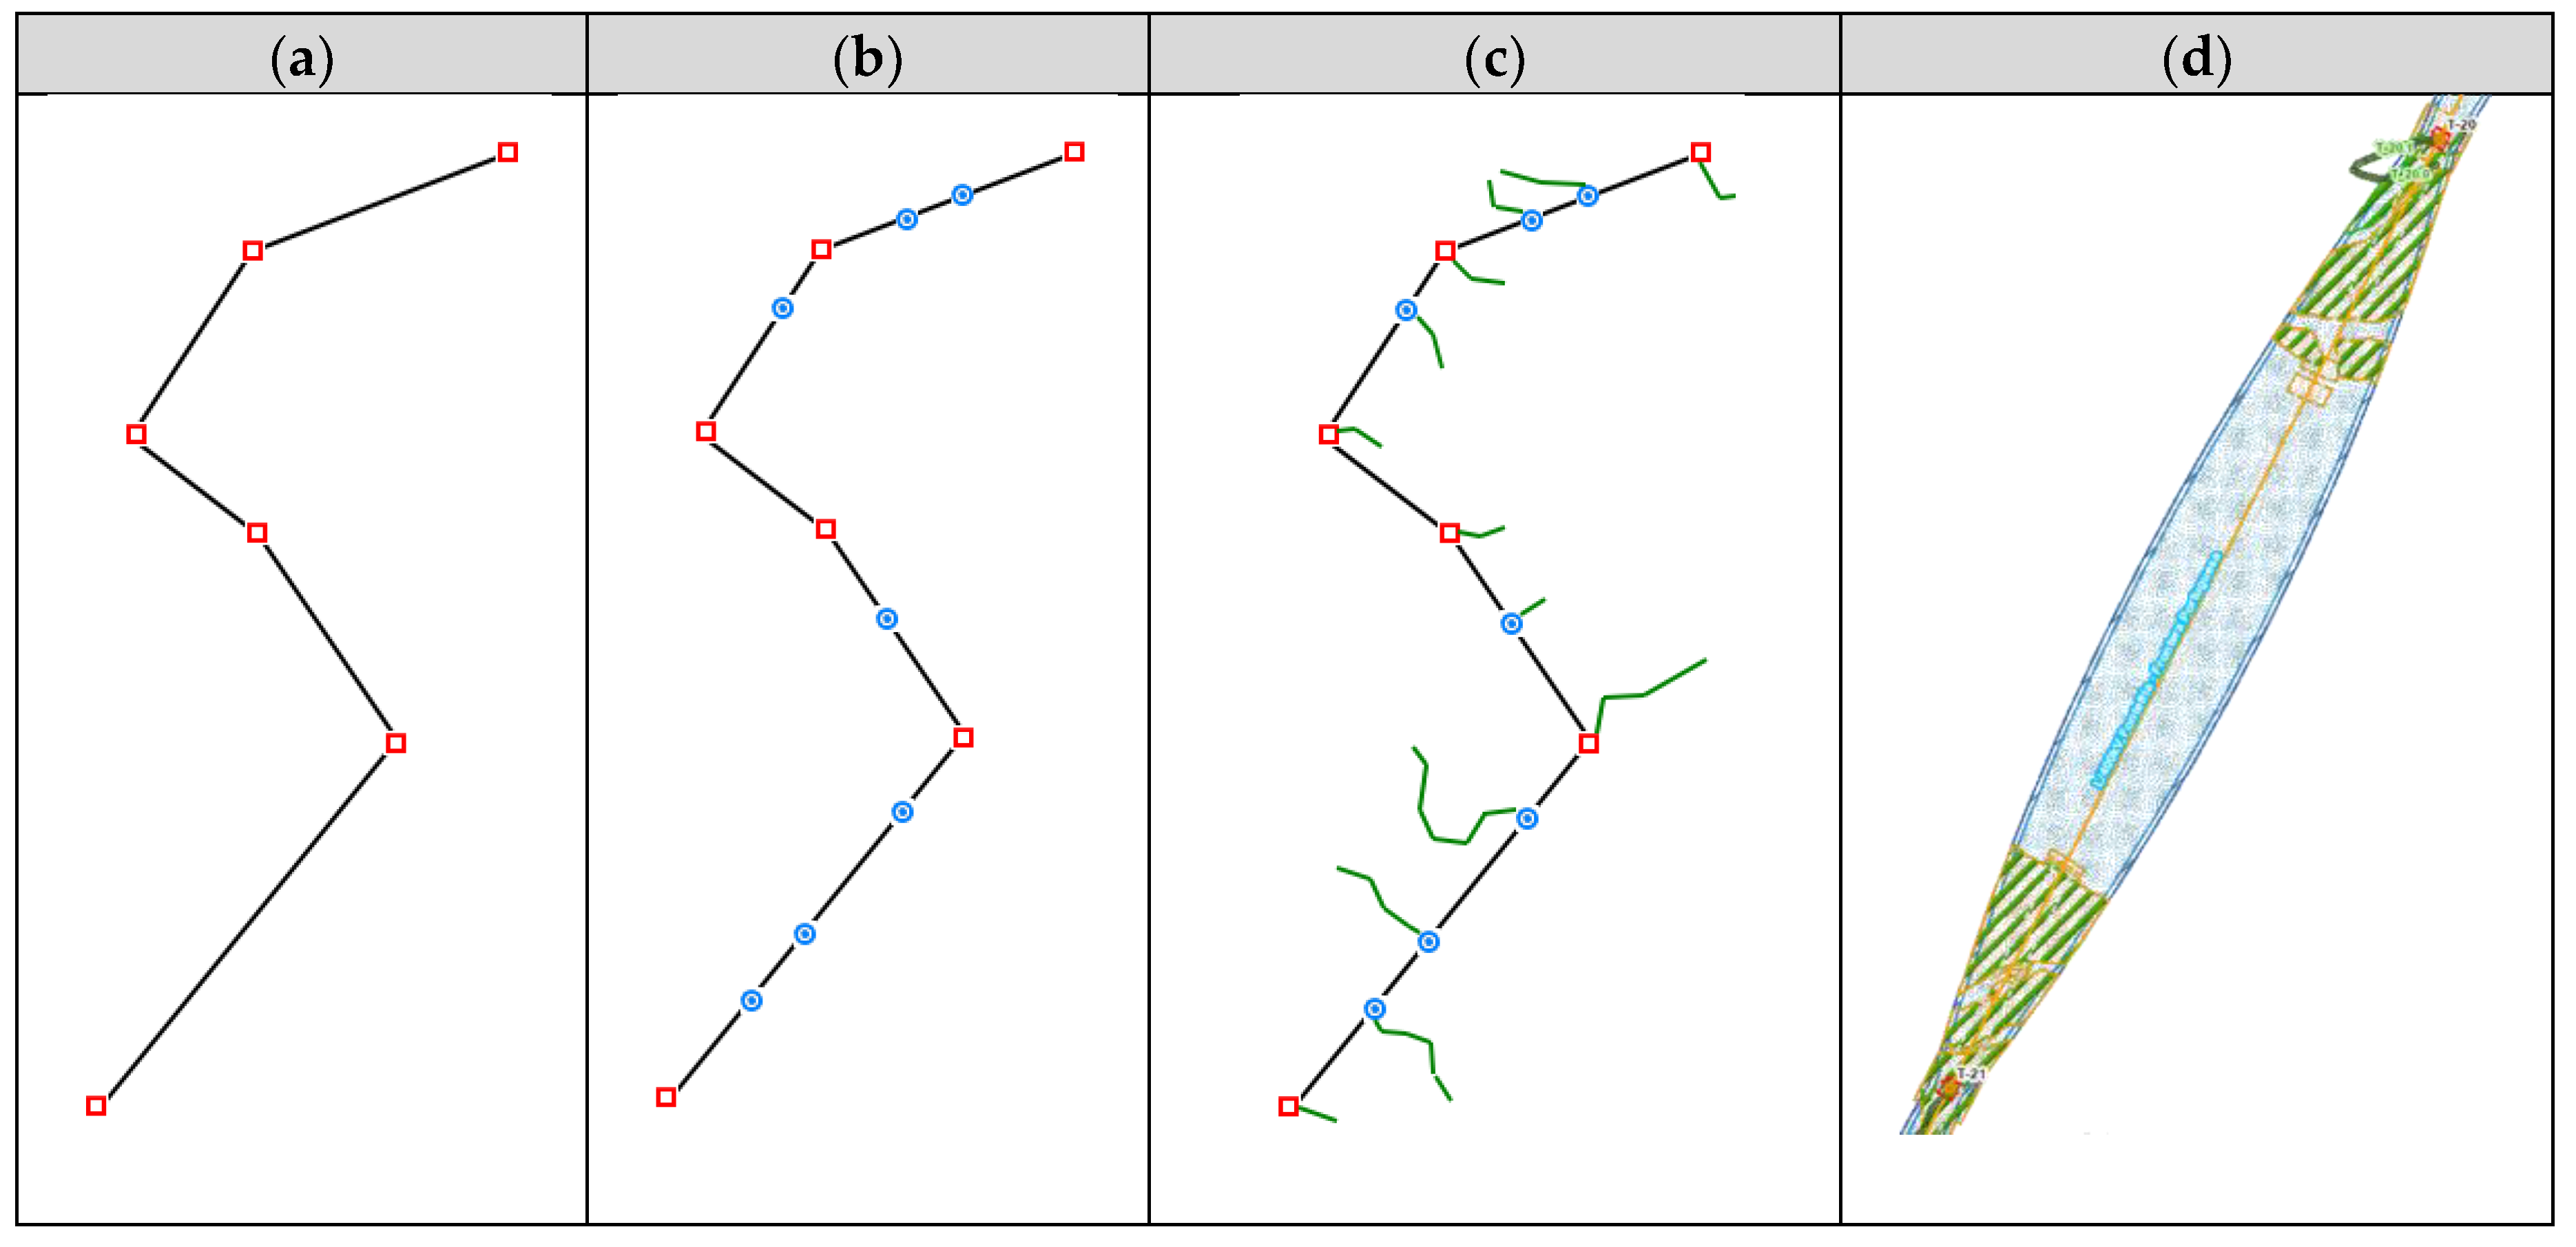
There are several project design steps included in this phase, in addition to any electrical and mechanical aspects that may result in strain on conductor cables and their supporting structures. As shown in Figure 5, the first step is designing the alignments, that is to say, the viable layout for the new HVTL, which will necessarily fall within the previously generated corridor. The second step is consolidating the alignment vertexes as pylons. The third is distributing the pylons, with each of the vertexes from the previous step serving as a pylon. There may be as many pylons as necessary between any two vertexes. The fourth step is designing the pylon access roads. Lastly, the fifth step is generating all the surfaces affected by the future HVTL.
3.4. Permit Obtainment Phase
During this phase, a detailed description is made of the impact of the new HVTL on the plots it is to occupy. This quantitative description defines the conditions for each plot and establishes the compensation that each owner will receive for its occupation, whether temporary or permanent. The permit is a document signed by both parties that authorizes REE to occupy the parcels in the terms specified therein.
3.5. Construction Phase
During the construction phase, the designed project is materialized in the territory. This phase consists of executing the civil work of the pylons and the access roads projected to reach them, as well as laying the cables that will be supported by the pylons.
It could be said that the previous phases have elaborated the project in detail so that, at this stage, any environmental, technical, or legal conditions that may apply have already been contemplated and satisfied. The only uncertainties remaining are those inherent to the execution of any civil works.
4. Workflow Implementation and Discussion
4.1. Planning Phase
The planning phase is carried out by consensus between the central governmental administration and REE as a technical phase that proposes the construction of new lines, or the repowering the existing lines, in order to maintain quality of service or enable connection to new sources of power generation or high-speed railway lines. Its final approval depends on the Council of Ministers.
During this phase the use of GI is merely informative and not detailed. This is why we have only included this phase as the start of the workflow without elaborating it in as much detail as the other phases.
4.2. Studying Alternatives Phase
This phase includes the biggest change in the GI work-scale, which goes from the national scale to a scale that covers the geographical extent of each project.
4.2.1. Scope of Study Model
The objective is not only to represent but also to be able to analyze GI with the criteria established by REE for each phase. This criteria is established under two requirements: the basic GI required, and the symbology of corporate representation; thus homogenizing studies for the new HVTL.
This model, adapted from the methodology proposed in the “TPropongo” [46] project, generates the basic GI required. The adaptation consisted of reducing the number of themes included in the model to be considered and re-parameterizing all the others, ultimately leaving eight layers of spatial data categorized by theme and level of acceptability of a new HVTL. These eight layers of spatial data correspond to the territorial constraints that have been taken into consideration. Each pixel (resolution of the analysis) is assigned an acceptability value for each of the territorial factors taken into account. According to REE’s technical criteria, the difficulty of carrying an HVTL is assessed on a scale from 0 to 10. The value 0 represents the minimum territorial restrictions within the territory, while 10 represents the most.
These territorial constraints are detailed below:
● Existing Linear Infrastructures
The aim is to obtain the areas that are already experiencing the impact of previously built power facilities in order to group the impact of the new HVTL together with the impact of existing linear infrastructures, thus avoiding fragmenting the territory by opening additional infrastructure corridors. Buffers (areas of influence) measuring 250 m are created around existing linear infrastructures (power lines, roads, and railway lines) in order to demarcate suitable areas. On the other hand, an additional buffer is created around the first 25 m surrounding these linear facilities in order to respect the right-of-way for these infrastructures. An example of values indicating territorial restrictions can be seen in Table A1 (1) of the Appendix A.
● Accessibility
In addition to minimizing costs and execution times for the project, the accessibility of the territory also reduces the impacts derived from building new accesses. The objective is to generate a map indicating the most and least accessible areas in the territory, as well as those areas that have no access roads. Buffers between 250 and 500 m are created around asphalted roads and non-asphalted roads. A 25-m buffer is also created around asphalted roads to respect the right-of-way. An example of values indicating territorial restrictions can be seen in Table A1 (2) of the Appendix A.
● Orography
The aim is to obtain a map of the study area representing zones with the greatest and least terrain slope. An example of values indicating territorial restrictions can be seen in Table A1 (3) of the Appendix A.
● Natural Value
There are different figures with a natural value to be found in the territory. These figures must be kept in mind, as far as possible, in order to avoid degradation. An example of values indicating carrying capacity can be seen in Table A1 (4) of the Appendix A.
● Protected Natural Areas
The aim is to obtain a map representing natural protected areas (NPAs), assigning greater value to areas in which protections overlap. An example of values indicating impeded carrying capacity can be seen in Table A1 (5) of the Appendix A.
● Populated Areas
The aim is to obtain a map that represents populated areas, areas near these population areas, and isolated areas, which would be less visible but would also be more difficult to access. To divide the territory by categories, buffer rings are created at different distances, and an example of values indicated territorial restrictions is shown in Table A1 (6) of the Appendix A.
● Social Environment
The aim is to obtain a map that shows the areas of social interest classified by type, to which end an example of values indicating territorial restrictions is shown in Table A1 (7) of the Appendix A were used.
● Physical Environment
Nature itself imposes different restrictions on the territory, such as those associated with hydrology and geology. In order to apply these restrictions, 25-m buffers were created around the hydrographic network, in order to respect its integrity. Also, 200-m buffers were created around specific elements such as places of hydrogeological interest. The sample values indicated in Table A1 (8) of Appendix A were used to generate the map of areas of physical interest.
Depending on the particularities of each region, REE can generate as many maps as necessary for each territorial feature by modifying the weight values applicable to each variable for each territorial constraint. Thus, for each project for the new HVTL, it is possible to iteratively generate different scenarios for each territorial constraint. A recent paper from Trogu and Campagna [47] demonstrated that it is possible to assign weights locally using a statistically sound data-driven approach. In this paper, the authors explain that, “the capacity of composite indicators to summarize the simultaneous effect of different aspect of the realty, and at the same time the possibility to take into account the spatial effects that may occur among the variables involved in the description of these aspects.” Another paper by Ligmann-Zielinska and Jankowski [48] explains how they, “employ spatially-explicit uncertainty and sensitivity analysis to examine the robustness of land suitability evaluation. We use Monte Carlo simulation to sweep through criteria weight space, where weights are expressed using probability distributions.”
The bioclimatic region of Spain where the study of alternatives is carried out conditions the weights associated with each variable. REE has multidisciplinary working groups spread throughout the territory. These groups are familiar with local environmental conditions, relationships among regional and local stakeholders and the technical aspects of the project and also have advanced GIS skills.
4.2.2. Territorial Restrictions Model
This model generates a map of the restrictions of the territory that might potentially accommodate the new HVTL.
Once the aforementioned (raster format) maps have been generated, representing each of the territorial features to be considered, the map of territorial restrictions is obtained from the weighted superposition of all these features. Each map generated takes the acceptability values of its variables into account, and each map weighs differently in generating the final territorial restrictions map. An example of weights used is listed in Table 1, where we can appreciate how it is possible to ponder the importance of each one of the themes.
The result of the weighted superposition of the various maps is the territorial restrictions map, where each pixel (at the study resolution) is assigned a restriction value, with pixels of lesser values representing a greater capacity for hosting a new HVTL.
As with the previous model, by modifying the weights of each layer of spatial data, it is possible to obtain different scenarios that, when applied iteratively, bring the map closer to the capacity for hosting a new HVTL of the particular conditions in each region.
4.2.3. Viable Alternatives Model
Based on the map of territorial restrictions, this model makes it possible to generate corridors within which to project the HVTL. An HVTL always has an origin and a destination that might include (new or existing) power substations or connections with other existing HVTLs. These corridors represent areas with minimal territorial restrictions for connecting the aforementioned origin and destination.
This model is composed of two steps. The first step consists of narrowing the scope of analysis, which helps reduce the size of the territorial restrictions map. In the second step, an analysis is made that makes it possible to obtain alternatives. Thus, it is possible to iteratively define as many scopes of analysis as necessary and generate alternative corridors for each one.
The geo-processing model for the first step is based on reducing the size of the territorial restrictions map in order to limit the scope of analysis. This reduction limits the surface area over which the alternative corridors are proposed.
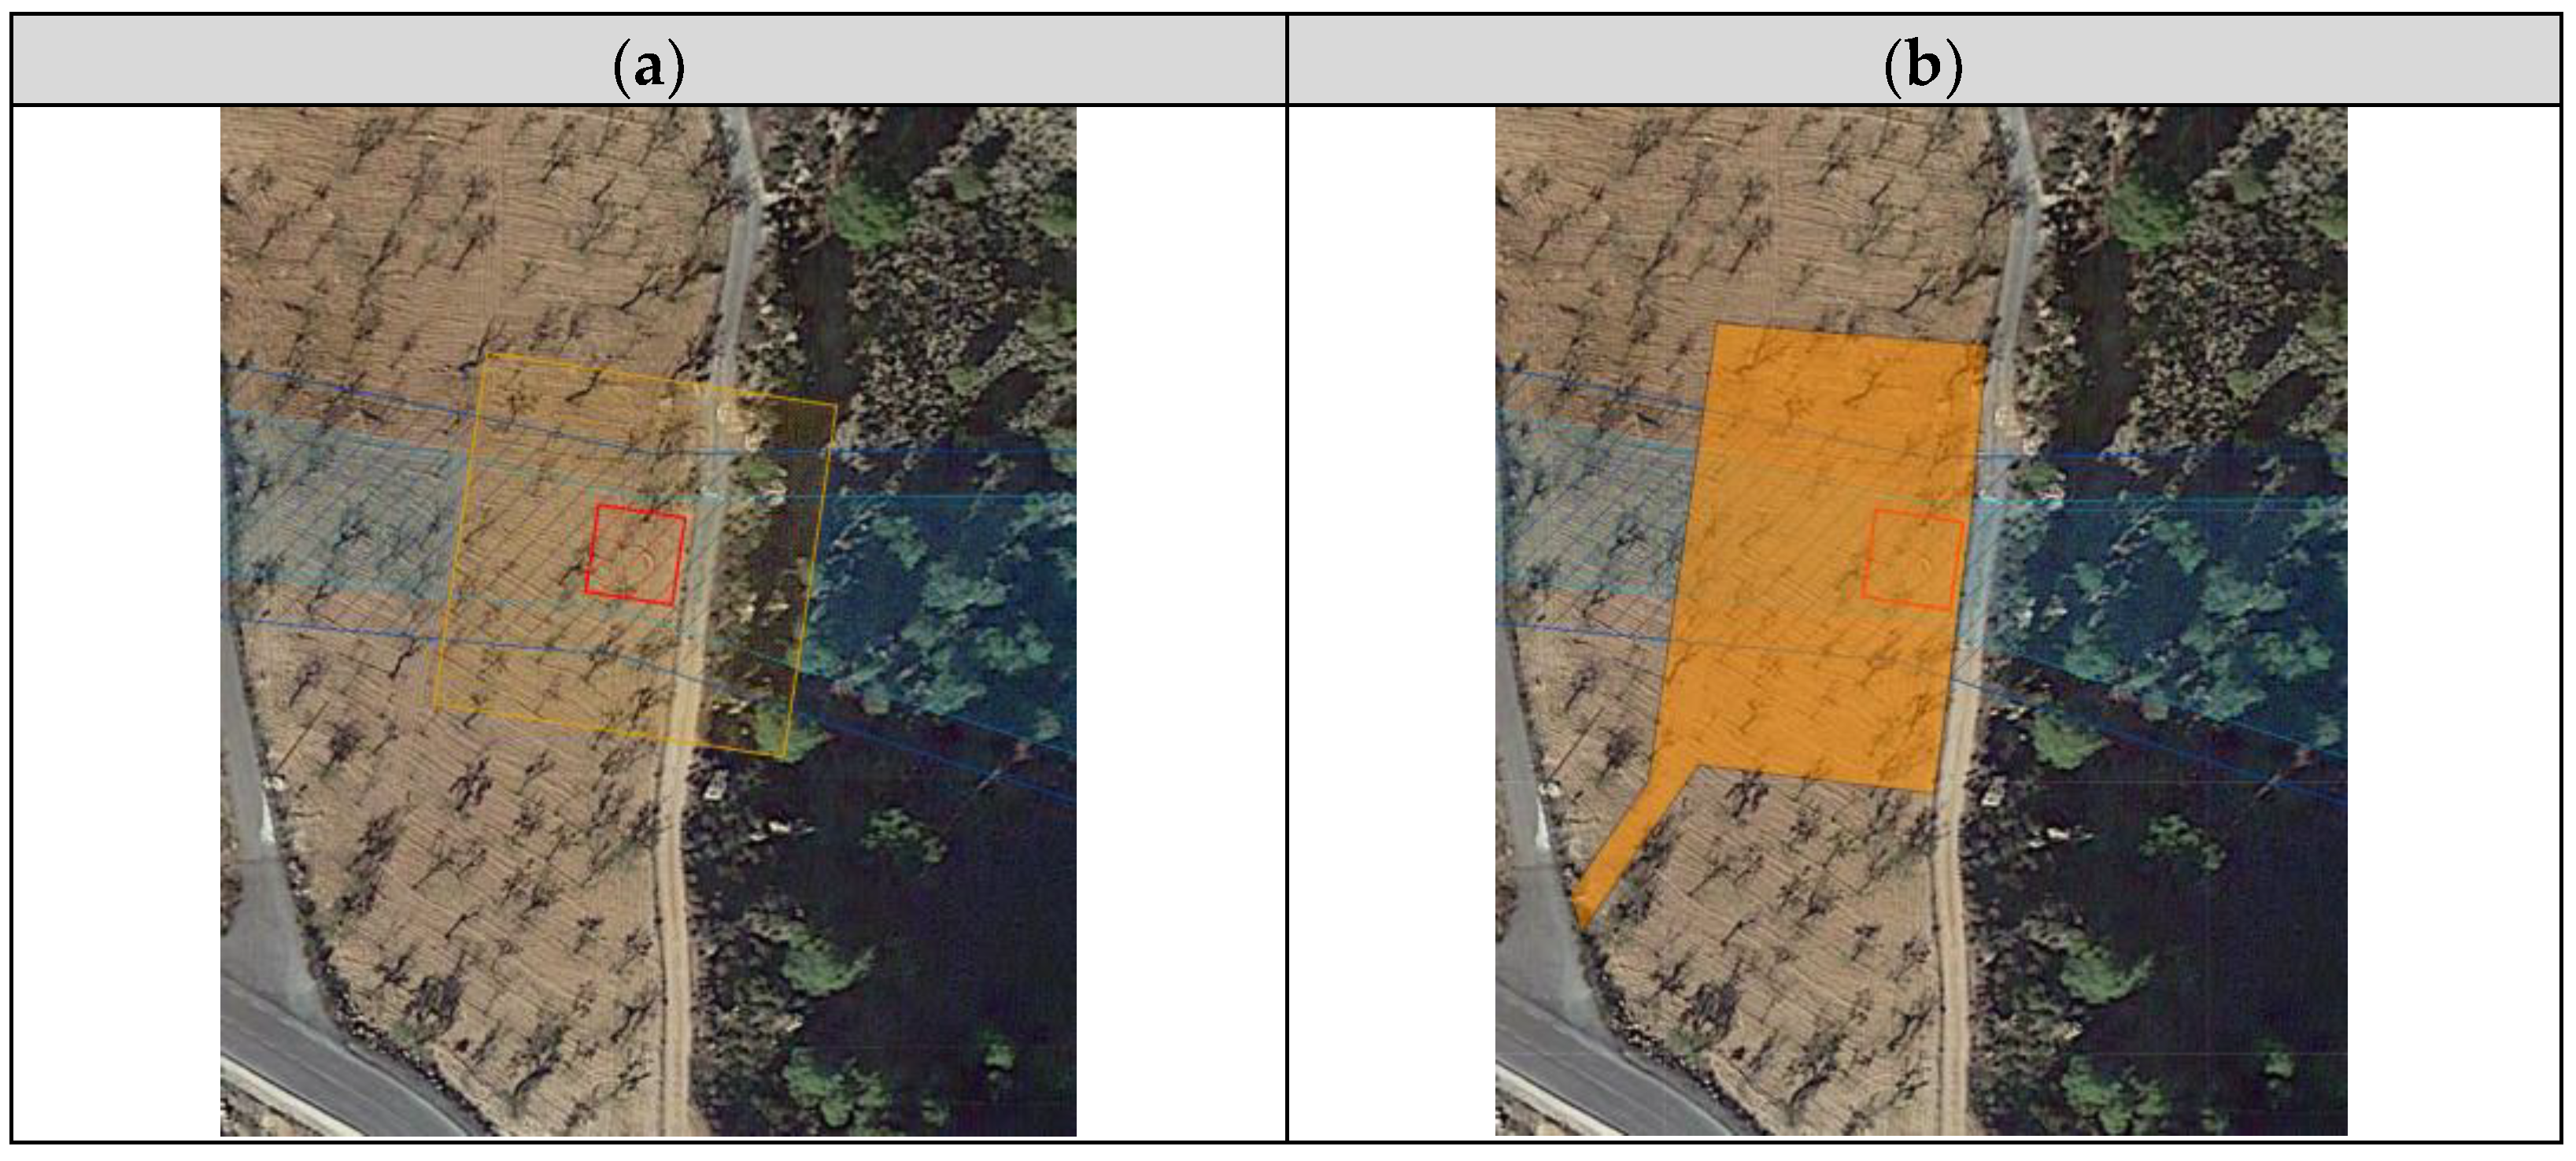
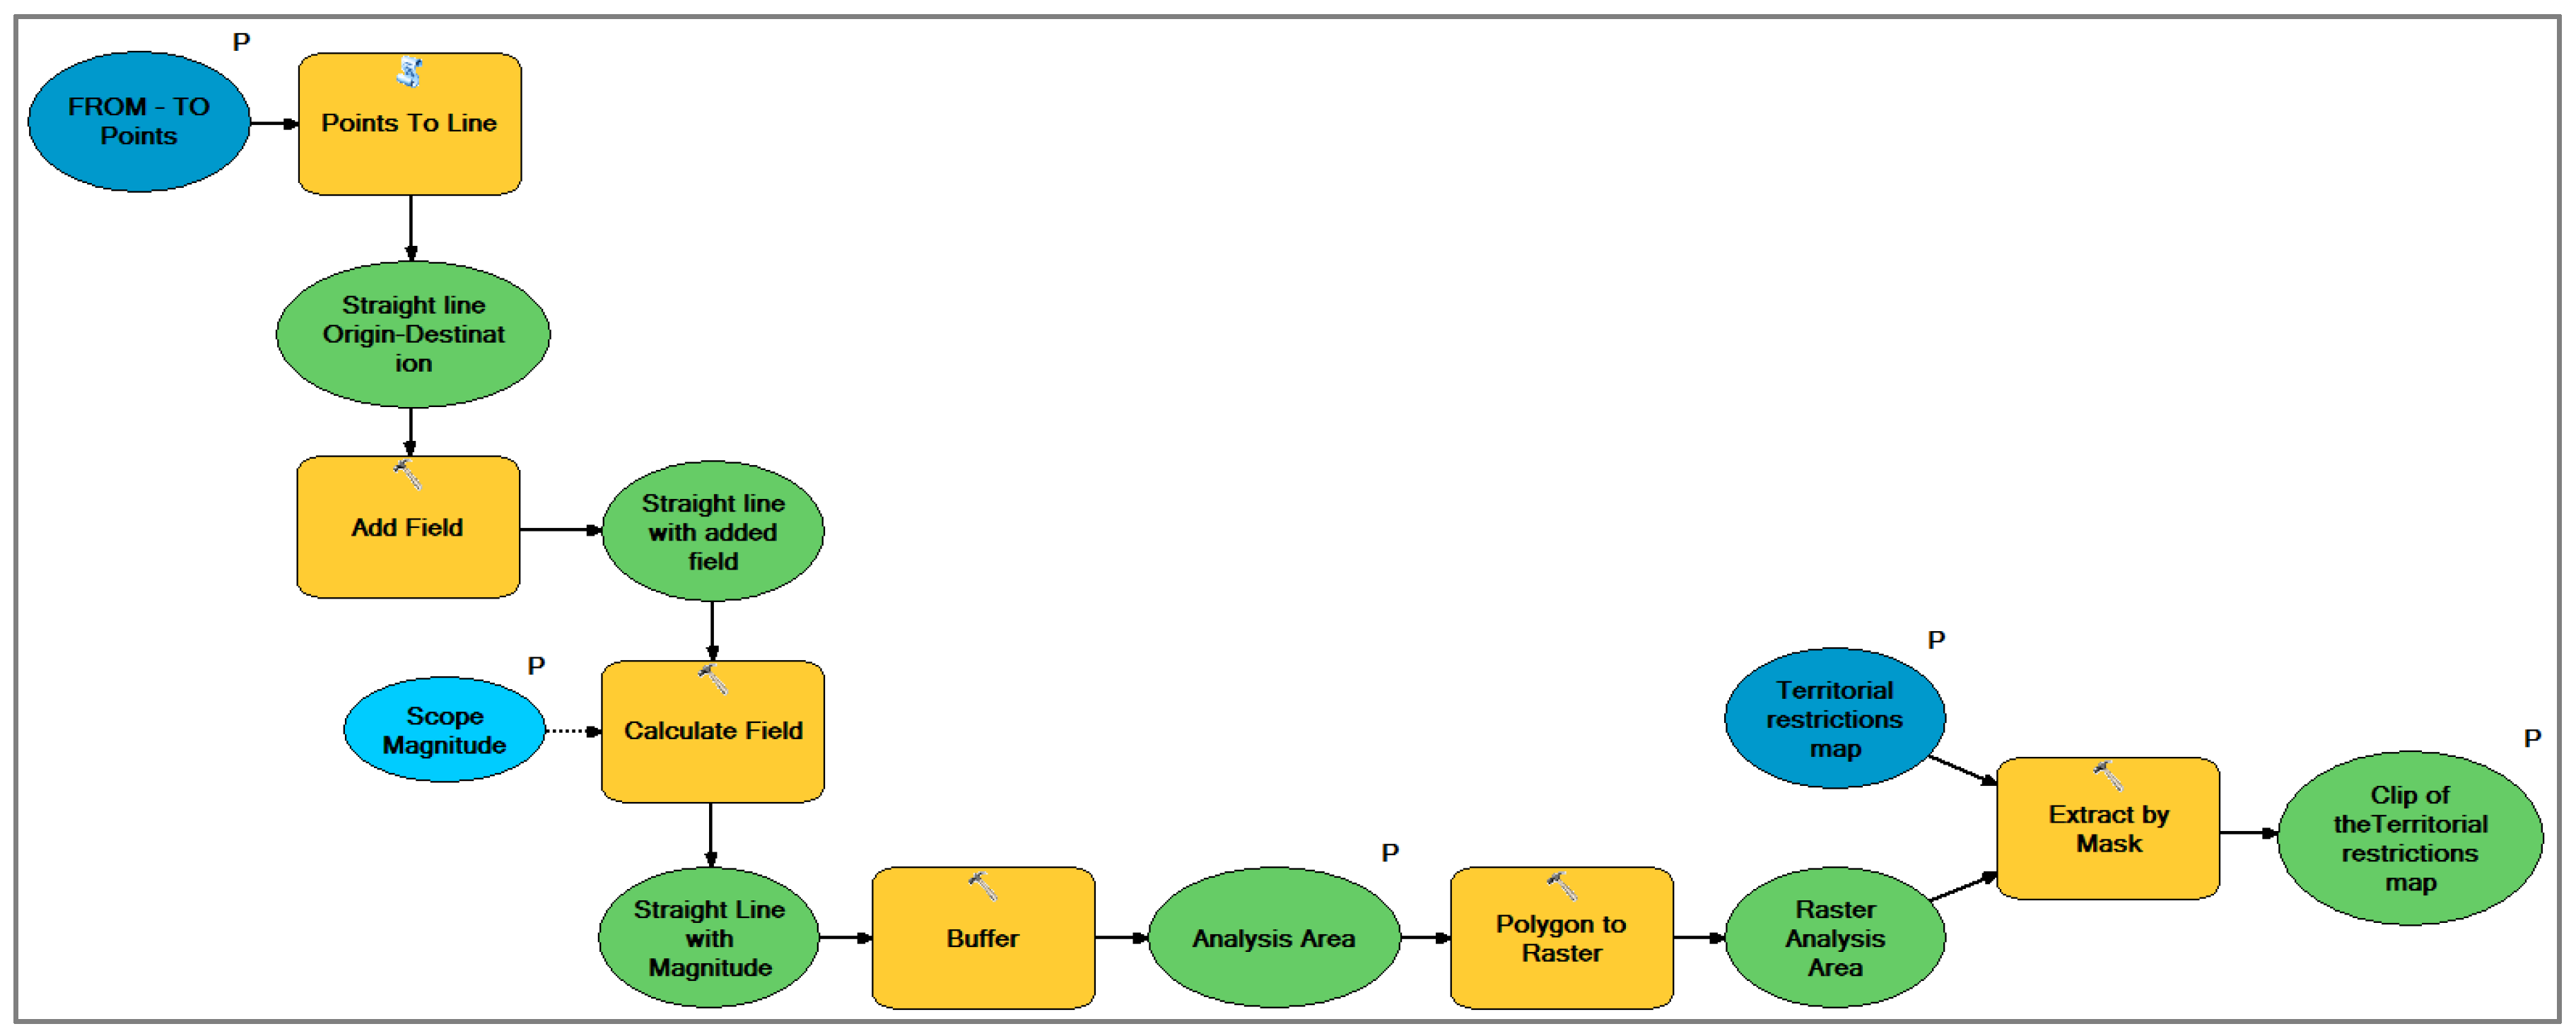
In this model (see Figure A1 of the Appendix A), the crop mask is generated and the territorial restrictions map is cropped, with the area around the straight line connecting the point of origin and the destination considered.
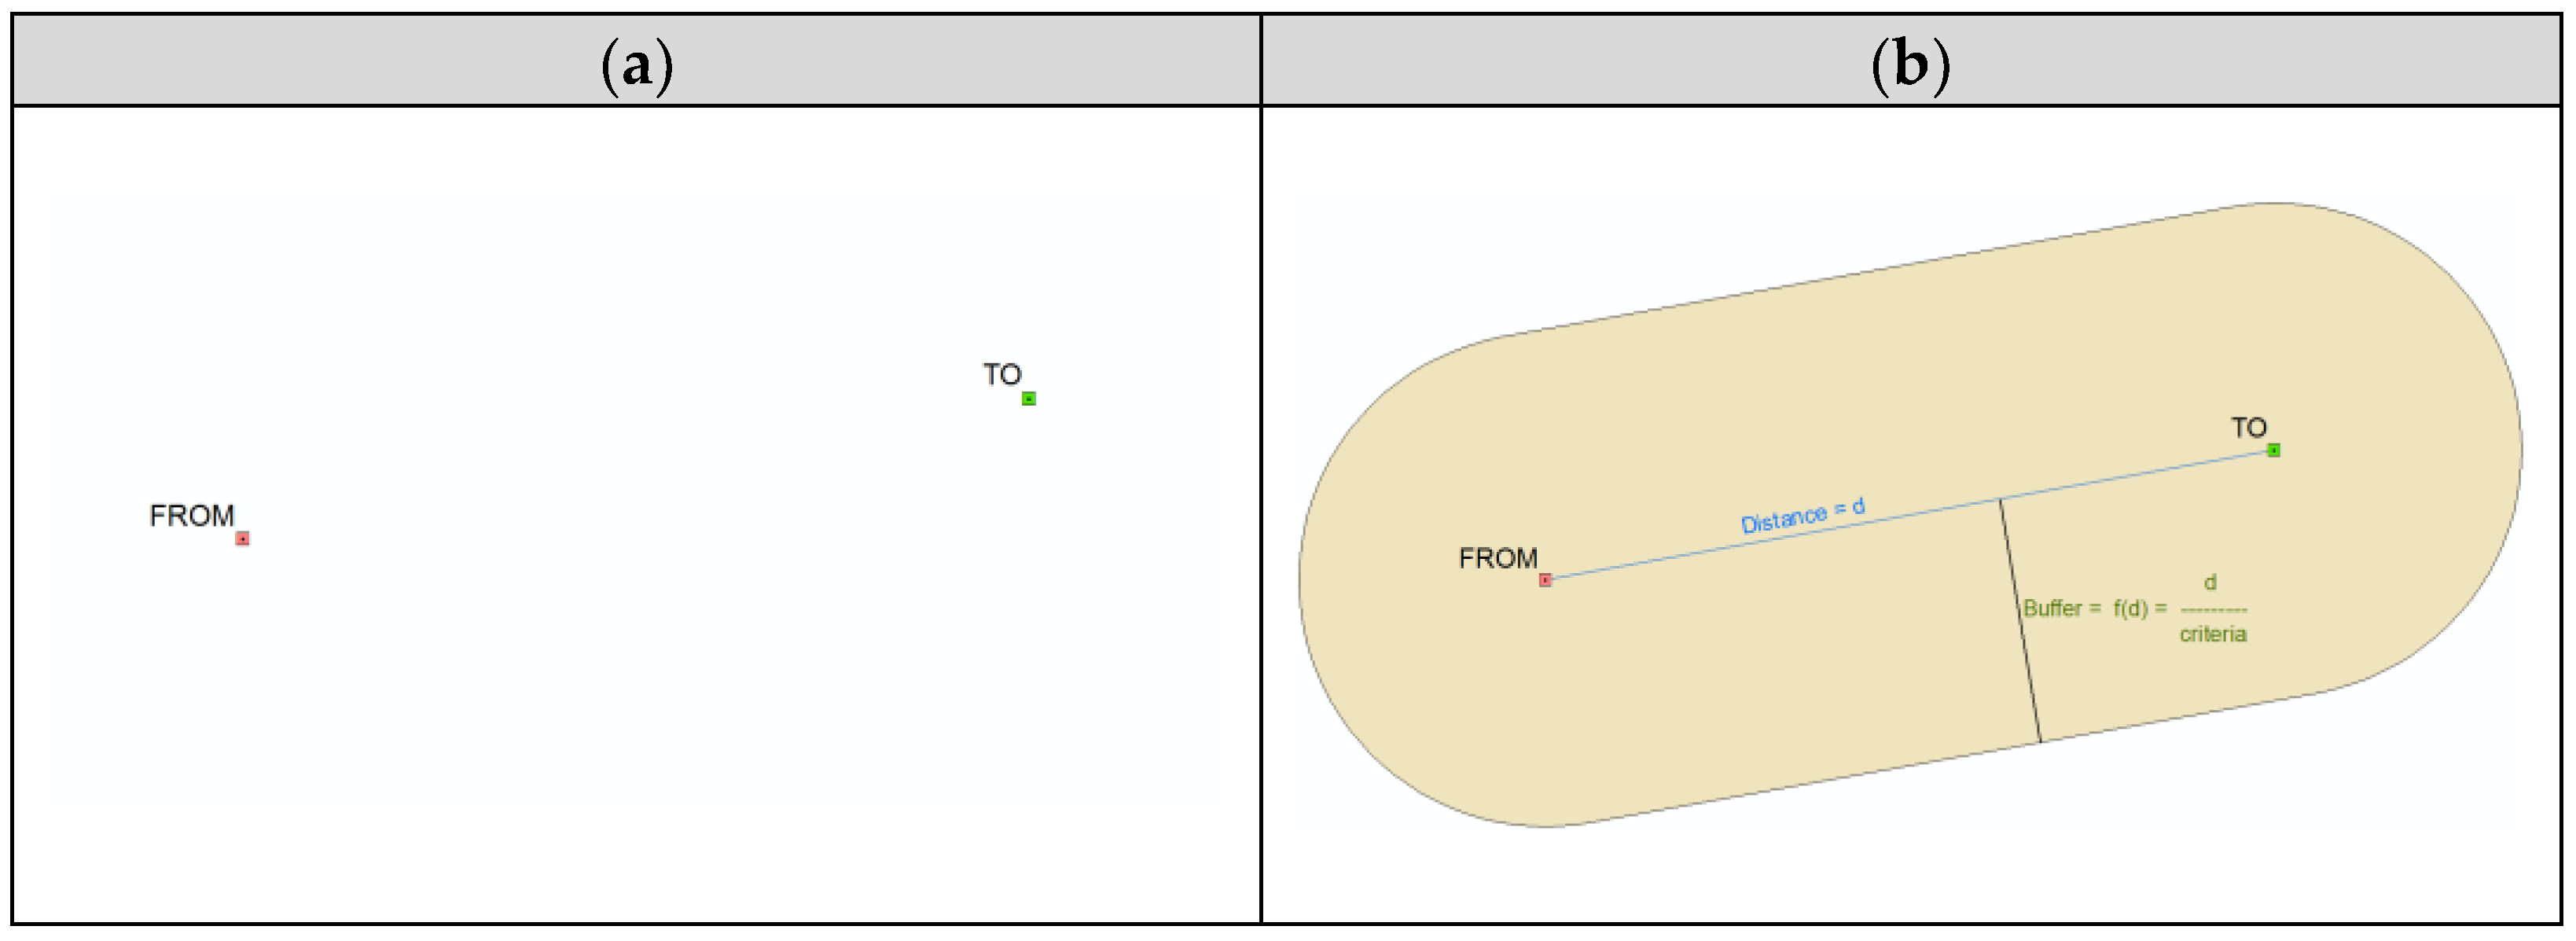
In order to ensure that as many alternative corridors as possible can be considered, the way in which the scope of analysis is delimited must vary depending on the distance between the point of origin and the point of destination. The greater the distance between the points of origin and destination, the greater the dimensions of the scope of study should be. In other words, the width of the scope of analysis is determined as a function of the distance between the point of origin and the point of destination. In this case, the width was taken to be one-third of the distance and is a value that can be modified iteratively.
Figure 6 is a graph showing the flow of information for this model.
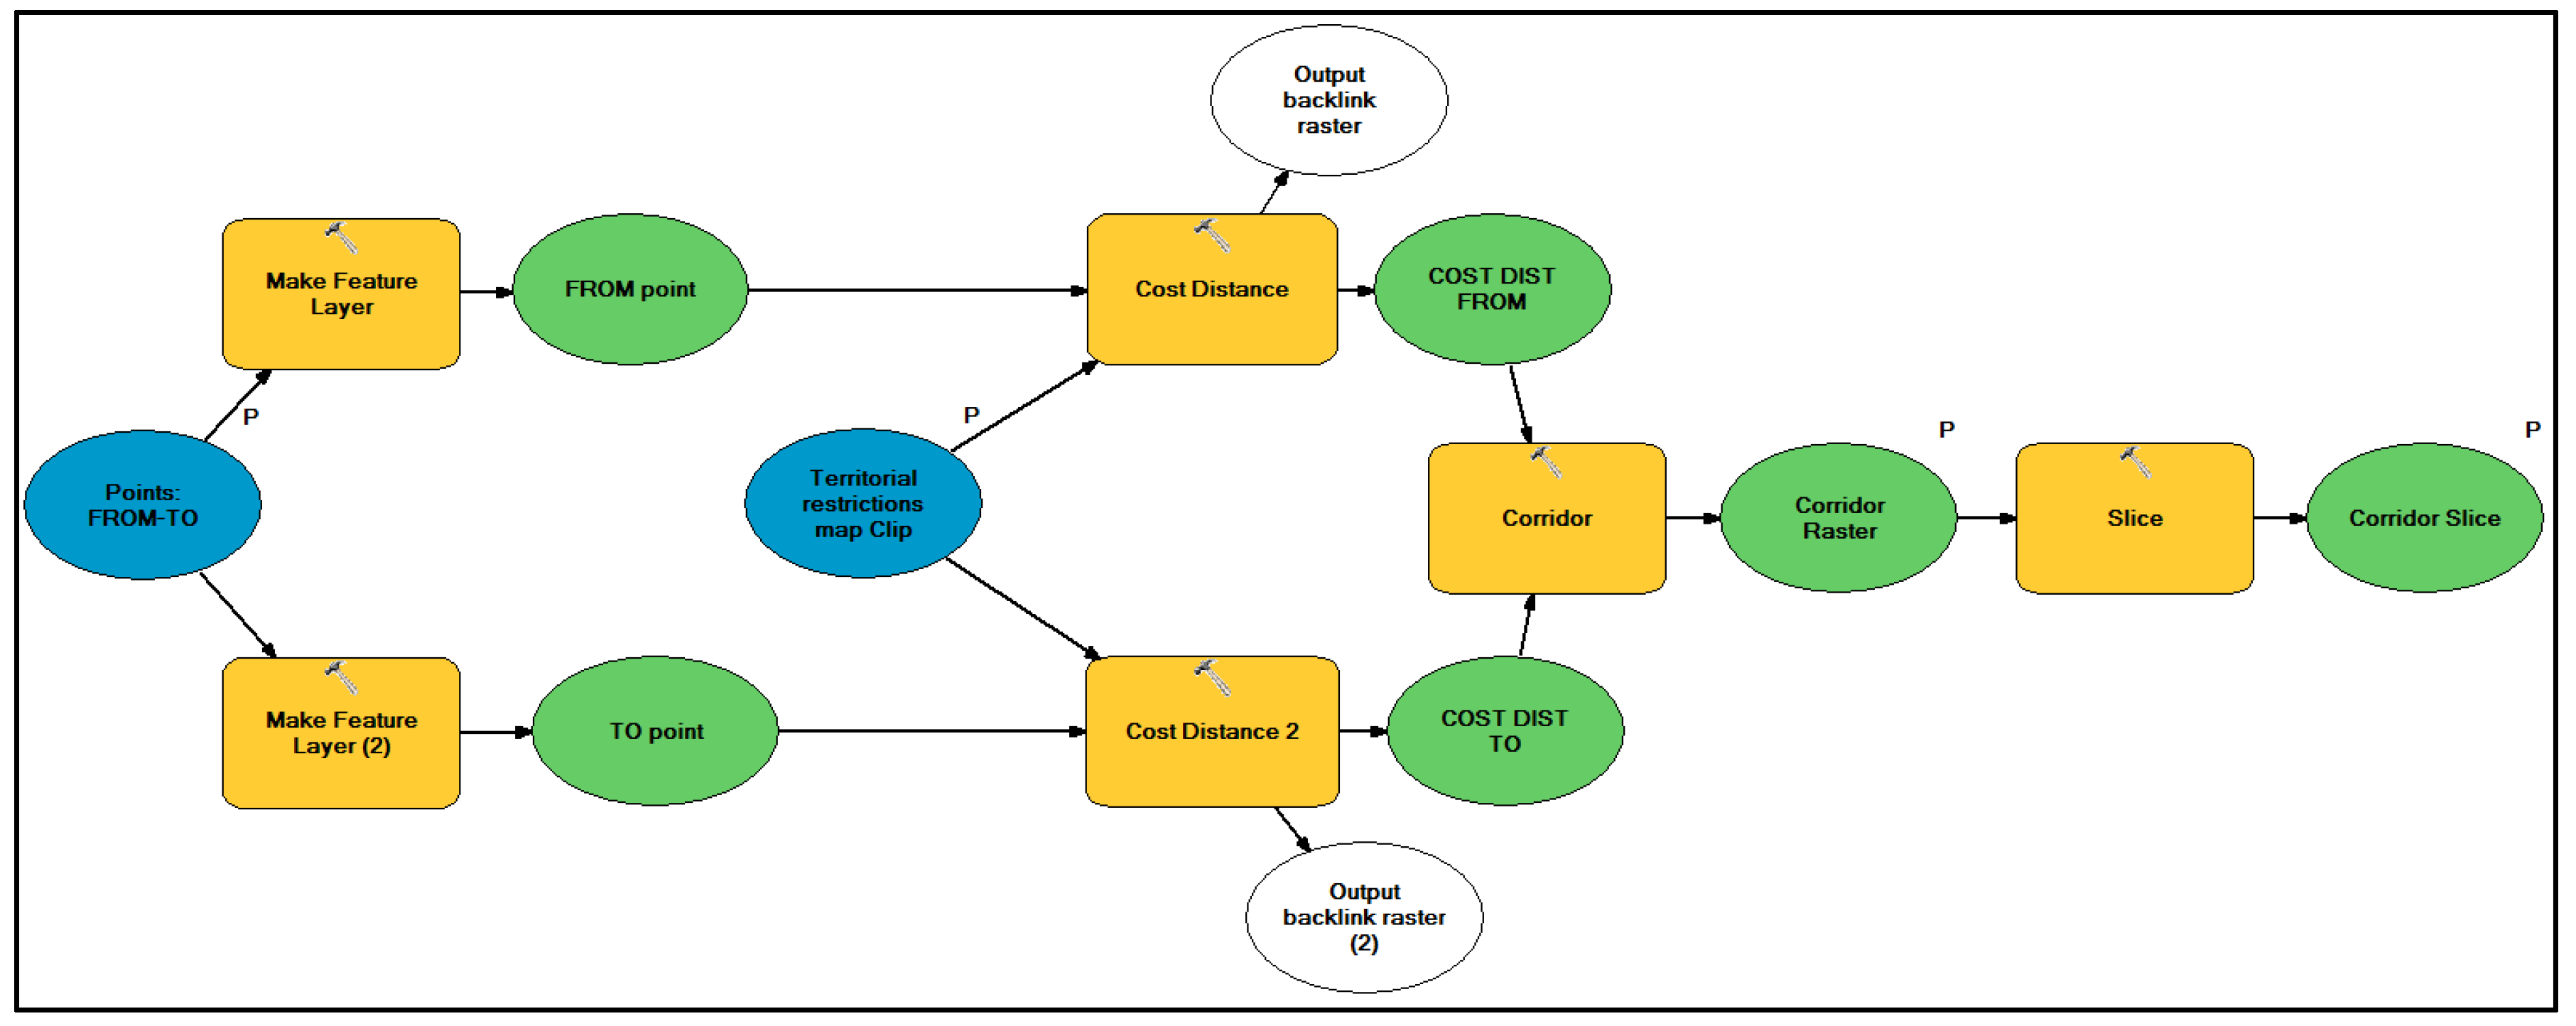
In the second step, using the model in Figure A2 of the Appendix A, the alternative corridors are generated after restricting the scope of analysis to the previous crop.
The raster crop that has just been generated serves as the raster cost area in the model, so that, a distance cost raster may be generated for each point based on the points of origin and destination. These distance cost rasters represent the distance with the lowest cumulative cost for each cell in the nearest point, using the territorial restrictions map as the cost surface.
Using these two distance cost rasters, a sum of the cumulative environmental costs for both rasters is obtained. Based on this resulting raster, crops are made to obtain the areas with the lowest cumulative environmental costs. From this point on, the alternative corridors are clearly visible.
Of all the alternatives generated, the three with the least environmental impact is chosen. To this end, the following environmental impact model is applied, the results of which, along with the overall visibility, are key for the decision model.
4.2.4. Environmental Impact Model
Both the alternative corridors generated and the points taken into consideration in generating the territorial restrictions map have had some sort of effect on the environment. These effects must be identified, quantified, and organized in order to select the alternative with the least impact. To this end, a layer is generated that adds all the environmental protection figures and creates an intersection of each of the alternative corridors based on the protection figures obtained for each alternative: what figures it goes through, their importance, and the degree to which these are affected. It is thus possible to select the alternative corridor with the least impact on the environment.
4.2.5. General Visibility Model
This model adds another attribute to each alternative corridor by carrying out a visibility analysis for each alternative. In this phase, visibility is not a characteristic that strictly constrains the layout of the future HVTL, but it does inform us of the visible surface area of each alternative.
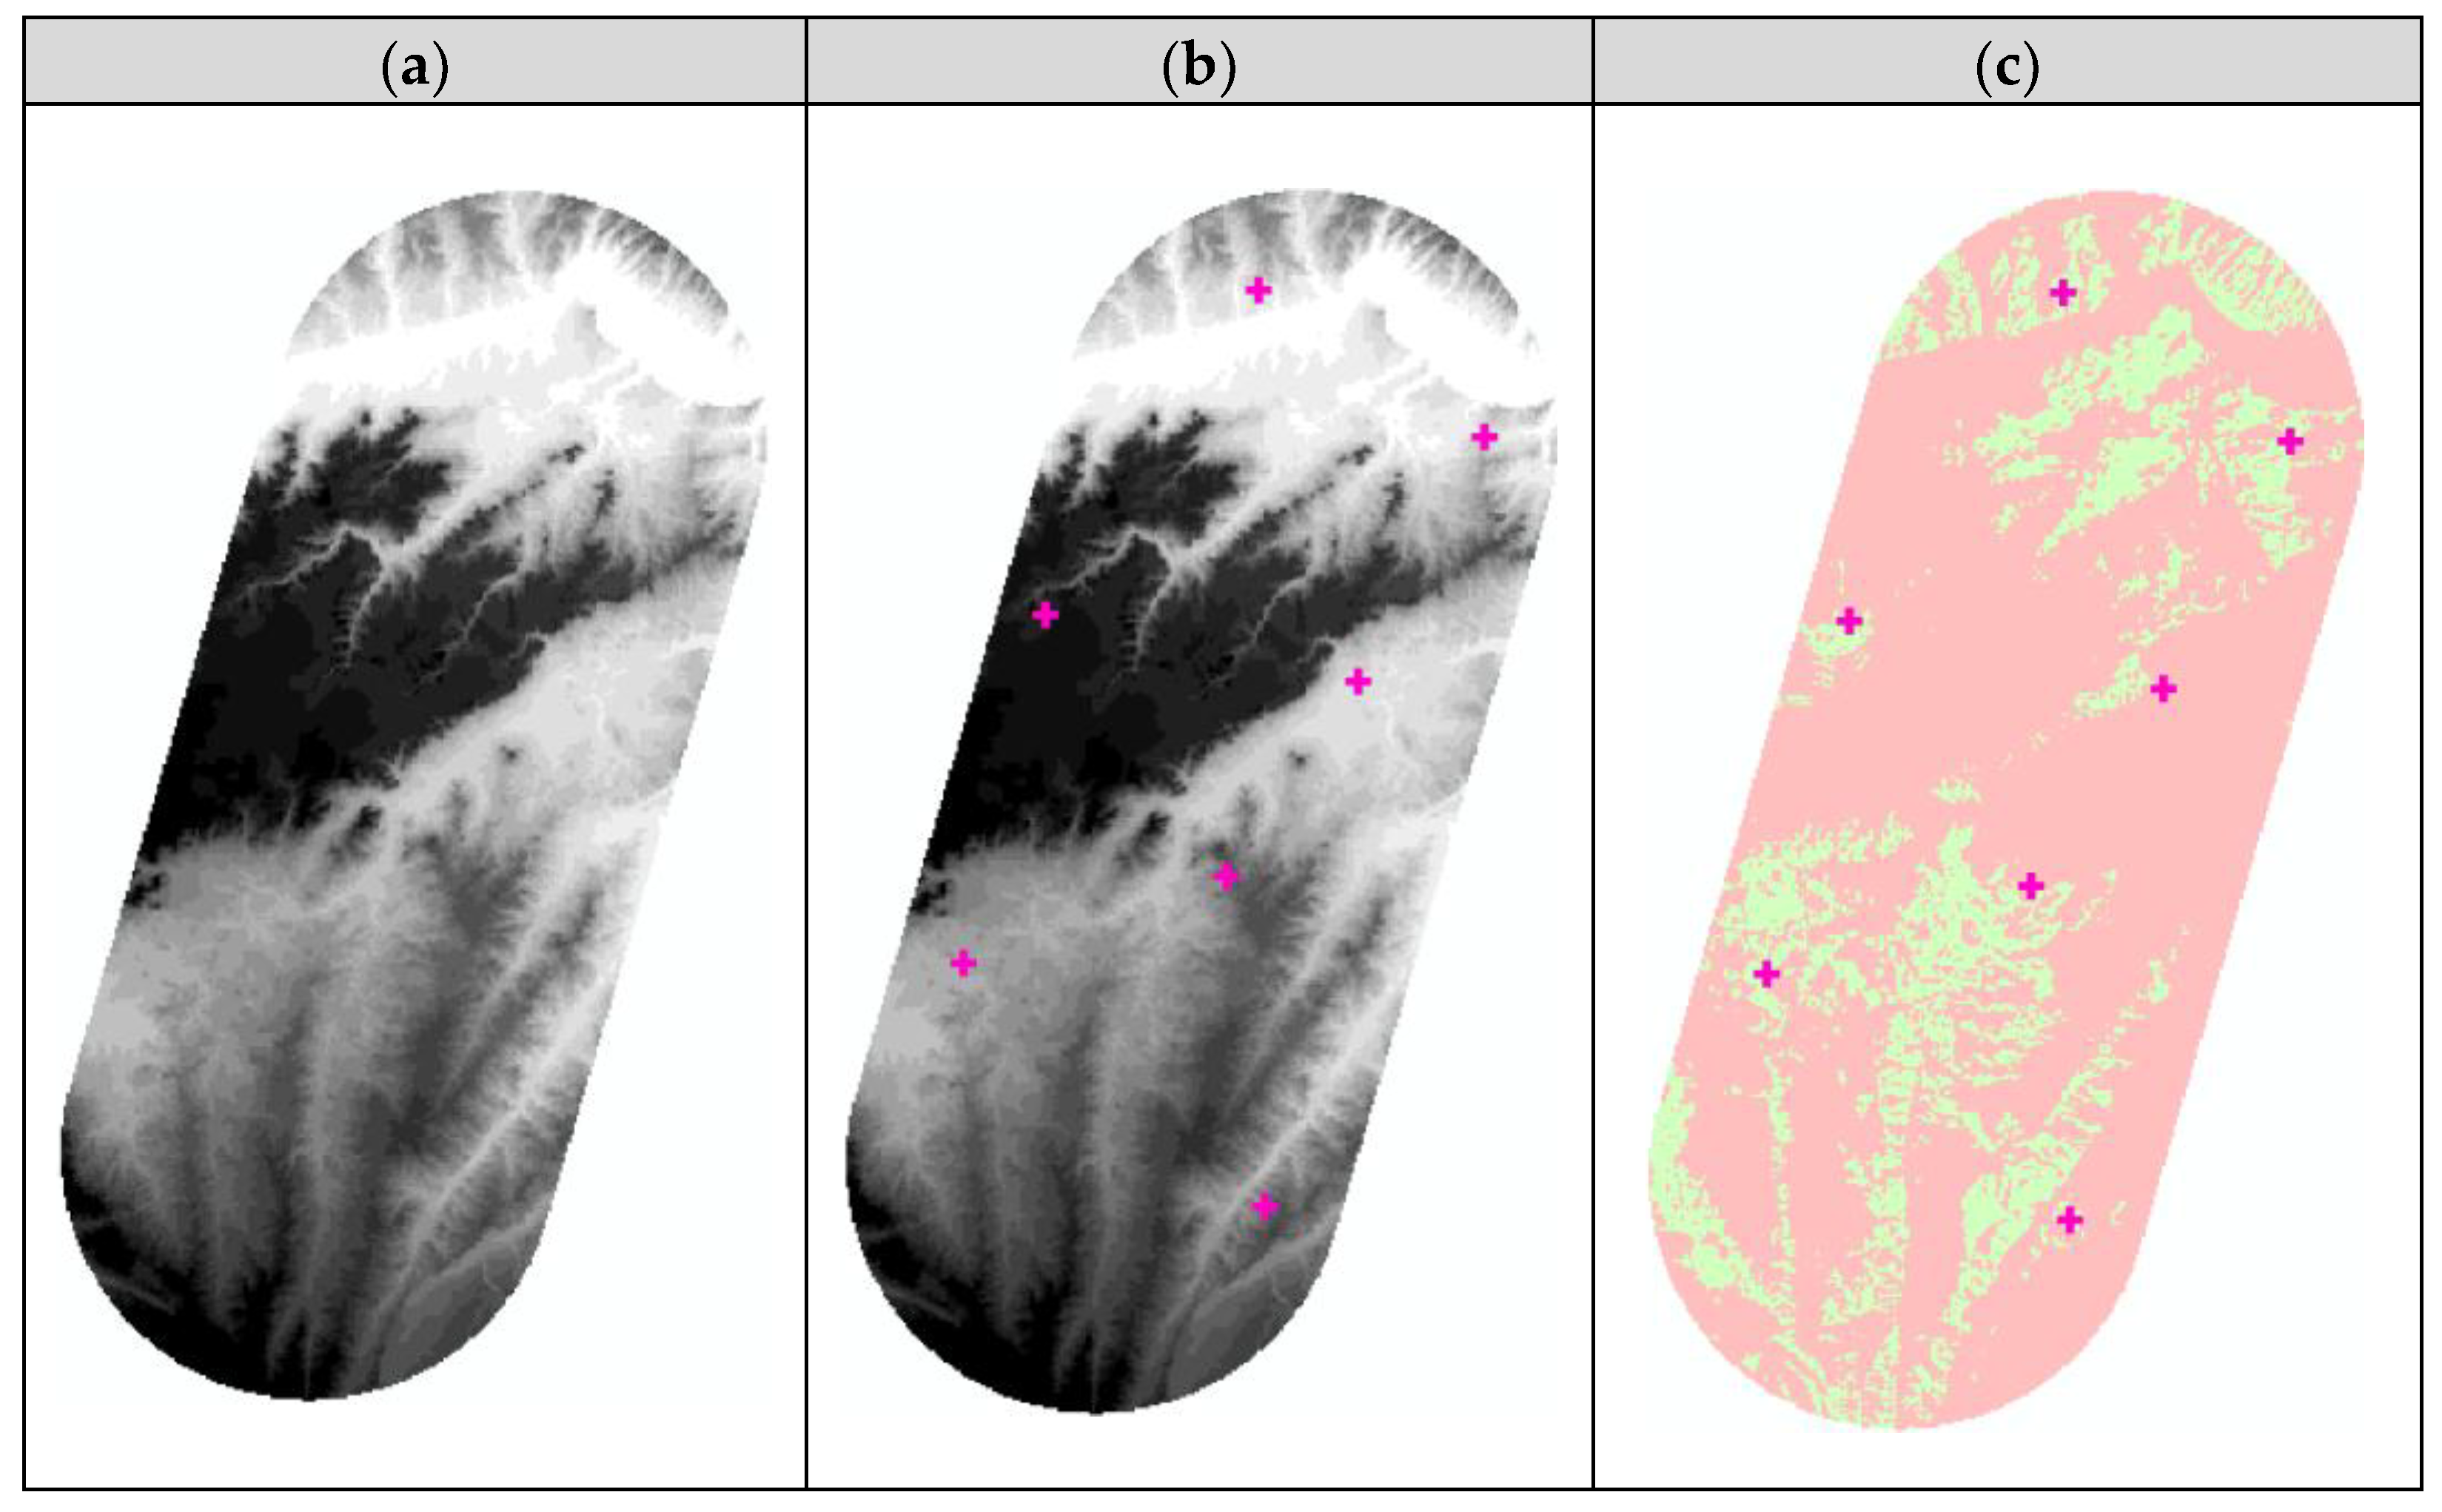
We also used the digital terrain model for the study area, a set of relevant points as observed points, such as the existence of populated areas, luxury hotels, tourist routes, roads, and any other relevant site whose sightlines might be interrupted by the new HVTL, and calculate the view-shed for each of them within the study area. Subsequently, an intersection is created between each alternative and the overall view-shed for the area in order to compare alternatives from the point of view of visibility.
This comparison takes into account the visible surface for each alternative and the relative weight of each relevant point to be observed in the territory. Figure 7 shows a graphic example.
4.2.6. Decision Model
During this phase, three viable alternatives for installing a new HVTL are chosen to find out which of the three has the lowest environmental impact. In order to identify the alternative with the least impact, we first analyze the results of the environmental impact model and the general visibility model, and also keep in mind the cost criteria and the length of each alternative.
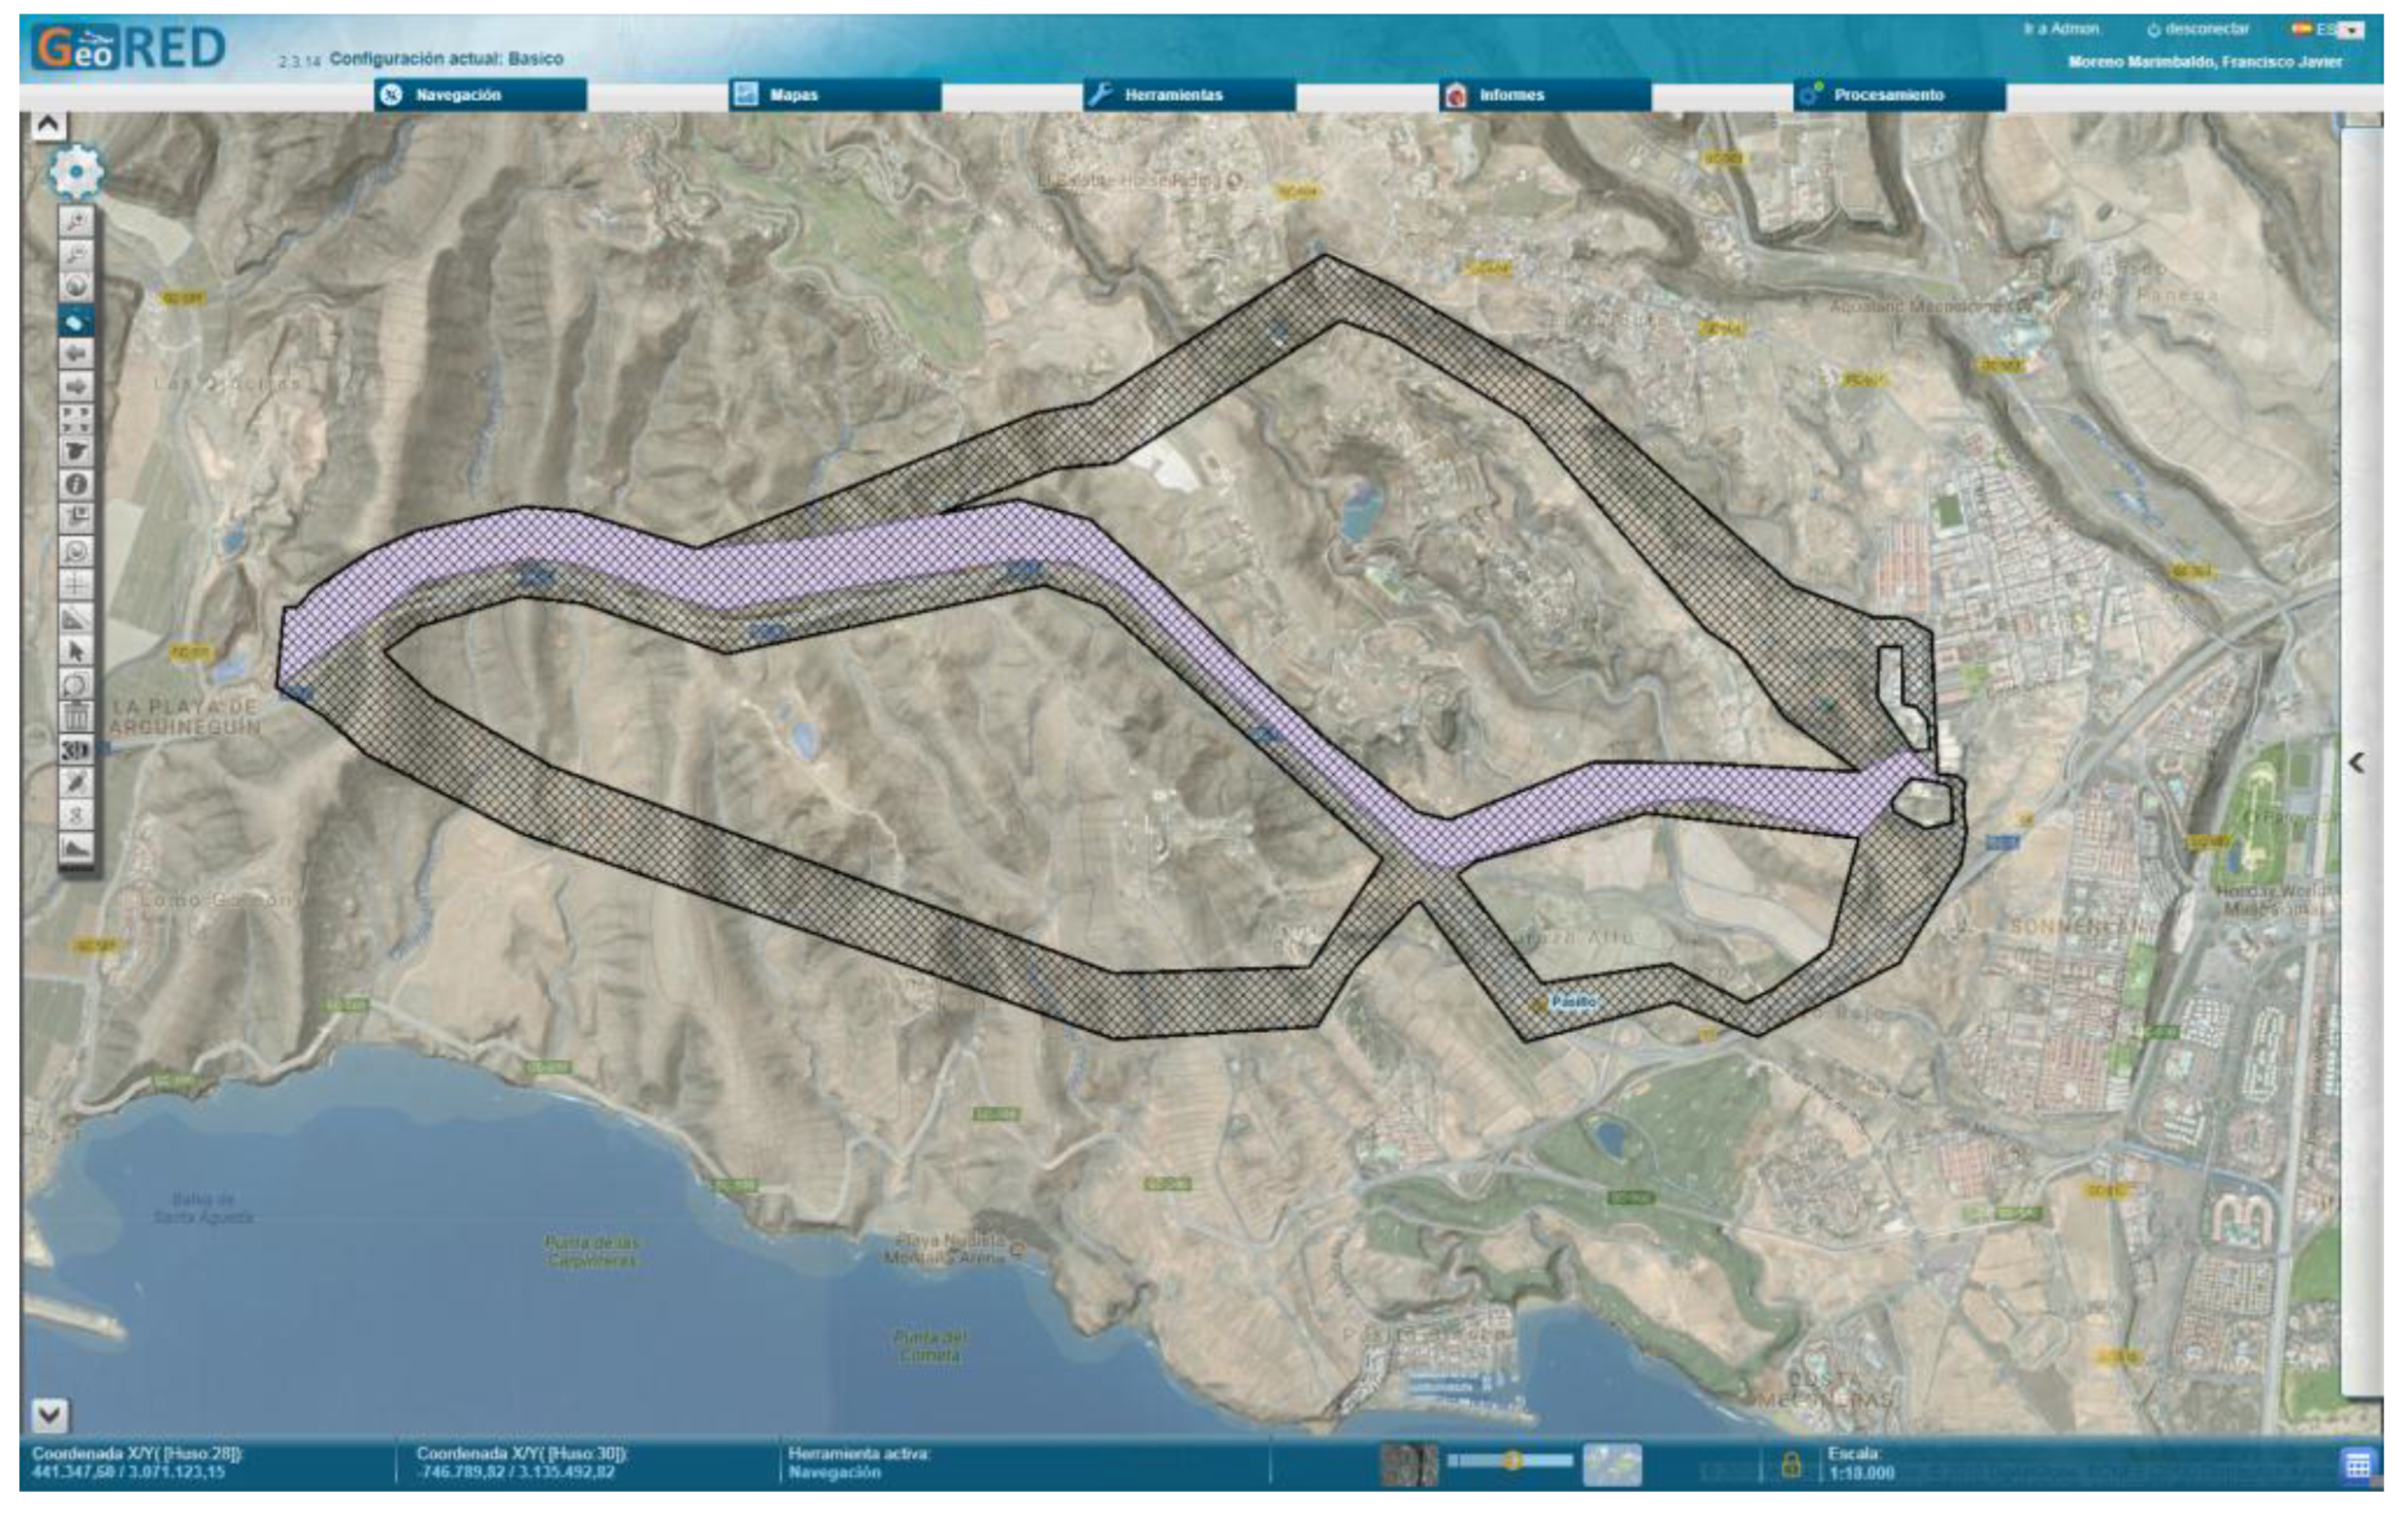
The viable alternatives model proposes different viable corridors based on the territorial restrictions map, and the technician takes the results of the previous models into account when defining the three finalist alternatives by editing (modifying, deleting, or drawing), and selecting the alternative with the least impact. This decision has a high human component and is therefore more subjective and based on experience, which could even qualify any of the alternatives studied. An example of the result of this phase is show in Figure 8.
4.3. Engineering Phase
In taking these steps, we applied the following models:
4.3.1. Scope of Study Model
In order to analyze the GI for each corridor, the data in this model is treated at a much more precise scale, between 1:5.000 and 1:2.000. This information consists of a DEM with a minimum 5 m resolution, the length of the span (distance between two consecutive pylons), the existence of passable roads, and restriction with regards to the location of vertexes and pylons. These preferences and restrictions are largely defined by the geomorphology of the terrain, the aim is to avoid river basins and flood plains, roads and corresponding easements, areas that are difficult to access with self-propelled machinery, cattle routes, or any other restriction that the technician in charge may consider relevant.
4.3.2. Alignment Model
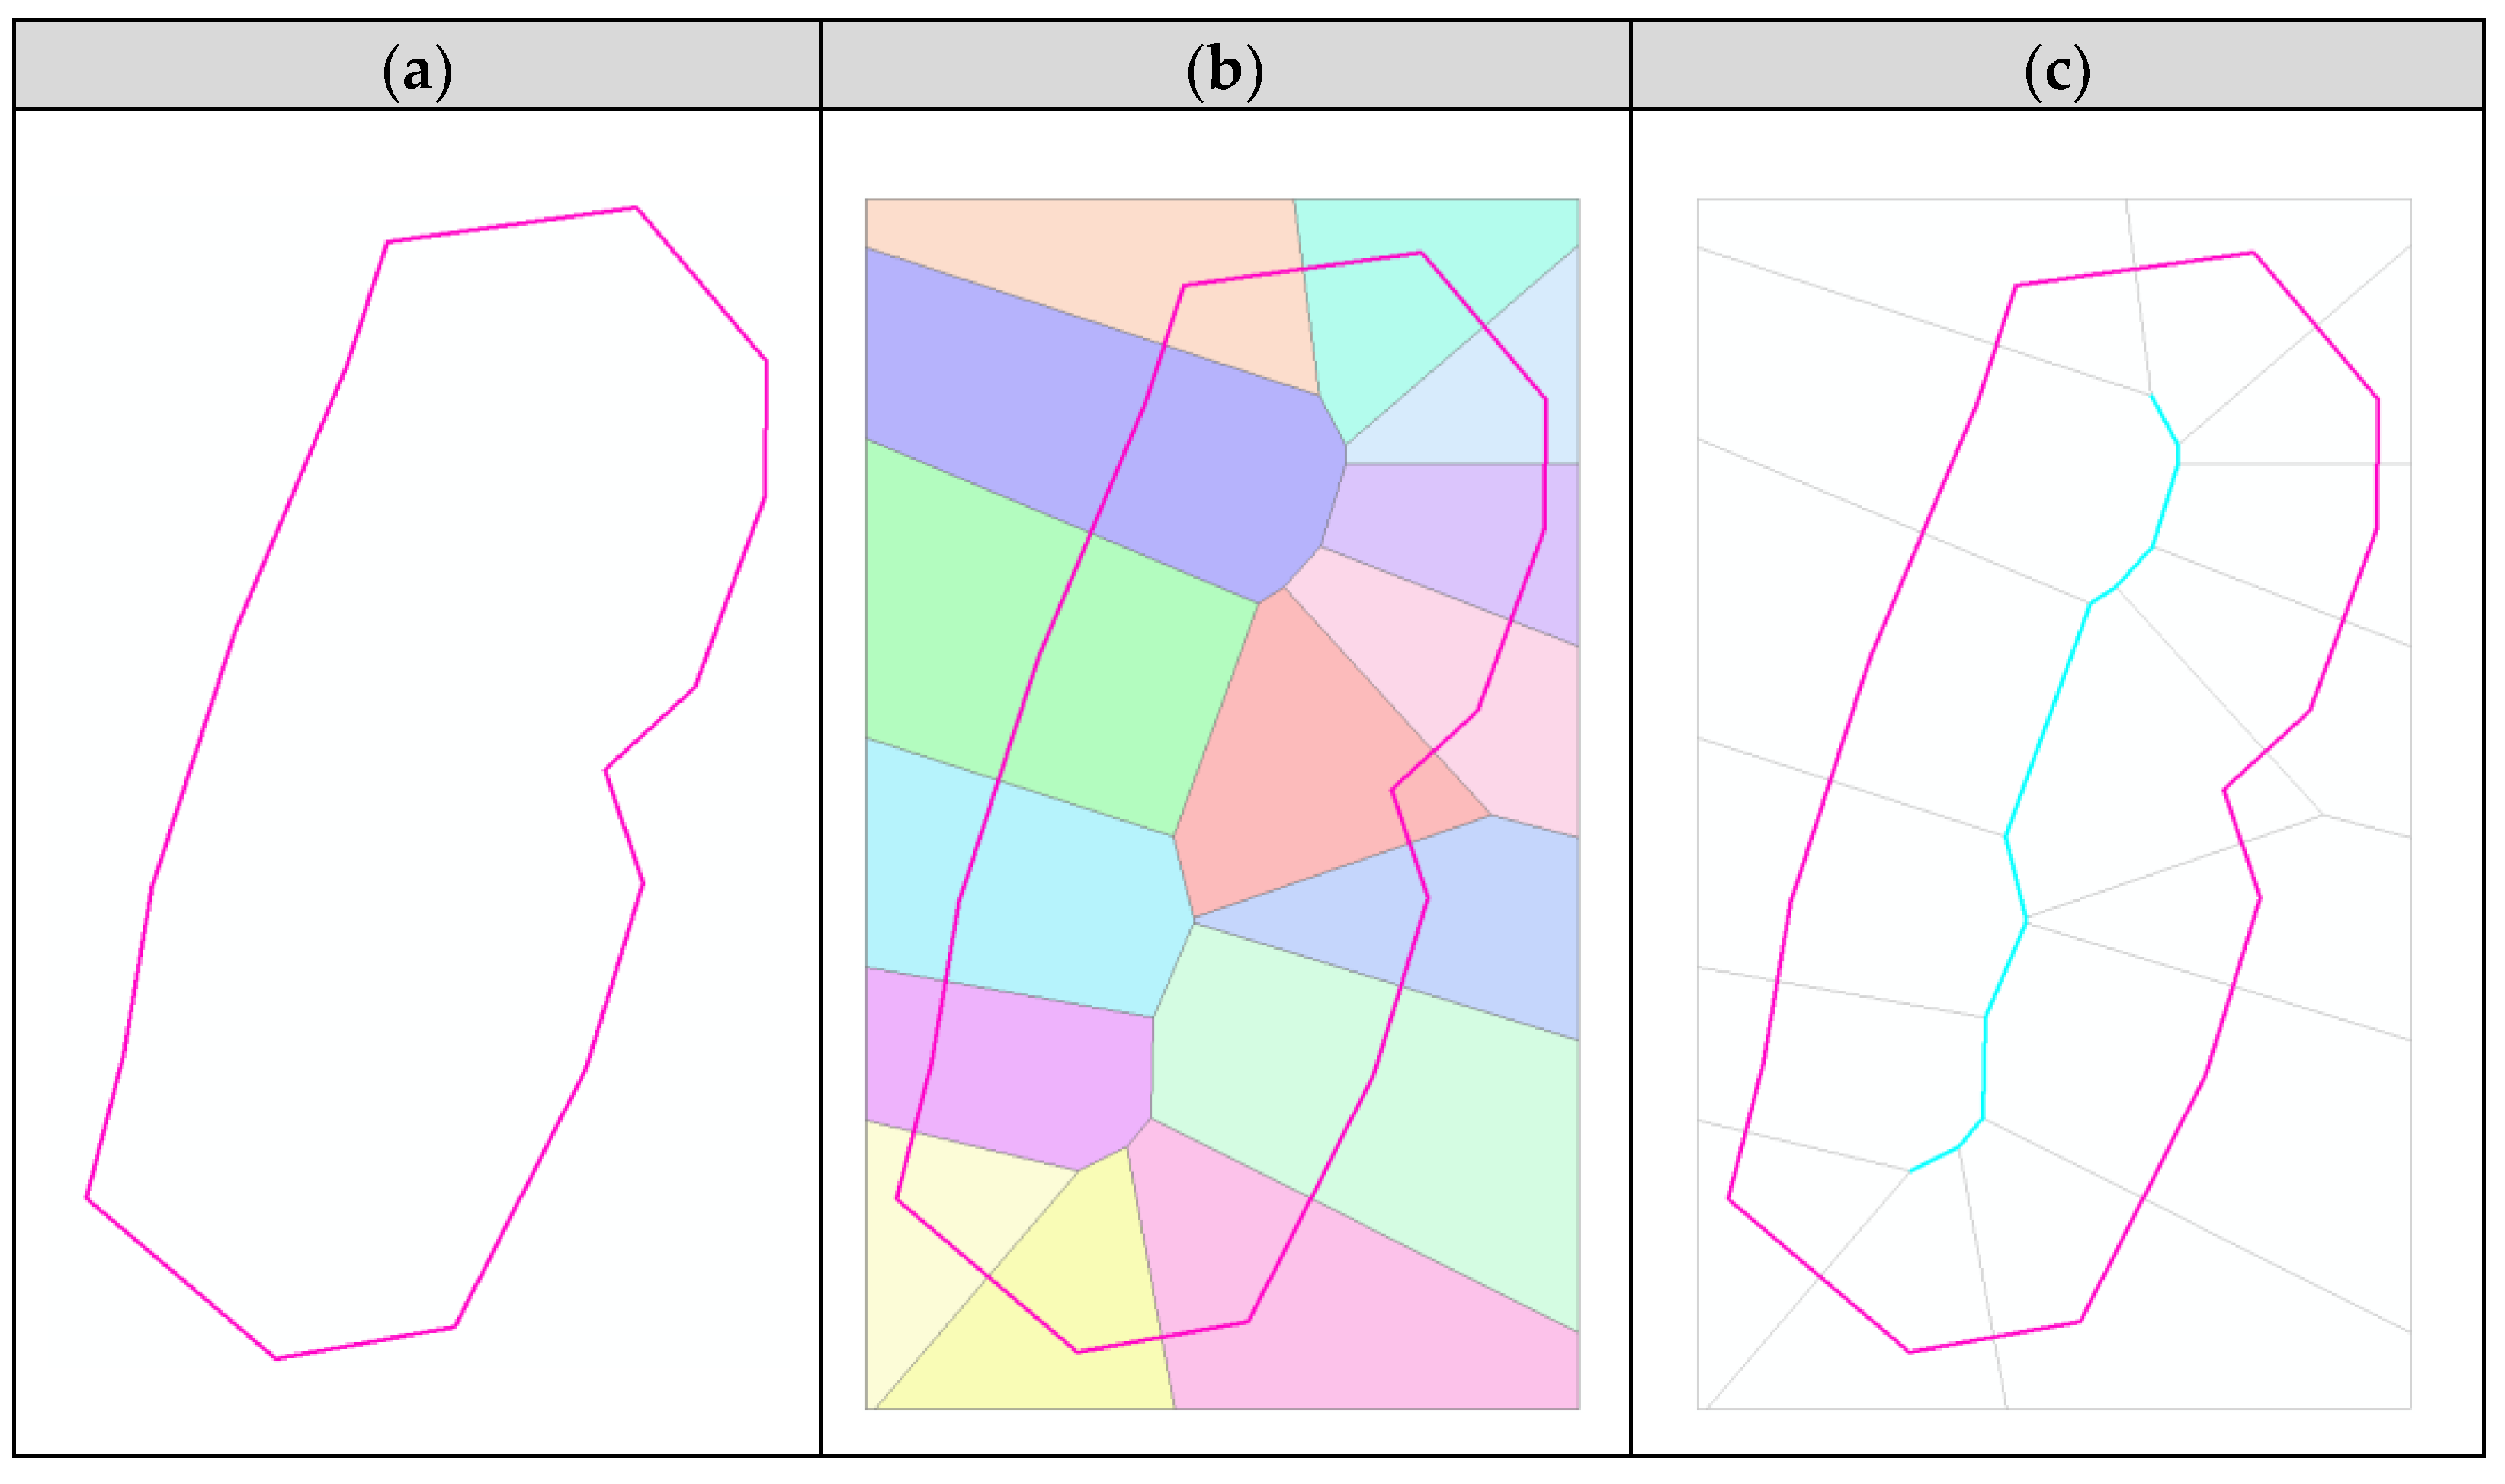
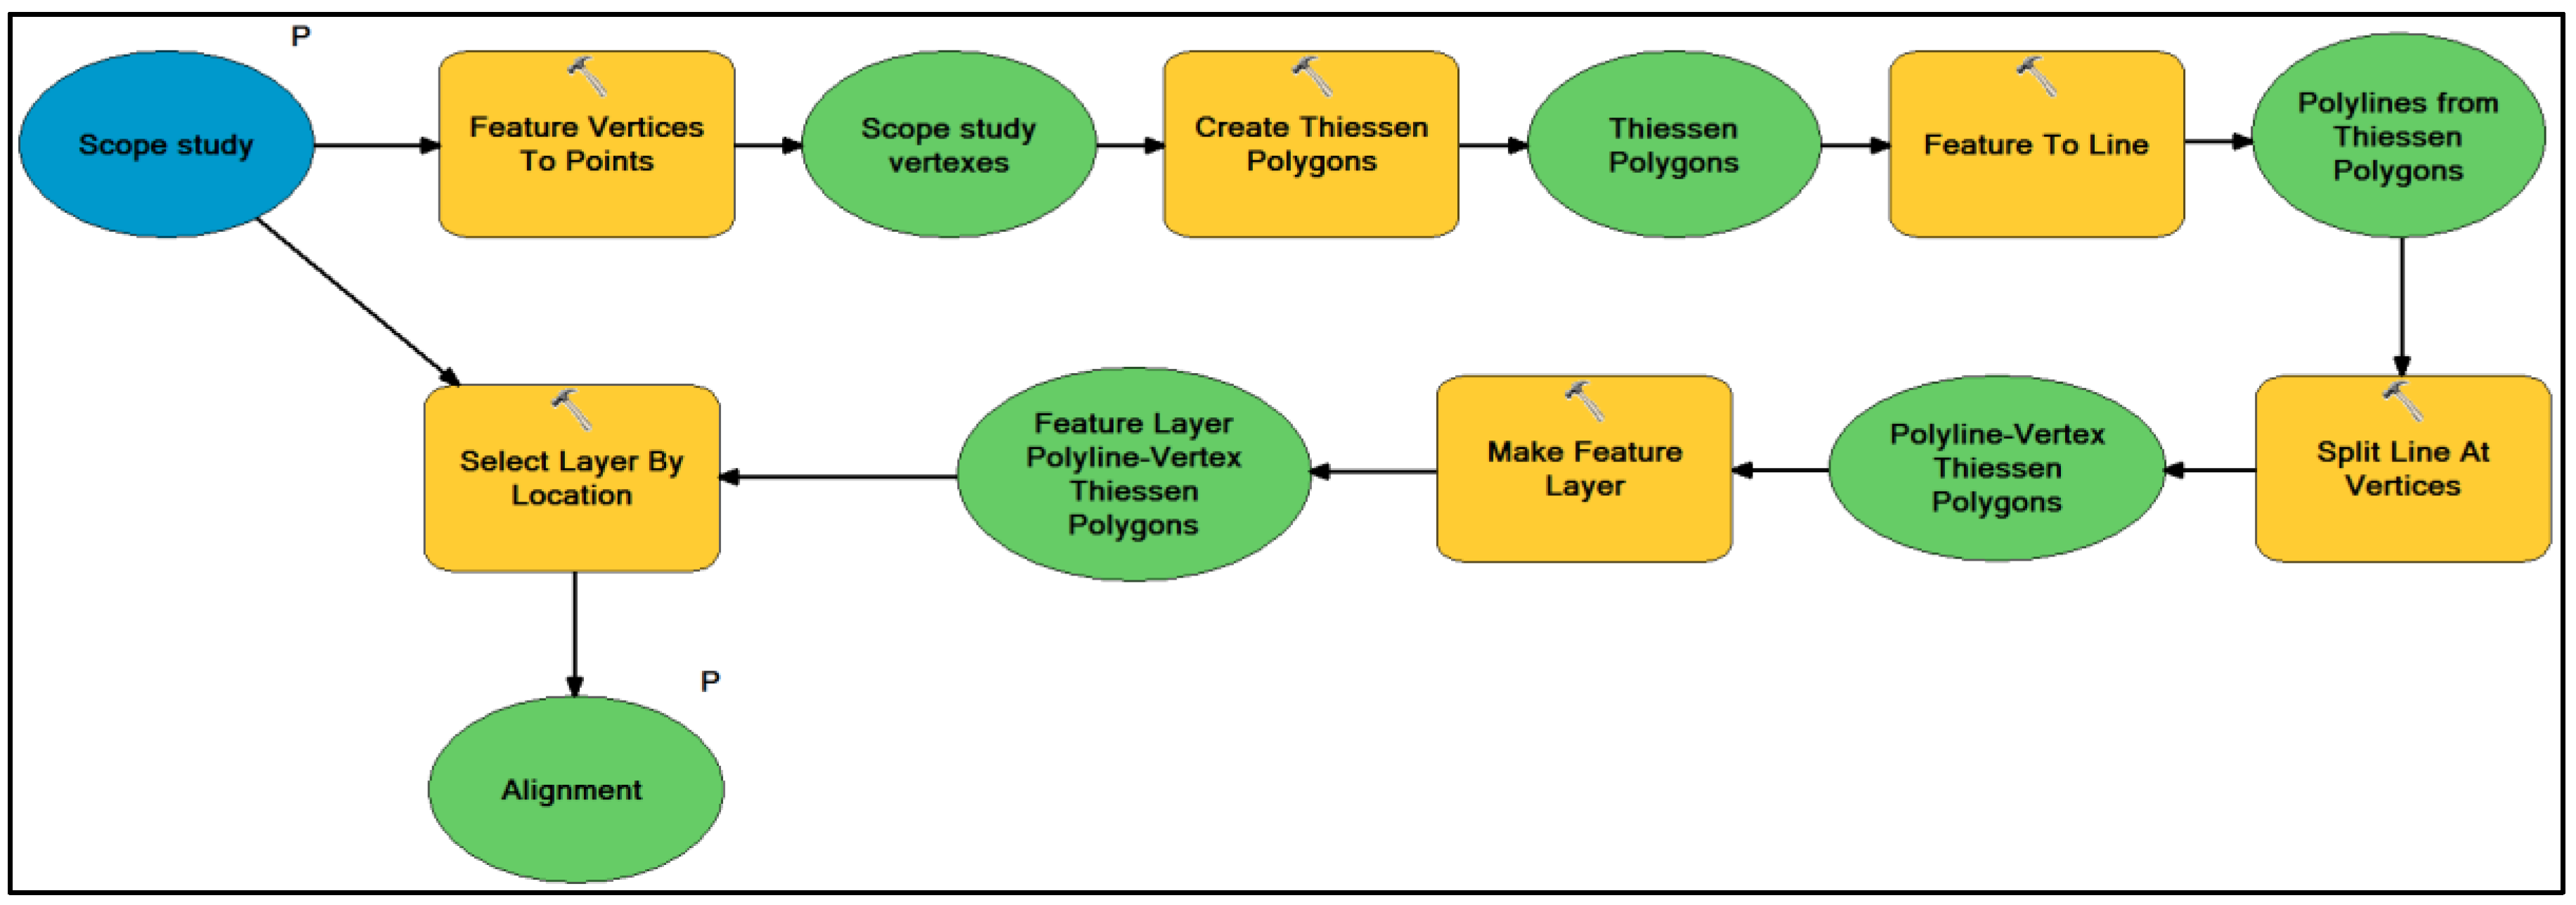
This model automatically generates the axis of each alternative corridor. This proposed axis is the point farthest from the boundaries of the corridor, the aim being to ensure that any possible effects of the movement of conductor cables by cross winds or of the layout of future pylon access roads are kept outside the corridor. In order to calculate this, the model used to propose the axis or alignment generates the vertexes that delimit the corridor’s polygon. These vertexes are used to generate the Thiessen [49] polygons (see Figure 9) and, after converting them to polyline, the lines that fall wholly within the area are selected.
Figure A3 of the Appendix A presents the geoprocess that generates the alignments.
This proposed axis is used to carry out a guided field visit and may be modified depending on any constraints found on the ground that were not registered in the GI used to make the initial analysis.
4.3.3. Pylon Distribution Model
Once the alignment has been established and its environmental viability agreed upon, a pylon distribution proposal is automatically produced. The automation was carried out using PLS-CADD software [50]. Without going into detail yet as far as the electric and mechanical aspects of the future HVTL, the software used in the model requires the following input data: a 3D topography, the proposed alignment and location restrictions for the pylons (including roads or paths, hydrographic networks, or any surface the technician in charge may deem it convenient to restrict), generating a proposal for distributing the pylons. This proposal should be verified in the field and modified if necessary.
4.3.4. Effects Impact Model
In the study of alternatives phase, we have considered how a new HVTL could impact the environment and landscape. In this phase, we used a more precise work scale to calculate the geometry and the exact location of all impacts. Once the final pylon distribution has been determined, we can go on to calculate the effects of the future HVTL, which may be permanent or temporary (during construction).
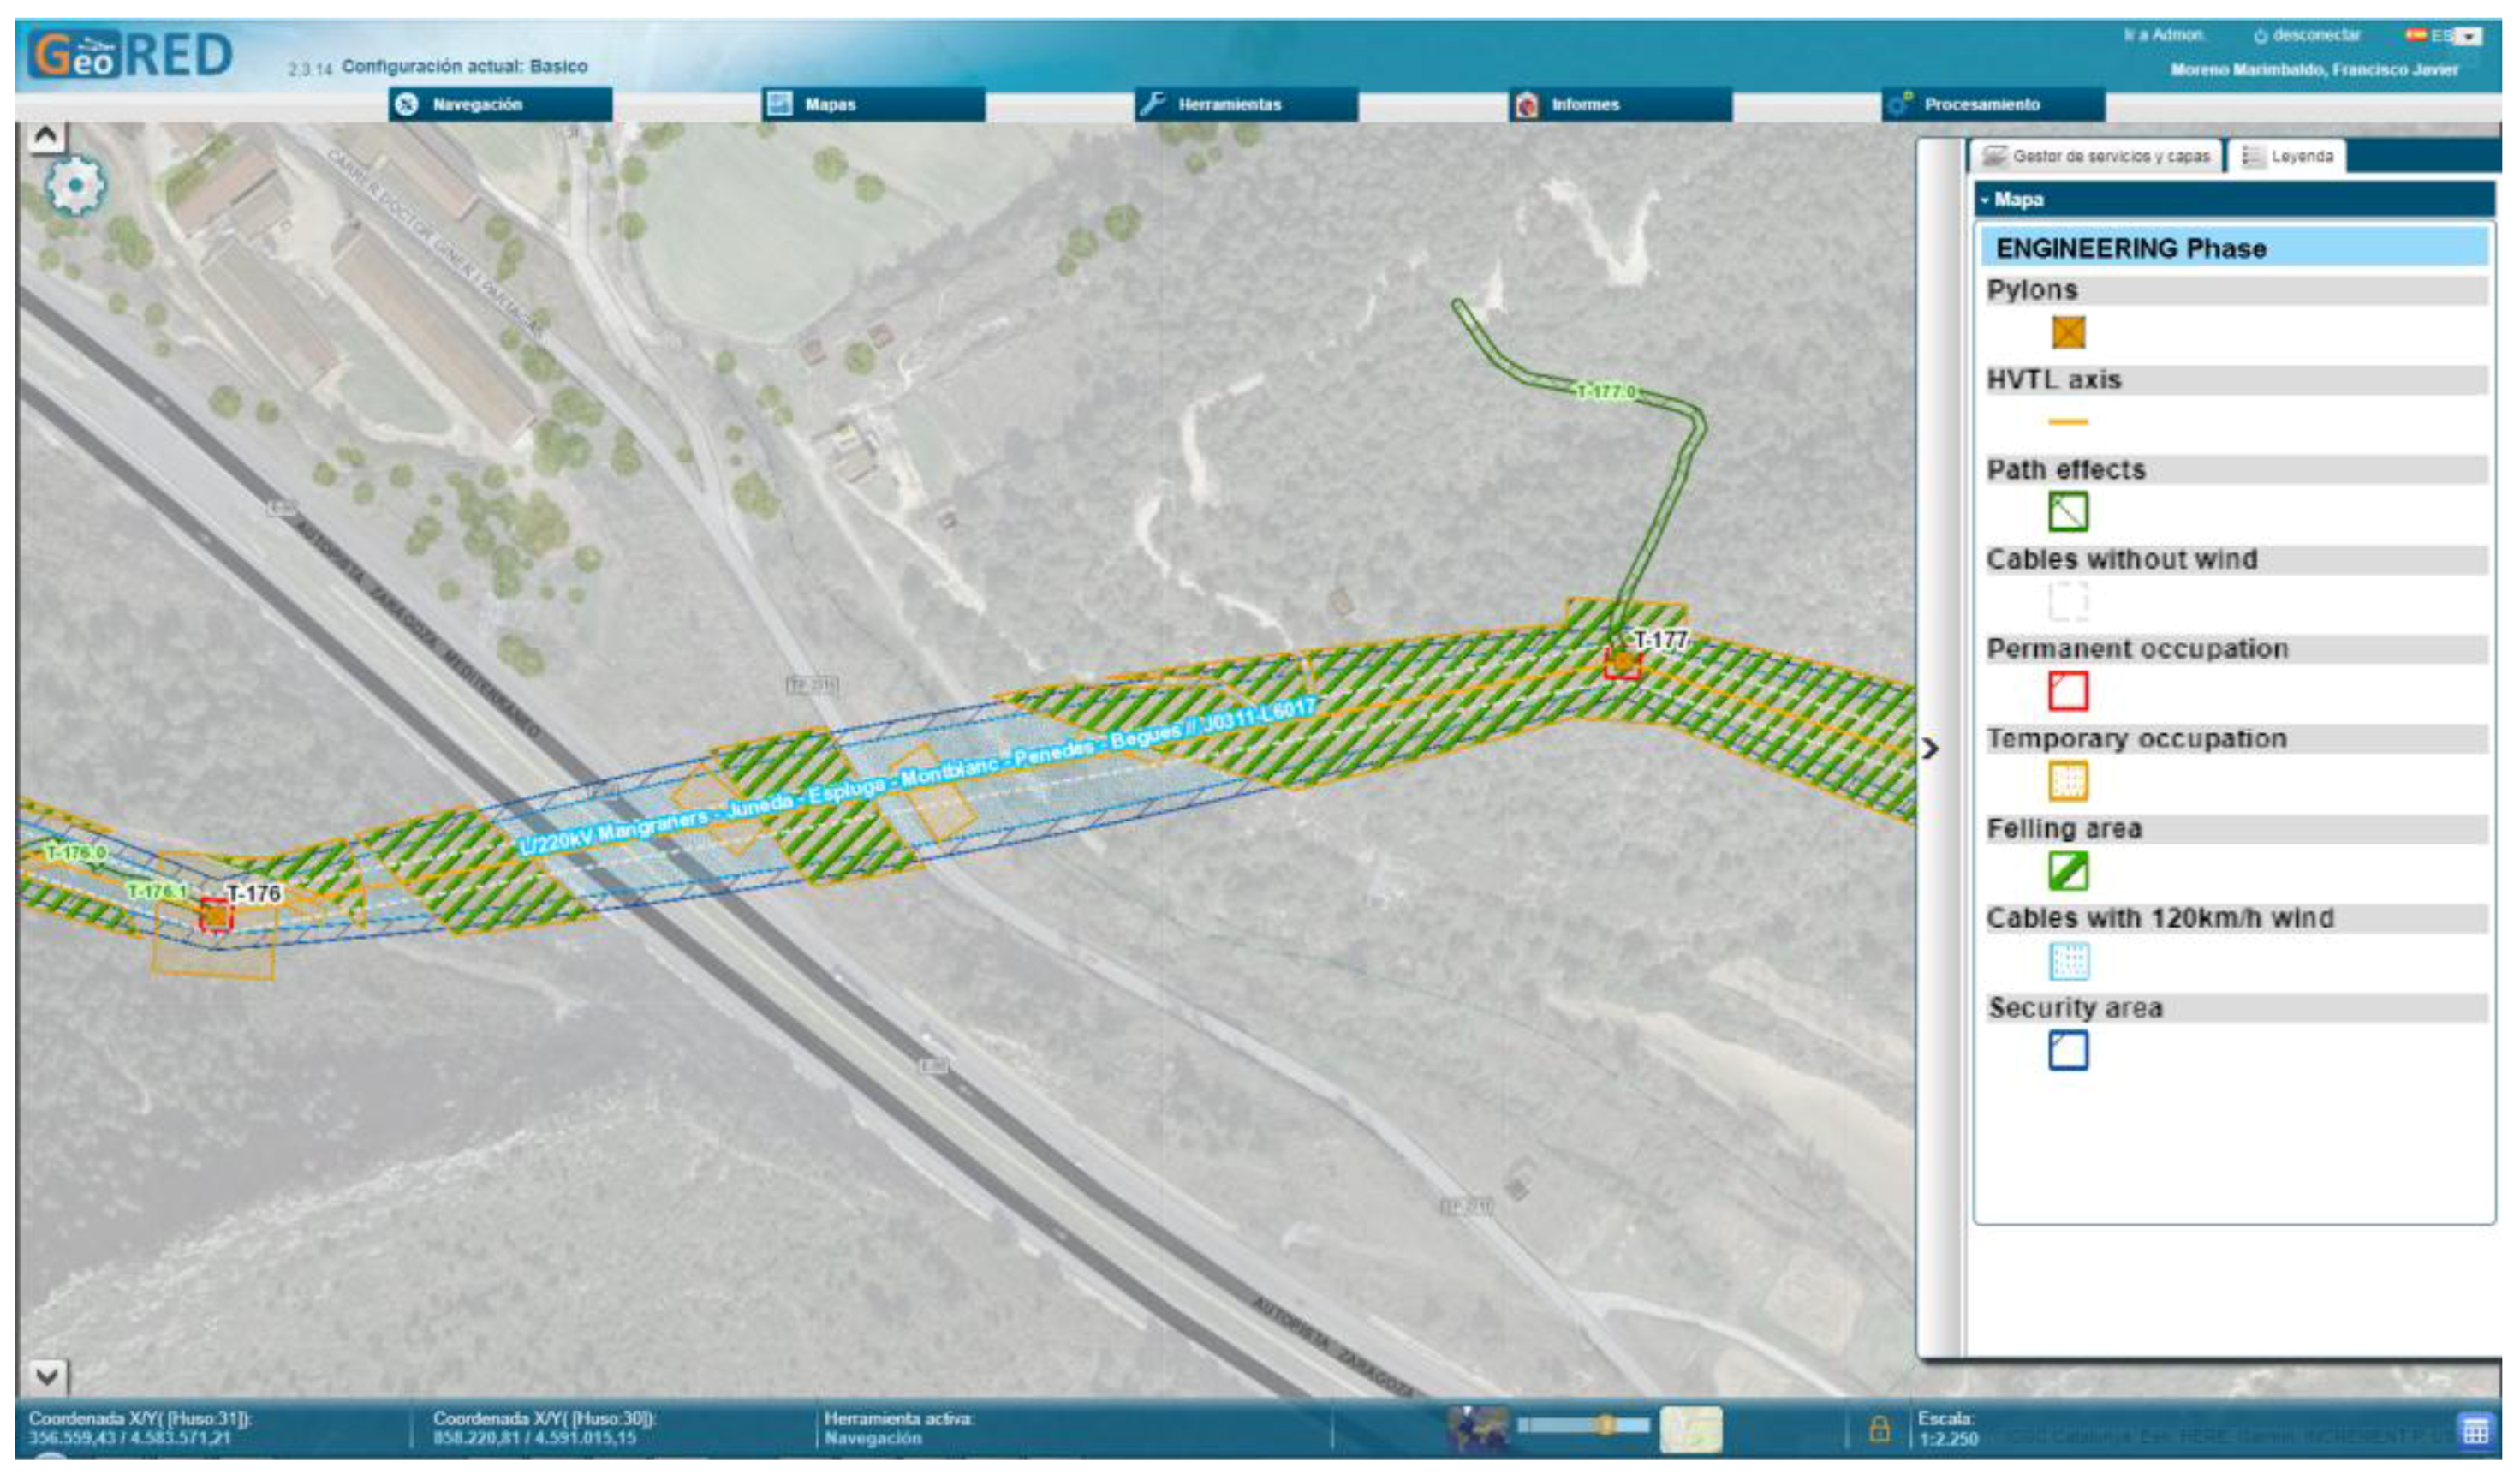
These permanent effects represent the land occupied after construction: pylons, aerial layout, felled trees, and blowout based on a hypothesis of extreme 120 km/h winds perpendicular to the HVTL layout. Each type of condition entails a type of action, and, in some cases, may modify the affected territory. In other cases, it may entail a right-of-way or fly-over rights for electric cables that bar construction underneath.
The sum of these affected surfaces is automatically calculated and represented, and its result may be seen in Figure 10.
4.3.5. Socioeconomic Impact Model
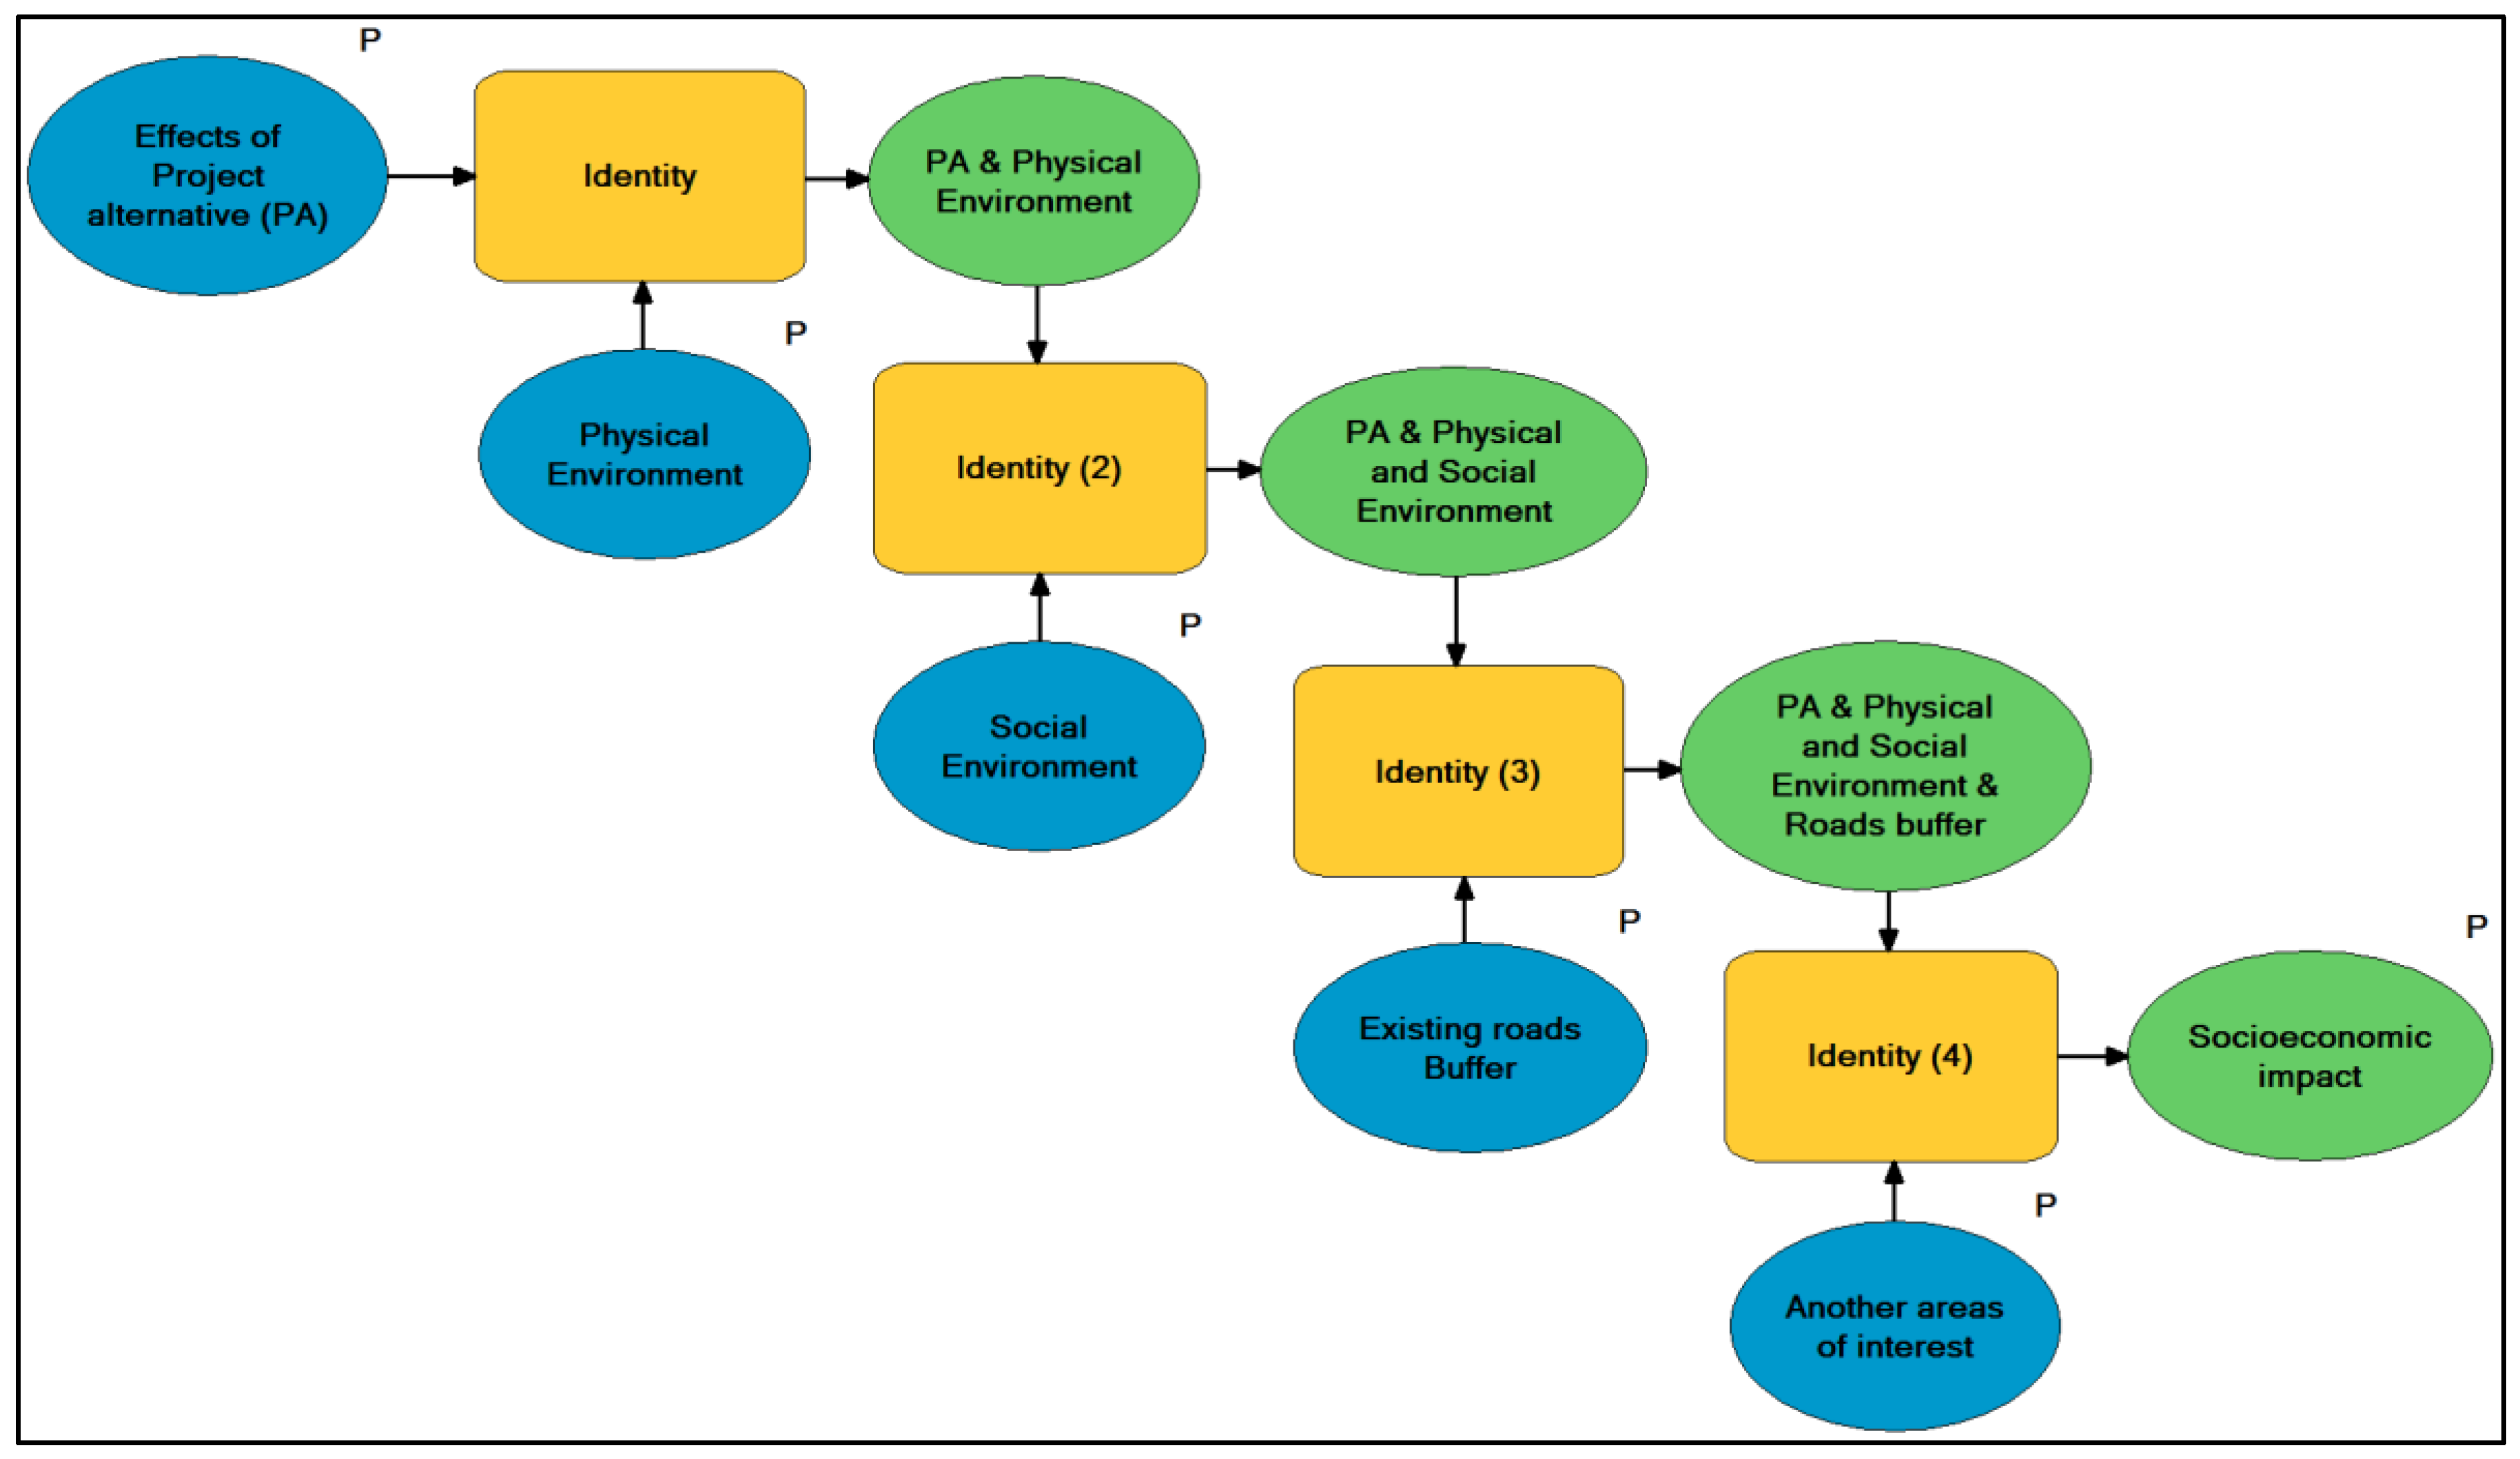
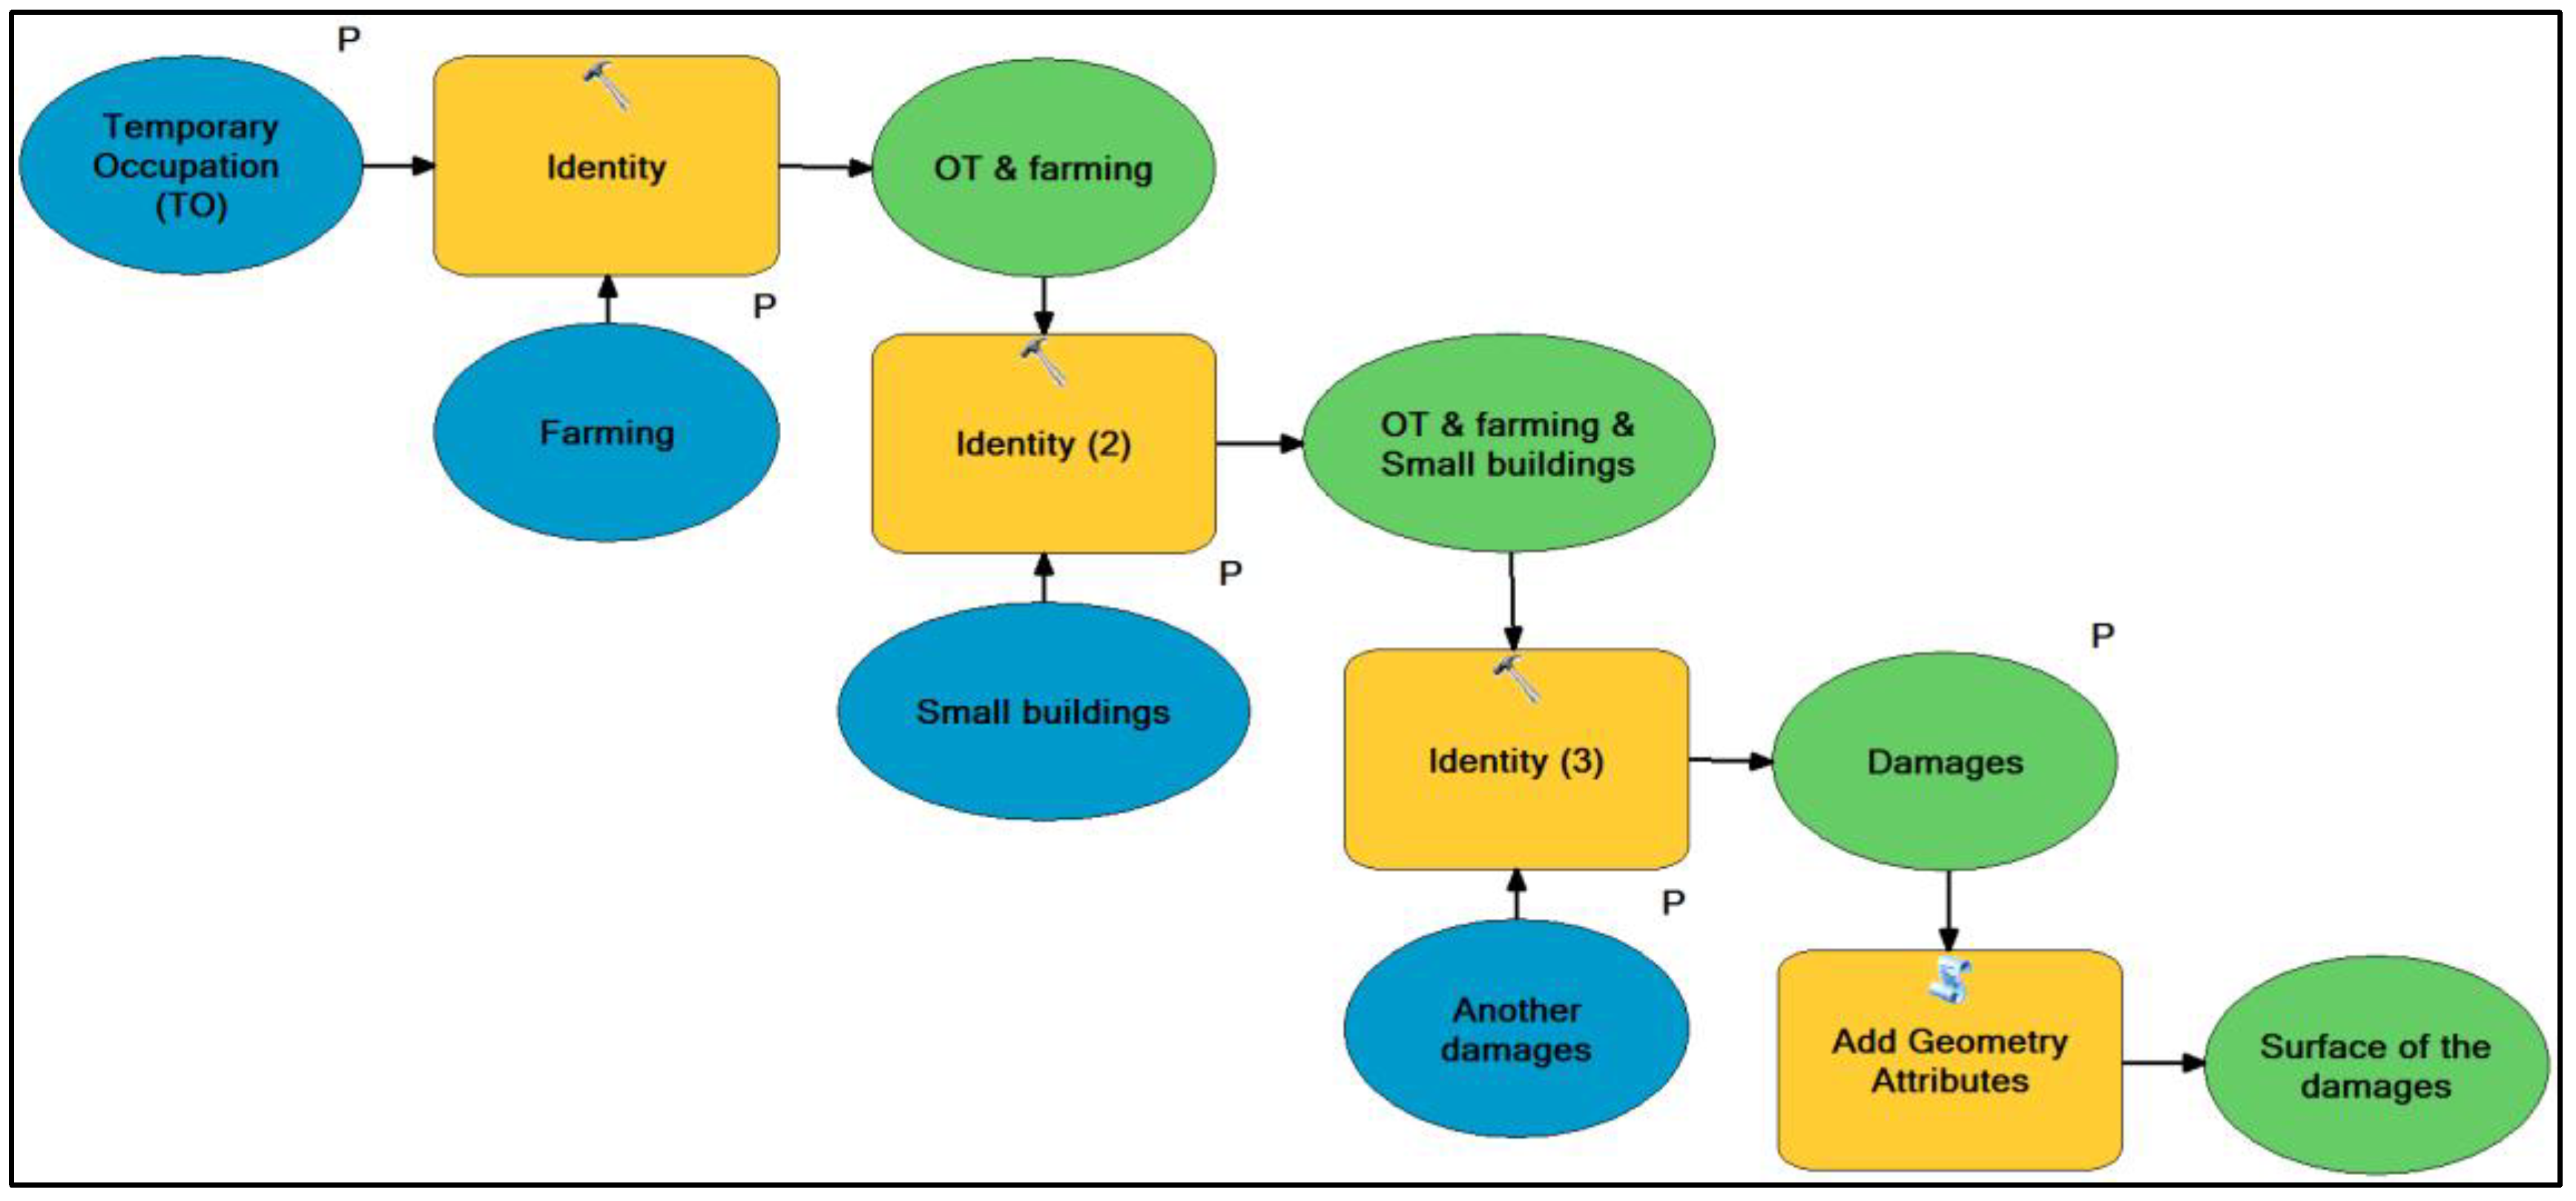
This model quantifies the impact generated by each project alternative on the socio-economic environment in the territory it traverses, and the idea is to produce cross-comparisons with existing socio-economic constraints. These constraints have already been taken into account in the study of alternatives phase and may be categorized as affecting either the physical or the social environment. Worth noting among them are those constraints related with economic activities in the area, including tourism. The public road network is also taken into account. REE performs a spatial analysis of the effects of the future HVTL within each stakeholder’s area of influence. The geoprocessing to be applied in this model is represented in Figure A4 of the Appendix A.
This model uses the “identity” tool in ESRI ArcGIS [51]. This tool maintains the alternative geometry analyzed and becomes increasingly detailed when cross-compared with the socio-economic constraints themselves. As the geometry gains detailed, it inherits alphanumeric information describing each constraint, thus, after concatenating various identities, we obtain the magnitude of the effects of each alternative on each constraint.
The model is applied to the entire alternative project, and the result obtained is the surface affected with each constraint, which makes it possible to compare the project alternatives with each other.
4.3.6. Visual Impact Model
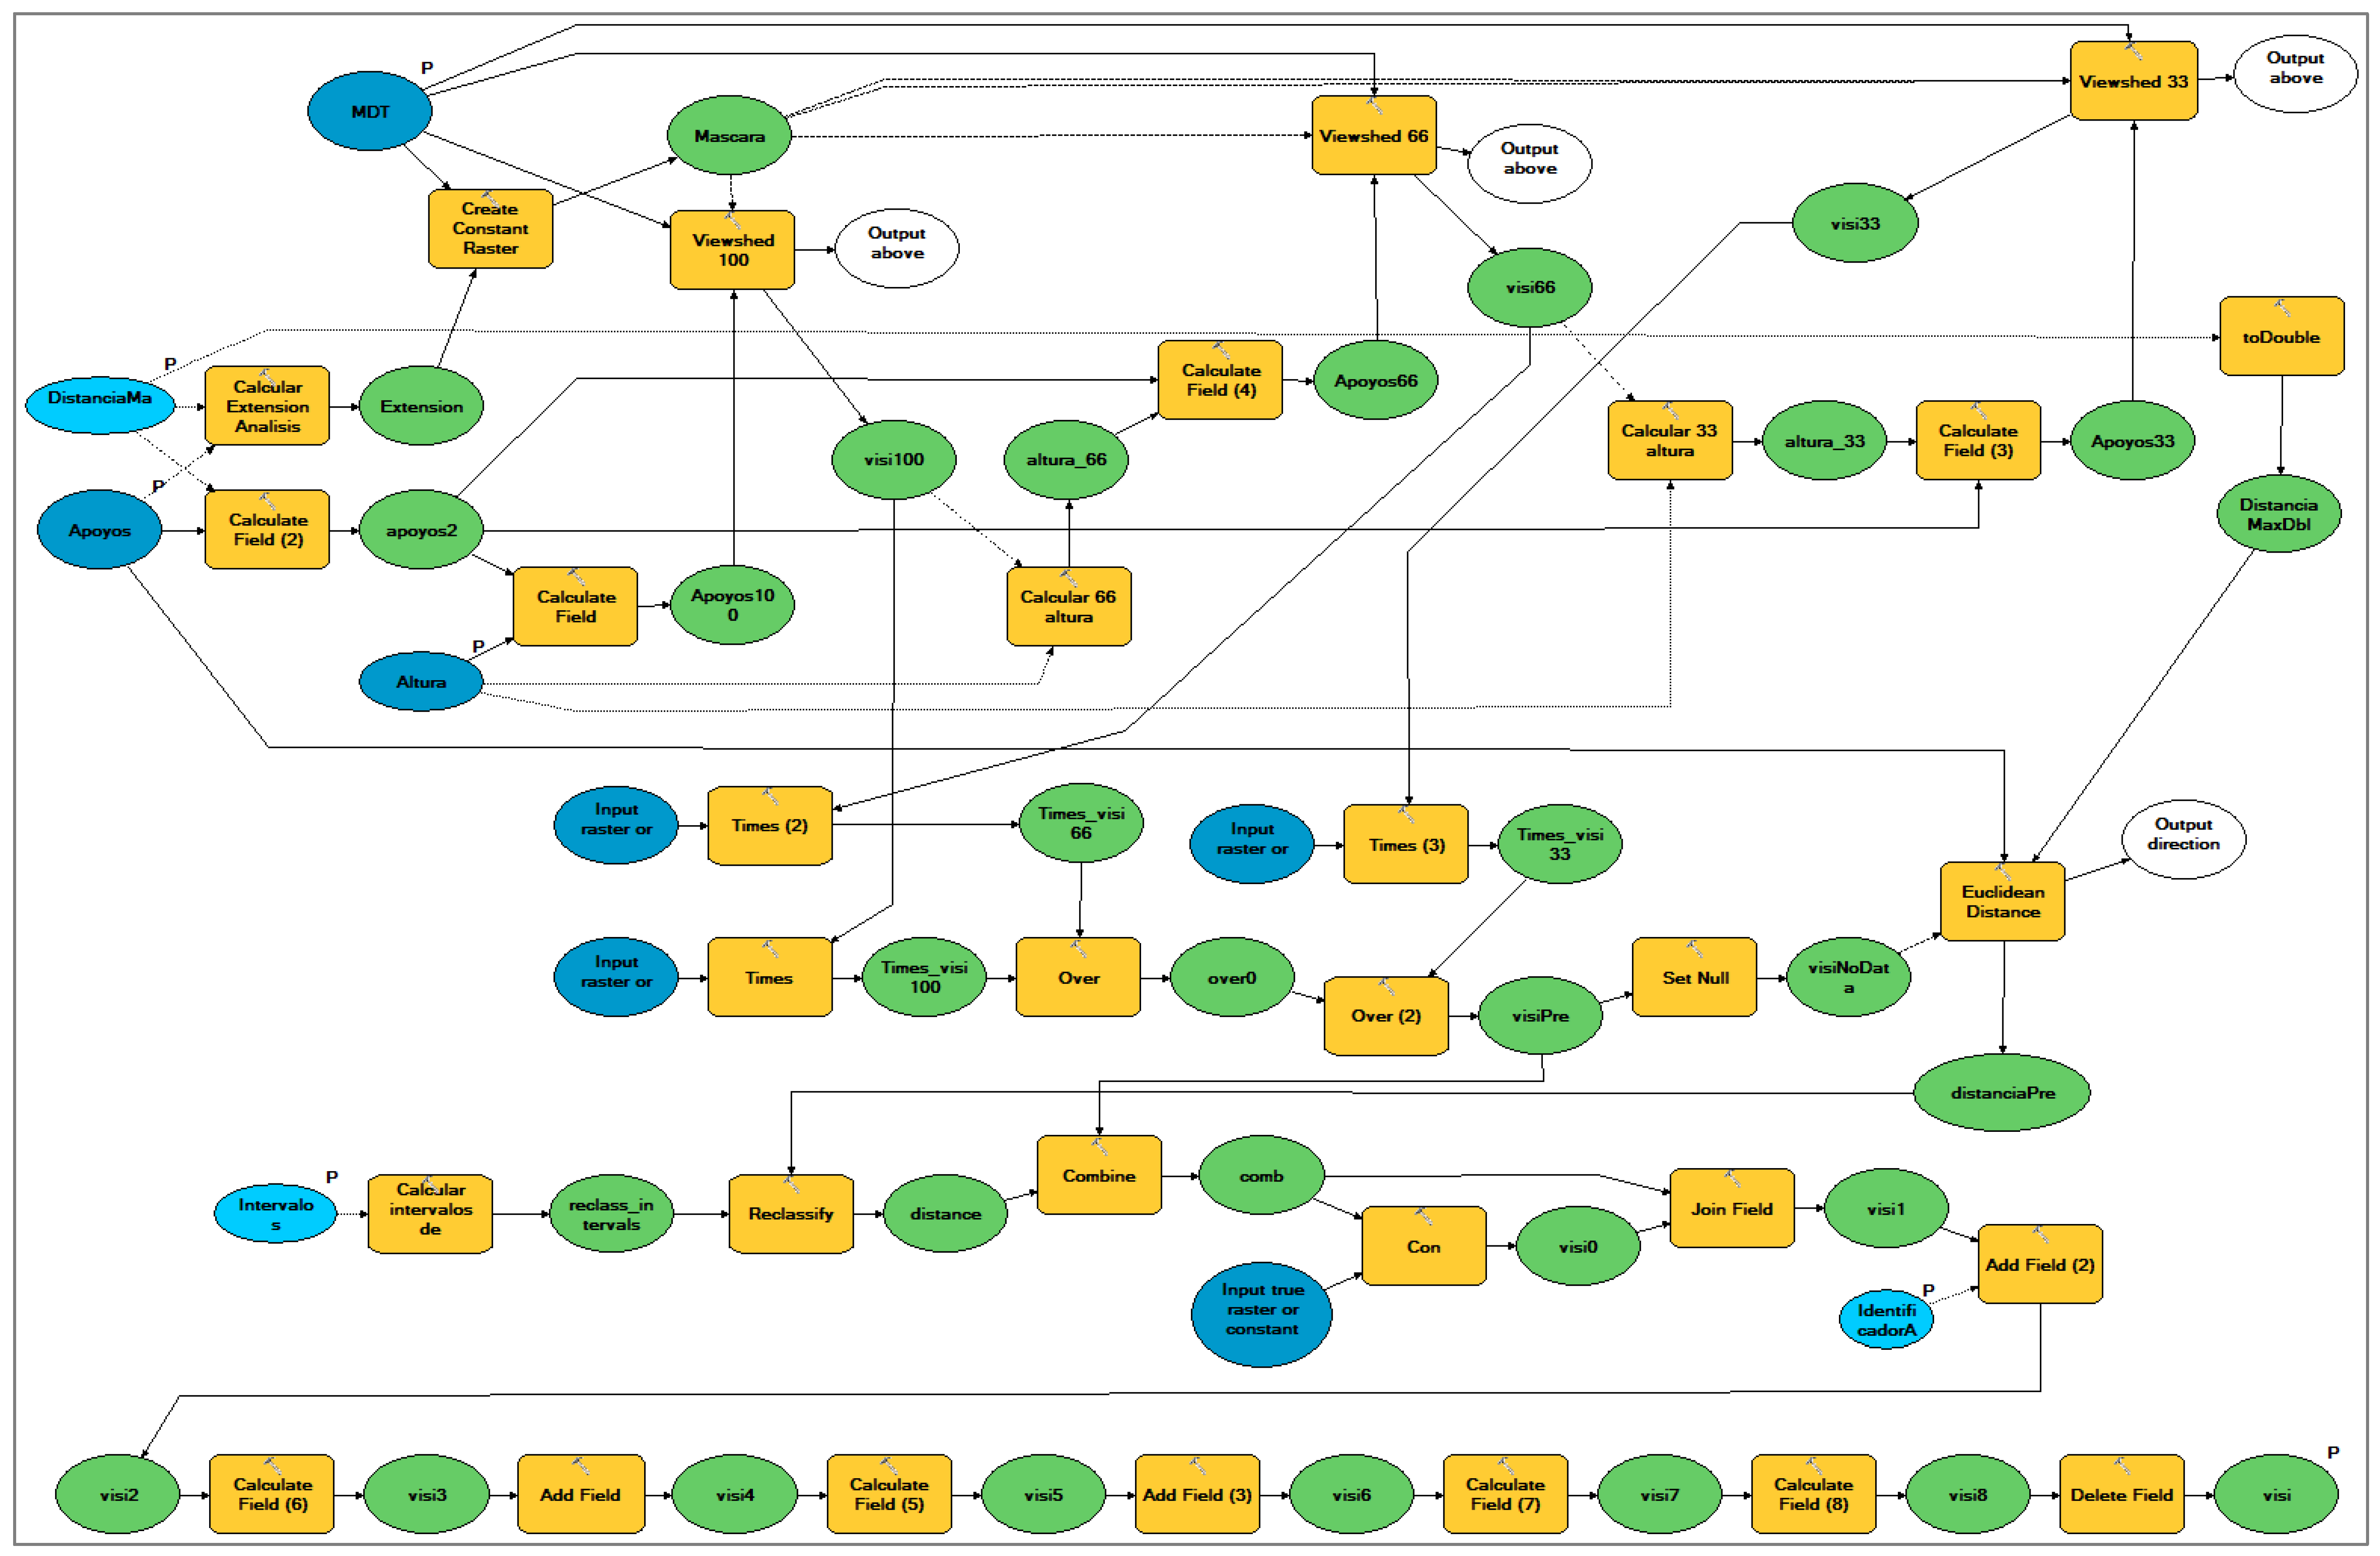
The visual impact model analyzes the visibility of the pylons, as their visibility has more of an impact than the visibility of conductor cables. The model’s objective is to quantitatively and qualitatively assess the visibility of pylons [52]. Quantitatively calculating the surface area of the view-shed for each pylon independently and as a whole together with the rest of the pylons under analysis. Qualitatively taking into account as weight parameters the distance between each point in the territory studied and each pylon and the visible part of each pylon (top, top-middle part, and complete pylon). The geoprocessing model that automates the visibility study for each pylon is shown in Figure A5 of the Appendix A and is a tool already developed in GeoRED’s corporate GIS.
In brief, this geoprocessing model carries out two fundamental tasks. The first of these tasks is to modify the digital elevation model by adding vegetation as a natural screen to reduce visibility. The second consists of a triple analysis of each pylon, that is to say, calculating the view-shed for each structure as its total height, as 66% of its height and as 33% of its height. This allows us to determine which part of each structure can be seen from any given point of the study area.
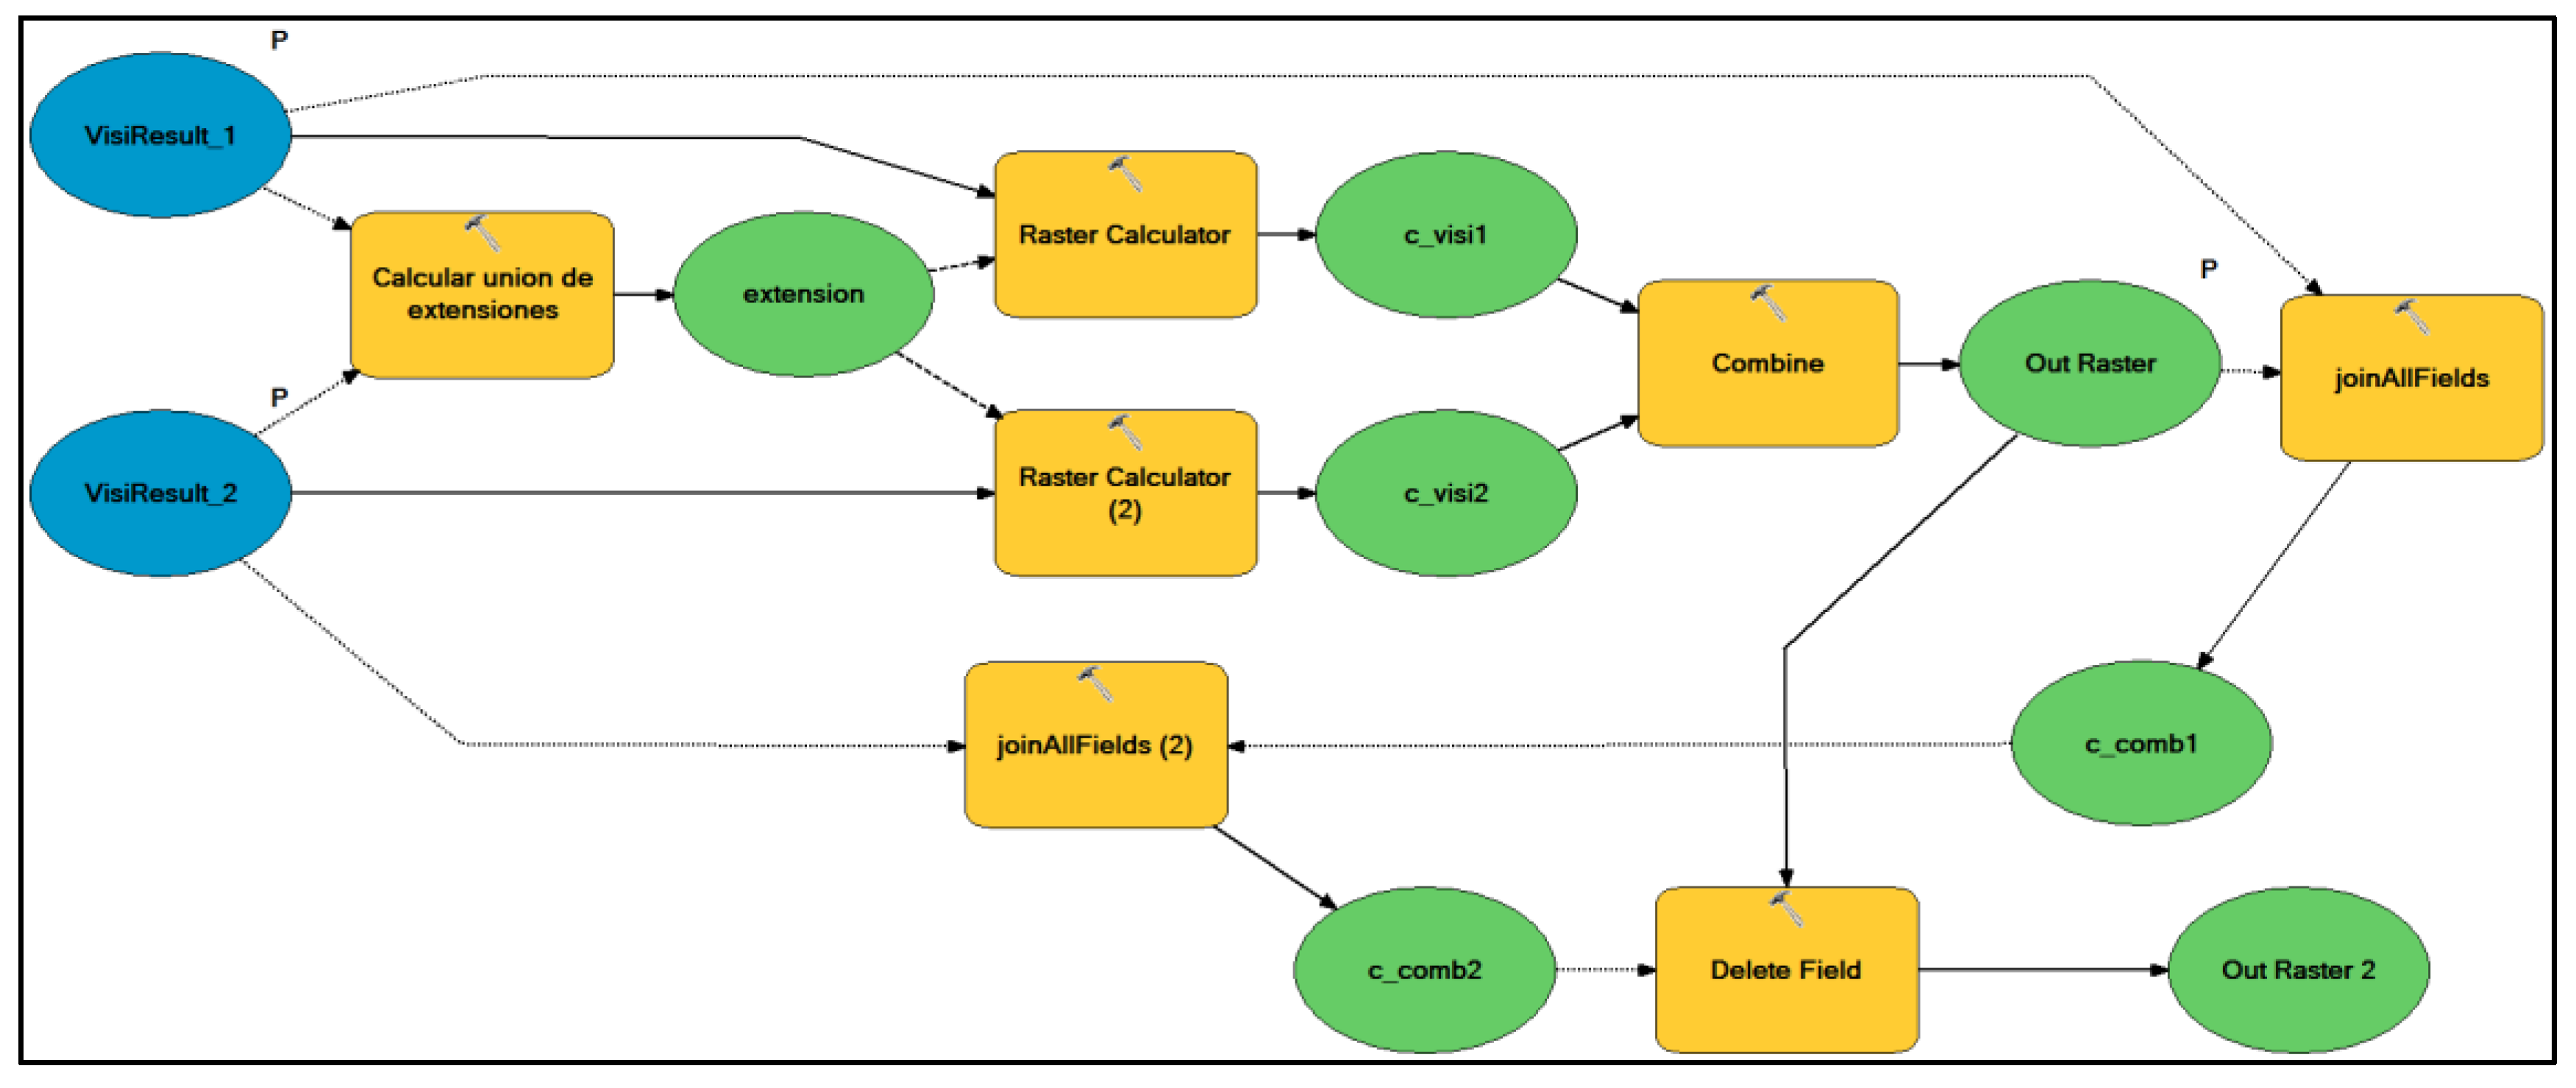
The results of the visibility analysis for each pylon are combined for each alternative. The combined results model is represented in Figure A6 of the Appendix A. This geoprocessing model combines the results of the execution of the previous model. Each point in the territory is thus assigned the alphanumeric information from the visibility analysis for all the pylon considered, producing as a result an analysis of each alternative.
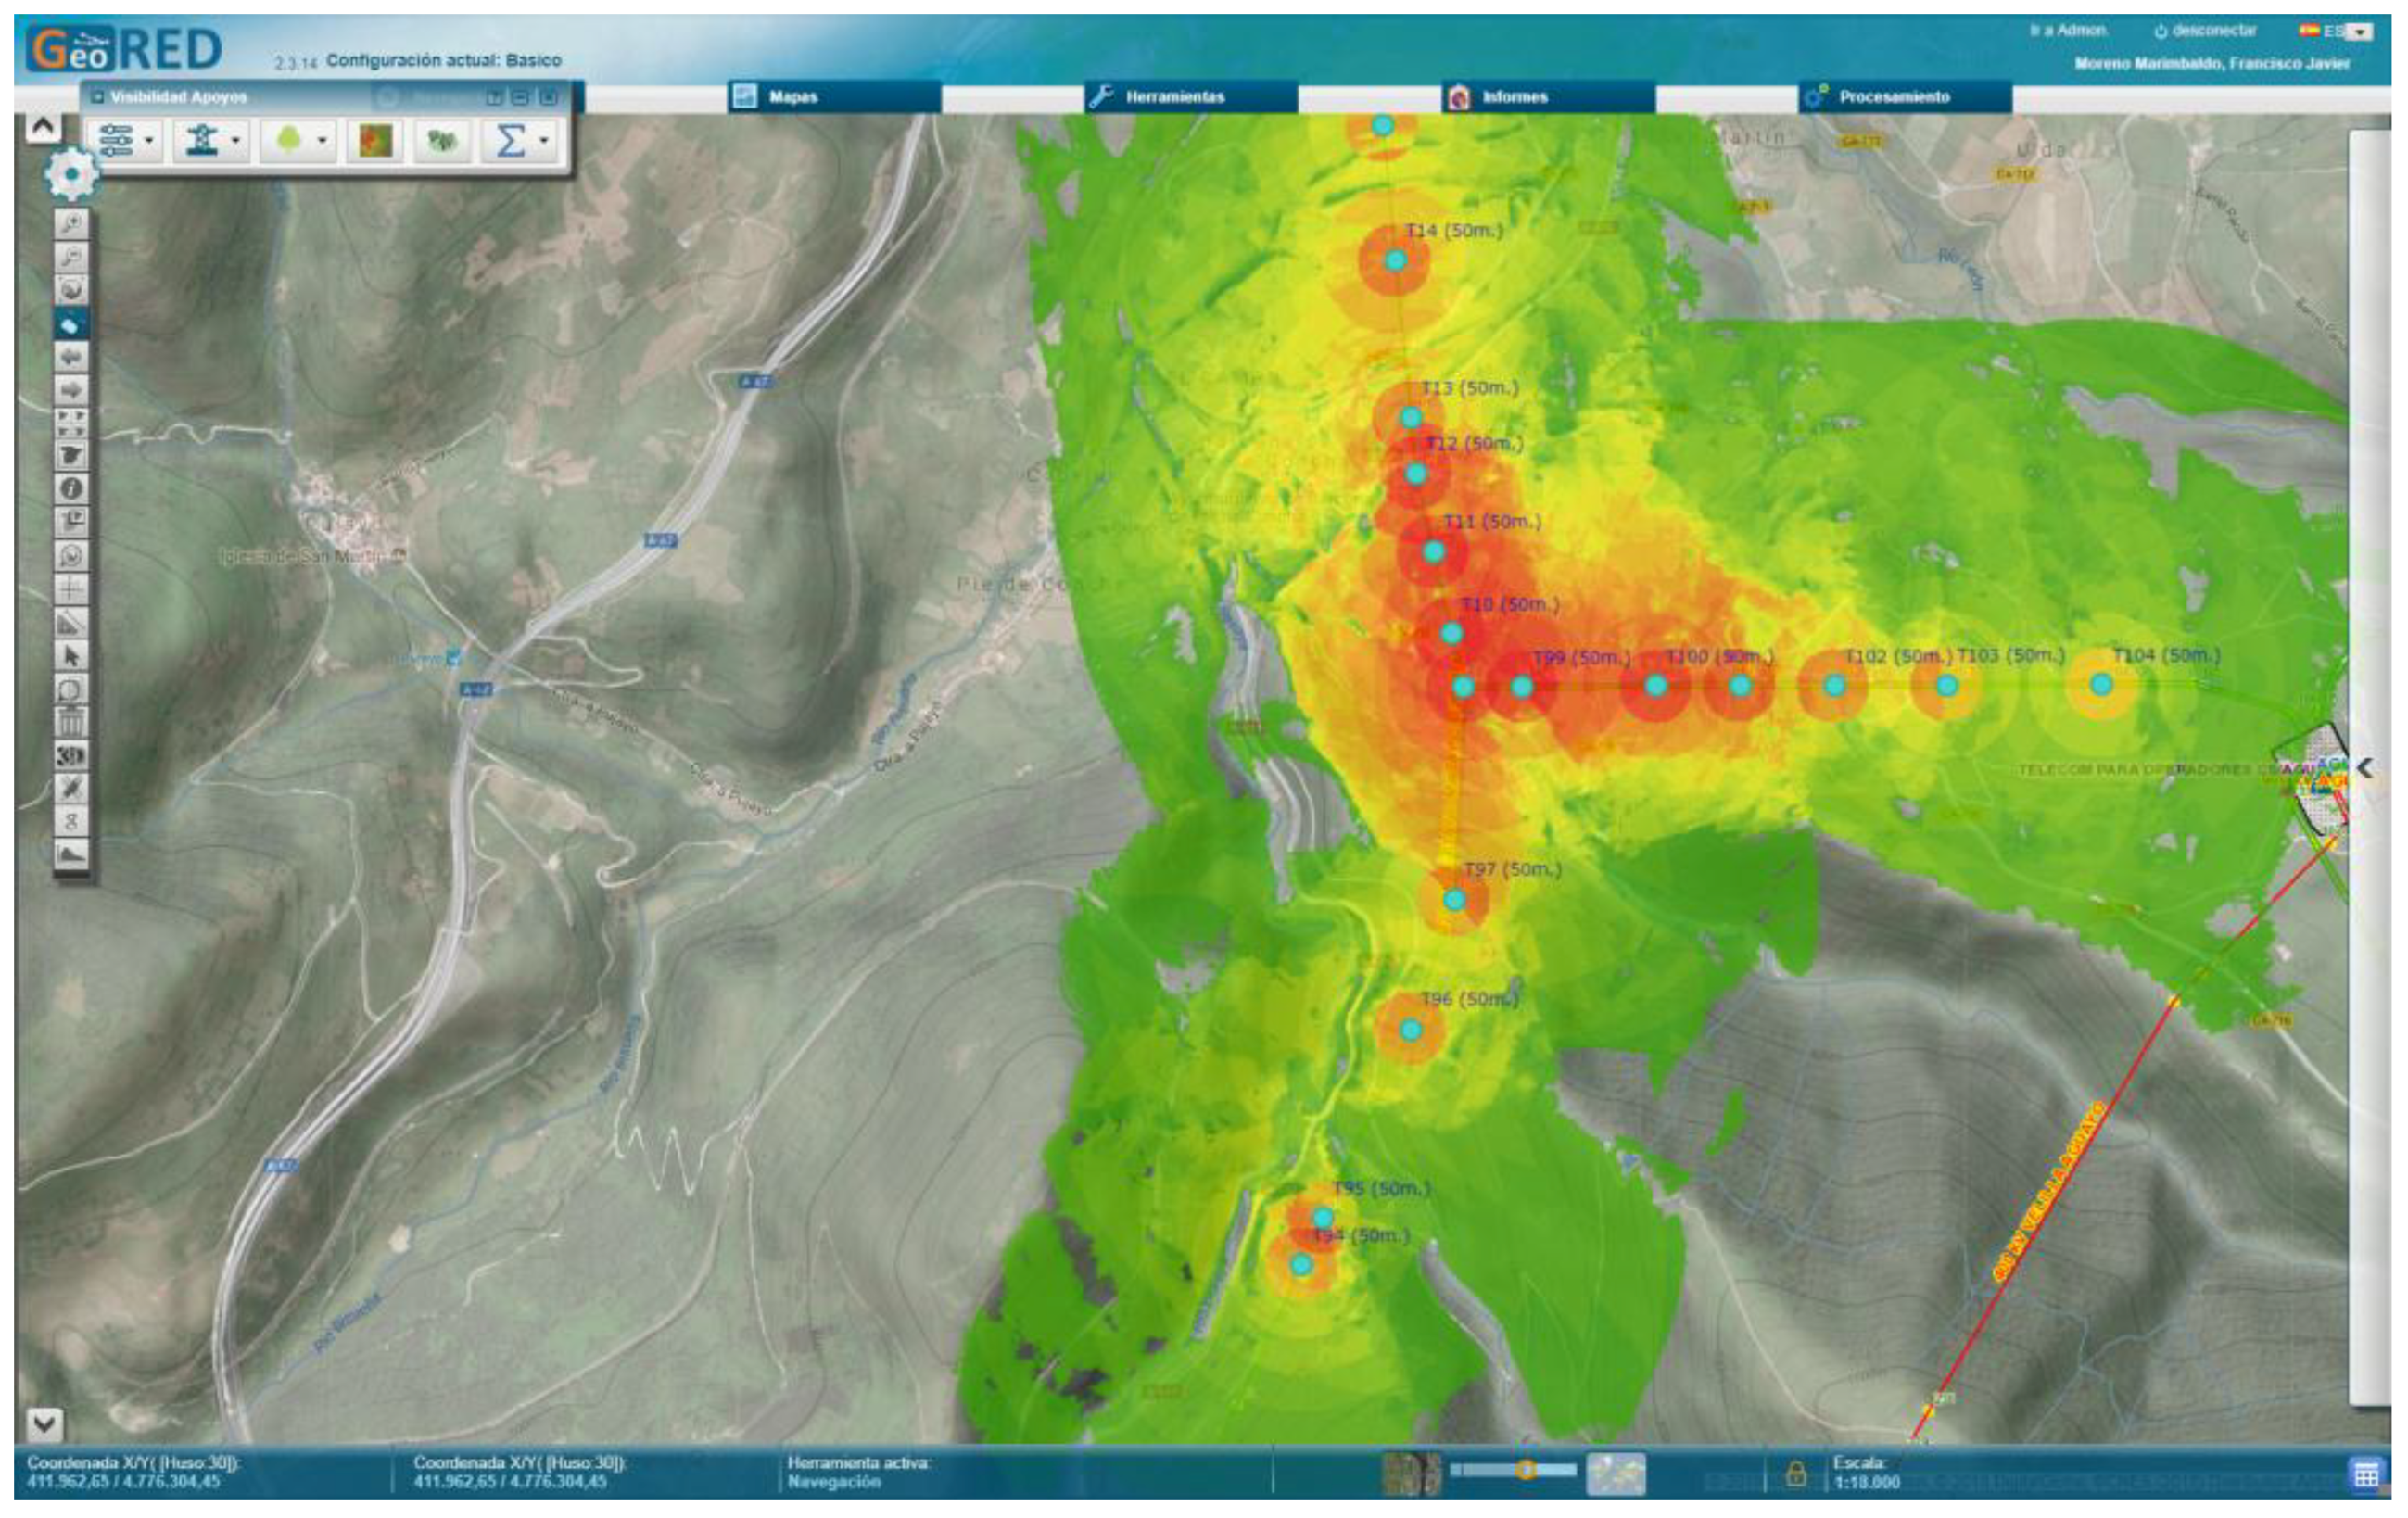
The specific results for a given study area are defined by the following attributes: the number of pylons that can be seen from that point, the distance at which each pylon lies, and the part of each pylon that is visible. The importance of visibility is directly associated with the weight attributed to the distance from each pylon and its visible part. Figure 11 presents an example of the results of applying this model.
This figure shows the visibility analysis for the 17 pylons highlighted and the specific visibility at one of the points analyzed, indicating the specific visibility of the 17 pylons.
4.3.7. Decision Model
This model compares the three alternatives by analyzing the results of the alignment calculations, their lengths, the distribution and visual impact of the pylons, the complexity of accessing the pylons, and the impact on the socio-economic environment in the area for each alternative.
The decision agrees with the corresponding administration through a negotiation process that takes into account technical, environmental, and socio-economic factors as well as factors related to the execution of the works. In preparing the negotiation process, REE’s multidisciplinary team in each territory organizes informative sessions to explain the project from every point of view considered. GeoRED 3D visualization tools will help improve understanding of the future HVTL. These informative sessions are open to the public and the administration, as representatives of the local population, takes note of the most relevant concerns in order to reach a consensus.
4.4. Permit Obtainment Phase
4.4.1. Scope of Study Model
In order to analyze how the future HVTL would affect the plots, the GI handled in this phase are more precise than the previous GIs, applying the work scale used for the official cartography of the cadaster (accessible through the Cadaster’s Online Site) [43], whose scales range between 1:2.000–1:1.000.
4.4.2. Cadastral Plot Model
This model is automatically obtained by using the downloading service offered by the Cadaster’s Online Site. During this process, the data is downloaded and also filtered to prevent duplicates and eliminate obsolescent plots.
4.4.3. RBD (List of Affected Assets and Rights) Model: Rights-of-Way and Occupations
This model analyzes the type and magnitude of the effects of the new HVTL on each cadastral plot. For permanent effects, the model takes into account the surface occupied by the pylons, access roads, fly-over rights—with and without crosswinds—and safety distances. For temporary effects, the model includes the surface area necessary in order to gather materials and vehicles and protect junctions for roads and other routes; the latter may be modified during the construction phase. Before completing the model, it is first analyzed to determine whether the resulting effects are significant or negligible. To this end, we apply the ratio between the surface area and the perimeter; if the ratio is less than 1, this indicates a long and narrow effect and may be considered negligible.
The results of this phase produce a table in which each row represents an affected cadastral plots, and each column contains data explaining how the future HVTL would affect each plot.
4.4.4. Plot Impact Model
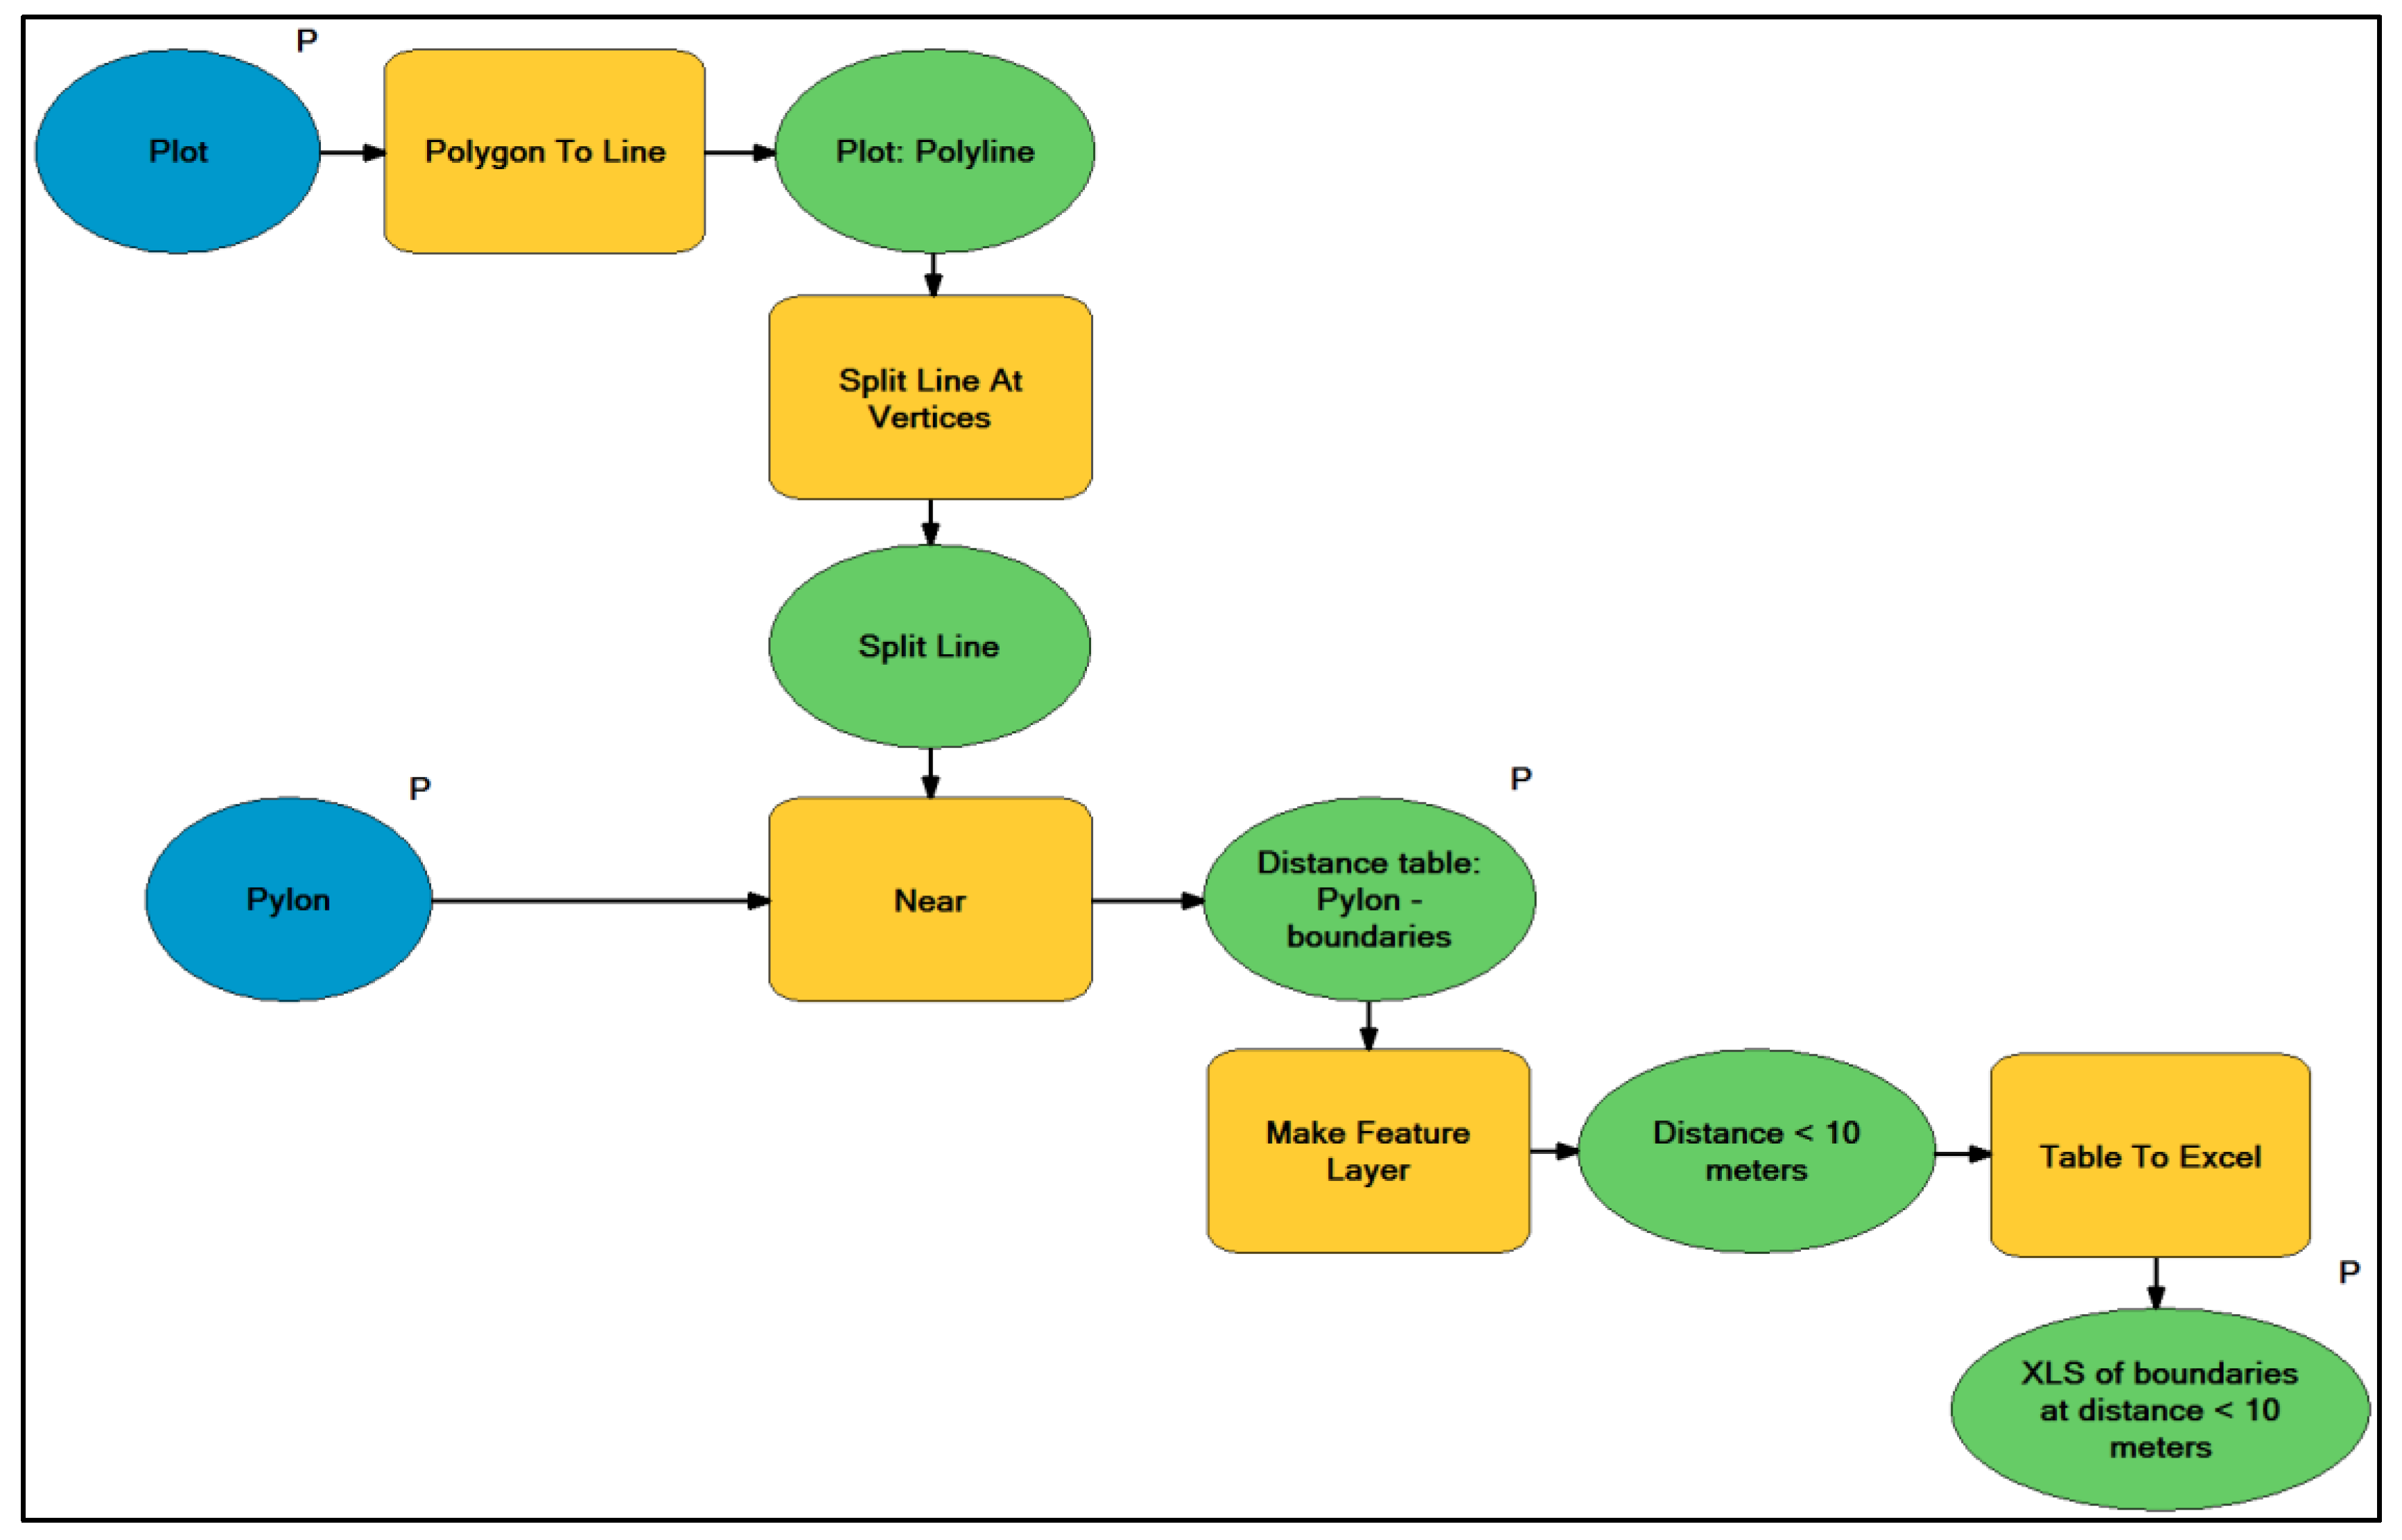
The model takes into account the position of the pylon on the affected plot. Out of respect for private property and for the occupancy generated by the future HVTL itself, every attempt was made to ensure that the pylons were close to the boundaries, thus preventing limiting the use of the entire plot. This model is then used to calculate the distances from the pylon to the plot’s various boundaries, so that they help identify the direction in which the tower could be moved in order to leave as much of the plot free of occupations. This model is represented in Figure A7 of the Appendix A.
4.4.5. Decision Model
This model takes into account the results of the RBD Model and the Impact on Plots Model and decides how to manage the effects by plot. In some cases, these are not taken into account, while in other cases they are and the engineering team is requested to modify the distribution of the pylons in order to minimize the impact on each plot.
4.5. Construction Phase
4.5.1. Scope of Study Model
In this phase, the GI focuses on how the execution of the construction works might affect the cadastral plots previously identified in the RBD model. Although the GI scales used in the previous phase were in the 1:2.000–1:1.000 range, in this phase the GI includes the topography of the construction site, using the following work scales: 1:1000–1:500.
4.5.2. Temporary Occupation for Works Model
Regardless of the surface area that is in theory to be temporarily occupied as established in the engineering phase, and having quantified the effects during the permit obtainment phase, variations in these surface areas often emerge during the execution of the works. These variations may be necessary in order to meet the requirements of the orography of the terrain, the machinery to be used, or even the requests of the plot owners themselves. One example of these new temporarily occupied surfaces is the surface required to hoist the pylons. By default, this is estimated to be a 1600-m2 surface area with the center at the pylon and facing the same direction.
Figure 12 shows the temporary occupation proposed by default, which would paralyze a public road, as well as the final occupation established during the execution of the works.
4.5.3. Plot Impact Model
Within the permit obtainment phase, payments are established for damages caused to each plot: for spoiling crops, demolishing buildings, cutting through fences or barbed wire, etc. In this case, as new effects are generated that were not previously contemplated, a system is established to compensate for the damages caused; the model used to calculate the magnitude of damages is shown in Figure A8 of Appendix A.
4.5.4. Decision Model
Again, it is the technicians in charge of the works who decide whether to temporarily occupy part of the plot, and they are the ones who decide how to balance the feasibility of construction with respect for private property, with the aim of minimizing any possible damage. Consequently, the model should calculate the damages caused, for which the owner of the affected plot shall be compensated.
4.6. Discussion
This paper presents Geodesign as a suitable methodological approach for gathering the different requirements of various stakeholders in a single environment, creating a collaborative workflow that enables consensual decision-making and favors transparency, making the different decisions and responsibilities in HVTL projects visible.
The proposed workflow for REE’s HVTL projects implements geodesign methodology in order to standardize criteria for analyzing data to support decision-making. This workflow is currently being implemented in the corporate GIS GeoRED, as an internal process within the company for meetings between the geospatial unit and the various business units responsible for the workflow phases described in this paper. Although many of the models have already been tested and validated, others are still in the debugging phase. The methodological proposal outlined in this workflow is not an end in itself, it is a means to coordinate the work of the various business units, by unifying the criteria in each phase and ensuring that a single criterion is applied when transferring GI between phases, thus harmonizing GI flows and guaranteeing their traceability.
Regarding the two research questions proposed in this work, RQ1 asks whether it is possible to implement a geodesign methodology based on a workflow for HVTL projects and integrate it in GeoRED as a PSS tool. Both the methodological workflow proposed and its progressive implementation and testing indicate that it is possible to integrate tools used to facilitate collaboration, analysis, and decision-making and provide the feedback–iteration–consensus tools that distinguish geodesign processes.
RQ2 asks whether it is possible to harmonize the treatment of GI in HVTL projects and integrate the GI life cycle into the geodesign workflow. Applying the feedback–iteration–consensus technique for GI among the company’s various business units has improved coordination and visibility of decision-making, responsibilities and the impact produced by these decisions on the sustainability of a project. It has also enabled the use of unified criteria in each phase, and in the transfer of GI between phases, thus harmonizing GI in the geodesign workflow and facilitating its traceability. In the implementation tests for this workflow, some exceptions detected by the business units emerged in the validation processes, indicating the need to make adjustments and to implement the workflow progressively. This is, therefore, another process of feedback–iteration–consensus that is outside the scope of the proposed workflow as a geodesign methodology, but within its implementation at the corporate level.
5. Conclusions and Future Works
The Spanish Electricity Transmission Network is in continual expansion; it is dynamic. This expansion is carried out through engineering projects that require planning and decision-making and involve many different agents and interests.
Nevertheless, neither the administrations nor the agencies responsible for execution (planning the transmission line infrastructures) have adequate tools with which to meet requirements, limitations, restrictions, and desires of each type of stakeholder.
REE’s technicians are crucial key holders at every phase of these HVTL projects. Traditionally, these projects have been designed internally at REE (as the company is in charge of maintaining, developing, and expanding the national infrastructure). Moreover, these projects have never been publicized or promoted jointly by all stakeholders. Consequently, the dialogue has often been time-consuming, and it was impossible to access the project plans and documentation by electronic means.
GI plays a key role in developing these projects, but it should be used according to an established methodology: each layer of thematic information should be given a suitable weight and taken into account in a coherent manner, always applying it in the same manner and following the same criteria. Creating the geodesign workflow for REE’s HVTL projects has made it possible to standardize the criteria for analyzing data to support decision-making, thus limiting the influence of the personal criteria of the technicians in charge and increasing the impact of the homogenous criteria established at a corporate level for each scenario. This homogenization was made possible by creating procedures and relationships between them, thus providing a solid sustainability methodology for developing these types of projects.
Using REE’s HVTL geodesign workflow, the GI lifecycle of a project is subject to corporate criteria. Specific data is thus required for each phase of the models. These data must always have the same structure—as far as the format, accuracy, descriptive attributes, etc.—and the models must always perform the same established procedures. This ensures that it is always possible to access the data whenever required during the process, as stipulated by corporate definitions. This will confirm the quality of the results, since the GI workflow is managed through procedures with a standardized criteria.
Based on geodesign principles, the geodesign workflow for REE’s HVTL projects provides, on the one hand, procedures for homogenizing technical criteria during every phase of the projects, and, on the other hand, a tool for collaborating with the capacity all of the project’s constraints and restrictions, decision-making, and design history in a single environment; thereby constituting an environment that facilitates the feedback—iteration—consensus triad necessary for any geodesign project.
The new geodesign workflow proposed for REE’s HVTLs represents a paradigm shift for these types of projects. This workflow is currently being implemented in the corporate geographic information system (GeoRED), enabling it to represent, establish collaborative scenarios and apply geoprocessing models. Currently GeoRED supports collaboration, it has the capacity to store the models to be applied in each phase, to use GI to generate project progress reports, and to produce a geographical collaboration environment and automate corporate procedures.
There is a growing interest in geolocalization in different disciplines. Each one of these disciplines is associated with its technologies, and they all share a spatial component. The way GeoRED manages contents (GI) is associated with user management. The basis of this relationship is sharing responsibility over GI with the various decision-makers in order to integrate it into a single system. Thus, by associating user profiles with content, virtual workspaces are generated for each theme or project, with a limited number of people working collaborative to find consensual solutions. These people may or may not belong to the organization; that is to say, GeoRED allows users who are not part of the organization to collaborate. This collaboration is carried out by REE’s multidisciplinary teams throughout the territory that are in contact with stakeholders (central administration, local administration representing the concerns of the local population, environmental and animalist associations, or any institutions that represent the interests of the interested parties) using the virtual meeting room accessible to all of them and the iterative execution of the design cycles until participants reach a consensus.
GeoRED allows the different map services used by various interest groups to coexist simultaneously, and this sets the stage for collaboration, discussion, negotiation, and, ultimately, consensus. These are the scenarios in which geodesign is made patent.
In addition to the objective of managing all the map services necessary for a project in a single environment, GeoRED has a more specific objective as far as its functionality as a corporate GIS. This objective is to define and manage corporate geographic procedures. The intention here is to ensure that all projects are developed using the same criteria. These criteria must be decided at the corporate level in order to minimize the influence of the personal criteria of the technicians in charge in favor of corporate criteria, making the results of the projects overall more homogenous and sustainable. The HVTL geodesign workflow is a theoretical proposal that requires a GIS platform in order to become a reality. The progressive implementation of the HVTL geodesign workflow in GeoRED has enabled the capacity to represent, establish collaborative scenarios, and apply geoprocessing models in an iterative way, adjusting in each case of weightings in the territorial constraints.
As future works, the authors will continue to integrate their proposed workflow in GeoRED, so that this corporate tool will evolve toward automatically managing the traceability of project GI throughout every phase, so that GI is managed and generated in accordance with the geodesign workflow proposed for HVTL herein. The authors will also test the entire geodesign methodology and workflow in several projects, once its implementation has been completed, in order to analyze the results and finish validating it.
Finally, the authors will propose the design of another workflow based on the geodesign methodology for the HVTL maintenance phase; that is, after the installation is built and throughout its useful life, since its maintenance also has a strong spatial component. Its implementation will pose a great challenge for REE as it implies integrating two worlds that are currently isolated: project and exploitation of infrastructures.
Author Contributions
All authors significantly contributed to this paper. Conceptualization, F.J.M. and M.A.M.; Formal analysis, F.J.M., R.A., and M.A.M.; Methodology, F.J.M.; Supervision, M.A.M.; Writing—original draft, F.J.M. and R.A.; Writing—review & editing, M.Á.M., F.J.M., and R.A.
Funding
This research received no external funding.
Acknowledgments
In this section you can acknowledge any support given which is not covered by the author contribution or funding sections. This may include administrative and technical support, or donations in kind (e.g., materials used for experiments).
Conflicts of Interest
The authors declare no conflict of interest.
Appendix A

Table A1.
Summary table of the different examples of weightings in the territorial constraints.
| Influence, Natural, Protected Areas, Ranges, Distances to Populated Areas, Social Interest, and Physical Environment Example Tables | |
| 1. Example of limited territorial restrictions due to areas of influence of linear infrastructures | |
| Areas of influence | Value |
| First 25 m around linear infrastructures | 10 |
| Next 250 m around linear infrastructures | 0 |
| 2. Example of limited territorial restrictions due to accessibility | |
| Areas of influence | Value |
| First 25 m around asphalted roads | 10 |
| Next 250 m around asphalted roads | 0 |
| First 250 m around asphalted roads | 2 |
| First 250 m around non-asphalted roads | 0 |
| Next 250 m around non-asphalted roads | 2 |
| 3. Example of limited territorial restrictions due to the gradient of the terrain | |
| Range of gradients | Value |
| Between 0 and 2% | 0 |
| Between 0 and 5% | 3 |
| Between 5 and 10% | 6 |
| Greater than 10% | 10 |
| 4. Example of limited territorial restrictions due to the existence of Natural Values | |
| Natural Area | Value |
| Tall (35-50 m) trees and singular groves | 6 |
| Vegetation of interest | 8 |
| Ferns | 6 |
| Habitats of interest for the community | 7 |
| Forests | 6 |
| Areas of action for wetland, steppe or necrophagous bird species | 8 |
| Crops | 1 |
| 5. Example of limited territorial restrictions due to the existence of a PNA | |
| Zone with protected natural areas | Value |
| Protected natural area (PNA) | 6 |
| Overlap of two PNAs | 8 |
| Overlap of three or more PNAs | 10 |
| 6. Example of limited territorial restrictions due to proximity of populated areas | |
| Distance to populated areas | Value |
| Populated areas at a distance d < 450 m | 10 |
| Populated areas at a distance 450 m < d < 650 m | 4 |
| Populated areas at a distance 650 m < d < 850 m | 2 |
| Populated areas at a distance 850 m < d < 1000 m | 1 |
| Populated areas at a distance d < 1000 m | 0 |
| Isolated buildings at a distance d < 50 m | 9 |
| Isolated buildings at a distance 50 m < d < 100 m | 5 |
| Isolated buildings at a distance d < 100 m | 0 |
| 7. Example of limited territorial restrictions due to the existence of areas of social interest | |
| Social interest | Value |
| Airports | 10 |
| Archaeological areas | 10 |
| Military areas | 10 |
| Mining concession | 10 |
| Property of cultural interest | 10 |
| Other infrastructures (gas pipelines, aqueducts, roads) | 10 |
| Recreational Areas (water parks, golf clubs) | 8 |
| 8. Example of limited territorial restrictions due to the existence of physical land elements | |
| Physical environment | Value |
| Hydrographic network at a distance d < 25 m | 4 |
| Reservoirs | 8 |
| Places of hydrogeological interest | 8 |
| Geo-resources at a distance d < 200 m | 8 |
Figure A1.
Model for calculating the scope of analysis.

Figure A2.
Geoprocessing model for generating alternative corridors.

Figure A3.
Model for generating alignments.

Figure A4.
Quantification of socioeconomic impact.

Figure A5.
Estimated visibility of each support structure.

Figure A6.
Combined results of the visibility analysis of each support structure.

Figure A7.
Model to help reduce impact on plots.

Figure A8.
Model quantifying the damage of impacts on plots.

References and Notes
- Ramachandra, T.; George, V.; Vamsee, K.; Purnima, G. Decision support system for regional electricity planning. Energy Educ. Sci. Technol. 2006, 17, 17–25. [Google Scholar]
- Kumar, A.; Bhatnagar, S.D.; Saxena, P.K. Integrated multimedia based intelligent group decision support system for electrical power network. AJIS 2002, 9, 2. [Google Scholar] [CrossRef]
- Red Eléctrica de España. Available online: http:// www.ree.es (accessed on 15 July 2018).
- Cocco, C.; Fonseca, B.M.; Campagna, M. Applying GeoDesign in urban planning: Case study of Pampulha, Belo Horizonte, Brazil. Rev. Bras. Cartogr. 2015, 67. [Google Scholar]
- Lee, D.; Dias, E.; Scholten, H.J. Geodesign by Integrating Design and Geospatial Sciences; Springer: Heidelberg, Germany, 2014; p. 14. ISBN 978-3-319-08299-8. [Google Scholar]
- Miller, E.; William, R. Introducing Geo-Design: The Concept. Available online: https://www.esri.com/library/whitepapers/pdfs/introducing-geodesign.pdf (accessed on 15 July 2018).
- Steinitz, C. A Framework for Theory Applicable to the Education of Landscape Architects (and Other Environmental Design Professionals). Landsc. J. 1990, 9, 136–143. [Google Scholar] [CrossRef]
- Steinitz, C. Toward a Sustainable Landscape with High Visual Preference and High Ecological Integrity: The Loop Road in Acadia National Park, USA. Landsc. Urban Plan. 1990, 19, 213–250. [Google Scholar] [CrossRef]
- Goodchild, M.F. Twenty years of progress: GIScience. J. Spat. Inf. Sci. 2010, 1, 3–20. [Google Scholar]
- Nyerges, T.; Ballal, H.; Steinitz, C.; Canfieldd, T.; Rodericke, M.; Ritzmana, J.; Thanatemaneerata, W. Geodesign dynamics for sustainable urban watershed development. Sustain. Cities Soc. 2016, 25, 13–24. [Google Scholar] [CrossRef] [Green Version]
- Steinitz, C.; Rogers, P. A Systems Analysis Model or Urbanization and Change: An Experiment in Interdisciplinary Education; MIT Press: Cambridge, MA, USA, 1969. [Google Scholar]
- Harris, B. Beyond geospatial information-systems-computers and the planning professional. J. Am. Plan. Assoc. 1989, 55, 85–90. [Google Scholar] [CrossRef]
- Vonk, G.; Geertman, S.; Schot, P.P. Bottlenecks blocking widespread usage of planning support systems. Environ. Plan. A 2005, 37, 909–924. [Google Scholar] [CrossRef] [Green Version]
- Geertman, S.; Stillwell, J. (Eds.) Planning Support Systems in Practice; Springer Science & Business Media: Berlin, Germany, 2003; ISBN 978-3-540-24795-1. [Google Scholar]
- Steinitz, C. A Framework for Geodesign: Changing Geography by Design; Esri Press: Redlands, CA, USA, 2012; ISBN 978-1589483330. [Google Scholar]
- Abukhater, A.; Walker, D. Making Smart Growth Smarter with GeoDesign. Dir. Mag. 2010. Available online: https://www.directionsmag.com/article/2137 (accessed on 15 July 2018).
- Aditya, T. Usability Issues in Applying Participatory Mapping for Neighborhood Infrastructure Planning. Trans. GIS 2010, 14, 119–147. [Google Scholar] [CrossRef]
- Hanzl, M. Information technology as a tool for public participation in urban planning: A review of experiments and potentials. Des. Stud. 2007, 28, 289–307. [Google Scholar] [CrossRef]
- Kubicek, H. The potential of E-Participation in Urban Planning: A European Perspective. In Handbook of Research on E-Planning: ICTs for Urban Development and Monitoring; Silva, C.N., Ed.; IGI Global: New York, NY, USA, 2010; pp. 168–194. ISBN 978-1-615209293. [Google Scholar]
- Pickles, J. Ground Truth: The Social Implications of Geographical Information Systems; Guilford Press: London, UK, 1995. [Google Scholar]
- Batty, M. Planning Support Systems for Cities and Regions; Lincoln Institute: Cambridge, MA, USA, 2008. [Google Scholar]
- Andrienko, G.; Andrienko, N.; Jankowski, P.; Keim, D.; Kraak, M.J.; MacEachren, A.; Wrobel, S. Geovisual analytics for spatial decision support: Setting research agenda. Int. J. Geogr. Inf. Sci. 2007, 21, 839–857. [Google Scholar] [CrossRef]
- Flaxman, M. GeoDesign: Fundamental Principles and Routes Forward, Talk at GeoDesign Summit. 22 May 2009.
- Dangermond, J. GIS: Designing Our Future ArcNews. Available online: http://www.esri.com/news/arcnews/summer09articles/gis-designing-our-future.html (accessed on 15 July 2018).
- McHarg, I. Design with Nature, Wiley Series in Sustainable Design; Wiley: Manhattan, New York, NY, USA, 1961; ISBN 0-471-11460-X. [Google Scholar]
- Ervin, S.M. A System for GeoDesign; Digital Landscape Architecture Conference: Dessau, Germany, May 2011. [Google Scholar]
- Artz, M. GeoDesign: New Concept or New Name. In Planning Support Systems: An Inventory of Current Practice, Computers, Environment and Urban Systems; Stan, G., John, S., Eds.; Gateway Media Private Limited: Hyderabad, India, January 2010; Volume 28, pp. 291–310. ISSN 0198-9715. [Google Scholar]
- Ball, M. Is GeoDesign an activity, a practice or a software-enabled modeling approach? Spatial Sustain Blog, 12 March 2010. [Google Scholar]
- Dangermond, J.T. Creating Our Future. In Proceedings of the Third GeoDesign Summit Conference, Redlands, CA, USA, 5–6 January 2012. [Google Scholar]
- Steinitz, C.; Arias, H.; Bassett, S.; Flaxman, M.; Goode, T.; Maddock III, T.; Mouat, D.; Peiser, R.; Shearer, A. Alternative Futures for Changing Landscapes: The Upper San Pedro River Basin In Arizona And Sonora; Island Press: Washington, DC, USA, 2003; ISBN 9781559632249. [Google Scholar]
- Foster, K. Geodesign parsed: Placing it within the rubric of recognized design theories. Landsc. Urban Plan. 2016. [Google Scholar] [CrossRef]
- Simon, H.A. The New Science of Management Decision; 3rd Revised Edition, 1st Edition 1960; Prentice Hall: Englewood Cliffs, NJ, USA, 1977; ISBN 0136161367. [Google Scholar]
- Simon, H.A. Administrative Behavior; 4th Expanded Edition, 1st Edition, 1947; Free Press: New York, NY, USA, 1997; ISBN 9780684835822. [Google Scholar]
- Asimov, M. Introduction to Design; Prentice Hall: Englewood Cliffs, NJ, USA, 1962. [Google Scholar]
- Fogler, H.S.; LeBlanc, S.E. Strategies for Creative Problem Solving; PTR Prentice Hall: Upper Saddle River, NJ, USA, 1995; ISBN 978-0133091663. [Google Scholar]
- Brown, T. Change by Design: How Design Thinking Transforms Organizations and Inspires Innovation; HarperCollins: New York, NY, USA, 2009; ISBN 9780061937743. [Google Scholar]
- Kumar, V. 101 Design Methods: A Structured Approach for Driving Innovation in Your Organization; John Wiley & Sons: Hoboken, NJ, USA, 2012; ISBN 978-1-118-08346-8. [Google Scholar]
- Rivero, R.; Smith, A.; Ballal, H.; Steinitz, C. Promoting Collaborative Geodesign in a Multidisciplinary and Multiscale Environment: Coastal Georgia 2050, USA. In Proceedings of the Digital Landscape Architecture, Dessau, Germany, 3–7 June 2015. [Google Scholar]
- Campagna, M.; Steinitz, C.; Di Cesare, E.A.; Cocco, C.; Ballal, H.; Canfield, T. Collaboration in planning: The Geodesign approach. Rozwój Regionalny i Polityka Regionalna 2016, 35, 27–43. [Google Scholar]
- Santini, L.; Pecori, S. Sensitivity assessment. Localization of road transport infrastructures in the Province of Lucca. TeMA J. Land Use Mobil. Environ. 2014. input. [Google Scholar]
- Campagna, M.; Ivanov, K.; Massa, P. Orchestrating the spatial planning process: From Business Process Management to 2nd generation Planning Support Systems. In Proceedings of the 17th AGILE Conference on Geographic Information Science, Castellon, Spain, 3–6 June 2014; ISBN 9789081696043. [Google Scholar]
- Craglia, M.; Bie, K.; Jackson, D.; Pesaresi, M.; Remetey-Fülöpp, G.; Wang, C.; Annoni, A.; Bian, L.; Campbell, F.; Ehlers, M.; et al. Digital Earth 2020: Towards the vision for the next decade. Int. J. Digit. Earth 2012, 5. [Google Scholar] [CrossRef]
- Moreno, F.J.; Gutierrez, F.V.; A, Ma.M. Using 3D GeoDesign for Planning of new Electricity Networks in Spain. In Proceedings of the 12th International Conference on Computational Science and Its Applications (ICCSA 2012), Salvador d Bahía, Brazil, 18–21 June 2012. [Google Scholar]
- Moreno, F.J.; Manso-Callejo, M.A. Planning New Power Lines in Spain with GeoDesign. SC C3-208 Cigre Sess. 2014. Available online: https://e-cigre.org/publication/C3-208_2014-planning-new-power-lines-in-spain-with-geodesign (accessed on 4 August 2018).
- Sede Electrónica del Catastro. Available online: http://www.sedecatastro.gob.es (accessed on 15 July 2018).
- López, E. Master GIS at ESRI (2014). tPropongo: web map application that proposes alternative locations for power transmission corridors and substations sites”. Available online: https://youtu.be/pNmvwVqacbI.
- Trogu, D.; Campagna, M. Towards Spatial Composite Indicators: A Case Study on Sardinian Landscape. Sustainability 2018, 10. [Google Scholar] [CrossRef]
- Ligmann-Zielinska, A.; Jankowski, P. Spatially-explicit integrated uncertainty and sensitivity analysis of criteria weights in multi-criteria land suitability evaluation. Environ. Model. Softw. 2014, 57, 235–247. [Google Scholar] [CrossRef]
- Thiessen Polygons. Available online: https://pro.arcgis.com/es/pro-app/tool-reference/analysis/create-thiessen-polygons.htm (accessed on 15 July 2018).
- PLS-CADD™ (Power Line Systems-Computer Aided Design and Drafting). V 14.2. Definition of prohibited and special zones (section 6.10.3 of the user manual) and Automatic distribution of pylons (section 14.2 of the user manual).
- ArcGIS Pro. Tool Reference. Available online: http://pro.arcgis.com/es/pro-app/tool-reference (accessed on 15 July 2018).
- Moreno, F.J. Metodología de análisis del impacto visual de líneas eléctricas aéreas con resultados en entornos 2D y 3D multi-observador. In Proceedings of the XVII ERIAC. Decimoséptimo Encuentro Reg. Iberoam. De CIGRÉ, Ciudad del Este, Paraguay, 21–25 May 2017. [Google Scholar]
Figure 1.
Types of models to be applied to the HVTL geodesign workflow.

Figure 2.
GI workflow and work scales in an HVTL project.

Figure 3.
Methodological approach of the HVTL geodesign workflow.

Figure 4.
List of models for managing the traceability of an HVTL project.

Figure 5.
Graphic example of the evolution of GI in the engineering phase. (a) Alignment + vertexes; (b) alignment + vertexes + pylons; (c) alignment + vertexes + pylons + accesses; (d) zoom in on conditions between two pylons.
Figure 5.
Graphic example of the evolution of GI in the engineering phase. (a) Alignment + vertexes; (b) alignment + vertexes + pylons; (c) alignment + vertexes + pylons + accesses; (d) zoom in on conditions between two pylons.

Figure 6.
Graphic example of the delimitation of the scope of analysis. (a) Points of origin and destination; (b) scope of analysis.
Figure 6.
Graphic example of the delimitation of the scope of analysis. (a) Points of origin and destination; (b) scope of analysis.

Figure 7.
Graphic example of the general visibility calculation in the scope of analysis. (a) Digital model of the terrain; (b) digital model of the terrain with observer points; (c) visibility map (yes/no).
Figure 7.
Graphic example of the general visibility calculation in the scope of analysis. (a) Digital model of the terrain; (b) digital model of the terrain with observer points; (c) visibility map (yes/no).

Figure 8.
Graphic example of a selection of alternatives.

Figure 9.
Graphic example of the application of Thiessen polygons [36] in generating alignments. (a) Scope of analysis: hallway; (b) Thiessen polygons [36]; (c) alignment/proposed axis.

Figure 10.
Graphic example of the effects of the new HVTL. The orange points represent the center of a pylon, the red squares are permanent occupations and the orange squares are temporary occupations. The green stripes represent areas where trees must be felled, and the blue areas show the displacement of cables with a side wind at 120 km/h.

Figure 11.
Graphic example of the results of the visibility analysis of the 17 pylons highlighted, and details of visibility at one of the points analyzed, indicating the details of visibility of the 17 pylons. The color green indicates the least visibility, while the color red indicates the greatest visibility.

Figure 12.
Example of the difference between temporary occupation for the project and during construction. (a) Default temporary occupation; (b) temporary occupation while executing the works.
Figure 12.
Example of the difference between temporary occupation for the project and during construction. (a) Default temporary occupation; (b) temporary occupation while executing the works.

Table 1.
An example of the values weighted to generate territorial restrictions maps.
| Map | Weight (%) |
|---|---|
| Protected Natural Areas | 20 |
| Populated Areas | 20 |
| Orography | 18 |
| Accessibility | 15 |
| Natural Value | 12 |
| Existing Linear Infrastructures | 5 |
| Social Environment | 5 |
| Physical Environment | 5 |
© 2018 by the authors. Licensee MDPI, Basel, Switzerland. This article is an open access article distributed under the terms and conditions of the Creative Commons Attribution (CC BY) license (http://creativecommons.org/licenses/by/4.0/).
Share and Cite
MDPI and ACS Style
Moreno Marimbaldo, F.J.; Manso-Callejo, M.-Á.; Alcarria, R. A Methodological Approach to Using Geodesign in Transmission Line Projects. Sustainability 2018, 10, 2757. https://doi.org/10.3390/su10082757
AMA Style
Moreno Marimbaldo FJ, Manso-Callejo M-Á, Alcarria R. A Methodological Approach to Using Geodesign in Transmission Line Projects. Sustainability. 2018; 10(8):2757. https://doi.org/10.3390/su10082757
Chicago/Turabian StyleMoreno Marimbaldo, Francisco Javier, Miguel-Ángel Manso-Callejo, and Ramon Alcarria. 2018. "A Methodological Approach to Using Geodesign in Transmission Line Projects" Sustainability 10, no. 8: 2757. https://doi.org/10.3390/su10082757
Note that from the first issue of 2016, this journal uses article numbers instead of page numbers. See further details here.