Agent-Based Evaluation of the Airplane Boarding Strategies’ Efficiency and Sustainability


1
Department of Economic Informatics and Cybernetics, Bucharest University of Economic Studies, Bucharest 010552, Romania
2
School of Business & Technology, Webster University, Bangkok 10120, Thailand
*
Author to whom correspondence should be addressed.
Sustainability 2018, 10(6), 1879; https://doi.org/10.3390/su10061879
Submission received: 24 May 2018
/
Revised: 30 May 2018
/
Accepted: 1 June 2018
/
Published: 5 June 2018
(This article belongs to the Section Economic and Business Aspects of Sustainability)
Abstract
:The airplane turnaround time costs money to the airline companies and, over the years, it has been determined that the best way to reduce it is by using efficient boarding strategies. Many boarding strategies have been proposed but a consensus as to which is the best method has not been reached yet. The aim of this paper is to gather and test all these strategies considering the same initial conditions in order to help airline companies identify the best boarding strategy. Minimizing the costs not only contributes to airlines’ sustainability and long-term performance, but also influences their ticketing policy, and has an impact on their customers’ choices. Moreover, airports can benefit from the fact that the airline companies are optimizing their boarding strategies as they can extend the number of services offered to more airlines during one day without investing in new infrastructure. Thus, this paper considers 24 boarding strategies and builds a configurable agent-based model using NetLogo 6.0.2 to perform different simulations. The results are analysed using grey systems theory considering the aircraft dimensions, aircraft occupancy and whether or not passengers are carrying hand luggage that may need storage.
1. Introduction
Reducing the turnaround time has been one of the most discussed problems in the literature as the costs generated by this process have an impact on both the airline and its passengers, being reflected in the ticketing policy and price. In addition, the airport can gain from the reduction of turnaround time as it can extend its services to more companies in the same limited amount of time and without increasing the number of gates [1,2,3].
The turnaround time is a traditional metric used to measure the efficiency of airline operations and is the very basis of the company sustainability in terms of generated costs. Usually, it is defined as the period of time between the airplane’s arrival and departure from an airport. Some of the main elements included in turnaround time are: deplaning, aircraft cleaning and passenger boarding [4]. In their paper, Soolaki et al. [5] identified more processes such as: fuelling, airplane maintenance, cargo loading, baggage loading, passengers boarding, passengers deplaning, baggage unloading, and cargo unloading. Considering all of the above, the authors stated that air transportation companies should pay more attention to the boarding process as they have limited control over the passengers and, therefore, are forced to make changes to increase the operational efficiency of this process. According to Nyquist et al. [6], the overall annual average boarding cost per minute is $16,434,891, while Nyquist et al. and Steiner et al. [6,7] estimated that the per minute cost for each airplane is between $30 and $77. On the other hand, Horstmeier et al. [8] estimated that the cost can be even higher, reaching as much as $250 per minute. In addition, Ferrari et al. [4] believed that the passenger boarding is the part that takes the longest time and is the most important one to consider when reducing the turnaround time and its associated cost, while Jafer et al. [9] identified passengers boarding as the most difficult factor to control in the whole turnaround process.
The literature dealing with the turnaround time reduction is mainly focused on developing methods for faster passengers boarding and comparing them with other already existing methods in terms of airplane description [4,5,10,11], passengers movement [1,12] or seat selection [4,12].
There are various methods used to decide on the best boarding method: cellular Discrete-Event System Specification (Cell-DEVS) modelling [9], Discrete-Event simulation [13], cellular automata [14], linear programming [15], grid based simulation model [16], computer simulation [7,13,15,17,18], Cell-based computer simulation [4], Markov Chain Monte Carlo optimization algorithm and computer simulation [1], genetic algorithm [5], critical path method and Lorentzian space-time geometry [19], and empirical tests of the performance of the considered boarding methods [10].
However, a consensus on the best boarding methods to be used considering the methods employed in each study, the type of the aircraft, the percentage of passenger occupancy and the fact that the passengers usually have a carry-on luggage with them, has not been reached yet. Some studies suggest that Steffen method performs well when used for boarding [10,20], while others present the best strategy as being WilMA [1,4,17,19], rotating zone [12], optimal boarding [9], by half-row [17], random [7], or reverse pyramid [5,13,15]. A complete picture over the research state-of-the-art is given in [3], with an emphasis on 12 most relevant papers and their results.
Newer research literature considers a series of other factors such as improving the boarding time by assigning passengers a place depending on the number of luggage they carry [21] or scanning the passengers and their luggage and assigning a place in the aircraft based on their characteristics [22]. Even though these methods could improve the time needed to board the plane, it is believed that they affect the passengers’ comfort as in some of the cases passengers are not travelling alone and their preference to sit near another traveller or to a side of the aircraft is not considered, increasing the discomfort level. In other cases, the needed infrastructure to scan the passengers for assigning places in the aircraft can induce a high cost effort for the airport and, if only few of the airplane companies are using this boarding method, the airport has no direct gain in investing in such a scanning procedure. As for the hand luggage a person is carrying-on and their characteristics, this can only be established in the airport, which increases the check-in time and, thus, the passengers discomfort while waiting in the queue.
On the other hand, looking at the boarding methods actually used in practice, only few of them are employed: back-to-front (Air Canada, Alaska, American, Delta, British Airways, Frontier, JetBlue, Spirit, US Airways, Virgin Atlantic, and Lufthansa), random (Southwest Airlines, US Airways, American Airlines, and Lufthansa), WilMA (United Airlines), rotating zone (AirTran), by seat (Southwest Airlines), and open seating (relatively common at low-cost-companies, such as Ryanair). The companies may switch from one boarding method to another depending on the aircraft, the airport facilities, the number of passengers boarding the plane, and their luggage.
The main purpose of the paper is to gather in one study all the boarding methods developed so far and compare them based on the same characteristics, such as airplane structure, number of passengers, carrying-on hand luggage, etc. To this purpose, based on the literature, we have identified twenty four different boarding strategies for assigned seat and two for the open seat. Since the strategies for the open seat are very much dependent on the characteristics of the persons travelling, and they are only used by some low-cost companies (even the tendency for the low-cost companies has been the use of assigned seats in the past years, e.g., WizzAir), we have not included them in this study.
The paper is organised as follows: all airplane boarding strategies are presented in detail in Section 2 and a visual representation of each boarding method is provided in Appendix A. In Section 3 we have a brief presentation of the incidence analysis using grey systems theory. The simulation was performed using NetLogo and agent-based modelling and the decision of employing both is justified under Section 4 of this paper, along with a brief mentioning of some of the most recent economic applications found in the literature. The simulation’s results and interpretations are presented in Section 5 together with a grey incidence analysis and a sensitivity analysis that takes into consideration several factors such as: aircraft dimensions, aircraft occupancy, and passengers having a carry-on hand luggage that may or may not need to be stored in the overhead compartment. The paper ends with some concluding remarks presented in Section 6.
2. Airplane Boarding Strategies
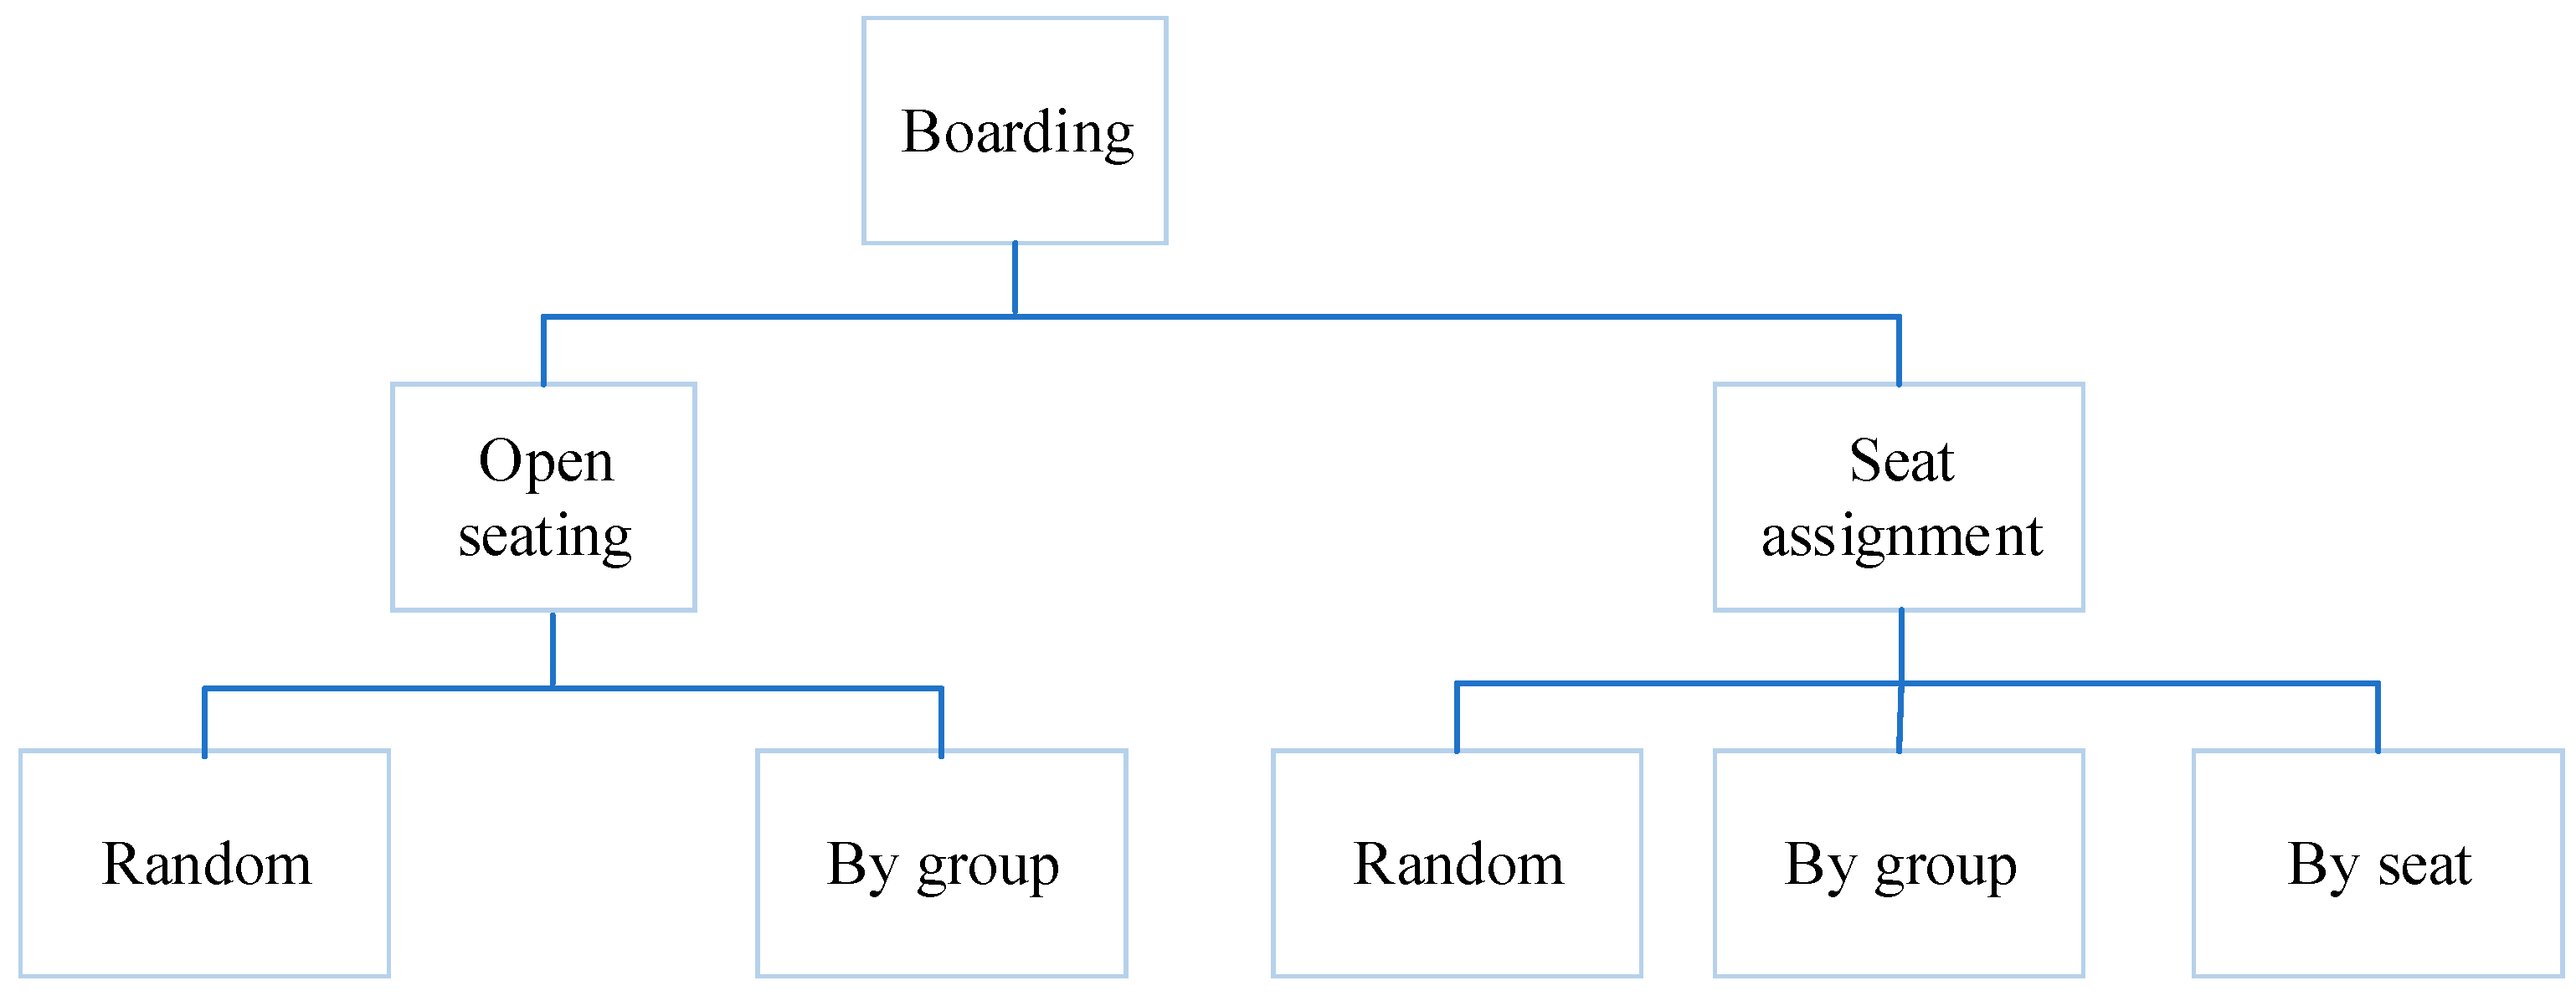
Boarding strategies can be divided into two main categories based on the seat assignment: with seat assignment or without seat assignment (also called open seating strategies) (see Figure 1).
2.1. Open Seating Strategies
Open seating strategies are currently used to a lesser extent by the airlines, as they provide little comfort for passengers in comparison with the seat assignment strategies, by forcing them to run and compete into selecting their preferred seats in the aircraft. Two types of open seating strategies exist: random and by group, as presented in Table 1.
2.2. Seat Assignment Strategies
For the seat assignment strategies, the assignment can be either random, by group or by seat.
2.2.1. Random Assignment
In the random assignment (also known as random boarding method with assigned seats), the passengers line up and take their assigned seat in no particular order (Appendix A, Figure A1). In the simulation section, this strategy is referred to as BS1 (boarding strategy 1).
2.2.2. By Group Assignment
In group assignment methods, passengers are divided into different groups depending on a certain characteristic. For example, a group may include all passengers having seats near the window, in the last rows of the aircraft, in the even rows, etc. Most of the strategies developed in the literature belong to this category, as presented in Table 2.
2.2.3. By Seat Assignment
Finally, the seat assignment methods place the passengers one-by-one in the aircraft, depending on certain rules. These strategies need more time for selecting the passenger before they enter the aircraft as they should be called one at a time and not as a group as in the group strategies presented above. Four strategies are shown in Table 3.
3. Incidence Analysis Using Grey Systems Theory
Grey systems theory is a part of the artificial intelligence techniques developed in the last two decades which deals with limited or missing information and provides the methods to deal with this type of uncertainty. In a keynote speech presented in 2011, Prof. Andrew explains why the whole surrounding world can be considered grey and how the methods provided by this new theory outperform in terms of results and accuracy other methods from the literature [23]. For the current research, we selected the degrees of grey incidence (presented below) for measuring the effects of the aircraft dimensions, aircraft occupancy, and whether passengers are traveling with/without hand luggage on the boarding time to propose sustainable boarding methods and luggage policies to the airline companies. A short theory is provided in the following. For more on grey systems theory and how they can be applied to real economic situations, please consider: [24,25,26,27,28,29].
3.1. The Absolute Degree of Grey Incidence
Considering two sequences of data with non-zero initial values and with the same length, data and , j = 1 ... n, with t = time period and n = variables [24,30,31]:
The zero-start points’ images are:
The absolute degree of grey incidence is:
with and computed as follows:
3.2. The Relative Degree of Grey Incidence
Considering the sequences from above with the same characteristics, and , j = 1 ... n, with t = time period and n = variables [30,31], the initial values images of X0 and Xj are determined as:
The zero-start points’ images calculated based on (7) and (8) for X0 and Xj are:
The relative degree of grey incidence is computed as:
with and :
3.3. The Synthetic Degree of Grey Incidence
The synthetic degree of grey incidence is based on both the absolute and the relative degrees of grey incidence [30,32]:
with j = 2, ..., n, and .
Thus, the grey incidence analysis is determined on the closeness relation between factors, being based on the similarity level of the geometrical patterns of sequence curves [24]. The size of the degree is directly proportional to the degree of similarity between the considered variables’ curves.
4. Agent-Based Modelling in NetLogo
The simulation of the boarding times needed for all 24 boarding methods will be conducted in NetLogo 6.0.2. A model will be developed for each of these methods. The decisions to use the agent-based modelling and NetLogo were made taking into consideration several factors that are presented below. As a platform, NetLogo is easy to understand, easy to program, and everybody can easily check, modify and adapt the proposed model without investing too much time in learning how to program it.
4.1. Advantages of Agent-Based Modelling
Some of the advantages brought by NetLogo are common to all the agent-based modelling (ABM) models and techniques, and are easily observed when compared to the traditional modelling approach represented by the equation-based modelling (EBM). Thus, the following can be underlined [33,34,35,36,37]: in ABM, the population can be represented through a heterogeneous set of agents possessing their own characteristics and rule of action while in the EBM the whole population has the same characteristics (we can call it homogenous). Moreover, the type of interactions are discrete in the ABM while in EBM they are continuous. Thus, the knowledge of the aggregate phenomena is required at a common sense level in ABM, while for the EBM a good understanding of the aggregate phenomena is needed.
Considering the causality within the two approaches, it can be stated that ABM allows indirect causation via emergence which has a larger impact on the model outcomes, while in the EBM the model directly influences or causes another aspect of the model. Even the approach is different: we can identify a bottom-up approach in ABM and a top-down one in EBM. The results are more detailed in the case of ABM and less detailed in EBM—one of the causes affecting the results’ level of detail is given by the readability: while EBM is mostly related to a “black-box” situation where one can see the inputs and the outputs but very few of the interactions, ABM possesses the “glass-box” approach where one can observe the phenomenon step by step, stop the model while running and continue it when needed [38,39,40,41,42,43,44].
Besides the advantages presented above, Vo et al. [45] stated that, in particular, NetLogo has its main advantages as it is a free and open-source multi-agent programming language for simulating both natural and social systems. In addition, it can be easily learned and used. There are a series of studies in the literature showing how undergraduates succeed in better understanding the presented phenomena when done in NetLogo in comparison to other software such as STELLA or MATLAB [46,47,48,49]. In addition, Vo et al. [45] considered that NetLogo possesses an extensive documentation and tutorials, which enable the users to better understand the way the program could be used and how it may be applied to a series of practical, real-life, situations. Other advantages according to Chen and Vo et al. [34,45] include: the model can have a multitude of agent-types operating in parallel, in the simulation environment the user can explore system’s behaviour under various conditions, the model created in NetLogo is easily adaptable in a fast and flexible way, and the program comes with a series of pre-built models which can be used for both observing the phenomenon and modifying the program to adapt to certain scenarios. The most mentioned disadvantage in the literature is related to the fact that it is only suitable for small systems [45,50,51].
4.2. Agent-Based Modelling Platforms
A series of agent-based modelling platforms have been developed and used for agent-based simulations, including StarLogo, Swarm, NetLogo, Repast and Mason.
4.3. Literature Review on the Agent-Based Modelling in NetLogo
In the following, a short literature review is provided for the transportation area applications modelled in NetLogo.
The efficiency of the high speed railway infrastructure has been analysed in [53] based on the caring capacity of high speed railway and NetLogo simulations. As a result, the authors concluded that their model can be used even in other situations to determine the carrying capacity of a high speed railway. In the particular case provided in the paper, the optimum amount of carrying capacity has been determined on different routes, along with the ranges between which the speed is optimal.
Focusing on the car movement within the parking lots, Vo et al. [45] considered a series of problems usually encountered in such situations, congestion, safety, and environmental effects, and constructed a NetLogo environment in which they simulated and determined the parking facilities features. Even though it just considers the interaction between the driver and the parking lot, while excluding other variables such as pedestrians, drivers’ experience and expectations, and parking location, the results are encouraging for future developments on this area as they are indicating that the speed limit and maximum parking duration have effects on the parking efficiency.
Dealing with the car collision avoidance, Riaz et al. [54] introduced the idea of using human social norms and emotions to improve the collision avoidance of the autonomous vehicles (AVs). A series of variables are being developed within the model and their values can be set from the interface such as the number of autonomous vehicle agents, the maximum and minimum velocity, acceleration-rate and deceleration-rate, safety distance, sonar range, metacognition, etc. Considering the simulation results, the authors concluded that the average number of accidents performed in the first case are 48.63 for 10 AVs, compared to just 2.57 in the second case. More, by considering 30 AVs, the authors found that the total average number of accidents by the non-social norms random walk technique are 305.43, and 59.35 by the social norms and emotions-based technique, underlying the benefits brought by the autopilot design, which should be reinvented to include social norms, emotions and optimal operating parameters.
5. Passengers Boarding Simulation and Evaluation
To determine the best boarding method and the effects of aircraft dimension, aircraft occupancy, whether passengers are carrying hand luggage with them on the aircraft with/without storing it, a model in NetLogo was created, containing all the 24 boarding strategies considered.
5.1. Passengers Boarding Modelling in NetLogo
The model’s parameters, assumptions, and the characteristics considered for the implementation of the boarding strategies are presented in the following.
5.1.1. Assumptions and Model Parameters
The model of aircraft implemented in NetLogo follows the studies in the field and does not consider first class passengers boarding [1,17,21,22], as, in most of the cases, first class is boarded separately and the time needed to board them does not influence much the overall time needed for boarding the whole aircraft.
Two types of agents can be encountered in the model: turtles representing the passengers, and patches representing the inside area of the aircraft (Table 4). At the beginning of the simulation, the passengers are located in the aircraft in front of the main entrance. Depending on the boarding strategy and their assigned seat, they are called inside the airplane randomly, by group or by seat.
The values in Table 4 have been determined through analogy with [9,11,33], conducting to the value of each tick (tick is the time unit in NetLogo), which is equivalent to 5.4 s in real life.
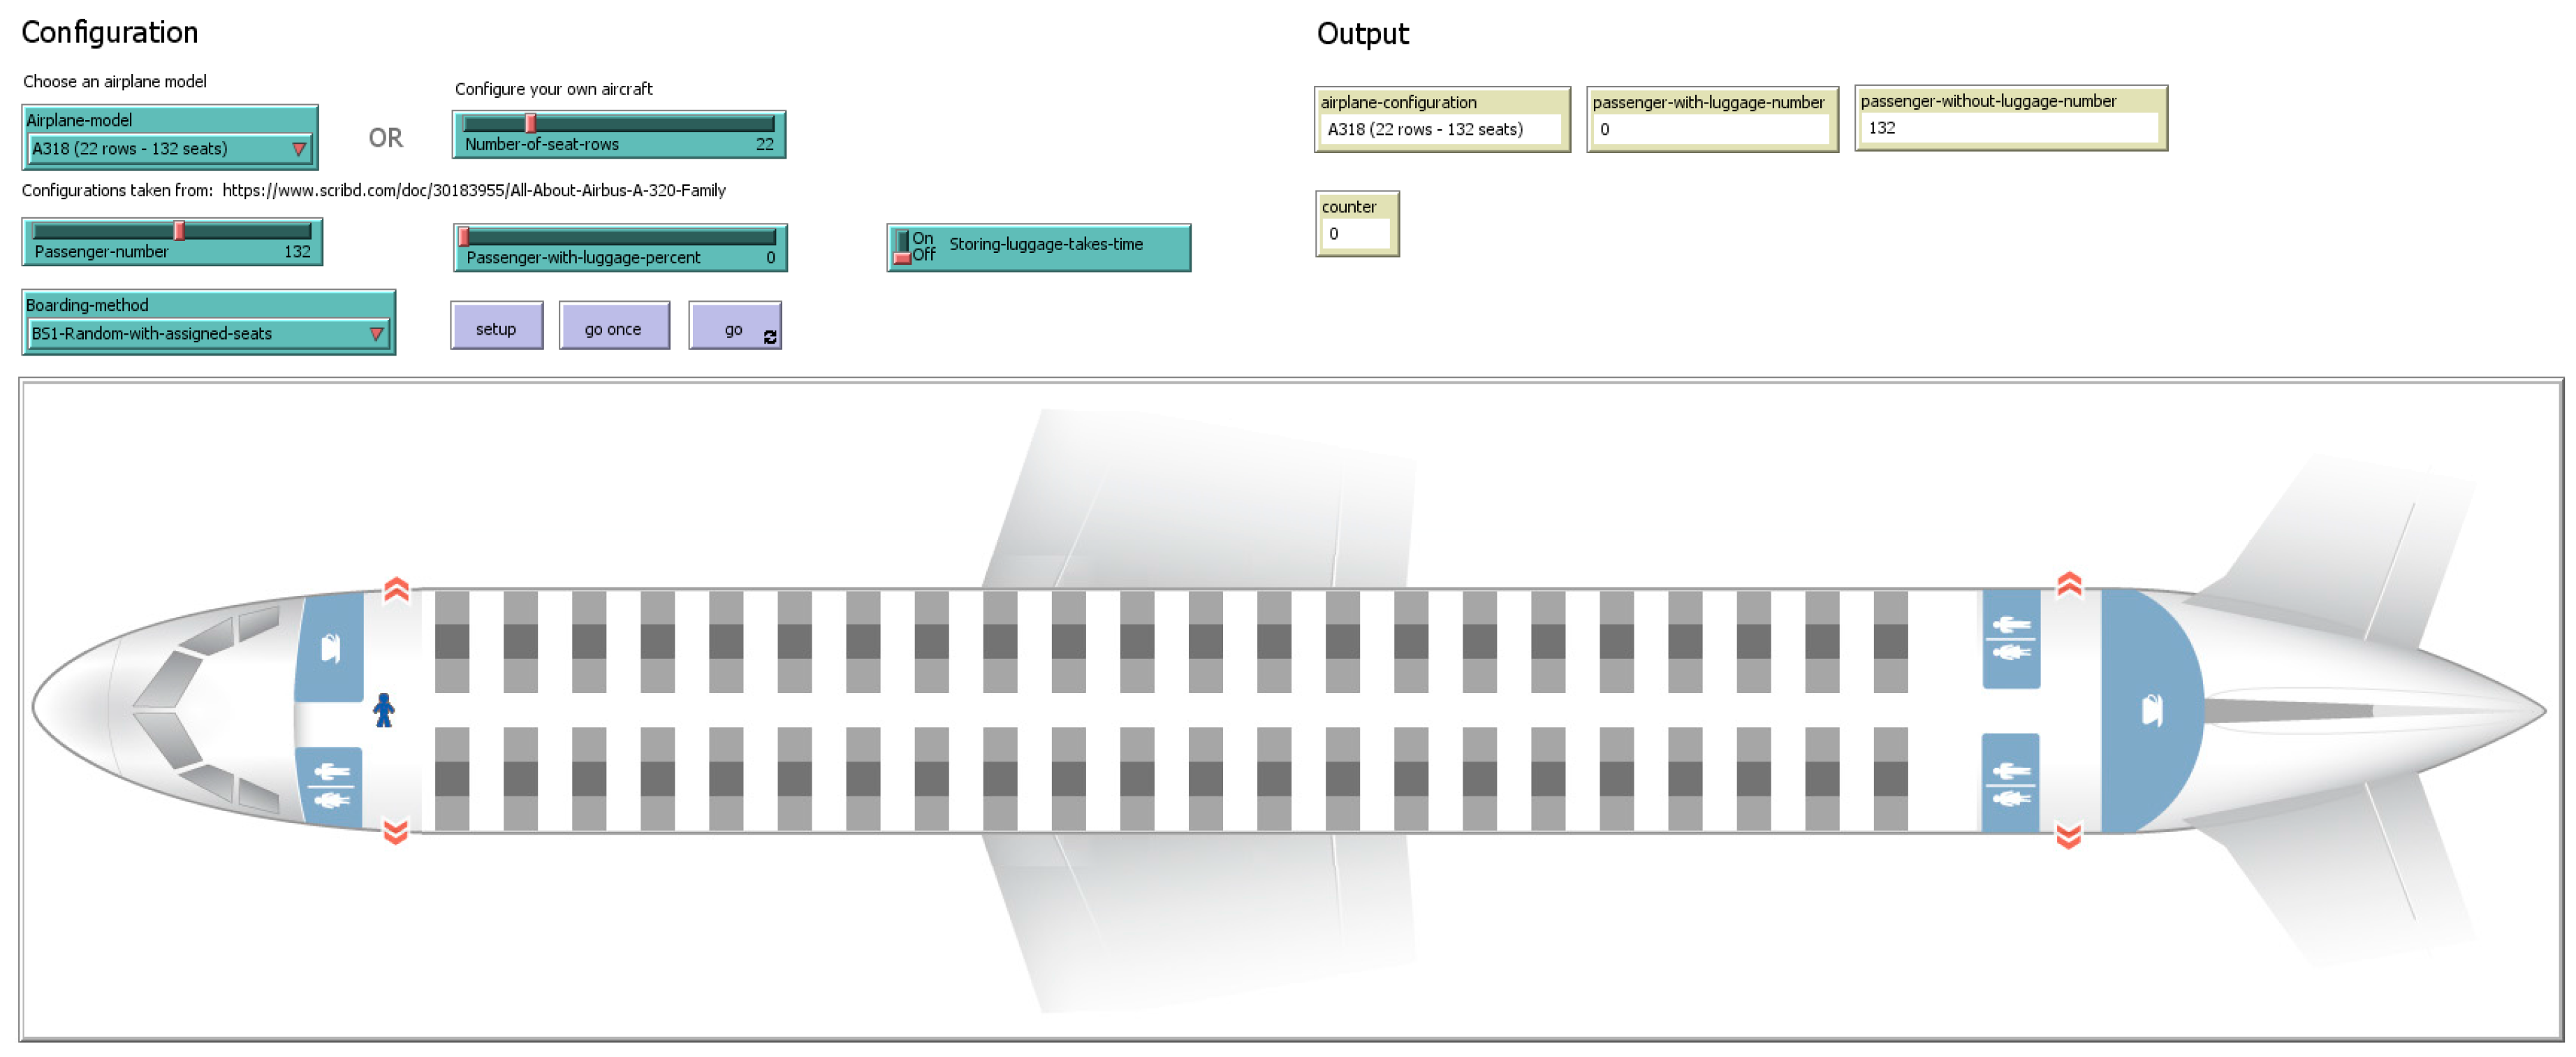
The model’s main interface is presented in Figure 3. It offers the possibility of selecting one of the most used aircraft models for simulation (A318, A319, A320 or A321) or one can decide to create his/her own airplane by selecting the number of rows from the number-of-seat-rows slider (Figure 4).
In addition, the passengers’ number and the passengers with luggage percent is configurable; the program randomly assigns hand luggage to the passengers in the mentioned proportion. One can select whether storing luggage takes time and in case it does, it is estimated randomly for each passenger carrying luggage as a time between 3 and 7 ticks (corresponding to 16.2 s and 37.8 s). During this time, the agent stops near his/her seat and places the luggage. All other agents behind them cannot overpass them, so they also stop until the aisle is free again and can be used.
5.1.2. Boarding Strategies Implementation Details
All boarding strategies mentioned above have been implemented in accordance to their description, by creating a NetLogo procedure for each boarding method.
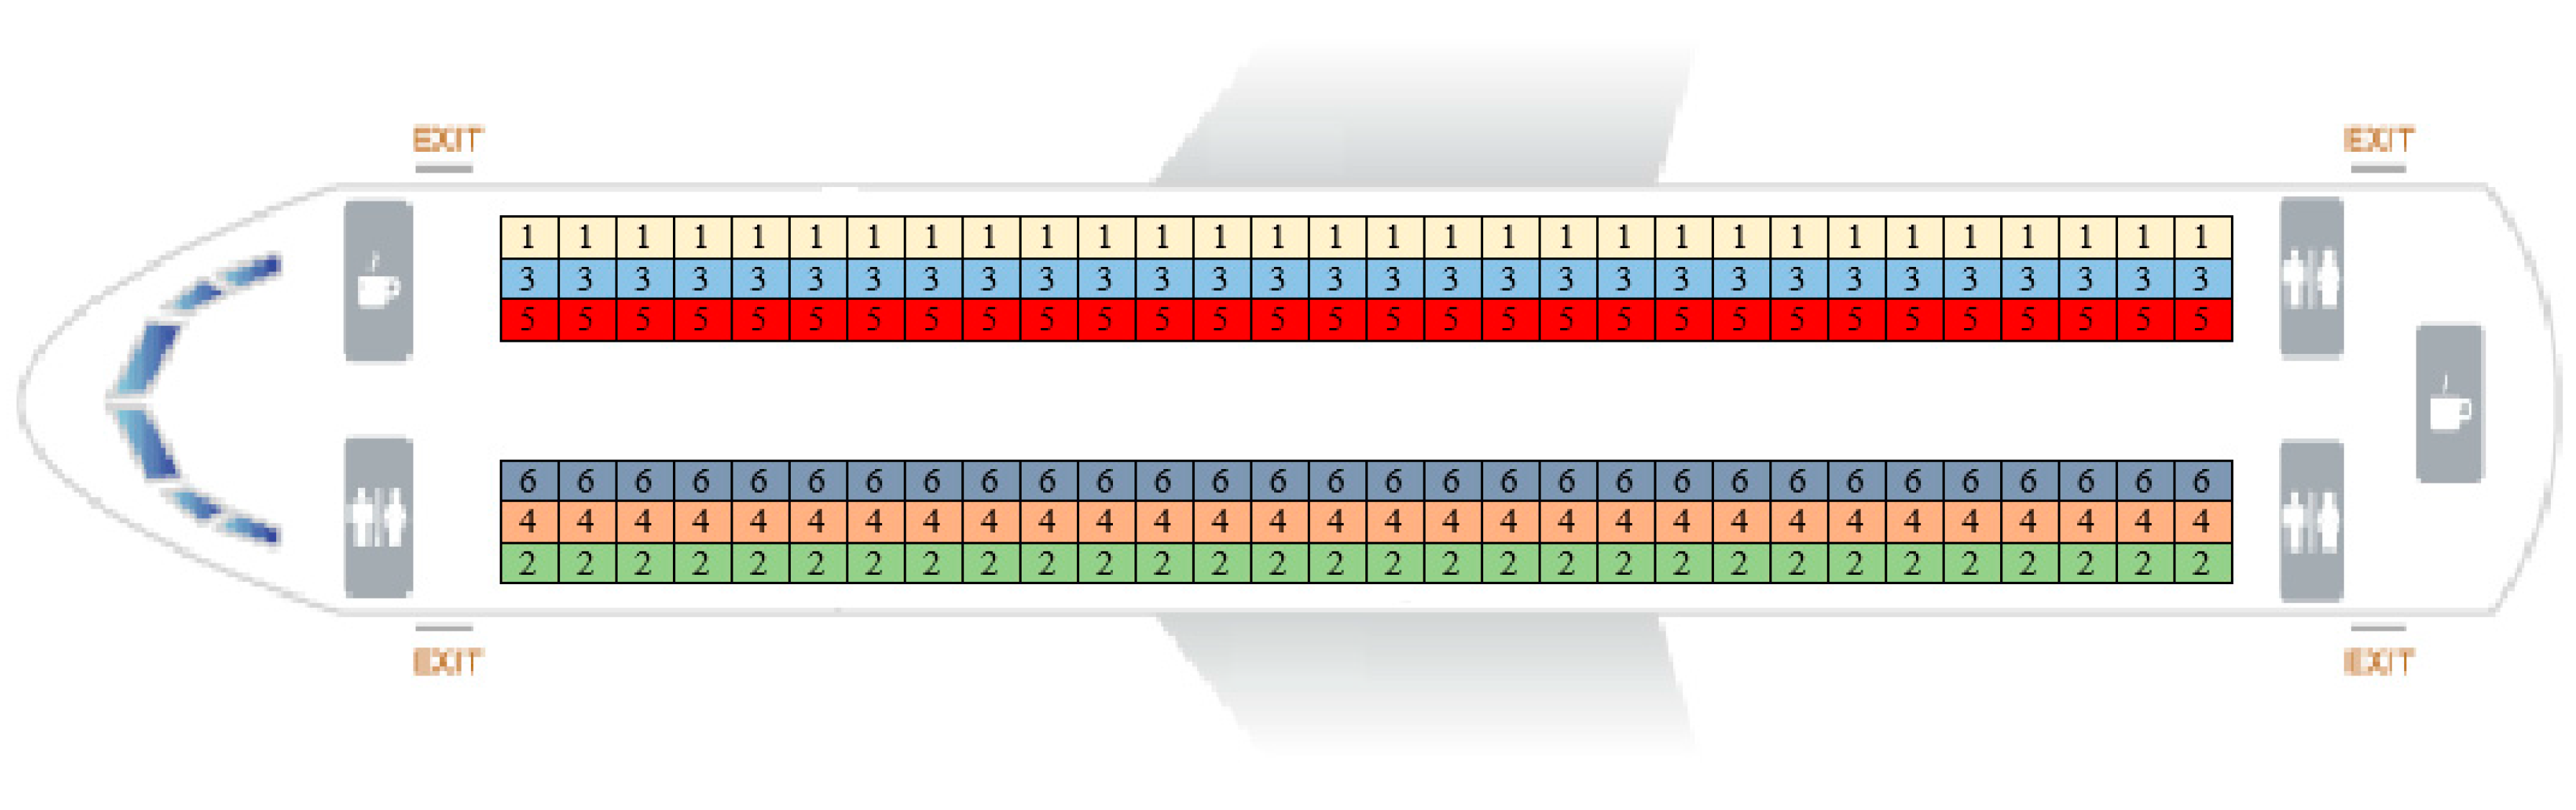
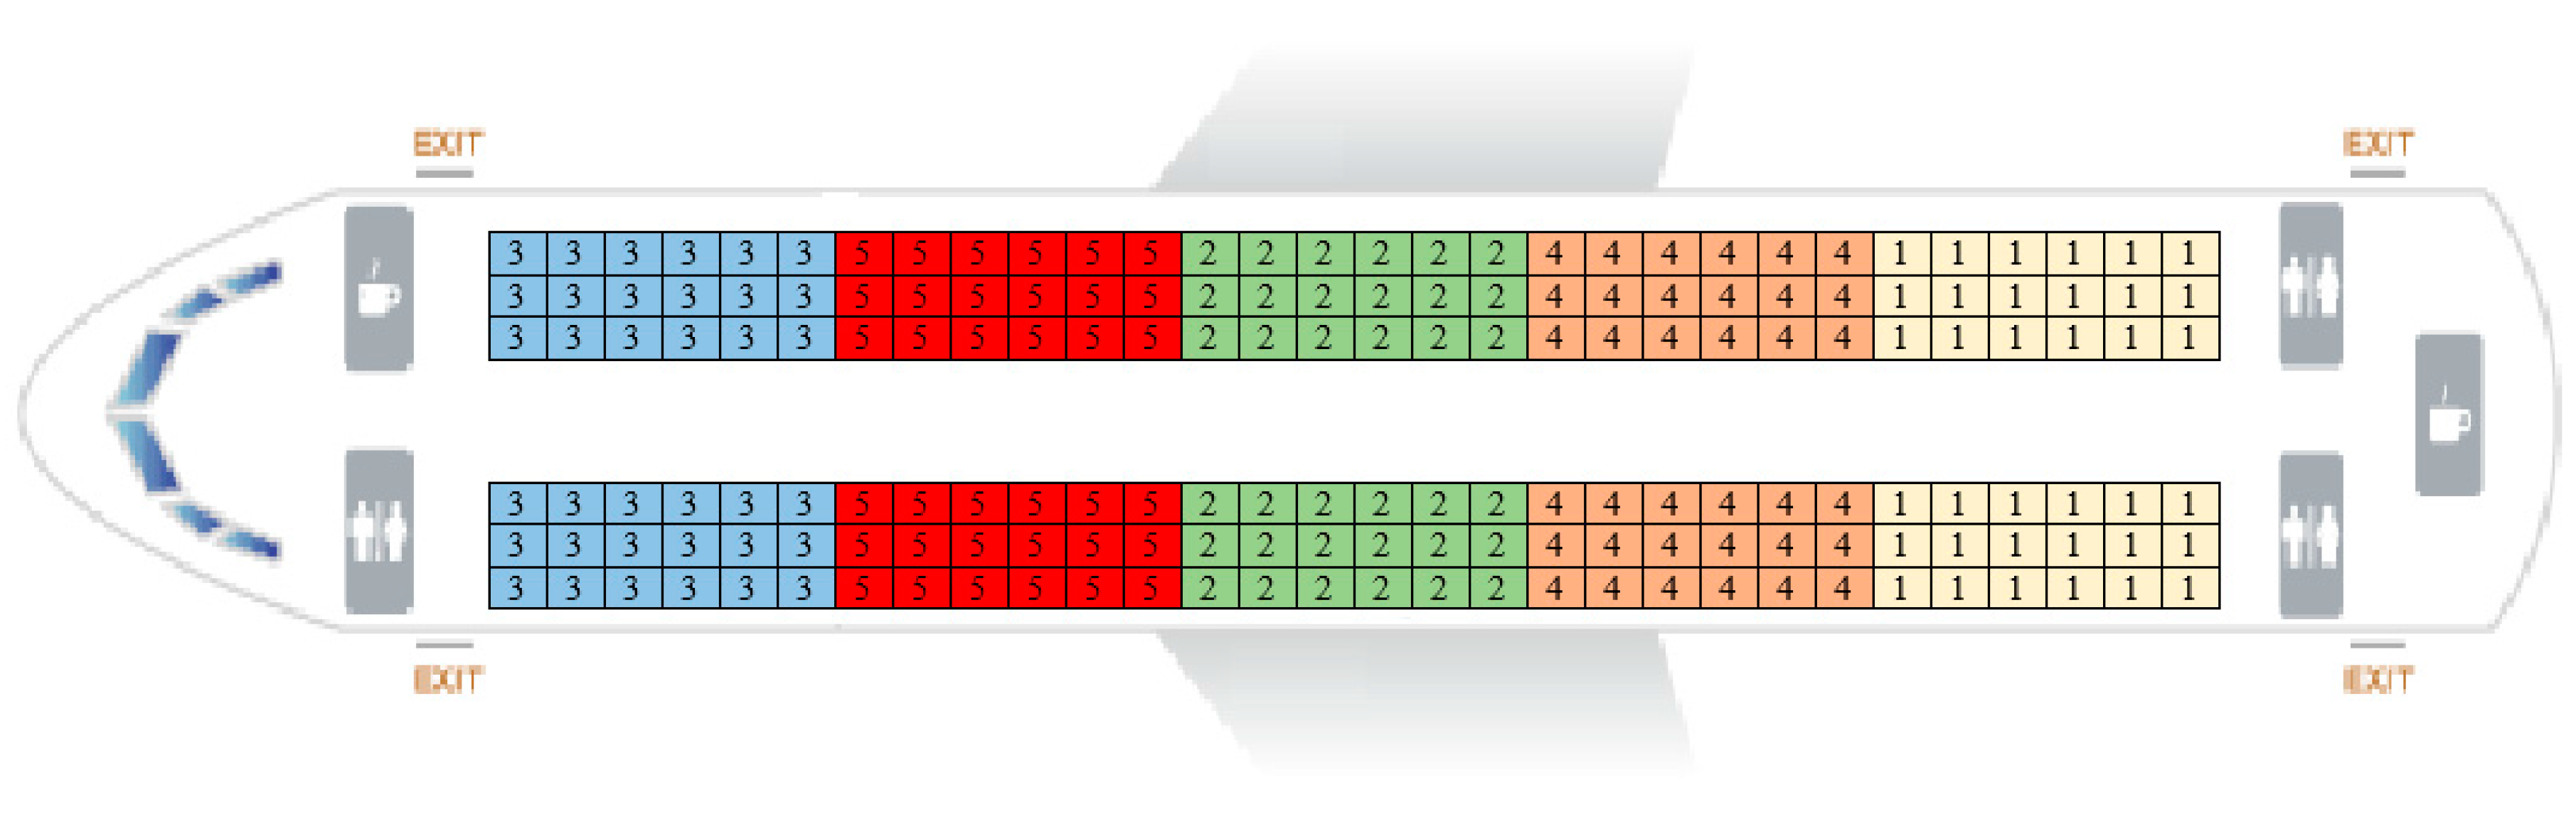
For the by-block strategies, the cabin has been divided into zones and the passengers have been sorted to step into cabin in accordance with their seats and the boarding strategy. For the non-traditional method, as it has a special topology, the airplane has been divided into four zones, with the first one having 1/3 of any other zone, being smaller than all the other zones (these have been considered almost equal—in accordance with the literature).
For the by-seat strategies, the passengers are called one by one for boarding, starting from one side of the cabin on the even rows and moving to the other side of the cabin once at the front with the seat allocation.
Figure 5 presents how the simulation can be visualized in real time while running the model. In the example in Figure 5, a smaller aircraft with only 16 seat rows has been used for a better visualization. In addition, some of the agents are carrying hand luggage (which reduces their speed, as mentioned in Table 4).
5.2. Boarding Methods’ Simulation
According to the literature, the most common configurations when simulating boarding techniques are A320 [4,5,13,15,17], A321 [7] and Boeing 757 [10]. As Boeing 757 has 22 rows for the economy class and 26 rows for economy and economy plus classes, we have decided to run our model on both A318 and A319 which have almost the same configuration as Boeing 757 when considering economy and/or economy plus, in addition to the A320 and A321 models, covering in this manner the simulations in the literature.
Thus, using BehaviourSearch 1.10 tool [38], 276,000 simulations were run on the four types of airplanes: A318, A319, A320 and A321 (Figure 6).
As Ferrari et al. [4] believed that the efficiency of the boarding strategies may depend on the aircraft occupancy, and different strategies may produce better results than others on the same aircraft model depending on the occupancy percentage, the simulations considered four airplane boarding loadings: 70%, 80%, 90% and 100% (a full flight).
For all the considered situations and airplane models, five situations have been identified regarding the hand luggage carrying inside the cabin:
- All the passengers are traveling without hand luggage;
- Only 50% of the passengers are carrying hand luggage in the cabin;
- All the passengers are carrying hand luggage in the cabin;
- Only 50% of the passengers are carrying hand luggage and they also need time to store it in the overhead compartment; and
- All the passengers are carrying hand luggage in the cabin and they need time to store it in the overhead compartment.
Each of the 24 boarding methods was run 100 times for the same passengers loading percentage, type of aircraft and luggage situation to determine its boarding time. An average time was determined based on these simulations and this time, expressed in ticks, was used when comparing the methods.
As the average time results for each method, type of airplane, passenger percentage, and luggage situation includes about 1920 values, we present in the following just the average time results for a particular situation: an A318 airplane, full flight with all five cases considered for the hand luggage. All other simulation results are available online along with the NetLogo program at the address mentioned at the end of the paper, and they are discussed within this section.
Thus, for an A318 full flight in which the passengers are not carrying any piece of hand luggage, the average boarding time ranges between 133 and 175 ticks. Three of the considered methods, BS15 (By-row-back-to-front), BS17 (By-half-row-back-to-front) and BS21 (Back-to-front-by-seating-order), score the best results, all of them providing a time of 133 ticks. Close to them in terms of time needed to board the aircraft we have the following boarding methods: BS11 (Half-block back-to-front) with 136.2 ticks, BS8 (Back-to-front) with 137.25 ticks and BS12 (Half-block-mix-1 back-to-front) with 137.6 ticks. On the other hand, the methods scoring the largest boarding time are: B10 (Front-to-back) with 172.6 ticks, BS20 (Non-traditional) with 172.8 ticks, and BS14 (By-row-front-to-back) and BS16 (By-half-row-front-to-back), both with 175 ticks. As for the Steffen methods (BS23 and BS24—variations in Steffen method), the time is 163 ticks, greater than the average time for this situation. WilMA scores even a higher time, of 168.5 ticks.
The two cases in which 50% of the passengers are carrying with them hand luggage (one without storing time (Figure 7) and the other one with storing time) are in line with the findings from the previous situation: the best methods are B15, B17 and B21 (with values of 165.8–166.8 in the “without storing” situation, and 180–184.6 in the “with storing” case), while the worst are still BS14 and BS16.
No change can be seen in the remaining two cases (all passengers are carrying cabin luggage with/without storing it). The best three methods average time ranges 202–204.5 ticks for the “without-storage” situation and 231.6–233 ticks for the “with-storage” case (Figure 8).
The best and worst boarding methods differences in terms of time are 42 ticks (without luggage case) and 69.1 ticks (all passengers with luggage and storing time). In real time, this can be translated into a time interval of [226.8; 373.14] seconds, which is somewhere between 3 min and 46 s and 6 min and 13 s. Considering an average cost of $53.5 (determined using the findings in [6,7]) and the average number of seconds (373.14 s) that can be saved by using the best method (in our case, any of BS15, BS17 or BS21) instead of the worst listed method (BS16) per a full-flight in which the passengers are carrying with them hand luggage, an amount of 373.14 s × $53.3/min = $331.47 can be saved for a single flight. As for the case in which none of them are carrying hand luggage with them, the saving will be equal to 226.8 s × $53.5/min = $202.23 per flight.
The rest of the simulation results are discussed in the sensitivity analysis below.
Table 5 summarizes the results of the grey incidence analysis performed on the considered cases.
The synthetic degree of grey incidence is calculated between the dependent variable (the average boarding time in all the methods) and four independent variables (aircraft dimensions, aircraft occupancy, passengers have hand luggage but they do not need time to store it, and passenger have hand luggage and they need time to store it). Considering the results, it can be underlined that the highest incidence on the boarding time is given by the number of passengers carrying big hand luggage which need time to be stored (an 0.807 incidence degree), followed by the aircraft occupancy (0.663), aircraft dimensions (0.579), and the passengers carrying small hand luggage (0.571). Based on these results, airline companies can decide whether to improve the hand luggage storage policy by offering free storing for the hand luggage in the aircraft’s cargo compartment upon check-in.
5.3. Sensitivity Analysis
The sensitivity analysis has been conducted based on the results obtained through simulation and by calculating the synthetic degree of grey incidence. The purpose is to see in detail the connection between the chosen boarding method and the variables mentioned above.
5.3.1. Effects of Aircraft Dimensions
Different aircraft configurations seem to have no effect over identifying the best boarding method. In all four cases (A318, A319, A320 and A321), the best methods are the same: BS15, BS21, BS17 and BS8, while the boarding methods resulting in the largest boarding time are still BS14 and BS16.
Thus, the overall boarding time is affected by the aircraft dimensions, the time increasing on average with 7.184 ticks per each full row (equivalent to 38.79 s/row), ranging between 6 ticks/row for the best performing boarding methods (BS15, BS21, BS17 and BS8), to 8 ticks/row for BS14 and BS16, for the case in which the passengers are boarding without luggage.
As in most cases the passengers are carrying hand luggage and they also need time to store it, the average time per full row is increasing by 51.9%, up to 10.91 ticks (58.91 s), taking values in the interval [8.83; 13.27] ticks.
5.3.2. Effects of Aircraft Occupancy
The aircraft occupancy seems to have a small influence on the selection of boarding methods and their performing times. Table 6 provides a ranking of the best boarding methods considering the aircraft occupancy.
It can be observed that BS15 and BS21 are listed under the best boarding methods irrespective of the passengers’ percentage within the aircraft, while BS21 is preferred to BS8 on partially-full flights. Nevertheless, both produce good results in terms of boarding time. As in the previous cases, BS14, BS20 and BS10 produce the least desirable results.
5.3.3. Effects of Carrying Hand Luggage without Storage
Two situations have been considered for this analysis: 50% of the passengers are carrying luggage without storing it, and all of the passengers have a carry on luggage that does not have to be stored in the overhead compartment. For both situations, the best boarding methods are the same as above, and they only depend on the type of flight (as presented in Table 6). Thus, the selection of the best boarding methods is not influenced by the fact that the passengers have hand luggage.
It is worth mentioning that carrying a hand luggage in the cabin slows down the boarding process on an A318 aircraft by [40.66, 77.36] ticks, which is equivalent to an interval of 3.5 to 7 minutes, and by [68.23, 131.1] ticks (equivalent to 6 to 8 minutes) on an A321.
In addition, it has been observed that each passenger carrying hand luggage produces a boarding delay, on average, of 3.27 s.
5.3.4. Effects of Carrying Hand Luggage with Storage
The same situations as in the previous case have been considered: 50% and, respectively 100% of passengers have a carry on luggage but this time the luggage needs to be stored in the overhead compartment. The results are similar to the ones above, showing that carrying hand luggage does not change the selection of the best boarding methods- it only has effects on the overall boarding time.
The boarding time increases, on average, by 8 to 14 minutes, depending on the percentage of the passengers that are carrying a luggage.
6. Conclusions
After considering all 24 boarding methods, the following findings can be highlighted:
- The selection of the best boarding methods is not affected by the size of the aircraft (given by the number of rows), or whether passengers are carrying hand luggage and they need or not to store it in the overhead compartment.
- The number of passengers taking a flight might have a small influence on the identification of the fastest boarding methods: BS8 (Back-to-front) works better on partially full flights, while BS21 (Back-to-front-by-seating-order) produces better results on full flights.
- Considering all situations, the 24 boarding methods have been ranked according to the average boarding time (Table 7) in descending order, starting with the fastest boarding method.
- The boarding time depends mostly on the number of passengers who carry hand luggage and need time to store it as they block the aisle, and it is less dependent on the aircraft size, occupancy and number of passengers carrying luggage without needing time to store it.
- Analysing the methods listed in Table 7, the best are based on the back-to-front approach, no matter the level of granularity (by group or by seat). This result was expected as, by boarding first the passengers in the back of the aircraft, they will no longer interference with the passengers boarding in the front of the aircraft and, in this way, they cannot delay them. The findings are in line with [17] and with the methods used in practice by airline companies.
- Following the same thinking and looking at the boarding methods that ranked the lowest, we notice that most are based on the front-to-back approach which, in fact, blocks the whole aircraft for the time needed for the passengers in the front to find their seats; this was again and expected result;
- BS15 (By-row-back-to-front) and BS21 (Back-to-front-by-seating-order) produce the best results irrespective of the airplane occupancy. However, even though they are faster in terms of boarding time than BS8 (Back-to-front), one can better choose BS8 due to the granularity degree. For example, it is easier to invite for boarding a group formed by the passengers occupying the last six rows of the airplane than calling each passenger one-by-one as in BS21, or each row as in BS15. Depending on their infrastructure, airline companies may take this aspect into account when deciding upon the best method to use.
- Some of the well-known methods from the literature, such as BS23 (Steffen), BS24 (Steffen variations), and BS2 (WilMA), did not produced the expected results while others like, for example BS23 and BS24, are quite hard to implement without the proper infrastructure as each passenger has to be called for boarding.
- Choosing the right method can reduce the costs by $202.23–$331.47 per flight, which will have a positive impact on the airline company’s costs, passengers, airport operational activity, and environment through the reduction of pollution, as the airplane waits less in the terminal, thus ensuring the sustainability of this type of transportation.
One of the limitations of this study it that it uses agents to simulate the passengers’ airplane boarding. Agents are rational, possessing the property of veracity irrespective of the situation, and acting upon the given rules, while, in reality, humans might act irrationally, and sometimes they disobey the rules. Thus, in reality, we might have cases in which a person is late for boarding, or misses their place in the aircraft, either intentionally or unintentionally, and needs to go back through the aisle, increasing the boarding time and the other passengers discomfort. These aspects have not been considered in the present study, but they will be the purpose of future research.
In addition, for further research, we aim to implement the two open seating methods and compare them against the fastest methods presented in this paper.
To this purpose, a questionnaire will be needed that will help us better understand the human behaviour and use it to create agents that behave as close as possible to humans.
The NetLogo 6.0.2 and the simulations made in this paper can be accessed at the following address: https://github.com/liviucotfas/ase-2018-sustainability.
Author Contributions
Conceptualization, C.D. and R.P.; Methodology, C.D.; Software, L.-A.C.; Validation, C.D., R.P. and L.-A.C.; Formal Analysis, C.D.; Investigation, L.-A.C. and R.P.; Resources, R.P.; Data Curation, R.P.; Writing—Original Draft Preparation, C.D.; Writing—Review and Editing, C.D. and L.-A.C.; Visualization, R.P. and L.-A.C.; and Supervision, C.D., R.P. and L.-A.C.
Funding
This research received no external funding.
Acknowledgments
The authors acknowledge the support of Leverhulme Trust International Network research project “IN-2014-020” through which a grey systems research network has been formed, encouraging the development of ideas and the use of grey systems within the economic analysis and applications. This research has also been partially supported by Webster University, Thailand campus.
Conflicts of Interest
The authors declare no conflict of interest.
Appendix A. Airplane Boarding Strategies
Figure A1.
Random.

Figure A2.
WilMA.

Figure A3.
Window to aisle half block.

Figure A4.
Window to aisle alternate.

Figure A5.
Reverse pyramid.

Figure A6.
Reverse pyramid half-zone (1).

Figure A7.
Reverse pyramid half-zone (2).

Figure A8.
Back-to-front boarding (5 zones).

Figure A9.
Back-to-front mix.

Figure A10.
Front-to-back boarding (1/4 of the aircraft).

Figure A11.
Half-block (back-to-front).

Figure A12.
Half-block mix (1).

Figure A13.
Half-block mix (2).

Figure A14.
By-row (front-to-back).

Figure A15.
By row (back-to-front).

Figure A16.
By half-row (front-to-back).

Figure A17.
By half-row (back-to-front).

Figure A18.
Rotating zone (with 5 zones).

Figure A19.
Modified optimal method.

Figure A20.
Non-traditional method.

Figure A21.
Back to front by seating order [10].
Figure A21.
Back to front by seating order [10].

Figure A22.
By seat descending order.

Figure A23.
Steffen method.

Figure A24.
Variation in Steffen method [9].
Figure A24.
Variation in Steffen method [9].

Appendix B. Comparison of Different Agent-Based Modelling Platforms

| Issue | ABM Platforms | ||||
|---|---|---|---|---|---|
| StarLogo | Swarm | NetLogo | Repast | Mason | |
| Date | 1990 | 1996 | 1999 | 2000 | 2003 |
| Developer | Massachusetts Institute of Technology | Santa Fe Institute | Northwestern University | University of Chicago | George Mason University |
| Website | http://education.mit.edu/starlogo | http://www. swarm.org/mailman/listinfo | http://ccl.northwestern.edu/netlogo/ | http://repast.sourceforge.net | http://cs.gmu.edu/~eclab/projects/mason |
| Operating System | Windows, UNIX, Linux | Windows, UNIX, Linux, Mac OSX | Windows, UNIX, Linux, Mac OSX | Windows, UNIX, Linux, Mac OSX | Windows, UNIX, Linux, Mac |
| Documentation | Limited | Uneven | Good | Limited | Limited |
| Ease of installation | Very easy | Poor | Very easy | Easy | Easy |
| Programming skills needed | Basic | Strong | Basic | Strong | Strong |
| Integrated GIS functionally | No | Yes | Yes | Yes | No |
| Integrated graphics | Yes | Yes | Yes | Yes | No |
| Object that builds and controls screen graphics | Interface | Observer swarm | Interface | None | ModelWithUI |
| Object that builds and controls simulation objects | Observer | Model swarm | Observer | Model | Model |
| Object that represents space and agent locations | Spaceland (world) | Space | World | Space | Field |
| User-opened display of an agent’s state | Monitor | Probe display | Monitor | Probe | Inspector |
| An agent behaviour or event to be executed | Procedure | Action | Procedure | Action | Steppable |
| Execution speed | Moderate | Moderate | Moderate | Fast | Very fast |
References
- Steffen, J.H. Optimal boarding method for airline passengers. J. Air Transp. Manag. 2008, 14, 146–150. [Google Scholar] [CrossRef] [Green Version]
- Dorndorf, U.; Jaehn, F.; Pesch, E. Flight gate scheduling with respect to a reference schedule. Ann. Oper. Res. 2012, 194, 177–187. [Google Scholar] [CrossRef]
- Jaehn, F.; Neumann, S. Airplane boarding. Eur. J. Oper. Res. 2015, 244, 339–359. [Google Scholar] [CrossRef]
- Ferrari, P.; Nagel, K. Robustness of Efficient Passenger Boarding Strategies for Airplanes. Transp. Res. Rec. J. Transp. Res. Board 2005, 1915, 44–54. [Google Scholar] [CrossRef]
- Soolaki, M.; Mahdavi, I.; Mahdavi-Amiri, N.; Hassanzadeh, R.; Aghajani, A. A new linear programming approach and genetic algorithm for solving airline boarding problem. Appl. Math. Model. 2012, 36, 4060–4072. [Google Scholar] [CrossRef]
- Nyquist, D.C.; McFadden, K.L. A study of the airline boarding problem. J. Air Transp. Manag. 2008, 14, 197–204. [Google Scholar] [CrossRef]
- Steiner, A.; Philipp, M. Speeding up the airplane boarding process by using pre-boarding areas. In Proceedings of the 9th Swiss Transport Research Conference, Ascona, Switzerland, 9–11 September 2009. [Google Scholar]
- Horstmeier, T.; de Haan, F. Influence of ground handling on turn round time of new large aircraft. Aircr. Eng. Aerosp. Technol. 2001, 73, 266–271. [Google Scholar] [CrossRef]
- Jafer, S.; Mi, W. Comparative Study of Aircraft Boarding Strategies Using Cellular Discrete Event Simulation. Aerospace 2017, 4, 57. [Google Scholar] [CrossRef]
- Steffen, J.H.; Hotchkiss, J. Experimental test of airplane boarding methods. J. Air Transp. Manag. 2012, 18, 64–67. [Google Scholar] [CrossRef] [Green Version]
- Milne, R.J.; Kelly, A.R. A new method for boarding passengers onto an airplane. J. Air Transp. Manag. 2014, 34, 93–100. [Google Scholar] [CrossRef]
- Steffen, J.H. A statistical mechanics model for free-for-all airplane passenger boarding. Am. J. Phys. 2008, 76, 1114–1119. [Google Scholar] [CrossRef] [Green Version]
- Van den Briel, M.H.L.; Villalobos, J.R.; Hogg, G.L.; Lindemann, T.; Mulé, A.V. America West Airlines Develops Efficient Boarding Strategies. Interfaces 2005, 35, 191–201. [Google Scholar] [CrossRef]
- Airplane Turn Time. Available online: http://www.boeing.com/commercial/aeromagazine/aero_01/textonly/t01txt.html (accessed on 30 May 2018).
- Bazargan, M. A linear programming approach for aircraft boarding strategy. Eur. J. Oper. Res. 2007, 183, 394–411. [Google Scholar] [CrossRef]
- Schultz, M. The Seat Interference Potential as an Indicator for the Aircraft Boarding Progress; SAE International: Warrendale, PA, USA, 2017. [Google Scholar]
- Van Landeghem, H.; Beuselinck, A. Reducing passenger boarding time in airplanes: A simulation based approach. Eur. J. Oper. Res. 2002, 142, 294–308. [Google Scholar] [CrossRef]
- Tang, T.-Q.; Wu, Y.-H.; Huang, H.-J.; Caccetta, L. An aircraft boarding model accounting for passengers’ individual properties. Transp. Res. Part C Emerg. Technol. 2012, 22, 1–16. [Google Scholar] [CrossRef]
- Bachmat, E.; Berend, D.; Sapir, L.; Skiena, S.; Stolyarov, N. Analysis of Airplane Boarding Times. Oper. Res. 2009, 57, 499–513. [Google Scholar] [CrossRef] [Green Version]
- Kierzkowski, A.; Kisiel, T. The Human Factor in the Passenger Boarding Process at the Airport. Procedia Eng. 2017, 187, 348–355. [Google Scholar] [CrossRef]
- Qiang, S.-J.; Jia, B.; Xie, D.-F.; Gao, Z.-Y. Reducing airplane boarding time by accounting for passengers’ individual properties: A simulation based on cellular automaton. J. Air Transp. Manag. 2014, 40, 42–47. [Google Scholar] [CrossRef]
- Notomista, G.; Selvaggio, M.; Sbrizzi, F.; Di Maio, G.; Grazioso, S.; Botsch, M. A fast airplane boarding strategy using online seat assignment based on passenger classification. J. Air Transp. Manag. 2016, 53, 140–149. [Google Scholar] [CrossRef]
- Alex, M. Andrew Why the world is grey. Grey Syst. Theory Appl. 2011, 1, 112–116. [Google Scholar] [CrossRef]
- Liu, S.; Yang, Y.; Xie, N.; Forrest, J. New progress of Grey System Theory in the new millennium. Grey Syst. Theory Appl. 2016. [Google Scholar] [CrossRef]
- Liu, S.; Yang, Y.; Forrest, J. Grey Data Analysis: Methods, Models and Applications; Computational Risk Management; Springer: Singapore, 2017; ISBN 978-981-10-1840-4. [Google Scholar]
- Liu, S.; Zhang, H.; Yang, Y. Explanation of terms of grey incidence analysis models. Grey Syst. Theory Appl. 2017, 7, 136–142. [Google Scholar] [CrossRef]
- Delcea, C. Grey systems theory in economics–bibliometric analysis and applications’ overview. Grey Syst. Theory Appl. 2015, 5, 244–262. [Google Scholar] [CrossRef]
- Delcea, C. Grey systems theory in economics–a historical applications review. Grey Syst. Theory Appl. 2015, 5, 263–276. [Google Scholar] [CrossRef]
- Delcea, C. Not Black Not even White Definitively Grey Economic Systems. J. Grey Syst. 2014, 26, 11–25. [Google Scholar]
- Liu, S.; Lin, Y. Grey Systems; Understanding Complex Systems; Springer: Berlin/Heidelberg, Germany, 2011; Volume 68, ISBN 978-3-642-16157-5. [Google Scholar]
- Cotfas, L.-A.; Delcea, C.; Segault, A.; Roxin, I. Semantic Web-Based Social Media Analysis. In Transactions on Computational Collective Intelligence XXII; Springer: Berlin/Heidelberg, Germany, 2016; pp. 147–166. [Google Scholar]
- Lian, Z.W.; Dang, Y.G.; Wang, Z.X.; Song, R.X. Grey distance incidence degree and its properties. In Proceedings of the 2009 IEEE International Conference on Grey Systems and Intelligent Services (GSIS 2009), Nanjing, China, 10–12 November 2009; pp. 37–41. [Google Scholar]
- Delcea, C.; Bradea, I.A. Economic Cybernetics. An Equation-Based Modeling and Agent-Based Modeling Approach; Editura Universitara: Bucuresti, Romania, 2017; ISBN 978-606-28-0629-3. [Google Scholar]
- Chen, L. Agent-based modeling in urban and architectural research: A brief literature review. Front. Arch. Res. 2012, 1, 166–177. [Google Scholar] [CrossRef]
- Tobias, R.; Hofmann, C. Evaluation of free Java-libraries for social-scientific agent based simulation. JASSS 2004, 7, 1–29. [Google Scholar]
- Railsback, S.F.; Lytinen, S.L.; Jackson, S.K. Agent-based Simulation Platforms: Review and Development Recommendations. Simulation 2006, 82, 609–623. [Google Scholar] [CrossRef]
- Caballero, A.; Botía, J.; Gómez-Skarmeta, A. Using cognitive agents in social simulations. Eng. Appl. Artif. Intell. 2011, 24, 1098–1109. [Google Scholar] [CrossRef]
- Wilensky, U.; Rand, W. An Introduction to Agent-Based Modeling: Modeling Natural, Social, and Engineered Complex Systems with NetLogo; The MIT Press: Cambridge, MA, USA, 2015; ISBN 978-0-262-73189-8. [Google Scholar]
- Li, Y.; Du, T.; Peng, J. Understanding Out-of-Home Food Environment, Family Restaurant Choices, and Childhood Obesity with an Agent-Based Huff Model. Sustainability 2018, 10, 1575. [Google Scholar] [CrossRef]
- Oloo, F.; Safi, K.; Aryal, J. Predicting Migratory Corridors of White Storks, Ciconia ciconia, to Enhance Sustainable Wind Energy Planning: A Data-Driven Agent-Based Model. Sustainability 2018, 10, 1470. [Google Scholar] [CrossRef]
- Wu, J.; Mohamed, R.; Wang, Z. An Agent-Based Model to Project China’s Energy Consumption and Carbon Emission Peaks at Multiple Levels. Sustainability 2017, 9, 893. [Google Scholar] [CrossRef]
- Zheng, K.; Jia, S. Promoting the Opportunity Identification of Industrial Symbiosis: Agent-Based Modeling Inspired by Innovation Diffusion Theory. Sustainability 2017, 9, 765. [Google Scholar] [CrossRef]
- Jiang, W.; Liu, J.; Liu, X. Impact of Carbon Quota Allocation Mechanism on Emissions Trading: An Agent-Based Simulation. Sustainability 2016, 8, 826. [Google Scholar] [CrossRef]
- Bai, X.; Yan, H.; Pan, L.; Huang, H. Multi-Agent Modeling and Simulation of Farmland Use Change in a Farming–Pastoral Zone: A Case Study of Qianjingou Town in Inner Mongolia, China. Sustainability 2015, 7, 14802–14833. [Google Scholar] [CrossRef] [Green Version]
- Vo, T.T.A.; van der Waerden, P.; Wets, G. Micro-simulation of Car Drivers’ Movements at Parking Lots. Procedia Eng. 2016, 142, 100–107. [Google Scholar] [CrossRef]
- Shiflet, A.B.; Shiflet, G.W. An Introduction to Agent-based Modeling for Undergraduates. Procedia Comput. Sci. 2014, 29, 1392–1402. [Google Scholar] [CrossRef]
- Dickes, A.C.; Sengupta, P. Learning Natural Selection in 4th Grade with Multi-Agent-Based Computational Models. Res. Sci. Educ. 2013, 43, 921–953. [Google Scholar] [CrossRef]
- Visintainer, T.; Linn, M. Sixth-Grade Students’ Progress in Understanding the Mechanisms of Global Climate Change. J. Sci. Educ. Technol. 2015, 24, 287–310. [Google Scholar] [CrossRef]
- Waight, N.; Gillmeister, K. Teachers and Students’ Conceptions of Computer-Based Models in the Context of High School Chemistry: Elicitations at the Pre-intervention Stage. Res. Sci. Educ. 2014, 44, 335–361. [Google Scholar] [CrossRef]
- Badham, J. Review of An Introduction to Agent-Based Modeling: Modeling Natural, Social, and Engineered Complex Systems with NETLogo. Available online: http://jasss.soc.surrey.ac.uk/18/4/reviews/2.html (accessed on 31 July 2016).
- Banitz, T.; Gras, A.; Ginovart, M. Individual-based modeling of soil organic matter in NetLogo: Transparent, user-friendly, and open. Environ. Model. Softw. 2015, 71, 39–45. [Google Scholar] [CrossRef] [Green Version]
- Klopfer, E.; Scheintaub, H.; Huang, W.; Wendel, D. StarLogo TNG. In Artificial Life Models in Software; Komosinski, M., Adamatzky, A., Eds.; Springer: London, UK, 2009; pp. 151–182. ISBN 978-1-84882-284-9. [Google Scholar]
- Gao, M.; Zhou, L.; Chen, Y. An Alternative Approach for High Speed Railway Carrying Capacity Calculation Based on Multiagent Simulation. Discret. Dyn. Nat. Soc. 2016, 2016, e4278073. [Google Scholar] [CrossRef]
- Riaz, F.; Jabbar, S.; Sajid, M.; Ahmad, M.; Naseer, K.; Ali, N. A collision avoidance scheme for autonomous vehicles inspired by human social norms. Comput. Electr. Eng. 2018. [Google Scholar] [CrossRef]
Figure 1.
Airplane boarding strategies classification.

Figure 2.
Example of a patch’s characteristics.

Figure 3.
The proposed agent-based model interface.

Figure 4.
Aircraft configuration.

Figure 5.
Simulating (modified optimal method, full aircraft, 62% passengers with hand luggage).

Figure 6.
Simulating using BehaviourSearch 1.10 tool.

Figure 7.
A318: Full flight simulation results with luggage (50%) without luggage.

Figure 8.
A318: Full flight simulation results with luggage (100%) and storing time.

Table 1.
Open seating strategies description.
| Boarding | Classification | Boarding Method | Boarding Strategy |
|---|---|---|---|
| Open seating | Random | Random boarding method (without assigned seat) | Passengers line up and take a seat in no particular order. In this strategy, the first class passengers are boarded first, while the other passengers are boarded in one zone randomly, on a first-come first-serve basis. |
| By group | Open seating method by group | Passengers are assigned a group and boarding number based on check-in times. After the group is called, passengers take a position next to the column representing their number and proceed onto the aircraft. Passengers choose their own seats once on-board. |
Table 2.
By group strategies description.
| Classification | Boarding Method | Code | Boarding Strategy |
|---|---|---|---|
| By group | Outside-in/WilMA | BS2 | Or the Window-Middle-Aisle method. The first class passengers are boarded firstly, then the passengers in window seats, followed by the middle seats and last the aisle seats. Basically, here we have the sequence of seats: (F, A), (E, B), (D, C) (Figure A2). |
| Window to aisle half block | BS3 | The seating starts from the window to the aisle in just one side of the airplane. Considering the letters associated to the seats, the order of placing the groups is: F, E, D, A, B, C (Figure A3). | |
| Window to aisle alternate | BS4 | The seating starts from the window to the aisle, by alternation of the groups: F, A, E, B, D, C (Figure A4). | |
| Reverse pyramid | BS5 | Window seats first, followed by middle, then aisle and loading diagonally (Figure A5). | |
| Reverse pyramid half-zone (1) | BS6 | The same idea as for the reverse pyramid (1) but on half zones, loading diagonally (with 8 zones) (Figure A6). | |
| Reverse pyramid half-zone (2) | BS7 | As reverse pyramid half-zone (1) but with 10 zones (Figure A7). | |
| Back-to-front method | BS8 | It consists in boarding the first class firstly. Then, the rest of the passengers are boarded by groups, starting from the rear of the aircraft and moving forward, about 1/5 of the rows at a time (Figure A8). | |
| Back-to-front mix | BS9 | The groups are seated in the rear, after that in the middle, in the front, then back again and front (Figure A9). | |
| Front-to-back method | BS10 | By groups, starting at the front of the aircraft and moving forward, about 1/4 of aircraft at a time (Figure A10). | |
| Half-block (back-to-front) | BS11 | Passengers of some consecutive rows on one side of the aisle board together (Figure A11). | |
| Half-block mix (1) | BS12 | It starts from the rear in just one side of the airplane, then in diagonal on the other side, after that diagonal on the initial side and so on until reaches the front. For the unseated places it starts again from the rear in diagonal until one reaches the front (Figure A12). | |
| Half-block mix (2) | BS13 | Starts from the rear in just one side of the airplane, after that on the same side in the middle, in front, then back to the rear, and front again. After one side of the airplane is done, one should continue in the same way with the other one (Figure A13). | |
| By row front-to-back | BS14 | By rows, starting in the front of the aircraft and moving to the rear (Figure A14). | |
| By row back-to-front | BS15 | By rows, starting at the rear of the aircraft and moving forward, a row at a time (Figure A15). | |
| By half-row front-to-back | BS16 | Starting in the front of the aircraft and moving forward to the rear in just one part of the aircraft, a half-row at a time (Figure A16). | |
| By half-row back-to-front | BS17 | Starting at the rear of the aircraft and moving forward in just one part of the aircraft, a half-row at a time (Figure A17). | |
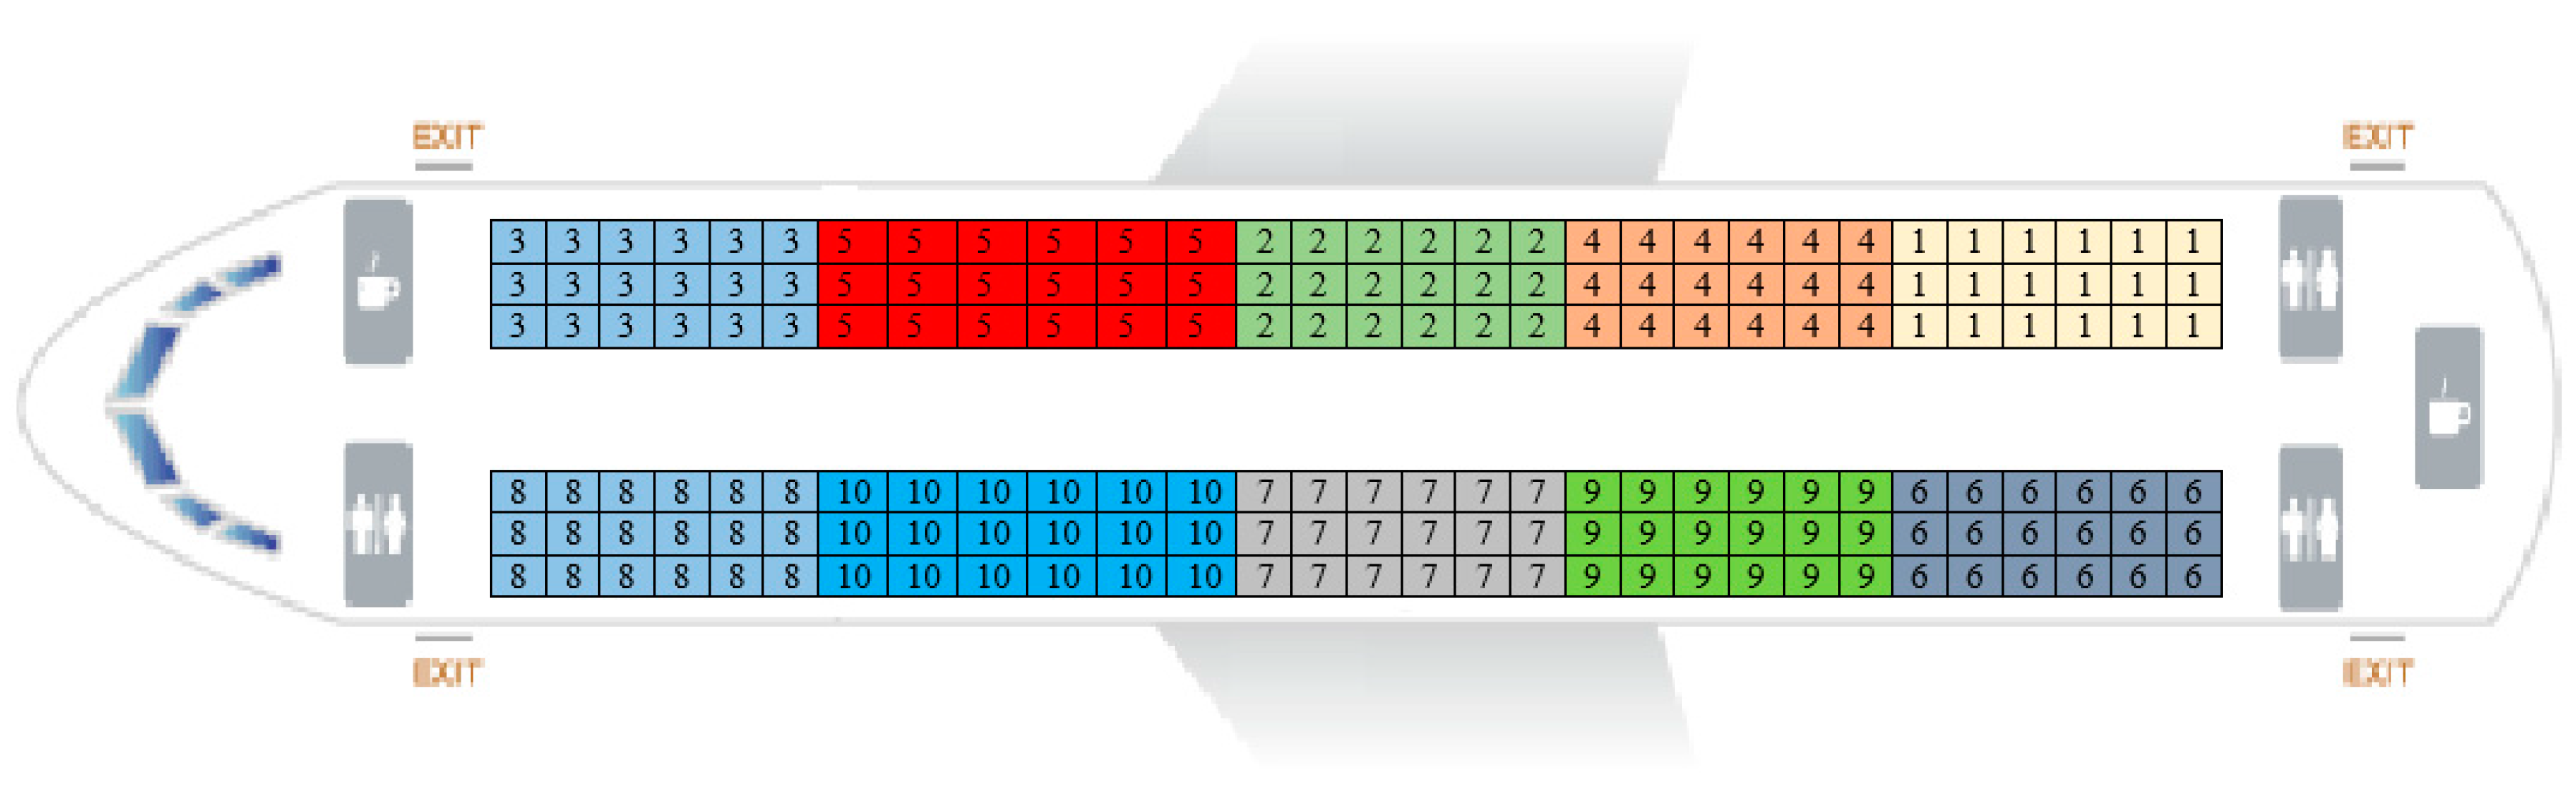
| Rotating zone | BS18 | The passengers sitting in the middle of the aircraft are boarded last, while the other passengers are divided based on their sitting zones and boarded first in the front, then in the back, in the front again, then back and so on (Figure A18). | |
| Modified optimal method | BS19 | As Steffen admits that the Steffen method is hard to realize in practice, he develops the modified optimal method. This method consists in four boarding groups with each group encompassing every second half-row of one side of the aisle. Therefore, the passengers who sit in a row with an even number on one side of the aisle board together. In the same way, those who sit in a row with an odd number on the same side board as a group. The same works for the passengers sitting on the other side of the aisle (Figure A19). | |
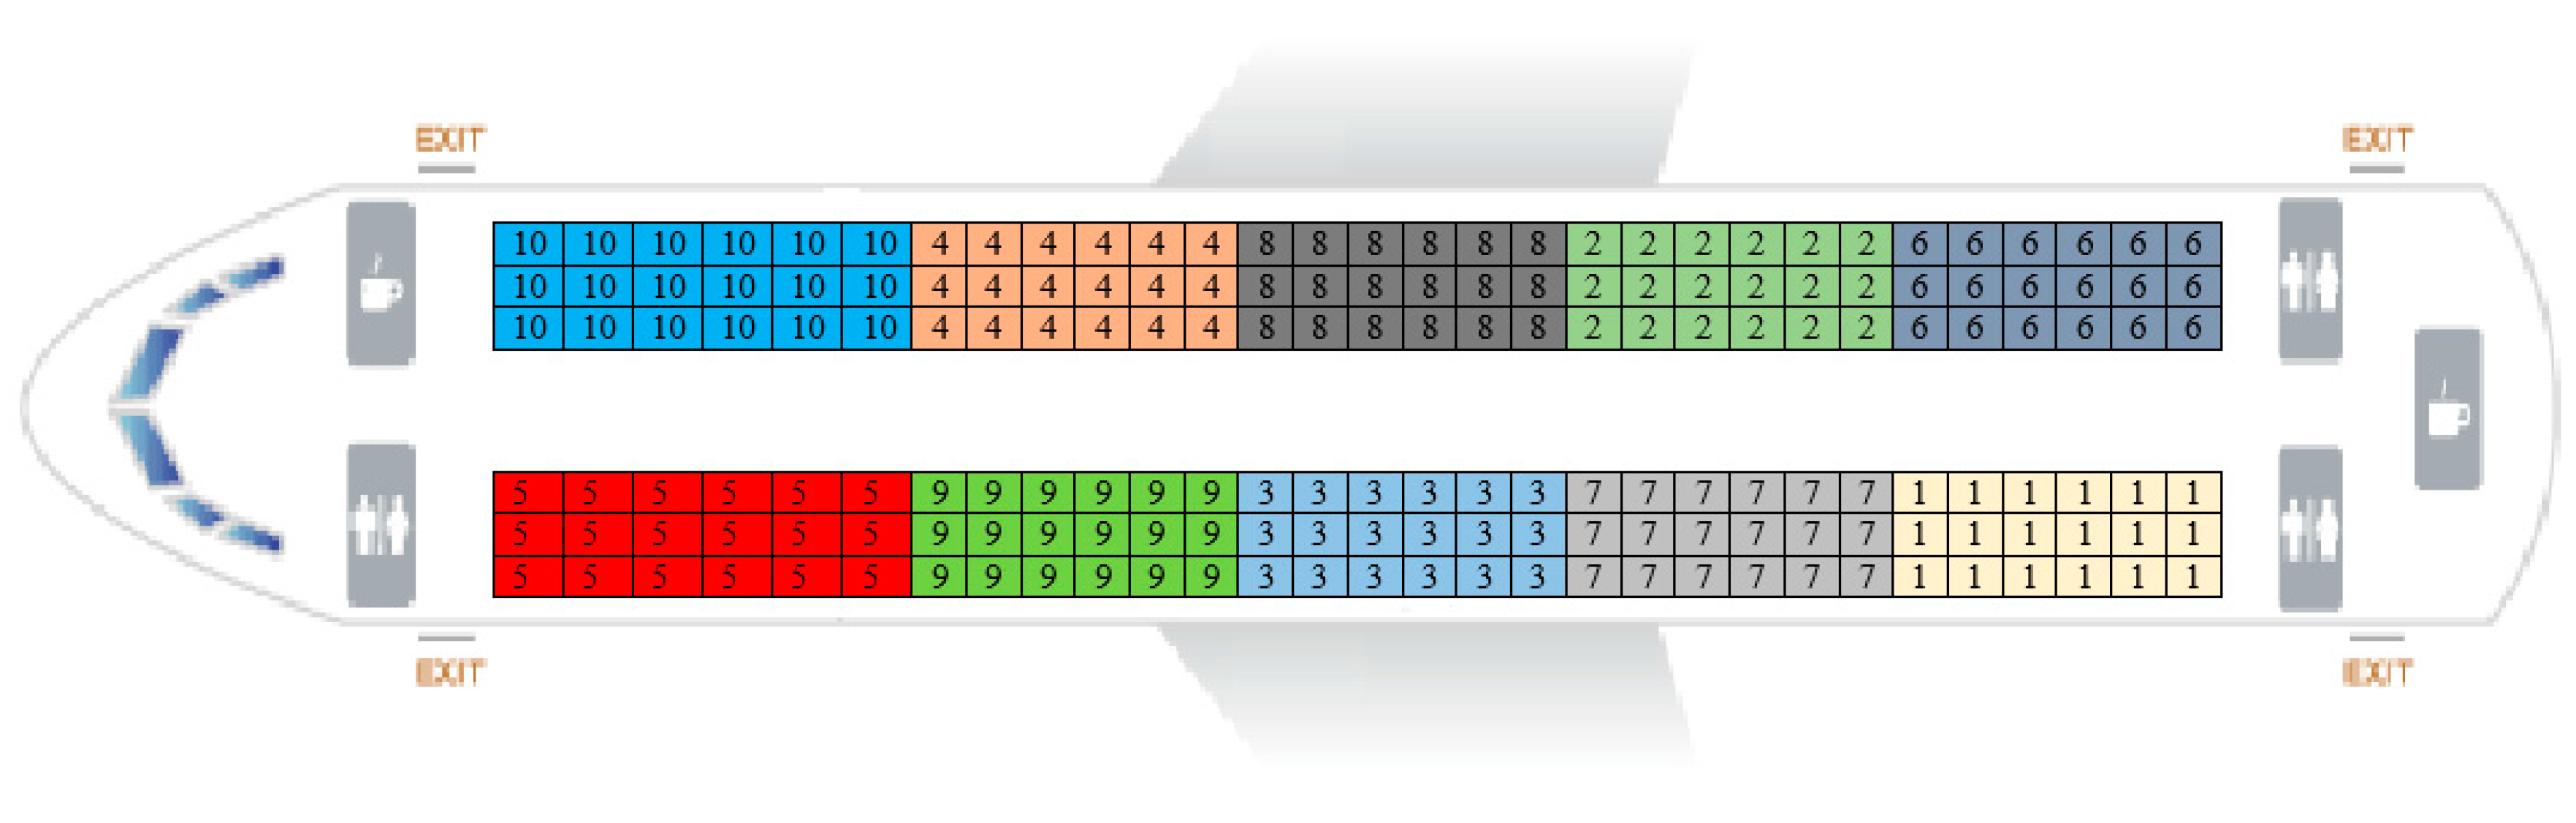
| Non-traditional method | BS20 | By zones, starting with the back few rows, followed by the middle and then front sections, then back to a rear section (Figure A20). |
Table 3.
By seat strategies description.
| Classification | Boarding Method | Code | Boarding Strategy |
|---|---|---|---|
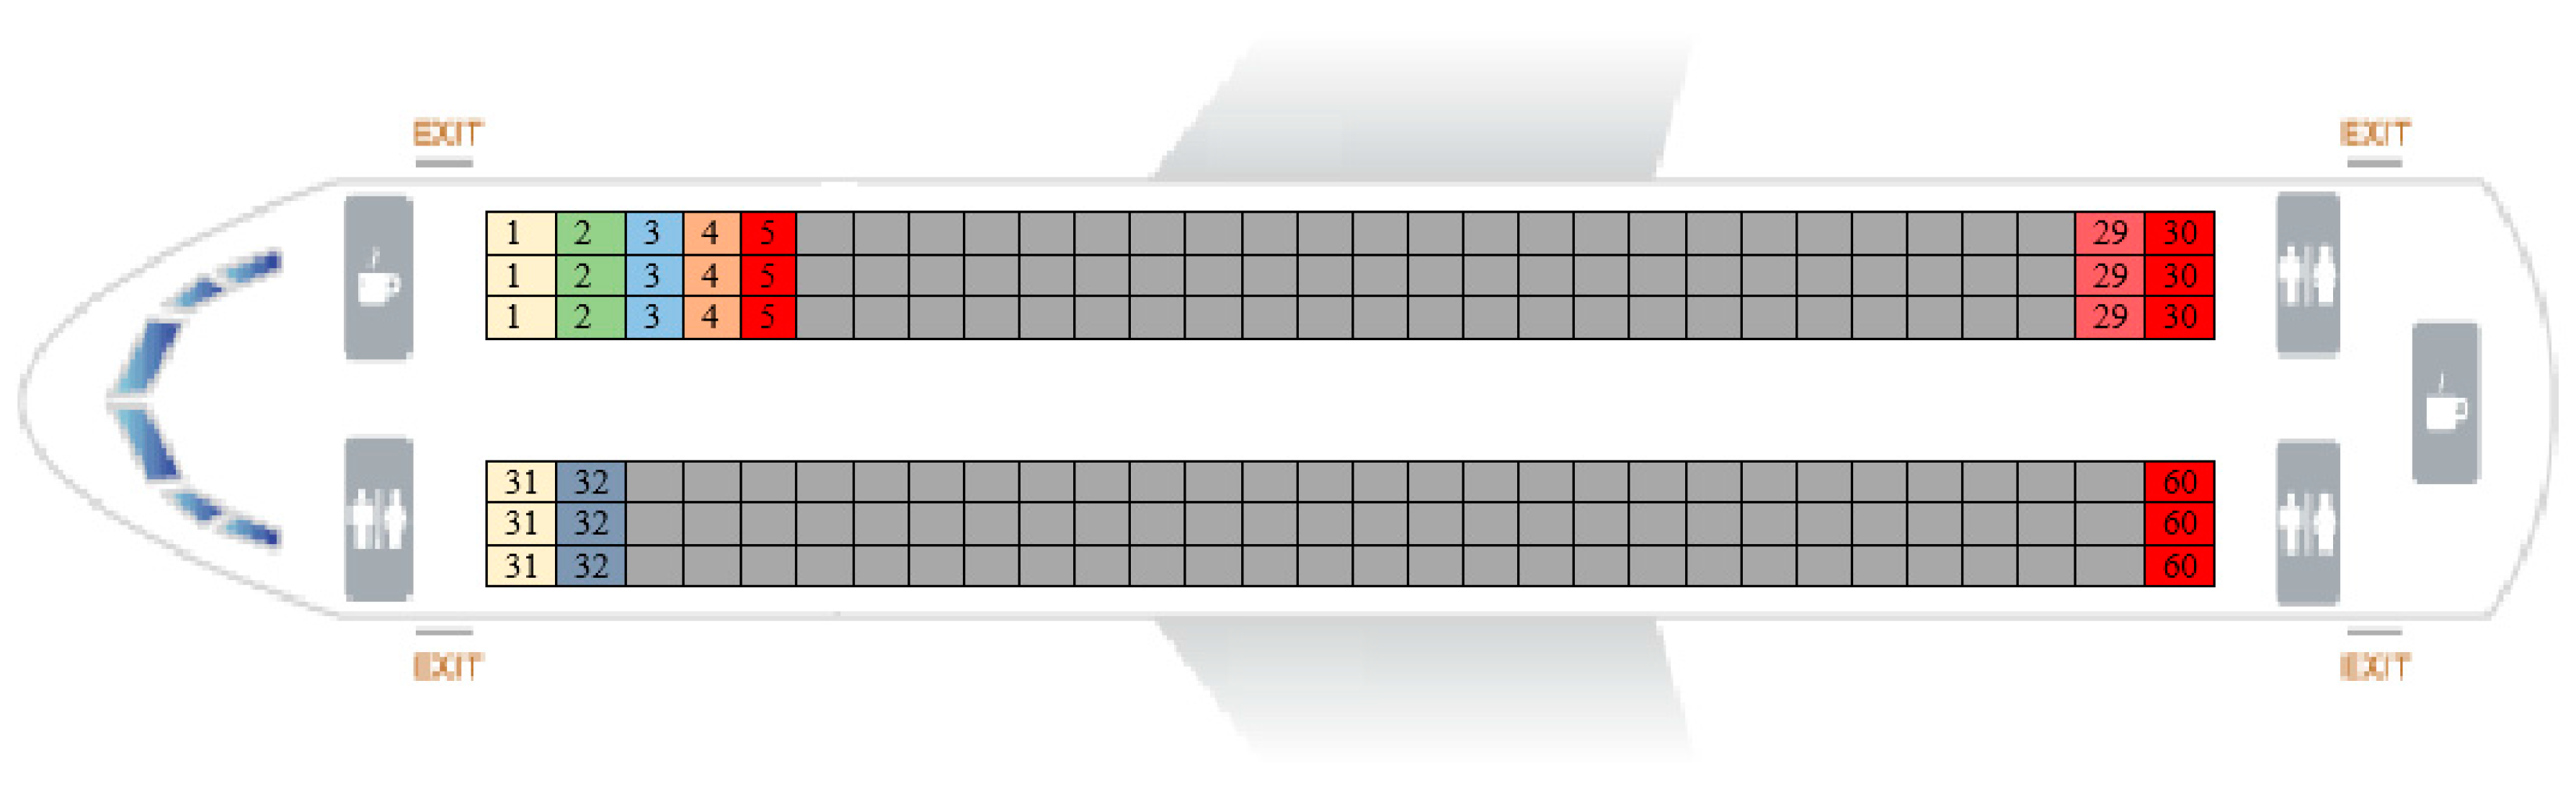
| By seat | Back to front by seating order | BS21 | On seats, the first seat is in the last row of the rear near the window on one side of the plane, followed by another one near the other window on the same row. The third seat is in the middle next to the first one, the fourth is in the middle next to the second one. The fifth seat is in the aisle near the third one, while the sixth is near the fourth. The seating continues in the same manner until 180th seat is reached (Figure A21). |
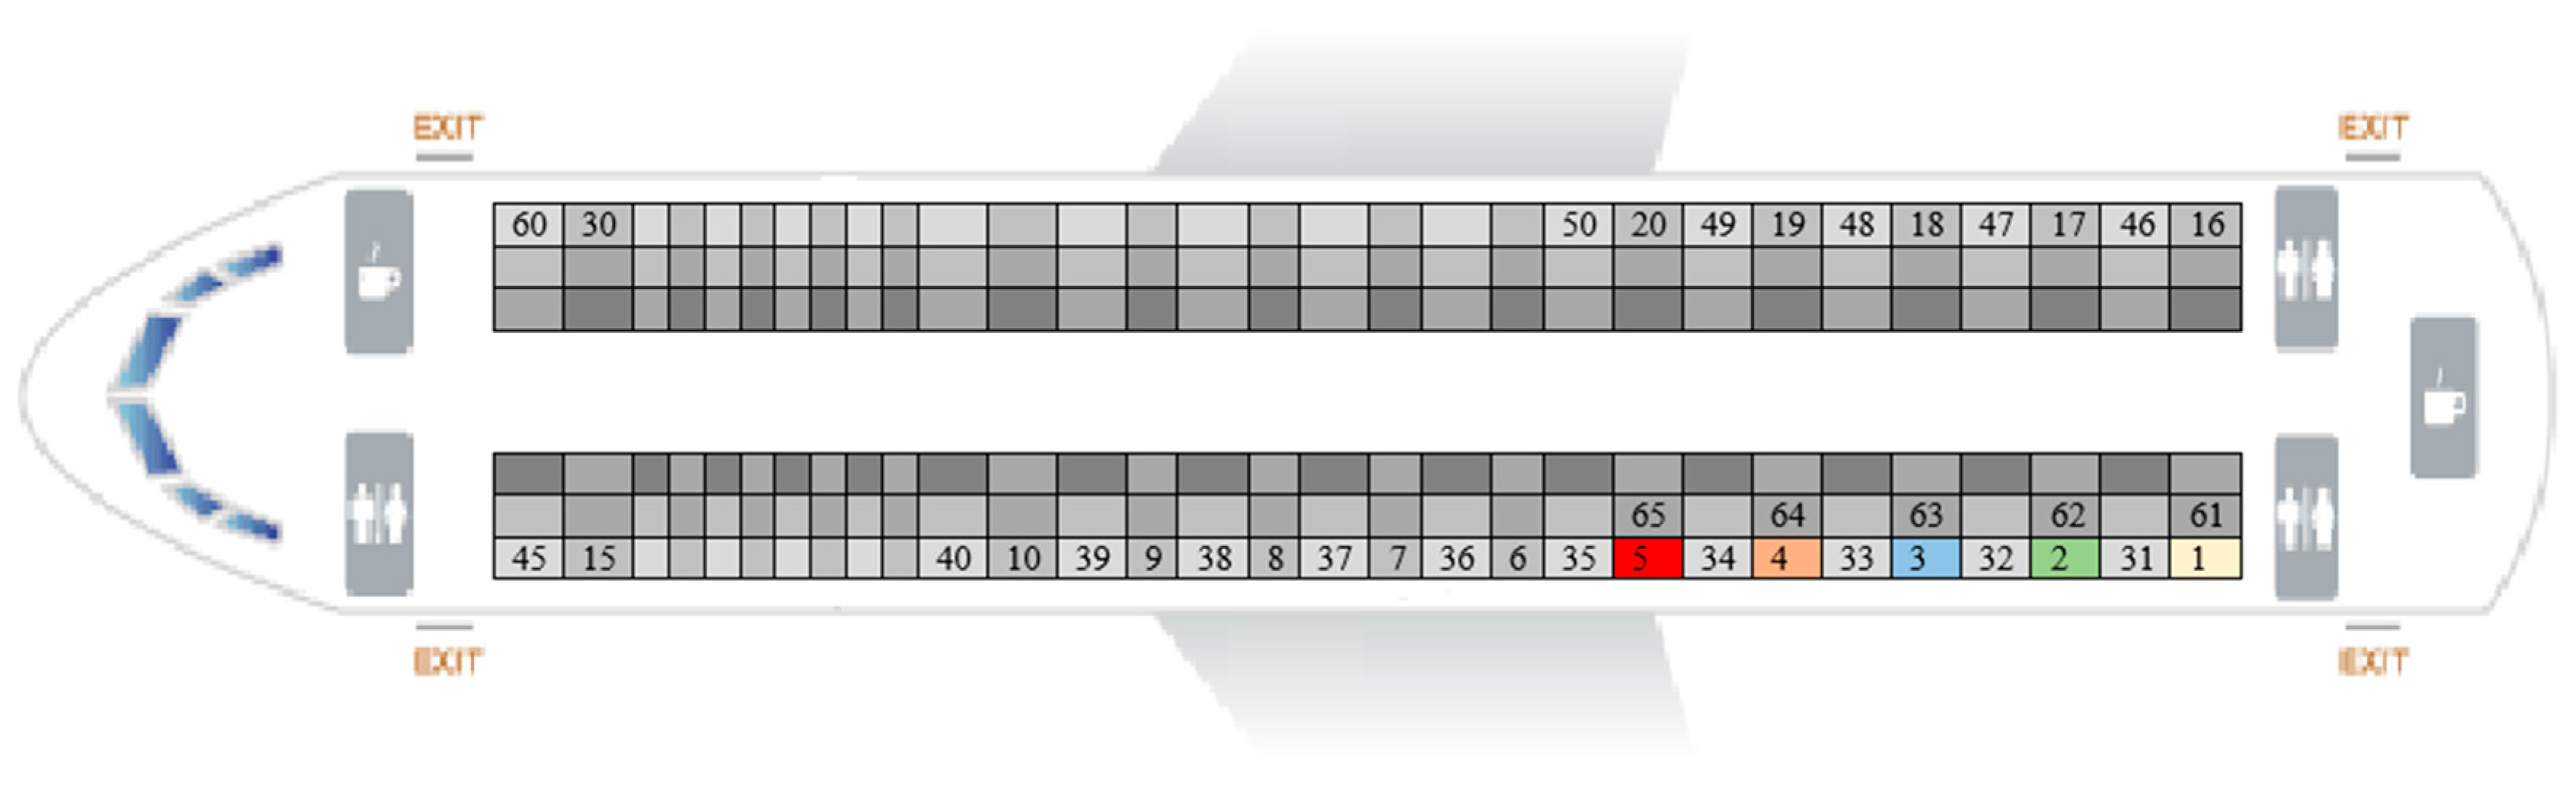
| Descending order | BS22 | It starts in the rear: the first seat is near the window in the last row, the next one is near the window in the second-last row, and so on until the seats near the window (in one side of the airplane) are completed. After that, the passengers are seated one by one on the middle seats starting from the rear to the front, then on the aisle seats in the same manner. Once one side of the airplane is completed, the second one continues from the last seat in the rear near the window as we did for the first side of the airplane (Figure A22). | |
| Steffen method | BS23 | The first seated passenger is near the window in the rear. The second passenger is placed one row apart from the first one near the window. The placement continues in the same manner from the back to the front and from the window to the aisle by seating the adjacent passengers one row apart from each other in the corresponding seats (Figure A23). | |
| Variation in Steffen method | BS24 | The same idea as in the Steffen method, but instead of filling first the rows near the window, it fills until the odd rows (window on the first odd row in the back, window on the second last-row in the back and so on, middle on the first row in the back until middle first row in the front and aisle in the back to the front) and after that the even rows (Figure A24). |
Table 4.
Variables in the agent-base model.
| Agent | Variables | Range/Values | Explanation |
|---|---|---|---|
| Turtle | speed | [0, 1] | For the agents not carrying luggage the speed is 1 patch/tick, while for the agents with hand luggage it lies in the interval [0.6, 0.9). Since the speed also depends on the speed of the passenger-ahead, it cannot be greater than the speed of the passenger-ahead. |
| luggage? | true, false | Indicates weather the agent is carrying on a luggage or not. | |
| luggage-store-ticks | 3 + random 5 | Takes random values between 3 and 7 ticks. | |
| seated? | true, false | Specifies whether the passengers has found his/her seat or is moving towards that seat. | |
| assigned-seat-row | 1 until the number of airplane rows | Indicates the row on which the assigned seat is. | |
| assigned-seat-number | −3, −2, −1, 1, 2, 3 | Representing the letters inside the aircraft (3 stands for A, 2 for B, 1 for C, −1 for D, −2 for E, −3 for F). | |
| Patch | isSeat? | true, false | Divides patches between seats and non-seats. |
| seat-row | airplane number of rows | Indicates the number of the airplane row to which the current patch is belonging (see Figure 2). |
Table 5.
Synthetic degree of grey incidence.
| Variable | Grey Incidence |
|---|---|
| Aircraft dimensions | 0.579 |
| Aircraft occupancy | 0.643 |
| Passengers are carrying hand luggage (without storage time) | 0.571 |
| Passengers are carrying hand luggage (with storage time) | 0.807 |
Table 6.
Best boarding methods considering the aircraft occupancy.
| Passengers Percent | Best Boarding Methods | Good Boarding Methods |
|---|---|---|
| Full flight (100%) | BS15 (By-row-back-to-front) BS17 (By-half-row-back-to-front) BS21 (Back-to-front-by-seating-order) | BS8 (Back-to-front) BS11 (Half-block back-to-front) BS12 (Half-block-mix-1 back-to-front) |
| 90% | BS15 (By-row-back-to-front) BS21 (Back-to-front-by-seating-order) BS8 (Back-to-front) | BS17 (By-half-row-back-to-front) BS11 (Half-block back-to-front) BS12 (Half-block-mix-1 back-to-front) |
| 80% | BS15 (By-row-back-to-front) BS21 (Back-to-front-by-seating-order) BS8 (Back-to-front) | BS13 (Half-block-mix-2 back-to-front) BS17 (By-half-row-back-to-front) BS11 (Half-block back-to-front) BS12 (Half-block-mix-1 back-to-front) |
| 70% | BS15 (By-row-back-to-front) BS21 (Back-to-front-by-seating-order) BS8 (Back-to-front) | BS13 (Half-block-mix-2 back-to-front) BS17 (By-half-row-back-to-front) |
Table 7.
Boarding methods classification considering the aircraft occupancy.
| Boarding Methods Full-Flights | Boarding Methods Partial Flights |
|---|---|
| BS15 (By-row-back-to-front) | BS21 (Back-to-front-by-seating-order) |
| BS17 (By-half-row-back-to-front) | BS15 (By-row-back-to-front) |
| BS21 (Back-to-front-by-seating-order) | BS8 (Back-to-front) |
| BS11 (Half-block back-to-front) | BS13 (Half-block-mix-2) |
| BS8 (Back-to-front) | BS17 (By-half-row-back-to-front) |
| BS12 (Half-block-mix-1) | BS12 (Half-block-mix-1 back-to-front) |
| BS9 (Back-to-front-mix) | BS11 (Half-block back-to-front) |
| BS7 (Reverse-pyramid-half-zone-2) | BS22 (By-seat-descending-order) |
| BS13 (Half-block-mix-2) | BS19 (Modified-optimal-method) |
| BS22 (By-seat-descending-order) | BS16 (By-half-row-front-to-back) |
| BS18 (Rotating-zone) | BS24 (Steffen-variation) |
| BS5 (Reverse-pyramid) | BS23 (Steffen) |
| BS6 (Reverse-pyramid-half-zone-1) | BS18 (Rotating-zone) |
| BS23 (Steffen) | BS9 (Back-to-front-mix) |
| BS24 (Steffen-variation) | BS6 (Reverse-pyramid-half-zone-1) |
| BS19 (Modified-optimal-method) | BS5 (Reverse-pyramid) |
| BS1 (Random-with-assigned-seats) | BS1 (Random-with-assigned-seats) |
| BS2 (Outside-in/WILMA) | BS2 (Outside-in/WILMA) |
| BS3 (Window-to-aisle-half-block) | BS3 (Window-to-aisle-half-block) |
| BS4 (Window-to-aisle-alternate) | BS7 (Reverse-pyramid-half-zone-2) |
| BS10 (Front-to-back) | BS4 (Window-to-aisle-alternate) |
| BS20 (Non-traditional) | BS14 (By-row-front-to-back) |
| BS14 (By-row-front-to-back) | BS10 (Front-to-back) |
| BS16 (By-half-row-front-to-back) | BS20 (Non-traditional) |
© 2018 by the authors. Licensee MDPI, Basel, Switzerland. This article is an open access article distributed under the terms and conditions of the Creative Commons Attribution (CC BY) license (http://creativecommons.org/licenses/by/4.0/).
Share and Cite
MDPI and ACS Style
Delcea, C.; Cotfas, L.-A.; Paun, R. Agent-Based Evaluation of the Airplane Boarding Strategies’ Efficiency and Sustainability. Sustainability 2018, 10, 1879. https://doi.org/10.3390/su10061879
AMA Style
Delcea C, Cotfas L-A, Paun R. Agent-Based Evaluation of the Airplane Boarding Strategies’ Efficiency and Sustainability. Sustainability. 2018; 10(6):1879. https://doi.org/10.3390/su10061879
Chicago/Turabian StyleDelcea, Camelia, Liviu-Adrian Cotfas, and Ramona Paun. 2018. "Agent-Based Evaluation of the Airplane Boarding Strategies’ Efficiency and Sustainability" Sustainability 10, no. 6: 1879. https://doi.org/10.3390/su10061879
Note that from the first issue of 2016, this journal uses article numbers instead of page numbers. See further details here.