The Influence of Farmers’ Livelihood Strategies on Household Energy Consumption in the Eastern Qinghai–Tibet Plateau, China


1
College of Geography and Environment Science, Northwest Normal University, Lanzhou 730070, China
2
College of Earth and Environmental Sciences, Lanzhou University, Lanzhou 730000, China
3
Key Lab of Pollution Ecology & Environmental Engineering, Institute of Applied Ecology, Chinese Academy of Sciences, Shenyang 110016, China
4
Institute for Advanced Sustainability Studies e. V. (IASS), 14467 Potsdam, Germany
*
Author to whom correspondence should be addressed.
Sustainability 2018, 10(6), 1780; https://doi.org/10.3390/su10061780
Submission received: 19 March 2018
/
Revised: 15 May 2018
/
Accepted: 16 May 2018
/
Published: 29 May 2018
(This article belongs to the Section Energy Sustainability)
Abstract
:As an essential factor for sustainable development, energy plays a very important role in sustaining a modern lifestyle, particularly in poor rural areas. Considering that farmers’ livelihood in such areas is enormously dependent on services provided by environmental resources, it makes sense to investigate the relationships and interactions between farming households’ livelihood strategies and their energy consumption. The findings and outcomes would be expected to contribute to the body of knowledge and benefit local policy-making toward sustainable transformation in the long run. Taking Gannan as an example, this study employed a participatory rural appraisal approach, with first-hand data mainly from field surveys, using a stratified random sampling method to illustrate the influence of farmers’ livelihood strategies for household energy consumption in the eastern Qinghai–Tibet Plateau, China. Seven townships in Gannan were covered, three of them in pure pastoral areas, two in farming-pastoral areas, and two in farming areas. From these, 230 households were selected as study samples, with a valid return of 217 questionnaires, among which 78 came from pure pastoral areas, 60 from farming-pastoral areas, and 79 from farming areas. The results show that livelihood has a significant impact on farmers’ household energy consumption patterns, and increasing family income level and education level and improving the availability of commodity energy resources will help farmers reduce the proportion of biomass energy consumption and increase the proportion of commodity energy consumption. Furthermore, measures such as developing nonagricultural industries, improving the energy infrastructure, and enhancing farmers’ energy-saving awareness should be seriously considered to optimize farmers’ living energy consumption patterns in these poverty-stricken and eco-frangible regions.
1. Introduction
Energy is an essential factor for sustainable development. In the United Nations (UN, New York, NY, USA) 2030 Agenda for Sustainable Development, Sustainable Development Goal 7 (SDG7) is to “ensure access to affordable, reliable, sustainable and modern energy for all”. The agenda also calls for protecting, restoring, and promoting sustainable use of terrestrial ecosystems by emphasizing SDG15, to “sustainably manage forests, combat desertification, and halt and reverse land degradation and halt biodiversity loss” [1]. Therefore, access to energy is key to any development initiative, and the issues of sustainable energy consumption connected with local ecosystem conservation should stand at the center of global efforts, to induce a paradigm shift toward long-term sustainability, particularly for ecologically fragile, less developed areas. Today, a third of the world’s population, about 2.5 billion people, rely on the traditional use of biomass to cook their meals, and 1.65 billion people (43% of the population) in developing Asia rely on biomass for cooking, which represents an increase of 160 million people since 2000 [2]. These biomass fuels include firewood, charcoal, dung, and agricultural residues; however, in many cases, the demand for biomass fuels far outweighs the sustainable supply, resulting in deforestation, land degradation, and desertification [3]. For example, due to the lack of affordable commercial energy sources, rural communities in Nepal rely entirely on fuelwood to meet household energy demands, and the overexploitation of fuelwood has resulted in a series of negative effects such as deforestation, erosion, and soil degradation [4,5]. The environmental income is important for all livelihood strategy groups in Nepal, therefore conservation policies and natural resource management are critical to sustain the increased demands and reliance of local livelihoods on environmental products and services in Nepal [6].
Sustainable livelihood, which was introduced by the Brundtland Commission on Environment and Development and then expanded at the 1992 UN Conference on Environment and Development, is usually applied as a broad goal for poverty eradication [7]. Generally, livelihood refers to the capabilities, assets (including both material and social resources), income, and activities required for people to secure the necessities of life [8,9]; accordingly, livelihood strategies concern the individual’s available and implemented options for pursuing livelihood goals [10,11]. The strategies can be classified into different categories according to diversified approaches [12], for example, livestock-oriented, diversified-oriented, and off-farm-oriented [13]. In developing countries, particularly in poor rural areas, a rural livelihood is enormously dependent on services provided by environmental resources, which are collected from forest and nonforest uncultivated land [10], for example, in Mozambique [14]. Considering their livelihood strategy in the energy sector, for instance, because they have a lesser ability to develop and access alternative commercial sources of energy, poor farmer households usually have to rely heavily on free energy sources, such as grass, dung, straw, and charcoal, which then further aggravates water loss, soil erosion, and destruction of forest vegetation, resulting in ecological degradation in eco-fragile areas [15,16].
As one of the most important stakeholders in rural economic activities, as well as a basic organizational unit in decision-making toward sustainability, a farming household with its livelihood strategies plays an important role in the way natural resources are developed and utilized, particularly in areas where household energy consumption still depends heavily on traditional biomass energy, such as crop straws and firewood [17]. The total household energy consumption in rural China in 2015 consisted of biomass, coal, electricity, oil, and liquefied petroleum gas (LPG), accounting for 46.1%, 33.8%, 9.4%, 5.2%, and 2.9%, respectively [18]. Given the fact that biomass energy (mainly fuelwood) consumption accounts for more than half of total energy use in rural China [19], the switch from fuelwood to alternative energy may have great ecological significance [20].
China needs more efforts to meet its domestic sustainable development goals toward an ecological society, particularly in some of the less developed and ecologically fragile areas, such as northwestern China. As a key indicator for addressing climate change and for long-term sustainability [21], the analysis of household energy consumption offers a fundamental picture that is useful in presenting the characteristics and potential for such issues [20]. Therefore, investigating the relationships [22] and the linkages and interactions between farming households’ livelihood strategies and their energy consumption will contribute to the body of knowledge and benefit local policy-making toward a sustainable transformation.
The Qinghai–Tibet Plateau is recognized as the third pole of the Earth, with an average altitude over 4000 m above sea level. The region has a unique natural environment, and is regarded as both a driver and amplifier of globe climate [23], therefore its energy issues have attracted interest from many researchers and policy-makers [24]. However, most studies are conducted in Tibet, and few studies have been conducted in the eastern part of the plateau [25,26], particularly from the perspective of sustainable livelihood. In this study, by employing a semistructured questionnaire and interview methods, we aimed to investigate the impacts of farming households’ livelihood on their energy consumption patterns, and to draw out the evolution of energy consumption patterns along with livelihood conversion.
2. Study Area
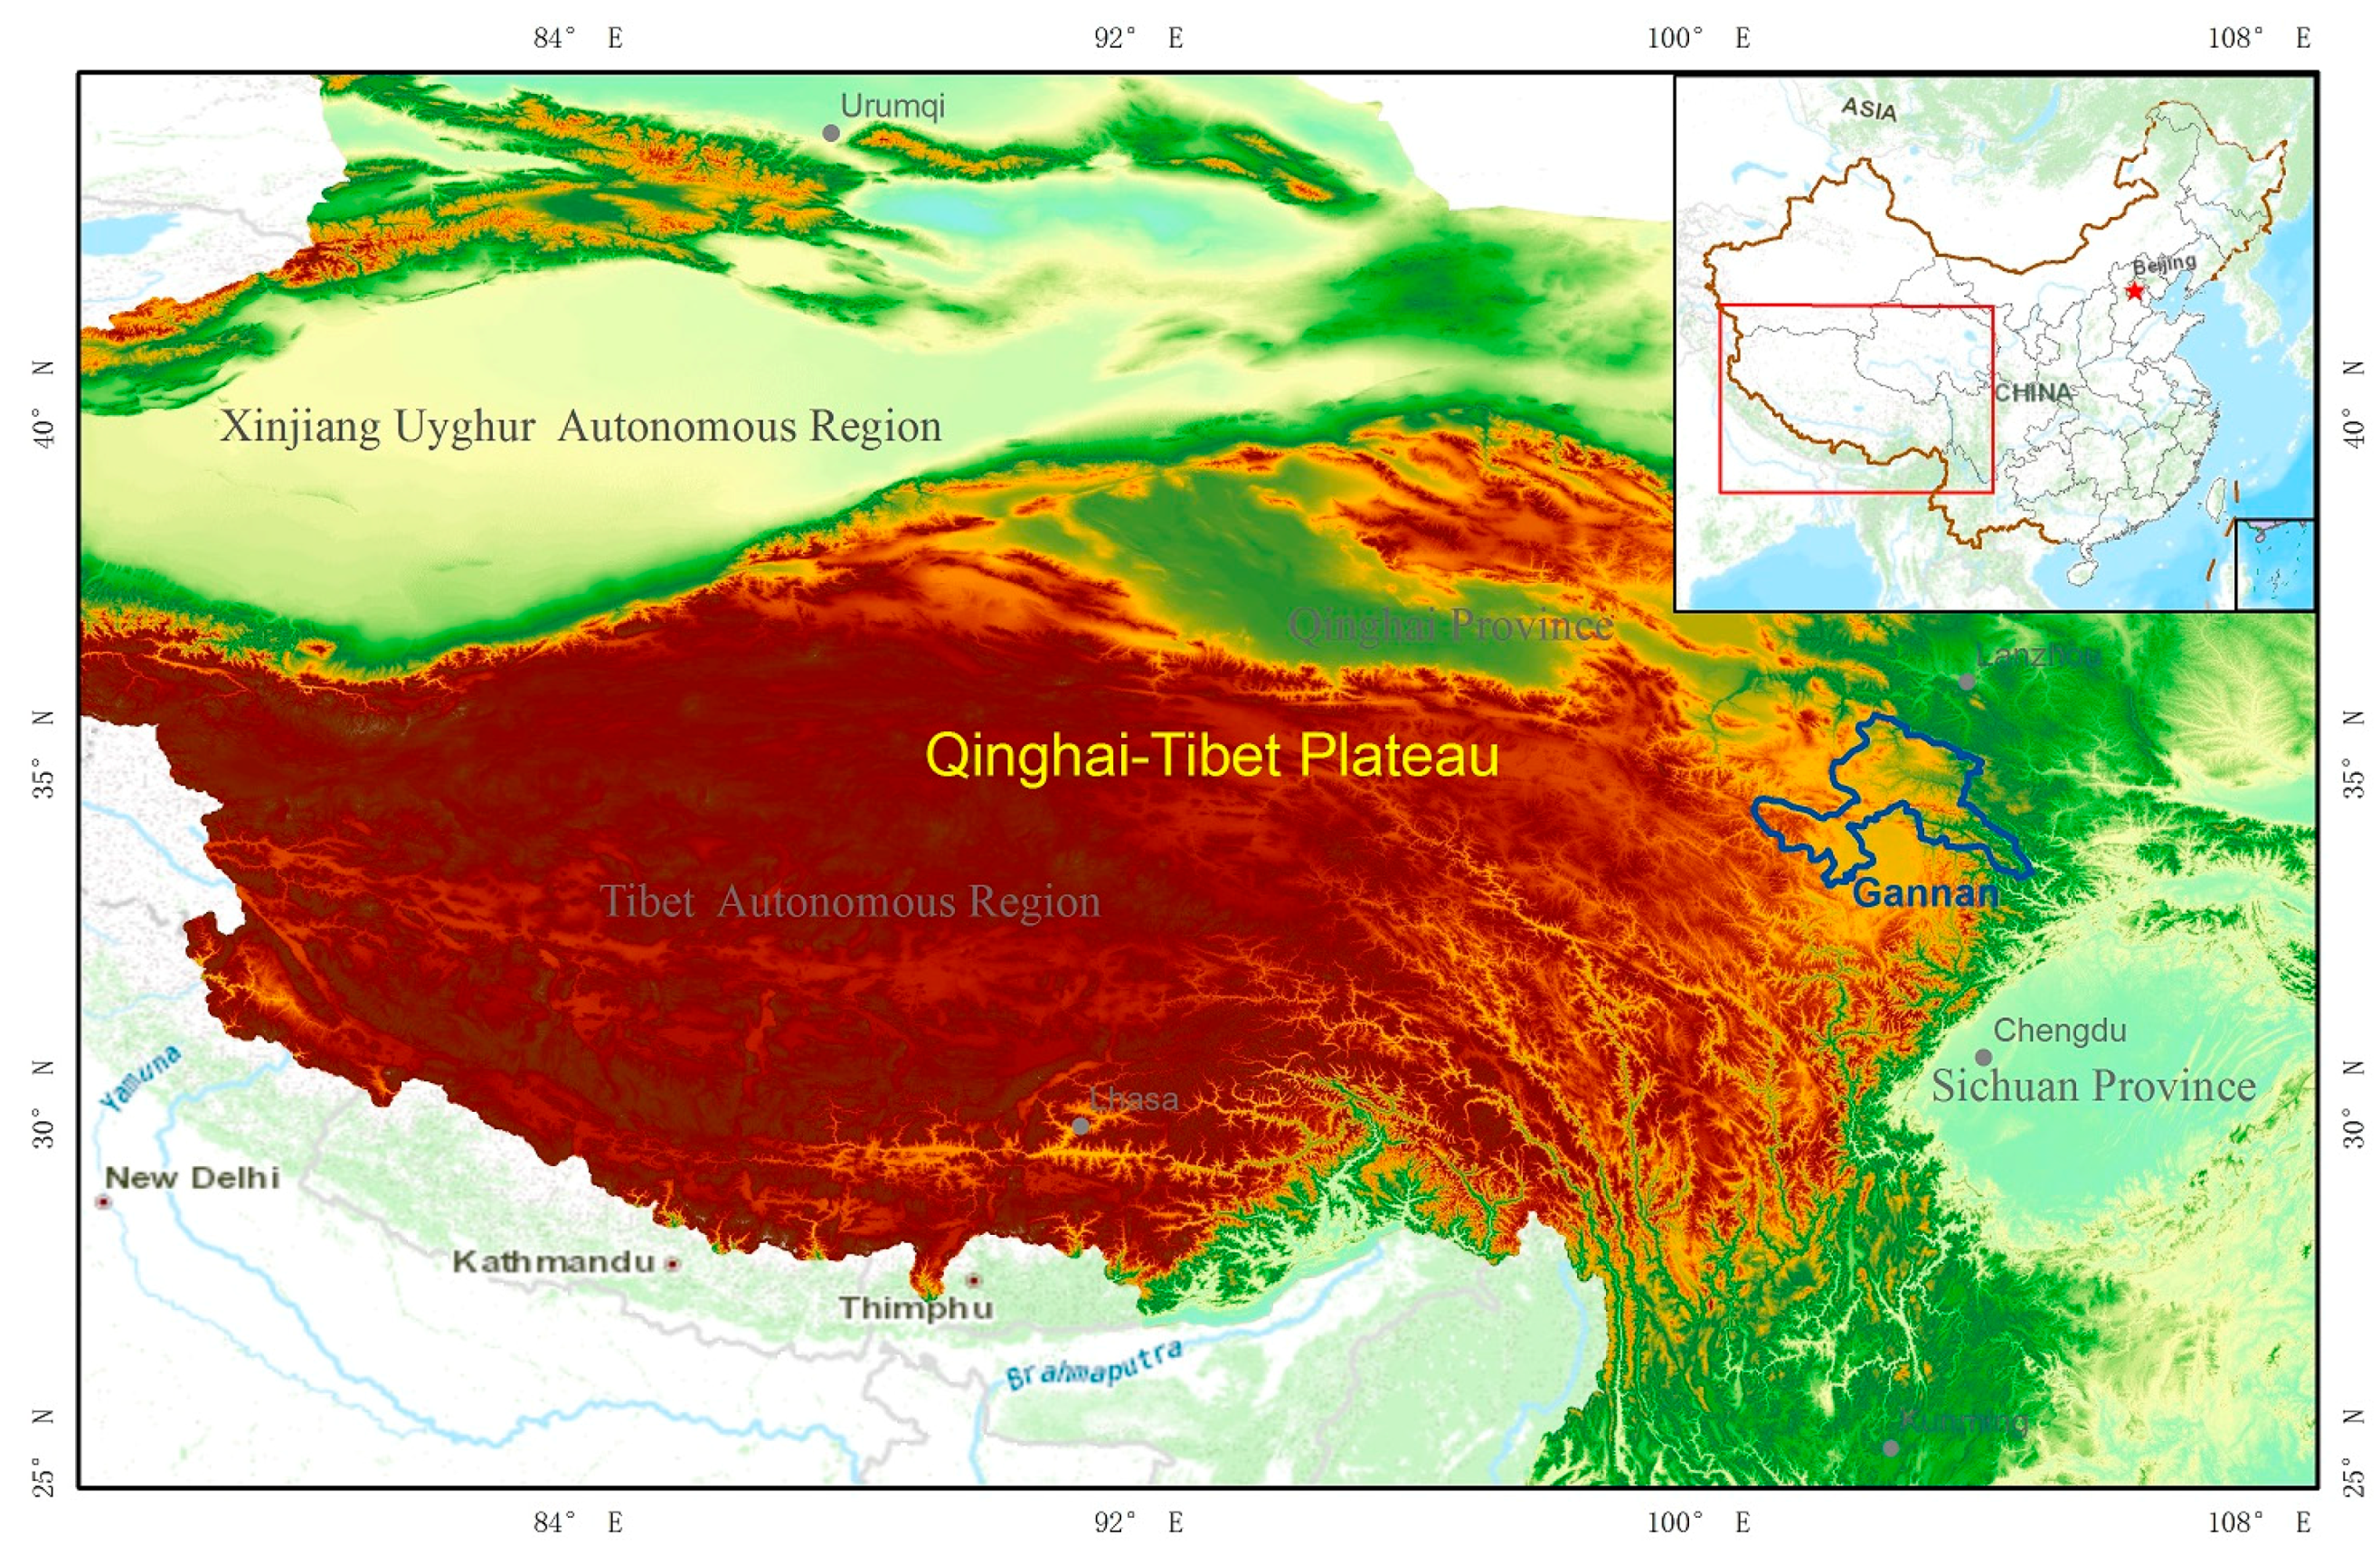
Gannan Tibetan Autonomous Prefecture, a city-level administrative area located on the eastern edge of the Qinghai–Tibet Plateau (Figure 1), is a typical eco-fragile region that places a heavy burden on ecosystem services, where dung, firewood, and other traditional forms of biomass energy have been predominantly used for a long time [27]. Such rural energy consumption patterns in Gannan have already caused serious damage to the forests and grassland in the region, and its ecosystem services have declined sharply [28]. In recent years, the livelihood strategies of farming households in Gannan have gradually shifted from traditional agriculture activities to concurrent industries and nonagricultural activities, which makes Gannan a typical case to investigate the impact of farmers’ livelihood strategies on household energy consumption [28].
According to official documents from the government of Gannan [27], the southeastern part of Gannan has a mild climate, with an average annual temperature between 0 and 14 °C, while the northeastern part, in the mountain-plateau region, has an average annual temperature of 3 to 7 °C. The population density in Gannan is about 19 people/km2, with a majority of Tibetans. In the pure pastoral areas, the Tibetan population accounts for over 90%, in farming-pastoral areas, it accounts for 74.7%, and in farming areas it accounts for 24.2%. Households in the pure pastoral areas are mostly engaged in animal husbandry, accounting for 63.1% all job holders. Animal husbandry accounts for 64.1% of farmers’ income, and up to 100% in some counties. In contrast, 56.3% of people in farming areas and 58.4% in farming-pastoral areas do crop farming, and their farming income accounts for 50.2% and 42.9%, respectively, of annual income, of which 23.5% and 28.9%, respectively, is from salary and only 10.2% and 8.4%, respectively, from animal husbandry.
3. Methods
3.1. Data Source
Guided by the approach of Participatory Rural Appraisal (PRA), which aims to incorporate the knowledge and opinions of rural people in the planning and management of development projects and programs [29], a questionnaire-based survey using a stratified random sampling method was carried out. There are about 99 township-level administrative areas in Gannan prefecture; considering that the area of Gannan is vast and most of the farmers live in scattered locations, it is quite difficult to conduct field survey-based interviews. Our survey covered 7 townships in Gannan, 3 in pure pastoral areas, 2 in farming-pastoral areas, and 2 in farming areas. In each township, 20 to 40 households from one village were chosen to conduct detailed interviews. In the end, 230 households were selected as study samples for our research, with a valid return of 217 questionnaires, among which 78 came from pure pastoral areas, 60 from farming-pastoral areas, and 79 from farming areas. Six Tibetan college students were hired as translators during the survey process, to ensure the accuracy of the interviewed information. Even though the survey samples are small, due to the high similarity of livelihoods and energy consumption in these areas, they still can reflect the general situation in Gannan. The survey was conducted from July to August 2011, and the questionnaire time was about 2 to 3 h.
The following contents were presented in the survey: (1) family characteristics of farming households, including household scale, manpower, education level of the household members and labor force, gender structure, family income, and source of income; (2) means of livelihood of farming households, including the input of household labor force and their specific activities; (3) availability of energy resources, including the area of land and firewood land, the number of livestock, and the distance from the village to the township; and (4) amount of energy consumption, including that of firewood, straw, and dung per year, of coal and electricity, and relevant fees.
Based on primary studies of the survey, the livelihood strategies of farming households in Gannan were categorized as follows: animal husbandry, cultivating, gathering, migrant working, transporting, business-making, handicraft trade, and working in enterprises and institutions. Animal husbandry, cultivation, and gathering can be further categorized as agriculture, and the rest as nonagriculture. Finally, according to the diversity of nonagriculturalization and the farmers’ livelihood strategies, the households were categorized as three types: pure farming households, households with combined occupations, and nonfarming households. Herein, pure farming household (PFH) means all manpower is engaged in agriculture, household with combined occupation (HCO) means the labor force partly worked on agriculture and partly on nonagriculture, and nonfarming household (NFH) means the labor force worked on only nonagricultural activities.
3.2. Analytical Methods
To model the impact of farmers’ livelihood on household energy consumption, the Stochastic Impacts by Regression on Population, Affluence and Technology (STIRPAT) model was applied. Farming households’ livelihood, energy availability, household income, and family characteristics were all fitted into the STIRPAT random regression model, whose general form goes as follows [30]:
where family characteristics, income, and energy availability are symbolized as P, A, and T, respectively, and a is a constant term; b, c, and d denote the exponential terms for P, A, and T, e is an error term, and I denotes energy consumption. In order to measure the impact of various factors on energy consumption, Equation (1) can be further converted into logarithmic form:
where a and e are logarithms of a and e in Formula (1), and b and c refer to percent changes of energy consumption caused by the driving factors P, A, T, which have 1% change when other influencing factors remain unchanged.
ln(I) = a + b ln(P) + c ln(A) + d ln(T) + e
To model the impact of livelihood on the farming households’ energy consumption patterns, the binary logistic model and the maximum likelihood estimate (MLE) were applied. First, the value of energy consumption is set as a dependent variable, yi, in 0–1 model: when biomass energy is mainly used in energy consumption (the share is above 55%), the value of yi is 0, which means the household selects a low-level energy consumption pattern; if coal and electricity and other commercial energy sources are mainly used (the share is more than 55%), the value of yi is 1, which suggests that the household chooses an advanced energy consumption pattern. Supposing that xi is an independent variable and Pi is the probability of occurrence of yi event, the corresponding regression model is then represented as:
where β0 is a constant and β1, β2, …, βm are regression coefficients that represent the contributions made by the various factors (xim) to Pi. Positive regression coefficients mean there will be a corresponding increase in occurrence each time explanatory variables add a unit of value; on the contrary, when regression coefficients are negative, there will be a corresponding reduction in occurrence each time explanatory variables add a unit of value.
Furthermore, in this study, the index of nonagricultural level (the proportion of labor force working on nonagricultural lines) is determined as the indicator for livelihood, and this indicator, together with the other indicators—energy availability, family income, household scale, and education level of the labor force—are introduced into the analytical model. Regarding the education level of the labor force, different scores are applied (illiterate = 1, primary schooling = 2, junior schooling = 3, senior schooling = 4, college and above = 5), and regional dummy variables are brought in (in pure pastoral area: yes = 1, no = 0; in farming area: yes = 1, no = 0). All statistical analyses were performed with SPSS for Windows version 15.0 (SPSS Inc., Chicago, IL, USA).
4. Results and Discussion
4.1. Farming Households’ Characteristics in Different Livelihood Types
The proportion of pure farming households in pure pastoral areas, farming-pastoral areas, and farming areas declined to 52.21%, 28.33%, and 15.18% respectively, while the proportion of nonfarming households increased steadily to 7.66%, 18.34%, and 40.49%, respectively. The characteristics of the households with different livelihoods were different; for example, pure farming households (PFH) had an average family size of about 5.14 persons/household, and the proportion of males was 54.76%; the labor force had about 2.78 laborers/household, and only 5.6% of family members graduated from senior school or above; the family size of households with combined occupations (HCO) and nonfarming households (NFH) was about 5.39 and 5.20 persons/household respectively, and the proportion of males was 51.06% and 49.33%, respectively, however, family members who graduated from senior school and above in these two households accounted for 9.5% and 11.4%, respectively, and there were about 3.02 and 2.98 laborers/household (Table 1).
Previous studies have indicated that livelihood strategies are diversified from different perspectives [31]; our study also shows that farming households are different as well, not only in the arrangements of their agricultural activities, but also in the introduction of nonagricultural and other activities due to their diverse means of livelihood. For example, farming households in pure pasturing areas mainly worked on planting crops, grazing, breeding livestock, and gathering; 75% of them relied on grazing, and the rest on breeding and gathering activities. Of the households in farming-pastoral areas, 52.94% worked on planting crops and breeding animals, and 35.29% worked on planting, breeding, and gathering activities. Of the households in farming areas, 66.67% were engaged in planting crops and gathering and 25% in planting, gathering, and breeding animals. Households with combined occupations mixed agricultural activities with nonagricultural ones, which means mainly going out to work for others. In general, households with combined occupations and nonfarming households accounted for 55.56% and 71.43%, respectively, of all types of households. In pure pastoral areas, 18.75% of households had family members going out to work, and in farming-pastoral areas and farming areas, the proportions were as high as 78.13% and 68.57%, respectively. Nonfarming households in farming and pastoral areas all had family members going out for work, and the proportion was 68.75% in farming areas. This was also indicated by Hua et al., who found that nonfarming-dependent households generally not only earned income from agricultural activities but also were willing to pursue non-farm activities or self-employment for wages [31].
4.2. Energy Consumption of Farmer Households with Different Livelihood Strategies
Energy consumption in pure pastoral areas (PPA), farming-pastoral areas (FPA), and farming areas (FA) is shown in Table 2. Per capita energy consumption for households in PPA was the highest, with an average of 779.87 kilograms of coal equivalent (kgce), which is about 2.5 times the amount in FPA and 2.84 times the amount in FA. A study conducted in 2009 in some other counties located in the eastern part of the Qinghai–Tibet Plateau also found that energy consumption per capita in the pastoral zone was higher than that in the agricultural zone, and rural household energy consumption structures were similar in counties with similar livelihoods [24]. The reason for such large energy consumption was generally the high altitude in pure pastoral areas, with cold weather and long heating periods; pastoral regions are usually areas with higher altitude, colder weather, lower oxygen pressure, and lower burning efficiency [24]. There are significant differences in living energy consumption among different livelihood types. Energy consumption in pure farming households (PFH), households with combined occupations (HCO), and nonfarming households (NFH) declined in sequence; for instance, the average energy consumption in PFH was 738.08 kgce, while the average energy consumption in HCO and NFH was about 368.34 kgce and 260.49 kgce, respectively (Table 2).
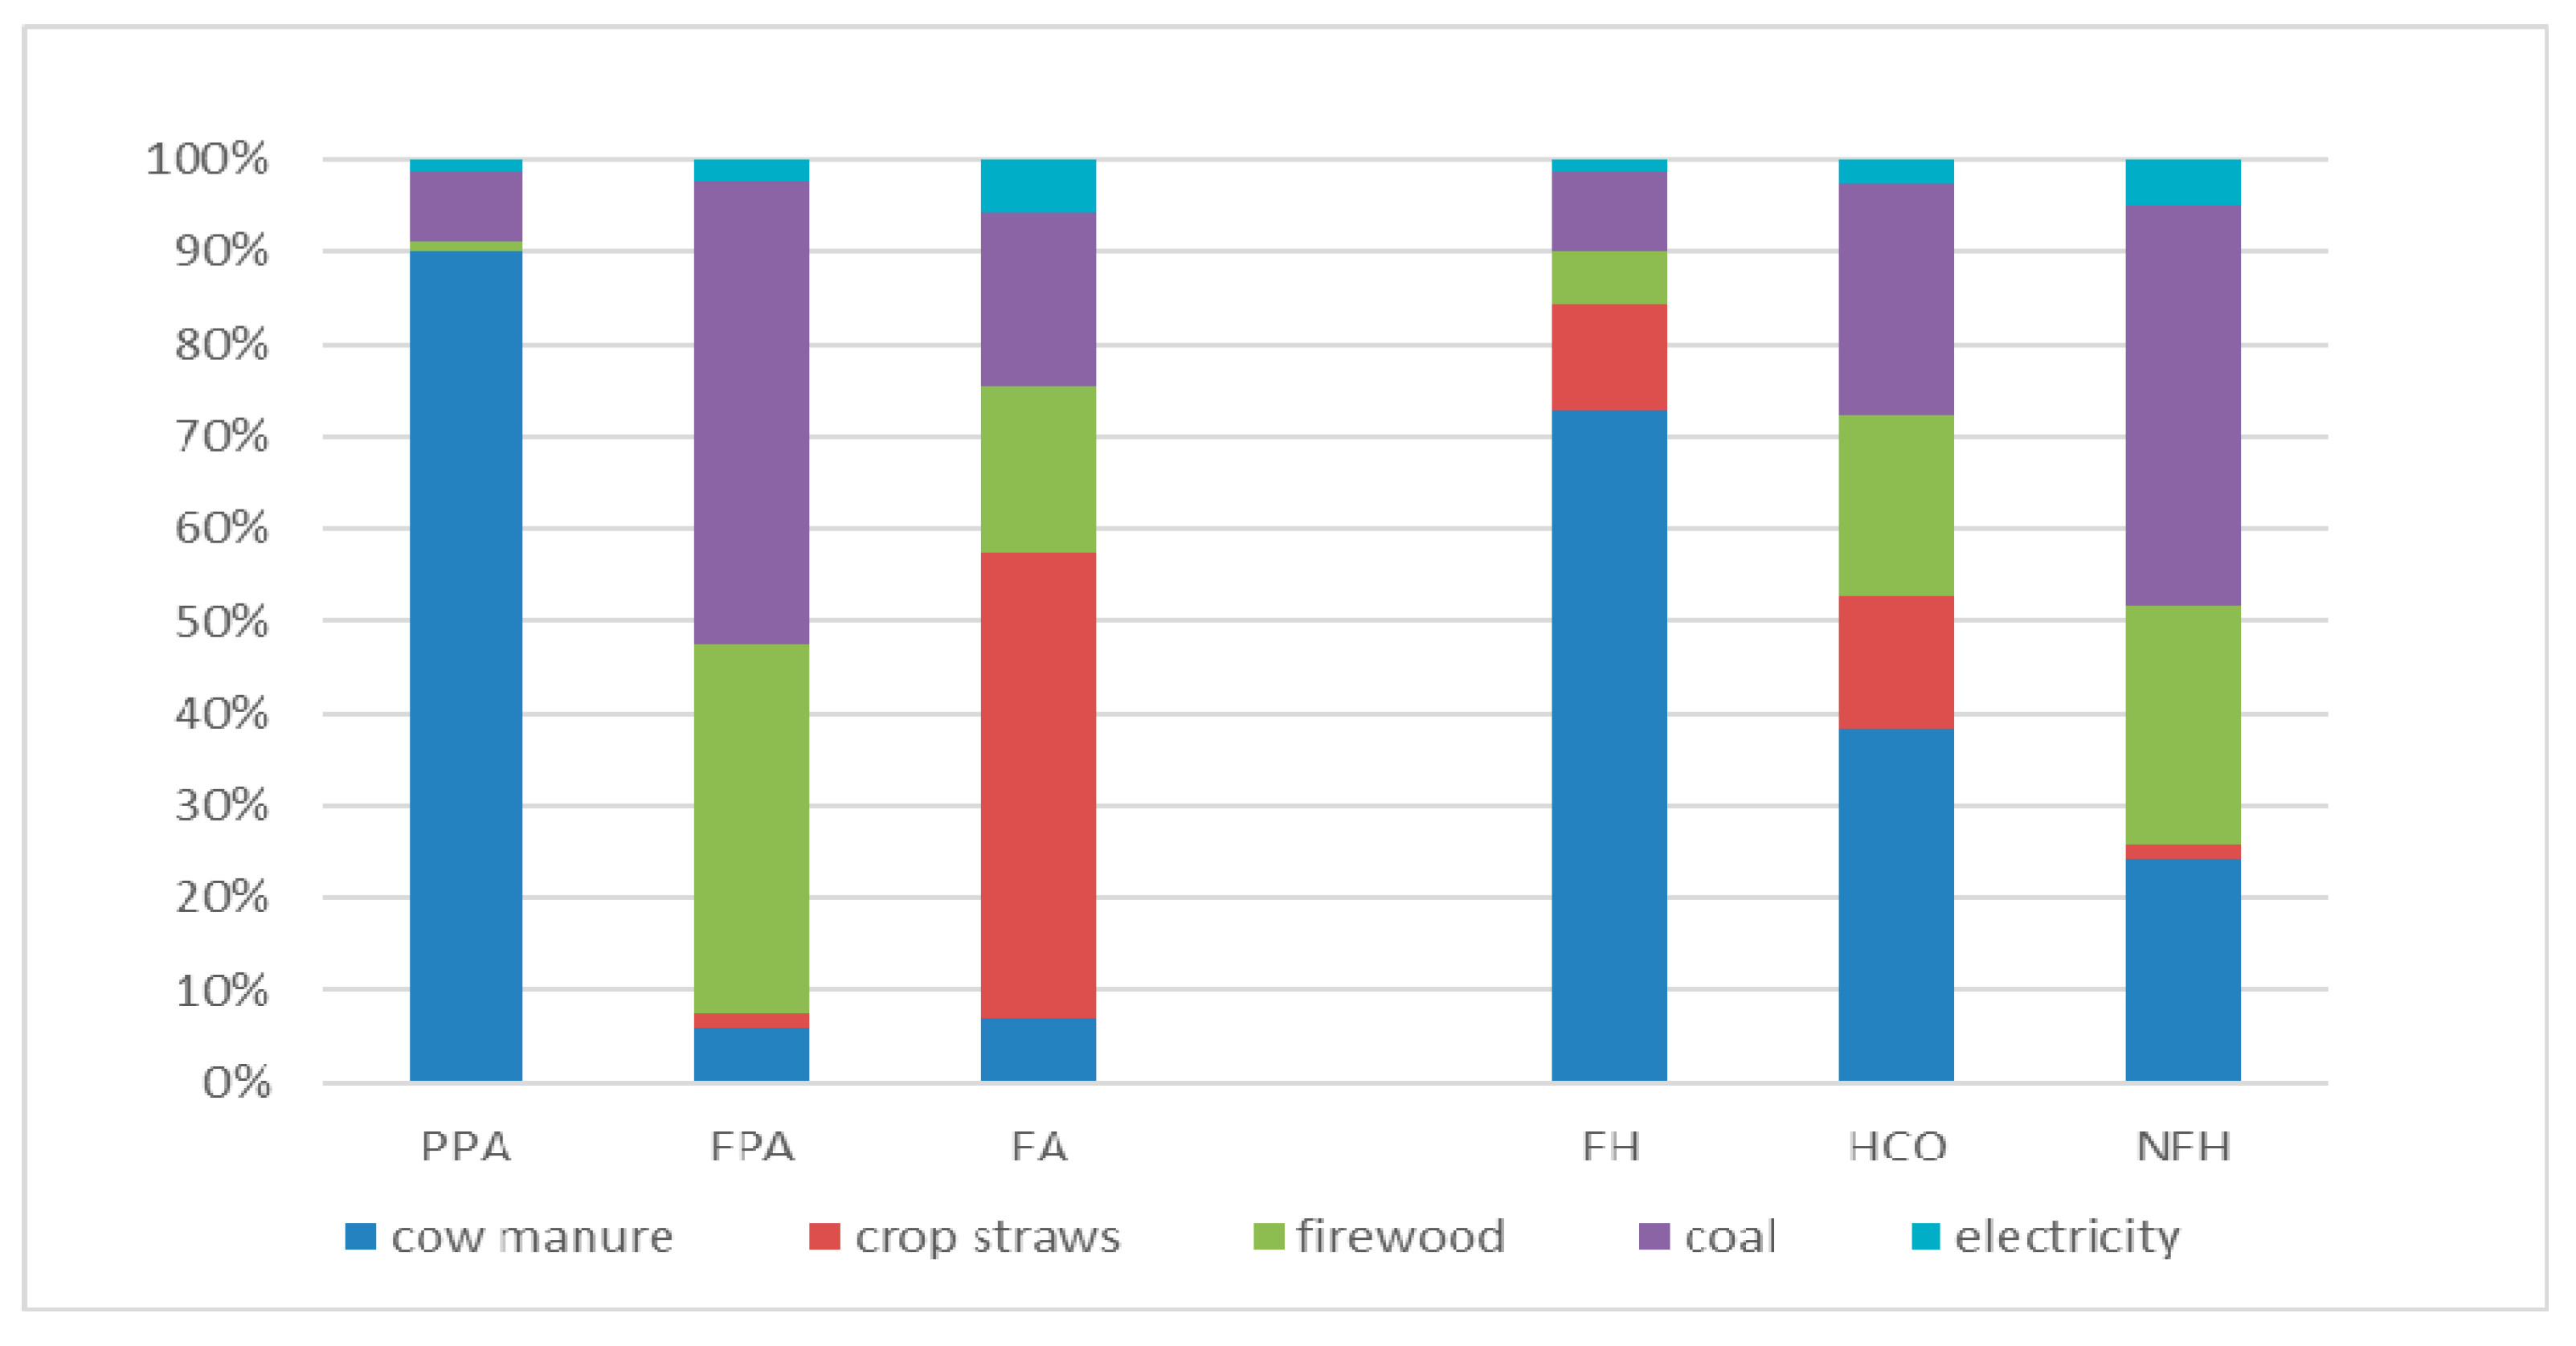
From the energy structure perspective, farming households in PPA were mainly dependent on cow manure, accounting for 90.10% of their total energy consumption, while the main energy sources for FPA were coal (49.80%) and firewood (40.06%), and in FA it was straw (50.30%) (Figure 2). Previous studies also found that the pastoralists in Qinghai and Tibet used yak dung and sheep fecal pellets as their main energy sources [32], even though a study on China’s rural energy structure found that the proportions of straw, firewood, biogas, coal, oil, LPG, electricity, and solar energy in rural residential energy consumption shifted from, respectively, 49.36%, 30.99%, 0.25%, 18.12%, 0.38%, 0.004%, 0.83%, and 0.08% in 1991 to 35.71%, 20.19%, 3.31%, 17.55%, 4.85%, 2.61%, 11.90%, and 3.87% in 2014 [33]. In our research, we found that the proportion using commercial energy (coal and electricity) among PFH, HCO, and NFH showed an upward trend, accounting for 9.9%, 27.81%, and 48.41%, respectively. Biomass has been used for cooking and heating for thousands of years on the Qinghai–Tibet plateau [34], but our study indicated that the consumption of biomass energy showed a declining curve from 90.11% to 72.18% to 51.59%.
Statistical analysis of the relationship between nonagricultural and farming households’ energy consumption shows that nonagricultural areas had a significant correlation (above the level of 0.05) with the index in per capita energy consumption, per capita commercial energy consumption, and per capita biomass energy consumption. An apparently negative correlation was shown between nonagricultural areas and per capita energy consumption and per capita biomass energy consumption, with coefficients of −0.283 and −0.257, respectively, and a significant positive correlation was observed between nonagricultural and the index of per capita commercial energy consumption, with a coefficient of 0.243. Moreover, nonagricultural areas had a significant correlation with both biomass and commercial energy, at the level of 0.01. There was a negative correlation, that is, a coefficient of −0.403, between nonagricultural level and biomass energy consumption, and a positive correlation, with a coefficient of 0.424, between nonagricultural level and commercial energy consumption.
4.3. Impact of Livelihood on Households’ Energy Consumption
By taking the farming households’ energy consumption as a dependent variable and introducing the indices of nonagricultural level, family size, educational level, per capita income, per capita arable land, per capita firewood land, number of livestock, distance to the township, and the locale attribute as independent variables, the impact of livelihood on farming households’ energy consumption was analyzed based on the STIRPAT model (Table 2). A preconducted fitting analysis based on the least squares method shows that the above-mentioned variables could completely account for 72.9% of energy consumption in farming households, with F-statistics of 19.437 at the level of 0.01. A significant negative correlation at the level of 0.05 between nonagricultural and farming households’ energy consumption suggests that, with improvement of the nonagricultural level, farming households’ energy consumption would be greatly decreased; however, the nonstandardized coefficient of nonagricultural level is between 0 and −1, which means that the lower rate of energy consumption by the improvement of the nonagricultural level was lower than the change rate of the nonagricultural level itself.
There was a significant positive correlation between farming households’ energy consumption and family size, per capita income, and per capita livestock number, at the level of 0.001, 0.05, and 0.1, respectively. Other studies also indicated that family size and annual income were important factors influencing energy consumption per capita [24,35,36], but in this study, we further found that the nonstandardized coefficient of family size was 1.457, which is greater than 1, while those of per capita income and per capita livestock number were 0.349 and 0.144, suggesting that the increase in household energy consumption caused by the expansion of family size was higher than that of family size, and the increase in household income and expansion of livestock farming caused the increase in energy consumption to be lower than their own pace of change. An interesting finding is that the level of labor education is negatively related to household energy consumption, but it is not statistically significant (Table 3).
Concerning the impact of livelihood strategy on energy consumption pattern (Table 2), the results show that all the indicators—nonagricultural level, per capita income, educational level, per capita livestock number, area of firewood land, distance to the township, and regional characteristics—have a great impact on energy consumption pattern, with confidence levels at 0.01, 0.05, and 0.1.
Among all these factors, nonagricultural level had the most significant impact on energy pattern, with a Wald statistic value of 14.122, followed by the indicator of per capita income (Wald statistic value 11.245). The values of the regression coefficients of nonagricultural level, per capita income, and educational level are all positive, indicating that with their improvement, the probability that farming households will choose a commodity-based energy consumption pattern will increase. From the modelling results, it shows that for every 1 unit increase in the level of nonagriculturalization, the probability of a farmer transferring to a commodity-based energy consumption mode will increase by 38 times, and if per capita income and labor force education increased by 1 unit, the probability of peasants turning to commodity-based energy consumption will increase by 1.4 times and 1.9 times, respectively.
5. Conclusions
Sufficient access to modern energy services is a key factor in addressing the Sustainable Development Goals; however, the issue of energy poverty is relatively new in China in the past decade, because research was primarily focused on how to support economic growth [37]. With the improvement of nonagricultural level, farming households’ energy consumption gradually decreases, and the consumption patterns dominated by traditional biomass energy have shifted to patterns dominated by commodity energy sources. This is mainly due to the fact that the nonagricultural livelihood led to a decrease in the amount of biomass energy produced by farmers, while nonfarm employment led to a decrease in the number of laborers involved in biomass energy harvesting, which increased the opportunity cost of collecting biomass energy. In addition, with the implementation of eco-immigrants and pastoralists’ settlement projects, the previously scattered rural households were resettled around towns with convenient transportation, which led to the transformation of household energy consumption patterns. The change in the production process is the fundamental reason for the change in household energy consumption pattern, therefore, improving the level of nonagriculturalization is an effective way to promote the transformation of household energy consumption patterns.
Although increased income will reduce the use of traditional noncommodity energy, it will increase the consumption of commodity energy, and the income elasticity of consumption of commodity energy is higher than that of traditional noncommodity energy, resulting in an increase of energy consumption by farmers as income increases. Previous studies indicated that economic development can indeed reduce some environmental problems by pushing rural households to move away from the consumption of traditional biomass-based energy in China [38]. With the increase of income level and education level of the labor force, the living energy consumption pattern of farmers shifts from biomass-based consumption to commodity-based. If farmers have higher income and education levels, they have higher requirements for energy comfort, convenience, and hygiene. Therefore, more and more high-income and moderate–high-level farmers choose to use more comfortable energy sources such as electricity. The low-income and low-literacy households are constrained by their income, which means they pay more attention to the economy of energy use, for example, by increasing their use of energy sources such as firewood, straw, and cow manure. Therefore, the latter characteristics of energy consumption provide a great space for reducing farmers’ overreliance on biomass energy and alleviating the pressure of ecological environment.
The difficulty of obtaining or accessing energy is an important factor that affects the energy consumption pattern of farmers. This study shows that the availability of energy affects the choice of household energy consumption patterns. For example, farmers with large numbers of livestock tend to have relatively easy access to biomass energy and thus choose biomass-based consumption patterns, while farmers with convenient transportation and easy access to coal and electricity prefer commodity-based energy consumption patterns. The energy consumption structure of farming households in areas with convenient transportation mainly transforms commercial convenient energy sources such as fuelwood, straw, and coal into liquefied gas and electricity. In areas with limited transportation, energy consumption is mainly based on fuelwood and straw, but it is slowly replaced by coal. Therefore, improving the accessibility of commodity energy sources is the primary measure to promote the transformation of household energy consumption patterns.
In conclusion, the energy consumption behavior of farmers in ecologically fragile areas has been closely integrated with the degradation of the ecological environment. Our previous study, based on a questionnaire that was conducted at the same time, indicated that farmers’ mode of livelihood has remarkable influences on their ecological footprint, and increasing the nonagricultural level will decrease the impact on the environment. Specifically, the per capita ecological footprint of farming households is 1.644 gha (global hectare), while that of combined occupation and nonfarming households is 1.488 gha and 1.225 gha, respectively [39]. In this paper, we found that livelihood has a significant impact on household energy consumption patterns. Along with the increase of nonagricultural level, the household energy consumption in Gannan decreased significantly, and the probability of choosing commodity-based energy increased. On the one hand, increases in family income level and education level and improvement in the availability of commodity energy resources contribute to reducing the proportion of biomass energy consumption, and on the other hand, it increases the proportion of commodity energy consumption. However, along with development in this area, further studies should be conducted: some time-series studies should be conducted to track the evolution process of farmers’ livelihood (energy consumption nexus), and more empirical studies should be conducted to investigate the overall picture of energy consumption in this unique area.
Author Contributions
X.Z. and B.X. conceived and designed the survey; H.Z., L.J. and C.L. analyzed the data; X.Z. and B.X. wrote the paper.
Acknowledgments
This research is supported by the Natural Science Foundation of China (41661115, 41471116, 41561110), the Program for New Century Excellent Talents in University of the Ministry of Education of China (NECT-11-0910), the Fundamental Research Funds for the Central Universities(lzujbky-2017-it85), and Sichuan Province Cyclic Economy Research Center (Key Research Base for Social Sciences of Sichuan Province) (XHJJ-1611). We appreciate the support from the German BMBF Kopernikus Project for the Energy Transition-Thematic Field No. 4 “System Integration and Networks for the Energy Supply” (Energy Transition Navigation System), and special thanks go to the Youth Innovation Promotion Association CAS (2016181). We also express our sincere appreciation to the anonymous reviewers for their valuable and constructive comments.
Conflicts of Interest
The authors declare no conflict of interest.
References
- UNDP. Transforming Out World: The 2030 Agenda for Sustainable Development: United Nations Development Programme. 2015. Available online: https://sustainabledevelopment.un.org/ (accessed on 10 January 2018).
- IEA (International Energy Agency). Energy Access Outlook 2017. Available online: https://www.iea.org/access2017/ (accessed on 25 April 2018).
- Deutsche Gesellschaft für Internationale Zusammenarbeit (GIZ) GmbH. Poverty-Oriented Basic Energy Services (HERA). Available online: www.giz.de/hera (accessed on 25 April 2018).
- Katuwal, H.; Bohara, A.K. Biogas: A promising renewable technology and its impact on rural households in Nepal. Renew. Sustain. Energy Rev. 2009, 13, 2668–2674. [Google Scholar] [CrossRef]
- Gurung, A.; Oh, S.E. Conversion of traditional biomass into modern bioenergy systems: A review in context to improve the energy situation in Nepal. Renew. Energy 2013, 50, 206–213. [Google Scholar] [CrossRef]
- Walelign, S.; Jiao, X. Dynamics of rural livelihoods and environmental reliance: Empirical evidence from Nepal. For. Policy Econ. 2017, 83, 199–209. [Google Scholar] [CrossRef]
- Krantz, L. The Sustainable Livelihood Approach to Poverty Reduction: An Introduction; Swedish International Development Cooperation Agency: Stockholm, Sweden, 2001; Available online: https://www.sida.se/contentassets/bd474c210163447c9a7963d77c64148a/the-sustainable-livelihood-approach-to-poverty-reduction_2656.pdf (accessed on 10 January 2018).
- Chambers, R.; Conway, G.R. Sustainable Rural Livelihoods: Practical Concepts for the 21st Century, IDS Discussion Paper 296, December 1991. Available online: http://publications.iwmi.org/pdf/H_32821.pdf (accessed on 10 January 2018).
- Scoones, I. Sustainable Rural Livelihoods: A Framework for Analysis; IDS Working Paper 72; Institute of Development Studies: Brighton, UK, 1998; Available online: https://www.researchgate.net/profile/Ian_Scoones/publication/251873585_Sustainable_Rural_Livelihoods_A_Framework_for_Analysis/links/5561c41808ae6f4dcc94f72b/Sustainable-Rural-Livelihoods-A-Framework-for-Analysis.pdf (accessed on 10 January 2018).
- Ellis, F. Rural Livelihoods and Diversity in Developing Countries; Oxford University Press: Oxford, UK, 2000. [Google Scholar]
- Jiao, X.; Pouliot, M.; Walelign, S.Z. Livelihood Strategies and Dynamics in Rural Cambodia. World Dev. 2017, 97, 266–278. [Google Scholar] [CrossRef]
- Xu, D.; Zhang, J.; Rasul, G.; Liu, S.; Xie, F.; Cao, M.; Liu, E. Household Livelihood Strategies and Dependence on Agriculture in the Mountainous Settlements in the Three Gorges Reservoir Area, China. Sustainability 2015, 7, 4850–4869. [Google Scholar] [CrossRef]
- Diniz, F.H.; Hoogstra-Klein, M.A.; Kok, K.; Arts, B. Livelihood strategies in settlement projects in the brazilian amazon: Determining drivers and factors within the agrarian reform program. J. Rural Stud. 2013, 32, 196–207. [Google Scholar] [CrossRef]
- Wallign, S.Z. Livelihood strategies, environmental dependency and rural poverty: The case of two villages in rural Mozambique. Environ. Dev. Sustain. 2016, 18, 593–613. [Google Scholar] [CrossRef]
- Liu, G.; Lucas, M.; Shen, L. Rural household energy consumption and its impacts on eco-environment in Tibet: Taking Taktse county as an example. Renew. Sustain. Energy Rev. 2008, 12, 1890–1908. [Google Scholar] [CrossRef]
- Schubert, R.; Blasch, J.; Hoffmann, K. Environmental Protection, Energy Policy and Poverty Reduction—Synergies of an Integrated Approach; IED Working Paper 07-01; Institute for Environmental Decisions (IED), ETH Zurich: Zurich, Switzerland, 2008; Available online: https://doi.org/10.3929/ethz-a-005830172 (accessed on 10 January 2018).
- Chen, Q.; Yang, H.; Liu, T.; Zhang, Z. Household biomass energy choice and its policy implications on improving rural livelihoods in Sichuan, China. Energy Policy 2016, 93, 292–302. [Google Scholar] [CrossRef]
- NBSC. Source: National Bureau of Statistics of China. Available online: http://data.stats.gov.cn/ (accessed on 10 January 2018).
- Jiang, L.; O’Neill, B.C. The energy transition in rural China. Int. J. Glob. Energy Issues 2004, 21, 2–26. [Google Scholar] [CrossRef]
- Wang, C.; Yang, Y.; Zhang, Y. Rural household livelihood change, fuelwood substitution, and hilly ecosystem restoration: Evidence from China. Renew. Sustain. Energy Rev. 2012, 16, 2475–2482. [Google Scholar] [CrossRef]
- Ma, X.; Ye, Y.; Shi, X.; Zou, L. Decoupling economic growth from CO2 emissions: A decomposition analysis of China's household energy consumption. Adv. Clim. Chang. Res. 2016, 7, 192–200. [Google Scholar] [CrossRef]
- Wang, Q.; Qiu, H. Situation and outlook of solar energy utilization in Tibet, China. Renew Sustain. Energy Rev. 2009, 13, 2181–2186. [Google Scholar] [CrossRef]
- Baotian, P.; Jijun, L. Qinghai-Tibetan Plateau: A driver and amplifier of the Global Climatic Changes. J. Lanzhou Univ. 1996, 32, 108–115. (In Chinese) [Google Scholar]
- Ping, X.; Li, C.; Jiang, Z. Household energy consumption patterns in agricultural zone, pastoral zone and agro-pastoral transitional zone in eastern part of Qinghai-Tibet Plateau. Biomass Bioenergy 2013, 58, 1–9. [Google Scholar] [CrossRef]
- Wei, X.; Yang, P.; Wang, Y.; Xie, Z. Use of rural energy resources and eco-environmental degradation in Tibet. J. Environ. Sci. 2004, 16, 1046–1050. [Google Scholar]
- Fang, Y.; Wei, Y. Climate change adaptation on the Qinghai–Tibetan Plateau: The importance of solar energy utilization for rural household. Renew. Sustain. Energy Rev. 2013, 18, 508–518. [Google Scholar] [CrossRef]
- The Government of the Gannan Tibetan Autonomous Prefecture. Available online: http://www.gn.gansu.gov.cn/ (accessed on 10 December 2017).
- Zhao, X. Impacts of human activity on environment in the high-cold pasturing area: A case of Gannan pasturing area. Acta Ecol. Sin. 2010, 30, 141–149. [Google Scholar] [CrossRef]
- Chambers, R. The origins and practice of participatory rural appraisal. World Dev. 1994, 22, 953–969. [Google Scholar] [CrossRef]
- York, R.; Rosa, E.A.; Dietz, T. STIRPAT, IPAT and ImPACT: Analytic tools for unpacking the driving forces of environmental impacts. Ecol. Econ. 2003, 46, 351–365. [Google Scholar] [CrossRef]
- Hua, X.; Yan, J.; Zhang, Y. Evaluating the role of livelihood assets in suitable livelihood strategies: Protocol for anti-poverty policy in the Eastern Tibetan Plateau, China. Ecol. Indic. 2017, 78, 62–74. [Google Scholar] [CrossRef]
- Ping, X.; Jiang, Z.; Li, C. Status and future perspectives of energy consumption and its ecological impacts in the Qinghai–Tibet region. Renew. Sustain. Energy Rev. 2011, 15, 514–523. [Google Scholar] [CrossRef]
- Han, H.; Wu, S. Rural Residential Energy Transition and Energy Consumption Intensity in China. Energy Econ. 2018. [Google Scholar] [CrossRef]
- Ping, X.; Jiang, Z.; Li, C. Social and ecological effects of biomass utilization and the willingness to use clean energy in the eastern Qinghai–Tibet plateau. Energy Policy 2012, 51, 828–833. [Google Scholar] [CrossRef]
- Alam, M.; Sathaye, J.; Barnes, D. Urban household energy use in India: Efficiency and policy implications. Energy Policy 1998, 26, 885–891. [Google Scholar] [CrossRef]
- Wang, R.; Jiang, Z. Energy consumption in China’s rural areas: A study based on the village energy survey. J. Clean. Prod. 2017, 143, 452–461. [Google Scholar] [CrossRef]
- Wang, B.; Li, H.; Yuan, X.; Sun, Z.M. Energy Poverty in China: A Dynamic Analysis Based on a Hybrid Panel Data Decision Model. Energies 2017, 10, 1942. [Google Scholar] [CrossRef]
- Zhao, Q.; Chen, Q.; Xiao, Y.; Tian, G.; Chu, X.; Liu, Q. Saving Forests through Development? Fuelwood Consumption and the Energy-Ladder Hypothesis in Rural Southern China. Transform. Bus. Econ. 2017, 16, 199–219. [Google Scholar]
- Zhao, X. Environmental Impact of Different Livelihood Strategies of Farmers: A Case of the Gannan Plateau. Sci. Geogr. Sin. 2013, 33, 545–552. [Google Scholar]
Figure 1.
Location of the Qinghai–Tibet Plateau and the studied area of Gannan.

Figure 2.
Energy structure of household energy consumptions.


Table 1.
Characteristics of peasant households in Gannan.
| Types | PFH | HCO | NFH |
|---|---|---|---|
| Family size (people/family) | 5.14 | 5.39 | 5.20 |
| Proportion of males (%) | 54.76 | 51.06 | 49.33 |
| Laborers (person/family) | 2.78 | 3.02 | 2.98 |
| Proportion with senior high school education and above (%) | 5.60 | 9.50 | 11.4 |
PFH, pure farming household; HCO, household with combined occupations; NFH, nonfarming household.
Table 2.
Household energy consumption with different livelihoods (per capita).
| Average (kgce) | Cow Manure (kgce) | Crop Straws (kgce) | Firewood (kgce) | Coal (kgce) | Electricity (kgce) | |
|---|---|---|---|---|---|---|
| PPA | 779.87 | 702.64 | 0.13 | 6.78 | 61.26 | 9.06 |
| FPA | 312.32 | 19.07 | 4.60 | 125.12 | 155.52 | 8.01 |
| FA | 274.45 | 19.40 | 138.06 | 49.52 | 51.27 | 16.20 |
| FH | 738.08 | 536.14 | 85.96 | 42.94 | 63.61 | 9.43 |
| HCO | 368.34 | 141.56 | 52.72 | 71.62 | 91.79 | 10.65 |
| NFH | 260.49 | 63.41 | 4.11 | 66.86 | 112.92 | 13.19 |
FPA, farming-pastoral area; FA, farming area; FH, farming household; kgce: kilogram of coal equivalent.
Table 3.
Estimated results of impact of livelihood strategy on energy consumption.
| Energy Consumption Amount | Energy Consumption Pattern | ||||
|---|---|---|---|---|---|
| Coefficient | Standard Deviation | Coefficient | Wald Value | Exp(b) | |
| Constant | 1.407 | 1.271 | −2.396 | 1.965 | 0.091 |
| Family size | 1.457 ※※※ | 0.257 | 0.249 | 1.347 | 1.283 |
| Labor education level | −0.101 | 0.139 | 0.662 ※※ | 5.381 | 1.939 |
| Per capita income | 0.349 ※※ | 0.132 | 0.358 ※※※ | 11.245 | 1.431 |
| Per capita arable land | 0.114 | 0.113 | 0.028 | 0.160 | 1.029 |
| Per capita firewood land | −0.103 | 0.112 | −2.224 ※※ | 4.636 | 0.108 |
| Number of livestock | 0.144 ※ | 0.078 | −0.008 ※※ | 0.467 | 0.992 |
| Distance to the township | −0.446 | 0.055 | −0.013 ※※ | 5.884 | 0.987 |
| Nonagriculture area | −0.84 ※※ | 0.080 | 3.645 ※※※ | 14.122 | 38.278 |
| Pure pasturing area | 1.488 ※※※ | 0.317 | 1.244 ※ | 2.871 | 3.468 |
| Farming area | 0.775 | 0.267 | −1.353 ※ | 1.971 | 0.259 |
| Model test | R2 | 0.729 | Accuracy 89.78% | Nagelkerke R2 | 0.719 |
| F-statistic | 19.437 ※※※ | Log likelihood 128.28 | Chi-squareTest value | 114.07 ※※※ | |
(※: 10% level, ※※: 5% level, ※※※: 1% level).
© 2018 by the authors. Licensee MDPI, Basel, Switzerland. This article is an open access article distributed under the terms and conditions of the Creative Commons Attribution (CC BY) license (http://creativecommons.org/licenses/by/4.0/).
Share and Cite
MDPI and ACS Style
Zhao, X.; Zhao, H.; Jiang, L.; Lu, C.; Xue, B. The Influence of Farmers’ Livelihood Strategies on Household Energy Consumption in the Eastern Qinghai–Tibet Plateau, China. Sustainability 2018, 10, 1780. https://doi.org/10.3390/su10061780
AMA Style
Zhao X, Zhao H, Jiang L, Lu C, Xue B. The Influence of Farmers’ Livelihood Strategies on Household Energy Consumption in the Eastern Qinghai–Tibet Plateau, China. Sustainability. 2018; 10(6):1780. https://doi.org/10.3390/su10061780
Chicago/Turabian StyleZhao, Xueyan, Haili Zhao, Lu Jiang, Chenyu Lu, and Bing Xue. 2018. "The Influence of Farmers’ Livelihood Strategies on Household Energy Consumption in the Eastern Qinghai–Tibet Plateau, China" Sustainability 10, no. 6: 1780. https://doi.org/10.3390/su10061780
Note that from the first issue of 2016, this journal uses article numbers instead of page numbers. See further details here.