Benchmarking the Life-Cycle Environmental Performance of Buildings


1
ISISE, Department of Civil Engineering, University of Coimbra, 3030-788 Coimbra, Portugal
2
European Commission, Joint Research Centre, Safety and Security of Buildings Unit, TP 480, Via E. Fermi 2749, Ispra, VA 21027, Italy
*
Author to whom correspondence should be addressed.
Sustainability 2018, 10(5), 1454; https://doi.org/10.3390/su10051454
Submission received: 9 April 2018
/
Revised: 2 May 2018
/
Accepted: 3 May 2018
/
Published: 7 May 2018
(This article belongs to the Section Environmental Sustainability and Applications)
Abstract
:The work presented in this paper is part of a research project aiming for the development of a performance-based approach for sustainable design, focusing on the efficient use of natural resources over the lifetime of buildings. The proposed approach requires the set of benchmarks to provide a consistent and transparent yardstick for the environmental performance of buildings and to strive towards an effective reduction in the use of resources and relative environmental impacts in the building sector. This paper focuses on the development of the framework for the quantification of the benchmarks. Additionally, a review of available benchmarks is provided, showing a huge diversity of values. One of the main factors contributing to such diversity is the lack of a reliable model for the quantification of the benchmarks. To overcome this problem, a consistent model for life-cycle assessment (LCA) is adopted, which is based on a standardized framework and enables comparability of results. Based on the proposed approach, a preliminary set of benchmarks for residential buildings is defined, leading to values in the range of 5–12 kg CO2/m2.yr and 68–186 MJ/m2.yr, for life-cycle global warming and total primary energy, respectively.
1. Introduction
The construction sector has a huge responsibility when it comes to the consumption of natural resources, the use of energy and the production of waste due to construction and demolition activities. Therefore, it plays a pivotal role in the effort to achieve sustainable development.
The consumption of natural resources for the production of construction materials is responsible for about 50% of all materials that are extracted from Earth [1]. In fact, the use of resources for building construction, in terms of mass, represents one of the biggest challenges in terms of resource consumption. For instance, in relation to some of the most popular construction materials, concrete used in buildings accounts for about 75% of total consumption, the use of aggregate materials accounts for about 65%, and the use of steel and wood for approximately 21% and 37.5%, respectively [2].
On the other hand, construction and demolition waste (C&DW) is one of the most important waste streams generated in the European Union (EU), accounting for approximately 25–30% of all waste generated in the EU and consists of numerous materials with potential for recycling.
Over the last few years, huge efforts have been made towards the efficient use of energy in buildings during the use stage due to heating and cooling needs, usually known as operational energy. This issue had been intensively addressed and major EU policies have been put into practice leading to considerable reductions in the operational energy of buildings. The aim is to make all new buildings nearly zero-energy by 2020 [3]. Hence, since the operational energy of buildings is being reduced, materials and embodied energy are becoming increasingly more important for resource-efficient construction. In fact, one of the measures to reduce the energy bill due to comfort requirements is usually to increase the insulation of the building envelope, leading to higher resource consumption and higher embodied energy [4].
However, Earth has finite resources and their use in buildings should be optimized to make the best use of them, over the full lifespan.
According to the European Commission, resource efficiency entails ‘using the Earth’s limited resources in a sustainable manner while minimising impacts on the environment’, thus reducing the inputs of resources, optimising production and use stages of materials, and minimising waste [5]. To enhance the use of resources, the EU roadmap to a resource-efficient Europe [1] sets ambitious targets for 2020: all new buildings should be highly material-efficient and 70% of non-hazardous construction and demolition waste will be recycled.
More recently, the EU circular economy action plan [6] identified ‘construction and demolition’ as a priority area where resource-efficiency actions should be concentrated. The transition towards a circular economy implies that resources and materials are maintained in the economy for as long as possible and waste is minimized. In relation to the construction sector, enhanced design strategies are promoted, leading to reduced environmental impacts, higher durability, and higher recyclability.
The work presented in this paper is part of the research project EFIResources: Resource Efficient Construction towards Sustainable Design [7]. Besides supporting the aforementioned EU policies, this project aims for the development of a performance-based approach for sustainable design, enabling to assess the efficient use of resources in buildings, throughout the complete life cycle, and complying with the design rules and reliability provisions of European standards for structural design, the Eurocodes.
Following the EU definition of resource efficiency referred to above, efficiency can be considered as a relative measure, so that at least two values are compared and a trend may be observed. In order to measure the potential reductions, in terms of resource use and environmental impacts, and thus assess the efficiency of buildings, reference values or benchmarks are needed. Therefore, in the proposed approach for sustainability design, the performance of a building is benchmarked against standard and/or best practices.
Hence, in the model for sustainable design two variables are defined: (i) the environmental performance of the building (E); and (ii) the reference value of the environmental performance for the same type of building (R), against which the performance of the building may be compared [8]. Both variables are quantified based on a life-cycle approach and, therefore, are subjected to a high degree of uncertainty and variability not only due to the long lifespan of buildings but also due to the inherent uncertainties of life-cycle approaches. These uncertainties are taken into account in the analysis and, therefore, both variables are defined by vectors of basic random variables with respective probability density functions, as represented in Figure 1.
The proposed performance-based approach for sustainable design is in line with the assessment of safety criteria of the Eurocodes, in which the actual performance of the structure is compared to an acceptable or targeted structural performance. Moreover, this approach aims to harmonize the sustainable assessment of buildings and to enable an easier integration of structural and sustainability criteria into the design process of buildings, thus coping with the basic requirements for construction work of the Construction Products Regulation [9].
The proposed approach is limited to the assessment of the structural system of residential and office buildings; thus focusing on the work for which structural engineers are directly responsible. The weight, by mass, of the structural system of a building is usually dominant in relation to the weight of the full building. Structural engineers have the ability to decide, during the design process, about which materials and structural systems to adopt in the process. Therefore, providing the chance for structural engineers to include environmental criteria in the decision-making process of building design will foster a more efficient use of resources and, consequently, will enable the environmental impacts of construction work to be reduced. In this perspective, structural engineers play a leading role in the pursuit of a sustainable built environment [8].
However, in the future, the developed approach may be applied to other building components and other building types. Moreover, currently only the environmental component of sustainability is considered but the approach is easily adapted to embrace other criteria.
This paper focuses on the development of the framework for the quantification of the benchmarks. Hence, in the following section, a review of reference values found in the literature is provided, focusing on residential and office buildings. Then, the general framework adopted for the development of benchmarks is described. The development of benchmarks should rely on a consistent model for life-cycle assessment (LCA), therefore in Section 4 a brief description of the developed model for LCA of buildings is provided. Based on the proposed approach, the last section of this paper provides a preliminary set of benchmarks for residential buildings.
2. Benchmarks in the Building Sector
2.1. Why the Benchmarking of Buildings?
Benchmarks are often used to monitor the changes and/or progress in different sectors induced by EU directives. For instance, in relation to the operational energy, the EU has adopted a number of measures to improve the energy efficiency of buildings. Following the implementation of such measures, energy-efficiency certificates are now mandatory for the sale and rental of buildings, which benchmark the energy consumption of buildings during the operation stage. This was a crucial step towards the effective reduction of the operational energy of buildings and to set ambitious targets for energy efficiency by 2020 and onwards [10].
Similarly, a benchmarking initiative in the US [11] for the energy consumption of buildings enables building owners and occupants to benchmark the energy consumption of their properties, based on the monthly energy bill, with other similar properties. This has been leading to significant reductions in terms of energy consumption but also to an increased awareness and demand for energy-efficient properties. Thus, in this case, benchmarking is additionally used as a policy tool for forcing the real estate market to properly value energy efficiency.
Benchmarking is also commonly used in rating systems for the ecological labelling of buildings such as LEED [12], BREEAM [13], HQE [14], SBTool [15], DGNB [16], etc. In these systems, the evaluation of the performance of a building, based on selected criteria, is compared with predefined thresholds or reference values. Quantitative and qualitative indicators are then translated into grades that are further aggregated into a final score. Although providing good guidelines for the design of buildings, these systems have some drawbacks [17]. One of the most relevant disadvantages is that they do not enable comparability due to disparities in the scope of analysis, selection of indicators, use of reference values, adopted calculation methods, etc. [18]. Moreover, this type of system influences only a very small part of the building stock worldwide and its use has not led to significant reductions in terms of CO2 emissions [19].
Hence, in the proposed approach the main goal for the development of the benchmarks is to provide a consistent and transparent yardstick to assess the environmental performance of buildings, striving towards an effective reduction of the use of resources and relative environmental impacts in the building sector.
2.2. Review of Benchmarks for Buildings
A literature review was carried out and available benchmarks for the environmental performance of buildings are provided in the following paragraphs.
Most reference values found in the literature refer to the operational stage of buildings, thus referring to the energy needed for heating and cooling the building over its service life. In a review made by Peng et al. [20], based on more than 100 buildings across different countries, the life-cycle energy consumption of residential and commercial buildings is in the range of 40–400 kWh/m2.yr and 120–550 kWh/m2.yr, respectively. For life-cycle CO2 emissions the values are 50 kg CO2 eq./m2.yr and 30–230 kg CO2 eq./m2.yr, respectively, for residential and commercial buildings. The share of embodied energy and embodied CO2 emissions in these global values is up to 80% for residential buildings and about 20% for commercial buildings.
These values are in the same range of the values provided by Moschetti et al. [21], in a study carried out for residential buildings in Italy. In this case, the values are 140 kWh/m2.yr and 35 kg CO2 eq./m2.yr for life-cycle energy consumption and climate change, respectively. Although no separation is made in terms of embodied impacts, when only the construction stage is considered the shares of energy and CO2 emissions are about 30% of the respective global amounts.
The reference values for residential buildings, provided by the German rating system DGNB, for life-cycle primary energy and global warming are 100 kWh/m2.yr and 17 kg CO2 eq./m2.yr, respectively [22]. In relation to these values, the share related to construction materials are about 45–50%.
In a statistical analysis made by the French Association HQE and Centre Scientifique et Technique du batiment (CSTB) [23], the performance of 63 buildings was carried out based on an approach developed by HQE for the assessment of the environmental performance buildings. Three types of buildings were considered: individual houses, collective buildings and office buildings. The analysis took into account two time frames: 50 and 100 years. In this study, the values are normalized by the net floor area (NFA) of each building. In terms of the global performance of buildings, the life-cycle primary energy is in the range of 170–380 kWh/m2.yr, with a median value of 210 kWh/m2.yr, for a lifespan of 50 years. For a lifespan of 100 years, the median value is reduced to 200 kWh/m2.yr. For life-cycle CO2 emissions and a lifespan of 50 years, the range is 15–23.5 kg CO2 eq./m2.yr, with a median value of 19 kg CO2 eq./m2.yr. In this case, for a lifespan of 100 years, the median value is reduced to 10.5 kg CO2 eq./m2.yr. The shares of embodied impacts are about 25% for primary energy and about 55% for CO2 emissions.
The share of embodied impacts in relation to life-cycle impacts, depends not only of the type of building but also on the options taken for the design. For instance, in terms of energy consumption, buildings that are designed to be energy efficient tend to have a higher share of embodied energy in relation to the whole energy. In a review performed by Sartori and Hestnes [24], the share of embodied energy in conventional buildings was in the range of 2–38%, while, in ‘low-energy’ buildings the share ranged between 9–46%.
Given the aim of the present research, in the following paragraphs the focus is limited to residential and office buildings. Furthermore, emphasis is given to values referring to embodied impacts.
2.2.1. Buildings with Different Typologies
The building typology influences the life-cycle performance of the building and consequently, the reference values obtained for each type of building. Thus, in the following paragraphs, reference values are differentiated by building typologies.
In the statistical analysis referred above [23], when only the building component of ‘construction products and equipment’ is taken into account, the results for ‘primary energy’ and ‘climatic change’ are indicated in Table 1. The intermediate values are the median values and the minimum and maximum values correspond to the 1st and 3rd quartiles, respectively.
As observed from Table 1, office buildings (BB) present the higher values, both for primary energy and climate change.
The building component of ‘construction products and equipment’ was further divided into: (i) main construction works, which included accesses and general infrastructure (Lot 1), foundations of sub-structure (Lot 2), and superstructure (Lot 3); (ii) secondary construction works; and (iii) equipment. Focusing on the structural system (lots 2 and 3), the results are indicated in Table 2.
The weight of the performance of the structural system in relation to ‘construction products and equipment’ and to the complete the building, are highlighted in Table 3, for each building typology.
In relation to the performance of the global building (including the values related to the operational energy), the weight of the structural system is below 10% for the environmental category of ‘primary energy’, for all buildings, but it is higher than 20% for ‘climatic change’ for collective buildings (IC) and individual houses (MI) and higher than 30% for BB.
Naturally, the importance of the structural system to the component ‘construction products and equipment’ increases. In this case, for primary energy, IC has the highest contribution with 31% and MI the lowest with 22%. In relation to ‘climatic change’, the minimum and maximum shares are 36% for MI and 50% for the other typologies.
The results indicated above are referring to a lifespan of 50 years. However, the conclusions for a lifespan of 100 years are similar to those obtained for the time span of 50 years, with slight reductions found for the global performance of the building: about −5% for ‘primary energy’ and about −15% for ‘climatic change’.
In a different survey, in this case performed by the International Energy Agency, about 80 buildings from different countries, were evaluated in terms of the embodied energy and embodied CO2 [25]. Some of the building works in this survey referred to refurbishment.
Contrary to the previous survey, the results are not comparable as most of the collected case studies were analysed based on different methodologies, databases and system settings, thus leading to a huge variability of the results. In this case, for new residential buildings, the values for embodied carbon range from 4–9 kg CO2 eq./m2.yr; while for embodied energy the values are in the range of 7.1–107 MJ/m2.yr. For new office buildings, the range of values is about 3–22 kg CO2 eq./m2 and 9–240 MJ/m2.yr, for embodied carbon and embodied energy, respectively [26]. In relation to the importance of the different stages, in general, the production stage is dominant for all case studies referring to new buildings; in the case of refurbishment, the contribution of the production stage is, in some cases, similar to the contribution of the replacements. The contribution of the end-of-life stage varies from 5% to 25% for embodied carbon and is lower than 10% for embodied energy.
Additional reference values found in the literature for embodied carbon and embodied energy are summarized in Table 4 for residential and office buildings. It is observed that some of the sources indicated in the table, provide values also for other building typologies.
As observed from Table 4, the range of values available in the literature is very wide. This variability is mainly due to the adoption of different scopes, units, methodologies, etc. All these factors have a considerable impact on the outcome of the analyses and, therefore, they cannot by compared.
2.2.2. Buildings with Different Structural Systems
The importance of the structural system of a building in relation to the global environmental performance of a building is considered to be small by some authors. However, the weight of the structure accounts for the highest share of the weight of the building, thus contributing to a significant share of impacts [27] and costs [28]. For instance, the structural systems of office buildings may account for 60–67% of the total embodied energy [29]; while, the embodied carbon of structures may reach shares of 20% to 40% [18,30].
Table 5 summarizes reference values for embodied carbon and embodied energy for different structural systems. Likewise, emphasis is given to residential and office buildings.
Again, it can be noticed that the values are not comparable as they are based on different methodological choices and, in some cases, information about important parameters is omitted in the reviewed sources.
Likewise, Table 5 shows a huge variability of values for each structural system and it is not possible to establish a trend between different structural systems. Among the reasons indicated above, the scope of the life-cycle analysis is of particular importance for construction materials [17]. The consideration of a cradle-to-gate (C2Gt) analysis or a cradle-to-grave (C2G) analysis has a huge influence for some materials, which obviously leads to inconsistencies in comparative assertions.
To illustrate this, the cradle-to-grave results for some construction materials are indicated in Table 6, in terms of Global-Warming Potential (GWP). It is observed that these values are not representative of each material. Furthermore, comparisons at the product level are meaningless and the only purpose of this table is to illustrate the influence of a different scope in LCA.
As observed from Table 6, for some materials (such as concrete), cradle-to-gate values (Modules A1–A3) (the relation between different life cycle analysis and Modules is given in Table 7) are not substantially changed when the complete life cycle is taken into account. However, for other construction products, this is not usually the case.
Taking into account the case of steel reinforcement indicated in Table 6, when only cradle-to-gate values are considered, the production 1 kg of steel leads to 3.20 kg CO2 eq. However, when the complete life cycle (cradle-to-cradle) is considered than the value of GWP is reduced to 2.21 kg CO2 eq.
Similarly, for timber products, the scope of the analysis has a huge influence on the results of the LCA. However, in this case, there is an additional question to be considered: the biogenic carbon sequestration. The carbon that is taken from the atmosphere by biomass is temporarily stored in bio-based materials. At the end-of-life stage, through decomposition or incineration, carbon emissions that were temporarily stored are released. In this case, the omission of end-of-life stages from the scope of the analysis could lead to biased interpretation of the results.
Moreover, biogenic carbon should only be considered in Modules A1–A3, when the wood is originated from a sustainably managed forest (a sustainable forest ‘is carbon and climate neutral and preserves biodiversity to support fundamental functionalities and ecosystems services on a landscape level’ [44]), which is the case of the material indicated in Table 6, according to the information provided by the source. In this case, the results for the softwood timber are reported as a total GWP (GWPT), as well as biogenic carbon (GWPB) and fossil carbon (GWPF). In all cases, the values from Modules A1–A3 alone are completely different from the final values (Modules A1 to D).
Following the guidance from EN16449 [45] and as a matter of transparency, the environmental category of GWP should be divided into GWP including biogenic carbon and GWP excluding biogenic carbon. In the adopted model for LCA [17], described in Section 4 of this paper, the two indicators are considered.
2.3. Need of a Consistent Life-Cycle Assessment (LCA) Model for Benchmarking
As observed from Table 4 and Table 5, the diversity of values found in the literature is very wide. The main factors contributing to such diversity may be summarized as the following:
- Goal and scope of analysis—In some cases only a cradle-to-gate analysis was performed; whereas, other cases considered a cradle-to-grave analysis. Additionally, the building components that are considered in the analysis vary from case to case, in some cases the complete building is considered, whereas in other cases only structural elements are taken into account, etc.;
- Functional unit—the results of the analysis are usually normalized by the area of the building but different types of values are considered, such as gross floor area, net floor area, internal net floor area, etc.;
- Source of building data—the accuracy and completeness of building data vary from case to case; in some cases data is related to the preliminary design of the building and in other cases is referring to as-built data;
- Source of environmental data—the use of generic databases, specific data or other sources for materials and processes leads usually to a wide variability of the results of the environmental analysis of buildings;
- The LCA approach—there is a wide diversity of LCA approaches, with different indicators and calculation methods, leading obviously to different results. For instance, the use of a input-output approach usually leads to higher results than a process-based approach;
- Scenarios and assumptions—the analyses are based on different scenarios for the performance of the building over its life cycle and other assumptions (e.g., the estimation of the service life of the building and building components, maintenance needs, recycling scenarios, etc.). Moreover, in many cases, this information is simply omitted.
All the above factors have a huge impact on the results of LCA and make it very difficult to perform appropriate comparisons between buildings. Therefore, to overcome the aforementioned problems in the development of the benchmarks, a consistent model for LCA was adopted, based on the standardized framework for the life-cycle assessment of construction works developed by the European Committee for Standardization CEN/TC 350 [17]. The most relevant aspects of this model are summarized in Section 4.
3. General Framework for the Benchmarks
The developed methodology for setting the benchmarks for the environmental performance of buildings is described in the following paragraphs.
3.1. Graduated Approach
One of the key steps in the development of benchmarks is the collection of accurate, consistently measured and verifiable data [46]. This is a major barrier in the development of benchmarks for the life-cycle performance of buildings, as the process of data collection is usually difficult, thus limiting the scope and accuracy of the life-cycle assessment of buildings.
Taking into account the above limitation and following guidance in [46], a graduated approach was adopted for the development of the benchmarks [47], starting on a simple basis and being progressively improved over time, as data collection on buildings and relative processes becomes more complete and precise.
Hence, the proposed framework for the benchmarking of buildings is an evolving process in sophistication and complexity, starting from simple data and improving the initial set of benchmarks over time, as illustrated in Figure 2.
In the follow-up of the aforementioned project, a database is foreseen for the collection of building data, which will enable the benchmarks to be continuously updated, thus increasing their accuracy and reliability over time.
3.1.1. Objectives and Scope
The main goal of the benchmarks is to provide a consistent and transparent yardstick for the environmental performance of buildings, enabling comparisons to be made and leading to effective reductions of the use of resources and relative environmental impacts in the building sector.
The assessment of the environmental performance of buildings, which is based on a life-cycle analysis, is limited to the structural system of the building, including the foundations. Moreover, currently only two types of buildings are addressed: residential and office buildings.
However, the scope of the analysis may be expanded in the future, to account for the complete building and other building typologies.
3.1.2. Data Collection
The definition of benchmarks entails the collection of two different types of data: (i) the collection of building data, which includes quantities of materials and an inventory of processes considered in the scope of the analysis, throughout the life cycle of the building; and (ii) the collection of environmental data for the quantification of potential environmental impacts.
In relation to the first type of information, building data (consisting of list of bill-of-materials, building plans, etc.) may be supplied from design offices, building promoters, etc.
For the second type of information, there are generally two main sources of data: generic data from available databases and specific data from manufactures and producers, which can be provided by environmental product declarations (EPDs). A list of available generic databases is provided by the European Platform for Life-Cycle Assessment [48]. On the other hand, specific data from manufactures is usually provided by EDPs, which are Type III environmental declarations according to ISO 14025 [49].
3.2. Quantification of Benchmarks
To guarantee consistency in the development of the benchmarks it is crucial that all calculations are based on the same methodological choices and on the same quality of data.
Hence, the model developed for the life-cycle assessment of buildings is based on the standardized framework for LCA developed by CEN/TC 350 for the sustainability assessment of construction works, provided by EN 15804 [50] and EN 15978 [51]. The adoption of a standardized procedure, which was specifically developed for the assessment of construction works, ensures the required consistency, thus enabling comparability and benchmarking. The most relevant aspects of the adopted model for LCA are provided in Section 4 of this paper.
3.3. Setting of Benchmarks
The development of benchmarks may be based [52]: (i) on political targets or strategies; (ii) on limit values prescribed by codes and standards; or (iii) on the statistical analysis of an appropriate set of data.
In the approach presented in this paper, the set of benchmarks is based on the statistical evaluation of a sample of buildings collected for this purpose. Moreover, following the guidance in Castro et al. [53], ‘conventional’ practice (also known as ‘business as usual’) is assumed to be given by the median value of the environmental performance of the buildings (represented by any of the indicators in Table 8, Table 9 and Table 10); while, ‘best practice’ is assumed to be given by the value of the environmental performance that is achieved by only 25% of the buildings, i.e., the upper limit of the first quartile, as illustrated in Figure 3.
It is noteworthy that the quality and robustness of benchmarks based on a statistical analysis is strongly dependent on the quality and representativeness of the sample in relation to the ‘basic population’.
3.4. Differentiation Factors for Benchmarking
The design of a building depends of local conditions, technical and functional requirements of safety regulations, and/or a client’s specific requirements. Therefore, the environmental performance of buildings will also be influenced by the same factors and the development of benchmarks should take into account these differentiation factors.
Hence, in the development of the benchmarks three main factors were considered [47]: (i) building typology; (ii) seismic area; and (iii) climatic area.
In relation to building typology, the focus is currently given to residential and office buildings. Moreover, for residential buildings, three different types of buildings are considered: single family houses, multi-family houses (≤5 storeys), and multi-storey buildings (>5 storeys).
On the other hand, one of the design loads prescribed in the structural codes for building design is the seismic load [54]. The severity of this load depends on the building location. In locations prone to seismic events, the seismic load may be governing the design of the building. In such locations, structures are required to bear proper stiffness and load-bearing capacity to resist frequent earthquakes, and possess proper ductility and energy-dissipating capacity to avoid collapse, in case of rare earthquakes [55]. Hence, the seismic design influences the way the structure is conceived and, consequently, the quantities of materials that are required. Therefore, the definition of benchmarks for buildings should take this into account, as the vulnerability of buildings to seismic hazards varies across European countries, as observed from Figure 4a.
Finally, in relation to the climatic area, besides the direct influence of the climate on the energy needs for heating and cooling, the specific location of the building is also responsible for other types of energy consumption, like the increased energy requirements for building illumination when the number of daylight hours decreases [58].
The design of a building should take into account the climatic characteristics where the building is supposed to be built, in order to comply with normative energy requirements.
Taking as an example the Köppen–Geiger climate classification [57], illustrated in Figure 4b, a building designed for a southern European country has to cope with warm temperatures, dry and hot summers; whereas, buildings in northern countries have to cope with low temperatures, humidity and cool summers. Therefore, in general, a building designed for a southern country is not appropriate for a northern country and vice-versa.
4. Model for LCA of Buildings
As previously mentioned, the set of benchmarks for the life-cycle environmental performance of buildings should rely on a consistent methodology for life-cycle assessment. The adopted model for the LCA of buildings is based on EN 15804 [50] and EN 15978 [51]. The adoption of a standardized procedure, which was developed specifically for the assessment of construction work, ensures the required comparability of different building assessments.
In the following paragraphs, the most relevant aspects of the approach are described. Full details of the LCA model are given in Gervasio and Dimova [17].
4.1. Goals and Scope of the Analysis
As already mentioned, the ultimate purpose of the development of benchmarks is to allow for harmonization between environmental and structural criteria in the design of buildings, leading to an enhanced design, coping with the required safety demands, but with lower pressure on the environment and on the use of natural resources.
As previously stated, the development of the benchmarks is limited to the structural system of the building, including the foundations.
Nevertheless, it can be observed that although the scope of the analysis is currently limited to the structural system, the LCA model summarized in this paper allows for the analysis of the full building.
Hence, the model takes into account the complete life cycle of the building, from the product stage to the end-of-life stage. The modular concept introduced by CEN/TC 350 standards for the definition of the system boundaries of the LCA, represented in Table 7, is adopted. According to EN15978, the system boundary of the analysis entails the stage of material production (Modules A1 to A3), the construction stage (Modules A4 and A5), the use stage (Modules B1 to B7), and the end-of-life stage (Modules C1 to C4). Module D allocates the benefits and loads due to recycling, recovery or reuse of materials. According to the standard, this module is considered beyond the system boundary of the analysis.
However, in the adopted model, all modules (including Module D) are taken into account, except Modules B6 and B7 (as indicated in Table 7), which address the consumption of operational energy and water, respectively, during the use stage of the building.
In fact, Module D plays an important role as it enables the loop for materials with potential for reuse, recycling and/or recovery to be closed. Therefore, the adopted LCA model takes into account a system expansion and considers Module D a mandatory component of the analysis. As previously mentioned, this is a deviation from CEN/TC 350 standards, which consider Module D optional in the LCA of buildings.
4.2. Functional Equivalent
The adopted functional equivalent includes the type of use of the building (residential or office building), the total Gross Floor Area (GFA) and a reference period of time. The GFA is measured according to the external dimensions of a building and includes all areas inside the building, including supporting areas. The results of the life-cycle analysis, for any environmental category, are provided for the functional equivalent, normalized by the GFA of the building and per year, as given by the following expression:
The reference period of time is given by the estimated working life of the building, according to the code or regulation used in the design of the structural system of the building. In case the estimated working life of the building is not provided in the project documentation, a period of time of 50 years may be considered, which is the design working life recommended by EN1990 [59] for residential and office buildings. Adequate scenarios should be taken into account in the use stage of the building to comply with the period of time considered.
4.3. Indicators for Life-Cycle Environmental Performance
The selection of impact categories must be consistent with the goal of the study and the intended applications of the results, and it must be comprehensive in the sense that it covers all the main environmental issues related to the system [60].
The indicators adopted in the proposed approach are those provided by EN 15804 [50] and EN 15978 [51]. These standards allow the assessment of the environmental performance of buildings at the product level (EN 15804) and at the building level (EN 15978). The indicators describing environmental problems are provided at the product level. To assure consistency at both levels, the same indicators are considered at the building level.
Hence, two main types of environmental indicators are considered for the environmental assessment: (i) indicators focusing on impact categories using characterisation factors; and (ii) indicators focusing on environmental flows. In relation to the former, seven indicators are provided, as indicated in Table 8.
The characterization factors (CFs) used for the quantification of these indicators are provided from the Centrum voor Milieuwetenschappen Leiden Impact Assessment approach (CML-IA—version 4.1) [61] and they can be downloaded from the CML-IA website [62].
It is noted that in the proposed model for LCA, the impact category of GWP is further divided into GWP including biogenic carbon and GWP excluding biogenic carbon, for a higher transparency of the results.
The indicators focussing on environmental flows address input and output flows. The indicators describing input flows are listed in Table 9.
In relation to output flows, indicators are provided for waste categories and other flows leaving the system, as indicated in Table 10.
The environmental indicators indicated in Table 8 to Table 10 cover the most relevant environmental problems and are recommended by other life-cycle approaches [17].
However, some remarks are made in the following paragraphs about the impact category of abiotic depletion.
In LCA the depletion of natural resources is usually addressed by the impact category of abiotic depletion, which describes the decrease of availability of total reserves of resources. However, this impact category is subjected to several discussions, as there is no scientifically accurate approach for its evaluation [63].
The method for abiotic depletion adopted in the CEN standards (see Table 8) is based on the baseline method recommended by the Dutch LCA handbook [61]. In this case, the evaluation of abiotic depletion potentials (ADPs) is based on the quantity of a resource that is ultimately available in the Earth’s crust, the ‘ultimate reserve’. It is noted that in these standards, currently two types of indicators are considered for abiotic depletion: ADPelements for the depletion of non-renewable abiotic material and ADPfossil fuel for all fossil resources. The former is measured in antimony equivalent (Sb eq.) and the later in MegaJoules (MJ).
Two alternative methods for abiotic depletion are provided in the Dutch LCA handbook to enable a sensitivity analysis: one based on the ‘reserve base’ and another based on the ‘economic reserve’. The ‘reserve base’ refers to ‘resources that have a reasonable potential for becoming economically and technically available’; while the ‘economic reserve’ is the ‘part of the reserve base which can be economically extracted at the time of determination’ [64]. It is noted that both the ILCD handbook [65] and the PEF approach [66] adopted ADPs based on the ‘reserve base’ instead of ‘ultimate reserve’.
The discussion of the most suitable method for ADP is outside the scope of this paper. What is important to highlight is that, for many raw materials used in the production of common construction materials, characterization factors are difficult to quantify due to the lack of data in terms of reserves, reserve bases and ultimate reserves [64].
Hence, at present in the assessment of buildings or any other construction work the impact category of ADP based on ultimate, base or economic reserves should not be used as a proxy indicator for resource depletion.
This enhances the importance of considering a set of indicators, instead of a single indicator, for the assessment of the efficient use of resources in the life-cycle assessment of buildings.
4.4. Scenarios and Assumptions for Life-Cycle Analysis
Scenarios are necessary to estimate the behaviour of the structural system of the building over the period of time considered for the analysis.
The processes and assumptions considered in these scenarios should be based on current technological developments and standard practices. This approach may be conservative, particularly for recycling and reuse of materials, for which major improvements are expected, as the market for secondary materials is in an early stage of development.
A brief description of each scenario considered in the analysis is provided in the following paragraphs.
4.4.1. Construction Stage
The construction stage includes Modules A4 and A5 in Table 7.
Module A4
Module A4 includes the transport of materials from the gate of the manufacturing location to the construction site. The distances should be estimated for each material, taking into account the place where they are produced and the location of the building. When it is not possible to evaluate these distances, its calculation may be done based on average distances.
In addition, the type of transport considered for each material should take into account whether the material is produced locally or produced at far distances (or imported).
Module A5
All on-site activities related to the construction of the building are considered in Module A5. This includes the preliminary works on the construction site to enable the construction of the building, the use of equipment, the transport of materials and equipment on-site, waste management of products lost during the construction activities, etc. In addition, inventory data should also include emissions due to combustion engines.
However, in practice, there are very few studies focusing on this life-cycle stage and currently, it is hard to find appropriate values for its quantification.
According to Sjunnesson [67], the use of electricity for the construction of houses varies from 0.5 to 3.3 kWh per the gross floor area; while for apartments, the electricity demand varies from 1.1 to 18.2 kWh per the gross floor area.
In another study [68], the electricity consumption of two office buildings were about 18.2 kWh/m2 and 91.7 kWh/m2. In this case, the author concluded that the electricity demand due to the construction of the building frames makes only a minor contribution to the total electricity demand (lower than 0.1%).
Hence, when no better information is available for this stage, a value in the range of 1–5 kWh/GFA may be considered for residential houses, and values in the ranges of 5–20 kWh/GFA and 20–80 kWh/GFA may be considered for multi-storey residential and office buildings, respectively. It is noted that these are only rough assumptions.
4.4.2. Operation Stage
Modules B1–B5 include all relevant data in relation to the maintenance, repair and refurbishment of the structural system of the building, during the period of time considered in the analysis.
Scenarios should be considered for the relevant modules, taking into account the estimated service life of the structural components of the building.
When special features are considered in the design of the building, enabling the adaptability of the building to new functional requirements, then scenarios should be considered taking this into account, and eventually extending the period of time considered in the analysis (see Section 4.5.1).
4.4.3. End-of-Life Stage
The end-of-life stage includes Modules C1–C4 and D. In addition, when special features are considered in the design of the building, enabling an easier disassembly of the building, then scenarios should be considered to consider this and eventually justify an increased recycling rate (RR) (see Section 4.5.2).
Modules C1–C4
Module C1 includes all processes and activities on-site for the deconstruction of the building frame. This shall ideally include the use of equipment, supply of fuel, and the quantification of other emissions due to the activities performed on-site.
Currently, there is not much information about this life-cycle stage to enable a comprehensive assessment of the corresponding potential environmental impacts.
In the absence of more accurate data, the values provided in Table 11 may be used, which are based on a study conducted by the Athena Institute [69] on the deconstruction of three different types of structures: wood, steel and concrete. These values include the demolition/deconstruction of the foundations for each type of frame.
The higher use of energy for the deconstruction of the steel structure was justified by the need to handle heavy steel members and thus, the need for a longer time for the operation. On the other hand, the lower values provided in general for concrete frames is because the process is usually quicker and requires less machine time [69].
Module C2 includes the transport of the materials resulting from the disassembling of the structure to disposal or until the end-of-waste state is reached. The transportation distances may be based on average transport distances for the materials.
Module C3 includes all the processes until the end-of-waste state is reached. Hence, appropriate scenarios should be considered for each material, taking into account additional processes (if applicable) that are needed to further process the materials until they reach the end-of-waste state.
Finally, for Module C4, scenarios should be considered that include all the necessary processes or activities that are needed before disposal and for the final disposal of materials.
Module D
Module D allocates net benefits due to the substitution of primary materials. Hence, scenarios should be considered for each material to enable the quantification of the net benefits. These scenarios should be based on average available technology, current practices and current rates of recycling, reuse and recovery of materials.
Currently, no reliable rates are available and the existing values vary across different European countries. For the two most popular construction materials, and unless more accurate information is provided, the following scenarios and recycling rates are considered [17]:
- Concrete: the recycled aggregates resulting from crushing concrete are usually used in road construction or in the production of new concrete. However, the former destination is usually the most common, since the use of recycled aggregates in the production of new concrete is limited according to current regulations. In addition, an average recycling rate of 70% may be considered for concrete waste [70];
- Steel products: steel is one of the most recycled materials in the world but current rates of reuse and recycling vary according to the source of data. However, a recycling rate of 90% may be considered for structural steel and 70% for reinforcement steel.
As mentioned, Module D allocates net environmental benefits due to recycling, reuse or energy recover. Net impact has a twofold meaning [50]. In relation to environmental impacts, net impact is given by difference between the impacts due to the recycling process, which substitutes primary production, and the impacts due to the production of the avoided primary material. In relation to mass, net impact is given by the difference between the output of secondary material from the system (RR) and the input of secondary material to the system (Rc).
However, secondary material may only be considered as substituting primary production when it reaches the functional equivalence of the substituted primary material [50]. Hence, a value-correction factor (Cf) is adopted to reflect the differences in the functional equivalence of the secondary material in relation to the substituted primary material. This factor may be given by the ratio of the price of the secondary material and the price of primary material [71,72].
The main limitations on the use of this coefficient is that it requires the correct identification of the appropriate point of substitution and the existence of a stable market for the secondary material.
4.5. Design Strategies for Enhanced Life Cycle Performance
Buildings are made of huge quantities of materials and extending the life of buildings enables the most effective use of the resources invested in the building to be achieved. Likewise, increasing the potential of building materials to be recovered for reuse or recycling after the deconstruction avoids the need to produce new materials from primary resources, thus contributing to the safeguard of the natural environment. Therefore, appropriate design options may positively influence the life-cycle performance of buildings and this should be reflected in the outcome of the analysis.
In the following, two main design options are highlighted for an enhanced life-cycle performance of buildings: design for adaptability and design for deconstruction.
4.5.1. Design for Adaptability and Flexibility
Buildings are designed for long lifespans. According to the Eurocode 1990 [59], the structural system of a building is designed for a period of 50 years. Nevertheless, with proper maintenance and with the ability to accommodate changes in technical and functional requirements, buildings can last much longer than the design working life, sometimes even centuries.
Given the long period of time, it should be expected that the functional requirements of the building may change during this period. Buildings should be able to accommodate these changes and adapt to new functional requirements, otherwise they reach was is known as the ‘limit state of obsolescence’. In this case, the end-of-life is reached because the building is either worn-out or outdated and not able to satisfy the users’ requirements.
In this section, given the scope of the proposed approach, focus is given to the structural system of a building; however, it is noted that other components of the building, such as the internal partitions, play a fundamental role towards this quest.
Some of the measures that may be considered towards an adaptable and flexible structural system are the following [73]:
- Maximize the internal net space of the building to create a flexible open space. This may be achieved by maximizing the length of the spans of beams and slabs and thus reducing the number of internal columns. The German system DNGB uses a ratio between the usable area and the gross floor area to evaluate the efficient use of floor area, and maximum points are achieved for a high value of the ratio [74];
- Consider slender internal columns to maximize the internal net space, but allow a slight overdesign of the columns and respective foundations, mainly in the perimeter of the building, to enable future extensions of the building structure;
- Ensure that the structural system is designed for loads that account for future changes in the function(s) of the building;
- Some redundancy and/or overdesign of the structural elements may be useful to enable future changes and extensions of the system;
- Avoid irreversible connections between structural elements to enable an easily and economic replacement of elements and/or connection of additional elements to the structure (for instance, in steel structures preference should be given to bolted connections instead of welded connections);
- Connections should be easily accessed to enable an easy removal or addition of new elements;
- Maximize the free height between floors. In DGNB a height between floors higher than 3 m enables the maximum score to be achieved; while lower heights do not provide any points in the assessment [74].
To account for adaptability and flexibility of buildings in the development of the benchmarks, an adaptability index (Iadap) is considered .This index is linked to the functional equivalent of the building by increasing (in %) the reference period of time (see Section 4.2) considered in the analysis. In this case, the result of the building performance, for each environmental category, is given by expression (2):
In order to be able to increase the reference period of time considered in the analysis, evidence should be provided that measures, such as the ones described above, were taken into account in the design of the building.
4.5.2. Design for Deconstruction
Design for deconstruction is herein understood as a design strategy that takes into account the way the building will be disassembled, so that the amount of materials resulting from the demountable process, with potential for reuse/recycling or recovery, is maximized.
In relation to the structural system, some construction systems may provide advantages towards deconstruction, such as [75]:
- Prefabrication of the structure or structural components enables reduction in the time for deconstruction and increases the potential for reuse;
- Modular construction systems, apart from improving the adaptability of the building, enable an easier disassembly of the building, thus increasing the potential for reuse of building components;
- Structures with reversible connections enable an easier disassembly of structural elements.
The type of materials used in the structural system may also influence the ability of the structure to be disassembled, reused or recycled:
- The durability of the materials increases the potential for building components to be reused after removal;
- The use of hazardous materials should be avoided, as they may contaminate other components and, therefore, are required to be removed before recycling;
- The use of a large number of different materials should be avoided, as it adds complexity to the structure and may reduce the potential for reuse or recycling.
A deconstruction index (Ideco) is proposed to account for the potential of building components and materials to be recycled or recovered in the deconstruction process. This index (given as a %) may increase the standard recycling rate (RR) considered for each material. It is noted that for the same material, the effective recycling rate depends of the complexity of the structure and, thus, it may change from case to case.
In order to increase the standard recycling/reuse or recovery rate, the design of the structural system of the building should provide evidence that measures were taken to support the increased rate.
5. Preliminary Set of Benchmarks for Residential Buildings
5.1. Introduction
The preliminary set of benchmarks provided in the following paragraphs is based on the methodology described in Section 3 and on the statistical analysis of the case studies included in a previous research project, IMPRO-Building [76].
The LCA model used for the assessment of the buildings was briefly described in Section 4 and full details are given in [17]. The LCA was based on generic data provided by the GaBi database [41]. Additionally, data provided by EPDs was used in cases where data was missing in the above database.
In the IMPRO-Building project, data was collected to define building models with enough representativeness of the building stock at the EU-25 level. Buildings were divided into three types: single-family houses (SI), multi-family buildings (MF), and high-rise buildings (HR).
In addition, the buildings cover the three main climate zones in Europe according to heating degree days (HDD): zone Z1—South European countries (564 to 2500 HDD), zone Z2—Central European countries (2501 to 4000 HDD), and zone Z3—North European countries (4000 to 5823 HDD).
5.2. Embodied Impacts vs. Global Impacts in Each Climatic Area
Before the quantification of the benchmarks for the structural system of the buildings, a preliminary analysis was performed of the full buildings to assess the relative contribution of embodied and operational impacts in each climatic area. In this case, embodied impacts refer to the impacts due to the production and use of materials and other processes over the life cycle of the building; while operational impacts refer to the impacts due to the use of energy for heating and cooling the buildings over the period of time considered in each case. The results are illustrated in Figure 5, for the three building types and the three climatic areas, in terms of the environmental category of GWP.
As expected, the values for the operational GWP have a huge variation within each climatic area, increasing from climatic area Z1 to Z3. On the other hand, the values of embodied GWP do not have significant variation within each climatic area and even within building types, although a slight increase is observed from climatic area Z1 to Z3. In terms of building type, the values for high-rise buildings are lower than multi-family buildings and much lower than single-family houses.
This enforces the need to consider the climatic area of the building location as a differentiation factor in the development of benchmarks, particularly when the operational energy is taken into account. When only embodied impacts are considered, the importance of the climatic area is not that significant.
In the following, the life-cycle analysis of each building is limited to the structural system [17], hence insulation materials and other non-structural elements were not considered in the analysis.
5.3. Statistical Analysis of LCA Results
As previously indicated, the methodology that was used to establish the preliminary set of benchmarks (‘best’ and conventional’ values) is based on the statistical evaluation of the results obtained for each European area.
The life-cycle environmental assessment of each building is based on the functional equivalent, given by expression (1).
In this case, the type of use refers to residential buildings, although a subdivision is made in terms of single-family houses (SI), multi-family houses (MF) and high-rise buildings (HR). The reference period is taken as the service life considered for each building in the IMPRO project.
The analysis was performed for all indicators in Table 8 to Table 10. However, in this paper, emphasis is given to two indicators: global warming potential (in kg CO2 eq./m2.yr) and primary energy (in MJ/m2.yr). Global warming potential is further divided in order to include biogenic carbon (GWP1) and to exclude it (GWP2).
In the following statistical analysis, it is assumed that the conventional practice is given by the median of the values and the best practice given by the first quartile (25%), i.e., the boundary of the 25% lowest values. In the sample of values, no discrepancy values (outliers) where found.
5.3.1. Statistical Analysis for Each Life-Cycle Stage
In this case, the scope of the LCA included Modules A1–A5, Module B4, Modules C1–C4 and Module D. The results of the statistical analysis for zone Z1 are indicated in Table 13, for each module and for the environmental category of global warming potential, including biogenic carbon. It can be observed that the values for high-rise buildings are not presented for individual climatic areas as the number of buildings in each area is reduced.
As observed from this table, Modules A1–A3 make a dominant contribution towards the aggregated life-cycle performance of the buildings. On the other side, Module B4, which in this case accounts for minor replacements in the structural system of the buildings, makes a smaller contribution. The same trend was observed for the environmental category of primary energy.
In terms of building typology, the values for single-family houses are slightly higher than the values for multi-family buildings.
The results obtained for climatic areas Z2 and Z3 are similar to those presented in the previous table.
5.3.2. Statistical Analysis for All Areas
The previous results were aggregated over the complete life cycle of the buildings and for each climatic European area. The respective results are illustrated in Figure 6, Figure 7 and Figure 8.
The results for GWP1 are indicated in Figure 6 and it is observed that in terms of median values, in all three areas, the results are very close, in particular for single houses with a range of 7.19–7.88 kg CO2 eq./m2.yr. For multi-family buildings, the median value ranges from 5.64 to 7.03 kg CO2 eq./m2.yr.
However, in both cases, the scatter of values is high. In this case, the variability of the values is not related to the climatic area but with the different types of structures considered in each area.
The results for GWP2 are indicated in Figure 7. In this case, the ranges of median values are 7.40–9.32 kg CO2 eq./m2.yr and 7.26–8.07 kg CO2 eq./m2.yr for single-family and multi-family buildings, respectively. The median values for area Z2 are slightly lower than the other 2 areas.
Finally, for the environmental category of Primary Energy (PE), the aggregated results are indicated in Figure 8. Likewise, there are no significant differences in the results. The range of median values for single-family houses is 132–154 MJ/m2.yr; while, for multi-family buildings the range is 105–117 MJ/m2.yr.
5.3.3. Statistical Analysis for All Building Types
The previous results are aggregated for the three climatic areas, taking into account the building typology. The results are indicated in Table 14, for each building type. This table provides also values for high-rise buildings.
In terms of median values, taken as ‘conventional practices’, single-family houses have the higher values, followed by multi-family buildings and high-rise buildings.
For the impact category of GWP, the higher variability, given by the coefficient of variation, is for single-family houses with 57% and 49% for GWP1 and GWP2, respectively. Instead, for the impact category of primary energy, the higher variability is for multi-family buildings with 40%. In all cases, high-rise buildings have the lower variability.
5.4. Comparison with Available Benchmarks
In this section, the values provided in the previous sub-section are compared with similar values available in the literature. However, as previously mentioned, the importance of this comparison is only limited since different scopes and assumptions on the respective calculations and different data lead to different results. Therefore, the values are not easily comparable.
In the first comparison, the results of the analysis are compared with the values available in the database deQo [27]. The comparison is presented in Figure 9 for the impact category of GWP including biogenic carbon, considering only the results from Modules A1–A3, as the referred database is limited to this stage. The values provided in the previous sub-section are indicated with (1); while the values from the literature are indicated with (2). It can be noted that the values are summed up for the entire period of the analysis.
In terms of the median values, only slight variations are found, about 15% for single-family houses and multi-family houses; while for high-rise buildings, the variation is lower than 5%. In terms of the lower quartile, the values are also quite similar, except for single-family houses. However, there is huge variation in terms of the range of values for the two groups of results.
In relation to PE, the comparison is made with results from a literature review [30]. For the impact category of PE, the comparison in represented in Figure 10. In this case, total life cycle results are used in the comparison. Similarly, the values provided in the previous sub-section are indicated with (1); while the values from the literature are indicated with (2).
In this case, a higher variation is found for the median value of single family houses, about 40%; while for multi-family houses, the variation is much lower, close to 12%. Likewise, there is huge variation in terms of the range of values for the two groups of results.
6. Conclusions
The work presented in this paper is part of the research project EFIResources. Besides supporting EU policies related to resource efficiency and the circular economy, this project aims for the development of a performance-based approach for sustainable design, enabling to assess the efficient use of resources in buildings throughout the complete life cycle, and complying with the design rules and reliability provisions of the European standards for structural design, the Eurocodes.
The performance-based approach for sustainable design, in which the performance of a building is benchmarked against standard and/or best practices, requires the development of benchmarks for the environmental performance of buildings within a life-cycle perspective.
This paper focused on the development of the framework for the quantification of the benchmarks. To cope with one of the major barriers in the development of benchmarks, the difficulty in gathering the appropriate building data, the adopted model for the benchmarking of buildings is an evolving process, starting from simple data and improving the initial set of benchmarks over time.
Moreover, the review of available benchmarks in the literature for the environmental performance of buildings showed a wide diversity of values and enhanced the importance of relying on a consistent methodology for LCA to allow benchmarking. To address this question, a LCA model based on EN 15,804 and EN 15,978 was adopted to ensure comparability between different building assessments and benchmarking. In this paper, the main important features of this model were briefly introduced.
Finally, at the end of the paper, a preliminary set of benchmarks for residential buildings was provided based on the proposed model. This first set of values will enable the framework for the performance-based approach for sustainable design to be established.
Author Contributions
H.G. wrote the text. S.D. and A.P. provided discussion and many valuable comments.
Acknowledgments
Financial support of the European Union under a Marie Curie Individual Fellowship H20-20-MSCA-IF-2015 707532 is acknowledged.
Conflicts of Interest
The authors declare no conflict of interest.
References
- European Commission. COM(2011)571 Final, Communication from the Commission to the European Parliament, the Council, the European Economic and Social Committee and Committee of the Regions. In The Roadmap to a Resource Efficient Europe; EC: Brussels, Belgium, 2011. [Google Scholar]
- ECORYS. Resource Efficiency in the Building Sector, Final Report; ECORYS: Rotterdam, The Netherlands, 2014. [Google Scholar]
- European Union. Directive 2010/31/EU of the European Parliament and of the Council of 19 May 2010 on the Energy Performance of Buildings (Recast); EU: Brussels, Belgium, 2010. [Google Scholar]
- Gervásio, H.; Santos, P.; Simoes da Silva, L.; Gameiro, A. Influence of insulation on the balance between embodied energy and operational energy in light-steel residential buildings. Adv. Steel Constr. 2010, 6, 742–766. [Google Scholar]
- European Commission. Available online: http://ec.europa.eu/environment/resource_efficiency/about/about/index_en.htm (accessed on 15 December 2017).
- European Commission. COM(2015) 614 Final, Communication from the Commission to the European Parliament, the Council, The European Economic and Social Committee and the Committee of the Regions. In Closing the Loop—An EU Action Plan for the Circular Economy; EC: Brussels, Belgium, 2015. [Google Scholar]
- European Commission. H2020, EFIResources: Resource Efficient Construction towards Sustainable Design, Project ID: 707532; European Commission: Brussels, Belgium, 2016. Available online: https://cordis.europa.eu/project/rcn/205244_it.html(accessed on 22 March 2018).
- Gervasio, H. Structural eco-efficiency: Harmonizing structural and environmental assessments. Eur. J. Environ. Civ. Eng. 2017. [Google Scholar] [CrossRef]
- European Union. Regulation (EU) No 305/2011 of the European Parliament and of the Council of 9 March 2011 Laying down Harmonised Conditions for the Marketing of Construction Products and Repealing Council Directive 89/106/EEC; EU: Brussels, Belgium, 2011. [Google Scholar]
- European Commission. COM(2017) 687 Final, Report from the Commission to the European Parliament and the Council 2017, Assessment of the Progress Made by Member States towards the National Energy Efficiency Targets for 2020 and towards the Implementation of the Energy Efficiency Directive as Required by Article 24(3) of the Energy Efficiency Directive 2012/27/EU; EC: Brussels, Belgium, 2017. [Google Scholar]
- Hart, Z. The Benefits of Benchmarking Building Performance; Building Performance Policy; Institute for Market Transformation (IMT): Washington, DC, USA, Pacific Coast Collaborative; 2015. [Google Scholar]
- LEED, Homepage of LEED. Available online: http://www.leedonline.com (accessed on 30 March 2018).
- BREEAM, Homepages of BREEAM. Available online: http://www.breeam.org (accessed on 30 March 2018).
- HQE, Homepage of HQE. Available online: http://www.behqe.com (accessed on 30 March 2018).
- SBTool, Homepage of SBTool. Available online: http://www.iisbe.org/sbmethod (accessed on 30 March 2018).
- DGNB, Homepage of DGNB. Available online: http://www.dgnb.de/en/ (accessed on 30 March 2018).
- Gervasio, H.; Dimova, S. Model for Life Cycle Assessment (LCA) of Buildings; EUR 29123 EN; Publications Office of the European Union: Brussels, Belgium, 2018; ISBN 978-92-79-79974-7. [Google Scholar] [CrossRef]
- Nibel, S.; Chevalier, J.; Lebert, A. Conclusions about the Needs of Development of Performance Levels and Benchmark Criteria and Weighting Methods; Deliverable 2.2, SuPerBuildings Project, 7th Framework Program; EC: Brussels, Belgium, 2010. [Google Scholar]
- Lorch, R. Climate policies for buildings. Build. Res. Inf. 2017, 45, 475–477. [Google Scholar] [CrossRef]
- Peng, B.; Lin, B.; Zhu, Y. Life cycle energy consumption and CO2 emissions of buildings: An overview and case studies in Beijing. In Proceedings of the SB11 Helsinki World Sustainable Building Conference Proceedings, Helsinki, Finland, 18–21 October 2011; Theme 1 World Resources. Finnish Association of Civil Engineers: Helsinki, Finland, 2011; pp. 154–163. [Google Scholar]
- Moschetti, R.; Mazzarella, L.; Nord, N. An overall methodology to define reference values for building sustainability parameters. Energy Build. 2015, 88, 413–427. [Google Scholar] [CrossRef]
- König, H.; De Cristofaro, M. Benchmarks for life cycle costs and life cycle assessment of residential buildings. Build. Res. Inf. 2012, 40, 558–580. [Google Scholar] [CrossRef]
- Centre Scientifique et Technique du Batiment (CSTB). Capitalisation des Résultats de l’Expérimentation HQE Performance; Rapport Intermédiaire, DEE/EICV-14.027, 235 Pages + 2 ANNEXES; CSTB: Champs-sur-Marne, France, 2013. (In French) [Google Scholar]
- Sartori, I.; Hestnes, A. Energy use in the life cycle of conventional and low-energy buildings: A review article. Energy Build. 2007, 39, 249–257. [Google Scholar] [CrossRef]
- International Energy Agency. Evaluation of Embodied Energy and CO2 eq. for Building Construction (Annex 57)—Subtask 4: Case Studies and Recommendations for the Reduction of Embodied Energy and Embodied Greenhouse Gas Emissions from Buildings; Institute for Building Environment and Energy Conservation: Tokyo, Japan, 2016; ISBN 978-4-909107-08-4. [Google Scholar]
- International Energy Agency. Evaluation of Embodied Energy and CO2 eq. for Building Construction (Annex 57)—Case Studies Demonstrating Embodied Energy and Embodied Greenhouse Gas Emissions in Buildings; Institute for Building Environment and Energy Conservation: Tokyo, Japan, 2016; ISBN 978-4-909107-08-4. [Google Scholar]
- Kaethner, S.; Burridge, J. Embodied CO2 of structural frames. Struct. Eng. 2012, 90, 33–40. [Google Scholar]
- Kim, S.; Moon, J.-H.; Shin, Y.; Kim, G.-H.; Seo, D.-S. Life Comparative Analysis of Energy Consumption and CO2 Emissions of Different Building Structural Frame Types. Sci. World J. 2013, 2013, 175702. [Google Scholar] [CrossRef] [PubMed]
- Dimoudi, A.; Tompa, C. Energy and environmental indicators related to construction of office buildings. Resour. Conserv. Recycl. 2008, 53, 86–95. [Google Scholar] [CrossRef]
- Ji, C.; Hong, T.; Park, H. Comparative analysis of decision-making methods for integrating cost and CO2 emission—Focus on building structural design. Energy Build. 2014, 72, 186–194. [Google Scholar] [CrossRef]
- deQo—database of embodied Quantity outputs. Available online: https://www.carbondeqo.com/database/graph (accessed on 15 December 2017).
- Holopainen, R.; Vares, S.; Ritola, J.; Pulakka, S. Maalämmön ja Viilennyksen Hyödyntäminen Asuinkerrostalon lämmityksessä ja Jäähdytyksessä; VTT Tiedotteita—Research Notes 2546; Technical Research Centre of Finland: Espoo, Finland, 2010. (In Finnish) [Google Scholar]
- Kang, G.; Kim, T.; Kim, Y.-W.; Cho, H.; Kang, K.-I. Statistical analysis of embodied carbon emission for building construction. Energy Build. 2015, 101, 326–333. [Google Scholar] [CrossRef]
- Ramesh, T.; Prakash, R.; Shukla, K. Life cycle energy analysis of buildings: An overview. Energy Build. 2010, 42, 1592–1600. [Google Scholar] [CrossRef]
- Yokoo, N.; Ito, N.; Oka, T. Embodied energy and embodied CO2 associated with buildings based on detail analysis and simple analysis. In Proceedings of the SB14 World, Barcelona, Spain, 28–30 October 2014. [Google Scholar]
- Nadoushani, Z.; Akbarnezhad, A. Effects of structural system on the life cycle carbon footprint of buildings. Energy Build. 2015, 102, 337–346. [Google Scholar] [CrossRef]
- Li, S. Embodied Environmental burdens of wood structure in Taiwan compared with reinforced concrete and steel structures with various recovery rates. Appl. Mech. Mater. 2012, 174–177, 202–210. [Google Scholar] [CrossRef]
- Shang, C.; Chu, C.; Zhang, Z. Quantitative Assessment on Carbon Emission of Different Structures in Building Life Cycle. Build. Sci. 2012, 27, 66–70. [Google Scholar]
- Canadian Wood Council (CWC). IBS4—Sustainability and Life Cycle Analysis for Residential Buildings [EB/OL]; CWC: Ottawa, ON, Canada, 2003; Available online: http://cwc.ca/wp-content/uploads/publications-IBS4_Sustainability_SMC_v2.pdf (accessed on 21 September 2017).
- Junnila, S.; Horvath, A. Environmental Sensitivity Analysis of the Life-cycle of an Office Building. In Proceedings of the Integrated Lifetime Engineering of Buildings and Civil Infrastructures (ILCDES 2003), Kuopio, Finland, 1–3 December 2003; Sarja, A., Ed.; 2003; pp. 1001–1006. [Google Scholar]
- Thinkstep, A.G. Leinfelden-Echterdingen GaBi Software-System and Databse for Life Cycle Engineering 1992–2017 (Version 8.1.0.29); Thinkstep Global: Leinfelden-Echterdingen, Germany, 2017. [Google Scholar]
- SteelConstruction. Info. End of Life LCA and Embodied Carbon Data for Common Framing Materials; SteelConstruction.Info: London, UK, 2017; Available online: https://www.steelconstruction.info/images/d/d6/C40_CEM_I.pdf (accessed on 15 December 2017).
- IBU, Institut Bauen und Umwelt e. V. Available online: http://ibu-epd.com/ (accessed on 13 December 2017).
- Erlandsson, M.; Zetterberg, L. Accounting of Biogenic Carbon in Attributional LCA—Including Temporary Storage; IVL Swedish Environmental Research Institute Ltd.: Stockholm, Sweden, 2017. [Google Scholar]
- European Committee for Standardization. EN 16449:2014, Wood and Wood-Based Products—Calculation of the Biogenic Carbon Content of Wood and Conversion to Carbon Dioxide; CEN: Brussels, Belgium, 2014. [Google Scholar]
- Bosteels, T.; Tipping, N.; Botten, C.; Tippet, M. Sustainability Benchmarking Toolkit for Commercial Buildings, Principles for Best Practice; The Building Centre: London, UK, 2010. [Google Scholar]
- Gervasio, H.; Dimova, S. Environmental Benchmarks for Buildings; EUR 29145 EN; Publications Office of the European Union: Brussels, Belgium, 2018; ISBN 978-92-79-80969-9. [Google Scholar] [CrossRef]
- European Platform for Life Cycle Assessment. Available online: http://eplca.jrc.ec.europa.eu/ResourceDirectory/faces/databases/databaseList.xhtml (accessed on 27 July 2017).
- International Organization for Standardization. ISO 14025:2006, Environmental Labels and Declarations—Type III Environmental Declarations—Principles and Procedures; International Organization for Standardization: Geneva, Switzerland, 2006. [Google Scholar]
- European Committee for Standardization. EN 15804:2012 + A1:2013, Sustainability of Construction Works—Environmental Product Declarations—Core Rules for the Product Category of Construction Products; CEN: Brussels, Belgium, 2013. [Google Scholar]
- European Committee for Standardization. EN 15978:2011, Sustainability of Construction Works—Assessment of Environmental Performance of Buildings—Calculation Method; CEN: Brussels, Belgium, 2011. [Google Scholar]
- Hernandez, P.; Bosdevigie, B. Benchmarking Criteria for Sustainable Buildings in Europe; Deliverable 5.2, SuPerBuildings Project, 7th Framework Program; EC: Brussels, Belgium, 2012. [Google Scholar]
- Castro, M.; Mateus, R.; Serodio, F.; Braganca, L. Development of benchmarks for operating costs and resources consumption to be used in healthcare building sustainability assessment methods. Sustainability 2015, 7, 13222–13248. [Google Scholar] [CrossRef] [Green Version]
- European Committee for Standardization. EN 1998-1:2005, Eurocode 8: Design of Structures for Earthquake Resistance. Part 1: General Rules; Seismic Actions and Rules for Buildings; CEN: Brussels, Belgium, 2005. [Google Scholar]
- Li, G.; Jin, H.; Wang, H. Enhancing performance of buildings in seismic zone with structural metal dampers. In Proceedings of the Second International Conference on Performance-based and Life-cycle Structural Engineering (PLSE 2015), Brisbane, Australia, 9–11 December 2015; pp. 69–78. [Google Scholar]
- Global Seismic Hazard Assessment Program. Available online: http://www.seismo.ethz.ch/static/GSHAP/index.html (accessed on 14 December 2017).
- Peel, C.; Finlayson, B.; McMahon, T. Updated world map of the Köppen-Geiger climate classification. Hydrol. Earth Syst. Sci. 2007, 11, 1633–1644. [Google Scholar] [CrossRef]
- Santos, P.; Simoes da Silva, L.; Ungureanu, V. Energy Efficiency of Light-Weight Steel-Framed Buildings, 1st ed.; Technical Committee 14—Sustainability & Eco-Efficiency of Steel Construction; ECCS: Brussels, Belgium, 2012. [Google Scholar]
- European Committee for Standardization. EN 1990:2002 + A1:2005, Eurocode: Basis of Structural Design; CEN: Brussels, Belgium, 2005. [Google Scholar]
- International Organization for Standardization. ISO 14044:2006, Environmental Management—Life Cycle Assessment—Requirements and Guidelines; International Organization for Standardization: Geneva, Switzerland, 2006. [Google Scholar]
- Guinée, J.B.; Gorrée, M.; Heijungs, R.; Huppes, G.; Kleijn, R.; Koning, A.D.; Oers, L.; Wegener Sleeswijk, A.; Suh, S.; Udo de Haes, H.A.; et al. Handbook On life Cycle Assessment: Operational Guide to the ISO Standards. I: LCA in Perspective. IIa: Guide. IIb: Operational Annex. III: Scientific Background; Kluwer Academic Publishers: Dordrecht, The Netherlands, 2002; ISBN 1-4020-0228-9. [Google Scholar]
- CML-IA Characterisation Factors. Available online: www.universiteitleiden.nl/en/research/research-output/science/cml-ia-characterisation-factors (accessed on 21 September 2017).
- Van Oers, L.; Guinee, J. The Abiotic Depletion Potential: Background, updates, and future. Resources 2016, 5, 16. [Google Scholar] [CrossRef]
- Van Oers, L.; Koning, A.; Guinee, J.; Huppes, G. Abiotic Resource Depletion in LCA, Improving Characterization Factors for Abiotic Resource Depletion as Recommended in the New Dutch LCA Handbook; Road and Hidraulic Engineering Institute: Amsterdam, The Netherlands, 2002. [Google Scholar]
- European Commission, JRC, Institute for Environment and Sustainability. International Reference Life Cycle Data System (ILCD) Handbook; Recommendations for Life Cycle Impact Assessment in the European Context—Based on Existing Environmental Impact Assessment Models and Factors, EUR 24571EN-2011; European Commission, JRC, Institute for Environment and Sustainability: Brussels, Belgium, 2011. [Google Scholar]
- European Commission. Commission Recommendation of 9 April 2013 on the Use of Common Methods to Measure and Communicate the Life Cycle Environmental Performance of Products and Organizations. Off. J. Eur. Union 2003, L124, 216. [Google Scholar]
- Sjunnesson, J. Life Cycle Assessment of Concrete. Master’s Thesis, University of Lund, Lund, Sweden, 2005. [Google Scholar]
- Arnold, A. Development of a Method for Recording Energy Costs and Uses during the Construction Process. Ph.D. Thesis, University of Texas A&M, College Station, TX, USA, 2008. [Google Scholar]
- Athena Sustainable Materials Institute. Demolition Energy Analysis of Office Building Systems; Athena Sustainable Materials Institute: Ottawa, ON, USA, 1997. [Google Scholar]
- European Cement Research Academy (ECRA). Closing the Loop: What Type of Concrete Re-Use is the Most Sustainable Option? Technical Report A-2015/1860; European Cement Research Academy: Düsseldorf, Germany, 2015. [Google Scholar]
- Werner, F. Treatment of Aluminium Recycling in LCA—Development and evaluation of the Value-Corrected Substitution Procedure Applied to Window Frames, Research and Work Report 115/47; Swiss Federal Laboratories for Materials Testing and Research (EMPA): Dubendorf, Switzerland, 2002. [Google Scholar]
- Koffler, C.; Florin, J. Tackling the downcycling Issue—A Revised Approach to Value-Corrected Substitution in Life Cycle Assesment of Aluminum (VCS 2.0). Sustainability 2013, 5, 4546–4560. [Google Scholar] [CrossRef]
- Design for Adaptability in Steel, Steel-Reuse Information Paper No. 1. Available online: www.reuse-steel.org (accessed on 17 May 2017).
- Hauke, B.; Kuhnhenne, M.; Lawson, R.M.; Veljkovic, M. Sustainable Steel Buildings: A Practical Guide for Structures and Envelopes; Hauke, B., Kuhnhenne, M., Lawson, M., Veljkovic, M., Eds.; Wiley: London, UK, 2016. [Google Scholar]
- Steel Component Design for Deconstruction, Steel-Reuse Information Paper No. 2. Available online: www.reuse-steel.org (accessed on 17 May 2017).
- Nemry, F.; Uihlein, A.; Colodel, C.; Wittstock, B.; Braune, A.; Wetzel, C.; Hasan, I.; Niemeier, S.; Frech, Y.; Kreißig, J.; et al. Environmental Improvement Potentials of Residential Buildings (IMPRO-Building), EUR 23493 EN; Office for Official Publications of the European Communities: Brussels, Belgium, 2008. [Google Scholar] [CrossRef]
Figure 1.
Probability density functions of the design environmental performance and of the reference environmental performance [8].
Figure 1.
Probability density functions of the design environmental performance and of the reference environmental performance [8].

Figure 2.
Graduated approach for benchmarking of buildings (based on [46]).
Figure 2.
Graduated approach for benchmarking of buildings (based on [46]).

Figure 3.
‘Conventional’ and ‘best’ values.

Figure 4.
(a) European seismic hazard map: peak ground acceleration (PGA) (with a period of return of 475 years) [56]; (b) Köppen–Geiger climate classification [57].

Figure 5.
Mean values of embodied and operational GWP (in kg CO2 eq./m2.yr), for all buildings, in the three climatic areas.
Figure 5.
Mean values of embodied and operational GWP (in kg CO2 eq./m2.yr), for all buildings, in the three climatic areas.

Figure 6.
GWP1 (kg CO2 eq./m2.yr) for single family houses (SI) and multi-family buildings (MF).

Figure 7.
GWP2 (kg CO2 eq./m2.yr) for single family houses (SI) and multi-family buildings (MF).

Figure 8.
PE (MJ/m2.yr) for single family houses (SI) and multi-family buildings (MF).

Figure 9.
Comparison of benchmarks for GWP (kg CO2 eq./m2).

Figure 10.
Comparison of benchmarks for PE (MJ/m2.yr).


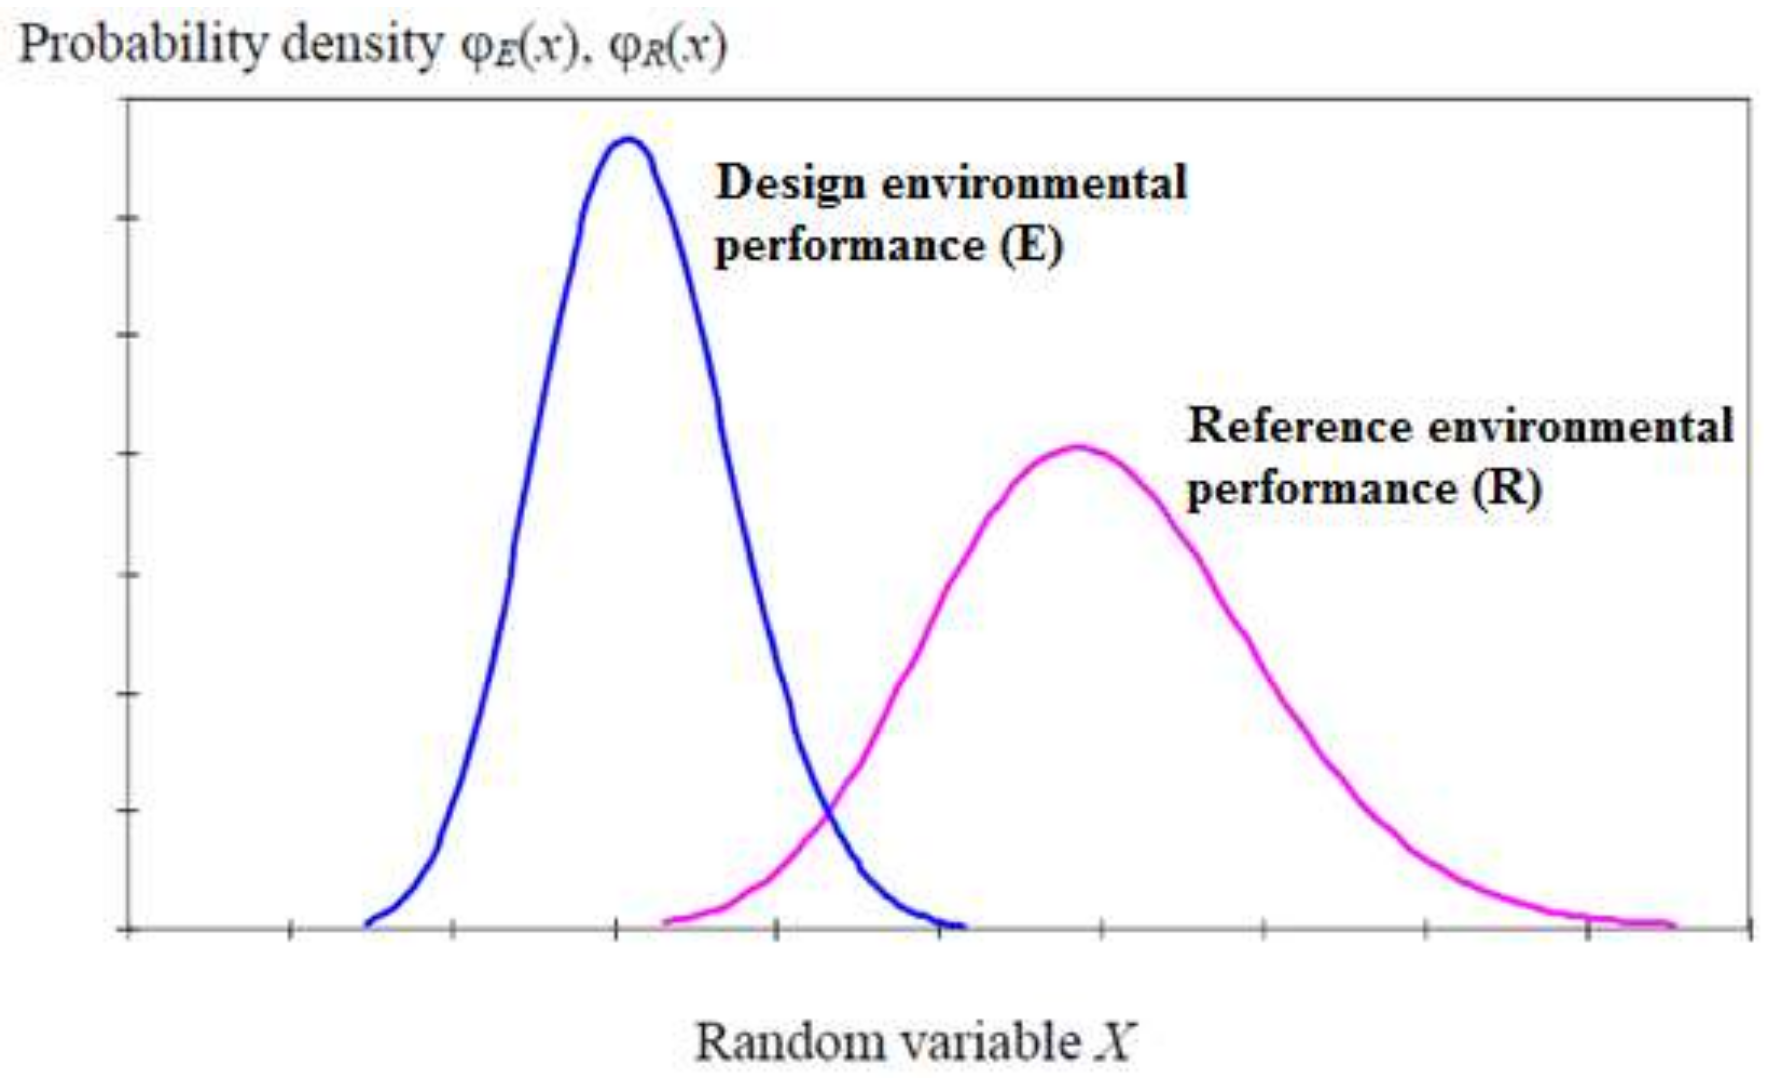
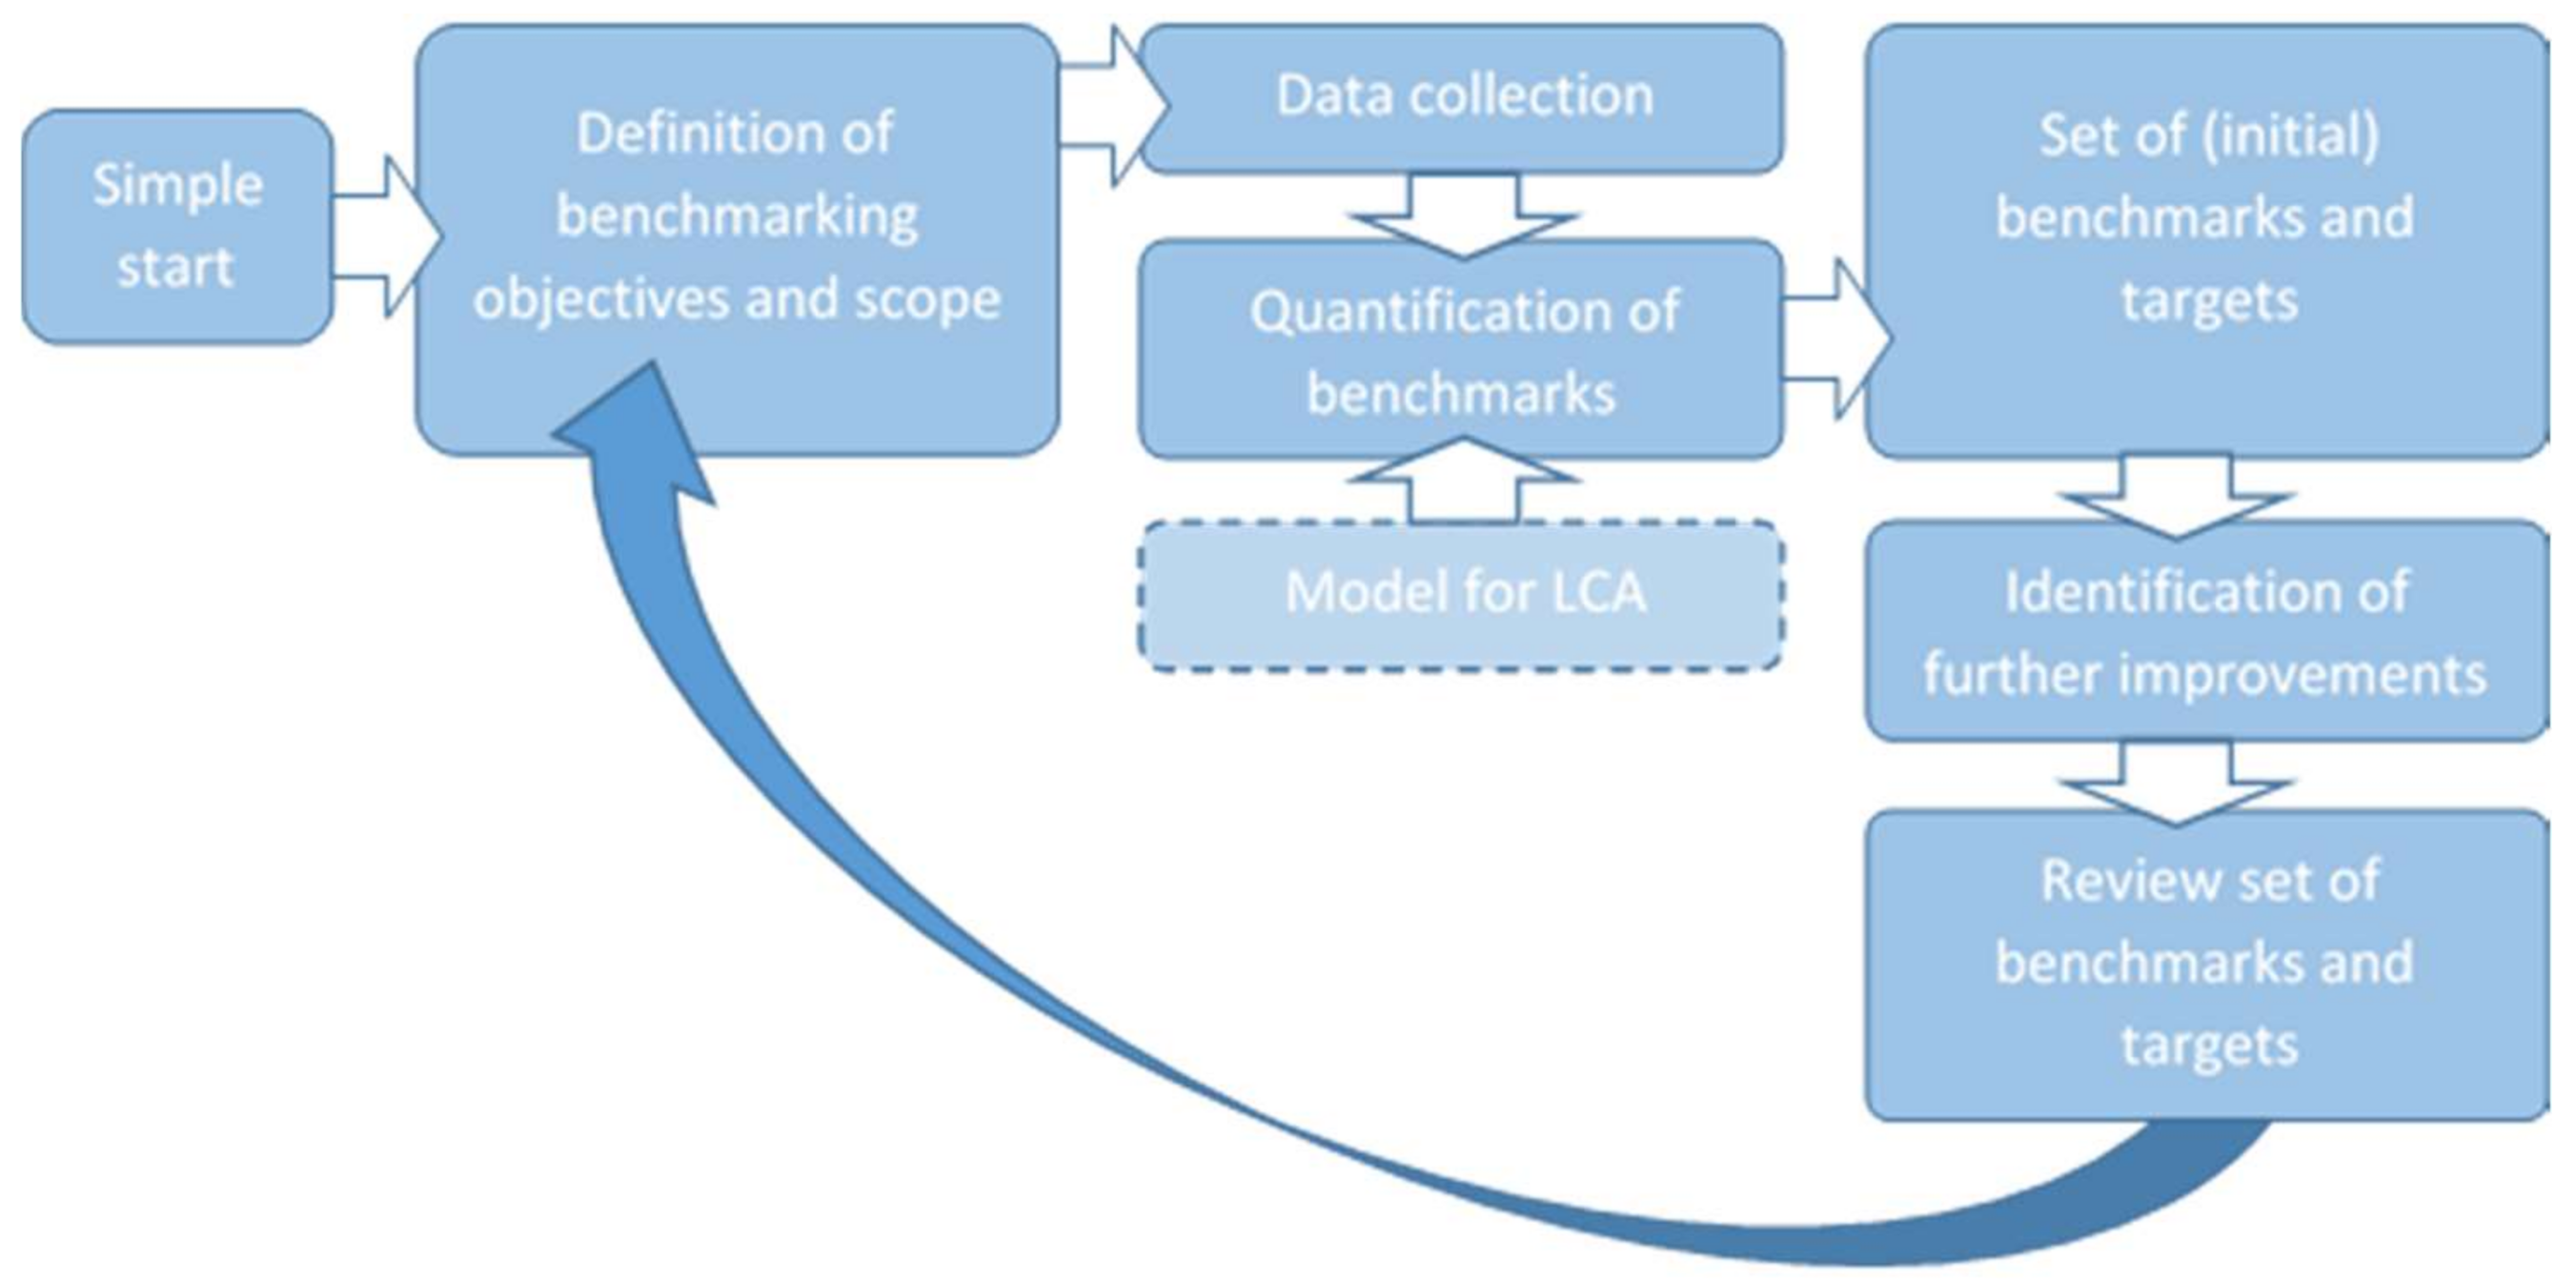
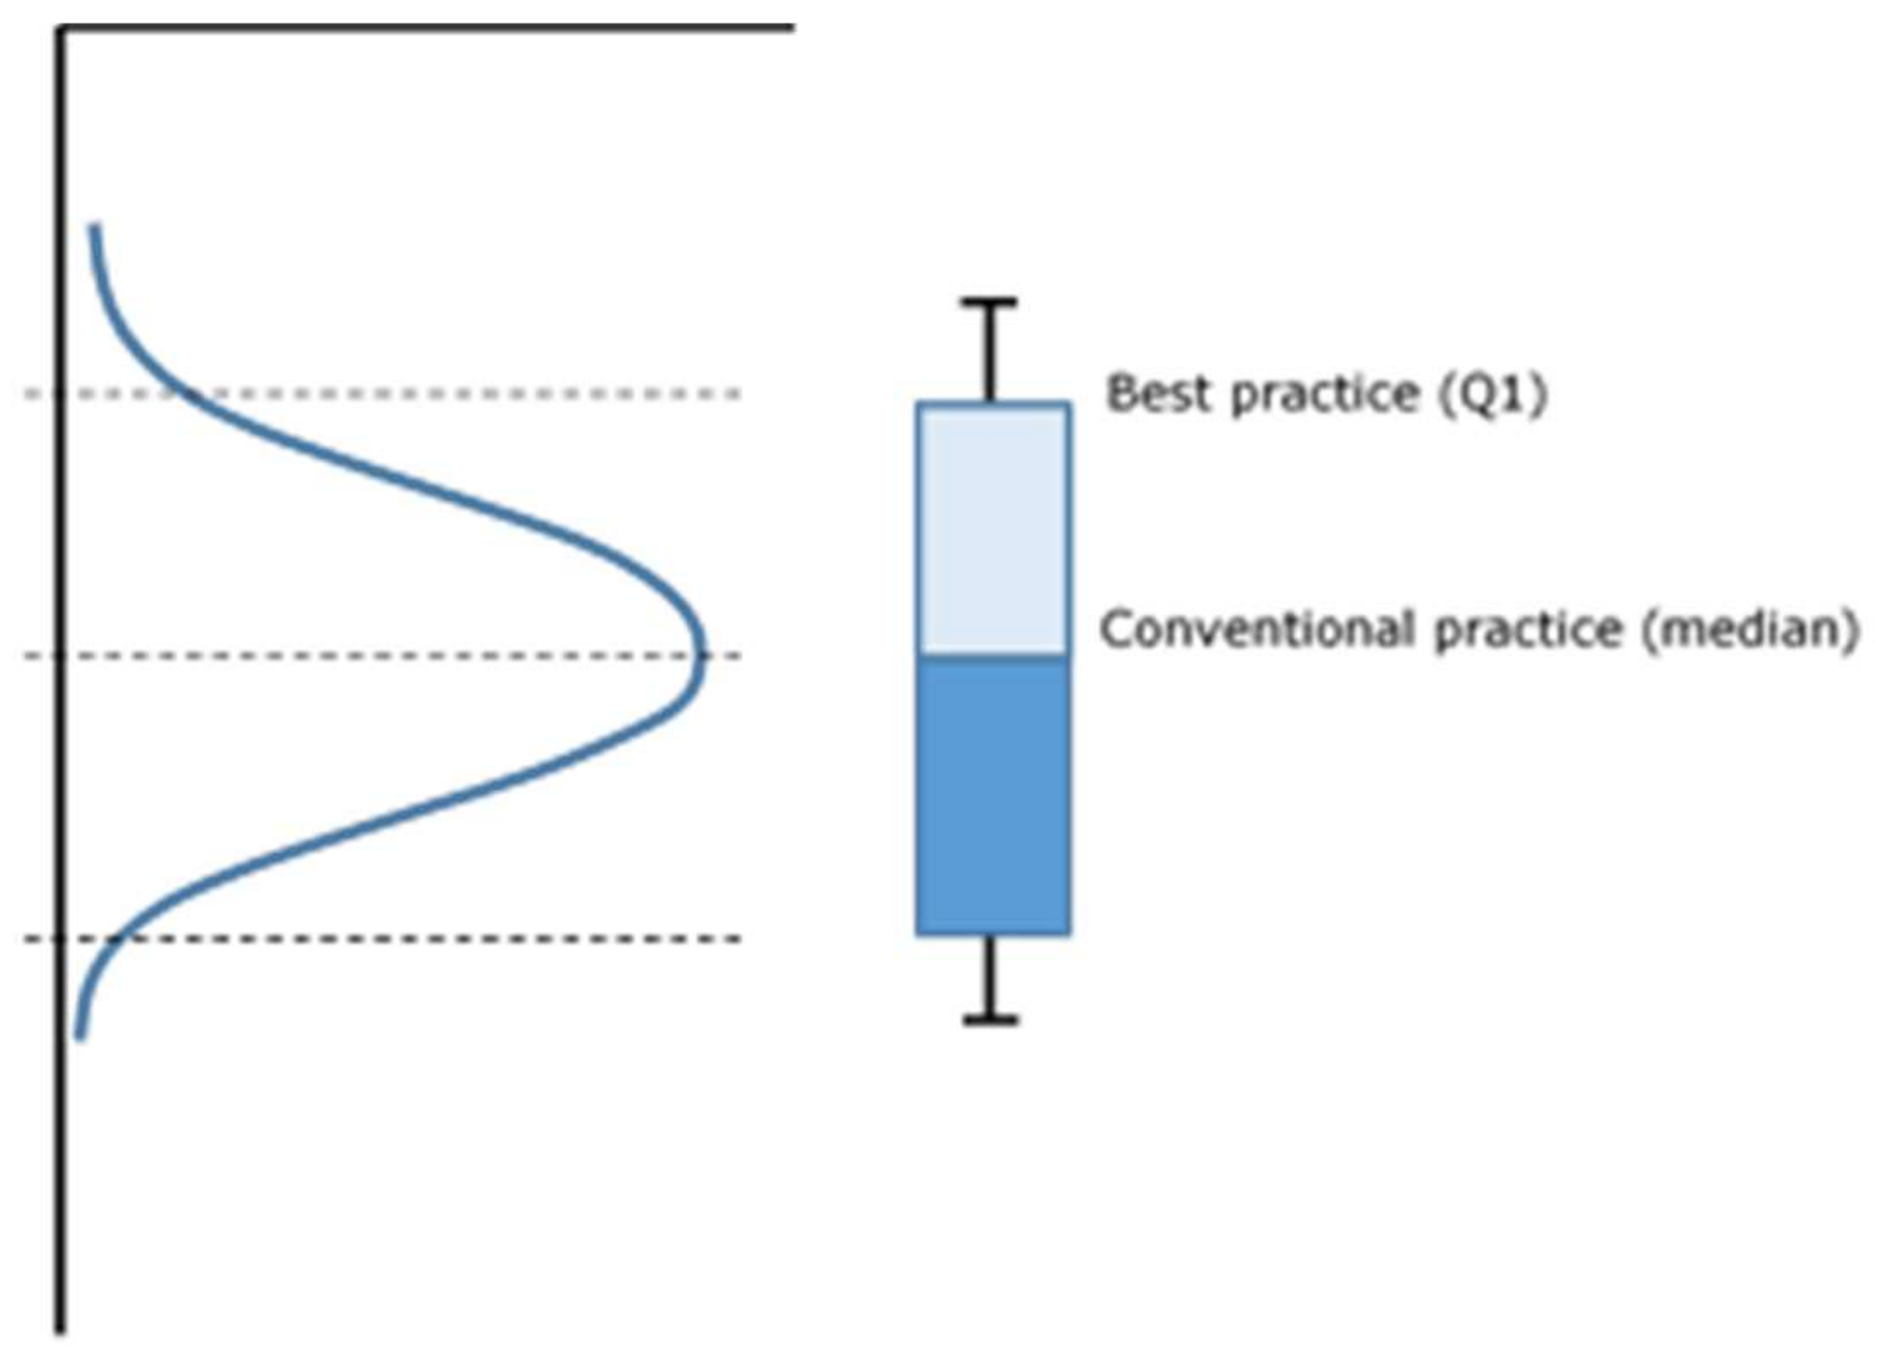
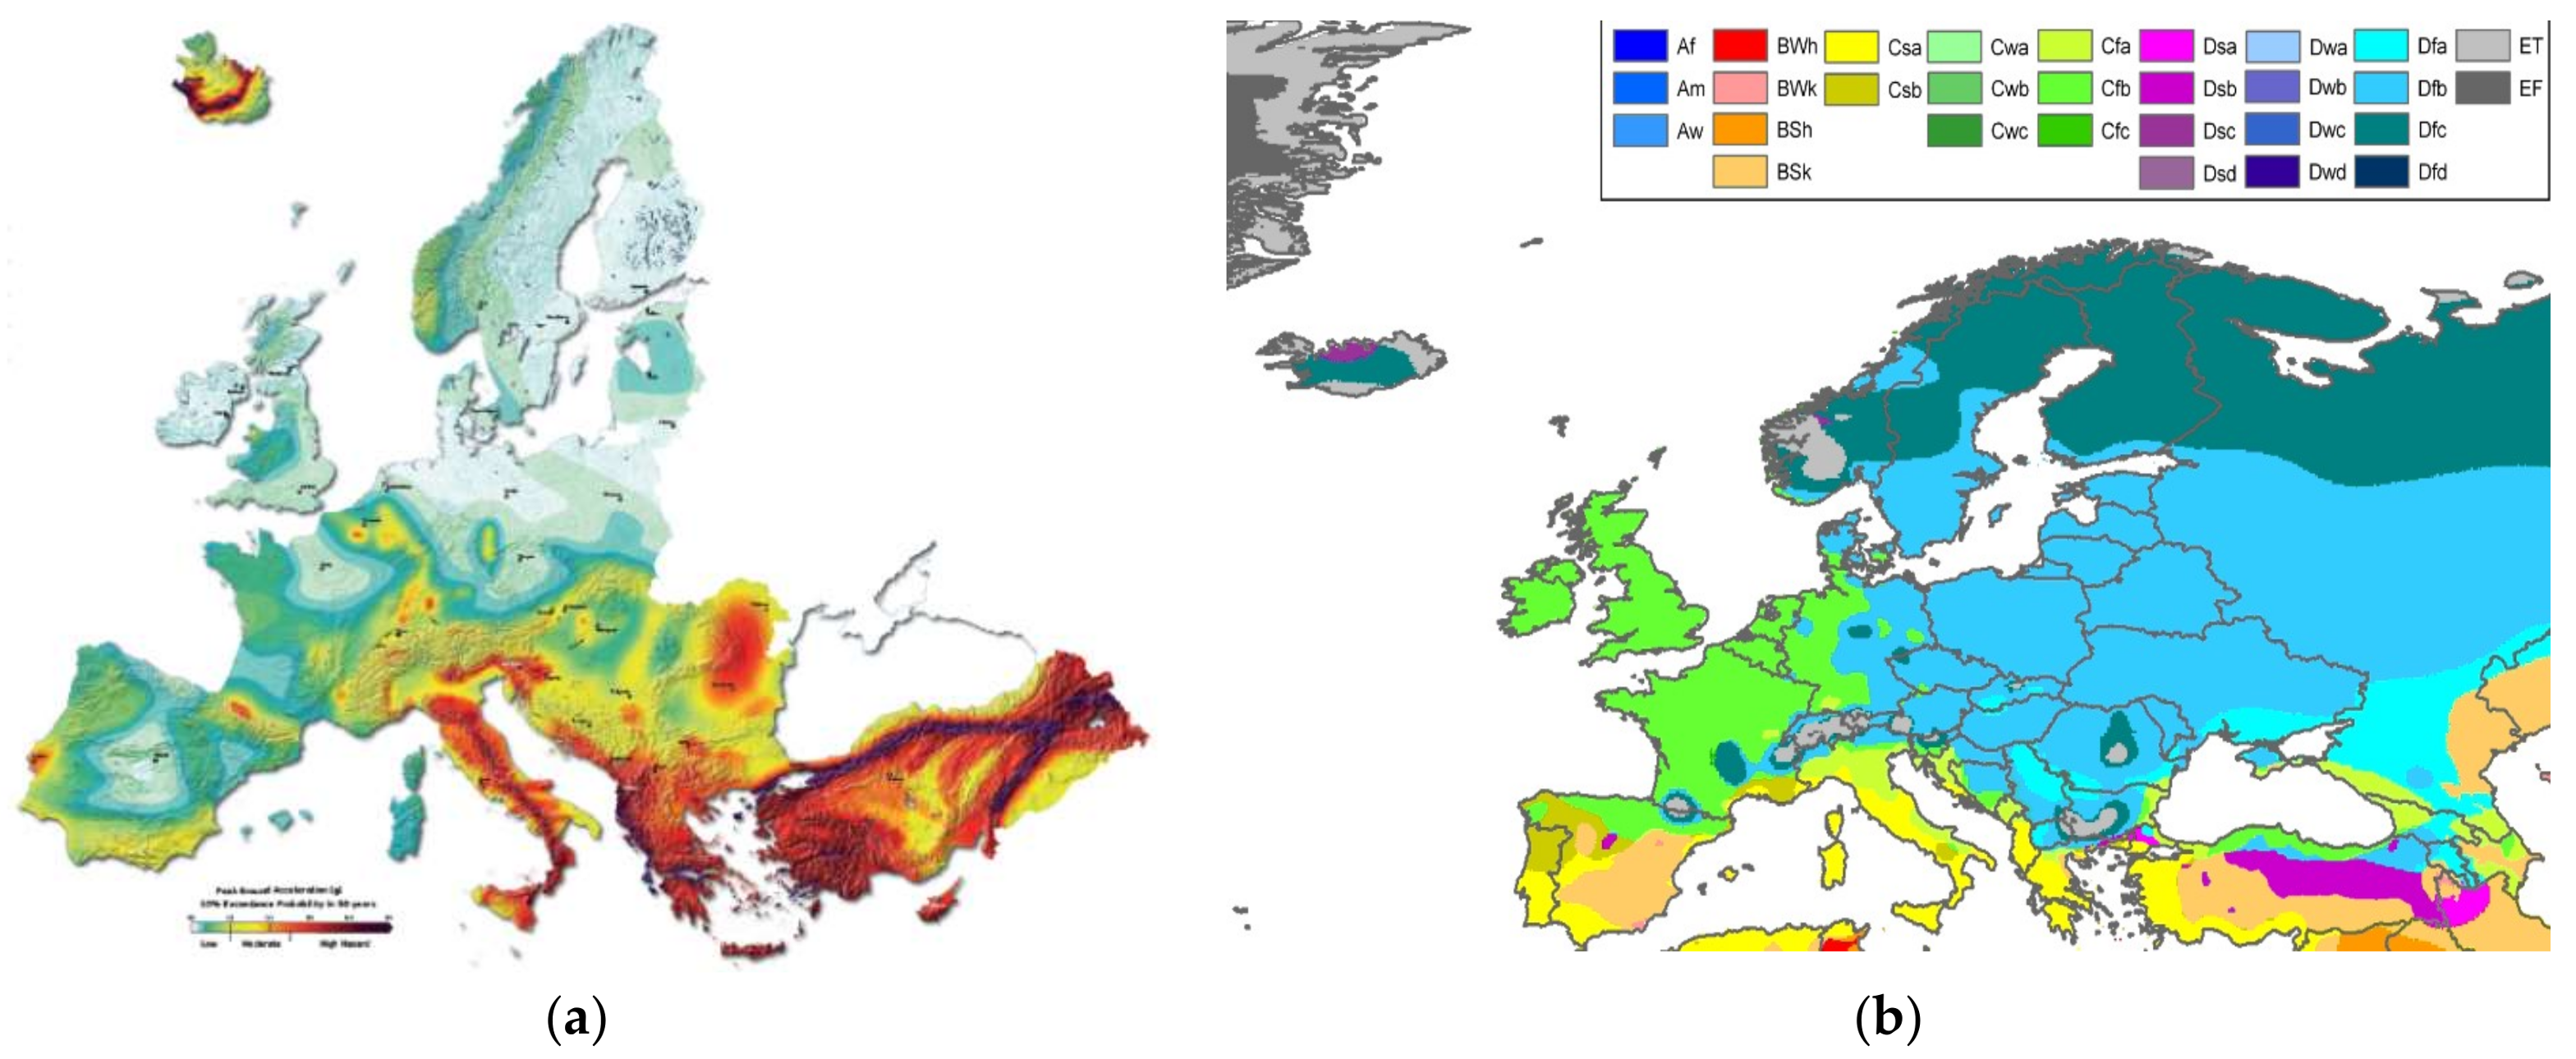
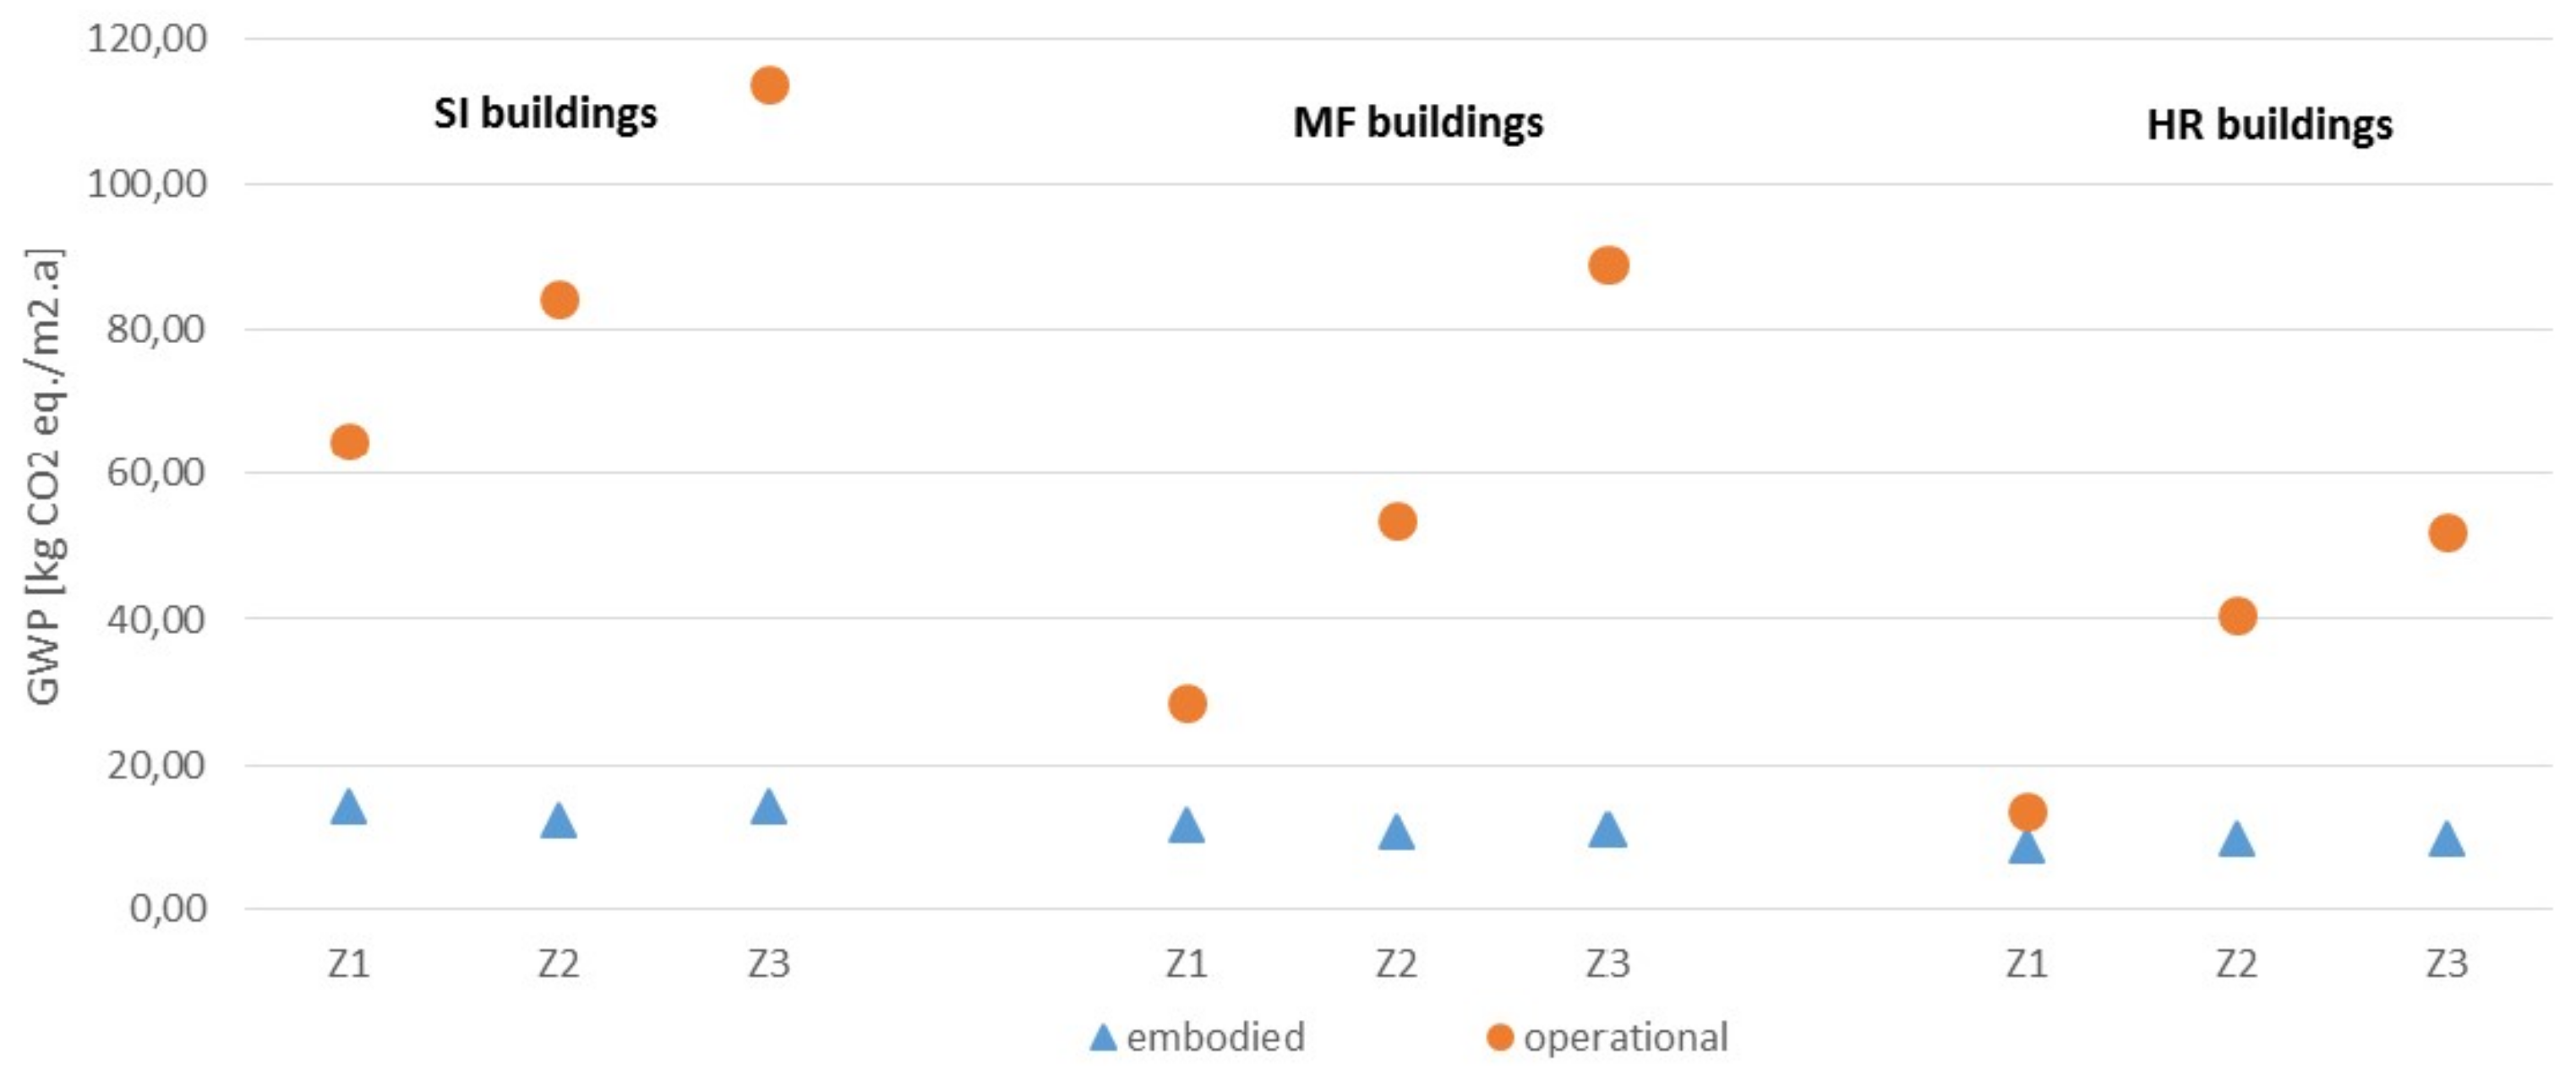
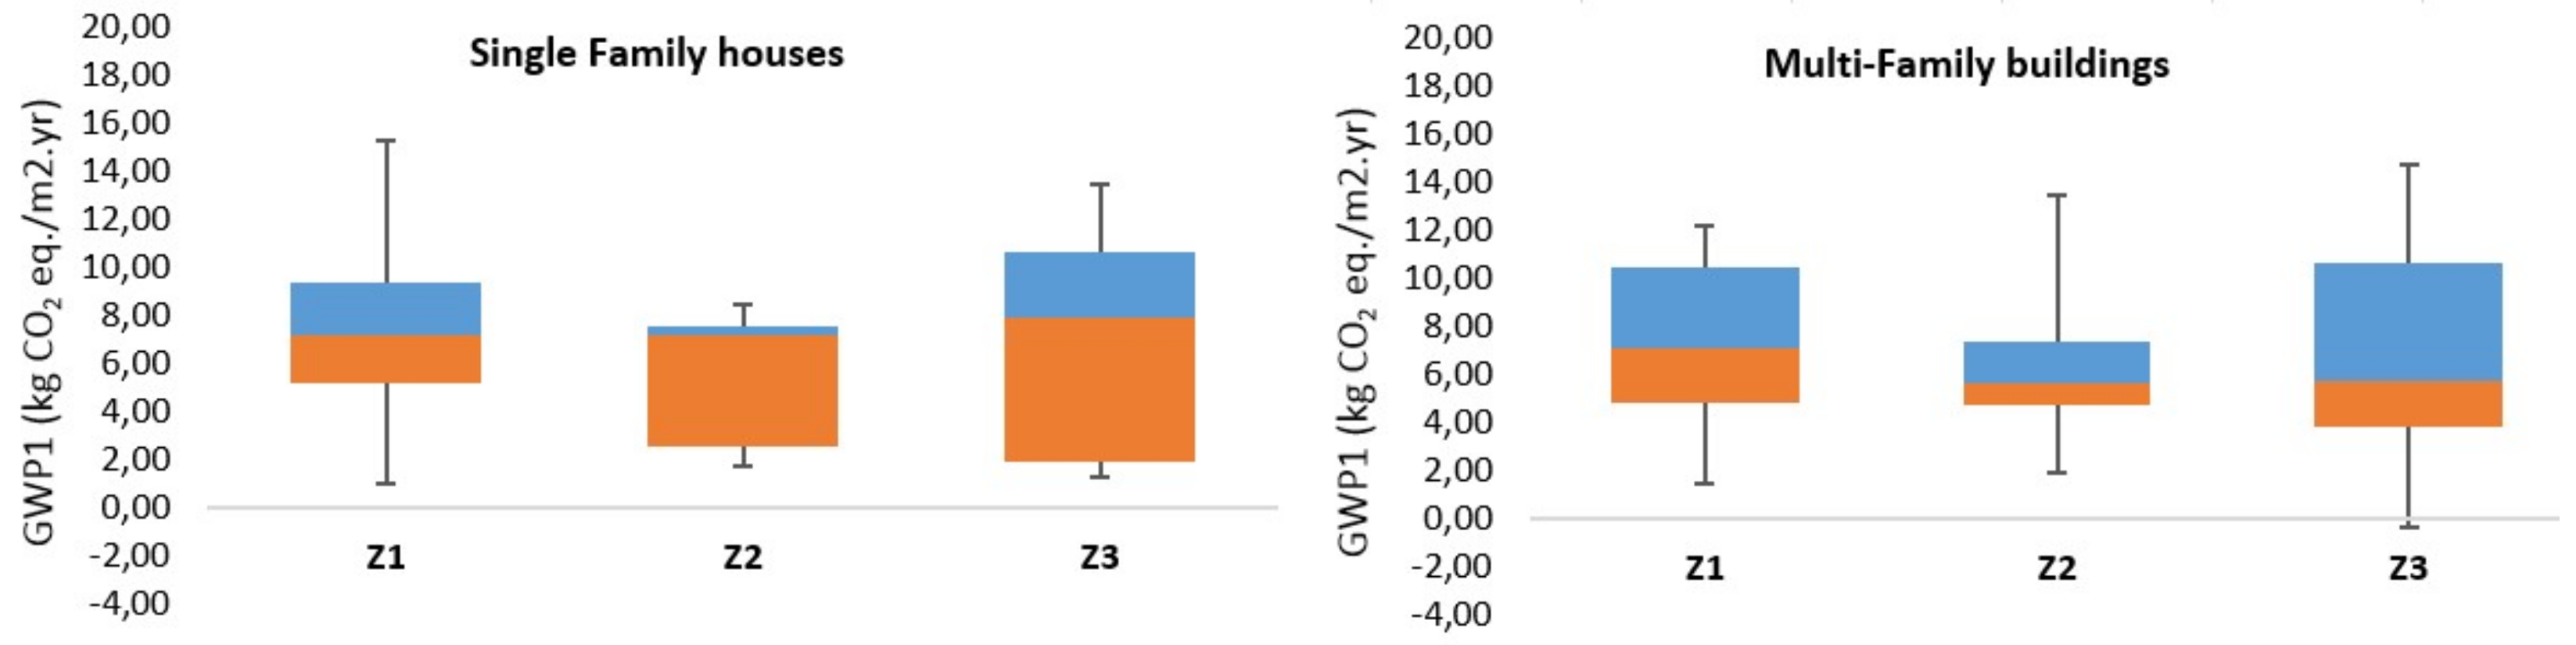
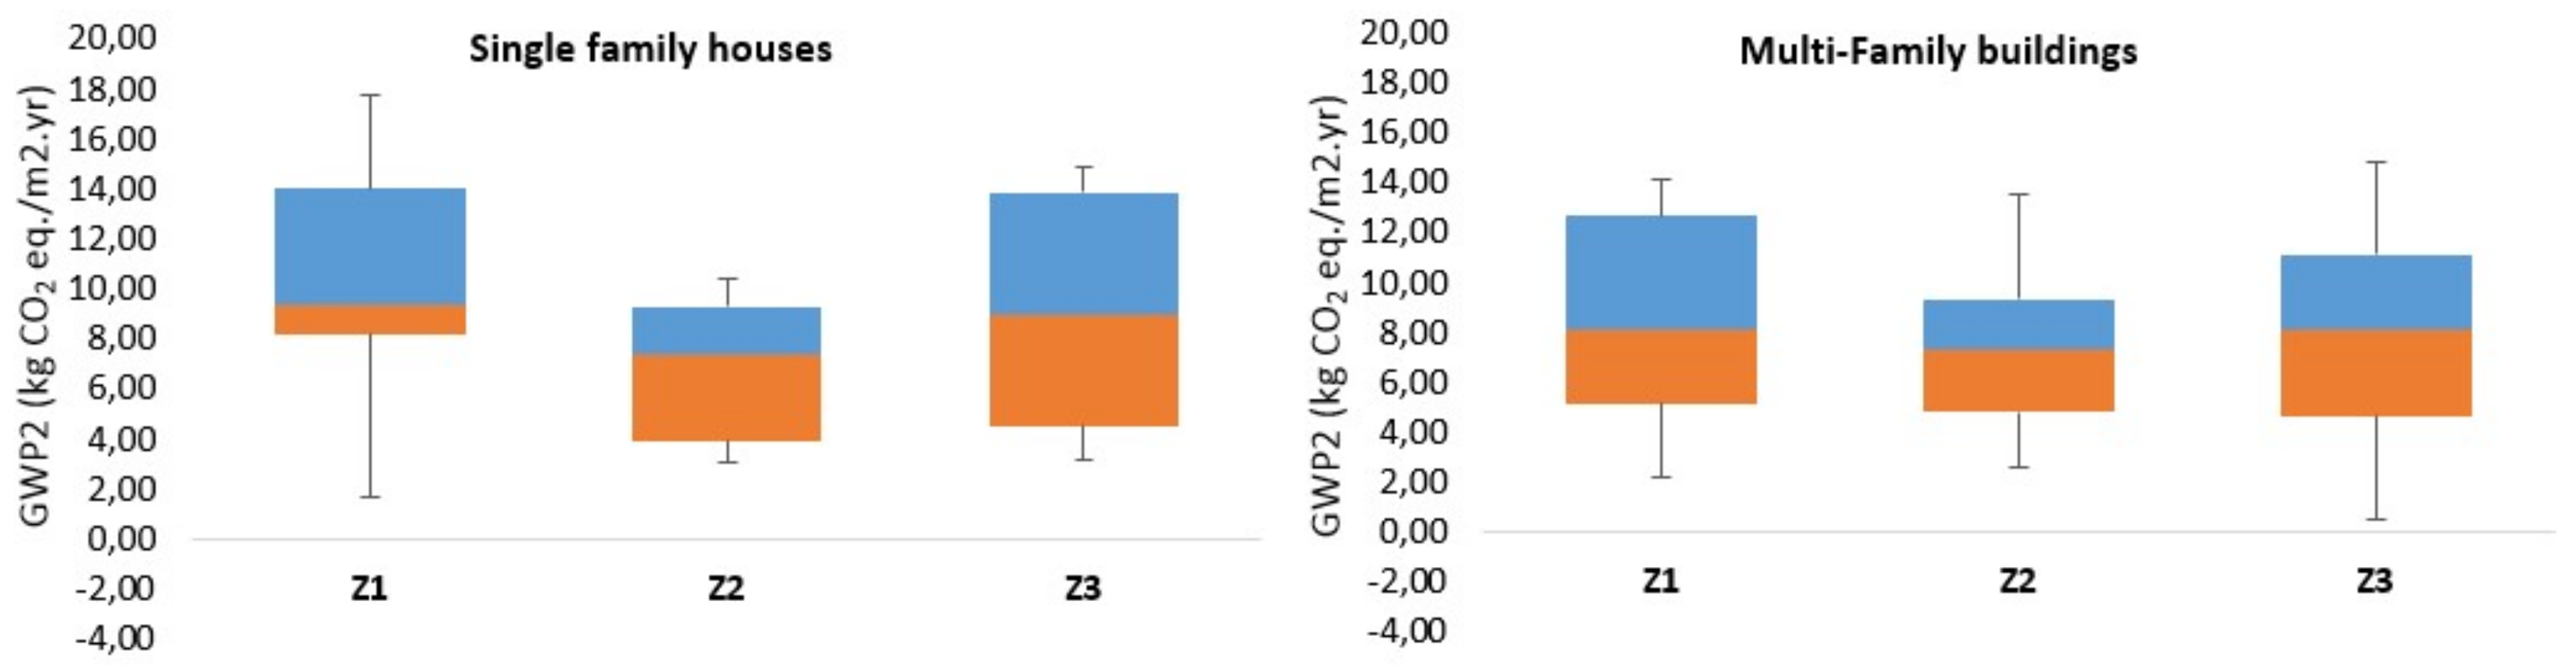
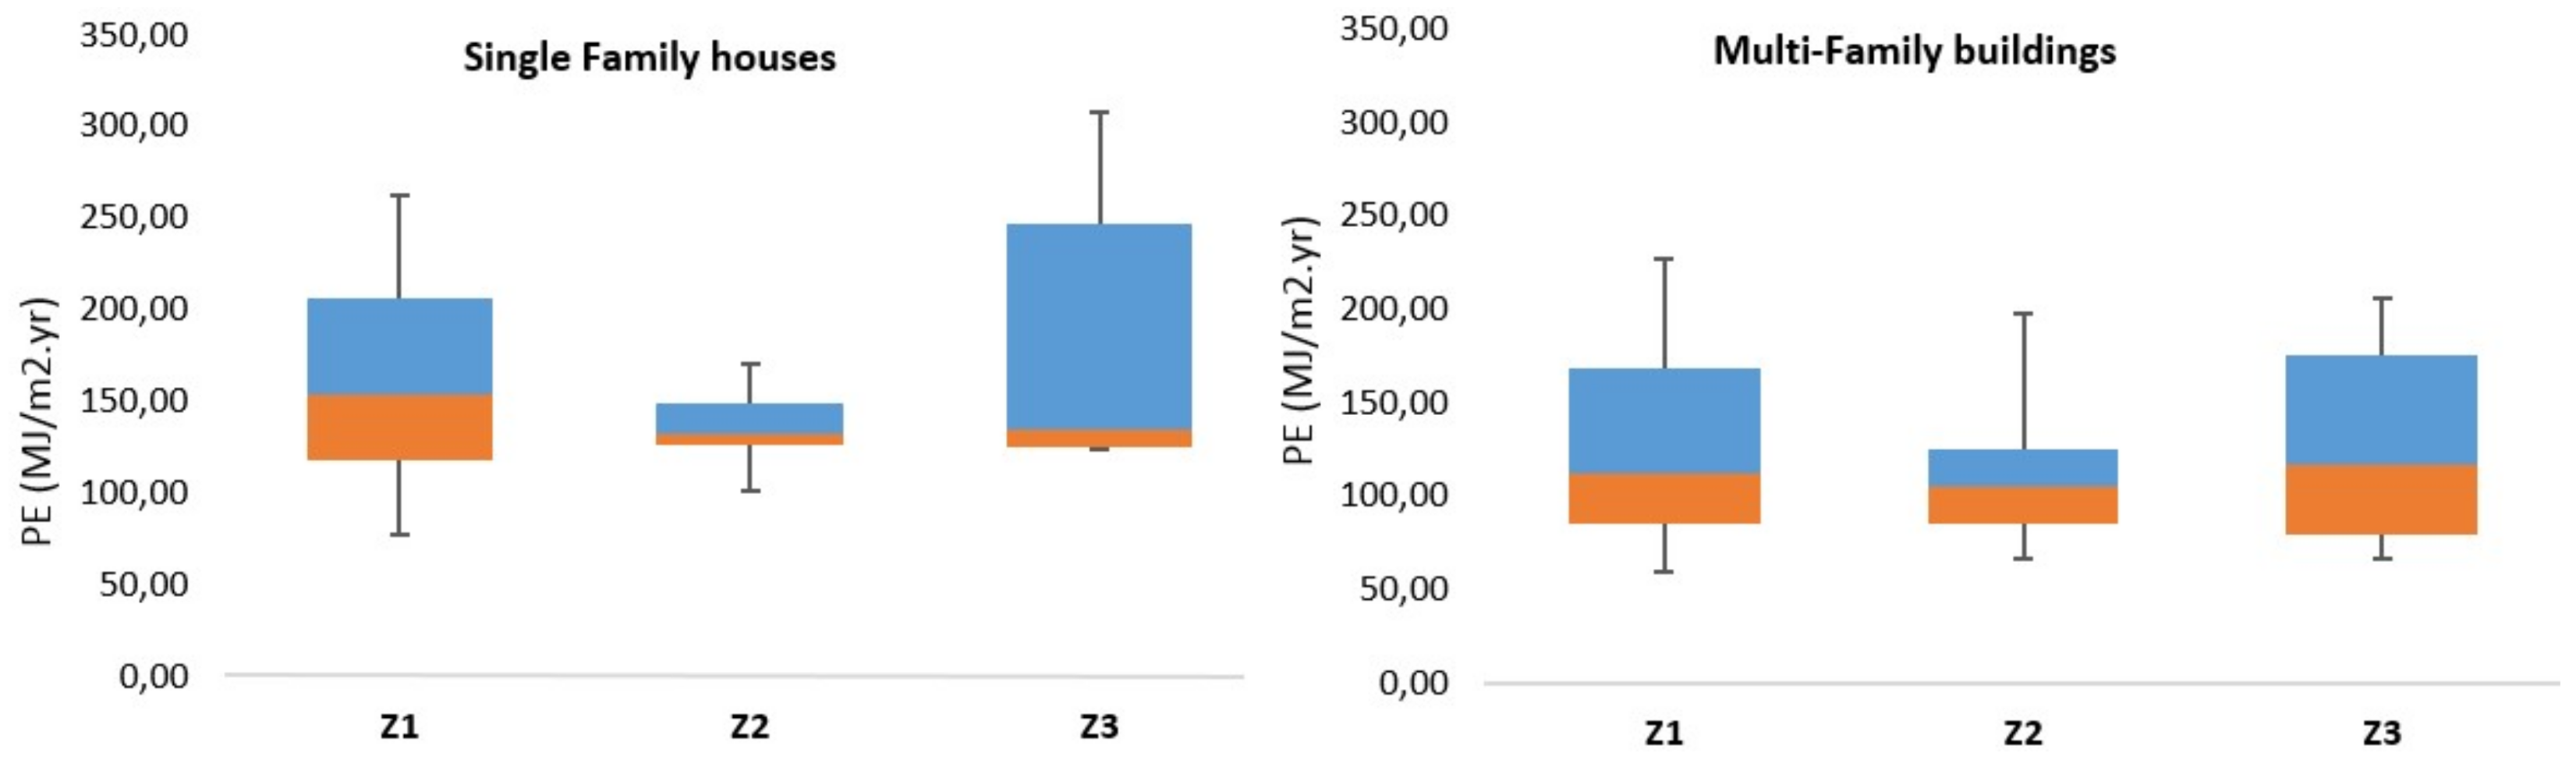
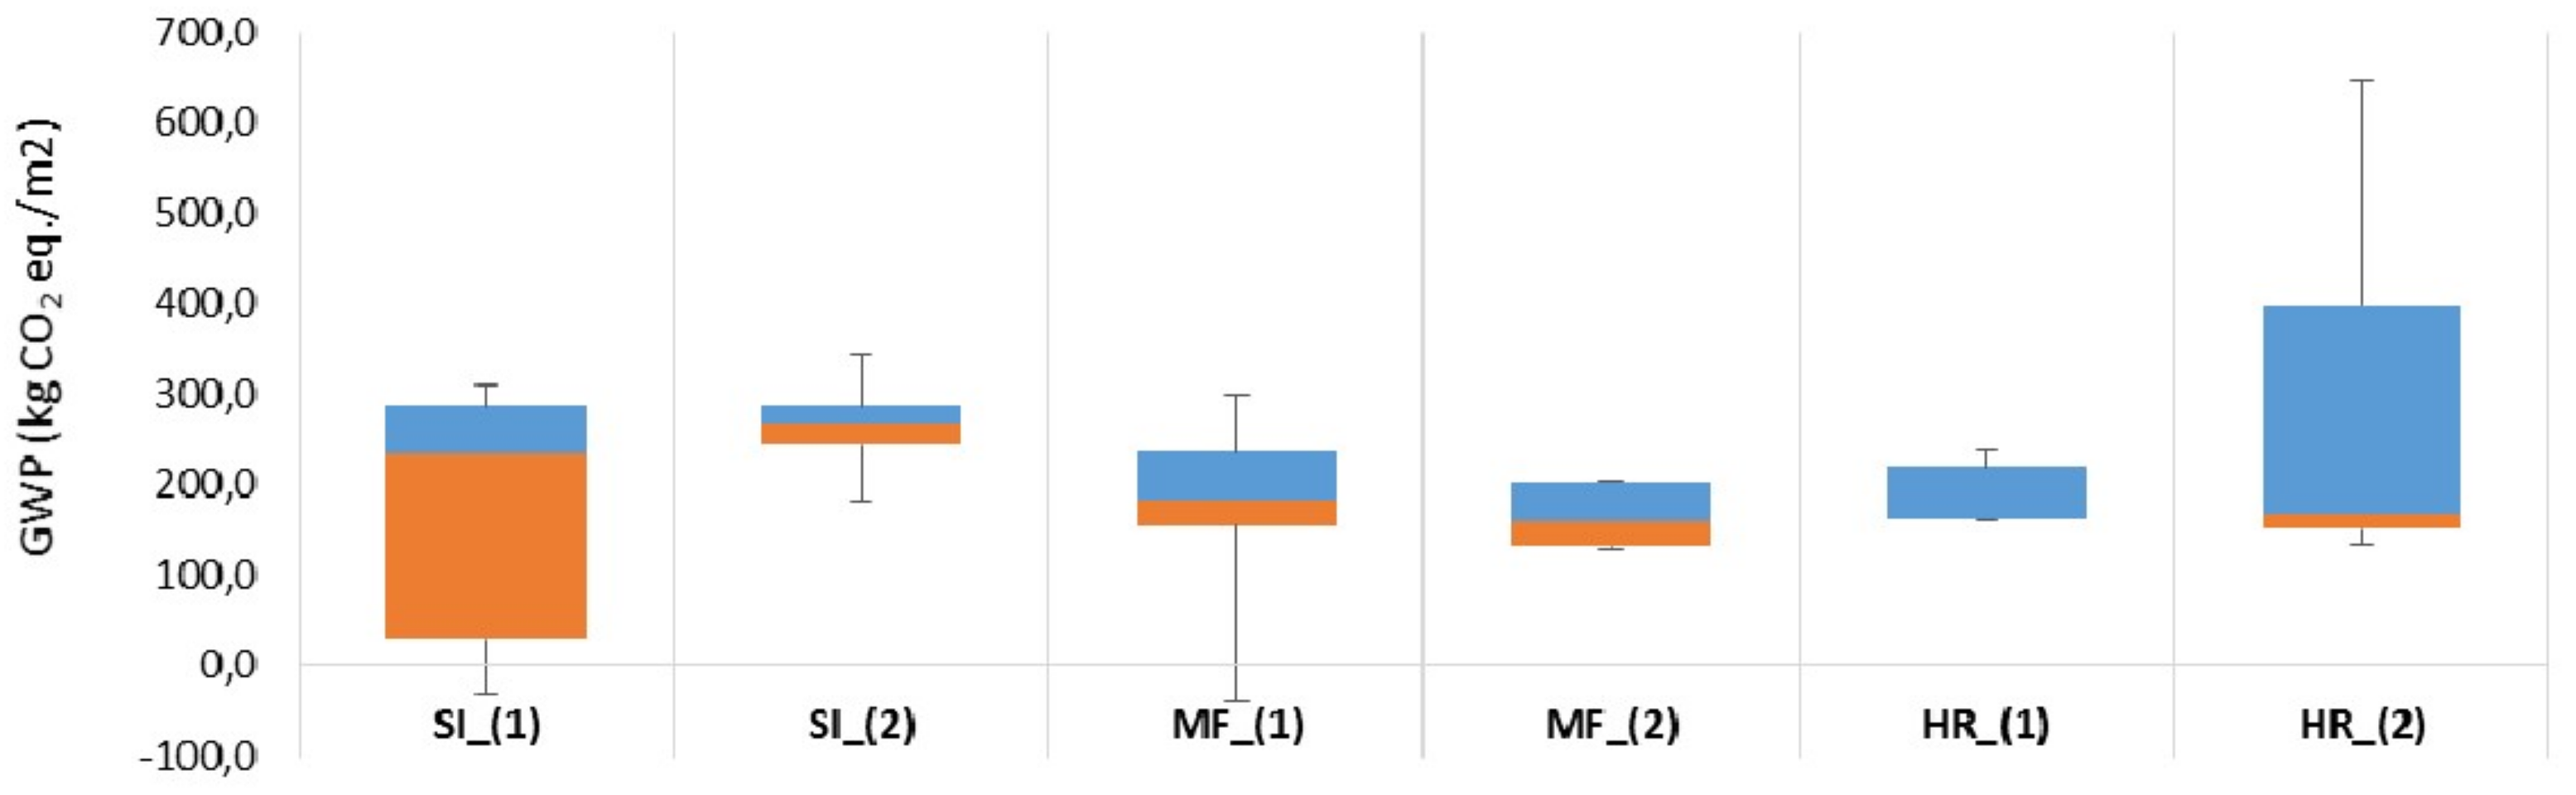
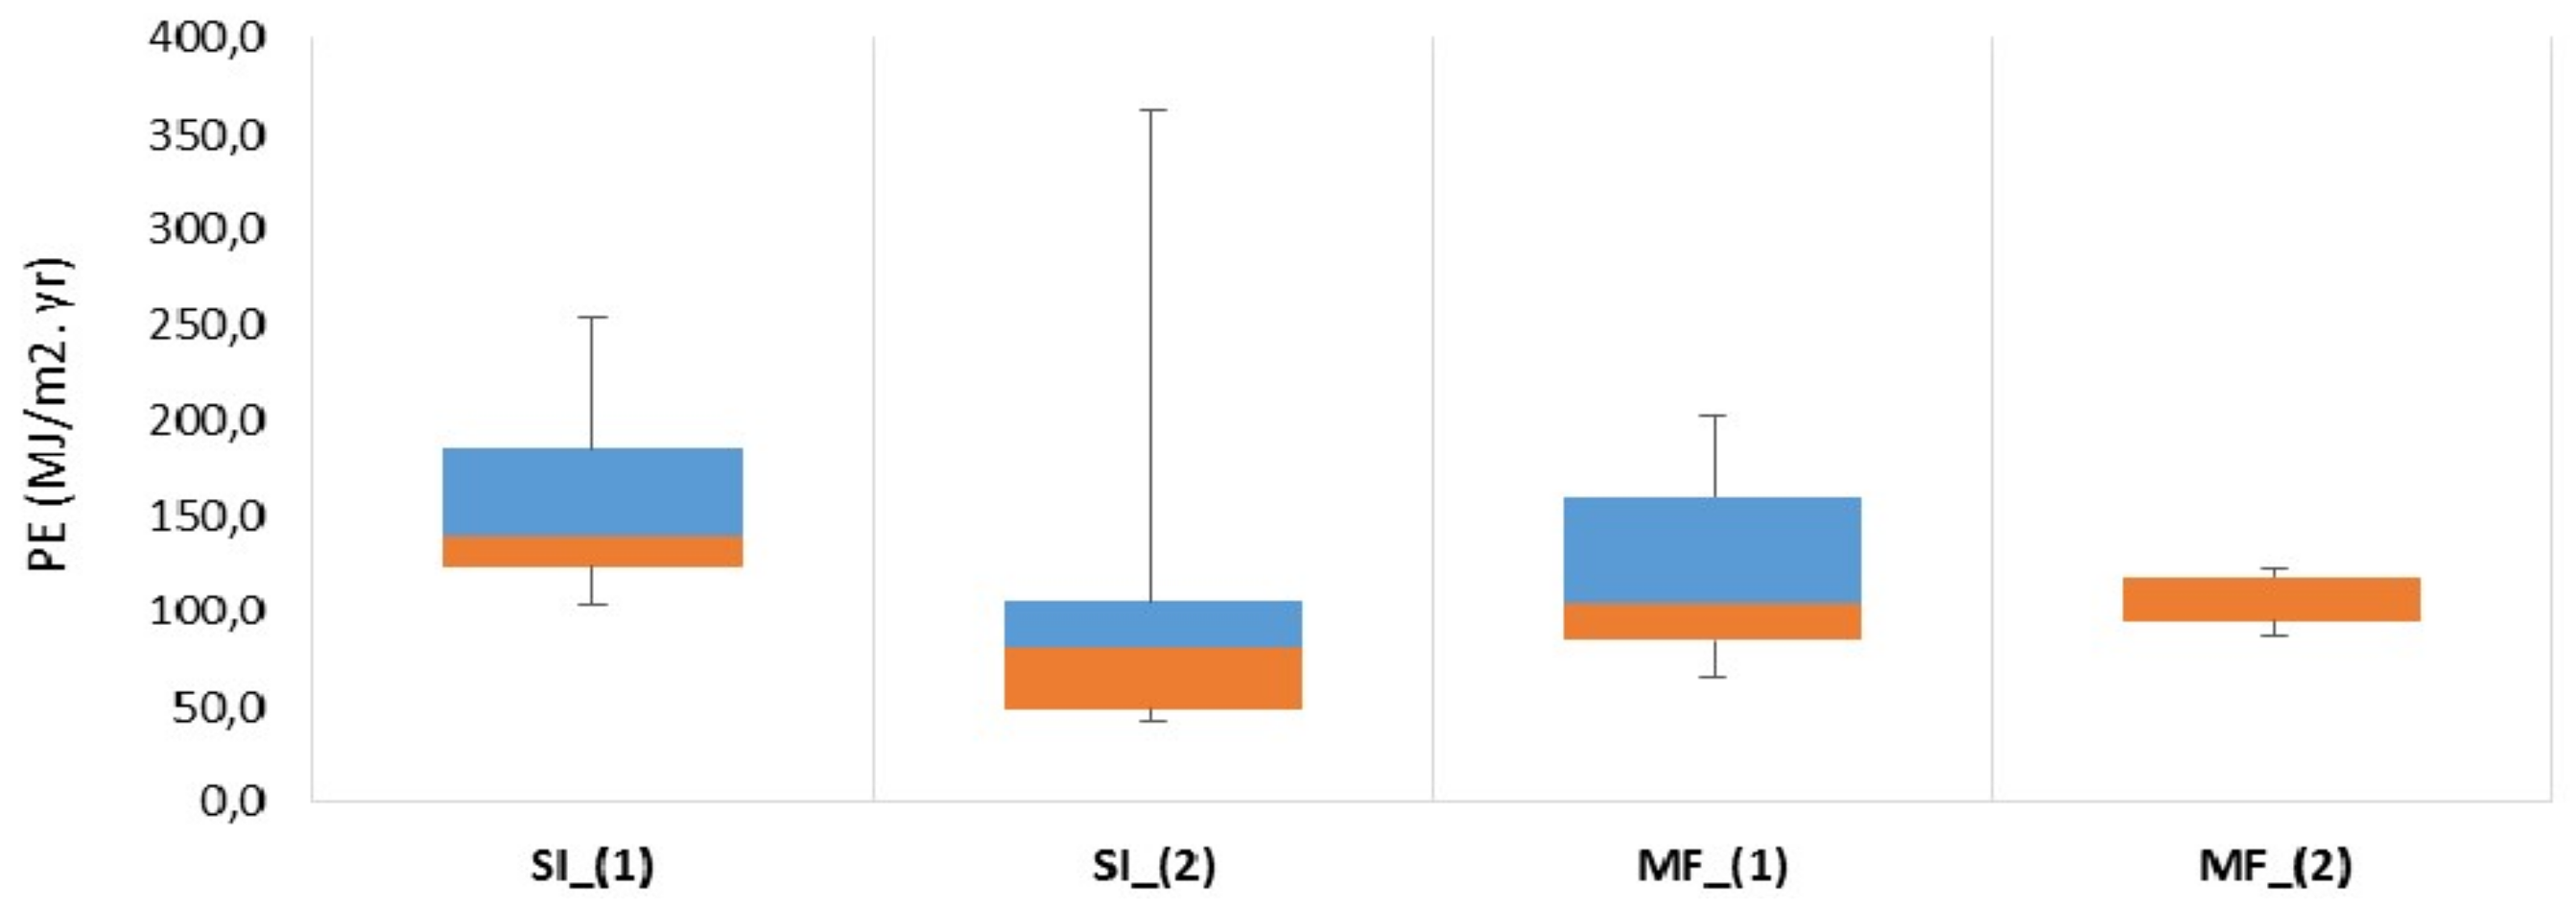
Table 1.
Results of life-cycle analysis for ‘construction products and equipment’, for a time period of 50 years [23].
Table 1.
Results of life-cycle analysis for ‘construction products and equipment’, for a time period of 50 years [23].
| Type of Building | Primary Energy (kWh/m2.yr) | Climate Change (kg CO2 eq./m2.yr) |
|---|---|---|
| Office buildings (BB) | 53-62.8-78 | 11-13-16 |
| Collective buildings (IC) | 45-49.7-60 | 8.5-10.5-12 |
| Individual houses (MI) | 44-51.4-58 | 6-8.4-10 |
Table 2.
Results of life-cycle analysis for the structural system, for a time period of 50 years.
| Type of Building | Primary Energy (kWh/m2.yr) | Climate Change (kg CO2 eq./m2.yr) | |
|---|---|---|---|
| Office Buildings | Lot 2 | 7.09 | 2.66 |
| Lot 3 | 10.30 | 3.88 | |
| Collective buildings | Lot 2 | 4.42 | 1.41 |
| Lot 3 | 10.96 | 3.87 | |
| Individual houses | Lot 2 | 3.28 | 1.04 |
| Lot 3 | 7.99 | 2.00 |
Table 3.
Importance of the structure (Lots 2 and 3) in relation to ‘construction products and equipment’ and global building [23].
Table 3.
Importance of the structure (Lots 2 and 3) in relation to ‘construction products and equipment’ and global building [23].
| Primary Energy | Climatic Change | |||
|---|---|---|---|---|
| Construction Products and Equipment | Global Building | Construction products and Equipment | Global Building | |
| Office buildings | 28% | 6% | 50% | 33% |
| Collective buildings | 31% | 7% | 50% | 23% |
| Individual houses | 22% | 6% | 36% | 20% |
Table 4.
Reference values according to different building typologies.
| Sub-Type | Area | Scope | Building Components | Embodied carbon (kg CO2 eq./m2) | Embodied Energy (MJ/m2) | Ref. | |
|---|---|---|---|---|---|---|---|
| Residential buildings | Multi Family | n.a. | C2G | Building materials | 435-1162 | 2817-7837 | [20] |
| Single Family | n.a. | C2Gt | Structure | 243-267-286 | - | [31] | |
| Multi Family (low rise) | n.a. | C2Gt | Structure | 131-159-202 | - | ||
| Multi Family (medium rise) | n.a. | C2Gt | Structure | 150-168-397 | - | ||
| Multi Family (high rise) | n.a. | C2Gt | Structure | 206-257-342 | - | ||
| Multi Family | NFA | C2Gt | Building materials | 164-173 | - | [32] | |
| Multi Family | NFA | C2Gt | Building materials and repair materials | 176-186 | - | ||
| Detached house | GFA | C2Gt | Building materials | 1158 | - | [33] | |
| Multi Family | GFA | C2Gt | Building materials | 704 | - | [33] | |
| Single Family | n.a. | C2G | Building materials and equipment | - | 25-515 * | [34] | |
| Multi Family | n.a. | C2G | Building materials and equipment | - | 79-126 * | [34] | |
| Single Family | NFA | C2G | Building materials and equipment | 300-420-500 ** | 7920-9252-10440 *** | [23] | |
| Multi Family | NFA | C2G | Building materials and equipment | 425-525-600 ** | 8100-8946-10800 *** | [23] | |
| Office buildings | - | n.a. | C2G | Building materials | 731-1053 | 5540-7157 | [20] |
| - | n.a. | C2Gt | Structure | 227-330-418 | - | [31] | |
| - | GFA | C2Gt | Building materials | 674 | - | [33] | |
| - | n.a. | C2G | Building materials and equipment | - | 119-500 * | [34] | |
| - | n.a. | C2Gt | Building materials and equipment | 843-1033 | 7743-11939 | [35] | |
| - | NFA | C2G | Building materials and equipment | 550-650-800 ** | 9540-11304-14040 *** | [23] |
* values are given in MJ/m2.yr; ** original values were multiplied by the period of time considered in the source (50 years); *** original values converted to MJ and multiplied by the period of time considered in the source (50 yrs).
Table 5.
Reference values according to different structural systems.
| Building Type | Area | Scope | Building Components | Embodied carbon (kg CO2 eq./m2) | Embodied Energy (MJ/m2) | Ref. | |
|---|---|---|---|---|---|---|---|
| Steel | Various | n.a. | C2Gt | Structure | 229-385-534 | - | [31] |
| Office | GFA | C2Gt | Structure + foundation | 473 * | 4869 | [35] | |
| N.A. | GFA | C2G | Structure | 152-209 | - | [36] | |
| Residen. | n.a. | C2G | Building materials | 241 | - | [37] | |
| Residen. | n.a. | n.a. | Building materials | 278 | - | [38] | |
| Residen. | GFA | C2Gt | Building materials | 354 | 1800 | [39] | |
| Office | GFA | C2Gt | Structure | 530-550 * | 5595-5770 | [28] | |
| Reinforced Concrete | Various | n.a. | C2Gt | Structure | 277-361-434 | - | [31] |
| Office | GFA | C2Gt | Structure + foundation | 497 * | 4366 | [35] | |
| Office | GFA | C2G | All building materials | 491 | - | [40] | |
| N.A. | GFA | C2G | Structure | 159-242 | - | [36] | |
| Office | GFA | C2Gt | Structure | 390-410 * | 4090-4321 | [28] | |
| Residen. | n.a. | C2G | Building materials | 332 | - | [37] | |
| Residen. | n.a. | n.a. | Building materials | 338 | - | [38] | |
| Residen. | GFA | C2Gt | Building materials | 433 | 2602 | [39] | |
| Office | NFA | C2Gt | Building materials + equipment | - | 7200-8820-11520 ** | [23] | |
| Residen. | NFA | C2Gt | Building materials + equipment | - | 7020-7200-8280 ** | [23] | |
| Wood | Various | n.a. | C2Gt | Structure | 174-244-293 | - | [31] |
| Residen. | n.a. | C2G | Building materials | 108 | - | [37] | |
| Residen. | n.a. | n.a. | Building materials | 172 | - | [38] | |
| Residen. | GFA | C2Gt | Building materials | 288 | 1181 | [39] | |
| Masonry | Various | n.a. | C2Gt | Structure | 243-265-281 | - | [31] |
| Residen. | NFA | C2Gt | Building materials + equipment | - | 6120-6480-6840 ** | [23] | |
| Steel and Concrete | Various | n.a. | C2Gt | Structure | 245-381-523 | - | [31] |
| Office | GFA | C2Gt | Structure + foundation | 744 * | 7616 | [35] | |
| Office | NFA | C2Gt | Building materials + equipment | - | 7740-7920-9540 ** | [23] |
* Based in I/O; ** Only non-renewable energy is considered.
Table 6.
Examples of GWP values (in kg CO2 eq./declared unit) for different construction materials.
| Material | Declared Unit | Indicator | A1–A3 | C1–C4 | D | Total | Source of Data |
|---|---|---|---|---|---|---|---|
| C40 concrete mix | 1 kg | GWP | 0.13 a | 0.0043 b | −0.0053 b | 0.13 | a GaBi database [41] |
| b data from [42] | |||||||
| Steel reinforcing | 1 kg | GWP | 3.2 | 0.0079 * | −1 | 2.21 | EPD reg. No.: S-P-00855 [43] |
| Softwood timber (sawn) | 1 m3 | GWPT | −760 | 906 ** | −585 ** | −439 | EPD reg. No.: S-P-00560 |
| GWPF | 128 | 5.59 ** | −586 ** | −452 | [43] | ||
| GWPB | −887 | 900 ** | 1.41 ** | 14.41 |
* only Modules C3-C4 were considered; ** only Module C3 was considered and the end-of-life scenario includes shredding (module C3) and combustion with recovered energy offset against average thermal energy from natural gas (module D).
Table 7.
Scope of the life-cycle assessment (LCA).
| Product Stage | Process Stage | Use Stage | End-of-Life Stage | |||||||||||||
|---|---|---|---|---|---|---|---|---|---|---|---|---|---|---|---|---|
| A1 | A2 | A3 | A4 | A4 | B1 | B2 | B3 | B4 | B5 | B6 | B7 | C1 | C2 | C3 | C4 | D |
| Raw material supply | Transport | Manufacturing | Transport | Construction | Use | Maintenance | Repair | Replacement | Refurbishment | Operational energy use | Operational water use | Deconstruction | Transport | Waste processing | Disposal | Reuse-recycling-recover |
| x | x | x | x | x | x | x | x | x | x | - | - | x | x | x | x | x |
| -------------Cradle-to-gate------------ | ||||||||||||||||
| -------------------------------------------------------------------------------------------------------------------------------------------------Cradle-to-grave--------------------------------------------------------------------------------------------------------------------------------------------------- | ||||||||||||||||
| --------------------------------------------------------------------------------------------------------------------------------------------------------------Cradle-to-cradle------------------------------------------------------------------------------------------------------------------------------------------------------------ | ||||||||||||||||
Table 8.
Indicators describing environmental impacts [50].
Table 8.
Indicators describing environmental impacts [50].
| Indicator | Unit |
|---|---|
| Global warming potential | kg CO2 eq. |
| Depletion potential of the stratospheric ozone layer | kg CFC 11 eq. |
| Acidification potential of land and water | kg SO2− eq. |
| Eutrophication potential | kg PO43− eq. |
| Formation potential of tropospheric ozone photochemical oxidants | kg C2H4 eq. |
| Abiotic resource depletion potential for elements | kg Sb eq. |
| Abiotic resource depletion potential of fossil fuels | MJ, net calorific value |
Table 9.
Indicators describing input flows [50].
Table 9.
Indicators describing input flows [50].
| Indicator | Unit |
|---|---|
| Use of renewable primary energy excluding energy resources used as raw material | MJ, net calorific value |
| Use of renewable primary energy resources used as raw material | MJ, net calorific value |
| Use of non-renewable primary energy excluding primary energy resources used as raw material | MJ, net calorific value |
| Use of non-renewable primary energy resources used as raw material | MJ, net calorific value |
| Use of secondary material | kg |
| Use of renewable secondary fuels | MJ |
| Use of non-renewable secondary fuels | MJ |
| Net use of fresh water | m3 |
Table 10.
Indicators describing output flows waste categories [50].
Table 10.
Indicators describing output flows waste categories [50].
| Categories | Indicator | Unit |
|---|---|---|
| Waste flows | Hazardous waste disposed | kg |
| Non-hazardous waste disposed | kg | |
| Radioactive waste disposed | kg | |
| Other flows leaving the system | Components for re-use | kg |
| Materials for recycling | kg | |
| Materials for energy recovery (not being waste incineration) | kg | |
| Exported energy | MJ for each energy carrier |
Table 11.
Energy used (in MJ/kg) for the demolition/deconstruction of different structural frames in buildings [69].
Table 11.
Energy used (in MJ/kg) for the demolition/deconstruction of different structural frames in buildings [69].
| Frame to Be Recycled (in MJ/kg) | Frame to Be Reuse (in MJ/kg) | |
|---|---|---|
| Steel frame | 0.239 | 0.432 |
| Concrete frame | 0.070 | 0.061 |
| Wood frame | 0.323 | 0.176 |
Table 12.
Number of buildings and types in each zone [76].
Table 12.
Number of buildings and types in each zone [76].
| Climatic Zones | Single-Family House (SI) | Multi-Family House (MF) | High-Rise Building (HR) | |||
|---|---|---|---|---|---|---|
| Existing | New | Existing | New | Existing | New | |
| Zone 1: South European countries | 8 | 3 | 8 | 3 | 2 | 1 |
| Zone 2: Central European countries | 8 | 3 | 8 | 3 | 2 | 1 |
| Zone 3: North European countries | 7 | 2 | 8 | 2 | 2 | 1 |
| Total | 31 | 32 | 9 | |||
Table 13.
Statistical analysis for each life cycle stage [GWP1 (kg CO2 eq./m2.yr)] for Z1.
| Life Cycle | Median | Quartile 25% | Quartile 75% | Median | Quartile 25% | Quartile 75% |
|---|---|---|---|---|---|---|
| Modules | Single-Family Houses (SI) | Multi-Family Houses (MF) | ||||
| A1–A3 | 6.79 × 100 | 9.03 × 10⁻¹ | 9.32 × 100 | 6.09 × 100 | 4.57 × 100 | 9.96 × 100 |
| A4 | 5.84 × 10⁻² | 4.38 × 10⁻² | 6.78 × 10⁻² | 4.83 × 10⁻² | 3.46 × 10⁻² | 6.92 × 10⁻² |
| A5 | 5.52 × 10⁻² | 4.62 × 10⁻² | 9.23 × 10⁻² | 1.78 × 10⁻¹ | 1.39 × 10⁻¹ | 2.89 × 10⁻¹ |
| B4 | 4.69 × 10⁻³ | −6.69 × 10⁻¹ | 5.10 × 10⁻² | 5.50 × 10⁻⁴ | 2.09 × 10⁻⁴ | 3.41 × 10⁻² |
| C1 | 5.50 × 10⁻¹ | 4.32 × 10⁻¹ | 6.51 × 10⁻¹ | 4.64 × 10⁻¹ | 3.40 × 10⁻¹ | 6.40 × 10⁻¹ |
| C2 | 6.51 × 10⁻² | 4.95 × 10⁻² | 7.55 × 10⁻² | 5.38 × 10⁻² | 3.91 × 10⁻² | 7.71 × 10⁻² |
| C3 | 7.14 × 10⁻² | 2.19 × 10⁻² | 9.01 × 10⁻² | 6.62 × 10⁻² | 4.94 × 10⁻² | 1.07 × 10⁻¹ |
| C4 | 4.99 × 10⁻¹ | 3.38 × 10⁻¹ | 6.57 × 10⁻¹ | 3.81 × 10⁻¹ | 2.24 × 10⁻¹ | 4.43 × 10⁻¹ |
| D | −6.67 × 10⁻¹ | −9.03 × 10⁻¹ | 2.25 × 100 | −6.23 × 10⁻¹ | −1.01 × 100 | −3.74 × 10⁻¹ |
Table 14.
Statistical analysis for each building type [GWP (kg CO2 eq./m2.yr) and PE (MJ/m2.yr)].
| Mean Value | Median | Standard Deviation | Quartile 25% | Quartile 75% | ||
|---|---|---|---|---|---|---|
| SI | GWP1 | 6.65 | 7.22 | 3.80 | 2.53 | 8.71 |
| GWP2 | 8.57 | 8.94 | 4.20 | 5.01 | 11.27 | |
| PE | 157.56 | 139.25 | 54.17 | 124.19 | 186.18 | |
| MF | GWP1 | 6.84 | 6.30 | 3.76 | 4.88 | 9.94 |
| GWP2 | 7.87 | 7.32 | 3.89 | 5.37 | 10.75 | |
| PE | 120.51 | 105.60 | 48.80 | 84.50 | 159.77 | |
| HR | GWP1 | 6.06 | 5.53 | 2.05 | 4.34 | 6.91 |
| GWP2 | 6.61 | 6.57 | 1.81 | 5.03 | 6.94 | |
| PE | 89.69 | 88.89 | 24.78 | 68.51 | 94.93 |
© 2018 by the authors. Licensee MDPI, Basel, Switzerland. This article is an open access article distributed under the terms and conditions of the Creative Commons Attribution (CC BY) license (http://creativecommons.org/licenses/by/4.0/).
Share and Cite
MDPI and ACS Style
Gervasio, H.; Dimova, S.; Pinto, A. Benchmarking the Life-Cycle Environmental Performance of Buildings. Sustainability 2018, 10, 1454. https://doi.org/10.3390/su10051454
AMA Style
Gervasio H, Dimova S, Pinto A. Benchmarking the Life-Cycle Environmental Performance of Buildings. Sustainability. 2018; 10(5):1454. https://doi.org/10.3390/su10051454
Chicago/Turabian StyleGervasio, Helena, Silvia Dimova, and Artur Pinto. 2018. "Benchmarking the Life-Cycle Environmental Performance of Buildings" Sustainability 10, no. 5: 1454. https://doi.org/10.3390/su10051454
Note that from the first issue of 2016, this journal uses article numbers instead of page numbers. See further details here.