Article

Comprehensive Evaluation for Operating Efficiency of Electricity Retail Companies Based on the Improved TOPSIS Method and LSSVM Optimized by Modified Ant Colony Algorithm from the View of Sustainable Development

1
School of Economics and Management, North China Electric Power University, Changping, Beijing 102206, China
2
Beijing Key Laboratory of New Energy and Low-Carbon Development (North China Electric Power University), Changping, Beijing 102206, China
*
Author to whom correspondence should be addressed.
Sustainability 2018, 10(3), 860; https://doi.org/10.3390/su10030860
Submission received: 8 January 2018 / Revised: 7 March 2018 / Accepted: 15 March 2018 / Published: 18 March 2018

Abstract

:
The electricity market of China is currently in the process of a new institutional reform. Diversified electricity retail entities are gradually being established with the opening of the marketing electricity side. In the face of a complex market environment and fierce competition, the operating efficiency can directly reflect the current market position and development of electricity retail companies. TOPSIS method can make full use of the information of original data, calculate the distance between evaluated objects and the ideal solutions and get the relative proximity, which is generally used in the overall department and comprehensive evaluation of the benefits. Least squares support vector machine (LSSVM), with high convergence precision, helps save the training time of algorithm by solving linear equations and is used to predict the comprehensive evaluation value. Considering the ultimate goal of sustainable development, a comprehensive evaluation model on operating efficiency of electricity retail companies based on the improved TOPSIS method and LSSVM optimized by modified ant colony algorithm is proposed in this paper. Firstly, from the view of sustainable development, an operating efficiency evaluation indicator system is constructed. Secondly, the entropy weight method is applied to empower the indicators objectively. After that, based on the improved TOPSIS method, the reverse problem in the evaluation process is eliminated. According to the relative proximity between the evaluated objects and the absolute ideal solutions, the scores of comprehensive evaluation for operating efficiency can then be ranked. Finally, the LSSVM optimized by modified ant colony algorithm is introduced to realize the simplified expert scoring process and fast calculation in the comprehensive evaluation process, and its improved learning and generalization ability can be used in the comprehensive evaluation of similar projects. The example analysis proves that the comprehensive evaluation model proposed in this paper can provide scientific and effective evaluation results of the operating efficiency of electricity retail companies.

1. Introduction

The operating efficiency of an enterprise refers to the profitability in carrying out a series of production and business activities. For enterprises, it is necessary to master and analyze the market environment, to enhance the core competitiveness to improve the operating efficiency. Today, the energy system is shifting from fossils to sustainable energy, thus the operating efficiency of enterprises must be based on the view of sustainable development. External environmental constraints, accessibility and availability of resources, economic and social perspectives on energy, etc. should be taken into account in a timely manner.
As one of the important engines of national economic and energy development, the electricity industry, along with the continuous progress of its institutional reform, the power grid enterprises, is no longer the main competitor in the liberalized sales side market. Instead, the electricity retail companies established by diversified capital enter the market to participate in competition by acquiring the licenses of electricity sales. Under the environment of the new reform of the electricity market, the original interest pattern of the sales side will be broken and re-divided. Having a comprehensive understanding of the existing operating efficiency of electricity retail companies is of great significance to achieve the goal of sustainable development, which also helps companies to recognize positions in the electricity market, analyze competitive advantages and disadvantages and put forward the appropriate operation and development modes combined with the market environment to seize the initiative on the marketing electricity side.
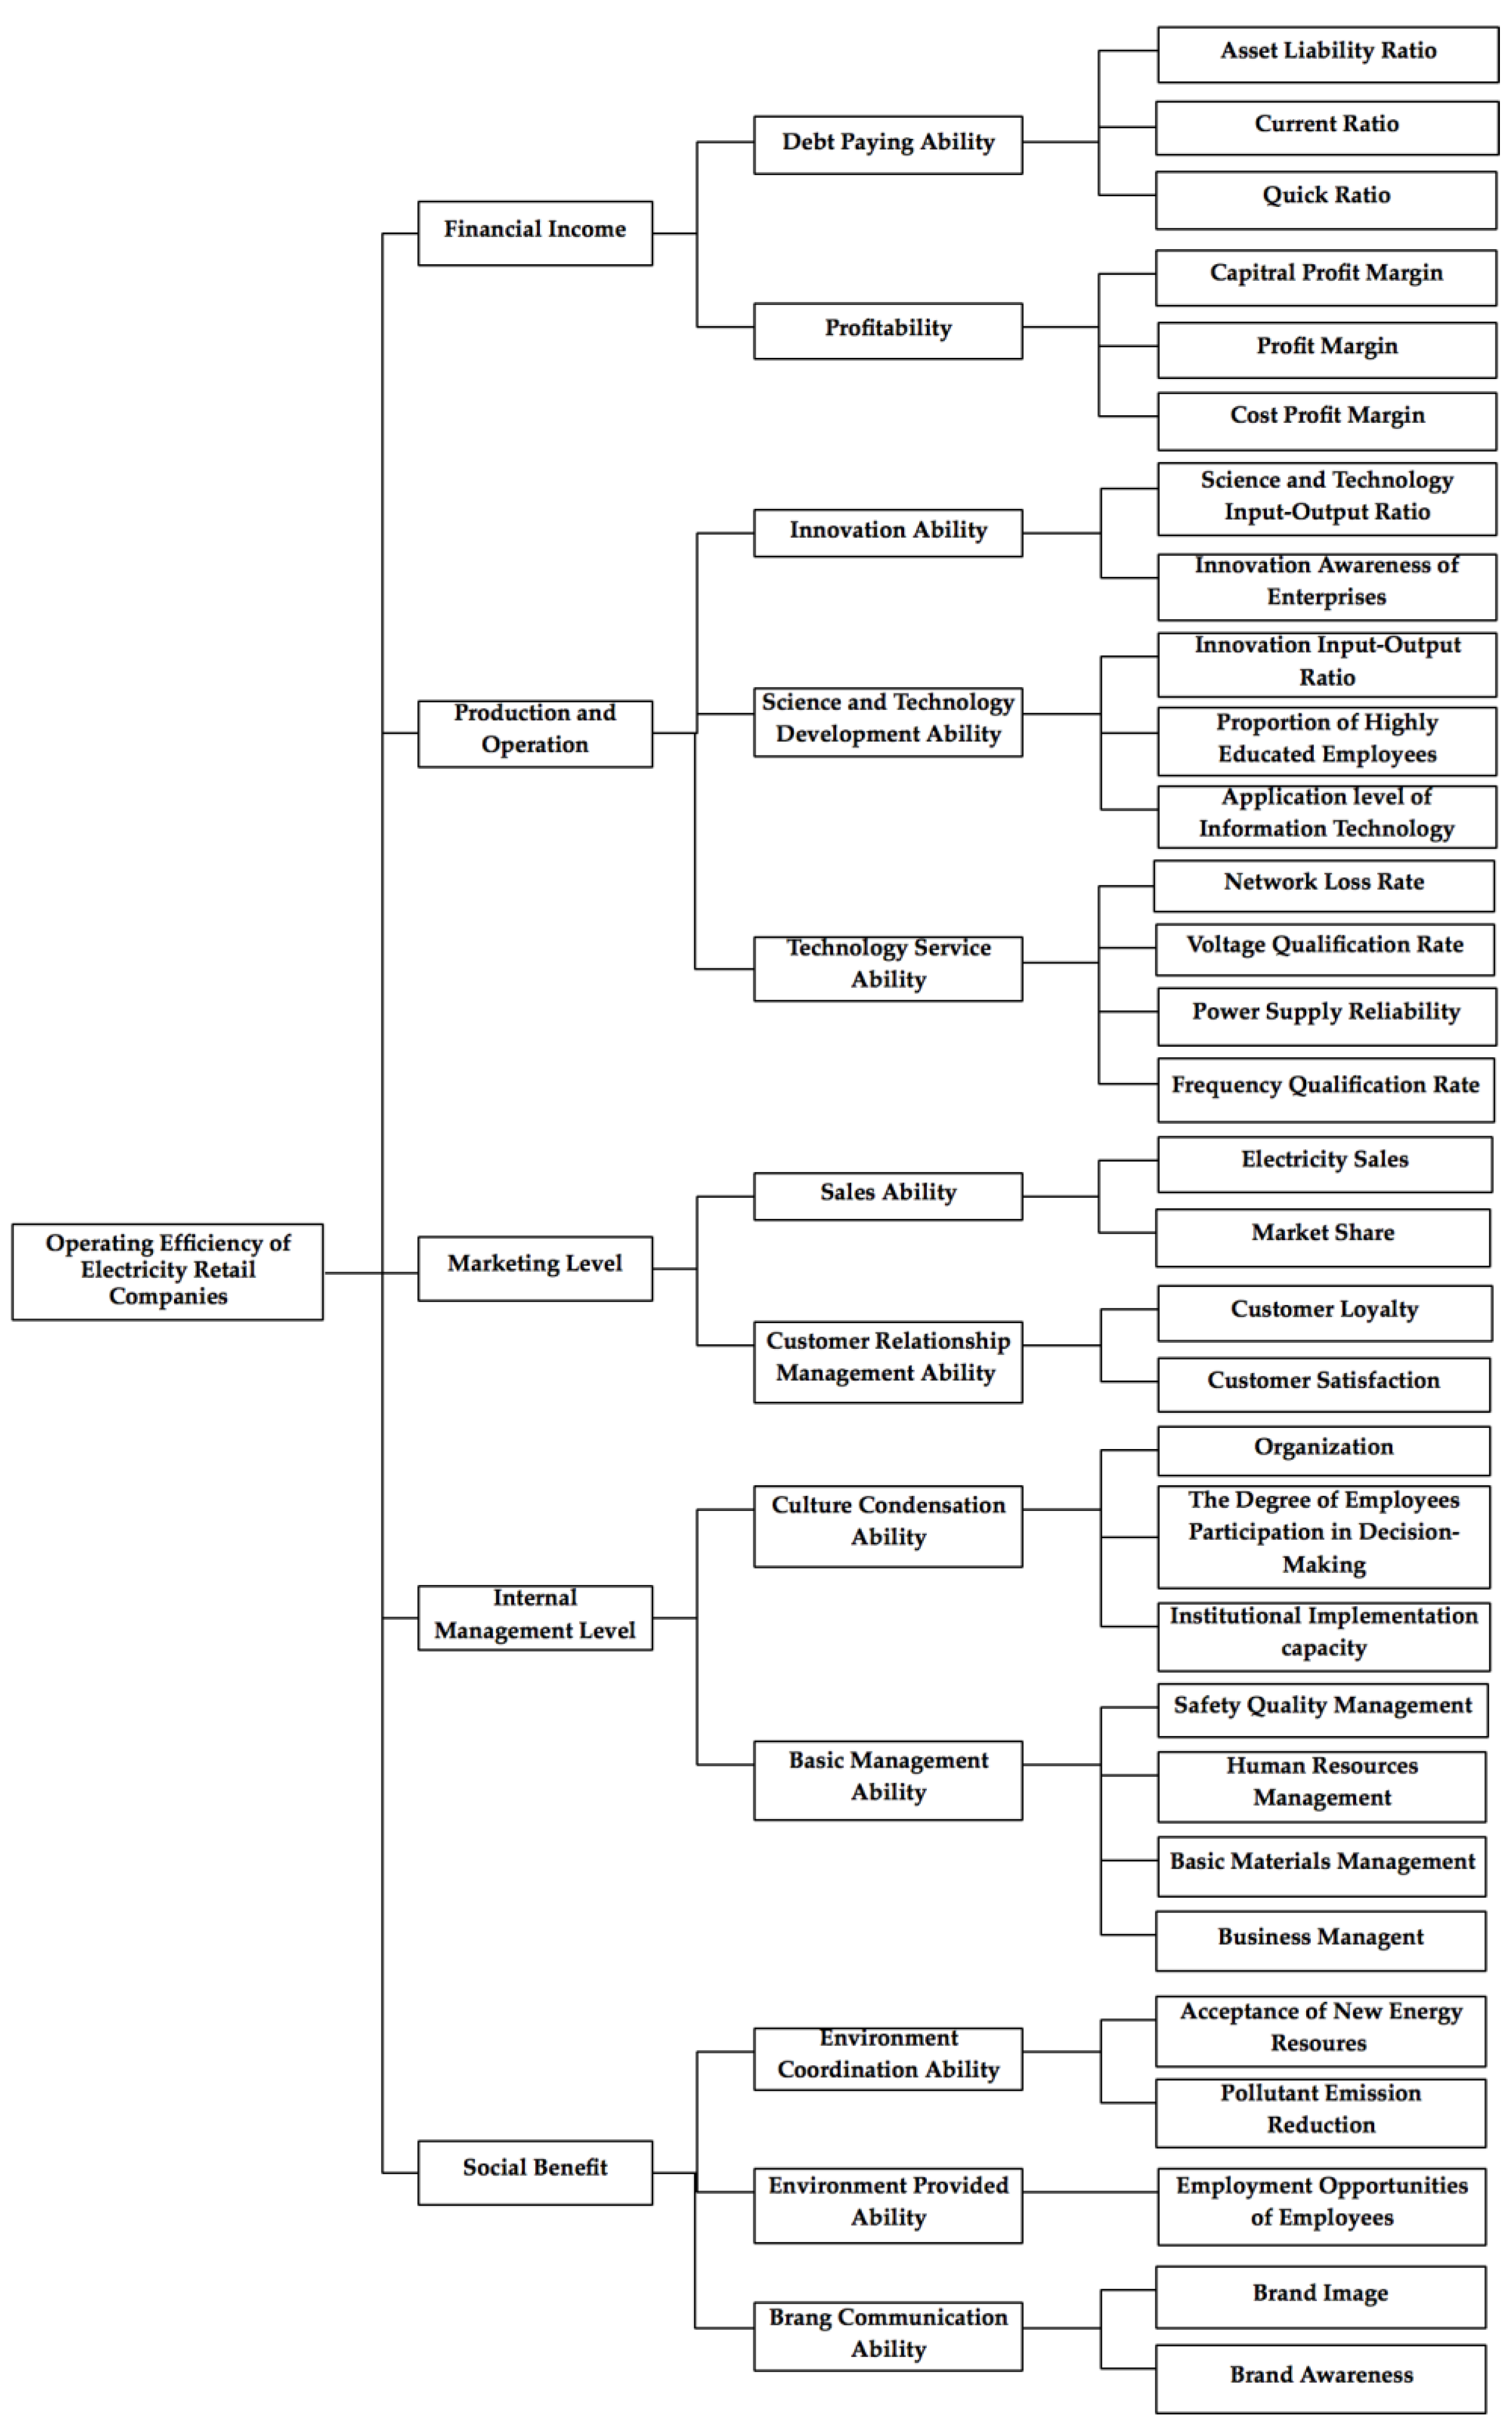
The evaluation for operating efficiency of electricity retail companies needs to take the ultimate goal of sustainable development into account. The operating efficiency evaluation indicator system of electricity retail companies can be constructed from multi-dimensions, such as financial benefits, production and operation, marketing, internal management and social contribution [1]. Also, a scientific and efficient evaluation method is applied to evaluate the operating efficiency. According to the comprehensive evaluation results of operating efficiency, the electricity retail companies can have a full understanding of problems existing in the whole operating process and adjust or take measures to solve problems in time. Meanwhile, it can also compare the operating efficiency with the same type of companies so as to grasp their own competitive advantages and judge the current position in the electricity market. Therefore, in combination with the goal of sustainable development of companies, it is necessary to construct an operating efficiency evaluation indicator system of electricity retail companies and have the comprehensive evaluation on its operating efficiency, which is of great importance to provide reference for the electricity retail companies to develop an effective operating development strategy and ultimately achieve sustainable development.
The TOPSIS method is a method to sort the evaluated objects by approximating the ideal solutions; it can make full use of the original information and reduce the subjectivity in the evaluation process [2]. The TOPSIS method is currently widely used in many fields, such as the selection of the factory locations, investment decision and multi-attribute decision-making, especially for the comprehensive evaluation of the overall efficiency.
In the early years, researchers mainly carried out a considerable volume of research on comprehensive evaluation from multi-aspects of power grid enterprises, such as investment activities [3,4,5,6], operation and management [7,8,9], safe operation [10,11], quality of power products [12,13,14,15,16] and infrastructure construction [17,18,19,20,21,22], etc. Comprehensive evaluation theory and methods with innovation and practical significance have been widely used for the actual production and operation of power grid enterprises in order to help them achieve better operating efficiency and sustainable development.
He W., Zhong F. et al. [3] constructed a comprehensive performance evaluation model of power grid enterprises based on the analytic hierarchy process and fuzzy comprehensive evaluation method, which took the characteristics of the actual investment projects into account. Liu S., Yang C. et al. [4] took the annual individual project investment benefit as the evaluation goal and established an annual investment decision model. The decision model was based on grid scale and electricity sales, which lent great importance to the investment decisions of power grid enterprises. Juan L.I. et al. [5] put forward the distribution network investment evaluation model by combining TOPSIS and grey correlation degree, which could reflect the distribution network investment benefit of power grid enterprises to support the future planning. Gong J., Lei L. et al. [6] calculated different risk degrees of different operational risk management indicators based on TOPSIS method and grey relational degree, which helped strengthen risk management of power grid enterprises and avoid the potential risks in the operational process effectively. Song L. and Yang J. [7] applied a full-scale comprehensive evaluation on operating efficiency of electric power networks based on the consideration of political, social and economic responsibilities. Zhang S.M., Jun L.I. and Wang B.Y. [8] established a risk evaluation indicator system and risk evaluation model of power grid enterprises used for controlling the risks in business operation, and analytic hierarchy process (AHP), the order relation and the clustering analysis with interactive method were used to empower the risk indicators in this model, without which judge consistency. Jin-Chao L.I. et al. [9] applied the analytic network process method to determine the weight of indicators and chose the linear weighted technique to assess the operation ability of grid enterprises. The operation ability indicator system used for evaluation includes electric power supply ability, power grid transmission and distribution ability, and demand ability, which were interconnected and constrained. Cui M., Sun Y. et al. [10] put forward a multi-level beforehand comprehensive assessment indicator system according to the demand of grid operation security. A multi-level gray area relational analysis-based comprehensive assessment model was constructed to calculate the resolution ratio, then the weights from analytic hierarchy process, artificial neural network and entropy weight method were combined objectively by using the game set model. Fuzzy comprehensive evaluation was used to get the evaluation results at last. Based on the regulation security indicators, the general security indicators and the efficiency indicators, Mu Y., Lu Z., Qiao Y. et al. [11] built a new security and benefit comprehensive evaluation indicator system of grid enterprises and proposed a multi-operator fuzzy analytical hierarchy evaluation model, which was of great significance in guiding the layout and planning of power grids and analyzing the operating experience. Jiang Y. et al. [12] chose to combine rough set with evidence theory to assess the power quality performance. The rough set was used to build the decision-making strength and expansion rules, and the basic probability assignment of evidence theory could be defined by the decision-making table. Indicators reflected the power quality could be integrated through the fusion rules of evidence theory. Jiang S.N., Fang J. et al. [13] studied power quality with the fuzzy comprehensive evaluation of power quality that was based on credibility theory, in which AHP was used to define the weights of power quality indicators, and a comprehensive evaluation result of power quality could be calculated through the corresponding credibility measure. Hongze L.I., Guo S., Tang H. et al. [14] applied variable weight theory to calculate the weights of rating indicators and then put forward a comprehensive power quality evaluation model based on improved matter-element extension model with variable weight. Also, the classical domain of matter-element extension model and the maximum membership criterion were improved in this model, which is more effective for evaluation. Wang L., Wang Q. et al. [15] assessed the power quality by means of a synthetic power quality evaluation model based on principal component analysis and information entropy. Chen J. et al. [16] focused on the line loss of power grid and constructed a multi-dimensional indicator system, then had the line loss management evaluated through principal component analysis. The evaluation results on line loss management of power grid enterprises were proved to reflect the current power quality. In order to meet the development trend of power grids and study its layout and construction level, Gao X. and Zheng Y. [17] proposed a multiple evaluation indicator system of smart grid and a comprehensive principal component evaluation function to conduct the comprehensive evaluation of grid construction. Multiple indicators for standardization, dimension-reduction and de-correlation process were based on the principal component analysis and cluster analysis. Zhi-Yong X.U. et al. [18] combined the ANP method and fuzzy comprehensive evaluation method for grid construction projects, in which the weights of indicators were calculated by means of the ANP method; and the evaluation based on the fuzzy comprehensive evaluation method, suitable for multi-objective decision-making, was proved more effective. Lucas Cuadra, Sancho Salcedo-Sanz et al. [19] proposed that the best topology seemed to be the small-world networks in the field of robustness in power grids. Then Lucas Cuadra et al. [20] put forward an objective function based on cost elements in connection with electric cables and several indicators that were advantageous for smart grids, which was used for achieving balance between moderate cost and robustness against exceptional conditions and could have a deeper understanding of smart grid structures. Pagani G.A. and Aiello M. [21] proposed a method to turn the current physical power grid into a good smart grid model, which was topological and used in the Dutch distribution grid. E. Omodei and A. Arenas [22] put forward a stylized model that depended on the network topology, which helped to forecast the coordination of elements, and the method provided new ideas for the analysis of energy demand-side management in networked systems.
With the transformation of the electricity market, grid companies are taking positive actions to expand their business types. Researchers have also conducted in-depth research on comprehensive evaluation of marketing [23,24], environmental protection, social responsibility [25,26,27] and other related fields.
Yang S., Han Q., Xu L. et al. [23] built a comprehensive evaluation indicator system of electric power customer satisfaction from seven dimensions, which included image, expectation, the perceived value of power quality, the perceived value of service, perception of value, grumble and allegiance. Then a comprehensive evaluation model based on back propagation neural network optimized by fish swarm algorithm was proposed to conduct the customer satisfaction evaluation of power grid enterprises. Liu X.X. et al. [24] constructed a comprehensive evaluation indicator system of customer satisfaction on power suppliers of grid enterprises by means of fuzzy comprehensive evaluation method, in which the AHP was applied to complete the indicators empowerment process. Liu Q. [25] put forward an energy-saving and emission reduction contribution evaluation indicator system from the generation side, supply side and demand side of electricity. Then he constructed a comprehensive evaluation model based on TOPSIS and entropy weight to obtain the ranking of energy saving and emission contribution of different power grid enterprises, which was of great guiding significance to the development of energy conservation and emission reduction. Xue X., Ye X. et al. [26] put forward a quantitative model on the basis of fuzzy comprehensive evaluation and fuzzy synthetic weighted average operator to evaluate the construction level of energy management system of grid enterprises, to some extent, which also realized the social benefits of grid enterprises. Zhang C.Q., Cai M.M. and Xie P. [27] applied experts’ estimation method for the empowerment process and then built a fuzzy comprehensive evaluation model of social responsibility of power grid enterprises. Evaluation results of social responsibility could help grid enterprises take the initiative to fulfill its social responsibilities.
Researchers then also carried out comprehensive evaluation studies of sustainable development. Considering the coordination among electricity, environment and economy, Zhang X.H. and Quan X.F. [28] proposed using the space length quality synthetic evaluation method to evaluate the sustainable development of power grid enterprises, in which the bigger gap with the ideal point showed the worse development. Following the trend of the future of power grid, Liu Q. and Chen J. [29] built a power grid intelligent fuzzy comprehensive evaluation indicator system to assess various aspects of power grid construction.
At present, the market is in the process of promoting the reform of electricity market and power grid enterprises are no longer the main participators in the electricity market. Instead, various kinds of capital are choosing to build electricity retail companies to compete in the opening marketing electricity side. Researchers are gradually conducting comprehensive evaluation studies for electricity retail companies. Liu W.Y. and Jiao J. [30] assessed the competitiveness of the six major types of main entities in the marketing electricity side based on the fuzzy comprehensive evaluation method, which provided reference to the future development for electricity retail companies. Huang W.Q. et al. [31] designed a comprehensive evaluation indicator system of core competitiveness and proposed a value chain model to evaluate the core competitiveness of independent electricity retail companies based on the grey comprehensive evaluation method.
It can be seen from the above research and results that, at present, a perfect evaluation indicator system for operating efficiency has not been constructed for electricity retail companies. In addition, whether the application of the existing comprehensive evaluation methods can meet the demand of operation and development of electricity retail companies under the current market environment still remains to be further studied.
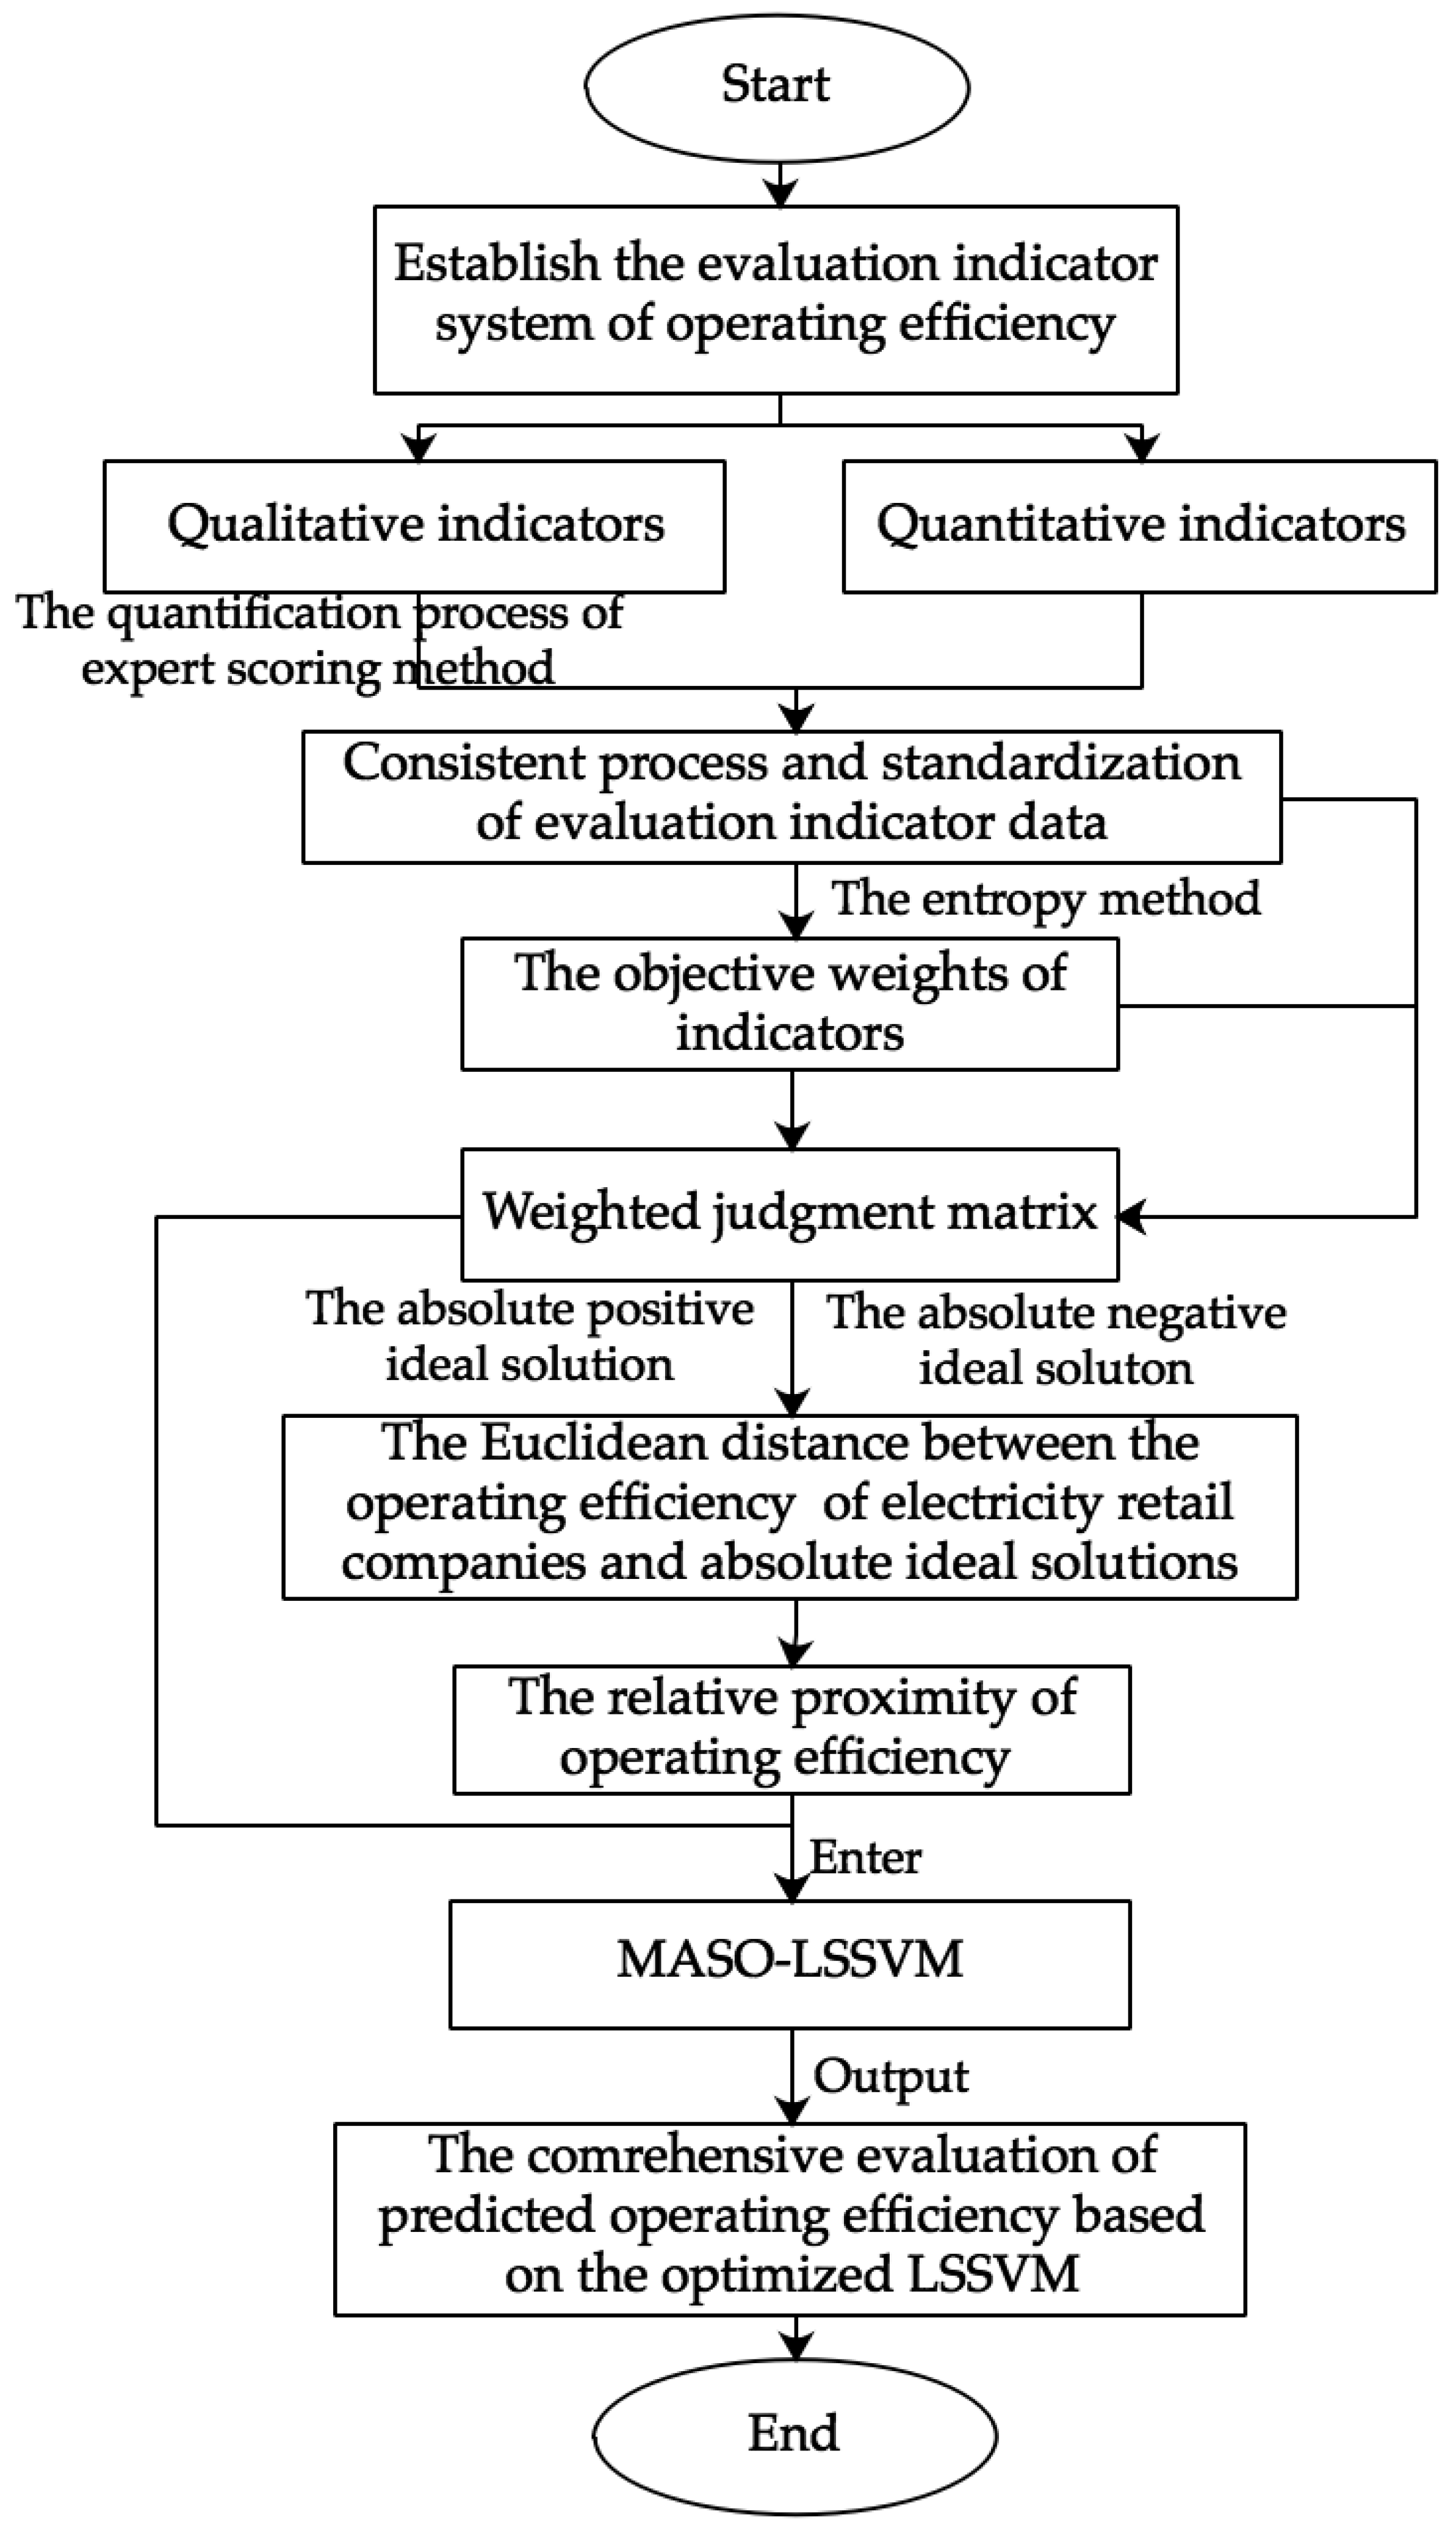
In this paper, from the view of sustainable development, an operating efficiency evaluation indicator system of electricity retail companies is proposed and a comprehensive evaluation model on operating efficiency of electricity retail companies based on the improved TOPSIS method and LSSVM optimized by modified ant colony algorithm is applied to have a comprehensive evaluation of the operating efficiency of electricity retail companies. Firstly, the operating efficiency of electricity retail companies is evaluated comprehensively based on the improved TOPSIS method. On that basis, the intelligent algorithm of LSSVM optimized by modified ant colony algorithm is introduced. The scoring process of experts is generalized by the learning of artificial intelligence, and the predicted value of comprehensive evaluation for operating efficiency is obtained by means of the intelligent calculation. For electricity retail companies, from the view of sustainable development, it is helpful to judge the market position and make the development strategies based on the comprehensive evaluation results of operating efficiency through the whole algorithm. In addition, the algorithm provides comprehensive evaluation with a new idea and has some universality. The improved TOPSIS method as the key content of the algorithm can be widely used in other comprehensive evaluations, as well as the LSSVM optimized by modified ant colony algorithm, as an auxiliary algorithm, which is used for generalizing the expert scoring in the process of comprehensive evaluation through intelligent learning and calculating the predicted value of evaluation rapidly. When it comes to evaluating other similar problems, it only needs to input the indicator data vector of the evaluated objects, which helps achieve the automatic operation and rapid evaluation through intelligent calculation.
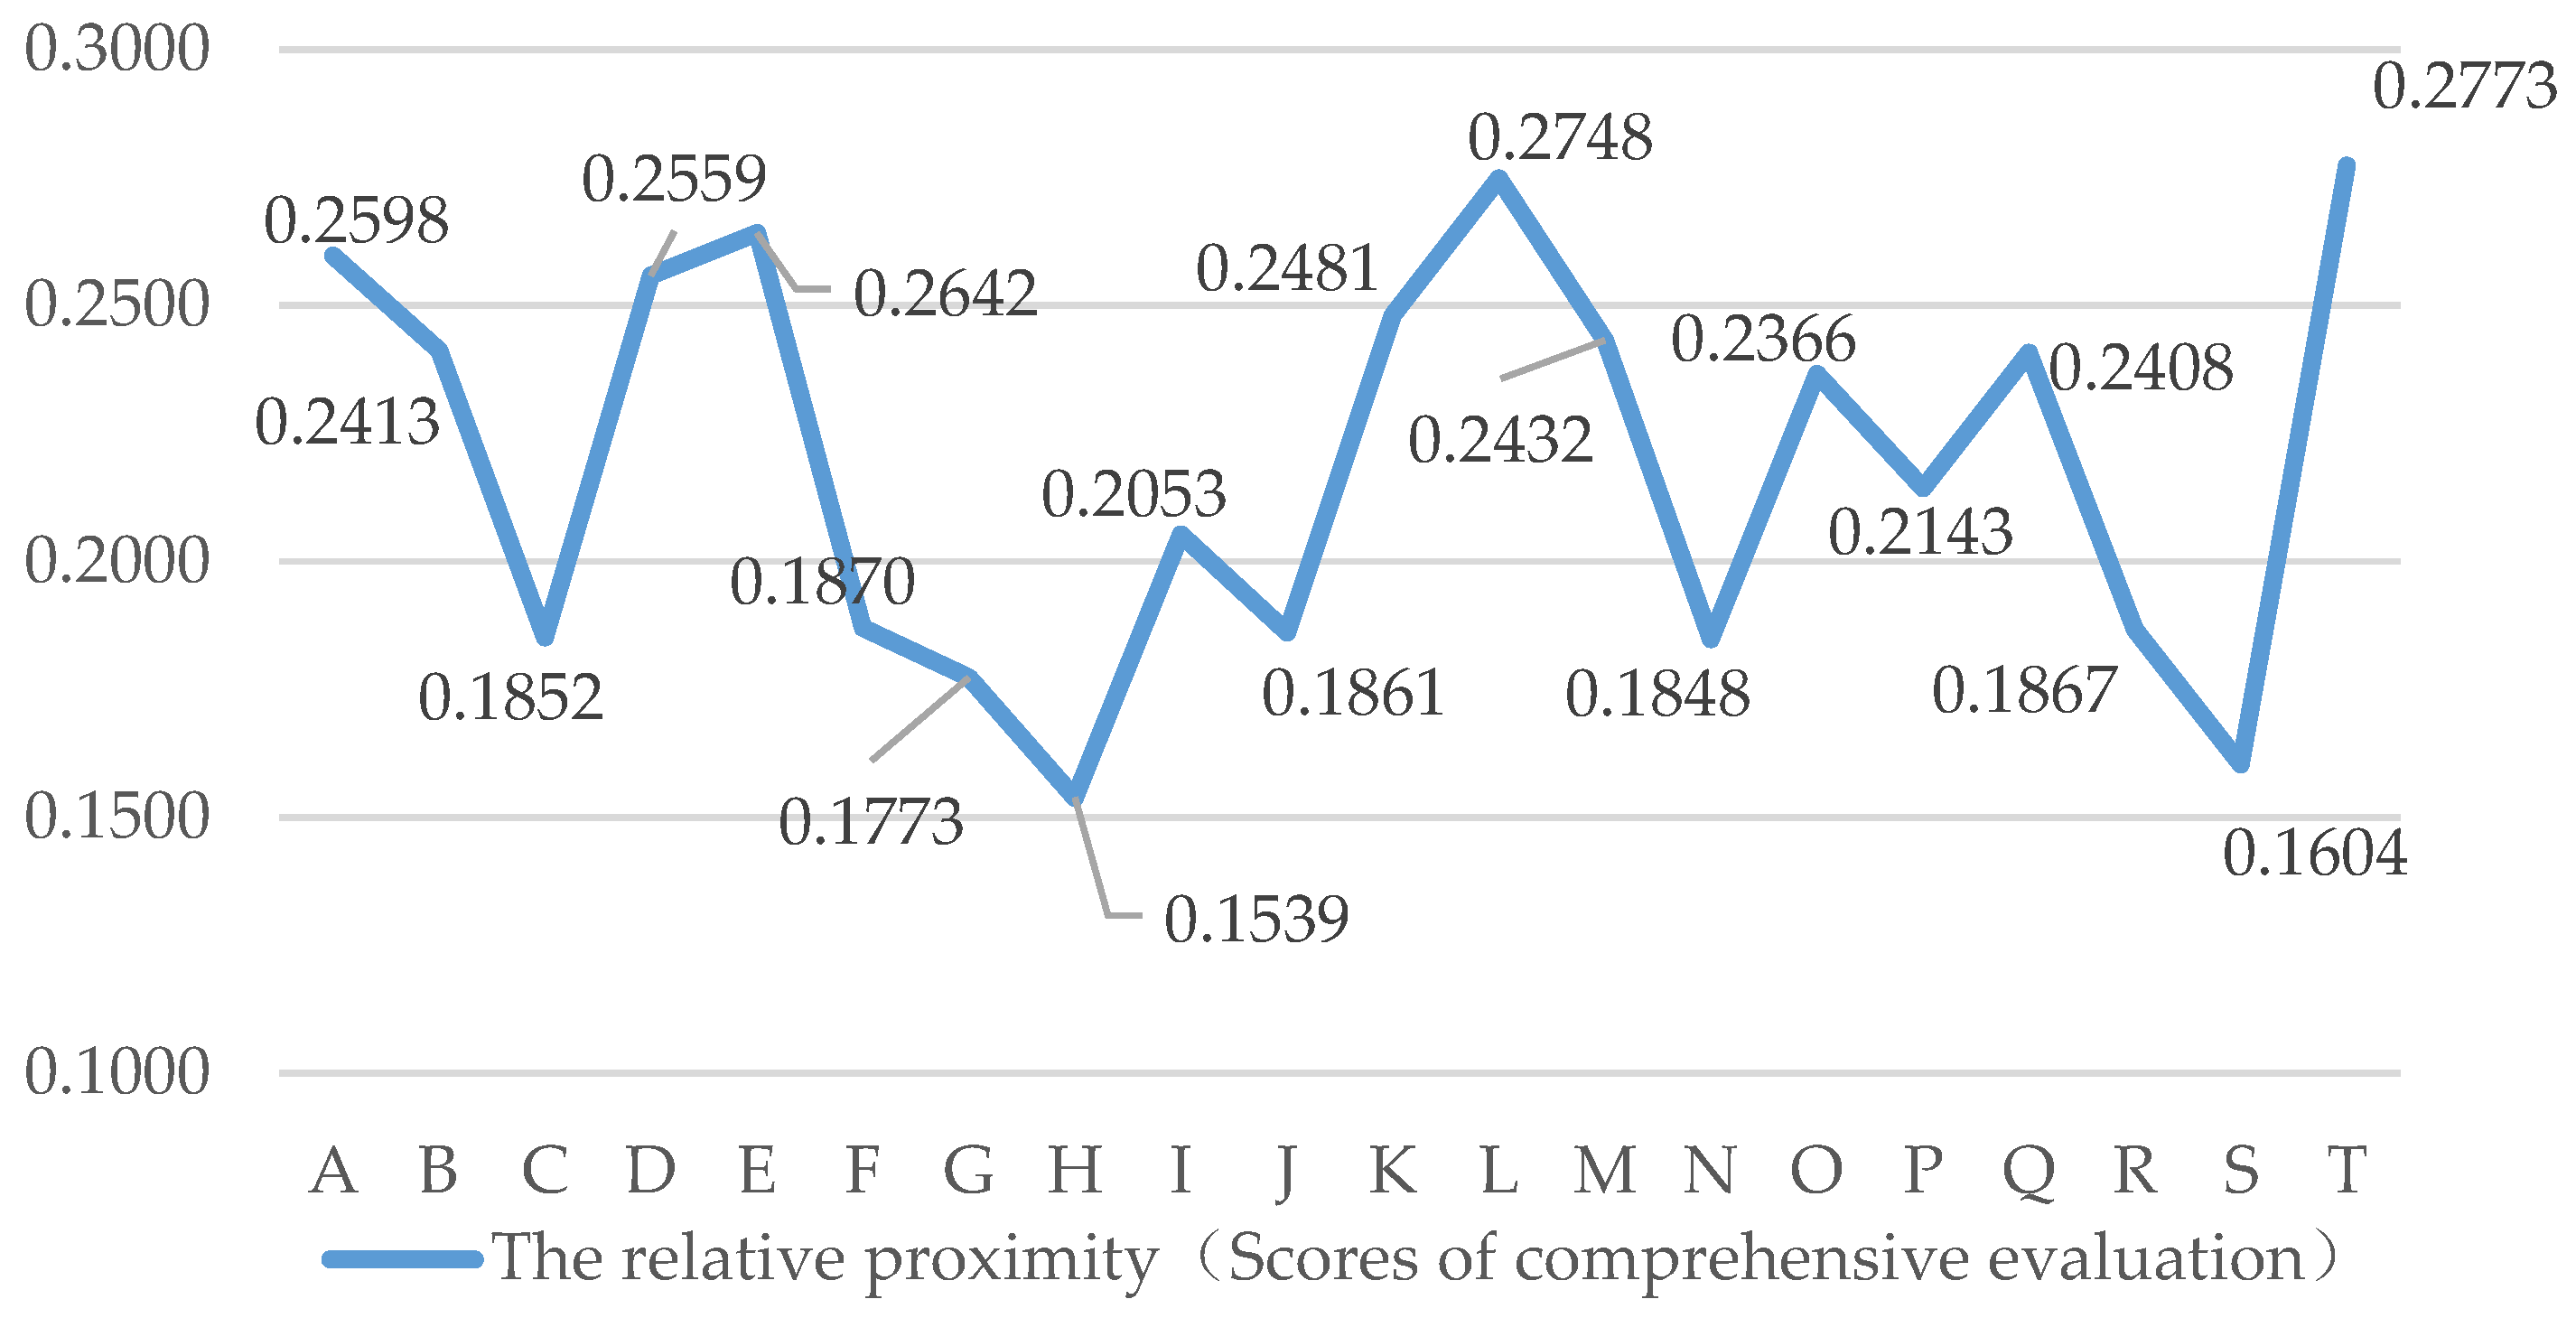
The main content of this paper is divided into six sections as follows: The first section takes the operating efficiency of electricity retail companies as the general evaluation target and puts forward an operating efficiency evaluation indicator system from the aspects of financial income, production and operation, marketing level, internal management level and social benefit, in which indicators are classified based on different characteristics firstly. Qualitative indicators are scored by a certain number of experts and then indicators are standardized at last. The second section is the research of comprehensive evaluation basic theory and the construction of comprehensive evaluation model of operating efficiency. The entropy weight method is applied to empower the indicators objectively. Then the improved TOPSIS method is used to solve the reverse problem in multi-objective evaluation and calculate the relative proximity. Finally, the ranking of the operating efficiency of electricity retail companies can be obtained on the basis of the relative proximity. In the third section, based on the improved TOPSIS method, the LSSVM intelligent algorithm is introduced to the comprehensive evaluation, which can generalize the expert scoring process in the subjective empowerment and achieve the fast calculation to obtain the predicted value of comprehensive evaluation. Next, the modified ant colony algorithm is applied to optimize two parameters of LSSVM; after that, the classification accuracy is improved. The fourth section combines the improved TOPSIS method and LSSVM optimized by modified ant colony algorithm and constructs the comprehensive evaluation model for operating efficiency of electricity retail companies. The fifth section adopts a practical example to prove that the improved TOPSIS method and LSSVM optimized by modified ant colony algorithm proposed in this paper can evaluate the operating efficiency of electricity retail companies of power grid enterprises with comprehensiveness, scientificity and validity. The sixth section draws conclusions based on the above researches.

2. Construction of the Operating Efficiency Evaluation Indicator System of Electricity Retail Companies and Standardization of Evaluation Indicators

In recent years, the reform of the electricity market has been carried out in China, and power grid enterprises and other types of enterprises in the electricity industry have set up independent electricity retail companies to enter the sales side of the electricity market. The construction of a scientific and reasonable operating efficiency evaluation indicator system, which is beneficial to help understand the real operation status and judge advantages and disadvantages for electricity retail companies, can provide a reference for decision-making in operations, development and support for their sustainable development in the competitive environment.

2.1. Construction of the Operating Efficiency Evaluation Indicator System of Electricity Retail Companies

In this paper, the indicators of operating efficiency with a view to sustainability for the comprehensive evaluation of electricity retail companies are selected on the basis of consulting a large amount of literature. In addition, the evaluation indicator system for operating efficiency is finally set up by consulting experts several times anonymously.
Taking the operating efficiency as the total evaluation target and a three-level comprehensive evaluation indicator system, based on the basic principles of indicator system and the actual operation of electricity retail companies, it is constructed from the five dimensions of financial income, production and operation, marketing level, internal management level and social benefit, containing 5 first-level indicators, 12 second-level indicators and 31 third-level indicators. The three-level evaluation indicator system for operating efficiency of electricity retail companies is constructed as shown in Figure 1.

2.1.1. Financial Income

Financial income is the most important manifestation of the sales performance of electricity retail companies, which reflects the companies’ profitability and solvency. Decision-makers can formulate the operation and development mode and implement the corresponding risk control strategy for the future based on the performance of financial income. The financial income of electricity retail companies is evaluated from two dimensions in this paper: debt-paying ability and profitability. Then six specific third-level indicators are determined, containing asset liability ratio, current ratio, quick ratio, capital profit margin, profit margin and cost profit margin.

2.1.2. Production and Operation

The production and operation of an electricity retail company is a series of activities around the production of electric products from production to end users. A clear understanding of the production and operation can grasp the core competitiveness, which is conducive to achieving sustainable development of electricity retail companies in the process of electricity market reform. The production and operation of electricity retail companies is evaluated from three dimensions in this paper: innovation ability, science and technology development ability, and technology service ability. Then nine specific third-level indicators are determined, containing innovation input–output ratio, innovation awareness of enterprises, science and technology input–output ratio, proportion of highly educated employees, application level of information technology, network loss rate, voltage qualification rate, power supply reliability and frequency qualification rate.

2.1.3. Marketing Level

The sales side of the electricity market has been gradually liberalized, in which diversified retail companies are formed to intensify the competition in the sales side market. The ability to access customer resources and gain market share is closely tied to the level of marketing. Therefore, decision-makers can take more effective marketing measures to develop rational development strategies by means of analyzing existing customer relationships and the current sales level. The marketing level of electricity retail companies is evaluated from two dimensions in this paper: sales ability and customer relationship management capability, and four specific third-level indicators are determined, containing electricity sales, market share, customer loyalty and customer satisfaction.

2.1.4. Internal Management Level

The level of internal management is a powerful support for enterprises of the electricity industry to achieve strategic transformation under the background of the new reform of electricity market. Also, the evaluation of internal management level from the aspects of internal culture, system, human resources and organizational structure, helps to achieve the sustainable development of electricity retail companies. The internal management level is evaluated from two dimensions in this paper: culture condensation ability and basic management ability, and seven specific third-level indicators are determined, containing organization, the degree of employees’ participation in decision-making, institutional implementation capacity, safety quality management, human resources management, basic materials management and business management.

2.1.5. Social Benefit

Contemporary enterprise spirit pays attention to the relationship between enterprises and society. Under the background of electricity market reform and the “thirteenth five-year plan”, it is of great importance for electricity retail companies to have harmonious coexistence with the environment and keep an eye on society, which makes progress in continuous development in the process of industry transformation. The social benefit of electricity retail companies is evaluated from three dimensions in this paper: environmental coordination ability, employment-provided ability and brand communication ability. Five specific third-level indicators are also determined, containing pollutant emission reduction, acceptance of new energy resources, employment opportunities for employees, brand image and brand awareness.

2.2. Classification and Consistent Process of Operating Efficiency Evaluation Indicators

2.2.1. Qualitative and Quantitative Indicators

From the above evaluation indicator system for operating efficiency of electricity retail companies, the types of indicators are divided into qualitative and quantitative indicators. On the basis of the consultation and feedback of the experts’ opinion by the Delphi method [32,33], the detailed classification of the third-level indicators is determined, as shown in Table 1 below.

2.2.2. Indicators of Benefit Type, Interval Type and Cost Type

It is usually necessary to standardize the evaluation indicators before assessing the operating efficiency of electricity retail companies, and there are some differences in the treatment methods of different types of evaluation indicators. The larger the indicator value, the better the state referring to the benefit type indicators. Similarly, we can see the definition of interval type and cost type indicators. These three types are often converted into the same type in the process of comprehensive evaluation [32]. In the above comprehensive evaluation indicator system, asset liability ratio is an interval type indicator, network loss rate is a cost type indicator and the others are the benefit ones.

2.3. Standardization of Operating Efficiency Evaluation Indicators

Due to the differences in the units of measurement, economic meaning and impact of the evaluation targets, we need to standardize the evaluation indicators in order to ensure that the final results of the comprehensive evaluation are scientific, comprehensive and reliable.
It is necessary to quantify the qualitative indicators firstly before standardization of the evaluation indicators and the expert scoring method is applied to quantify the qualitative indicators above in this paper. The expert scoring method is to select a certain number of experts and seek advice anonymously. Experts have their own independent evaluation of indicators in accordance with certain scoring criteria. Finally, the quantitative estimation of qualitative indicators is carried out based on the synthesis and statistic treatment of the experts’ opinions [32].
Supposing that the number of invited authoritative experts is M , in accordance with certain scoring criteria, the score of qualitative indicator i of electricity retail company t graded by the expert k independently is S t i k . Finally, the score of qualitative indicator i qualified by all experts is as follows:
S t i = 1 M k = 1 M S t i k
The consistent process of interval type and cost type indicators is conducted after quantifying the qualitative indicators. The consistent process of translating other types into the benefit type indicators is as follows:
For the interval type indicators, the consistent process is as shown in Equation (2):
x i j = { 1 q 1 x i j 0 max { q 1 d l , d u q 2 } , x < q 1 1 x i j 0 q 2 max { q 1 d l , d u q 2 } , x > q 2 , x [ q 1 , q 2 ]
where x i j 0 is the initial value of indicators, [ q 1 , q 2 ] is the optimal reasonable range, d l is the allowed lower limit and d u is the allowed upper limit of the interval type indicators.
For the cost type indicators, the consistent process is as shown in Equation (3):
x i j = 1 x i j 0
where x i j 0 is the initial value of the indicators.
After the quantification of qualitative indicators and the consistent process, the standardization of all the evaluation indicators is as follows:
x i j = x i j i = 1 m x i j 2 , i = 1 , 2 , , m ; j = 1 , 2 , , n
where m and n are the number of evaluation objects and evaluation indicators, respectively.

3. Comprehensive Evaluation for Operating Efficiency of Electricity Retail Companies Based on the Improved TOPSIS Method

The improved TOPSIS method based on the entropy weight method is used to assess the indicator system synthetically after the objective empowerment of indicators. The relative proximity, reflecting the results of comprehensive evaluation for operating efficiency, is finally determined by calculating the distance between the evaluated objects and the absolute positive and negative ideal solutions.

3.1. Empowerment of Operating Efficiency Evaluation Indicators Based on the Entropy Weight Method

The empowerment of indicators mainly includes subjective and objective weighting methods. Subjective weighting methods include analytic hierarchy process, expert scoring method, ordinal relationship method, matter element analysis method, etc.; objective weighting methods include entropy weight method, principal component analysis method and variation coefficient method, etc. The objective weighting methods empower the indicators based on the objective laws of data, which can objectively reflect the relative importance of an indicator in the overall evaluation system. The entropy weight method is widely used in multi-object and multi-indicator comprehensive evaluation and is suitable for the determination of indicator weights in any evaluation problem. Entropy is a measure of uncertain information. The smaller the entropy, the greater the amount of information provided by the indicator. A constructed matrix is built by means of the entropy weight method in this paper and the entropy value is used to measure the amount of information [32,34]. The weights of operating efficiency indicators of electricity retail companies can be obtained through the calculation of the information entropy, which can eliminate subjectivity of the empowerment and reflect the orderliness of data. The empowerment of evaluation indicators based on the entropy weight method is as follows:
  • Construction of standardized judgment matrix
    Supposing that the number of electricity retail companies for comprehensive evaluation is m and the number of indicators is n , the standardized judgment matrix X constructed by standardized data is as follows:
    X = ( x i j ) m × n , i = 1 , 2 , , m ; j = 1 , 2 , , n
  • Calculation of the information entropy of each indicator
    H j = k i = 1 m f i j l n f i j
    f i j = x i j i = 1 m x i j
    k = 1 ln m
    where H j is the information entropy.
  • Empowerment of indicators
    w j = 1 H j j = 1 n ( 1 H j )
    where 0 w j 1 , j = 1 n w j = 1 .

3.2. Improved TOPSIS Method

The meaning of comprehensive evaluation function is sometimes not clear based on principal component analysis method, and subjectivity and indicators are not compatible in the matter element analysis method. Therefore, we choose TOPSIS method to evaluate, which is widely used in comprehensive evaluation for the overall efficiency and has no special requirements for sample data. The traditional TOPSIS method calculates the proximity between the evaluated objects and ideal solutions by approximating the positive and negative ideal solutions. It is considered that the optimal result is the time when it is the nearest to the positive ideal solution and the farthest from the negative ideal solution. Above that, objects for comprehensive evaluation are ranked [32,35,36]. However, in the comprehensive evaluation of multi-object and multi-attribute, the traditional TOPSIS method has the reverse problem in most cases [37,38,39], namely, the changes of ideal solutions or weights of indicators can lead to the changed ranking results, which can even affect correctness of future decision-making. Therefore, the improved TOPSIS method is applied to make comprehensive evaluation for operating efficiency of electricity retail companies, which can eliminate the reverse problem and provide scientific and reasonable reference for electricity retail companies to formulate the future operation and development modes. The improved TOPSIS method is to redefine the positive and negative ideal solutions, which considers that both positive and negative solutions have their own absolute state and that the evaluated object is always in a state between the absolute positive and negative ideal solutions. In this paper, the evaluated operating efficiency of electricity retail companies cannot be higher than the absolute positive ideal and cannot be lower than the absolute negative ideal solution. The determination of absolute positive and negative ideal solutions is often based on the actual situation of the specific target or determined by experienced experts.
The comprehensive evaluation for operating efficiency of electricity retail companies based on the improved TOPSIS method is as follows:
  • Construction of weighted judgment matrix
    R = ( r i j ) m × n
    r i j = w j · x i j , i = 1 , 2 , , m ; j = 1 , 2 , , n
    where r i j is the element of the weighted judgment matrix R .
  • Determination of the absolute positive and negative solutions
    The absolute positive ideal solution is as shown in Equation (12):
    X + = ( r 1 + , r 2 + , r 3 + , , r m + )
    The absolute negative ideal solution is as shown in Equation (13):
    X = ( r 1 , r 2 , r 3 , , r m )
    Since the original data used for comprehensive evaluation have been standardized, the absolute positive and negative ideal solutions are often set as follows:
    X + = ( 1 , 1 , , 1 ) T
    X = ( 0 , 0 , , 0 ) T
  • Calculation of the Euclidean distance between the operating efficiency of electricity retail companies and the absolute positive and negative ideal solutions
    The Euclidean distance between the operating efficiency of electricity retail companies and the absolute positive solution is as shown in Equation (14):
    D + = j = 1 n w j ( X + x i j ) 2
    The Euclidean distance between the operating efficiency of electricity retail companies and the absolute negative solution is as shown in Equation (15):
    D = j = 1 n w j ( X x i j ) 2
  • Calculation of the relative proximity of the operating efficiency
    C i = D D + + D
  • Sequencing of the operating efficiency of electricity retail companies
    The value of relative proximity is the score of comprehensive evaluation. The ranking result of operating efficiency of electricity retail companies is based on the value of C i , namely, the larger the C i value, the better the operating efficiency.

4. Least Square Support Vector Machine and Optimization by Modified Ant Colony Algorithm

4.1. Least Square Support Vector Machine

Based on the evaluation of the improved TOPSIS method, the least square support vector machine (LSSVM) in the intelligent algorithm is introduced to the comprehensive evaluation for operating efficiency of electricity retail companies. The machine outputs the predicted results of operating efficiency of electricity retail companies with a small error.

4.1.1. The Basic Theory of Least Square Support Vector Machine

Support vector machine (SVM) is a kind of machine learning method suitable for small capacity samples, which is based on the Vapnik-Chervonenkis dimension theory and minimization of structure risk. SVM transforms the low dimensional space to the high dimensional feature space through the nonlinear transformation of kernel mapping, and solves the linear separable problem with inequality constraints to achieve the global optimization [32,40,41]. LSSVM is in the form of quadratic loss function, which transforms inequality constraints into quadratic programming linear problems with equality constraints [42]. The loss function in the optimization target of LSSVM is the squares error summed function, which has the advantage of fast calculation.

4.1.2. Solving Process of Least Squares Support Vector Machine

The process of solving the quadratic linear programming problem by means of LSSVM is as follows:
  • Supposing that the number of sample data is m , { x i , y i } i = 1 m is the sample set, x i is the input vector and x i R n , y i is the output vector and y i R .
  • The sample data of low dimensional space are mapped into high dimensional feature space and the linear regression is carried out. The regression function is established as follows:
    f ( x ) = ω T φ ( x ) + b
    where φ ( x ) is the nonlinear function, ω T is the vector made up of weights and b is the bias parameter.
  • The objective function optimized by LSSVM is established as follows:
    m i n J ( ω , ξ ) = 1 2 ω T ω + 1 2 C i = 1 m ξ i 2
    s . t . y i = ω φ ( x ) + b + ξ i , i = 1 , 2 , , m
    where C is the error penalty coefficient and ξ i is the relaxation variable.
  • The Lagrange function is established to solve the objective function as follows:
    L ( ω , b , ξ , a ) = 1 2 ω T ω + 1 2 C i = 1 m ξ i 2 i = 1 m a i { ω T φ ( x i ) + b + ξ i y i }
    where a i is the Lagrange multiplier corresponding to the data in the sample set.
According to the Karush-Kuhn-Tucker optimization conditions, there are simultaneous equations as follows:
{ L ω = 0 ω = i = 1 m a i φ ( x i ) L b = 0 ω = j = 1 m a i = 0 L ξ i = 0 a i = C ξ i L a i = 0 ω T φ ( x i ) + b + ξ i y i
The following results can be obtained by the elimination of elements in Equation (20).
[ 0 Q T Q K + C 1 I ] [ b A ] = [ 0 Y ]
where Q = [ 1 , 1 , , 1 ] T , A = [ a 1 , a 2 , , a m ] T and Y = [ y 1 , y 2 , , y m ] T .
The kernel function is defined as shown in Equation (22) according to the M e r c e r condition, and the radial basis kernel function as shown in Equation (23) is selected as the kernel function.
K ( x i , x j ) = φ ( x i ) T φ ( x j )
K ( x , x j ) = e x p ( x x j 2 2 σ 2 )
where σ is the width of K ( x , x j ) .
Finally, the nonlinear predictive function on the basis of LSSVM is established as follows:
f ( x ) = i = 1 m a i   K ( x , x j ) + b
LSSVM with the radial basis kernel function only needs to determine two parameters σ and c , which greatly reduces the search space of parameters and speeds up the modeling. The classification accuracy of LSSVM can be further improved through the optimization of parameters. In this paper, modified ant colony algorithm is selected to complete the optimization process.

4.2. Modified Ant Colony Algorithm

4.2.1. The Basic Theory of Ant Colony Algorithm

Ant colony algorithm is an algorithm that simulates ant foraging behavior [43]. The idea is that ants search for food in places with high pheromones based on the perception of pheromones during the ants foraging and return process. The parameters in the network are sorted and set to a random non-zero number to form a set. Each ant chooses an element arbitrarily from the set and regulates the pheromones [32]. When the selection of all elements in the set is completed by the ant colony, the ant is expected to arrive at the food source and return to the colony on the original path. The pheromones are left on the discrete nodes after the finished optimization through the ants foraging. The above process is repeated till all the ants converge to the same shortest path and the parameters in the network reach the optimal value at this time.

4.2.2. Modification of Ant Colony Algorithm

The optimization objects of traditional ant colony algorithm are discrete problems, and it is easy to fall into the local optimum [44,45,46]. Therefore, we need to modify the algorithm when used for the continuous optimization problems. The modified ant colony algorithm (MASO) is that the ant colony judges the traveling route by the pheromones in a certain area instead of pheromones left at the discrete nodes. The certain area is the alternative solution space, the pheromones that may be left on various paths are limited to a maximum and minimum interval.
The optimization process based on MASO is as follows:
  • Determine the initial location and initial pheromones of the ant colony
    Supposing that the number of ants is N and the ants are distributed in the solution space randomly at the beginning, X i ( i = 1 , 2 , , N ) is the initial position of the ant colony and x i 1 , x i 2 , , x i d is the initial position of each ant. The initial pheromone of ant i is as follows:
    Δ τ ( i ) = exp ( f ( X i ) )
    where f ( X i ) is the fitness. It can be seen from Equation (25) that 0 < Δ τ ( i ) 1 when f ( X i ) 0 and Δ τ ( i ) 0 when f ( X i ) + . f ( X i ) is adjusted as follows:
    f ( X i ) = { f ( X i ) a v g , a v g > a v g 0 f ( X i ) , a v g a v g 0
    where f ( X i ) is the adjusted fitness and there is a v g = f ( X l ) ¯ , ( 1 × 10 3 a v g 0 < + ) in Equation (26). Finally, the initial pheromone of ant i is determined as follows:
    Δ τ ( i ) = exp ( f ( X i ) )
  • Searching optimization of the ants
    After finishing a foraging search process, the ants will judge the next moving direction according to certain rules. In this paper, there are two types of movement rules to complete the next foraging search.
    (i)
    Global search with a large step length
    Determine the next target individual by dynamic random extraction at first. Except for the optimal ant obtained by the last iterative calculations, the remaining ants in the colony are moving to the selected target. The searching optimization of the ants based on the global search with a large step length is as follows.
    Supposing that the number of the ants in the colony is N and the number of the randomly selected ants is p :
    p = r × N
    r = i i e r , m a x + i i e r 2 i i e r , m a x
    where r is the dynamic extraction ratio, i i e r is the current number of iterations and i i e r , m a x is the maximum number of iterations.
    Then the next moving target is the object with most pheromones from the randomly selected ants above, and the optimal moving target is determined as follows:
    X o b j = { X j , τ ( X i ) < τ ( X j ) m a x X b e s t , τ ( X i ) τ ( X j ) m a x , j = 1 , 2 , , p
    where X b e s t is the optimal ant obtained by the last iterative calculations. The greater the concentration of pheromones at the target ant, the larger the attractiveness of the other ants in the ant colony.
    The movement rule that ant i is moving to the target is as follows:
    X i = ( 1 λ ) X i + λ X o b j , ( 0 < λ < 1 )
    (ii)
    Neighborhood search with a small step length
    The optimal ant obtained by the last iterative calculations completes the searching optimization based on the neighborhood search with a small step length, and the searching rule of the optimal ant is as follows:
    X b e s t = { X i , f ( X i ) < f ( X b e s t ) X b e s t , f ( X i ) f ( X b e s t )
    X i = X b e s t ± h × δ
    h = h m a x ( h m a x h m i n ) × i i e r i i e r , m a x
    where δ = 0.1 · r a n d ( ) , h is the dynamically changing parameter. h m a x and h min are given constants and always there is h min = 0.1 h max . Positive and negative signs in Equation (33) are determined as follows:
    X b e s t = X b e s t ± ( X b e s t × 0.01 )
    The positive sign is obtained when f ( X b e s t ) < f ( X b e s t ) and the negative sign is obtained when f ( X b e s t ) f ( X b e s t ) .
  • Update the changed pheromones
    The concentration of pheromones at the target will change after finishing the above searching optimization process, and the updated pheromones are shown as follows:
    τ ( i ) = τ ( i ) ρ + Δ τ ( i )
    where ρ is the residual coefficient of pheromones and ρ ( 0 , 1 ) .
The modified ant colony algorithm helps find the global optimum. In the algorithm, all variables are optimized at the same time and the solution space of the optimal path is limited by the last iteration, which can achieve fast calculation to find the global optimum [47].

4.3. Process of Least Squares Support Vector Machine Optimzed by Modified ant Colony Algorithm

The parameters needed to be optimized in LSSVM are the error penalty coefficient C and the kernel function width σ [48]. Iterative computation and optimization of these two parameters based on MASO can enhance the learning and generalization ability of LSSVM.
The objective function optimized by the MASO method is as follows:
m i n f ( C , σ ) = i = 1 M ( y i y i ^ ) 2
s . t .   C [ C m i n , C m a x ]
σ [ σ m i n , σ m a x ]
where y i is the output value corresponding to the i th historical sample data and y i ^ is the output predicted value corresponding to the i th historical sample data.
The process of LSSVM optimized by MASO (MASO-LSSVM) is as shown in Figure 2.

5. Construction of the Comprehensive Evaluation Model on Operating Efficiency of Electricity Retail Companies Based on the Improved TOPSIS Method and LSSVM Optimized by Modified Ant Colony Algorithm

In this paper, the improved TOPSIS method is firstly used to evaluate the operating efficiency of electricity retail companies and the relative proximity is obtained as the value of comprehensive evaluation. After that, the intelligent algorithm of LSSVM is introduced to generalize the expert scoring in the comprehensive evaluation based on the improved TOPSIS method, in which the predicted comprehensive evaluation value can be calculated quickly by entering the indicator data automatically. Meanwhile, the classification accuracy of LSSVM can be improved through the optimization of parameters based on modified ant colony algorithm. On this basis, the comprehensive evaluation model based on the improved TOPSIS method and MASO-LSSVM proposed in this paper can improve the effectiveness of evaluation results, which provides a more meaningful reference for the operation and development of electricity retail companies. In addition, it also provides the comprehensive evaluation for operating efficiency of electricity retail companies with a new idea.
Steps of the construction of the comprehensive evaluation model are as follows:
  • Construct the operating efficiency evaluation indicator system.
  • Standardize the data of evaluation indicators. Firstly, the expert scoring method is used to quantify the qualitative indicators. Then the interval type and cost type indicators are converted into the benefit type indicators. Finally, all the indicators are standardized.
  • Give weights to the indicators by the entropy weight method.
  • The relative proximity of object is calculated based on the improved TOPSIS method. The standardized judgment matrix is constructed by multiplying the weights of indicators and the standardized data, and then the absolute positive and negative ideal solutions are determined to calculate the Euclidean distance between the object and the absolute ideal solutions. Finally, the relative proximity of the operating efficiency is calculated, which is the comprehensive evaluation score.
  • The modified ant colony algorithm is used to optimize the parameters of LSSVM and the optimized intelligent algorithm is used for comprehensive evaluation for operating efficiency.
  • A part of the known comprehensive evaluation scores and the data of the weighted judgment matrix are used as the input of LSSVM to train the machine.
  • The trained LSSVM can be applied to achieve quick calculation of similar projects and input the predicted comprehensive evaluation results with a small relative error.
The construction process of the comprehensive evaluation model for operating efficiency of electricity retail companies based on the improved TOPSIS method and LSSVM optimized by modified ant colony algorithm is as shown in Figure 3.

6. Example Analysis of the Comprehensive Evaluation for Operating Efficiency of Electricity Retail Companies Based on the Improved TOPSIS Method and LSSVM Optimized by Modified Ant Colony Algorithm

In this paper, the number of electricity retail companies for comprehensive evaluation is 20. The evaluation indicator system for operating efficiency is constructed as shown in Figure 1, containing 5 first-level indicators of financial income, production and operation, marketing level, internal management level and social benefit; the number of corresponding second-level indicators is 12, the number of third-level indicators is 31. The comprehensive evaluation for operating efficiency of the 20 electricity retail companies is based on the improved TOPSIS method and the predicted data is based on the LSSVM optimized by modified ant colony algorithm.

6.1. The Comprehensive Evaluation for Operating Efficiency of Electricity Retail Companies Based on the Improved TOPSIS Method

6.1.1. Standardization of Evaluation Indicators

There are 8 experts to score the qualitative indicators with the interval value of [ 1 , 100 ] according to Equation (1). Then the indicators are standardized based on Equation (2) and Equation (3). After the quantification and the consistent process of indicators, the standardized results of raw data are as shown in Table A1.
The standardized judgment matrix is as follows:
X = [ 0.1445 0.2335 0.1915 0.2611 0.1794 0.3165 0.3288 0.2397 0.2950 0.2674 0.2991 0.3240 0.1531 0.2131 0.2777 0.2851 0.2104 0.2398 0.2131 0.2074 0.2226 0.2306 0.2319 0.2202 0.2402 ]

6.1.2. Empowerment of Evaluation Indicators

The standardized judgment matrix is processed based on Equation (5) to Equation (9) and the weights of evaluation indicators are ω = (0.0583, 0.1430, 0.1531, 0.0799, 0.2462, 0.0042, 0.0105, 0.0120, 0.0407, 0.0813, 0.0097, 0.0112, 0.0000, 0.0000, 0.0000, 0.0454, 0.0367, 0.0042, 0.0041, 0.0048, 0.0224, 0.0041, 0.0015, 0.0019, 0.0004, 0.0012, 0.0008, 0.0063, 0.0033, 0.0065, 0.0063), as shown in Table A1.

6.1.3. Calculation of the Euclidean distance between the Electricity Retail Companies and the Absolute Ideal Solutions

The values of the positive and negative ideal solutions are as follows:
X + = ( 1 , 1 , , 1 ) T
X = ( 0 , 0 , , 0 ) T
The results of the Euclidean distance calculated by Equations (14) and (15) are as follows, as shown in Table A2.
D + = (0.7441, 0.7668, 0.8195, 0.7458, 0.8159, 0.8322, 0.8572, 0.7955, 0.8196, 0.7526, 0.7300, 0.7585, 0.8207, 0.7677, 0.7870, 0.7610, 0.8161, 0.8440, 0.7268)
D = (0.2612, 0.2438, 0.1862, 0.2564, 0.2661, 0.1877, 0.1793, 0.1559, 0.2054, 0.1874, 0.2484, 0.2767, 0.2437, 0.1861, 0.2380, 0.2146, 0.2414, 0.1874, 0.1612, 0.2789)

6.1.4. Calculation of the Relative Proximity between the Electricity Retail Companies and the Absolute Ideal Solutions

The results of the relative proximity calculated by Equation (16) are as follows, as shown in Table A2.
C i = (0.2598, 0.2413, 0.1852, 0.2559, 0.2642, 0.1870, 0.1773, 0.1539, 0.2053, 0.1861, 0.2748, 0.2432, 0.2408, 0.1867, 0.1604)

6.1.5. Results of the Comprehensive Evaluation for Operating Efficiency of Electricity Retail Companies

As is shown in Table A2, the relative proximity obtained by the improved TOPSIS method is the comprehensive evaluation scores of electricity retail companies and is ranked on the basis of the numerical values. Finally, the ranking results of operating efficiency of the 20 electricity retail companies are as shown in Table 2 and Figure A1.
Compared with the single-indicator analysis, the improved TOPSIS method in this paper is able to reflect the overall situation more intensively, and the relative proximity helps measure the comprehensive benefit of the evaluated objects. The relative proximity further emphasizes the distance from the absolute negative ideal solution, which ranges from 0 to 1. The smaller the value, the worse the operating efficiency of the corresponding company, and vice versa.
In combination with the standardized data and weights of indicators as shown in Table A1, the relative proximity as shown in Table A2, it can be analyzed that differences of operating efficiency from evaluated electricity retail companies were mainly reflected in the financial benefits, production and operation, and marketing level. Among them, the differences of production and operation are mainly reflected in the status of scientific research and highly educated employees, and the differences of marketing are mainly reflected in electricity sales and market share. It can also be seen from the above that the results of comprehensive evaluation for operating efficiency of the 20 electricity retail companies are obtained based on the improved TOPSIS method, among which company T has the best operating efficiency and company H has the worst operating efficiency.

6.2. The Comprehensive Evaluation for Operating Efficiency of Electricity Retail Companies Based on the Improved TOPSIS Method and LSSVM Optimized by Modified Ant Colony Algorithm

The first 15 electricity retail companies are selected as the training sample set and the sample data of the 15 groups are selected as the input vectors of the comprehensive evaluation model based on the LSSVM optimized by modified ant colony algorithm. The last 5 electricity retail companies are selected as the test sample set and the trained LSSVM is used for the evaluation of the test sample set. The training results and test results are as shown in Table 3 and Table 4 below.
In this paper, mean absolute percentage error (MAPE), mean square error (MSE) and root mean square error (RMSE) are also selected to verify the prediction accuracy of the model further, the test results are as follows in Table 5.
It can be seen from the above that the maximum error is 3.86% and the minimum is 1.92%, and MSE, RMSE and MAPE of the training sample and test sample are all within 3%. The predicted comprehensive evaluation value of operating efficiency through the intelligent learning based on MASO-LSSVM has a small relative error compared with the results calculated by the improved TOPSIS method.
The gradient descent method is used to optimize the parameters of LSSVM in the reference [49], in which, however, lies a disadvantage that it is easy to fall into the local optimum. The adaptive genetic algorithm is applied to optimize the parameters of LSSVM in the reference [50], but the actual optimization is complicated. In this paper, on the basis of the comprehensive evaluation results based on the improved TOPSIS method above, the intelligent algorithm of MASO-LSSVM is applied to the comprehensive evaluation that helps simplify the process of the expert scoring and realize the faster calculation. At present, traditional evaluation methods are combined with intelligent algorithms, which is seldom used for the comprehensive evaluation. Therefore, the algorithm of the improved TOPSIS method and LSSVM optimized by modified ant colony algorithm can provide a new idea and be applied to a large number of similar projects in the comprehensive evaluation, which is conductive to reducing the complexity of the calculation process, achieving a rapid and accurate comprehensive evaluation process and drawing the predicted results with a small relative error.

7. Conclusions

In this paper, from the view of sustainable development and the characteristics of the current electricity market in the context of electricity market reform, the comprehensive evaluation model on operating efficiency of electricity retail companies based on the improved TOPSIS method and LSSVM optimized by modified ant colony algorithm is proposed, which evaluates the operating efficiency of electricity retail companies scientifically. Based on consulting literature and experts’ opinions, the evaluation indicator system for operating efficiency of electricity retail companies is constructed and the entropy method is used to obtain the weights of indicators. Then the improved TOPSIS method is applied to eliminate the reverse problem and calculate the Euclidean distance and relative proximity between the operating efficiency of electricity retail companies and the absolute ideal solutions. Finally, the results obtained by the improved TOPSIS method can reflect the good or bad situation of the operating efficiency. In order to simplify the scoring and calculation process of experts, the LSSVM optimized by modified ant colony algorithm is applied to the comprehensive evaluation. The modified ant colony algorithm helps improve the classification accuracy of LSSVM, the artificial intelligence learns to get expert knowledge so as to generalize the expert scoring in the comprehensive evaluation based on the improved TOPSIS method, which achieves the purpose of rapid calculation and support of decisions for electricity retail companies. The algorithm for comprehensive evaluation proposed in this paper is universal, in which the improved TOPSIS method can be widely used in comprehensive evaluation in most cases. In addition, combined with the LSSVM optimized by modified ant colony, the predicted value of comprehensive evaluation with small error can be obtained after inputting indicator data vector of evaluated objects, which realizes automatic operation and rapid evaluation and provides a new idea of the comprehensive evaluation for similar problems.

Acknowledgments

1. The paper is supported by the Natural Science Foundation of China (Project No. 71471059). 2. The paper is supported by “the Fundamental Research Funds for the Central Universities (2018ZD14)”. 3. The paper is supported by the 111 Project (B18021).

Author Contributions

In this research activity, all the authors were involved in the data collection and preprocessing phase, model constructing, empirical research, results analysis and discussion, and manuscript preparation. All authors have approved the submitted manuscript.

Conflicts of Interest

The authors declare no conflict of interest.

Appendix A

Table A1. The data standardization results.
Number of IndicatorsElectricity Retail CompaniesWeights of Indicators
ABCDEFGHIJ
10.14450.23350.19150.26110.20760.19240.24820.20010.22240.29640.0583
20.31650.32880.23970.29500.25820.14750.15060.09530.20900.16600.1430
30.29910.32400.15310.27060.26700.16020.13170.09970.22070.17090.1531
40.28510.21040.23980.21310.11580.25040.27340.20130.20880.21310.0799
50.25540.17670.13580.26490.31530.16500.10550.08860.18780.12560.2462
60.22650.21230.21590.23780.23970.21760.20080.21030.21870.21020.0042
70.24170.23500.22110.23850.22470.20330.22980.22190.18560.20060.0105
80.24460.20930.22620.22660.21540.18560.21240.22810.19370.20470.0120
90.27140.23540.17770.24500.29300.21380.19690.16090.18490.22580.0407
100.21380.16800.15090.24610.27070.18650.15410.18440.22730.16900.0813
110.18480.21510.20950.23490.22480.19640.23850.23610.22610.20390.0097
120.20420.20940.23720.25170.23110.21440.18850.23490.24320.20590.0112
130.22300.22370.22370.22220.22250.22290.22290.22380.22410.22380.0000
140.22270.22300.22360.22340.22360.22370.22380.22380.22360.22360.0000
150.22280.22380.22350.22370.22370.22330.22350.22360.22380.22380.0000
160.21380.19670.17740.21960.30360.24280.24860.22580.18940.21880.0454
170.22650.22050.17520.25070.26580.22950.23250.22650.16010.23560.0367
180.22960.23930.21860.22580.23960.22260.22420.22990.21090.22030.0042
190.21750.23140.21960.22230.24090.21210.23910.23150.21970.20850.0041
200.20820.22540.21630.23070.23580.20320.23160.21790.22020.20490.0048
210.22260.19220.23090.14680.25170.19700.21260.23740.20930.21860.0224
220.23340.21790.22440.23920.21460.23080.22740.23740.22410.21830.0041
230.21120.22240.21770.22000.23090.21590.21190.22830.21990.21880.0015
240.21620.22520.22280.20830.23460.23980.20860.22980.22420.22670.0019
250.22460.22200.22550.22150.22750.22800.22040.22450.22630.21710.0004
260.22300.23080.21700.21260.21730.22520.23290.22180.22470.22800.0012
270.22220.22660.21990.22480.22170.22530.21710.22630.22220.22280.0008
280.23810.22380.23230.19840.21770.22660.23610.22200.21390.24140.0063
290.21840.22460.23500.20210.21000.22960.22570.22210.22370.23530.0033
300.22700.23130.23650.22070.21140.21690.23200.20230.21030.24660.0065
310.22260.23060.23190.22020.20820.21720.23610.20520.21390.25120.0063
Number of IndicatorsElectricity Retail CompaniesWeights of Indicators
KLMNOPQRST
10.27570.19270.25400.29990.17750.20870.19280.23420.18370.17940.0583
20.22430.25510.22740.15980.25510.17520.21820.16290.14750.26740.1430
30.23850.27770.25280.16380.26350.19580.23500.15670.13170.27770.1531
40.27830.29500.17860.22960.12930.25630.21650.19130.18210.20740.0799
50.25410.34100.27090.13030.27720.22170.26530.15540.11340.33720.2462
60.21920.23700.22810.21140.23010.23340.23940.22420.21990.23430.0042
70.24490.25490.23980.19870.22450.20940.21970.22680.20500.23270.0105
80.26150.25010.24820.20950.21880.21000.23270.23560.22690.21670.0120
90.24980.20900.26660.17530.21140.19690.21860.25700.20180.22820.0407
100.27870.29010.26200.20830.17890.24540.30400.19870.16360.26820.0813
110.21600.24440.23360.21550.20980.22780.25860.22720.22150.23490.0097
120.21170.22480.23460.24630.24080.20820.20300.19630.23520.23620.0112
130.22370.22410.22390.22380.22400.22410.22410.22390.22400.22410.0000
140.22360.22370.22380.22380.22380.22380.22360.22380.22370.22370.0000
150.22350.22350.22370.22370.22380.22370.22380.22350.22380.22380.0000
160.23350.18440.19600.18280.21570.21220.24280.20220.18320.32070.0454
170.22950.18120.21740.18720.22050.22050.23250.22350.18120.30800.0367
180.22500.21430.20470.21710.23510.22420.21110.23290.20110.24040.0042
190.22210.21510.20650.22240.22930.22230.21480.24540.20920.23700.0041
200.22650.21720.21320.23300.23690.24820.21090.22130.22470.23970.0048
210.22320.24420.23220.23820.26910.22690.20880.21750.22210.24310.0224
220.21030.24390.21010.22370.23440.21160.20460.21470.21250.23340.0041
230.22220.23330.21870.22190.23340.22800.23100.22740.23060.22650.0015
240.22240.22260.22460.22660.23030.21910.21640.22100.22420.22640.0019
250.22540.22840.22280.22560.22210.22630.21720.21640.22450.22540.0004
260.22220.22960.23330.21640.22550.21330.21860.22450.22810.22600.0012
270.21990.22740.23620.21260.22530.22840.22120.22380.22700.22050.0008
280.22400.21060.20380.20030.21250.22180.22550.24180.24800.22520.0063
290.23090.21590.21840.21660.20670.23200.23110.24210.22260.22500.0033
300.23090.21360.19830.20800.22070.21430.22040.24350.24540.23370.0065
310.22960.21650.20320.21110.21650.21120.21420.23670.24770.24020.0063
Table A2. The results of the comprehensive evaluation based on improved TOPSIS method.
Electricity Retail CompaniesAbsolute Positive Ideal SolutionsAbsolute Negative Ideal SolutionsRelative Proximity
A0.74410.26120.2598
B0.76680.24380.2413
C0.81950.18620.1852
D0.74580.25640.2559
E0.74120.26610.2642
F0.81590.18770.1870
G0.83220.17930.1773
H0.85720.15590.1539
I0.79550.20540.2053
J0.81960.18740.1861
K0.75260.24840.2481
L0.73000.27670.2748
M0.75850.24370.2432
N0.82070.18610.1848
O0.76770.23800.2366
P0.78700.21460.2143
Q0.76100.24140.2408
R0.81610.18740.1867
S0.84400.16120.1604
T0.72680.27890.2773
Figure A1. The relative proximity of operating efficiency of the 20 electricity retail companies.
Sustainability 10 00860 g0a1

References

  1. Gao, Z. Research on the Benefit Evaluation System of Small and Medium Enterprise Based on Sustainable Development. Master’s Thesis, China University of Petroleum, Shandong, China, 2010. [Google Scholar]
  2. Zhou, Y. Study on the TOPSIS Method in Multiple Attribute Decision Making. Master’s Thesis, Wuhan University of Science and Technology, Wuhan, China, 2009. [Google Scholar]
  3. He, W.; Zhong, F.; Chang, Y. Study on Investment Performance Evaluation of Grid Enterprise. Technol. Econ. 2011, 30, 78–84. [Google Scholar] [CrossRef]
  4. Liu, S.; Yang, C.; Feng, Y.; Pan, B.; Gao, Y. Research and Application of Distribution Grid Investment Effectiveness Evaluation and Decision-making Mode. Power Syst. Prot. Control 2015, 43, 119–125. [Google Scholar]
  5. Juan, L.I.; Xiao-Hui, L.I.; Liu, S.Y.; Zeng, M.; Liu, Z.; Xu, W. Investment Benefit Evaluation for Distribution Network Based on TOPSIS and Grey Correlation Degree. East China Electr. Power 2012, 40, 13–17. [Google Scholar]
  6. Gong, J.; Lei, L.; Minxia, W.U.; Li, C. Comprehensive Evaluation on Power Grid Enterprise Operational Risk Based on TOPSIS Method and Grey Relational Degree. Guangdong Electr. Power 2014, 27, 7–10. [Google Scholar] [CrossRef]
  7. Song, L.; Yang, J. A Method of Full-Scale Comprehensive Evaluation on Operating Efficiency of Electric Power Networks. J. Electr. Power 2015, 30, 268–274. [Google Scholar] [CrossRef]
  8. Zhang, S.M.; Jun, L.I.; Wang, B.Y. Comprehensive Evaluation Model of Grid Corporation Business Risk under the Competitive Electricity Market. Power Syst. Prot. Control 2011, 39, 70–74. [Google Scholar] [CrossRef]
  9. Jin-Chao, L.I.; Jin-Ying, L.I.; Niu, D.X.; Wu, Y.N. Study on the Evaluation Model for the Power Grid Corporation Operation Ability Based on ANP. Power Syst. Prot. Control 2011, 39, 37–43. [Google Scholar] [CrossRef]
  10. Cui, M.; Sun, Y.; Yang, J.; Li, Y.; Wu, W. Power Grid Security Comprehensive Assessment Based on Multi-Level Grey Area Relational Analysis. Power Syst. Technol. 2013, 37, 3453–3460. [Google Scholar]
  11. Mu, Y.; Lu, Z.; Qiao, Y.; Wang, Y.; Huang, H.; Zhou, Q.; Han, J. A Comprehensive Evaluation Index System of Power Grid Security and Benefit Based on Multi-Operator Fuzzy Hierarchy Evaluation Method. Power Syst. Technol. 2015, 39, 23–28. [Google Scholar] [CrossRef]
  12. Jiang, Y.; Wenyun, L.I.; Ying, Z.; Yu, F. Evaluation of Power Quality Performance Based on Rough Set and Evidence Theory. Power Syst. Prot. Control 2015, 43, 1–7. [Google Scholar]
  13. Jiang, S. Fuzzy Comprehensive Evaluation of Electric Power Quality Based on Credibility Theory. Shanghai Meas. Test. 2016, 43, 40–42. [Google Scholar] [CrossRef]
  14. Hongze, L.I.; Guo, S.; Tang, H.; Li, C. Comprehensive Evaluation on Power Quality Based on Improved Matter-Element Extension Model with Variable Weight. Power Syst. Technol. 2013, 37, 653–659. [Google Scholar]
  15. Wang, L.; Wang, Q.; Wu, L.; Wang, P. Power Quality Synthetic Evaluation Based on Principal Component Analysis and Information Entropy. Shangxi Electr. Power 2015, 43, 55–58. [Google Scholar] [CrossRef]
  16. Chen, J.; Tao, J.; Zhou, Q.; An, H. A Study of Line Loss Management Evaluation in Provincial Power Grids Based on Principal Component Analysis. Electr. Power Sci. Eng. 2016, 32. [Google Scholar] [CrossRef]
  17. Gao, X.; Zheng, Y. Comprehensive Assessment of Smart Grid Construction Based on Principal Component Analysis and Cluster Analysis. Power Syst. Technol. 2013, 37, 2238–2243. [Google Scholar]
  18. Zhi-Yong, X.U.; Zhang, X.D.; Zeng, M.; Yan, F. Application of ANP-Based Multilevel Fuzzy Comprehensive Evaluation Methods to Post-Evaluation for Grid Construction Projects. East China Electr. Power 2009, 141, 488–491. [Google Scholar] [CrossRef]
  19. Cuadra, L.; Pino, M.D.; Nieto-Borge, J.C.; Salcedo-Sanz, S. Optimizing the Structure of Distribution Smart Grids with Renewable Generation against Abnormal Conditions: A Complex Networks Approach with Evolutionary Algorithms. Energies 2017, 10, 1097. [Google Scholar] [CrossRef]
  20. Cuadra, L.; Salcedo-Sanz, S.; Del Ser, J.; Jiménez-Fernández, S.; Geem, Z.W. A Critical Review of Robustness in Power Grids Using Complex Networks Concepts. Energies 2015, 8, 9211–9265. [Google Scholar] [CrossRef] [Green Version]
  21. Pagani, G.A.; Aiello, M. From the Grid to the Smart grid, Topologically. Physica A 2016, 449, 160–175. [Google Scholar] [CrossRef]
  22. Omodei, E.; Arenas, A. A Network Approach to Decentralized Coordination of Energy Production-Consumption Grids. PLoS ONE 2018, 13. [Google Scholar] [CrossRef] [PubMed]
  23. Yang, S.; Han, Q.; Xu, L.; Lu, S. Comprehensive Evaluation of Electric Power Customer Satisfaction Based on BP Neural Network Optimized by Fish Swarm Algorithm. Power Syst. Technol. 2011, 35, 146–151. [Google Scholar] [CrossRef]
  24. Liu, X.X.; Lian, G.H.; Guo, X.Z.; Luo, Z.K.; Yin, Y.Y. Fuzzy Comprehensive Evaluation of Customer Satisfaction on Power Suppliers Based on AHP Method: A study of the power companies in Hunan province. J. Yunnan Minzu Univ. Nat. Sci. 2017, 26. [Google Scholar] [CrossRef]
  25. Liu, Q. A Study of Comprehensive Evaluation on the Contribution Effect of Energy-Saving and Emission Reduction of Power Grid Enterprises. Master’s Thesis, North China Electric Power University, Beijing, China, 2012. [Google Scholar]
  26. Xue, X.; Ye, X.; Wang, H. The Fuzzy Comprehensive Evaluation of Power Grid Enterprises Energy Management System. Energy Conserv. Technol. 2015, 33, 546–549. [Google Scholar] [CrossRef]
  27. Zhang, C.Q.; Cao, M.M.; Xie, P. Fuzzy Comprehensive Evaluation of Social Responsibility of Power Grid Corporation. China Electr. Power Technol. Ed. 2011, 8, 68–70. [Google Scholar]
  28. Zhang, X.H.; Quan, X.F. The Evaluation on the Sustainable Development of Electric Power Enterprise Based on Space Length Quality Synthetic Evaluation Model. Commer. Res. 2009, 6, 119–122. [Google Scholar] [CrossRef]
  29. Liu, Q.; Chen, J. Fuzzy Comprehensive Evaluation of Intelligent Electric Grid and Its Application. Stat. Decis. 2017, 3, 77–80. [Google Scholar] [CrossRef]
  30. Liu, W.Y.; Jiao, J. The Evaluation Research of Main Bodies’ Competitiveness of the Electric Selling Market in the Future Based on the Fuzzy Comprehensive Evaluation Method. Power Demand Side Manag. 2016, 18, 15–20. [Google Scholar] [CrossRef]
  31. Huang, W.; Liu, J.; Wang, G. Analysis and Evaluation Research on Core Competence of Independent Electricity Retailer Based on Value Chain. J. North Chin. Electr. Power Univ. Soc. Sci. 2017, 5, 26–33. [Google Scholar] [CrossRef]
  32. He, Y.; Liu, D.; Luo, T.; Wang, J. Power Comprehensive Evaluation Method and Application, 1st ed.; China Electric Power Press: Beijing, China, 2011; p. 9787512319691. [Google Scholar]
  33. Boulkedid, R.; Abdoul, H.; Loustau, M.; Sibony, O.; Alberti, C. Using and Reporting the Delphi Method for Selecting Healthcare Quality Indicators: A Systematic Review. PLoS ONE 2011, 6. [Google Scholar] [CrossRef] [PubMed]
  34. Li, C.; Song, Y. Performance Fuzzy Comprehensive Evaluation of Electric Power Enterprise Informatization Application Based on AHP-Entropy. Shangxi Electr. Power 2015, 43, 48–52. [Google Scholar] [CrossRef]
  35. Huiling, L.I.; Xinbo, L.U.; Liu, D.; Xin, W.; Zhang, J.; Zeng, B.; Yang, X. A Comprehensive Evaluation Method for Power Energy Efficiency Project Based on AHP-TOPSIS. Mod. Electr. Power 2014, 31, 88–94. [Google Scholar] [CrossRef]
  36. Zhang, Z.H. A TOPSIS Comprehensive Evaluation of Agricultural Sci-Tech Achievements. J. Anhui Agric. Sci. 2012, 40, 9493–9495. [Google Scholar] [CrossRef]
  37. Feng, S. The Research on the Methods of Combination Weighting and TOPSIS in the Multiple Attribute Decision Making. Master’s Thesis, Jiangsu University of Science and Technology, Jiangsu, China, 2016. [Google Scholar]
  38. Lu, W.; Tang, H. Comprehensive Improvement of TOPSIS Method in the Multiple Attribute Decision Making. Stat. Decis. 2012, 19, 38–40. [Google Scholar]
  39. Wang, Y.; Ren, L.; Chen, L.; Sun, Z. A Novel Improved TOPSIS Method and Its Application in Medical Science. J. Cent. South Univ. 2013, 38, 196–201. [Google Scholar]
  40. Yang, X. Comprehensive Evaluation of Economic Efficiency Based on the Support Vector Machine. Sci. Technol. Inf. 2010, 28, 452–453. [Google Scholar] [CrossRef]
  41. Kai, W.; Guan, S.; Wang, L.; Wang, D.; Cui, Y. A Combined Forecasting Model for Wind Power Predication Based on Fuzzy Information Granulation and Least Squares Support Vector Machine. Power Syst. Prot. Control. 2015, 43, 26–32. [Google Scholar]
  42. Gu, Y.; Zhao, W.; Wu, Z. Investigation of Robust Least Squares-Support Vector Machines. J. Tsinghua Univ. Nat. Sci. Ed. 2015, 5, 396–402. [Google Scholar] [CrossRef]
  43. Li, X. AHP-ACO Model Based on Assessment on Bearing Capacity of Regional Water Resources. Northwest Hydropower 2015, 5, 16–20. [Google Scholar] [CrossRef]
  44. Zhang, Y. Study of Optimizing Logistic Distribution Routing Based on Improved Ant Colony Algorithm. Control. Eng. 2015, 22, 252–256. [Google Scholar] [CrossRef]
  45. Cheng, F. Improved Ant Colony Algorithm and Application. Master’s Thesis, Jiangxi University of Science and Technology, Jiangxi, China, 2013. [Google Scholar]
  46. Wei, X.; Han, L.; Lu, H. A Modified Ant Colony Algorithm for Traveling Salesman Problem. Int. J. Comput. Commun. Control 2014, 9, 633–643. [Google Scholar] [CrossRef]
  47. Toksarı, M.D. A Heuristic Approach to Find the Global Optimum of Function. J. Comput. Appl. Math. 2007, 209, 160–166. [Google Scholar] [CrossRef]
  48. Sun, W.; Tong, X.; Li, Q. NOx Emission Concentration of Coal-Fired Boiler Prediction Based on Improved PSO Parameter Optimized LSSVM. J. Data Acq. Process. 2015, 30, 231–238. [Google Scholar] [CrossRef]
  49. Chapelle, O.; Vapnik, V.; Bousquet, O.; Mukherjee, S. Choosing Multiple Parameters for Support Vector Machines. Mach. Learn. 2002, 46, 131–159. [Google Scholar] [CrossRef]
  50. Zhang, C.; Zhang, T. Oil Holdup Modeling of Oil-water Two-phase Flow Using Thermal Method Based on LSSVM and GA. J. Chem. Ind. Eng. 2009, 60, 1651–1655. [Google Scholar] [CrossRef]
Figure 1. The evaluation indicator system for operating efficiency of the electricity retail companies.
Sustainability 10 00860 g001
Figure 2. The parameter optimization steps of LSSVM optimized by modified ant colony algorithm.
Sustainability 10 00860 g002
Figure 3. The flow chart of the comprehensive evaluation model for operating efficiency of electricity retail companies.
Sustainability 10 00860 g003
Table 1. The classification of the third-level indicators.
Quantitative IndicatorsQualitative Indicators
Asset liability ratioInnovation awareness of enterprises
Current ratioApplication level of information technology
Quick ratioCustomer loyalty
Capital profit marginCustomer satisfaction
Profit marginorganization
Cost profit marginThe degree of employees’ participation in decision-making
Innovation input–output ratioInstitutional implementation capacity
Science and technology input–output ratioSafety quality management
Proportion of highly educated employeesHuman resources management
Network loss rateBasic materials management
Voltage qualification rateBusiness management
Power supply reliabilityAcceptance of new energy resources
Frequency qualification rateBrand image
Electricity salesBrand awareness
Market shareEmployment opportunities for employees
Pollutant emission reduction
Table 2. The ranking results of operating efficiency of the 20 electricity retail companies.
Ranking results of Electricity Retail CompaniesOperating Efficiency
T0.2773
L0.2748
E0.2642
A0.2598
D0.2559
K0.2481
M0.2432
B0.2413
Q0.2408
O0.2366
P0.2143
I0.2053
F0.1870
R0.1867
J0.1861
C0.1852
N0.1848
G0.1773
S0.1604
H0.1539
Table 3. The training results of LSSVM.
Electricity Retail CompaniesScores of Comprehensive EvaluationTraining ResultsRelative Error (%)
A0.25980.2536−2.36%
B0.24130.2351−2.54%
C0.18520.1831−1.12%
D0.25590.25790.80%
E0.26420.2580−2.33%
F0.18700.19172.50%
G0.17730.1758−0.85%
H0.15390.16004.02%
I0.20530.2016−1.78%
J0.18610.1851−0.55%
K0.24810.2419−2.51%
L0.27480.2686−2.26%
M0.24320.24691.52%
N0.18480.19103.32%
O0.23660.24001.43%
Table 4. The test results of LSSVM.
Electricity Retail CompaniesScores of Comprehensive EvaluationTraining ResultsRelative Error (%)
P0.21430.22012.72%
Q0.24080.2362−1.92%
R0.18670.19293.31%
S0.16040.16663.86%
T0.27730.2711−2.22%
Table 5. The test results of the prediction accuracy of the model.
IndicatorsTraining SampleTest Sample
MSE0.00%0.00%
RMSE0.48%0.58%
MAPE1.99%2.81%

