Variations of Ecosystem Service Value in Response to Land-Use Change in the Kashgar Region, Northwest China


1
Key Laboratory of Oasis Ecology, College of Resources and Environmental Science, Xinjiang University, Urumqi 830046, China
2
Kashgar Research Center, Institute of Remote Sensing and Digital Earth, Chinese Academy of Sciences, Kashgar 844000, China
3
Ecology Postdoctoral Research Station, Xinjiang University, Urumqi 830046, China
*
Author to whom correspondence should be addressed.
Sustainability 2018, 10(1), 200; https://doi.org/10.3390/su10010200
Submission received: 10 October 2017
/
Revised: 2 January 2018
/
Accepted: 10 January 2018
/
Published: 15 January 2018
(This article belongs to the Special Issue Defining and Assessing Landscape and Urban Sustainability: Linking Spatial Patterns, Ecosystems Services, and Human Wellbeing)
Abstract
:Increasing anthropogenic activities have significantly altered ecosystems in arid oasis regions. Estimating the impact on a wide range of ecosystem services is important for decision making and the sustainable development of these regions. This study analyzed time-series Landsat data to determine the influences of oasis land-use changes on the ecosystem services in the Kashgar region in Northwest China. The following results were found. The total value of the ecosystem services in the Kashgar region were approximately $10,845.3, $11,218.6, $10,291.7, and $10,127.3 million in 1986, 1996, 2005, and 2015, respectively. The water supply, waste treatment, biodiversity protection, and recreation and cultural services were the four ecosystem services with the highest service value, contributing 77.05% of the total ecosystem services. The combined contribution rate of food production and raw material value was only about 4.02%, relatively small. The sensitivity analysis indicated that the estimated total ecosystem service value (ESV) for this study area was relatively inelastic with respect to the value coefficients. The findings of this study will be crucial for maintaining the stability and sustainable development of the oasis region, where socio-economic development and the integrity of the natural ecosystem complement each other. Furthermore, the results provide a scientific basis for decision makers in land use management, and provide a reference for researchers in the Northwest China.
1. Introduction
Ecosystems are the life-support systems for the earth’s environment. Human beings and other organisms benefit directly and indirectly in many ways from their ecosystems, such as through the provision of food and resources, storing carbon, air purification, biodiversity protection, pharmaceuticals, and the regulation of local climates [1,2]. As an important part of the biosphere, ecosystem services maintain the environment, and understanding the multiple benefits provided by the ecosystems is becoming increasingly important [3]. An ecosystem can be defined as the conditions and processes that contribute to human beings’ and other living organisms’ survival and welfare [4]. Ecosystem services are critical to maintaining life on earth and ecosystem integrity. The integration of ecological and economic concepts has contributed to the sustainable development of the natural environment [5]. The ecosystem service value (ESV) has become a focus in the fields of environmental ecology and ecological economics. Because of human activities and climate change, ecosystem services are facing considerable pressure, which is expected to continue to increase. Among these pressures, human activities are the main contributor, by changing the ecosystem services through land-use and land-cover changes (LULCC) [6]. LULCC are the main determinant of changes in the land-use structure, the ecosystem function evaluation, and the dynamic processes of most landscapes throughout the world [7,8]. LULCC affect ecosystem services through agricultural activities, animal husbandry, human settlements, built-up areas, and mining [9,10]. Some negative impacts that the LULCC have on ecosystem services are obvious, expressed predominantly in the imbalance between the provision of ecosystem services and the demands of humans and other organisms [11]. Changes in ecosystem services are mainly caused by the anthropic alteration of land use [12].
The economic evaluation of ecosystem services has been an important aspect of ecological economics [13]. Numerous studies have estimated the various ESV around the world [14,15,16]. In 1997, Costanza et al. estimated the global biospheric value of 17 ecosystem services in the 16 dominant global biomes [4,17]. In 2003, Xie et al. calculated the economic value of the ecosystem services in China [18]. In 2004, Mamattursun et al. assessed variations in ESV in the Kirya Oasis in Western China [19]. These studies led to a better understanding of the complex relationship between nature and society [20].
In China, LULC have been increasing in speed, breadth, and depth. Their resulting effects have become serious, highlighting the importance of global research about LULCC [21]. The demand for resources, the increasing socio-economic development, and population growth are largely beyond the supply capacity of the natural ecosystem. As such, the human population increase and socio-economic development will face serious challenges. In arid and semi-arid regions, LULCC might have important consequences for natural resources, significantly affecting the ecosystem processes and services [22,23].
To highlight the effect of LULCC on ESV, ESV was evaluated using land-use data. The relationship between land-use changes and ESV has been explored in scientific papers. These studies have confirmed that land-use data provide an efficient basis for estimating ESV [9,24,25]. The studies have emphasized how monetization has enabled the evaluation of environmental effectiveness, thereby aiding different decision-making strategies for LULCC planning [26,27].
Kashgar is the first special economic zone in Western China. With the establishment of the “One Belt and One Road” development strategy, Kashgar has become an important hub in the new Silk Road Economic Belt, being the largest oasis conglomeration in Southern Xinjiang.
Along with the resources and energy development, the demand for natural resources has rapidly increased, and considerable changes have occurred in the land use structure, resulting in serious impacts on regional ecosystem services. However, quantitative research on LULCC in oasis areas and ESV at the regional level is limited in Western China’s Kashgar region. Therefore, evaluating the effects of LULCC on ESV in arid areas is important for the coordinated development of the regional socio-economy and the natural environment [28,29]. In this study, we chose the Kashgar region of Northwest China as the study area because it has undergone intense land-use changes during the economic growth period between 1986 and 2015, especially following the central Chinese government’s formal approval of the “Economic Development Zone” in the Kashgar region in 2010 [30]. Given these circumstances, we attempted estimate the trend in ESV change in the Kashgar region, and explore the relationship between LULCC and the ESV, from 1986 to 2015. We assessed the ESV of the Kashgar region by using multi-temporal land-use data sets from 1986, 1996, 2005, and 2015.
The objectives of this research were (1) to analyze LULCC in the study area from 1986 to 2015; (2) to examine the change in ecosystem services at the regional scale by using value coefficients and land use change data that reflect ESV, from the period of 1986 to 2015; and (3) to determine how arid LULCC affect the ecosystem services value for the Kashgar region. These quantitative analyses are urgently needed to assist with the land-use management of arid land oases and to provide a scientific basis for the environmental protection and sustainable development of the Kashgar region.
2. Materials and Methods
2.1. Study Area
The Kashgar region is located in the southwestern part of the Xinjiang Uyghur Autonomous Region, China (73°27′–79°57′ E, 35°20′–40°18′ N) (Figure 1).
The region covers an area of 1.62 × 10⁵ km2. Administratively, it includes the cities of Kashgar, Shufu (Kona Shahar), Shule (Yingi Shahar), Yingjisha (Yengisar), Zepu (Poskam), Shache (Yarkant), Yecheng (Kagelek), Maigaiti (Maket), Yuepuhu (Yopuga), Jiashi (Payzawat), Bachu (Maralbeshi), and Tashikuergan (Tashkorgan) counties.
The Kashgar region is adjacent to several countries, including Tajikistan, Afghanistan, and Pakistan [31]. The region has unique landforms, with the Kunlun Mountains in the south, the Tianshan Mountains in the north and west, and the Taklimakan Desert in the east. The Kashgar region ecosystem is a typical mountain–oasis–desert ecosystem [32]. The climate is a continental arid climate, characterized by low rainfall, high evaporation, sufficient sunlight, and a large temperature difference between day and night. According to the weather stations in the study area, the 50-year mean annual temperature varies from 10.5 to 11.6 °C, with a mean monthly temperature between 22 and 31.5 °C in July, and −11 and 19 °C in January [33]. The mean annual precipitation is about 116.8 mm, but the annual potential evaporation is as high as 2400–3100 mm. The annual precipitation exhibits a decreasing elevation-dependent gradient, from 220 to 500 mm in the mountainous area, 50 to 90 mm in the pediments of the mountain or alluvial fans, to 10 mm in the eastern desert part of the study area. The inter-annual distribution of precipitation is significantly heterogeneous. More than 80% of the total annual precipitation falls within the period of May to October, and less than 20% falls between November to April [30]. The topographic and climatic factors result in different land use types for the oasis, depending on being located in a temperate, tropical, or semi-arid area. Agriculture is the major industry in the region, acting as the major source of employment and income. Agricultural planting is the main land-use type, with cotton, maize, and wheat being the most common crops. The local vegetation consists of Populous euphratica, Tamarix chinensis, and Phragmites australis. The total water resources in this region have a volume of 78.01 × 10⁸ m3, of which the surface water resource is 73.56 × 10⁸ m3, with the total volume of the groundwater being 4.45 × 10⁸ m3. The total population of the Kashgar region in 2015 was 449.92 × 10⁴. The region’s gross domestic product (GDP) for 2015 was 1.204 × 10¹⁰ RMB. In 2015, the conversion between RMB and USD was $1 = 6.36 ¥ [29]. Since the 1986s, the two major oases in the Kashgar region, the Yarkant Oasis and the Kashgar Oasis, have experienced notable changes due to human activity.
2.2. Data Collection
In this study, we used land-use data, socio-economic data, an equivalent ESV coefficient, and socio-economic land-related policies to estimate the ESV of the study area since 1986. The land-use data were acquired by using multi-temporal and differential-resolution remote sensing data, which includes Landsat Thematic Mapper, Enhanced Thematic Mapper and Operational Land Imager (TM/ETM and OLI) images from 1986, 1996, 2005, and 2015, obtained from the United States Geological Survey (USGS). For each year, a total of 12 images were selected that covered the extent of the Kashgar region (Table 1). The socio-economic data were obtained from the Kashgar statistical yearbooks (1986–2015). The socio-economic land-related policies were obtained from the relevant literature.
2.3. Land-Use Classification
In this study, the geometric corrections and masking of the remote sensing data were performed on 1:10,000 topographic maps using the ENVI 5.0 image software. All data were re-projected to the Universal Transfer Mercator Projection System (UTM) Zone 39N with the World Geodetic System (WGS-1984) datum. After geometric correction and geo-referencing, the average location errors in the images were reduced to less than one pixel. We obtained the LULCC data for the Kashgar region from TM/ETM/OLI imagery by using a maximum likelihood classification method with a combination of bands 3, 4, and 5, and the visual interpretation of image characteristics such as color, shape, size, shading, texture, structure, and relative spatial distribution for each class of land cover [33,34,35].
By following China’s land resources secondary classification system, we classified the land into nine types: cultivated land, forestland, grassland, water body, construction land, salinized land, wetland, sandy land, and unused land. The correction of the results was validated based on the 1986, 1996 and 2005 LUCC map which was obtained from the Data Center for Resources and Environmental Sciences, CAS and the 2015 result was validated based on ground truth investigation which was carried out by our research group. For each time periods 900 samples are selected in the evaluation of the classification results and 100 samples are guaranteed for each land use types. In addition one of the authors has conducted field investigations in the study area several times and has rich, local and on-the-ground knowledge and experience about the landscape of Kashgar region.
Based on the study area’s 1986, 1996 and 2005 land use maps and 2015 field data, we adopted the error matrix accuracy evaluation method to evaluate the classification result. The evaluation result is shown in Table 2.
The accuracy of the classification for the four periods (1986, 1996, 2005 and 2015) were 89%, 92%, 90.1%, 89% and the Kappa coefficients were 0.881, 0.908, 0.891, and 0.88, respectively, indicating that the classification results meet the accuracy requirement of land use classification. A brief description of the land-use categories is given in Table 3.
2.4. ESV Assignment
Since the 1990s, economic valuation of ecosystem services has become a popular topic, being widely used to estimate the multiple benefits provided by ecosystems. To assess the ESV for each of the nine land-use types, each of the land-use types was compared with the different biomes identified both in the world [4] and in the Chinese ecosystem services [18]. Costanza categorized the global biosphere into 16 types of ecosystems and 17 types of service functions and then estimated their ESV [3,17]. Using Costanza’s indexes as a foundation, Xie et al. modified the value coefficient for use with Chinese terrestrial ecosystems [4,19]. In this study, the ESV per unit area for each land-use category was assigned based on the equivalent coefficient value of the ecosystem services proposed by Xie and Costanza [20] (Table 4). As such, all the monetary values for all the years were based on 2003 values.
2.4.1. ESV Calculation
In this study, the ESV and ecosystem services functions for each land-use type were calculated as follows [19,20]:
where ESVk, ESVf, and ESV are the value of the ecosystem services of land-use type k, the value of ecosystem services function type f, and the total ecosystem services value, respectively. Ak is the area (ha) for land-use type k, and VCkf is the value coefficient ($/ha/year) for land-use type k and ecosystem service function type f [14,16]. The change in the value of the ecosystem services was estimated by calculating the differences between the estimated values for each land-use type in 1986, 1996, 2005, and 2015.
2.4.2. Sensitivity Analysis (CS)
As uncertainty is related to the value coefficients, in this study we used sensitivity analysis as shown in Equation (4) by adjusting the ESV coefficients for each land use type by 50%, and then calculating the corresponding change in ESV [36]. In this analysis, the coefficient sensitivity (CS) was calculated using the standard economic concept of elasticity [37,38]:
where ESV is the estimated ecosystem service value, VC is the value coefficient, i and j represent the initial and adjusted values (coefficient values were adjusted to the upper 50% and lower 50%), respectively, and k represents the land-use type [39]. When CS ≤ 1, then ESV is considered inelastic with respect to the ecosystem value coefficient. The greater the value of CS, the more critical the accuracy of the ecological value coefficient when evaluating S [40].
3. Results
3.1. Land Use Dynamics
3.1.1. Land Use and Land Cover Change
The classification results of the land-use changes in the Kashgar region between 1986 and 2015 are shown in Table 5 and Figure 2 and Figure 3. The LULCC over the past 30 years indicate that grassland, sandy land, and unused land remain the dominant cover types in the study area. Considering the LULC classification results shown in Figure 2, the most notable changes in LULC took place in the Kashgar and Yarkant oases, which are located near the Kashgar River and the Yarkant River basin. The Kashgar and Yarkant oases are characterized by intense human activity, which has converted large areas of grassland into cultivated land. Among all the land-use types, the highest change in cover occurred in grasslands, which decreased from 27% of the total area in 1986, to 16.8% in 2015.
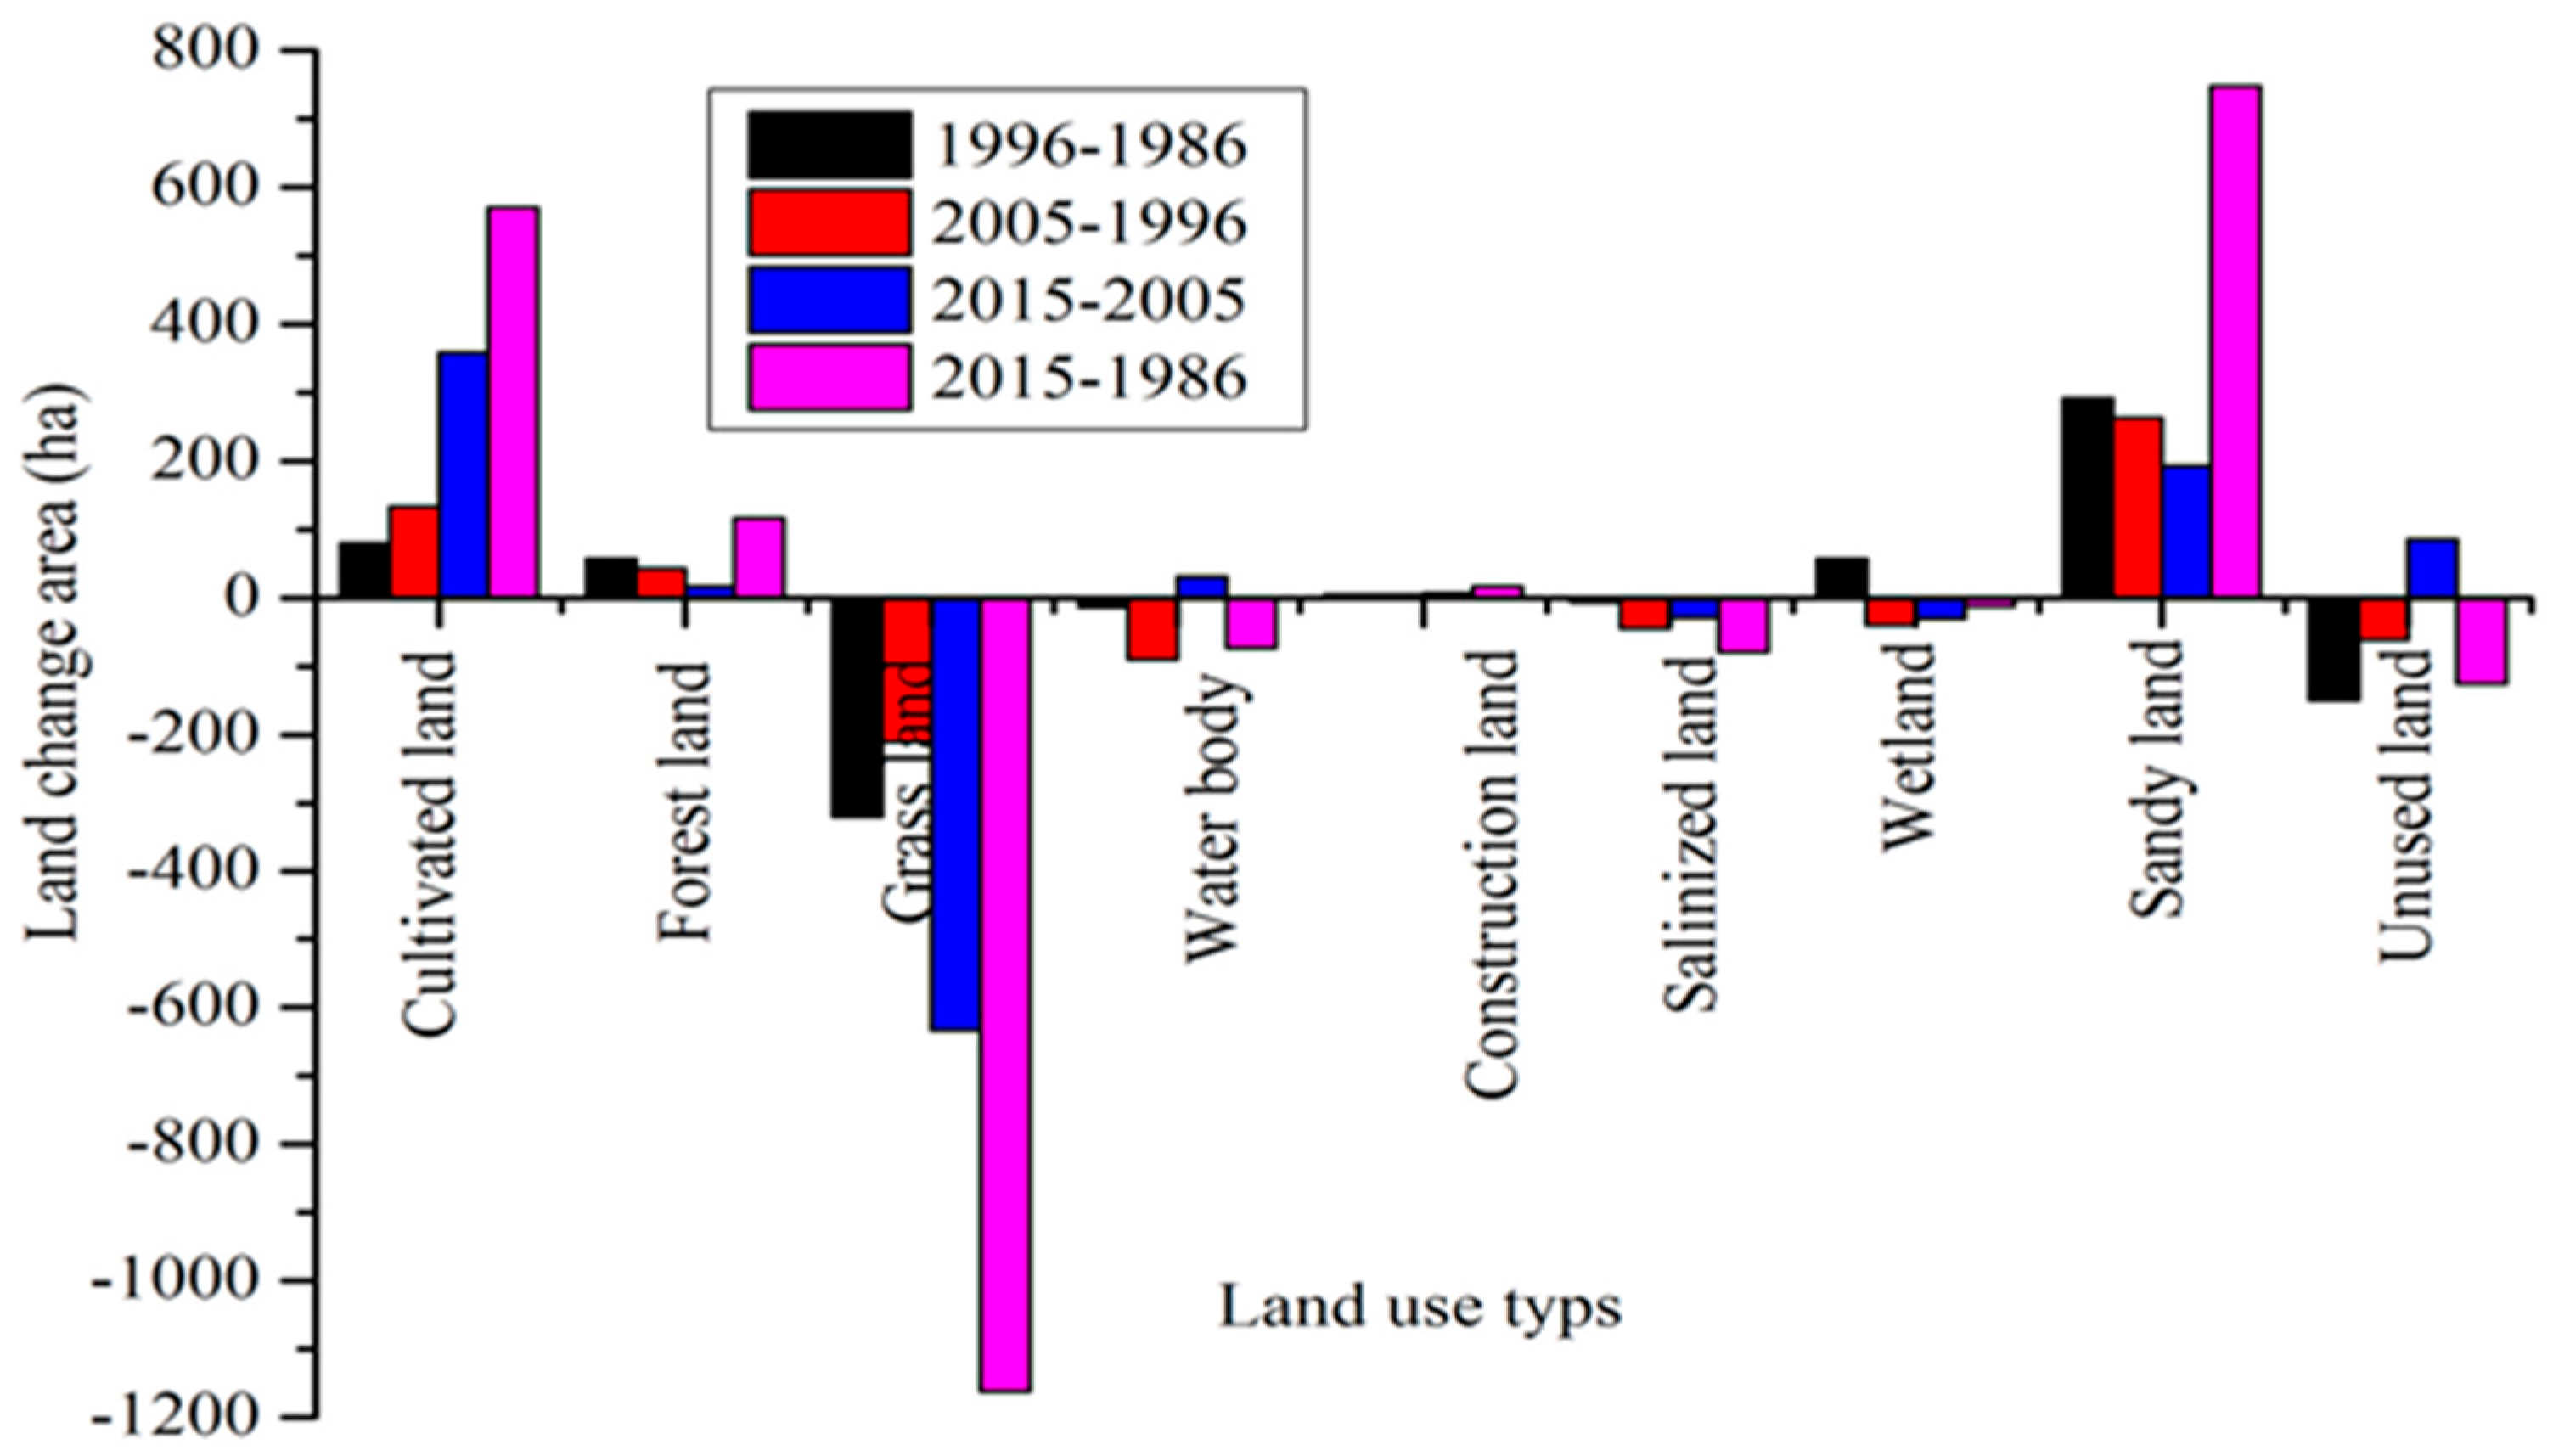
Sandy land showed a continual increase, from 22.8% of the total land in 1986 to 29.4% in 2015. Cultivated land expanded at an alarming rate, from 7.8% of the total land in 1986 to 12.8% in 2015. Forestland increased from 2% in 1986 to 3% in 2015. The water body experienced an initial decrease and then increasing, with a decrease from 7.7% of the total land in 1986 to 6.8% in 2005, and then an increase to 7.1% in 2015. Overall, water bodies decreased from 7.7% of the total area in 1986 to 7.1% in 2015. Construction land also increased, from 0.3% in 1986 to 0.4% in 2015. Salinized land decreased, from 3.3% in 1986 to 2.6% in 2015. Wetland increased from 0.5% in 1986 to 1% in 1996, and then decreased to 0.4% in 2015. The unused land also decreased from 28.7% in 1986 to 27.6% in 2015. During the period of 1986 to 2015, cultivated land, forest land, construction land, and sandy land all increased, whereas grassland, water, salinized land, wetland, and unused land decreased (Figure 2). Grassland displayed the greatest absolute change and water area the least. The considerable decreases in grassland and wetland, together with the simultaneous increase in cultivated land, are a result of the rapid development of commercial agriculture and inadequate regulations for the protection of wetlands and curbing irrational water use.
3.1.2. Land-Use Conversion
The transformation among the different LULC could reflect the direction of change, which could be best explained using a space-time change process. Our results (Table 6) revealed that, from 1986 to 2015, a complex transformation occurred among each LULC type in the Kashgar region. The main characteristics of the transference are shown below.
Table 6 shows that 883.6 × 10³ ha of the cultivated land in 1986, 600.2 × 10³ ha were unchanged, while 14.7 × 10³ ha, 146.9 × 10³ ha, 12.6 × 10³ ha, 13.5 × 10³ ha, 5.5 × 10³ ha, 8.8 × 10³ ha, 0.8 × 10³ ha, and 70.0 × 10³ ha were lost to forestland, grassland, water bodies, construction land, salinized land, wetland, sandy land, and unused land, respectively. The total loss of cultivated land was 272.8 × 10³ ha. Of the 1454.5 × 103 ha of cultivated land in 2015, 854.2 × 10³ ha were gained from forestland (29.1 × 10³ ha), grassland (688.5 × 10³ ha), water bodies (5.9 × 10³ ha), construction land (6.9 × 10³ ha), salinized land (9.7 × 10³ ha), wetland (8.4 × 10³ ha), sandy land (38.0 × 10³ ha), and unused land (67.7 × 10³ ha). Over the entire research period, all cultivated land showed an increasing trend with transference being predominantly from grassland, forest land, and unused land. Similarly, of the 3063.9 × 103 ha of grassland in 1986, 1607.3 × 103 ha remained unchanged, whereas 688.5 × 10³ ha, 54 × 103 ha, 69.3 × 10³ ha, 10.2 × 10³ ha, 85.2 × 10³ ha, 2.6 × 10³ ha, 82.5 × 10³ ha, and 464.3 × 10³ ha changed to cultivated land, forestland, water bodies, construction land, salinized land, wetland, sandy land and unused land, respectively. Some of the 1901.9 × 103 ha of grassland in 2015 was gained from cultivated land (146.9 × 10³ ha), forest land (35.9 × 10³ ha), water bodies (87.0 × 10³ ha), construction land (0.4 × 10³ ha), salinized land (7.6 × 10³ ha), wetland (4.1 × 10³ ha), sandy land (33.4 × 10³ ha), and unused land (109.9 × 10³ ha). During the study period, 122.1 × 10³ ha of forestland was unchanged, whereas 99.8 × 10³ ha was converted into other land use types, and 206.0 × 10³ ha of forestland was converted from other land types. A total of 535.5 × 10³ ha of water was unc hanged, whereas 220.2 × 10³ ha was converted into other land types and another 367.6 × 10³ ha was converted from other land types. For construction land, 21.0 × 10³ ha was unchanged, 11.9 × 10³ ha was converted into other land types, and 28.6 × 10³ ha was converted from other land types. For salinized land, 172.1 × 10³ ha was unchanged, and 205.2 × 10³ ha was converted into other land types, and 126.0 × 10³ ha was converted from other land types. For wetlands, 21.2 × 10³ ha was unchanged, 21.6 × 10³ ha was converted into other land types, and 24.1 × 10³ ha was converted from other land use types. For sandy land, 2440.1 × 103 ha was unchanged, 147.6× 10³ ha was converted into other land types and 165.1 × 10³ ha was converted from other land use types. For unused land, 2643.4 × 103 ha of was unchanged, 526.3 × 10³ ha was converted into other land use types, and 765.2× 10³ ha was converted from other land use types.
3.2. Variability and Distributions of ESV through Time
3.2.1. Ecosystem Service Value Changes
In this study, by using the value coefficients (Table 4) and the areas of the land-use categories (Table 5), the ESV of each land use category and total ESV of the Kashgar region in 1986, 1996, 2005, and 2015 were calculated using Microsoft Excel and Equations (1)–(3). The results are presented in Table 7. According to Table 7, the overall trend in ESV is characterized by volatile change processes. During the four periods, the total ESV of the Kashgar region rose from $10,845.3 million U.S. in 1986, to $11,218.6 million U.S. in 1996, declining to $10,127.3 million U.S. in 2015. An overall increase in ecosystem service value, of about $373.31 million U.S., occurred in the first 10 years (1986–1996). The net ESV benefit was $32.9 U.S. per hectare. The ESV loss was about $1091.3 million U.S. in the following 20 years (1996–2015), and the net ESV loss was $96.15 U.S. per hectare.
3.2.2. Change in Ecosystem Function
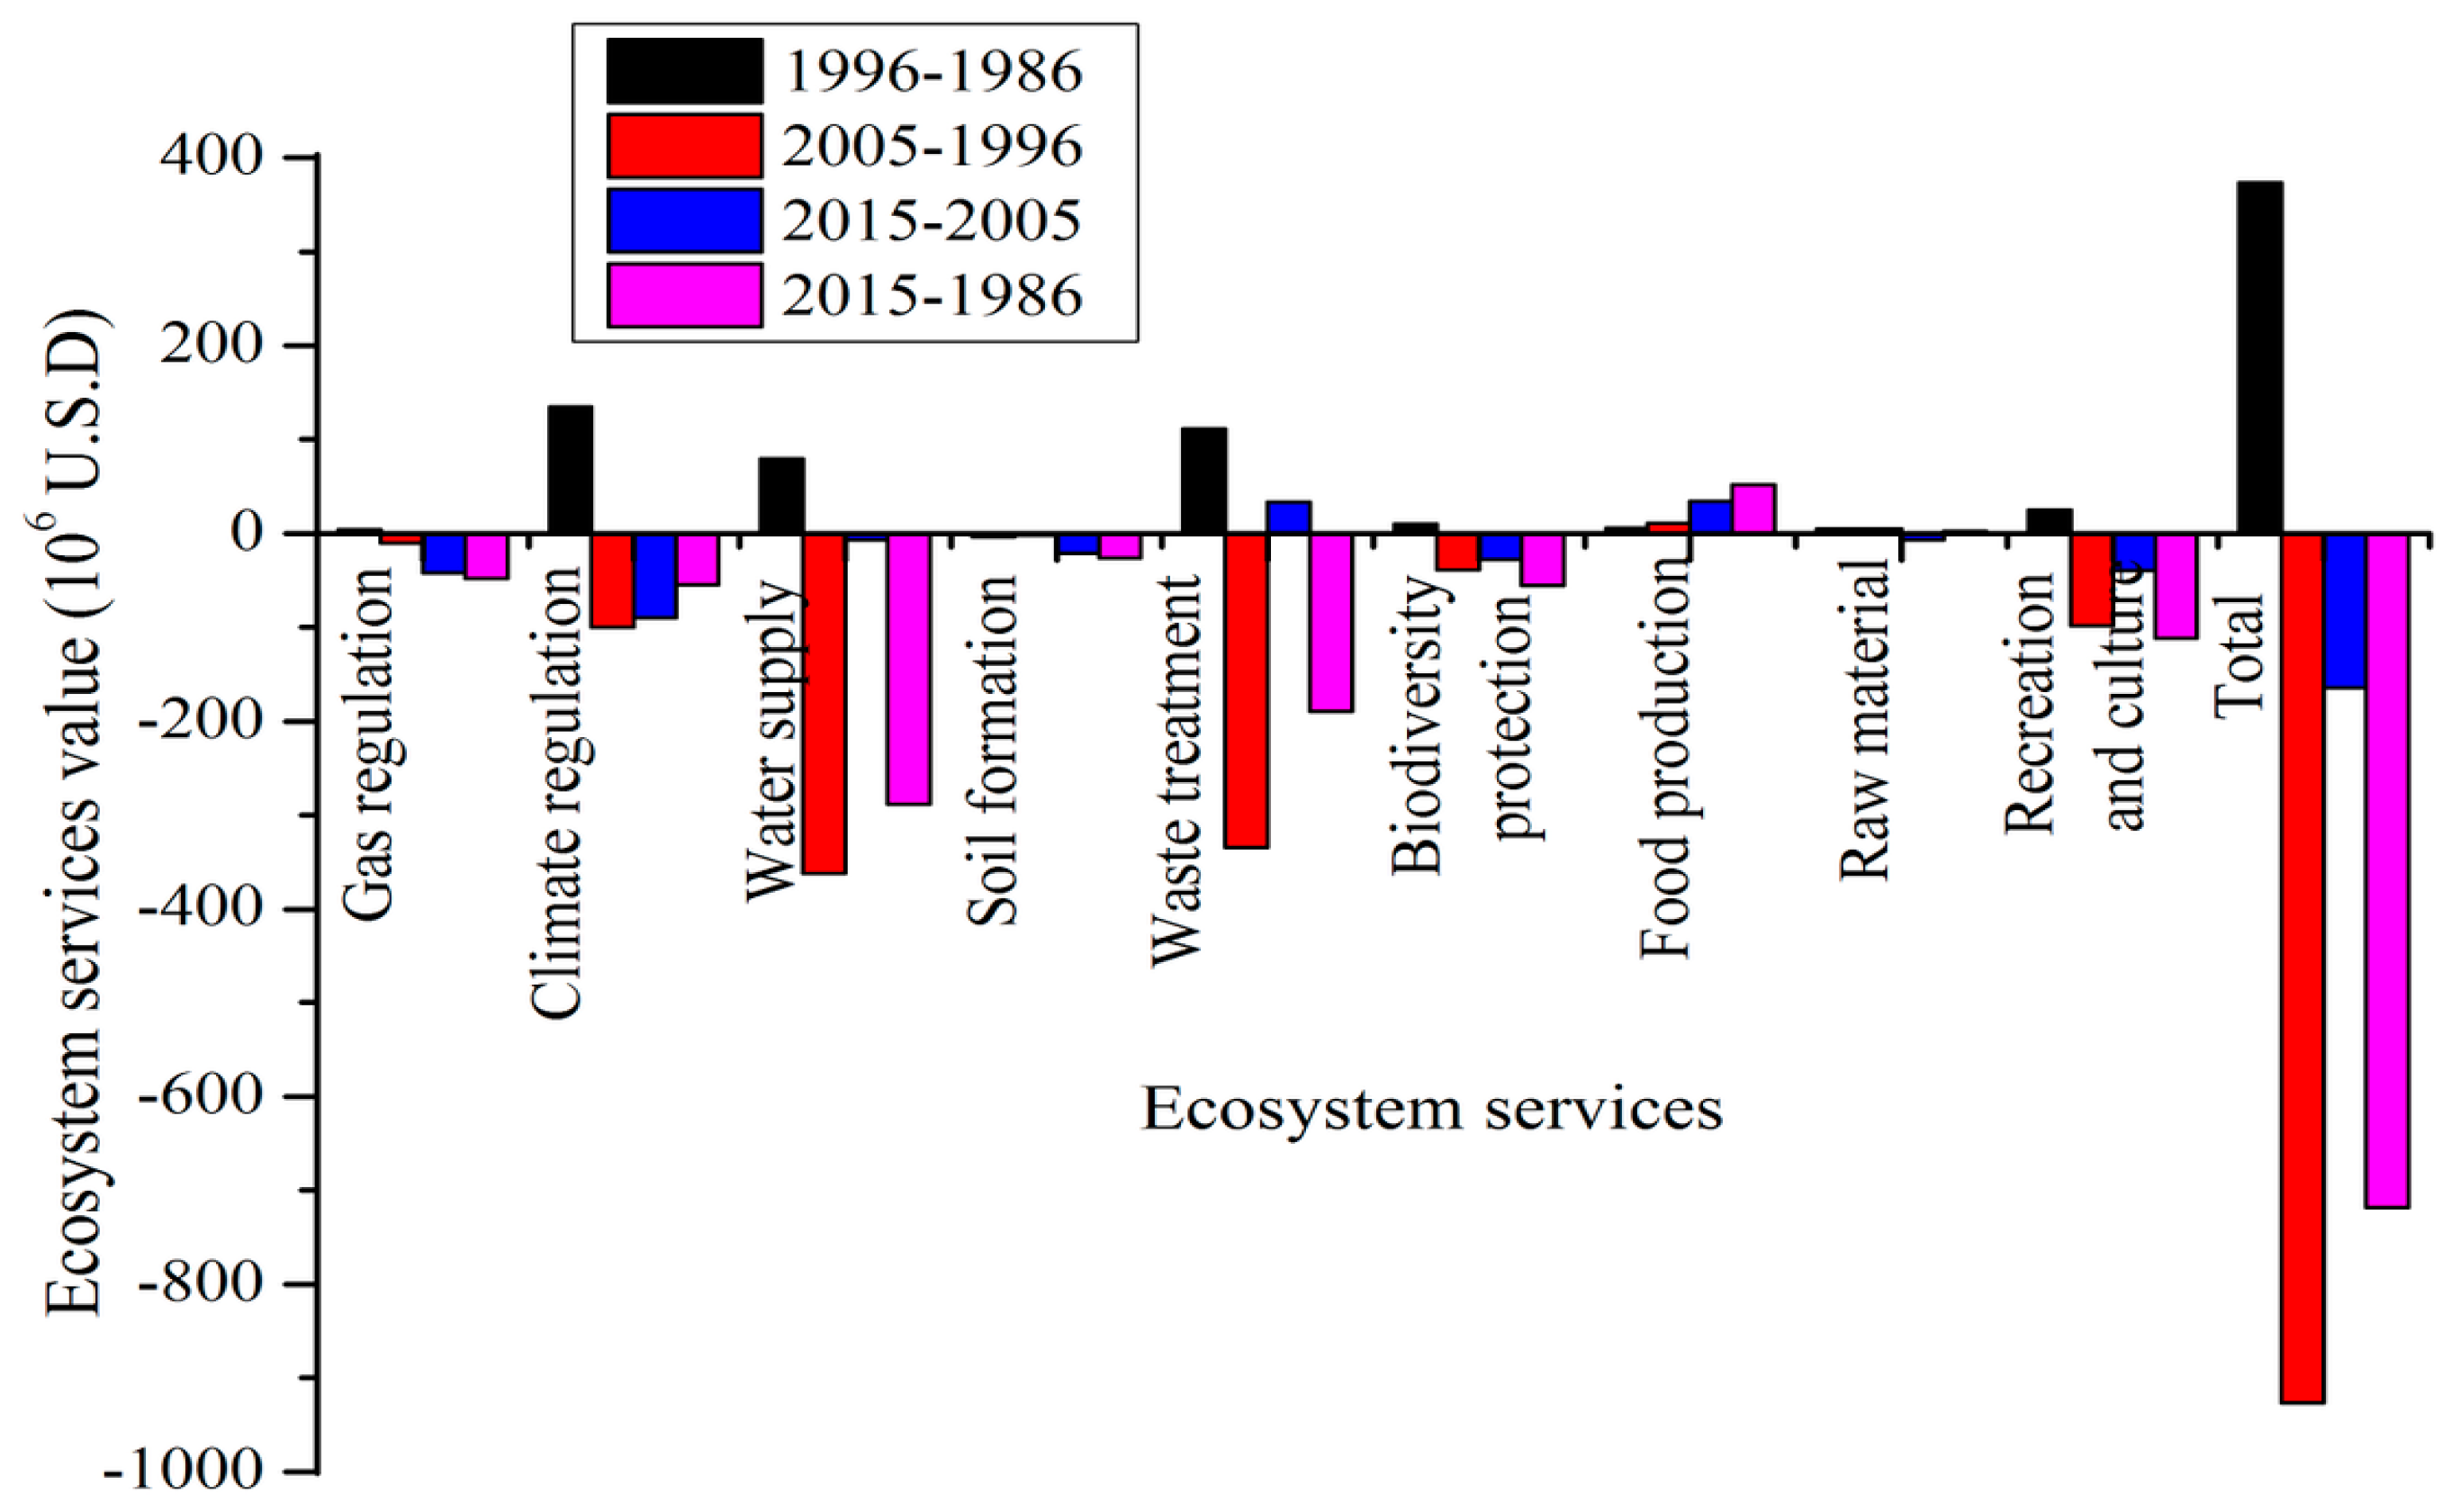
To determine the effects of the change in land use on each of the ecosystem functions and its contribution rate to the total ESV within the Kashgar region in the 30-year timeframe, the ecosystem function type f was calculated using the value coefficients (Table 4) and areas of the land-use categories (Table 5). As shown in Table 8 the contribution rate of the individual ecosystem functions to the total value of the ecosystem services in each year are ranked based on their estimated average ESVf in 1986, 1996, 2005, and 2015. The trend in the contribution rate of each ecosystem function to the overall ESV is marked with an upward arrow to denote an increasing contribution, a downward arrow to denote a decreasing contribution, and a dash to denote no change. As in showed in the Figure 4, most ecosystem functions of all land use types increased from 1986 to 1996, except for Soil formation which increased, while most ecosystem functions of all land use types declined from 1986 to 2015, except for food production that increased.
The overall ranking for each ecosystem function, based on their contribution to the overall ESV from high to low, is water supply, waste treatment, biodiversity protection, recreation and cultural services, soil formation, climate regulation, gas regulation, food production, then raw material. Water supply, waste treatment, biodiversity protection and recreation and culture services were the top four ecological functions affecting the total ecosystem service value and their combined contribution accounts for 77.05%. The food production and raw material functions contributed the least to the ecosystem service value, with a combined contribution rate of only about 4.02%. In this study, the value of the regulating services of Kashgar region ecosystem is far greater than that of the provisioning services, indicating that regulation services are the main driver of the ecosystem services in the Kashgar region.
3.2.3. Ecosystem Services Sensitivity Analysis
To confirm the reliability in our research, the sensitivity of ESV to changes in value coefficients must be relatively low, meaning CS must be less than one in Equation (4). The change in estimated total ESV and the coefficient of sensitivity, derived from a 50% adjustment in the value of the coefficient, showed that the total ESV estimated for the study area was relatively inelastic.
The sensitivity index results showed that from 1986 to 2015 (Table 9), the ESV to CS values in the Kashgar region were all lower than one and often close to zero. In this study, a CS value less than one means that the estimated total ESV was relatively inelastic with respect to the value coefficients. In this study, the CS is ranged from 0.00 to 0.58, and changes in the total value of the ecosystem services ranged from 0 to 29.11%. Adjusting the value coefficients for construction land, sandy land, and salinized land had little impact on the estimated ESV, with a change less than 0.05% with a 50% change in value coefficient. Correspondingly, the CS is fluctuated from 0.03 to 0.58 when the coefficients for cultivated land, forest land, grass land, water body, wetland, and unused land were adjusted. Because CS was less than one, the analyses reflect that grass land, water bodies, cultivated land, and wetland play a critical role in the total ecosystem services of the study area. The sensitivity analysis indicated that the estimation was robust, regardless of scope. The value coefficients had a significant influence on the accuracy of the estimated change in ESV over the 30-year period, indicating that our results are credible and that the ESV index that was used in the research area was a good fit.
4. Discussion
Due to large-scale land reclamation and water resource exploitation that have occurred since 1980, the ecosystems in the Kashgar region have changed considerably [41,42] (Table 5 and Table 6). Population growth, rapid economic development, and socioeconomic policies, implemented after the reform as part of the “reform and opening up policy”, have led to changes in land use and the exploitation of water resources exploitation [43].
4.1. Factors Driving LULCC
4.1.1. Population and Economic Growth
LULCC in arid areas are commonly a human-driven process that has resulted in consequences for land-related ecosystems [44]. Under certain geographical conditions and to meet increasing demands, population growth has often influenced and modified the natural landscape on different scales [45]. Kashgar is a multi-ethnic region, and most populations in Kashgar region are rural, which are the main driving forces in LULCC and economic structure change. From 1986 to 2015, the population in Kashgar region grew from 2,601,124 to 4,499,200 (Figure 5).
The increased population inevitability produced an intense pressure on food and space [46]. Additionally, the Kashgar region is the main cotton producing area in Xinjiang; it has a long history of cotton production and has favorable conditions for cotton plantations [47]. From 1986 to 2015, cotton prices in the Kashgar region increased considerably, and local farmers maximized their economic profit through increased cotton production by expanding the area under cultivation, which consequently resulted in frequent land conversion. Therefore, population growth, agricultural intensification, and socio-economic development are the main driving forces of LULCC and are the critical factors influencing regional human-land relationships in the study area.
4.1.2. The Influence of Policy
Another important driving force for the LULC is closely related to the government’s land-related policies at national and local level [48].
The “reform and opening up policy”, implemented in China in 1978, generated impressive expansion of cultivated lands, significantly altering the land structure [49]. Along with the “China market economy policy” enacted in 1992, tremendous LULCC occurred in the study area, especially where natural resources were available for the expansion of cultivated lands [50]. The income of the Kashgar people largely relies on agriculture, which is the key part of the local socio-economic development [30]. At the beginning of the study period, these economic policies improved the living standard of the local people by steadily expanding the cultivated lands in the Kashgar region. Consequently, serious desertification and degradation in the ecosystem services occurred because of irresponsible land use. In addition, two major land related laws, the “Basic Cultivated Land Protection Regulation” and the “New Land Administration Law”, implemented in 1994 and in 1999, respectively, played an important role in LULCC [51]. Established in 2010, the “Kashgar Special Economic Zone” also accelerated the land use structure change, as it attracted many entrepreneurs at home and abroad to Kashgar to build many factories and businesses [29]. Technological improvements and advances in irrigation and land resource management systems have also contributed to the rapid change in LULC. In the study area, LULCC is closely related to human-induced policy interventions and market economy.
4.2. Effect of LULCC on ESV
The population growth and rapid economic development in the study area led to the expansion of cultivated land and construction land, which accelerating deforestation and the cultivation of grassland and wetlands. The expansion of cultivated land and construction land changed the landscape pattern, causing a gradual increase in ecological degradation. During 1986 to 2015, the areas of the different land use types continually changed in the Kashgar region. Cultivated, forest, construction, and sandy lands increased, while grassland, water body, Salinized land, wetland, and unused land decreased. The changes in ESV of the land use types varied according to their changes in area. Although the ESV of cultivated, forest, construction, and sandy lands demonstrated an increasing trend, the trend in total annual ESV in the Kashgar region was variable, first increasing then decreasing, because the high value coefficient of wetlands and water bodies, and the large areas of grassland, contributed more to the overall ESV. Based on the estimated size of nine land-use types and ESV, we determined that the total annual ESV in the Kashgar region declined by 6.6% between 1986 and 2015 (Table 7). This massive decline in ESV is largely attributable to the loss of 12.3 × 10³ ha wetlands and 1162 × 103 ha grasslands. In the study area, the high rate of decline of these land use would have considerably negative ecological consequences.
The total ecosystem function value also first increased then decreased. The nine single ecosystem functions decreased, except for food production. Among them, the ecosystem function values of water supply, recreation and culture, and waste treatment experienced largest decline. Recent relevant studies were performed in the Keriya Oasis and Ugan-Kuqa River Delta Oasis regions, where the ecosystems are similar to the Kashgar region. Mamattursun’s [35] study of the ecosystem services in Keriya Oasis, China, showed that the total ESV of the Keriya Oasis decreased from $35.8 million U.S. in 1991 to $32 million U.S. in 2008. Similar work conducted by Mamatsawut [3] in the Ugan-Kuqa River Delta Oasis, China, reported that the ecosystem service value in the Ugan-Kuqa River Delta Oasis region increased from $1236.42 million U.S. in 2000 to $1238.1 million U.S. in 2008. Although the two studies revealed opposite ESV trends, the changes in both areas were driven by the change in wetland area. The ESV change in the Kashgar region corresponds to the trend observed in the Keriya Oasis. The total ESV of the Kashgar region was about $10,845.29 million U.S. in 1986, increasing to $11,218.6 million U.S. in 1996, then decreasing to $10,127.3 million U.S. in 2015. The net ESV benefit was about $373.31 million from 1986 to 1996, and the net loss in ESV was about $1091.3 million from 1996 to 2015. The increase in ESV caused by the expansion of wetland was about $531.21 million U.S. from 1986 to 1996, whereas the loss in ESV caused by the decrease in wetland was about $646.4 million U.S. from 1996 to 2015. Wetland conversion into cultivated land in both Kashgar and Keriya occurred over the same time period, which explains the similar response of ESV to land use change. Therefore, the uncontrolled land-use changes can negatively affect the capacity of an ecosystem to provide ecosystem services on a sustainable basis, resulting in long-term degradation of environmental quality in arid regions [52].
4.3. Possible Limitations and Future Suggestions
4.3.1. Data Selection
We extracted the LULC maps of the study area for four time frames using remote sensing and GIS tools. Due to the limitation of remote sensing interpretation, such as data classification, scale bias, and data precision [53], and the temporal and spatial dependence of LULCC on our estimation of land use pattern changes, ESV was only captured at single points in time in the study area. In addition, the Landsat data used in this study has lower resolution and mixed pixels in neighboring land use types, limiting the accurate estimation of ESV. Therefore, future ESV estimation studies should use high resolution remote sensing data for improved accuracy in land use classification. Field investigation and interviews with local leaders, experts, and residents should also be integrated [54].
4.3.2. ESV Calculation
The ESV calculation framework used in this study was proposed by Costanza and modified by Xie et al. However, as the monetarily estimated ESV is influenced by different elements including market price, exchange rate among currencies, inflation rate, land use structure optimization, social and economic development trends, and governmental policies [55], accurately evaluating ESV is difficult. In addition, the accuracy of the modified value coefficients is unreliable due to ecosystem heterogeneity [56]. These issues can considerably affect the ESV accuracy. Therefore, when we estimated the ESV change between 1986 and 2015, we assumed that the market price was the same as in 2003. One of the disadvantages of this ESV estimation is its vagueness, especially because the uncertainty of the value coefficient and the spatial, biophysical, and socio-economic heterogeneity were not considered. This limitation should be addressed in follow-up studies. This study mainly used the benefit transfer method, which just adjusted previously completed studies to this region. Including the inflation adjusted contingent valuation, that considers local people’s willingness to pay, would improve the accuracy of final result.
4.3.3. Implications for Land Use Management in Future
In this study, the decrease in ESV in the Kashgar region was mainly caused by rapid changes in LULC, which can limit the capacity of an ecosystem to provide sustainable ecosystem services, possibly resulting in the long-term degradation of environmental quality. However, considering the fragile natural environment of the study area, we suggest that human activities in the Kashgar region should be pursued with caution as anthropogenic activities here will have an irreversible impact on its ecosystem services. Furthermore, coordinated socioeconomic development and ecological protection is necessary, and must be addressed properly by all stakeholders, to maintain a balance between economic development and ecosystem health in the future. Policy makers should implement a reasonable land-use policy that protects wetland and grasslands, which have high ESV. Local stakeholders should protect the ecosystem and understand the importance of ecosystem services, so as to maintain a balance between economic development and ecosystem health in the future.
5. Conclusions
This study yielded the following conclusions regarding LULCC in the Kashgar region:
- (1)
- The ESV decreased from approximately $10,845.3 × 106 U.S. in 1986 to $10,127.3 × 106 U.S. in 2015. This decline in ESV is attributed to a corresponding decrease in the total area of wetland, grasslands, and water bodies.
- (2)
- The water supply, waste treatment, biodiversity protection, and recreation and cultural services were the top four ecosystem services in terms of service value, with a combined contribution of 77.05% to the total service value. The ecosystem functions based on contributions to the total ecosystem service value were as follows, in decreasing order: water supply, waste treatment, biodiversity protection, recreation and cultural services, soil formation, climate regulation, gas regulation food production, and raw material.
- (3)
- The sensitivity analysis showed a value below one and often close to zero, indicating that the estimated ESV of the study area was considerably inelastic with respect to the value coefficients. The estimated result was robust despite uncertainties in the value coefficients.
The population density changes, agricultural disturbances, and socio-economic policies were the most significant driving forces for LULCC. Results from this study suggest that anthropogenic activities in fragile and arid lands should be pursued with caution. We recommend policymakers to consider efficient measures in light of the local conditions.
Acknowledgments
This research was supported by National Natural Science Foundation of China (Grant Number: U1703102), the graduate student research innovation project of Xinjiang Uyghur Autonomous Region of China (Grant Number: XJGRI2014021).
Author Contributions
For this paper, Aynur Mamat completed the data collection process and carried out the interpretation, and wrote the manuscript. Ümüt Halik and Aihemaitijiang Rouzi designed the experimental method and revised the paper. We would like to thank for anonymous reviewers for their constructive comments, which improved the quality of this manuscript.
Conflicts of Interest
The authors declare no conflict of interest.
References
- Chuai, X.W.; Huang, X.J.; Wu, C.Y. Land use and ecosystems services value changes and ecological land management in coastal Jiangsu, China. Habitat Int. 2016, 57, 164–174. [Google Scholar] [CrossRef]
- Li, R.Q.; Dong, M.; Cui, J.Y. Quantification of the impact of land-use changes on ecosystem services: A case study in Pingbian County, China. Environ. Monit. Assess. 2007, 128, 503–510. [Google Scholar] [CrossRef] [PubMed]
- Mamat, S.; Mamattursun, E.; Taxpolat, T. The effects of land-use change on ecosystem service value of desert oasis: A case study in Ugan-Kuqa River Delta Oasis, China. Can. J. Soil Sci. 2012, 93, 99–108. [Google Scholar]
- Costanza, R.; Arge, R.; Groot, R. The value of the world’s ecosystem services and natural capital. Nature 1997, 387, 253–260. [Google Scholar] [CrossRef]
- Terefe, T.; Feyera, S.; Moges, K. The impact of land use/land cover change on ecosystem services in the central highlands of Ethiopia. Ecosyst. Serv. 2017, 23, 47–54. [Google Scholar]
- Wang, S.X.; Wu, B.; Yang, P.N. Assessing the changes in land use and ecosystem services in an oasis agricultural region of Yanqi Basin, northwest China. Environ. Monit. Assess. 2014, 186, 8343–8357. [Google Scholar] [CrossRef] [PubMed]
- Hu, H.B.; Liu, W.J.; Min, C. Impact of land use and land cover changes on ecosystem services in Menglun, Xishuangbanna, Southwest China. Environ. Monit. Assess. 2008, 146, 147–156. [Google Scholar] [CrossRef] [PubMed]
- Li, T.H.; Li, W.K.; Qian, Z.H. Variations in ecosystem service value in response to land use changes in Shenzhen. Ecol. Econ. 2010, 69, 1427–1435. [Google Scholar]
- Stephen, P.; Erik, N.; Derric, P. The impact of land-use change on ecosystem services, biodiversity and returns to landowners: A case study in the state of Minnesota. Environ. Resour. Econ. 2011, 48, 219–242. [Google Scholar]
- Kreuter, U.P.; Harris, H.G.; Matlock, M.D. Change in ecosystem service values in the San Antonio area, Texas. Ecol. Econ. 2001, 39, 333–346. [Google Scholar] [CrossRef]
- Nahuelhual, L.; Carmona, A.; Aguayo, M. Land use change and ecosystem services provision: A case study of recreation and ecotourism opportunities in southern Chile. Landsc. Ecol. 2014, 29, 329–344. [Google Scholar] [CrossRef]
- Chen, X.Z. A study on the value change of land ecosystem services in Huangguoshu scenic area. Asian Agric. Res. 2016, 64, 57–60. [Google Scholar]
- Zang, Z.; Zou, X.Q.; Zuo, P. Impact of landscape patterns on ecological vulnerability and ecosystem service values: An empirical analysis of Yancheng Nature Reserve in China. Ecol. Indic. 2017, 72, 142–152. [Google Scholar] [CrossRef]
- Adam, J.; Sharolyn, A.; Michael, J.B.D.; Paul, C.S. Revisiting ecosystem services: Assessment and valuation as starting points for environmental politics. Sustainability 2017, 9, 1755. [Google Scholar]
- Frederik, L.; Hubert, G.; Liesbet, V. valuing ecosystem services to explore scenarios for adaptive spatial planning. Ecol. Indic. 2017, 81, 30–40. [Google Scholar]
- Uta, S.; Marina, K.; Georg, L.; Veronika, F.; Erich, T.; Ulrike, T. Future impacts of changing land-use and climate on ecosystem services of mountain grassland and their resilience. Ecosyst. Serv. 2017, 26, 79–94. [Google Scholar]
- Costanza, R.; de Groot, R.; Braat, L.; Kubiszewski, I.; Fioramonti, L.; Sutton, P.; Farber, S.; Grasso, M. Twenty years of ecosystem services: How far have we come and how far do we still need to go? Ecosyst. Serv. 2017, 28, 1–16. [Google Scholar] [CrossRef]
- Xie, G.D.; Lu, C.X.; Leng, Y.F. Ecological assets valuation of the Tibetan Plateau. J. Nat. Resour. 2003, 18, 189–196. (In Chinese) [Google Scholar]
- Mamattursun, E.; Hamid, Y.; Zulpiya, T. Variations in ecosystem service value in response to Oasis land-use change in Keriya Oasis, Tarim Basin, China. Nat. Areas J. 2014, 34, 353–364. [Google Scholar]
- Zulpiya, M.; Ümüt, H.; Maierdang, K.; Ayjamal, K.; Kalbinur, N. Variation of the floodplain forest ecosystem service value in the lower reaches of Tarim River, China. Land Degrad. Dev. 2017, 1–29. [Google Scholar] [CrossRef]
- Perring, M.P.; De Frenne, P.; Baeten, L.; Maes, S.L.; Depauw, L.; Blondeel, H.; Carón, M.M.; Verheyen, K. Global environmental change effects on ecosystems: The importance of land-use legacies. Glob. Chang. Biol. 2016, 22, 1361–1371. [Google Scholar] [CrossRef] [PubMed]
- Xu, Y.; Tang, H.P.; Wang, B.J. Effects of land-use intensity on ecosystem services and human well-being: A case study in Huailai County, China. Environ. Earth Sci. 2016, 75, 416–428. [Google Scholar] [CrossRef]
- Fu, B.L.; Li, Y.; Wang, Y.Q. Evaluation of ecosystem service value of riparian zone using land use data from 1986 to 2012. Ecol. Indic. 2016, 69, 873–881. [Google Scholar] [CrossRef]
- Ian, J.B.; Georgina, M.M.; Carlo, F. Economic analysis for ecosystem Service assessments in an oasis agricultural region of Yanqi Basin, northwest China. Environ. Monit. Assess. 2011, 186, 8343–8357. [Google Scholar]
- Tarras, D.; Raver, F.; Reed, M.S. Land degradation assessment through an ecosystem services lens: Integrating knowledge and methods in pastoral semi-arid systems. J. Arid Environ. 2016, 124, 205–213. [Google Scholar] [CrossRef]
- He, Y.B.; Chen, Y.Q.; Tang, H.J. Exploring spatial change and gravity center movement for ecosystem services value using a spatially explicit ecosystem services value index and gravity model. Environ. Monit. Assess. 2011, 175, 563–571. [Google Scholar] [CrossRef] [PubMed]
- Jerome, D.; Lluis, P.; Jorge, B. Using ecosystem services valuation to measure the economic impacts of land-use changes on the Spanish Mediterranean coast (El Maresme, 1850–2010). Reg. Environ. Chang. 2016, 16, 1075–1088. [Google Scholar]
- Jiang, S.; Zhu, Q.Z.; Zhang, Z.H. Landscape changes and its driving force in Kashgar. Agric. Res. Arid Area 2011, 29, 210–219. (In Chinese) [Google Scholar]
- Dong, M. Analysis of Land Use Change and Its Driving Forces in Kashgar Area of Xinjiang. Master’s Thesis, Northeast Forestry University, Harbin, China, 2016. (In Chinese). [Google Scholar]
- Li, Q. The Relationship between Land Use Change and Eco-Environment Based on RS & GIS in Kashgar Region. Master’s Thesis, Chang’an University, Xi’an, China, 2014. (In Chinese). [Google Scholar]
- Wang, W.J.; Zhang, Y.F. Analysis on the changes and driving forces of cultivated land in Kashgar area based on GIS. Hubei Agric. Sci. 2016, 55, 4561–4566. (In Chinese) [Google Scholar]
- Liu, G.Y.; Gao, M.H.; Yan, L. Study on the change of Kashgar administrative offices oasis over 30 year period based on RS/GIS. J. Shaanxi Univ. Sci. Technol. 2008, 3, 120–125. (In Chinese) [Google Scholar]
- Amee, K.T.; Venkappayya, R.D.; Ajay, P. Post-classification corrections in improving the classification of Land Use/Land Cover of arid region using RS and GIS: The case of Arjuni watershed, Gujarat, India. Egypt. J. Remote Sens. Space Sci. 2017, 20, 79–89. [Google Scholar]
- Li, Q.; Kong, J.L. Kashgar region’s economic development zone land use spatial change analysis Based on GIS. J. Shanxi Inst. Social. 2014, 1, 53–59. (In Chinese) [Google Scholar]
- Liu, S.; Costanza, R. Ecosystem services valuation in China. Ecol. Econ. 2010, 69, 1387–1398. [Google Scholar] [CrossRef]
- Mengistie, K.; Thomas, S.; Demel, T.; Thomas, K. Changes of ecosystem service values in response to land use/land cover dynamics in Munessa–Shashemene landscape of the Ethiopian highlands. Sci. Total Environ. 2016, 547, 137–147. [Google Scholar]
- Anna, F.C.; Kate, A.B.; Rebecca, C.K.; Andreas, H.; Guy, Z.; Ralf, S. Priorities to advance monitoring of ecosystem services using earth observation. Trends Ecol. Evolut. 2017, 32, 416–429. [Google Scholar]
- Zhang, Z.M.; Gao, J.F.; Fan, X.Y. Assessing the variable ecosystem services relationships in polders time: A case study in the eastern Chaohu Lake Basin, China. Environ. Earth Sci. 2016, 75, 856–867. [Google Scholar] [CrossRef]
- Zhou, C.P. Assessment on the eco-environment and the Land Use Based on the Ecosystem Service Value—A Case of Guangdong Province, China. Asian Agric. Res. 2010, 40, 34–36. [Google Scholar]
- Ning, J.; Liu, J.Y.; Zhao, G.S. Spatio-temporal characteristics of disturbance of land use change on major ecosystem function zones in China. Chin. Geogr. Sci. 2015, 5, 523–536. [Google Scholar] [CrossRef]
- Zhang, Z.; Gao, J.; Gao, Y. The influences of land use changes on the value of ecosystem services in Chaohu Lake Basin, China. Environ. Earth Sci. 2015, 74, 1–11. [Google Scholar] [CrossRef]
- Zhao, B.; Kreuter, U.P.; Li, B. An ecosystem service value assessment of land-use change on Chongming Island, China. Land Use Policy 2004, 21, 139–148. [Google Scholar] [CrossRef]
- Peng, W.F.; Wang, G.J.; Zhou, J.M. Effects of the land use change on ecosystem service value based on RS and GIS. J. Landsc. Res. 2015, 7, 21–26. [Google Scholar]
- Peng, W.F.; Zhou, J.M.; Fan, S.Y. Effects of the land use change on ecosystem service value in Chengdu, western China from 1978 to 2010. J. Indian Soc. Remote Sens. 2016, 44, 197–206. [Google Scholar] [CrossRef]
- Si, J.; Nasiri, F.Z.; Han, P. Variation in ecosystem service values in response to land use changes in Zhifanggou watershed of Loess plateau: a comparative study. Environ. Syst. Res. 2014, 3, 2–10. [Google Scholar] [CrossRef]
- Lu, Y.; Wang, J.; Wei, L.Y. Land use change and its impact on values of ecosystem services in the west of Jilin province. Wuhan Univ. J. Nat. Sci. 2006, 11, 1028–1034. [Google Scholar]
- Vera, C.V.; Arturo, R.L.; Andrea, G. Effects of land use changes on the ecosystem service values of coastal wetlands. Environ. Manag. 2014, 54, 852–864. [Google Scholar]
- Fan, Q.D.; Ding, S.Y. Response of ecosystem services to land use change in county scale of Fengqiu, Henan Province, China. Arab. J. Geosci. 2015, 8, 9015–9022. [Google Scholar]
- Wang, M.; Sun, X.F. Potential impact of land use change on ecosystem services in China. Environ. Monit. Assess. 2016, 188, 248–261. [Google Scholar] [CrossRef] [PubMed]
- Wang, Y.; Chen, Y.N.; Ding, J.L. Land-use conversion and its attribution in the Kaidu-Kongqi River Basin, China. Quat. Int. 2015, 380, 216–223. [Google Scholar] [CrossRef]
- Wang, Z.M.; Zhang, B.; Zhang, S.Q. Changes of land use and of ecosystem service values in Sanjiang Plain, Northeast China. Environ. Monit. Assess. 2006, 112, 69–91. [Google Scholar] [CrossRef] [PubMed]
- Lichtenberg, E.; Ding, C.R. Assessing farm land protection policy in China. Land Use Policy 2008, 25, 59–68. [Google Scholar] [CrossRef]
- Shi, Y.; Wang, R.S.; Huang, J.L. An analysis of the spatial and temporal changes in Chinese terrestrial ecosystem service functions. Chin. Sci. Bull. 2012, 17, 2120–2131. [Google Scholar] [CrossRef]
- Wang, Z.L.; Wang, Z.M.; Bai, Z. Impact of land use/land cover changes on ecosystem services in the Nenjiang River Basin, Northeast China. Ecol. Processes 2015, 4, 11–23. [Google Scholar] [CrossRef]
- Cao, S.J.; Li, C.; Cao, S.H. Change in ecosystem service value arising from land consolidation planning in Anhui province. Asian Agric. Res. 2013, 5, 13–16. [Google Scholar]
- Hu, X.S.; Wu, C.Z.; Hong, W. Impact of land-use change on ecosystem service values and their effects under different intervention scenarios in Fuzhou City, China. Geosci. J. 2013, 17, 497–504. [Google Scholar] [CrossRef]
Figure 1.
Map showing the location of the Kashgar region in Northwest China.

Figure 2.
Land-use maps of the Kashgar region for 1986, 1996, 2005, and 2015.

Figure 3.
Land-use change chart of the Kashgar region for 1996–1986, 2005–1996, 2015–2005, and 2015-1986.
Figure 3.
Land-use change chart of the Kashgar region for 1996–1986, 2005–1996, 2015–2005, and 2015-1986.

Figure 4.
Ecosystem function chart of the Kashgar region for 1996–1986, 2005–1996, 2015–2005, and 2015–1986.
Figure 4.
Ecosystem function chart of the Kashgar region for 1996–1986, 2005–1996, 2015–2005, and 2015–1986.

Figure 5.
(a) Population increase and (b) rate of population increase.


Table 1.
Landsat data acquired from 1986-2015.
| Path/Row | Acquisition Data | |||
|---|---|---|---|---|
| 1986 | 1996 | 2005 | 2015 | |
| 147/032 | 24 September 1986 | 15 September 1996 | 15 September 2005 | 20 August 2015 |
| 147/033 | 24 September 1986 | 14 September 1996 | 15 September 2005 | 20 August 2015 |
| 147/034 | 13 September 1986 | 8 October 1996 | 14 September 2005 | 12 September 2015 |
| 147/035 | 2 October 1986 | 7 October 1996 | 29 August 2005 | 11 August 2015 |
| 148/032 | 22 September 1986 | 30 September 1996 | 29 August 2005 | 26 July 2015 |
| 148/033 | 19 September 1986 | 9 September 1996 | 29 August 2005 | 28 September 2015 |
| 148/034 | 18 September 1986 | 5 September 1996 | 11 July 2005 | 19 September 2015 |
| 148/035 | 10 September 1986 | 17 September 1996 | 23 August 2005 | 19 September 2015 |
| 149/032 | 30 August 1986 | 24 August 1996 | 12 August 2005 | 19 September 2015 |
| 149/033 | 9 September 1986 | 29 August 1996 | 26 July 2005 | 10 September 2015 |
| 149/034 | 25 September 1986 | 26 August 1996 | 26 July 2005 | 26 September 2015 |
| 149/035 | 30 August 1986 | 26 August 1996 | 18 July 2005 | 26 September 2015 |
Table 2.
Confusion matrix of image classification in 1986, 1996, 2005 and 2015.
| 1986 Class Types | Actual Types | ||||||||
| (C) | (F) | (G) | (W) | (C) | (S) | (W) | (S) | (U) | |
| Cultivated land (C) | 88 | 9 | 7 | 2 | 2 | 1 | 0 | 0 | 0 |
| Forestland (F) | 2 | 84 | 4 | 1 | 0 | 3 | 2 | 0 | 0 |
| Grassland (G) | 2 | 2 | 83 | 2 | 1 | 5 | 3 | 0 | 0 |
| Water body (W) | 0 | 0 | 3 | 92 | 0 | 0 | 7 | 0 | 0 |
| Construction land (C) | 4 | 0 | 1 | 0 | 95 | 1 | 0 | 0 | 0 |
| Salinized land (S) | 3 | 4 | 1 | 0 | 0 | 89 | 1 | 3 | 1 |
| Wetland (W) | 1 | 1 | 1 | 3 | 2 | 1 | 86 | 0 | 3 |
| Sandy land (S) | 0 | 0 | 0 | 0 | 0 | 0 | 1 | 93 | 2 |
| Unused land (U) | 0 | 0 | 0 | 0 | 1 | 0 | 0 | 4 | 94 |
| Total | 100 | 100 | 100 | 100 | 100 | 100 | 100 | 100 | 100 |
| Total accuracy of classification = 89% Kappa = 0.881 | |||||||||
| 1996 Class Types | Actual Types | ||||||||
| (C) | (F) | (G) | (W) | (C) | (S) | (W) | (S) | (U) | |
| Cultivated land (C) | 89 | 4 | 2 | 0 | 6 | 3 | 2 | 1 | 0 |
| Forestland (F) | 1 | 87 | 3 | 0 | 2 | 0 | 0 | 0 | 0 |
| Grassland (G) | 2 | 3 | 88 | 2 | 1 | 1 | 0 | 1 | 0 |
| Water body (W) | 1 | 2 | 1 | 88 | 1 | 0 | 2 | 0 | 0 |
| Construction land (C) | 2 | 1 | 1 | 2 | 89 | 1 | 0 | 0 | 0 |
| Salinized land (S) | 2 | 0 | 1 | 2 | 0 | 92 | 1 | 1 | 1 |
| Wetland (W) | 1 | 1 | 2 | 6 | 0 | 1 | 93 | 0 | 3 |
| Sandy land (S) | 1 | 1 | 0 | 1 | 0 | 1 | 2 | 96 | 2 |
| Unused land (U) | 1 | 1 | 2 | 1 | 1 | 1 | 0 | 1 | 95 |
| Total | 100 | 100 | 100 | 100 | 100 | 100 | 100 | 100 | 100 |
| Total accuracy of classification = 92% Kappa = 0.908 | |||||||||
| 2005 Class Types | Actual Types | ||||||||
| (C) | (F) | (G) | (W) | (C) | (S) | (W) | (S) | (U) | |
| Cultivated land (C) | 92 | 1 | 4 | 2 | 2 | 2 | 1 | 0 | 1 |
| Forestland (F) | 3 | 89 | 1 | 0 | 1 | 1 | 2 | 0 | 1 |
| Grassland (G) | 2 | 2 | 91 | 1 | 2 | 0 | 1 | 0 | 0 |
| Water body (W) | 0 | 0 | 1 | 87 | 1 | 2 | 1 | 0 | 0 |
| Construction land (C) | 1 | 2 | 0 | 1 | 87 | 0 | 0 | 0 | 0 |
| Salinized land (S) | 2 | 2 | 2 | 2 | 2 | 90 | 1 | 1 | 1 |
| Wetland (W) | 0 | 1 | 1 | 4 | 2 | 1 | 94 | 0 | 4 |
| Sandy land (S) | 0 | 1 | 0 | 2 | 2 | 2 | 0 | 97 | 3 |
| Unused land (U) | 0 | 1 | 0 | 1 | 1 | 2 | 0 | 2 | 91 |
| Total | 100 | 100 | 100 | 100 | 100 | 100 | 100 | 100 | 100 |
| Total accuracy of classification = 90.1% Kappa = 0.891 | |||||||||
| 2015 Class Types | Actual Types | ||||||||
| (C) | (F) | (G) | (W) | (C) | (S) | (W) | (S) | (U) | |
| Cultivated land (C) | 91 | 2 | 2 | 4 | 5 | 0 | 2 | 1 | 1 |
| Forestland (F) | 2 | 88 | 3 | 2 | 2 | 1 | 2 | 1 | 1 |
| Grassland (G) | 2 | 3 | 90 | 1 | 2 | 1 | 1 | 1 | 1 |
| Water body (W) | 0 | 2 | 0 | 88 | 0 | 0 | 1 | 1 | 1 |
| Construction land (C) | 2 | 1 | 0 | 0 | 86 | 0 | 0 | 0 | 0 |
| Salinized land (S) | 2 | 1 | 1 | 1 | 2 | 92 | 1 | 0 | 1 |
| Wetland (W) | 1 | 1 | 4 | 4 | 1 | 2 | 91 | 1 | 1 |
| Sandy land (S) | 0 | 1 | 0 | 0 | 1 | 0 | 1 | 93 | 4 |
| Unused land (U) | 0 | 1 | 0 | 0 | 1 | 2 | 1 | 2 | 90 |
| Total | 100 | 100 | 100 | 100 | 100 | 100 | 100 | 100 | 100 |
| Total accuracy of classification = 89% Kappa = 0.88 | |||||||||
Table 3.
Land-use categories in the Kashgar region, together with their definitions.
| Land Use Category | Definition |
|---|---|
| Cultivated land | Areas cultivated with dense annual crops and vegetables, including dry land and irrigated land. |
| Forestland | Areas of dense forest, open forest, orchards, and nurseries. |
| Grassland | Land with natural grassland cover, including steppes and grazing lands. |
| Water body | Rivers, lakes, and artificial water areas. |
| Construction land | All land used to construct human structures, including residential, commercial, and industrial buildings as well as transportation facilities, highways, rail ways, and family houses. |
| Salinized land | Land with salt on top soil. |
| Wetland | Mainly marshes along river banks, characterized by poor drainage moisture, and surface-grown |
| long-term hygrophytes. | |
| Sandy land | Land covered with sand, with a vegetation cover of less than 5%. |
| Unused land | Uncultivated areas with sparse plant cover, including barren, rocky, or abandoned sandy land in slopes, bare land. |
Table 4.
Ecosystem services value (ESVf) per unit area for the different land-use categories ($/ha/year).
Table 4.
Ecosystem services value (ESVf) per unit area for the different land-use categories ($/ha/year).
| Ecosystem Services Value (USD/ha/year) | |||||||||
|---|---|---|---|---|---|---|---|---|---|
| ESVf | Cultivated | Forest | Grass | Water | Construction | Salinized | Wet | Sandy | Unused |
| Gas regulation | 74.7 | 299.4 | 104. | 0.0 | 0.0 | 2.3 | 268.9 | 0.0 | 4.2 |
| Climate regulation | 133.0 | 282.1 | 108. | 68.7 | 0.0 | 0.0 | 2554.7 | 0.0 | 9.0 |
| Water supply | 89.6 | 283.5 | 105. | 3047.7 | 0.0 | 39.4 | 2315.6 | 4.1 | 4.8 |
| Soil formation | 218.1 | 278.6 | 155. | 1.5 | 0.0 | 0.2 | 255.5 | 2.7 | 11.8 |
| Waste treatment | 245.0 | 119.2 | 91.5 | 2719.0 | 0.0 | 55.6 | 2716.0 | 1.4 | 18.0 |
| Biodiversity protection | 106.1 | 312.6 | 130 | 372.0 | 0.0 | 3.2 | 373.5 | 46.4 | 27.7 |
| Food production | 149.4 | 22.9 | 29.8 | 14.9 | 0.0 | 12.1 | 44.8 | 1.4 | 1.4 |
| Raw material | 14.9 | 206.5 | 25.0 | 1.5 | 0.0 | 1.1 | 10.5 | 0.0 | 2.8 |
| Recreation and culture | 1.5 | 144.2 | 60.3 | 648.4 | 12.7 | 15.3 | 829.2 | 1.4 | 16.6 |
| Total | 1032.3 | 1948.9 | 809 | 6873.8 | 12.7 | 129.2 | 9368.7 | 57.3 | 96.4 |
Table 5.
Land-use patterns in the Kashgar region in 1986, 1996, 2005, and 2015.
| Land Use Type | 1986 | 1996 | 2005 | 2015 | ||||
|---|---|---|---|---|---|---|---|---|
| Area (103 ha) | % of Total | Area (103 ha) | % of Total | Area (103 ha) | % of Total | Area (103 ha) | % of Total | |
| Cultivated | 883.6 | 7.8 | 963 | 8.5 | 1095.8 | 9.7 | 1454.5 | 12.8 |
| Forest | 221.9 | 2.0 | 278.3 | 2.5 | 321.4 | 2.8 | 338.1 | 3.0 |
| Grass | 3063.9 | 27.0 | 2824.1 | 24.9 | 2534.6 | 22.3 | 1901.9 | 16.8 |
| Water | 875.7 | 7.7 | 782.2 | 6.9 | 772.9 | 6.8 | 803.1 | 7.1 |
| Construction | 32.9 | 0.3 | 37.4 | 0.3 | 42.5 | 0.4 | 49.4 | 0.4 |
| Salinized | 377.3 | 3.3 | 370.9 | 3.3 | 326.4 | 2.9 | 298.1 | 2.6 |
| Wet | 52.6 | 0.5 | 109.3 | 1.0 | 70.1 | 0.6 | 40.3 | 0.4 |
| Sandy | 2588 | 22.8 | 2880.2 | 25.4 | 3143.3 | 27.7 | 3335.6 | 29.4 |
| Unused | 3254.3 | 28.7 | 3104.8 | 27.4 | 3043.2 | 26.8 | 3129.2 | 27.6 |
Table 6.
Land cover conversion from 1986 to 2015 (103ha).
| 1986–2015 | (C) | (F) | (G) | (W) | (C) | (S) | (W) | (S) | (U) | Gain |
|---|---|---|---|---|---|---|---|---|---|---|
| Cultivated land (C) | 600.2 | 29.1 | 688.5 | 5.9 | 6.9 | 9.7 | 8.4 | 38.0 | 67.7 | 854.2 |
| Forest land (F) | 14.7 | 122.1 | 54.0 | 0.2 | 0.0 | 94.2 | 3.1 | 23.1 | 16.7 | 206.0 |
| Grass land (G) | 146.9 | 35.9 | 1607.3 | 87.0 | 0.4 | 7.6 | 4.1 | 33.4 | 109.9 | 425.2 |
| Water body (W) | 12.6 | 2.0 | 69.3 | 535.5 | 5.0 | 0.1 | 2.6 | 2.8 | 278.2 | 367.6 |
| Construction land (C) | 13.5 | 0.4 | 10.2 | 0.1 | 21.0 | 3.1 | 0.0 | 0.8 | 0.5 | 28.6 |
| Salinized land (S) | 5.5 | 18.7 | 85.2 | 2.8 | 0.0 | 172.1 | 0.3 | 6.8 | 6.7 | 126.0 |
| Wetland (W) | 8.8 | 1.1 | 2.6 | 2.0 | 0.7 | 3.1 | 21.2 | 2.3 | 3.5 | 24.1 |
| Sandy land (S) | 0.8 | 11.9 | 82.5 | 0.5 | 0.0 | 23.2 | 3.1 | 2440.4 | 43.1 | 165.1 |
| Unused land (U) | 70.0 | 0.7 | 464.3 | 121.7 | 3.9 | 64.2 | 0.0 | 40.4 | 2643.4 | 765.2 |
| Loss | 272.8 | 99.8 | 1456.6 | 220.2 | 11.9 | 205.2 | 21.6 | 147.6 | 526.3 |
Table 7.
ESV of the Kashgar region in 1986, 1996, 2005, and 2015 (106 U.S.D.).
| Land Use Types | 1986 | 1996 | 2005 | 2015 | 1986–1996 (%) | 1996–2005 (%) | 2005–2015 (%) | 1986–2015 (%) |
|---|---|---|---|---|---|---|---|---|
| Cultivated Land | 912.14 | 994.1 | 1131.2 | 1501.5 | 8.99 | 13.79 | 32.7 | 64.6 |
| Forest Land | 432.48 | 542.4 | 626.4 | 659 | 25.42 | 15.49 | 5.2 | 52.4 |
| Grass Land | 2477.5 | 2218.9 | 2049 | 1537 | –10.44 | –7.66 | –25.0 | –38.0 |
| Water Body | 6019.3 | 5926.5 | 5312.7 | 5520.3 | –1.54 | –10.36 | 3.9 | –8.3 |
| ConstructionLand | 0.42 | 0.5 | 0.54 | 0.63 | 13.68 | 8 | 16.2 | 50 |
| Salinized Land | 48.75 | 47.9 | 42.2 | 38.5 | –1.7 | –11.9 | –8.7 | –21.0 |
| Wet Land | 492.79 | 1024 | 656.77 | 377.6 | 107.79 | –35.86 | –42.5 | –23.4 |
| Sandy Land | 148.55 | 165.3 | 180.4 | 191.5 | 11.29 | 9.13 | 6.1 | 28.9 |
| Unused Land | 313.39 | 299 | 293.1 | 301.3 | –4.59 | –1.97 | 2.8 | –3.9 |
| Total | 10,845.3 | 11218.6 | 10,291.7 | 10,127.3 | 3.44 | –8.26 | –1.6 | –6.6 |
Table 8.
ESVf in 1986, 1996, 2005, and 2015 (106 U.S.D.).
| ESVf | 1986 | 1996 | 2005 | 2015 | % | Rank | Trend |
|---|---|---|---|---|---|---|---|
| Gas regulation | 479.77 | 483.93 | 474.1 | 432.3 | 4.40 | 7 | ↓ |
| Climate regulation | 734.84 | 869.36 | 769.7 | 680.5 | 7.19 | 6 | ↓ |
| Water supply | 3295.56 | 3375.46 | 3013.7 | 3007.2 | 29.88 | 1 | ↓ |
| Soil formation | 789.66 | 786.61 | 784.9 | 763.7 | 7.36 | 5 | ↓ |
| Waste treatment | 3130.35 | 3241.91 | 2907.9 | 2941.3 | 28.77 | 2 | ↓ |
| Biodiversity protection | 1118.26 | 1128.3 | 1090.1 | 1062.7 | 10.36 | 3 | ↓ |
| Food production | 256.54 | 262.63 | 273.9 | 308.2 | 2.59 | 8 | ↑ |
| Raw material | 146.98 | 151.96 | 156.8 | 149.8 | 1.43 | 9 | ↓ |
| Recreation and culture | 893.33 | 918.45 | 820.6 | 781.6 | 8.04 | 4 | ↓ |
| Total | 10,845.3 | 11,218.61 | 10,291.7 | 10,127.3 | ↓ |
Table 9.
Percentage change in estimated total ESV and coefficient of sensitivity.
| Change in Value Coefficient | 1986 | 1996 | 2005 | 2015 | ||||
|---|---|---|---|---|---|---|---|---|
| % | CS | % | CS | % | CS | % | CS | |
| Cultivated land VC ± 50% | 7.41 | 0.15 | 7.90 | 0.16 | 5.49 | 0.11 | 7.41 | 0.15 |
| Forest land VC ± 50% | 3.48 | 0.07 | 4.34 | 0.09 | 3.04 | 0.06 | 3.25 | 0.07 |
| Grass land VC ± 50% | 14.45 | 0.30 | 16.50 | 0.33 | 9.94 | 0.20 | 7.59 | 0.15 |
| Water body VC ± 50% | 27.89 | 0.56 | 29.11 | 0.58 | 25.77 | 0.52 | 27.23 | 0.54 |
| Construction land VC ± 50% | 0.12 | 0.00 | 0.12 | 0.00 | 0.00 | 0.00 | 0.00 | 0.00 |
| Salinized land VC ± 50% | 0.09 | 0.00 | 0.10 | 0.00 | 0.20 | 0.00 | 0.19 | 0.00 |
| Wetland VC ± 50% | 4.32 | 0.09 | 8.91 | 0.18 | 3.18 | 0.06 | 1.86 | 0.04 |
| Sandy land VC ± 50% | 0.77 | 0.02 | 0.90 | 0.02 | 0.87 | 0.02 | 0.94 | 0.02 |
| Unused land VC ± 50% | 2.21 | 0.04 | 2.61 | 0.05 | 1.57 | 0.03 | 1.51 | 0.03 |
© 2018 by the authors. Licensee MDPI, Basel, Switzerland. This article is an open access article distributed under the terms and conditions of the Creative Commons Attribution (CC BY) license (http://creativecommons.org/licenses/by/4.0/).
Share and Cite
MDPI and ACS Style
Mamat, A.; Halik, Ü.; Rouzi, A. Variations of Ecosystem Service Value in Response to Land-Use Change in the Kashgar Region, Northwest China. Sustainability 2018, 10, 200. https://doi.org/10.3390/su10010200
AMA Style
Mamat A, Halik Ü, Rouzi A. Variations of Ecosystem Service Value in Response to Land-Use Change in the Kashgar Region, Northwest China. Sustainability. 2018; 10(1):200. https://doi.org/10.3390/su10010200
Chicago/Turabian StyleMamat, Aynur, Ümüt Halik, and Aihemaitijiang Rouzi. 2018. "Variations of Ecosystem Service Value in Response to Land-Use Change in the Kashgar Region, Northwest China" Sustainability 10, no. 1: 200. https://doi.org/10.3390/su10010200
Note that from the first issue of 2016, this journal uses article numbers instead of page numbers. See further details here.