1. Introduction
Rugby league is a team sport characterised by high-intensity activities such as high-speed (≥5.5 m∙s
−1) running and sprinting (≥7.0 m∙s
−1) actions that are interspersed with contact efforts (i.e., collisions, wrestling and grappling), and low-intensity activities such as standing, walking and jogging [
1,
2,
3]. Largely due to the frequency and intensity of eccentric muscle actions and physical contacts [
4,
5], the demands of match-play may cause post-match perturbations in the hormonal milieu [
5,
6], indices of neuromuscular function [
4,
7,
8], perceptual responses [
5,
9], and muscle soreness [
4]. Knowing the influence of match-play on specific recovery and preparedness to train markers is valuable for practitioners when seeking to modulate training intensity and/or volume thereafter in order to avoid the accumulation of fatigue and subsequent injury, illness and/or underperformance [
10].
Up to 120 h may be required to facilitate full post-match recovery [
8], however most observations from adult players have reported durations of 48–72 h [
7,
11] when profiling the restoration of neuromuscular, biochemical or endocrine, and/or perceptual responses [
12]. These inconsistencies may reflect methodological differences between studies, such as the reliability of the specific variables being examined [
13], between-study differences in match-play demands, as well as discrepancies in training regimes [
8,
14] and recovery strategies [
7,
11] implemented in the post-match period; all of which are known to modulate post-match recovery [
12]. Literature reporting the reliability of the various recovery markers used in collision-sports players is limited, in both senior [
15], and academy [
13] playing standards. Furthermore, whilst some investigations have reported reliability data, it is unclear whether these relate to within- or between-day assessments [
5,
6]. Such information may be important, especially when considering the repeated use of certain measurements in either within- or between-day scenarios. As the reliability of measures may be population-specific [
15], it is important for practitioners to know the reproducibility of tests and variables in their target population.
Previous studies that have profiled post-match responses in rugby league players have often recruited senior age players [
4,
5,
7,
9], and typically neglect those in the later stages of adolescence (i.e., 16–19 years). Notably, investigations assessing responses to match-play in academy rugby union [
14,
16] or rugby league [
6] players remain limited. Differing match demands [
1,
17], and differences in certain physical capabilities associated with specific age groups (i.e., reduced fitness levels and maximal strength) [
18,
19] appear to influence post-match recovery responses [
1,
6]. For this reason, there remains a need for practitioners to understand the magnitude and time-scale of post-match responses in academy players as this is likely to affect the implementation of recovery strategies and training regimes in the post-match period. This statement is especially true given that professional academy players often have additional commitments outside of their rugby careers in the form of school, college or additional employment, which may cause further restrictions and challenges when seeking to maximise recovery [
20]. Collectively, differential post-match responses may be elicited in academy versus senior players when methods that incorporate greater ecological validity (i.e., the extent to which the findings are able to be generalised to real-life settings) [
21] are employed. Therefore, in academy rugby league players, the aim of this study was to A) assess the within- and between-day reliability of neuromuscular and perceptual measures, before B) profiling the time-course of recovery of variables deemed reliable for 120 h post-match. The null hypothesis (H
0) associated with part B of the study was that no differences would occur relative to baseline values after match-play.
4. Discussion
In professional academy rugby league players, the aims of this study were to assess the reliability of neuromuscular and wellness measures (part A) and to profile the time-course of such responses following match-play (part B). Acceptable within- and between-day reliability (i.e., no between-trial differences and CV% ≤ 10% and ICC ≥ 0.8) was achieved by F200, F250 and PF in the IMTP. Most CMJ variables demonstrated acceptable within-day reliability, whilst FT, PF, PP, relative PP, VTO and JH exhibited acceptable between-day reliability. From the wellness questionnaire, only the accumulated total wellness score met the threshold for between-day reliability, whereas four individual components of the wellness questionnaire (i.e., sleep quality, general lower body soreness, mood, total wellness) produced acceptable within-day reliability. The variables demonstrating acceptable between-day reliability were then eligible for use in part B of the study where match-play did not elicit statistically significant post hoc differences relative to baseline values for IMTP performance or total wellness. However, VTO and JH in the CMJ were depressed at +24 h versus baseline. Collectively, these findings indicate that the reliability of specific variables may differ when assessed on a within- or between-day basis. Similarly, the magnitude of the post-match response appeared to depend on the assessment and variables used. Such findings warrant consideration by practitioners when considering the type of measurements to be used in practice – especially when normal recovery, lifestyle and training activities are implemented by academy rugby league players in the post-match period.
Existing research indicated high within- and between-day reliability for IMTP forces elicited at earlier time-points (i.e., F30, F50, F90) in a variety of sporting populations [
37,
38]. These results are not reflected in the current study where force production at 30, 50, and 100 ms generally did not meet acceptable reliability thresholds. As dynamic tasks such as sprinting typically involve ground-contact times of between 50 and 250 ms [
39], exposures to tasks that involve force production within <50 ms are limited in team sport players. It is plausible that this fact may explain the limited reliability of the F30 and F50 values in the present study. Across different sporting populations, the highest levels of reliability are typically found in forces produced at 200 and 250 ms and in PF [
37]; findings which are in agreement with the results of the present study.
Those CMJ variables demonstrating acceptable levels of between-day reliability (i.e., FT, PF, PP, relative PP, VTO and JH) are consistent across a number of sporting populations [
15,
29]. Time-related variables such as time to PF, time to PP, MT and consequently the FT:MT ratio did not meet the threshold for acceptable between-day reliability in the present study; findings which partly reflect those of previous research [
29,
40]. As the present study did not control for CMJ depth, players may have adopted an altered jump strategy when seeking to maximise jump height on each attempt [
41]; especially in part B of the study. Allowing players to implement their preferred jump strategy may have inconsistently influenced displacement of their centre of mass during the eccentric and concentric phases across different jumps [
41]. As a result, time-related variables may have been influenced by modification of the time spent in the eccentric and concentric phases of the movement with a view to maintaining the primary instruction of the jump, being to achieve maximal height.
The monitoring questionnaire used here observed comparable reliability data to a similar questionnaire (i.e., one in which a 1–10 rating is required on soreness across a variety of sites), which was completed throughout the season by elite Australian Rules Football players [
42]. Although comparable reliability (i.e., 7.1%) has been reported in a study of academy rugby union players [
13], such scores may have reflected the absence of any physical activity undertaken between testing days. Akin to the methods of Montgomery and Hopkins [
42], the present study was carried out whilst regular training activities were performed; a methodological issue that may influence different elements of the wellness questionnaire. Nevertheless, as the test-retest reliability of this type of questionnaire may be questioned when used in more ecologically valid scenarios (i.e., including regular training activities) [
43], the current study may provide a more accurate representation of its within- and between-day reliability during the in-season period, and thus have implications for practitioners using such methods in similar scenarios. Notably, contrary to previous research [
43], the internal consistency of the questionnaire (calculated via Cronbach’s Alpha) was deemed acceptable in the present study; a finding which may reflect the absence of negative values for inter-item correlations given that each question was aligned directionally (i.e., negative responses were always categorised as lower numerical values).
Whilst responses to rugby match-play have been profiled using different measures, such as a CMJ [
4,
7,
11], a plyometric push-up [
14], and an adductor squeeze test [
16], the present study is amongst the first to profile the effects of match-play on IMTP responses [
44]. Although match-play did not influence PF during the IMTP, a large ES (0.95) was reported at +24 h following match-play compared to baseline measures, whilst small and trivial ES were observed thereafter. No significant changes were observed in F200 or F250 following match-play, but a large ES (0.9) in F250 was reported at +24 h versus baseline measures, whilst moderate and large ES (≥0.67) were still evident throughout the full post-match period. Prolonged perturbations (based on ES values) seen in some (i.e., F250), but not other (i.e., PF) variables suggest that maximal force production may be less sensitive to the influence of match-play when compared to those measures that include a velocity-component. This finding supports observations following Australian Rules Football match-play, in which the rate of force development was found to be more sensitive to the recovery of neuromuscular function than PF [
44]. When performing sporting actions such as sprinting, jumping and changing direction, ground contact occurs in time intervals between 50–250 ms, therefore it may be more important to apply force quickly as opposed to producing maximal force [
45]. Any reductions in F250 occurring post-match could have implications on athletic performance throughout the training week.
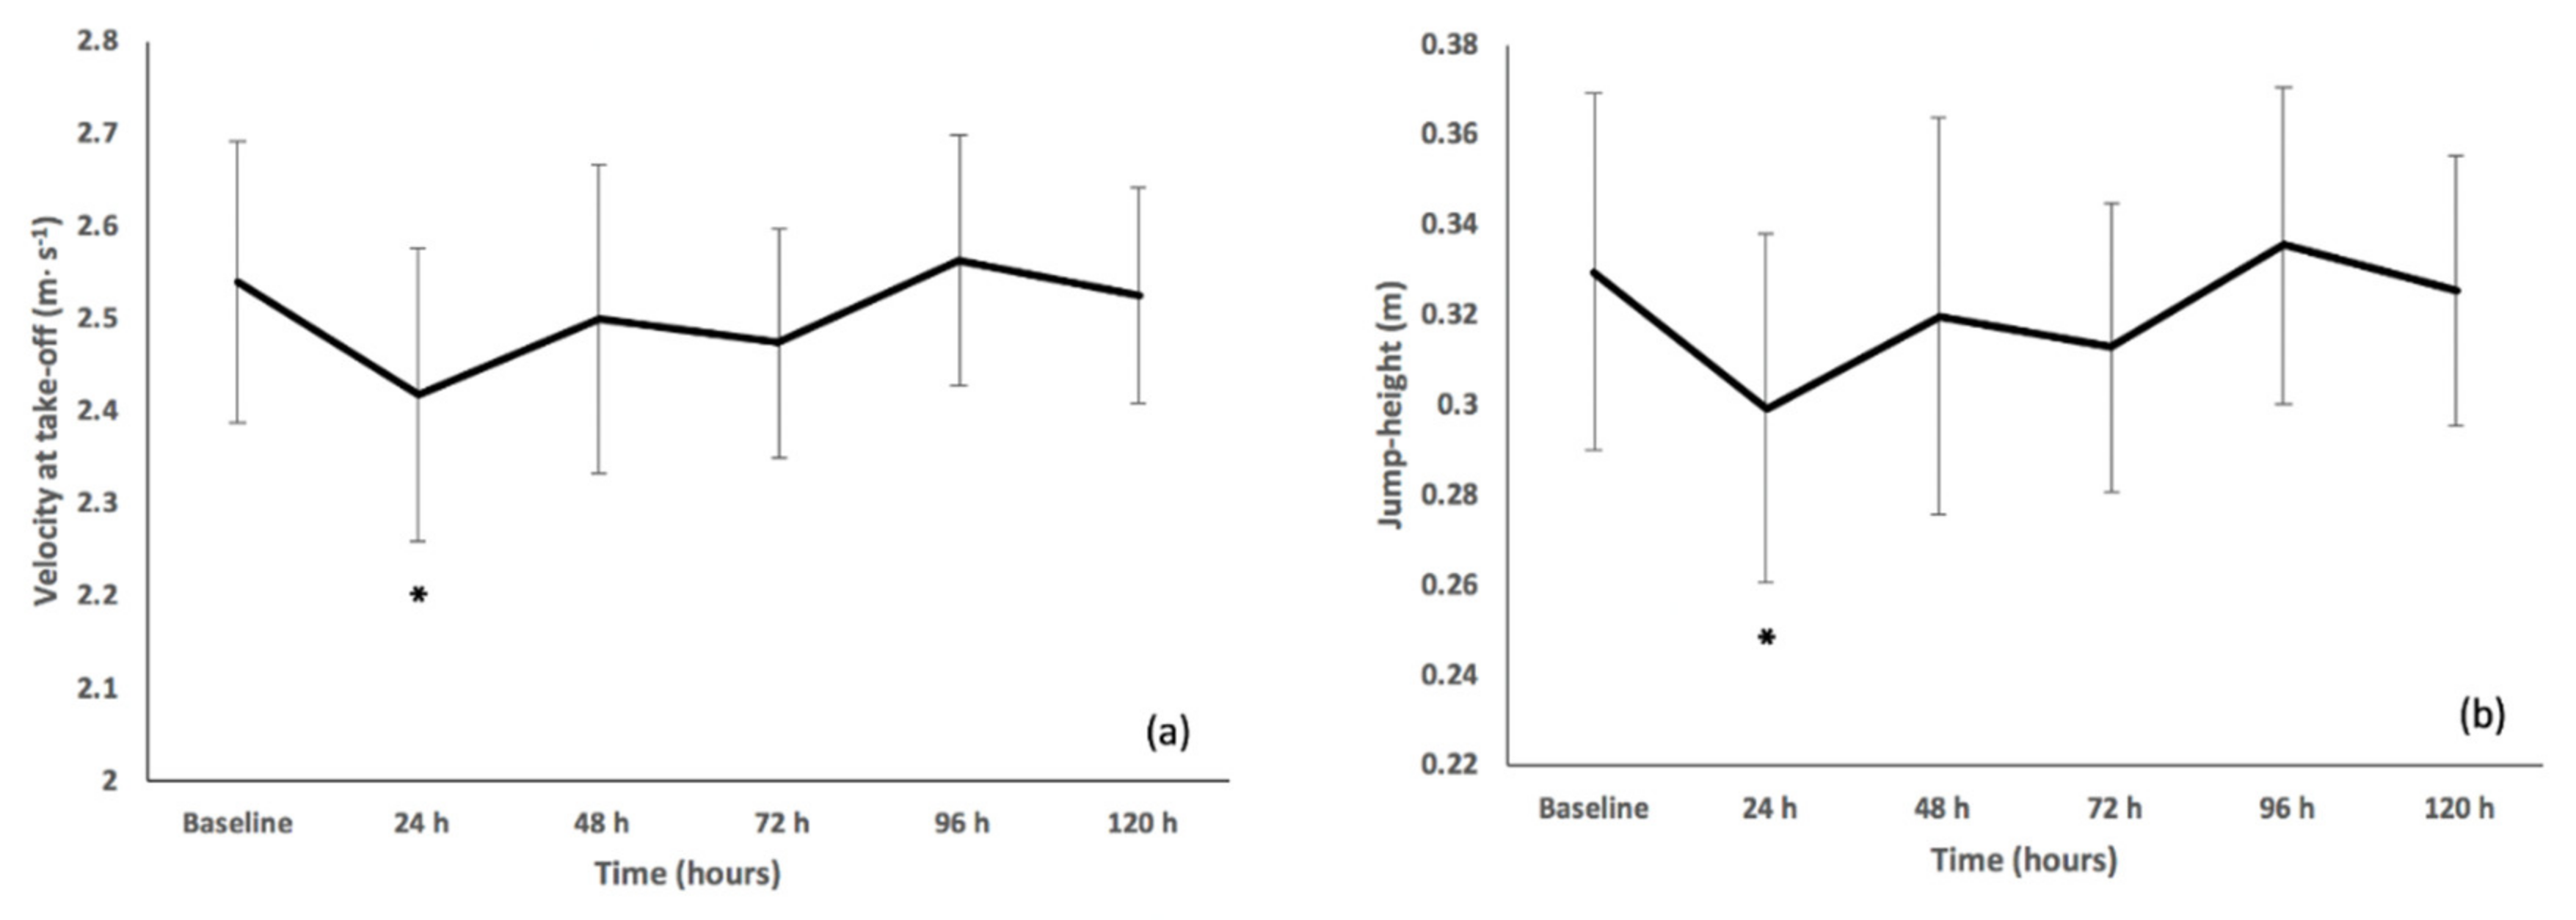
Jump performance was reduced at +24 h following match-play, as indicated by significant differences (p ≤ 0.039) and large ES (≥1.44) in VTO and JH as well as moderate to large ES (≥0.63) compared to baseline values in FT, PP and PF. Small or trivial ES (≤0.41) were reported at +48 h after match-play compared to baseline values in FT, PF, VTO and JH, whilst ES observed in PP were still moderate (0.7) at this time-point. Accordingly, when using the CMJ to profile post-match responses, the magnitude of change may differ according to the variable selected; implications which could influence the interpretation of data derived, and thus prescription of training thereafter. Notably, a delayed recovery of PP compared to PF has previously been reported [
8], with the present study lending some support to this observation (based on ES values). As the nature of rugby league includes a large frequency of sprinting, jumping and high-speed changes of direction, there is a large reliance on the ability to produce force rapidly [
8]. For this reason, and because of its increased sensitivity to match-play, it may be more appropriate for practitioners to assess the velocity-components of CMJ testing rather than the force-components when seeking to profile post-exercise responses. Recovery of CMJ performance in this study was comparable to changes reported following competitive matches in academy rugby players [
6,
14]. However, prolonged reductions of larger magnitude were reported following competitive matches in senior players [
4,
5,
7,
11], which may be the result of differing peak movement and collision demands in this age group [
2,
46].
Even though match-play did not affect total wellness, large and moderate ES were found at +24 (0.86) and +48 h (0.76) compared to baseline measures, respectively. Disturbances in wellness in this study were similar to responses observed following competitive rugby matches in both senior and academy players [
4,
5,
14], in which perturbations were present for up to +48 h. Even though acceptable internal consistency was found in the questionnaire, between-day reliability criteria were only met by total wellness. A more expansive scale (i.e., 0–10 or 0–100) may be useful to improve the reliability of all questions in this tool and enhance its practical application [
47].
5. Conclusions
In conclusion, this study observed acceptable within- and between-day reliability in a variety of variables of the IMTP (i.e., F200, F250 and PF) and the CMJ (i.e., FT, PF, PP, relative PP, VTO and JH). Independent components of the wellness questionnaire should be interpreted with caution as acceptable between-day reliability was reported in total wellness only. Although match-play did not elicit significant post hoc differences for the majority of variables analysed (excluding VTO and JH), a large ES was observed in the post-match period for most variables (i.e., F200, F250 and PF of the IMTP, FT, PP of the CMJ and in the total wellness score) when compared to baseline measures. These results indicate that the magnitude and time-course of post-match responses may differ depending on the test and individual variables used. To avoid underestimation of the post-match response, it may be worthwhile to assess both objective (i.e., indices of neuromuscular fatigue) and subjective (i.e., total wellness) measures post-match-play.
When taking IMTP measurements, practitioners working in rugby league are recommended to use F200, F250 and PF over forces elicited at earlier time-points due to the higher levels of within- and between-day reliability demonstrated in the present study. Likewise, because of its increased sensitivity to match-play, as well as the importance of rapid force application in sport, practitioners may consider the use of F250 over PF when profiling post-exercise responses. For the CMJ, analysis of variables such as FT, PF, PP, relative PP, VTO and JH may be preferred over a variety of other variables as a result of their greater between-day reliability. Assessing the velocity components of the CMJ may also assist in the interpretation of post-match responses. As individual components of the questionnaire lacked acceptable levels of between-day reliability, the use of total wellness is recommended when profiling post-exercise responses; especially given that this was the only element meeting the criteria for between-day reliability in this study. Collectively, post-match responses require at least 48 h to recover in academy rugby league players. During this time, practitioners are recommended to implement a variety of recovery strategies as this is likely to facilitate a quicker recovery of neuromuscular function and subjective wellness. Strenuous physical activity should be avoided in this time-period as this could prolong a return to baseline values.

 ,
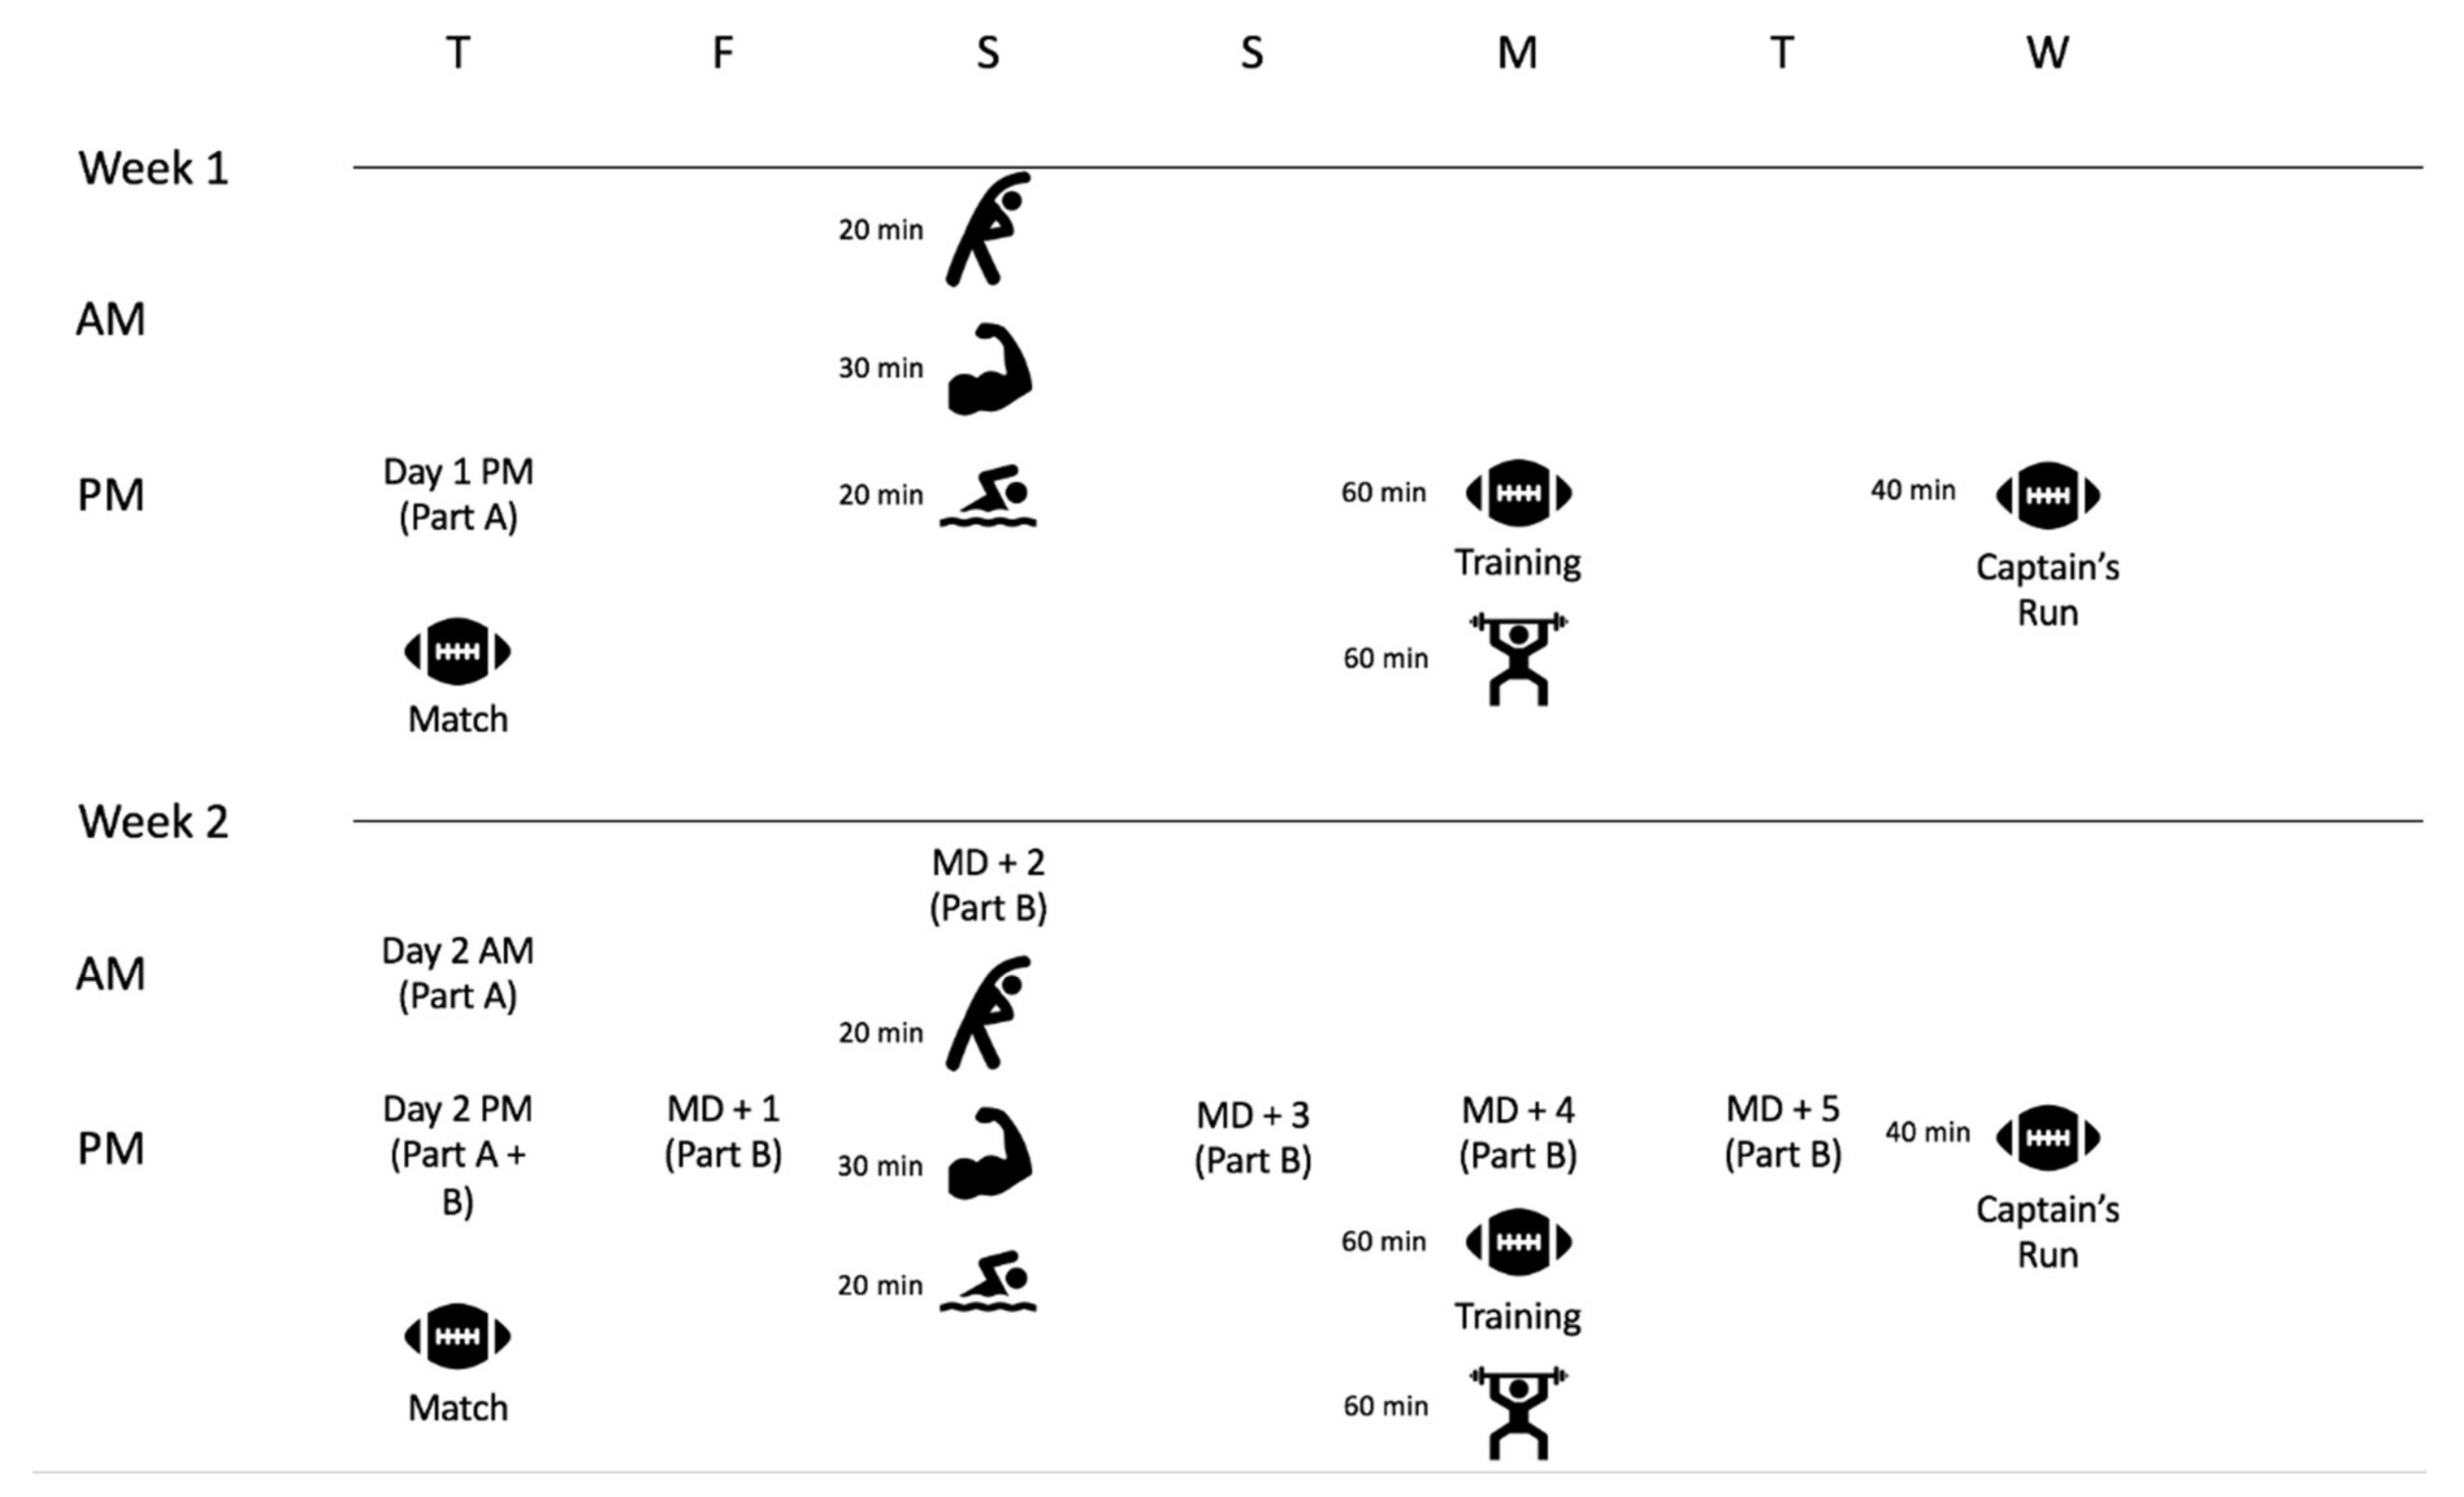
,  Match: Match-play;
  Training: The primary focus of this training session is development of specific skills and the tactical aspects of the game;
  Captain’s run: The final training session leading up to the game. This session predominantly focuses on the tactical and game-specific elements of the game;
  : Static and dynamic stretching as well as full body foam rolling in order to restore range of motion and general movement function;
  : An upper-body hypertrophy-based training session;
  : Pool session mostly taking place in the shallow end of the pool in which players perform a variety of dynamic movements (e.g., lunges, squats, calf raises, high knees);
  : Individual gym-based program including a variety of full-body movements designed to improve strength, power and/or hypertrophy (e.g., bilateral squat variation, knee- and or hamstring-dominant hamstring exercises, lower-body unilateral exercises, horizontal and/or vertical push and pull exercises).


 *
* *
* *
*


 *
*
 *
*

 *
* *
*
 *
* *
*


 *
*