Social Class Inequalities in Graduates’ Labour Market Outcomes: The Role of Spatial Job Opportunities

Moray House School of Education, University of Edinburgh, Edinburgh EH8 8AQ, UK
*
Author to whom correspondence should be addressed.
Soc. Sci. 2018, 7(10), 201; https://doi.org/10.3390/socsci7100201
Submission received: 4 August 2018
/
Revised: 21 September 2018
/
Accepted: 11 October 2018
/
Published: 19 October 2018
(This article belongs to the Special Issue Social Stratification and Inequality in Access to Higher Education)
Abstract
:This paper provides new important evidence on the spatial dimension of social class inequalities in graduates’ labour market outcomes, an aspect largely overlooked within the existing literature. Using data from the HESA Destinations of Leavers from Higher Education Early and Longitudinal Survey (DLHE) for the 2008/09 graduate cohort and applying multilevel logistic regression models, we investigate whether and the extent to which social class inequalities in graduates’ occupational outcomes vary depending on the job opportunities in the geographical area where they find employment. By examining different macro-level indicators, we find wider social inequalities by parental social class in areas with fewer opportunities in high professional and managerial occupations and smaller inequalities in areas with more opportunities. Interestingly, this pattern applies only to graduates who moved away from their place of origin. We interpret this finding as the result of selective migration, that is, areas with more opportunities attract the better-qualified graduates irrespective of their social origin. Finally, graduates’ HE experiences—in particular, their field of study—and sector of employment explain most of the social class gap in areas with fewer job opportunities.
1. Introduction
Much of the policy debate in the last few decades in the UK has centred on the issues of reducing inequalities in education and promoting intergenerational social mobility (Cabinet Office 2011; Department for Education 2017). In this debate, the role of education features prominently as the main instrument through which to promote social mobility. Scholars have manifested strong scepticism about the reliance solely on educational expansion and educational reforms to eradicate social class inequalities in the labour market. This is because possessing high levels of education in most cases is an essential requirement for social mobility to take place but it is not a sufficient condition to guarantee equal chances of accessing top-level jobs (Boliver 2017; Brown 2013; Iannelli and Paterson 2007). In other words, researchers have warned that simply increasing the number of working class people graduating from higher education (HE) will not automatically increase social mobility. The empirical evidence has indeed confirmed this. Various studies have consistently shown that tertiary graduates from more advantaged social classes have higher chances of entering top-level jobs compared to their counterparts from less advantaged social classes (Crawford et al. 2016; Britton et al. 2016; Jacob et al. 2015).
These studies have focused on national and cross-country analysis of patterns of social inequalities but have not paid much attention to within-country geographical variation in employment opportunities to further understand those patterns (an exception is the recent work by Friedman and Laurison (2017); see next section). Human geographers, on the other hand, have long analysed the importance of job opportunities in different areas/regions of the UK to explain different degrees of career promotion (e.g., see the seminal work by Fielding (1992), on the ‘escalator’ regions) and different patterns of geographical mobility. However, they have overlooked the relationship between area-level opportunities and inequalities in labour market outcomes by social class of origin.
This paper aims to fill the missing link between these two strands of literature, thus providing new important evidence on the spatial dimension of social class inequalities in graduates’ labour market outcomes. It seeks to contribute to our understanding of how opportunity structures in the labour market relate to social class inequalities in graduates’ occupational destinations, ultimately providing new insights which can inform policies aimed at improving social mobility chances. Specifically, this paper investigates whether and the extent to which, the chances of graduates from different social origins gaining access to top-level occupations (i.e., a higher professional/managerial occupation) and avoiding low-level jobs varies by area-level characteristics. It will further contribute to the existing literature by providing a more in-depth and nuanced picture of the importance of graduates’ HE experiences (i.e., prestige of the HE institution attended, fields of study and class of degree achieved), sector of employment entered and geographical mobility to explain area-level variations in social class inequalities in graduates’ destinations.
Our key research questions are:
- (1)
- Does the social-class gap in graduates’ occupational destinations vary depending on area-level job opportunities? If so, how do they vary?
- (2)
- How far do the observed patterns result from area-level factors rather than selective migration?
2. Social Class, Labour Market Structure and Geographical Location
The link between job opportunities and social class inequalities is not straightforward. Social mobility research has shown that even when opportunities expand social class inequalities may remain stable. Thus, the expansion of professional and managerial occupations which occurred in the UK in the 1970s and 1980s, while offering new opportunities for a minority of socially disadvantaged people, did not change the relative distribution of opportunities which remained largely in favour of middle class children (Goldthorpe 1987; Payne 1987; Marshall et al. 1988; Erikson and Goldthorpe 1992). More recent social mobility research has confirmed substantial stability in relative patterns of social mobility in the UK despite the growing numbers of highly educated people from less advantaged social classes (Bukodi et al. 2015; Iannelli and Paterson 2006; Goldthorpe and Mills 2004).
Several explanations focusing on individual and institutional factors have been put forward to explain the relationship between social origin and graduates’ labour market outcomes. Graduates from different social origins tend to differ in their HE experiences–such as the prestige of the HE institution attended (Iannelli et al. 2016; Sullivan et al. 2014; Boliver 2011), chosen field of study (Iannelli et al. 2018; Laurison and Friedman 2016; Van de Werfhorst et al. 2003) and class of degree achieved (Crawford 2014; Crawford et al. 2016)—but also in earlier cognitive skills (Sullivan et al. 2017). However, Crawford et al. (2016) found that ‘even among those attending the same university, attaining the same degree class in the same subject, those from more privileged backgrounds are more likely to access the top professions’ (p. 14). National institutional factors have also been found to shape the transition from higher education to the labour market (Triventi 2013; Jacob et al. 2015). Specifically, in the UK, social class inequalities in graduates’ occupational outcomes were found to be more marked than in Germany and only partly mediated by graduates’ field of study, higher education achievement and institution attended (Jacob et al. 2015). Given the larger supply of university graduates and the weaker links between HE qualifications and labour market outcomes in the UK, employers may need to rely on factors other than credentials (e.g., soft skills; candidates’ social and cultural capital) to select their future employees. This ultimately favours people from higher social origins (Jackson et al. 2005).
The patterns highlighted in the research above are based on national-level averages and may cover the existence of very different patterns within the country. Indeed, as in other European countries, employment opportunities are unevenly distributed within the UK. Statistics published by the Office of National Statistics show wide regional and sub-regional variations in employment, unemployment and inactivity rates (see ONS 2018a) and in labour productivity (ONS 2018b). These differences may play an important role in altering the patterns of social class inequalities among graduates. As mentioned in the introduction, research mainly conducted by human geographers has highlighted the importance of analysing local labour market opportunities and the relationship between the job opportunities available in different geographical areas and individuals’ chances of getting a good job. In particular, several studies have linked intra-generational social mobility (i.e., movements within and between social classes occurring during one’s occupational career) with spatial mobility (e.g., Fielding 1992; Van Ham et al. 2012; Champion et al. 2013). They showed that more economically developed areas in the UK (e.g., South-East area and London in England or Edinburgh in Scotland) act as ‘escalator regions’ (Fielding 1992) displaying a higher level of upward intra-generational occupational mobility for both people who stay and people who migrate into these regions. The issue of geographical mobility has been the topic of many studies. The main results of this literature have pointed out that highly educated people are more geographically mobile than less educated people; geographical mobility is associated with higher occupational and economic returns (Fielding 1992; Van Ham et al. 2012; Kidd et al. 2017); and that the likelihood of moving for HE studies and for employment are highly correlated (Faggian et al. 2007). Kidd et al. (2017) also stress that mobility in terms of employment is crucial. Their results suggest that being mobile for employment is more important than the initial decision of whether or not to move to study. Indeed, those individuals who move to go to university but subsequently return to the family domicile area and those who remain in the same university location for employment either do not have an earning premium relative to non-graduates or have only a modest premium in comparison to those who moved away for employment.
Labour economists have also contributed to this theme of enquiry by focusing on geographical variations in earnings and trying to distinguish the effects of area-level factors from individual-level factors. O’Leary and Sloane (2008) found substantial variations in the earnings benefits of university graduates across regions of the UK, with graduates in London having the highest economic returns, followed by South-East England. However, the regional earnings differential was substantially reduced once the costs of living were taken into account. Moreover, the remaining earning differentials were not explained by differences in occupational and industrial structures across regions, despite the fact that London and the South-East had a larger number of graduates employed in managerial and senior positions. The authors highlight that the main driver of these differences can be traced to the higher productivity of these areas derived from spillover and agglomeration effects in areas of high concentration of graduates. Gibbons et al. (2010) examined the extent to which wage disparities are due to a sorting mechanism—i.e., workers with different characteristics gather in different areas—or whether they are due to an area-of-employment effect—i.e., the same types of workers achieve different outcomes in different areas of the country. They showed that individual characteristics explain a much larger part of wage disparities across areas than area effects (90% versus 10% of area-level wage variation). Area effects also explain only 1% of the overall levels of individual wage disparity.
Nonetheless, these latter studies did not investigate the role of family of origin and whether and how social class inequalities in graduates’ occupational outcomes vary by area-level characteristics; in other words, they did not investigate whether intergenerational social mobility is also related to geographical area of employment.
Recent policy reports have stressed the fact that regional characteristics can enable or hamper social mobility (Friedman et al. 2017; Social Mobility Commission 2017) and hence, those coming from less privileged backgrounds and who live in areas with fewer opportunities can suffer a double disadvantage, not only related to their family of origin but also to the geographic area. The 2017 Social Mobility Commission report provided detailed geographical analysis of a variety of factors which can influence intergenerational social mobility, showing that there are great regional disparities in the UK: in England, two thirds of highly skilled and knowledge-based jobs are in cities, with 1 in 3 of such jobs being based in London. However, this report did not focus explicitly on graduates and access to top-level jobs. Friedman et al. (2017) focused on professional jobs and regional inequalities. They found that there are large inequalities within the higher professional and managerial occupations in Britain, in particular in Central London (and in the lucrative banking and finance jobs in the City). Indeed, in Central London, the social composition of professional and managerial jobs is disproportionately in favour of people from socially privileged backgrounds. Moreover, those from working-class backgrounds who reach these positions have lower economic returns: their average earnings are 10 percentile points lower than their colleagues who comes from more advantaged backgrounds.
3. Theoretical Explanations and Hypotheses
Various explanations may account for the existence, or lack, of geographical variation in social class inequalities in graduates’ destinations.
Based on the social mobility research (e.g., Goldthorpe 1987; Payne 1987; Marshall et al. 1988; Erikson and Goldthorpe 1992), we could argue that social class inequalities tend to reproduce themselves irrespective of the economic conditions of a place. Thus, better regional job opportunities may not translate into a more equal distribution of professional jobs (as was the case in the 1970s and 1980s when professional and managerial jobs expanded). This is because the chances of all graduates from all backgrounds would equally increase; hence, the relative gap by parental background would remain the same regardless of the regional opportunities as the same mechanisms which perpetuate inequality will be at work in all types of areas (hypothesis of constant inequalities). Moreover, information on job opportunities may be harder to access for graduates from less advantaged social backgrounds and the high costs of moving and of living in areas with higher professional job opportunities (such as London and Edinburgh) may discourage such moves.
Following this line of thinking we would expect that:
Hypothesis 1 (H1).
Class-of-origin effect on entering top-level occupations does not vary across areas with different job opportunities.
On the other hand, following the ‘escalator’ regions literature (e.g., Fielding 1992; Van Ham et al. 2012; Champion et al. 2013), we could envisage an alternative scenario. Thus, in places where job opportunities are greater, graduates from lower social backgrounds may have easier access to professional and managerial jobs and the terms of job competition may be more meritocratic. Areas with more job opportunities are likely to offer a wider range of occupations and for a wider range of graduates, therefore, there will be less social bias which usually accompanies access to traditional professions (Van de Werfhorst et al. 2003; Friedman et al. 2017). In contrast, in places where job opportunities for graduates are scarce the competition for professional jobs is higher and inequalities may be greater since those from higher social classes of origin are likely to be better equipped to compete. This advantage may be because they possess the best match (in terms of types of degree requested, for example, more traditional professions such as doctors and lawyers), or because they benefit from direct support from their parents, such social networks, advice and financial assistance which would allow them either to wait for the next suitable vacancy or to move away to areas where the opportunities are available.
Thus, an alternative hypothesis is:
Hypothesis 2 (H2).
The higher the job opportunities in the geographical area of employment, the smaller the social class inequalities among graduates in accessing top-level jobs.
The reason for lower social class inequalities in employment areas with high level of employment, especially in professional and managerial jobs, could be explained by two mechanisms: area-level effect or selective migration. To discern which effect is at play, we will distinguish between graduates who moved from their area of domicile and graduates who stayed there. For example, if lower inequalities are driven by structural opportunities and areas with more job opportunities indeed act as equalizers of graduates’ employment prospects, then we would expect that:
Hypothesis 2a (H2a).
The smaller social class inequalities in areas with greater job opportunities will apply both to those graduates who moved to these areas of employment and to graduates who are from those areas (or returned there after having studied in a different area).
On the contrary, if different patterns emerge between movers and non-movers, then we will analyse whether a potential reduction in inequalities in areas with higher job opportunities reflect the selection of the ‘best’ or ‘most suitable’ graduates from various areas of the country, irrespective of their social class of origin (selective migration). In this case we would expect that:
Hypothesis 2b (H2b).
The smaller social class inequalities in areas with greater job opportunities can be explained by graduates’ individual characteristics.
4. Data and Methods
The data used in this study come from the Destinations of Leavers from Higher Education Early and Longitudinal Survey (DLHE), which was conducted by the Higher Education Statistics Agency (HESA) in 2012. These data contain labour market information on graduates who completed higher education programmes at a UK HE institution in the academic year 2008/09, 3.5 years after graduation.1 Labour market information from the survey was linked to the HESA administrative student records which contain information on students’ family background characteristics, HE institution attended, programme of study and final qualification achieved.
The sample used in this paper is restricted to UK-domiciled full-time first-degree graduates who were aged 21 or under at the time of entering HE. Our focus on young graduates is mainly due to the limited information on parental social class of mature students available in this dataset. UCAS (Universities and Colleges Admissions Services) consistently collects this information only from young HE applicants since mature applicants are asked about information on their own occupation before entering HE. However, due to data availability and comparability of macro-indicators at NUTS 3 (Nomenclature of Territorial Units for Statistics) area-level, the analysis focuses on Great Britain (GB) and hence does not include Northern Ireland. We started with a sample of about 29,0002 for GB, of whom 24,585 were in employment 3.5 years from graduation (85%).3 Of these, about 23% had missing data on at least one of the key variables used in the analysis. These cases were removed from the analysis, leaving us with a total working sample of 18,940.4 Finally, the sample was clustered according to NUTS 3 regions of employment which we derived from the information on graduates’ postcodes of employment.5 We used the most detailed classification of NUTS 3 (133 geographical units/128 units for GB) derived from the ONS NSPD lookup table referring to May 2009.
The dependent variable in the study is social class of destination 3.5 years after graduation. This is measured using the National Statistics Socio-Economic Classification (NS-SEC) (Rose et al. 2005) which distinguishes higher managerial and professional occupations (NS-SEC 1), lower managerial and professional occupations (NS-SEC 2), intermediate occupations (NS-SEC 3-5) and semi-routine and routine occupations (NS-SEC 6-7).
Our key independent variable, based on which we assess social inequalities is parental social class, also measured by NS-SEC, using the same categories as for respondents’ social class. Further explanatory variables capture key aspects of graduates’ higher education experiences. First, the type of HE institution attended is a categorical variable which comprises the oldest and most prestigious universities in the UK (Universities of Oxford and Cambridge in England and the Universities of Edinburgh, Glasgow, Aberdeen and St. Andrews in Scotland), other old universities founded before 1950, newer universities (founded between 1950 and 1992) and post-92 universities (former polytechnics) and other higher education institutions. Second, field of study distinguishes between nine categories: Medicine and Veterinary, Subjects allied to medicine, Natural Sciences (i.e., Biological Sciences, Agriculture, Physics, Maths, Computer Science), Engineering and Architecture, Humanities, Social Sciences and Arts (i.e., Social Studies, Languages, Historical & Philosophical Studies, Arts & Design), Law, Business and Mass Communication, Education Studies and Combined degrees. Thirdly, attainment in higher education is measured by the class of degree achieved: first class (1), upper-second class (2:1), lower-second class (2:2), third class (3) and unclassified (mainly ordinary degrees). Fourthly, further qualification achieved after first degree captures whether graduates acquired any additional credentials, distinguishing between nine categories: No further qualification, Higher degree by research, Higher degree by taught course, Postgraduate diploma or certificate, First degree, Other diploma or certificate, Professional qualifications, Other qualifications, Not aiming for a qualification. This variable is included in the statistical modelling to control for possible effects of further qualification achieved between first leaving HE education and the occupation acquired 3.5 years after graduation. In addition, apart from the social class of destination, we also examine another employment characteristic via the type of industry where graduates work. We distinguish between nine sectors: Primary; Secondary; Tertiary; Finance, Insurance and Real Estate; Professional, Scientific and Technical; Public Administration, Defence and Compulsory Social Security; Education; Human Health and Social work; and Other Quaternary. Although, field of study might also serve as a proxy for the sector in which graduates are likely to work, there is also a fair amount of mismatch between field of study and occupational/industry fields (Docherty and Fernandez 2014). For this reason, accounting for the industry of the current employer provides a more direct measure of the labour market in which graduates work.
In our statistical modelling, we also include a measure of geographic mobility to identify whether respondents moved from their area of domicile (as reported when entering higher education) to another area for employment, that is, whether the domicile NUTS 3 is different from the employment NUTS 3. A more refined geographic mobility variable accounting for distance and moves to the HE institution was also examined but the identified patterns of those who moved for both HE and employment, those who moved for employment only and those who moved for HE and remained in the area of the HE institution were very similar. Also, the patterns of those who did not move at all and those who moved for HE and returned to the domicile area were similar. Therefore, for parsimony we decided to opt for the simplified version, which distinguishes whether graduates moved for employment or not.
In our analyses, we control for other individual characteristics, that is, age (i.e., four age groups 20, 21–22, 23–24, 25+), gender (male/female), ethnicity (White, Asian, Black, Other), disability (whether disabled or not) and country of domicile (England, Wales, Scotland).
Our key independent variables at macro level include macro indicators measuring job opportunities in the area of employment which were attached to NUTS 3 areas. These indicators were provided by the ONS Annual Population Survey, October 2009–September 2010 (ONS SSD 2015) and include: (1) Percentages of Professionals; (2) Percentages of Managers, Directors & Senior Officials and (3) Employment rate. For simplicity, we will focus more on the first indicator and include results using the latter two indicators in the supplementary material (Figures S1 and S2).6
In the statistical modelling, we adopt a multilevel framework with graduates nested into NUTS3 regions of the area of employment7 to analyse the variance in graduates’ destinations at both individual (level 1) and area level (level 2) and to disentangle the effect of macro- and micro- level factors on the outcome. Macro-level indicators were attached to the area of employment to measure the regional job opportunities. Models are estimated using MLwiN software (Rasbash et al. 2015). We use IGLS (iterative generalized least squares) estimation, followed by Bayesian Markov Chain Monte Carlo (MCMC), therefore the MCMC initial parameters starting value is based on the IGLS estimations. The analysis was carried out using a multilevel multinomial model which can be expressed by the following equation:
Our dependent variable is expressed by the log-odds ratios of being in category k instead of category 1 for individual i in group j; is the intercept and is the effect of for the contrast of category k versus category 1 for individual i in group j and is the level 2 random effect for the contrast of response category k with the reference category.
First, to assess the variance at area level (level 2) and the extent to which different macro-indicators explain this variance, we run several models starting with the null model and adding one macro-indicator variable at a time, without including any other control variable. We then compare the amount of area variance explained by each macro-indicator against the null model. In this way, we test the statistical significance of the macro-level indicators, the direction of the association with our outcome and, at the same time, we assess to what extent these macro-level indicators explain the initially identified variance at level 2. Second, to investigate whether the social-class gap in graduates’ occupational destinations varies depending on the job opportunities in the area of employment, we test interactions between social origin (level 1) and our macro-level indicators (level 2), generally referred to as cross-level or micro-macro interaction. The interaction terms allow us to establish whether the percentage of professional or managerial jobs available in the area of employment and the employment rate moderate the relationship between parental social class and the social class attained by graduates 3.5 years after graduation. Building on these models, we also test three-way interactions to assess whether the observed patterns are similar across different groups. The estimates obtained from the multilevel models are presented in the supplementary material.
5. Results
5.1. Area Characteristics and Graduate’s Chances of Entering Top-Level Occupations
To analyse whether the area of employment and its characteristics are associated with the chances of gaining a top-level job after graduation and avoiding low-level jobs, we estimated a series of hierarchical regression models which shows how much of the variance of our outcome is explained at the area level (Table 1). First, the null/empty model (M0), with no covariates, shows the area-level variance for each contrast of the NS-SEC group versus the reference category (NS-SEC 1). Although the variance estimates are very small, they are relatively large compared to their standard errors, indicating that the social class of graduates varies across areas of employment.8
Further, models M1-M3 add to the empty model each macro-indicator separately, with no other control variables. They show that the log odds of being employed in low professional occupations (NS-SEC 2), intermediate (NS-SEC3-5) and semi-routine and routine occupations (NS-SEC6-7) versus high professional occupation (NS-SEC1) significantly decrease with the increase in the percentage of professional jobs available in the area of destination and with higher employment rates (Table 1). In other words, graduates are more likely to be in high professional jobs if the area of employment has a higher proportion of professional jobs and if employment opportunities are higher. The coefficients related to the percentage of managerial occupations in the area of employment are not significant.
Comparing the variance estimates of the area random effects (i.e., how much of our outcome is explained by differences between areas of employment) presented in Table 1, it emerges that a larger part of the variation between areas of employment in the chances of gaining a top-level job is explained by the percentage of professional jobs.9 The other macro-level indicators explain much less of the initial area level variance shown by the null model.
From these analyses it emerges that despite the small overall variance present at area level (level 2) compared to individual level (level 1), graduates’ chances of gaining a top-level job are significantly affected by the labour market opportunities in the employment area, in particular the proportion of professional jobs available and employment rate (for a concrete example of how areas vary by job opportunities, please see Tables S2 and S3 which list the areas with the highest and the lowest percentages of professionals in Great Britain).
5.2. Social Inequalities in Graduates’ Occupational Destinations and Regional Job Opportunities
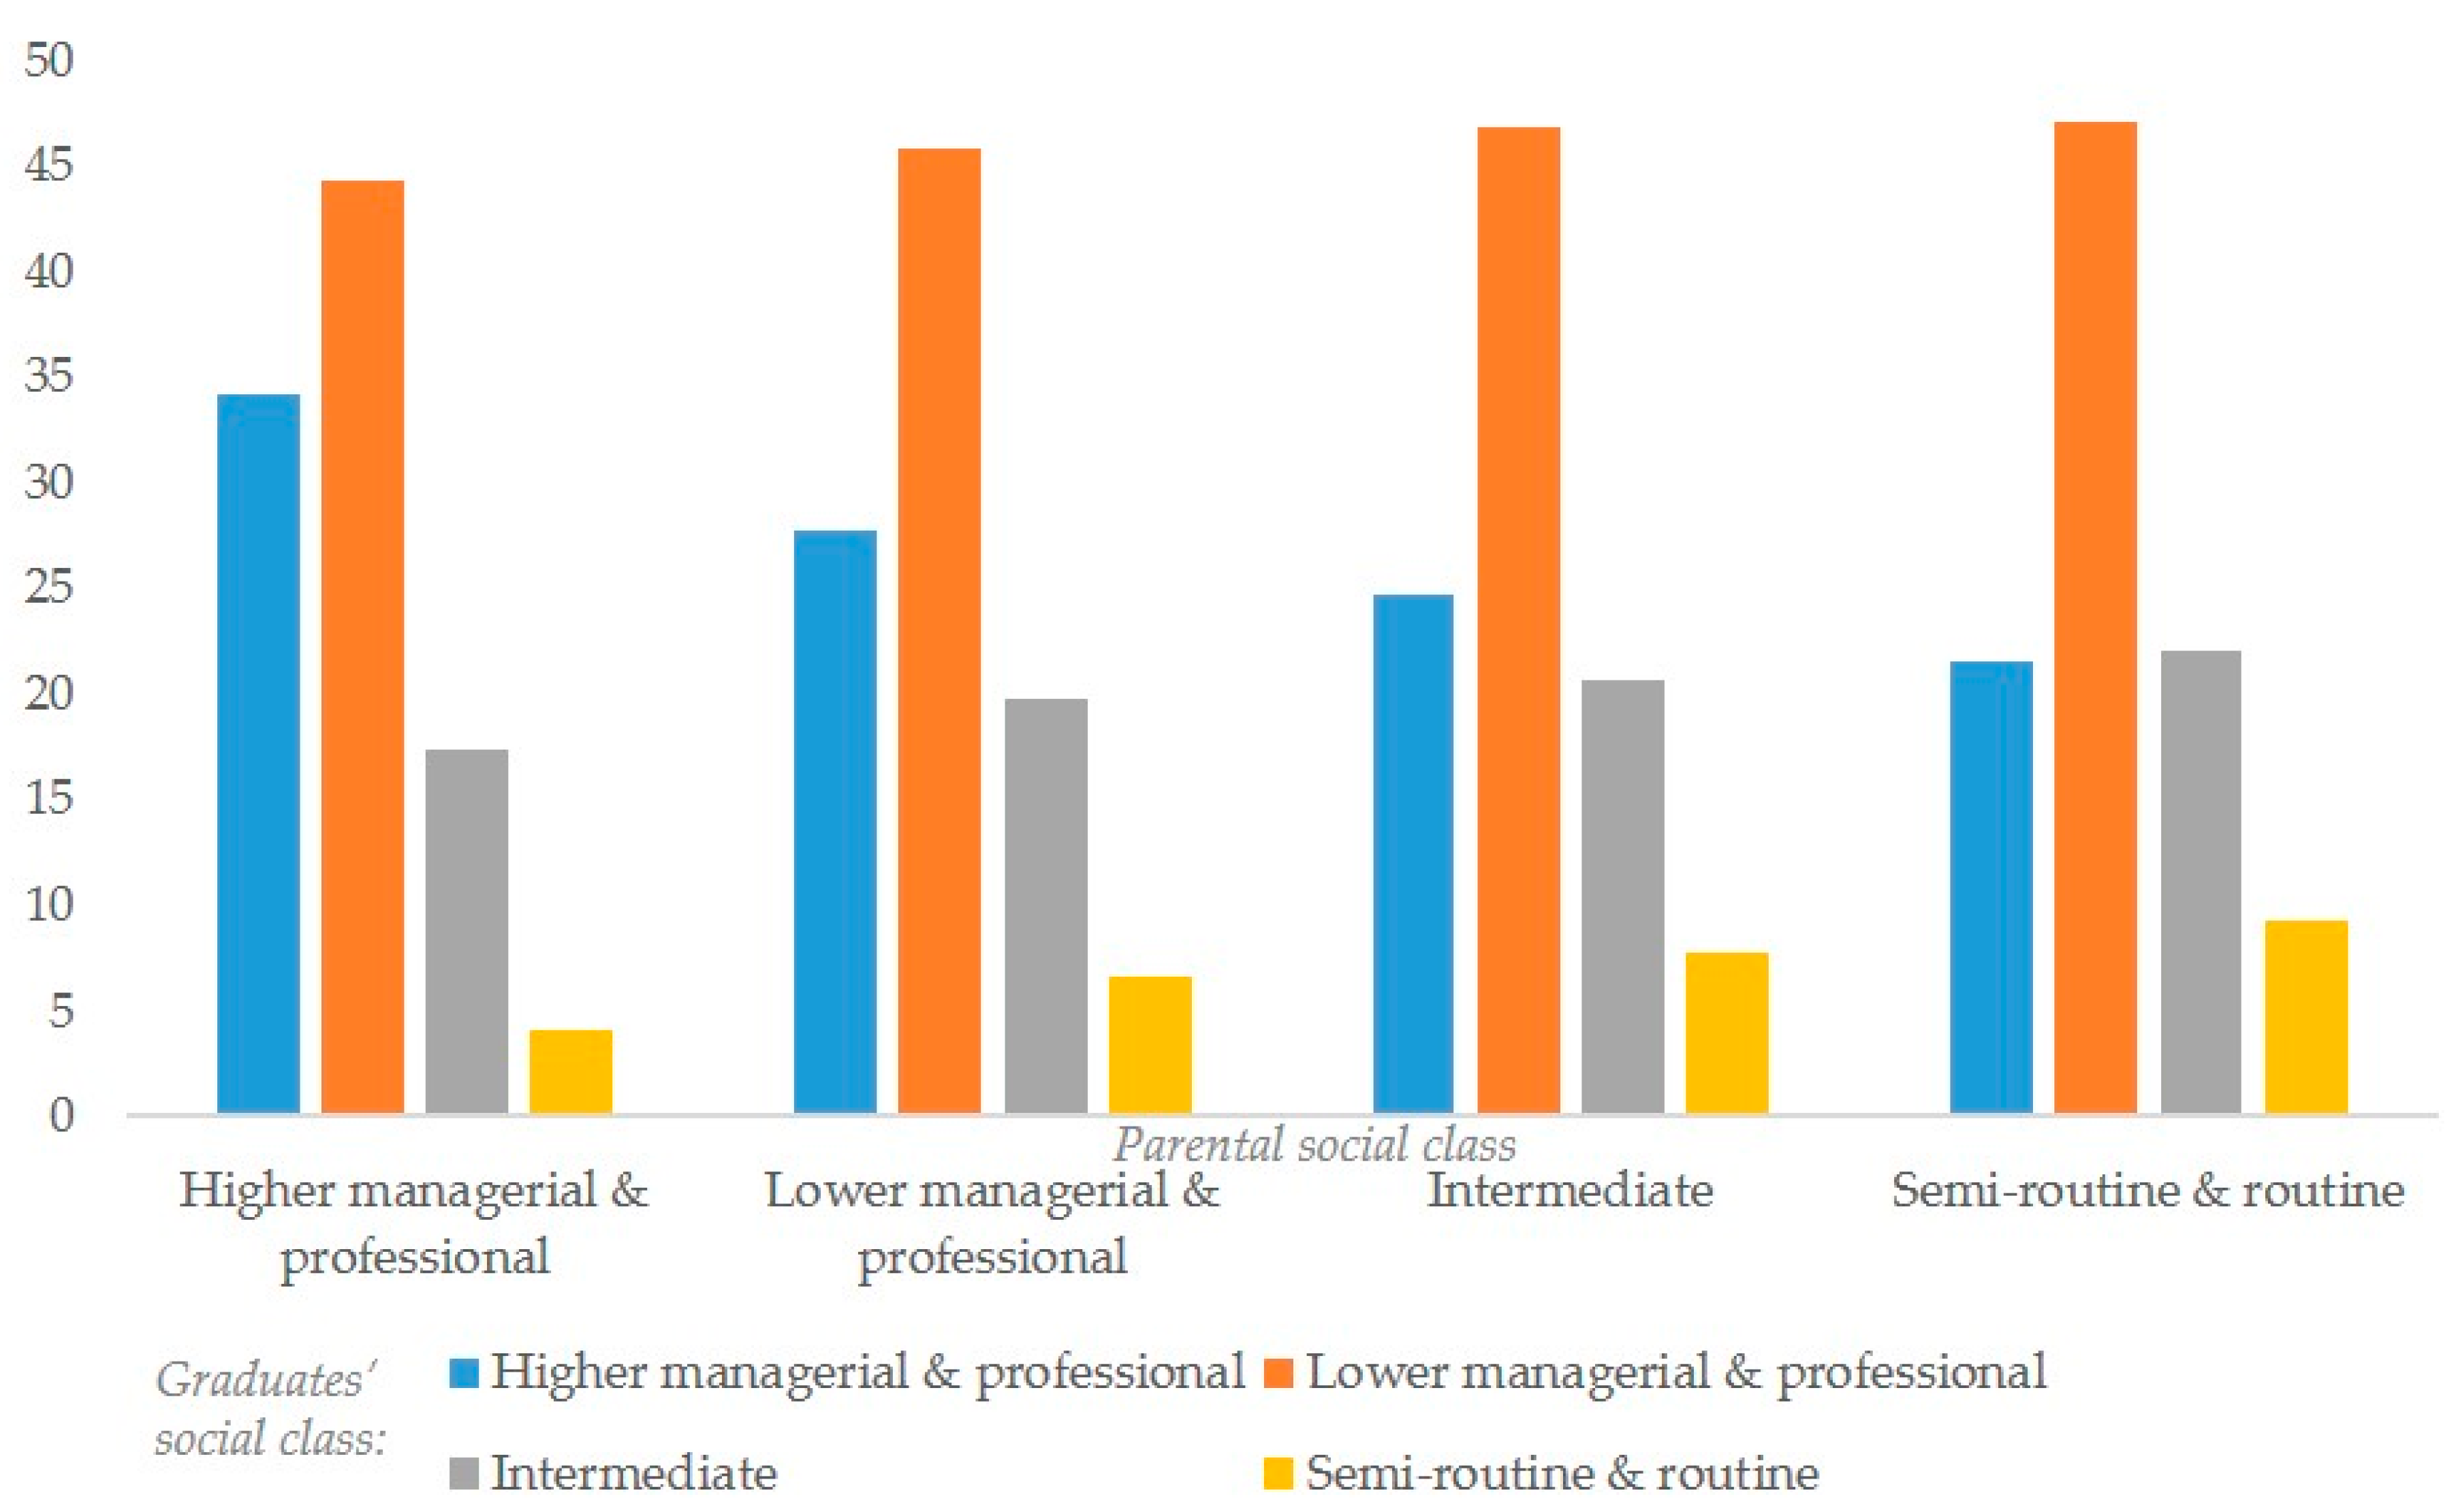
Descriptive statistics were run to investigate the extent of the social class gap in graduates’ occupational destinations. As expected, the social gap is marked: 3.5 years after graduation, 34% of graduates with parents in managerial and professional occupations are found in top-level occupations (i.e., higher managerial & professional occupations) compared to only 21% of those graduates who come from the least advantaged social backgrounds, that is, semi-routine and routine occupations (Figure 1). Differences are also evident between graduates from the highest social classes and the intermediate and the lower professional and managerial classes (25% and 28% respectively). Interestingly no social class differences emerge in relation to the proportions entering the lower professional and managerial occupations. In contrast, social class differences are present again when looking at the chances of ending up in the lowest occupations (i.e., semi-routine and routine).
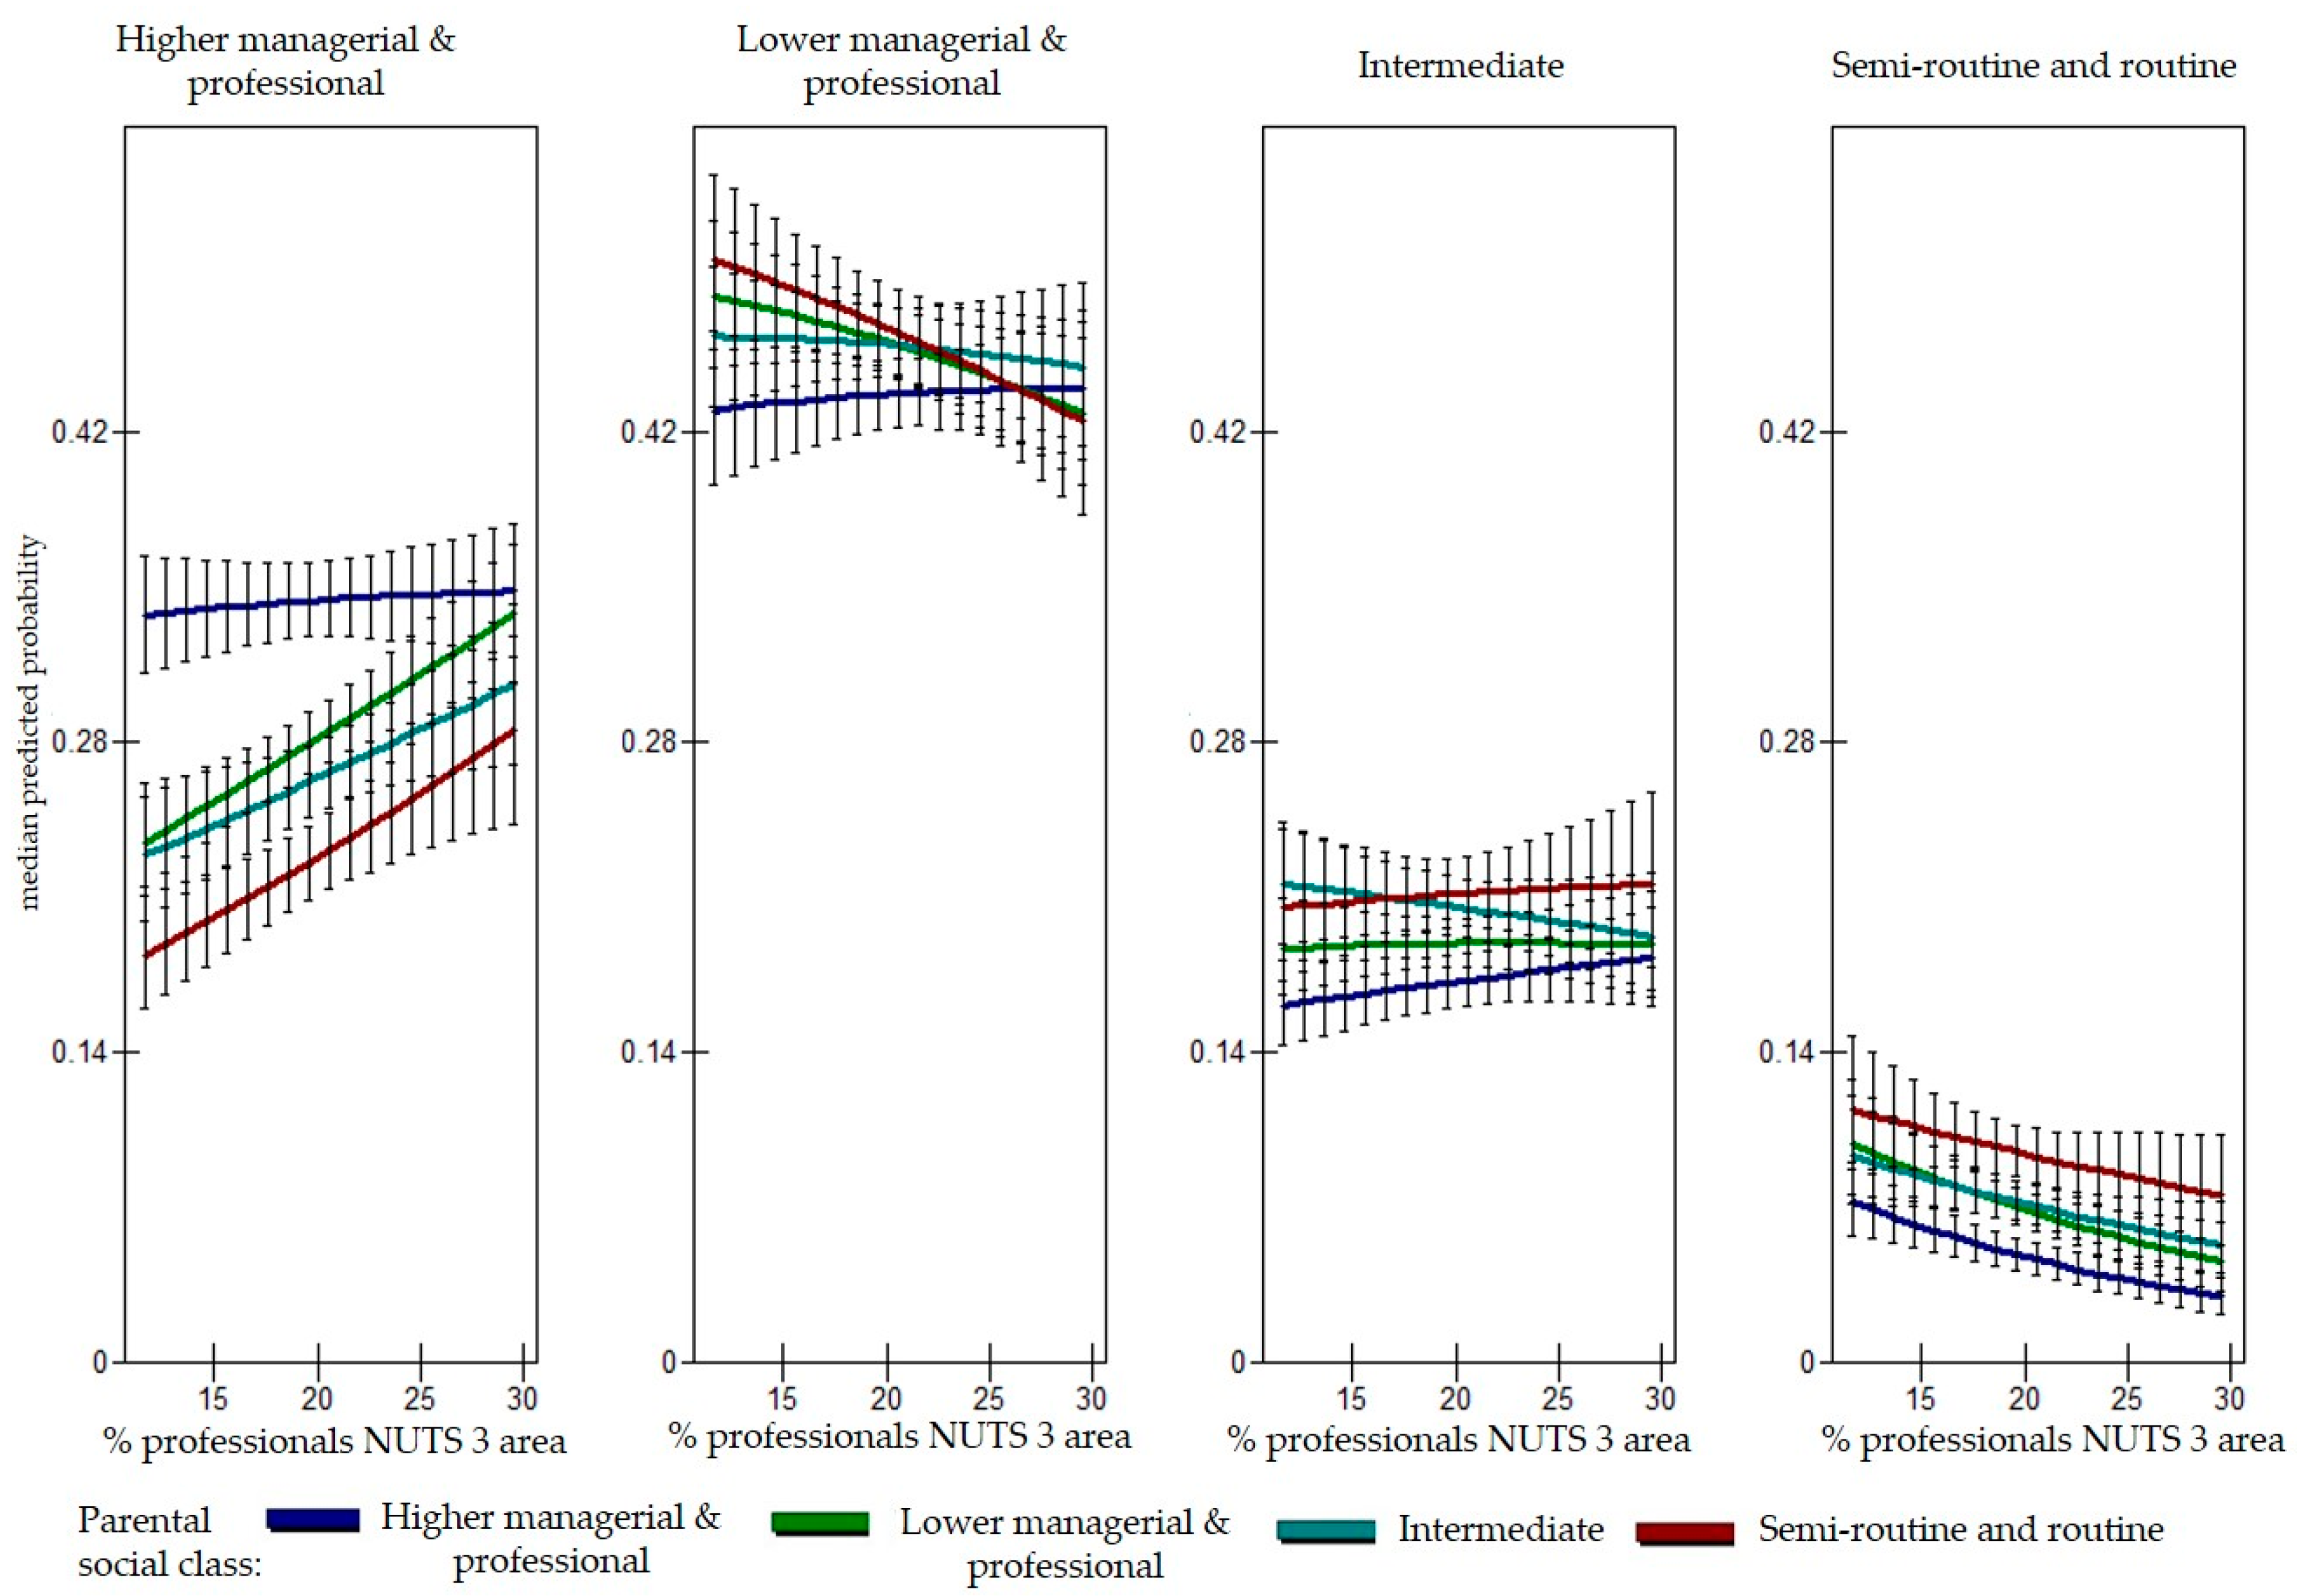
The core question of our paper is whether the social-class gap in graduates’ occupational destinations varies according to the opportunity structures of local labour markets. Figure 2 shows the predicted probabilities of entering different types of occupational classes by graduates’ social class of origin and how these vary depending on the percentage of professionals in the area of employment. We have chosen the percentage of professionals as the central macro-indicator in our analysis since this was the strongest indicator explaining the area-level variance (see Table 1). Confirming the results presented in Figure 1, Figure 2 shows that the most salient difference by parental background is in the chance of gaining a high professional and managerial occupation. This outcome also shows the clearest pattern linked to the percentage of professionals in the area of employment: thus, large and statistically significant differences emerge in areas with low and moderate percentages of professionals and small and not significant differences in areas with the highest percentages of professionals. In other words, the higher the percentage of professionals in the area of employment, the smaller the social-class differences in the chance of entering a top-level job, particularly in the areas at the high end of the distribution (e.g., Inner London, Edinburgh). This pattern emerges through a steeper increase in the probability of getting a top-level job by those from lower classes compared to those from the highest social class who maintain a relatively high probability of entering a high professional job even in areas with low percentages of professionals. No significant social-class-of-origin differences appear in the probability of entering the two middle occupational groups and there is little evidence for area variation with respect to entering the semi-routine and routine jobs, despite the overall significantly lower probability of those from top social classes of origin to enter these types of occupations.
We replicated this analysis by analysing area variations in the social class gap by the percentage of managers, directors and senior officials and employment rate in the area of employment (Figures S1 and S2 in the Supplementary Materials) and they revealed similar patterns. In summary, in those employment areas which have better job opportunities social class inequalities in graduates’ chances of reaching top-level jobs and avoiding lower-level jobs are smaller. However, in areas where job opportunities at the higher occupational levels are scarce, graduates from higher social classes are more likely to reach the top occupations than graduates from lower social backgrounds. Thus, these results confirm our Hypothesis 2 and lead us to reject the null hypothesis which predicted no differences in the patterns of social-class differences.
5.3. Area-Level Opportunities versus Selective Migration
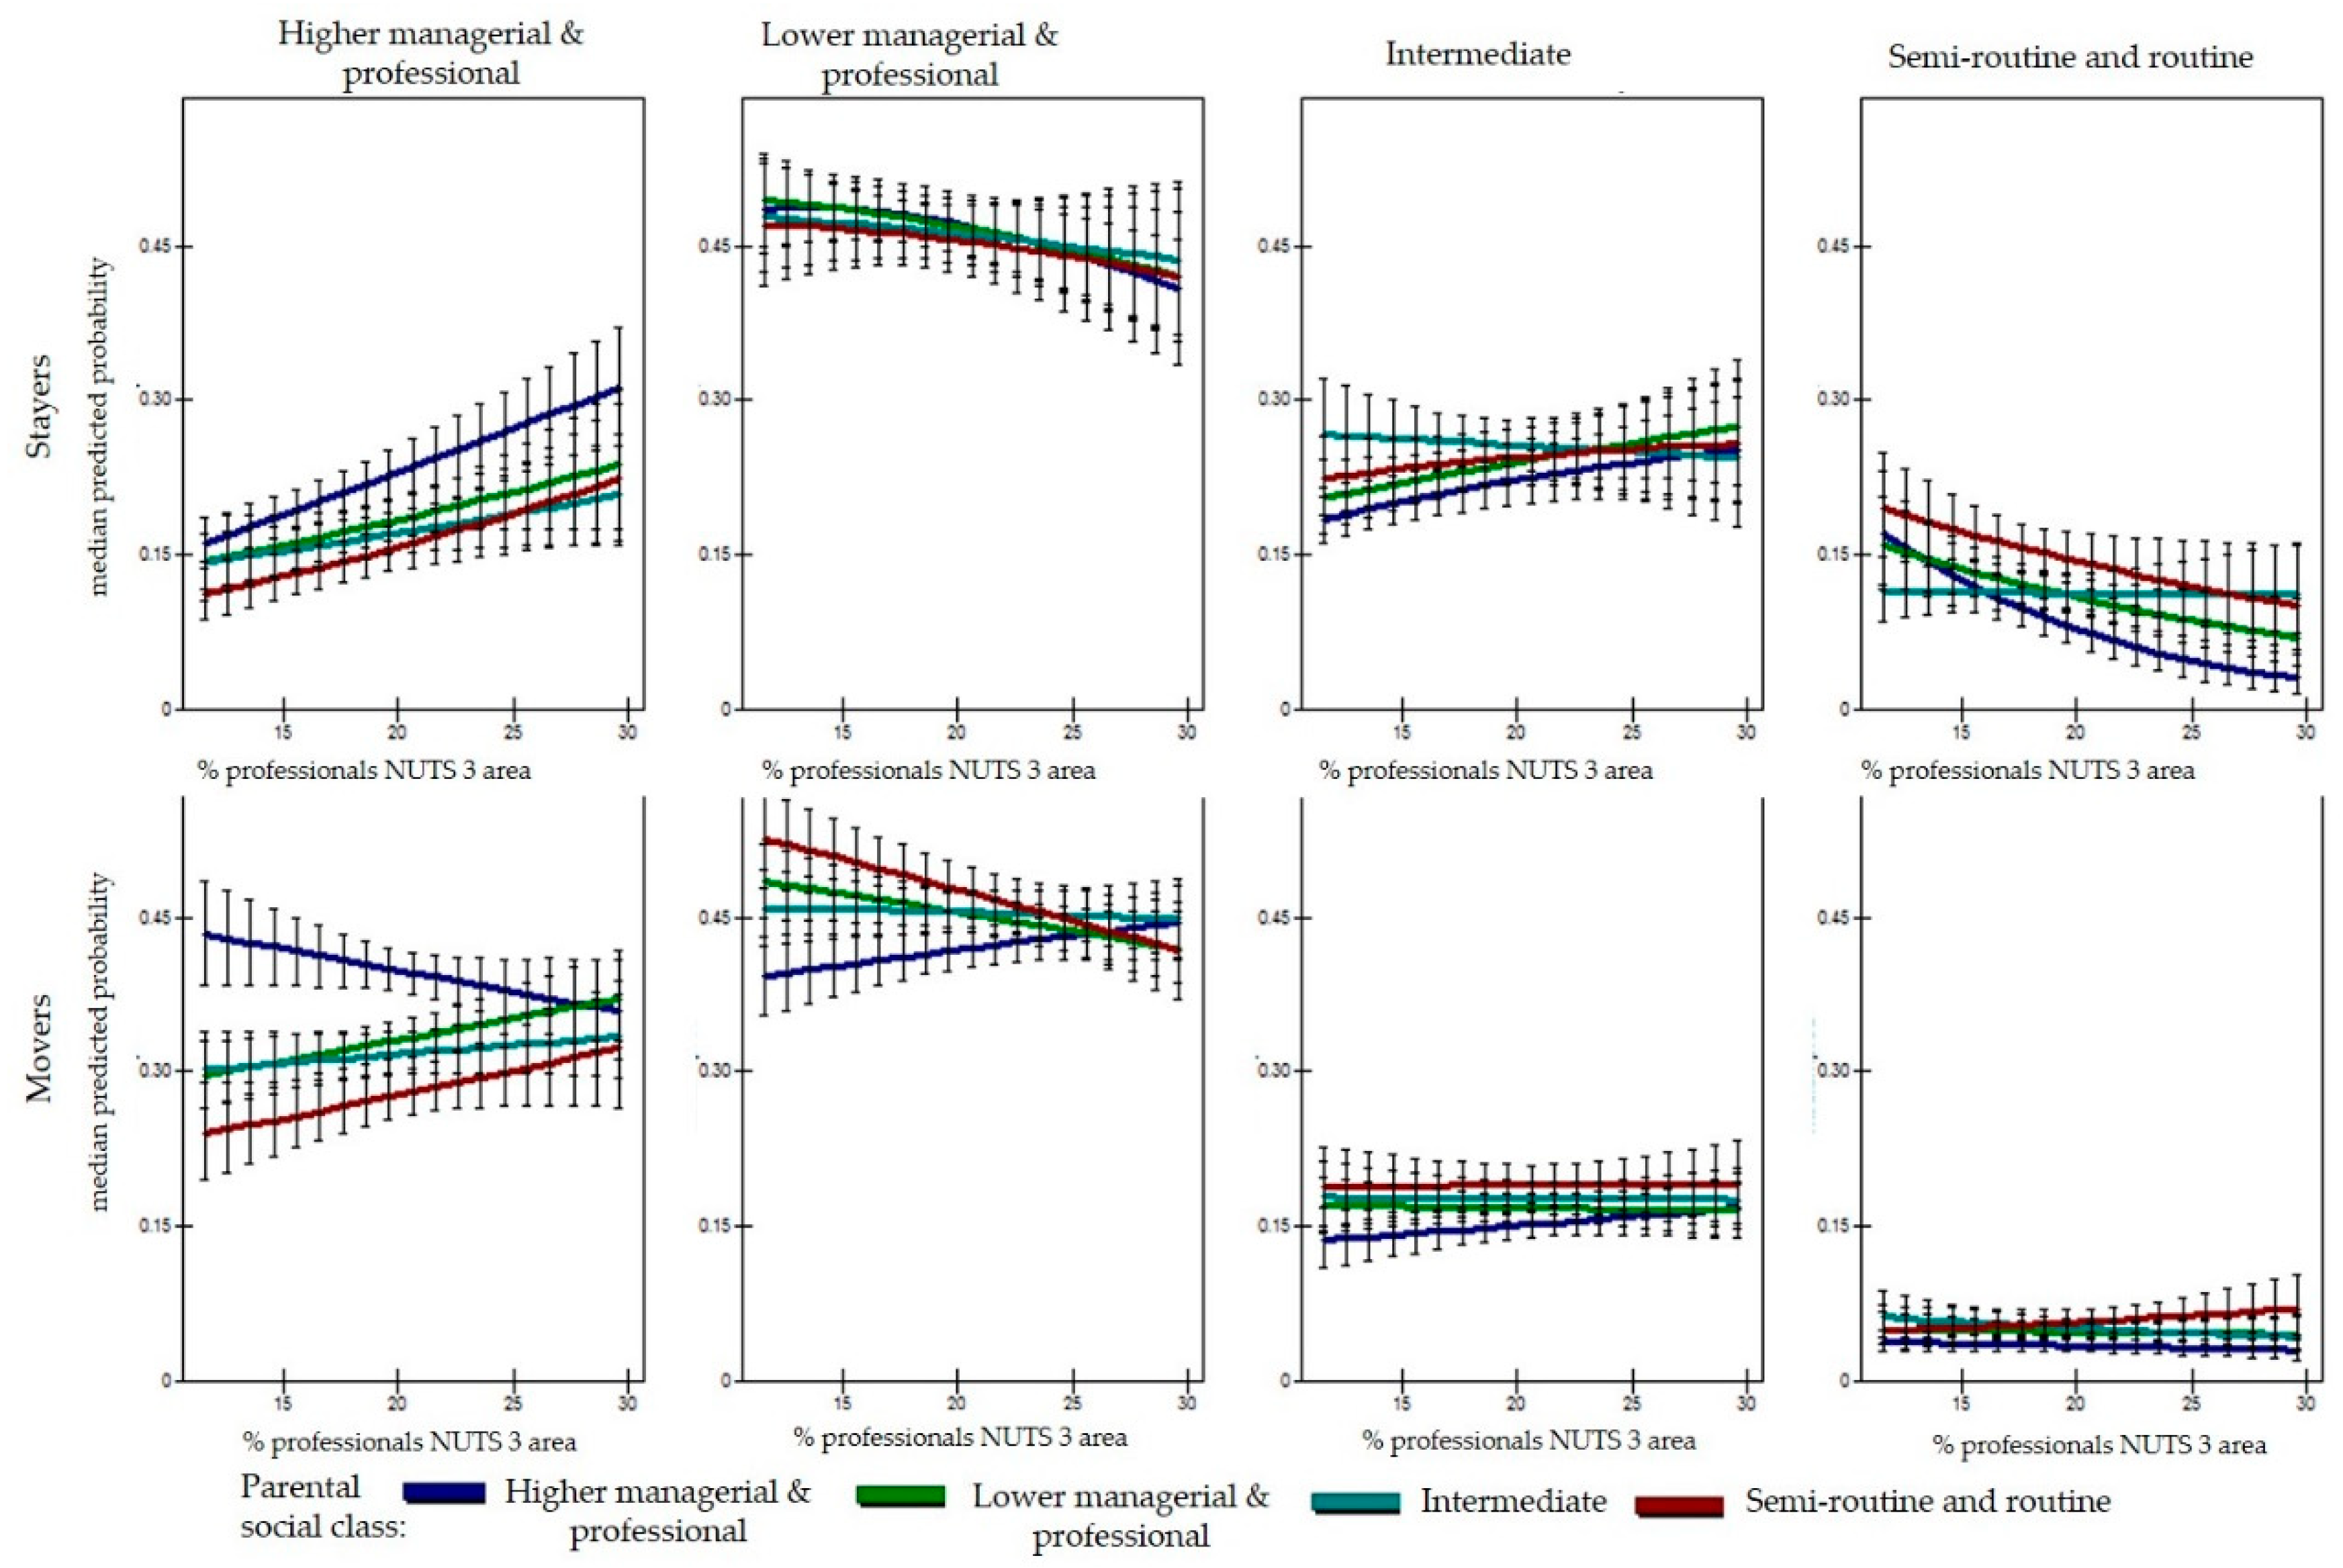
In order to tease out whether the identified patterns are driven by area opportunities or by the characteristics of people coming to work in these areas, we have tested a three-way interaction between the percentage of professionals in the area of employment, graduates’ parental background and whether graduates moved to the area of employment or they were employed in the same area where they were domiciled before entering HE (for simplicity we call them ‘non-movers,’ even though they may have moved to study and then returned in the area of their original domicile). The three-way interaction was significant and this model had a better fit compared to the two-way interaction model presented in Figure 2 (a decrease in the DIC of 567 units). This indicates that the way social class differences vary by area depends on graduates’ geographic mobility (i.e., the identified patterns differ between movers and non-movers).
Figure 3 presents the derived predicted probabilities for both movers and non-movers. The results show that the pattern of area variation in the social class gap specific to entering top-level jobs discussed above is only visible among those who work in a different area than that of domicile (movers) and not among those whose area of employment is the same as the area of domicile (non-movers). For this latter group, the pattern is reversed, that is, when the percentage of professionals in the region increases, the chances of getting a top-level job tend to diverge, translating therefore into larger disparities by parental background in areas with more top-level job opportunities (however, these differences are not statistically significant). These results suggest that the initially observed pattern is driven by those who move for employment but does not apply to those who do not move, who display the opposite pattern. Hence, this seems to support the selection Hypothesis (H2b) and to reject the idea that areas with more opportunities act as a universal equalizer in terms of graduates’ relative chances of getting a top-level job (Hypothesis 2a). This is in contrast to the findings on intra-generational occupational mobility in escalator regions, which have been found to be higher than in other regions for both those who moved and those who stayed in those areas.
For those who remain in their area of domicile, increased job opportunities improve their chances of getting a top-level job but this serves disproportionately those from higher social backgrounds and hence, it creates more room for social inequalities to emerge. For those who move for employment, instead, areas with more job opportunities help those from lower social backgrounds to compete on a more equal footing. Nevertheless, we must not lose sight of the bigger picture and acknowledge that ‘stayers’ also compete with ‘movers’ in the labour market and vice-versa. Given that areas with more job opportunities attract more people from various places and graduates who move there are on average better qualified than the ones who do not (Supplementary Materials, Figure S7), stayers and particularly those from lower social backgrounds, might face a higher level of competition despite the higher job opportunities.
To test the selective migration hypothesis (H2b) we examine the individual factors which could explain the patterns linked to the movers. Hence, the following analyses focus on graduates who moved for employment and on their probability of entering top-level jobs.
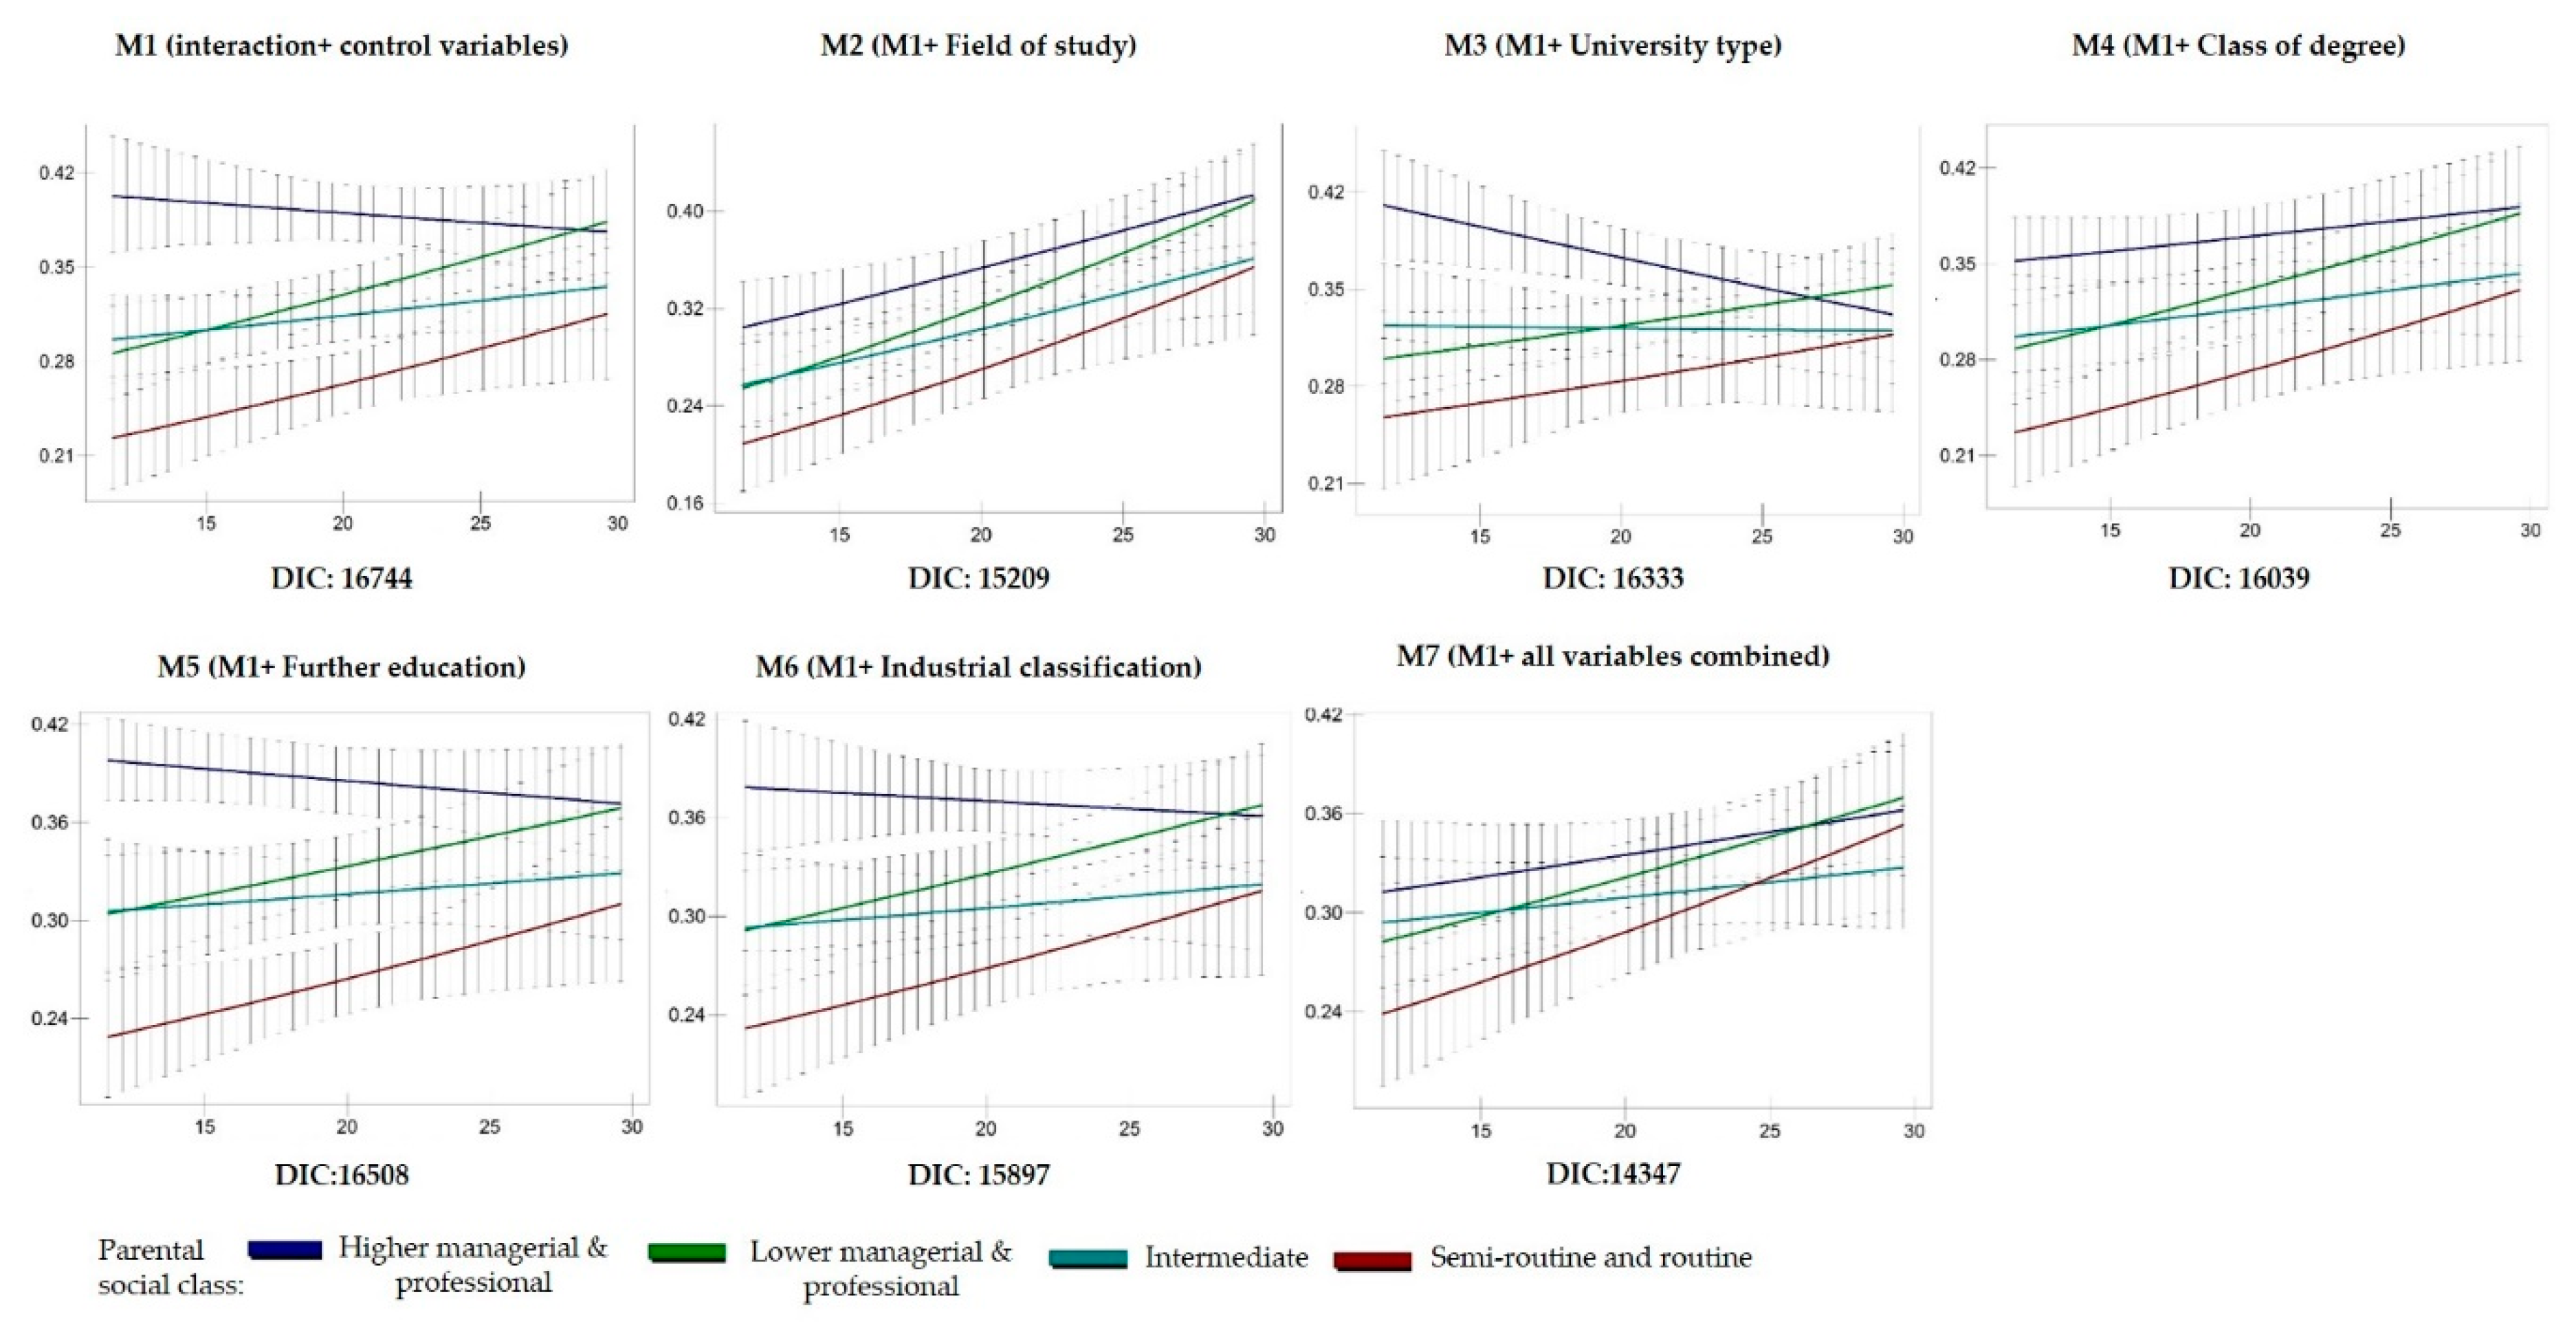
Figure 4 presents the estimated area-level variation in the social class gap in entering top-level jobs among movers and how this changes when we control for different individual characteristics. M1 controls for gender, age at graduation, ethnicity, disability and country within GB and shows a slight narrowing of the social class gap. This indicates that a small part of the initially observed differences were related to the socio-demographic characteristics of graduates. However, the pattern remains very similar to the one presented in Figure 3. Furthermore, models M2-M6 build on M1 and add the main effects of several higher education and employment characteristics separately (i.e., not in a nested fashion). This model building is meant to assess whether certain factors are more influential than others in explaining our pattern of interest. Finally, M7 brings all variables together to test whether controlling for all the factors at the same time fully explains the identified area-level variations. Based on the DIC of each model, it is clear that the field of study and the sector of activity entered, followed by the class of degree, are the most important predictors of entering top level jobs with a decrease in the DIC of 1535, 847 and 705 units respectively compared to M1 (DIC = 16,744).
Indeed, looking at the change in the area-level variation pattern, ‘field of study’ seems to exert the strongest influence, closing the wide social class gap in areas with lower percentage of professionals and making the lines by parental background almost parallel (i.e., constant social class gap across areas) but slightly converging in the areas with the highest percentage of professionals. A similar pattern but slightly weaker is shown when controlling for the class of degree (M4). However, in both cases, the differences between top and bottom parental social classes, although narrower, remain statistically significant in areas with fewer opportunities and become not statistically significant only in the areas with the highest job opportunities (see Figures S3 and S4 in the Supplementary Materials showing the predicted median probabilities only for the top and bottom social classes for a clearer picture of the confidence intervals). As already mentioned, sector of activity (M6) is an important predictor in itself and explains some of the differences in the areas with low job opportunities. However, as in the case of all other variables, the differences are not fully explained by this factor. The other variables play a weaker role both as overall predictors and in explaining the investigated patterns. Finally, when including all variables together, the area-level variation shows an even stronger convergence in the areas with more job opportunities and despite the fact that a wider gap remains in areas with fewer job opportunities, the remaining differences are not statistically significant, not even between the two extreme ends of the social class schema. Therefore, taken together, higher education and employment characteristics help to explain the regional variations in the social class gap with respect to entering top-level jobs.
5.4. Further Analysis
Given the pivotal role of field of study and type of industry in explaining the identified regional variations in the social class gap related to entering top-level jobs, this section aims to shed more light on how these two factors matter in the processes examined. Looking at the distribution of field of study by parental background and by quartiles of professionals in the areas of employment, it is clear that the major social class difference in the field of study among graduates who have moved to work in areas with fewer job opportunities is the higher percentage of graduates from top social classes who studied Medicine & Veterinary compared to their counterparts from lower social classes. This gap narrows as the percentage of professionals increases.10 Indeed, robustness checks excluding graduates who studied medicine show that the initial area-level variation pattern in the probability of getting a top-level job reduces dramatically (Figure S5). Nevertheless, the gap between top and bottom social classes remains significant and larger in areas with fewer job opportunities (Figure S6). Therefore, although, having studied Medicine & Veterinary is one of the crucial factors behind the larger social class gaps identified in areas with low professional job opportunities, this pattern remains even when excluding graduates who studied Medicine & Veterinary from the analysis.11
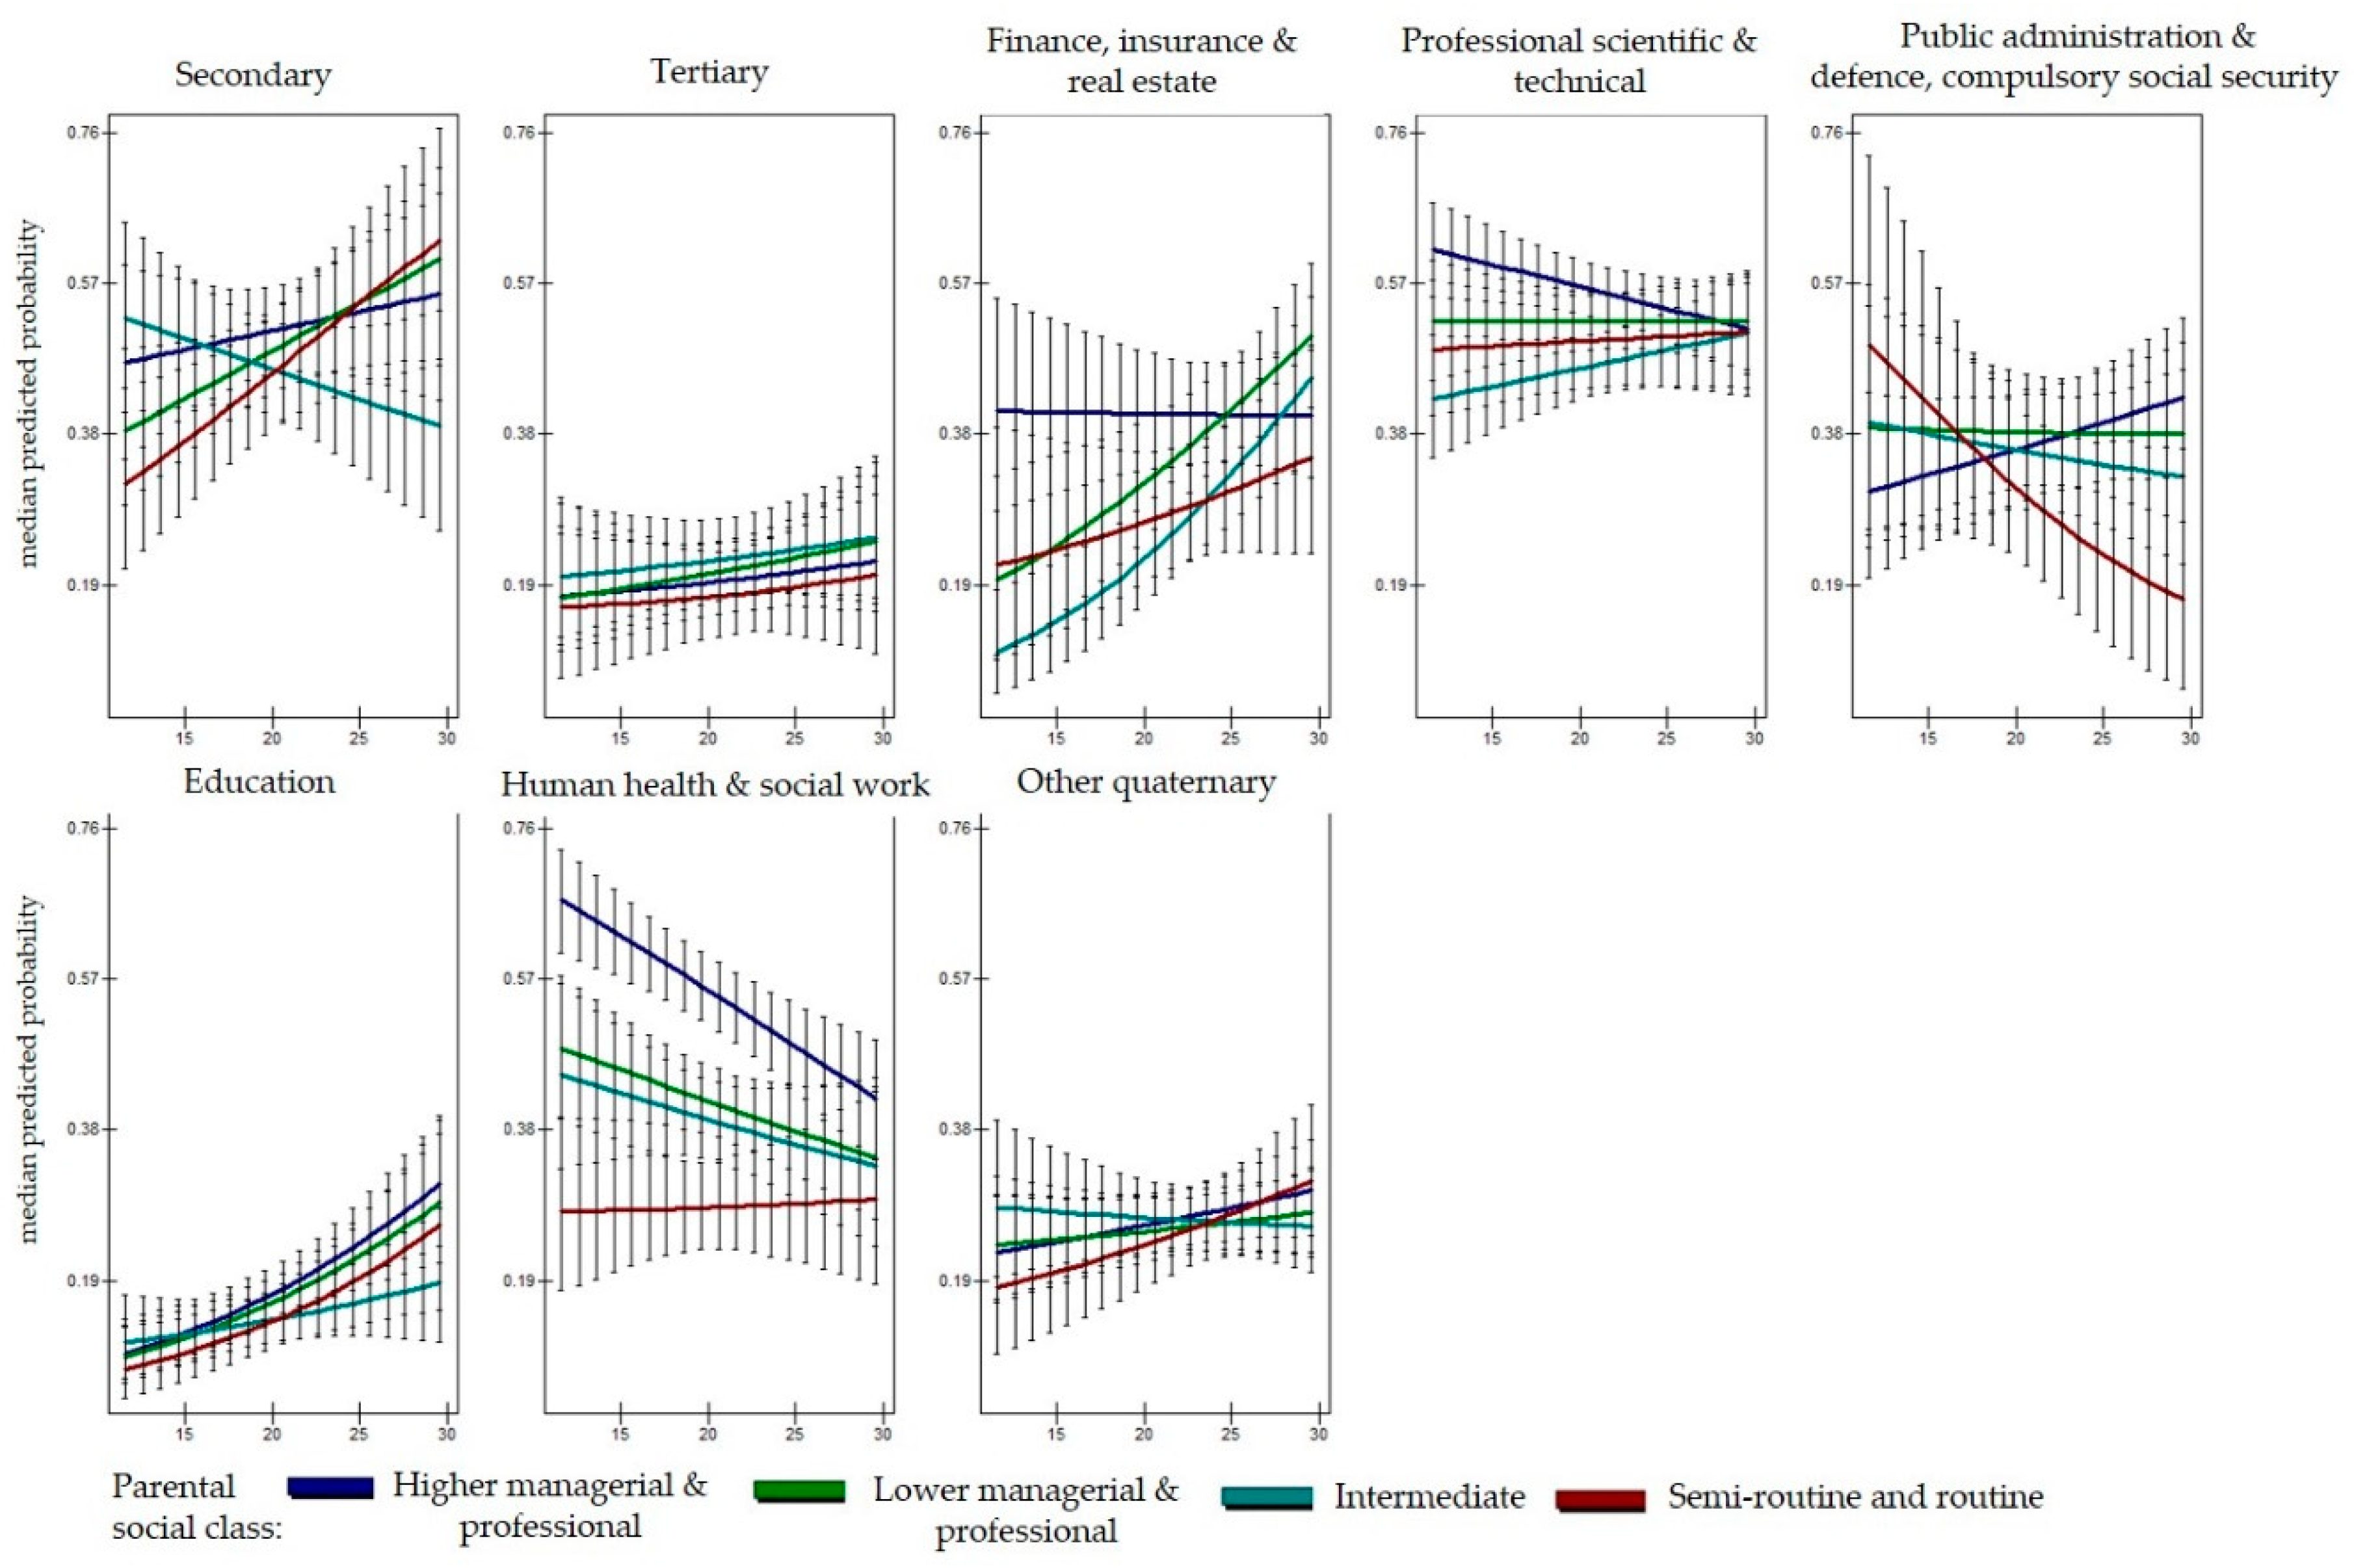
Finally, to illustrate how the regional variation in the social class gap of entering the top-level jobs depends on the type of industry, we present the median probabilities from a three-way interaction model between parental social class, percentage of professionals and industry (Figure 5) showing the area-level variation in the social class gap within each industry. These results confirm that the ‘Human Health & Social Work’ industry is the sector which mostly resembles the initially identified pattern of area-level variation in the social class gap (i.e., wider and significant inequalities in areas with low job opportunities and smaller and non-significant differences in areas with the highest level of job opportunities). Nonetheless, other industries such as ‘Finance, Insurance and Real Estate’ and ‘Professional, Scientific and Technical’ show a similar pattern, with those from intermediate social classes being the only group which shows statistically significant differences compared to those from the top social classes in areas with fewer job opportunities. Other industries do not show clear or significant regional variation in the social class differences in the probability of attaining a top-level job.
6. Conclusions
This paper provides new empirical evidence on the link between area-level opportunities and social class inequalities in graduates’ occupational outcomes. It assesses whether the social-class gap in graduates’ occupational destinations documented in various studies may vary depending on area-level job opportunities and, if so, the mechanisms behind this spatial variation. Based on the literature on social mobility and the ‘escalator’ regions, we formulated two main hypotheses: one predicting constant social class inequalities across areas with different levels of job opportunities and another predicting a decline in social class inequalities with the increase in job opportunities. Moreover, regarding the latter hypothesis, we investigated why such a decline in inequalities might occur—whether due to structural area factors (i.e., the higher number and variety of jobs requiring a degree available in such areas) or because of selective migration, that is, the most qualified graduates, regardless of their social background, are attracted to areas with more opportunities.
In line with other studies (e.g., Gibbons et al. 2010), we found that the overall area-level variation in the chances of getting a top-level job and avoiding a low-level job is low compared to the individual-level variation. However, area characteristics such as the percentage of professional jobs available and the employment rate significantly increase graduates’ chances of getting a top-level job. Three main findings emerged in relation to social class inequalities in graduates’ occupational destinations.
The first is that the relationship between area-level job opportunities and graduates’ chances of getting a top-level job is not constant among graduates from different social backgrounds. Graduates from working class of origin have significantly lower chances of entering top-level jobs when the employment opportunities are low but they catch up when the job opportunities are particularly high (in the ‘escalator’ areas). In contrast, graduates from the highest social class of origin show a less steep increase in their chances of gaining a top professional or managerial job since they have relatively higher chances of entering these jobs irrespective of the job opportunities in the area of employment. This pattern confirms our alternative research hypothesis, that is, there are lower social class inequalities in graduates’ probabilities of getting a high professional and managerial job in areas with a higher number of these jobs. This finding seems to suggest that areas with higher professional jobs may offer more equal opportunities.
However, a more in-depth analysis of the data reveals our second main finding, that is this pattern only applies to graduates who were geographically mobile. This leads us to reject the idea that structural characteristics of the area are behind the observed reduction in inequalities (H2a) as if this had been the case, graduates who did not move should have shown a similar pattern, which they do not. Therefore, moving for employment to areas with higher job opportunities appears to enhance substantially the chances of accessing a top-level job for graduates from lower social classes, to the extent that they have almost the same chances as the highest social classes.
Thus, our third finding suggests that selective migration may be the main mechanism behind the equalization of graduates’ occupational outcomes in areas with greater occupational opportunities (H2b, that is, the best qualified graduates from all social backgrounds move to areas with the best opportunities). We have further investigated this by testing the role of individual factors (HE experiences and sector of employment entered) in explaining the movers’ patterns. We found that ‘fields of study’ and ‘sector of activity’ have the strongest explanatory power of the social class gap among mobile graduates employed in areas with different levels of professional job opportunities. The other factors which contribute to explain the gap are ‘class degree’ and ‘HE institution type.’ In relation to ‘fields of study’ and ‘sector of activity,’ we found that ‘Medicine and Veterinary’ and working in ‘Human Health and Social Work’ (and to a lesser extent in the Finance and Professional Scientific sectors) provide an advantage for middle class graduates to enter top-level jobs in areas with low percentages of professional jobs.
It is important to acknowledge that our study has some limitations. First, our analysis offers only a snapshot of graduates’ occupational opportunities at a relatively early point in time (3.5 years after graduation) and for those graduates who were in employment. 11% of graduates were still studying and another 5% were unemployed or inactive at the time of the survey. This means that we cannot assess whether our findings would hold for those people who entered the labour market at a later stage. Secondly, due to the limited information available in the data, we could not investigate the reasons behind the different patterns found among immobile graduates. Finally, we may have underestimated the extent of the social class gap due to the issues of survey and item non-response, which have led to a slight over-representation of graduates from more advantaged social classes of origin in our sample (see Supplementary Materials, Tables S1 and S2).
Nevertheless, our findings provide important evidence that area-level opportunities together with geographical mobility are key to gaining access to top-level jobs for graduates from working class backgrounds. However, it is worth noting that among the mobile graduates, an equalization of job opportunities between those from working class and middle-class backgrounds is visible only in areas with the highest percentages of professional jobs (top decile). This suggests that in the other areas of the country, inequalities are still marked and the reasons for why this is the case will require further investigation.
Important policy implications can be drawn from our findings. On the one hand, widening access to some fields, such as Medicine, has the potential to make the competition for professional jobs in areas with lower job opportunities more equal. On the other hand, governmental policies mostly focused on widening access to higher education are inevitably too narrow and need to be extended to include measures aimed to equalize occupational opportunities. Promoting social mobility requires sustained support beyond access to and graduation from higher education to enable graduates from disadvantaged backgrounds to progress into professional graduate employment. Financial support for mobility may be needed to ensure that access to a wider range of opportunities for graduates is not shaped by the resources of their family of origin. Universities have a role too. University career services could play a key part in supporting young people from lower social backgrounds during the critical transition to the labour market by providing essential information on professional job opportunities and their geographical location. In conclusion, our findings have highlighted the need for policies which are not limited to a one-off intervention but take a life-course perspective to ensure equality of opportunity and outcomes for those from different social classes of origin.
Supplementary Materials
The following are available online at https://www.mdpi.com/2076-0760/7/10/201/s1, Sample description and survey non-response rates. Missing information. Table S1: Sample description comparing the distribution of excluded cases due to missing data, complete cases and total sample (column %), sub-sample of those who were in employment. Table S2: Parental social class (including separate category for missing values) and social class of destination. Table S3: Parental social class and social class of destination (row %, restricted GB sample: only those in employment and with valid information on all variables used in our analysis). Table S4: Great Britain NUTS 3 areas in the top decile of percentage of professionals, indicators merged from the ONS Annual population Survey (October 2009–September 2010). Table S5: Great Britain NUTS 3 areas in the bottom decile of percentage of professionals, indicators merged from the ONS Annual population Survey (October 2009–September 2010). Table S6: Full multilevel binary logistic models estimating graduates’ probability of entering a top-level job 3.5 years from graduation. Movers. Table S7: Full multilevel binary logistic models estimating graduates’ probability of entering a top-level job 3.5 years from graduation. Movers, Medicine & Veterinary excluded. Table S8: Full multilevel binary logistic models estimating graduates’ probability of entering a top-level job 3.5 years from graduation. Stayers. Figure S1: Graduates’ social class by social class of origin and by percentages of managers, directors and senior officials in the employment area (NUTS 3). Predicted median probability from a two-way interaction model. Figure S2: Graduates’ social class by social class of origin and by employment rate in the employment area (NUTS 3). Predicted median probability from a two-way interaction model. Figure S3: Graduates’ probability of attaining a top-level job by social class of origin and by percentages of professional jobs in the employment area (NUTS 3). Predicted median probability estimated in Figure 4, M2: Higher managerial and professional and Routine & semi-routine parental social classes. Figure S4: Graduates’ probability of attaining a top-level job by social class of origin and by percentages of professional jobs in the employment area (NUTS 3). Predicted median probability estimated in Figure 4, M4: Higher managerial and professional and Routine & semi-routine parental social classes. Figure S5: Graduates’ probability of attaining a top-level job by social class of origin and by percentages of professional jobs in the employment area (NUTS 3). Subsample of graduates who did NOT study Medicine & Veterinary. Predicted median probability. Figure S6: Graduates’ probability of attaining a top-level job by social class of origin and by percentages of professional jobs in the employment area (NUTS 3). Subsample of graduates who did NOT study Medicine & Veterinary. Predicted median probability. Higher managerial and professional and Routine & semi-routine parental social classes. Figure S7: Distribution of class of degree by parental background by quartiles of professionals in the employment area: movers. Figure S8: Graduates’ social class by social class of origin and by percentages of professionals in the employment area (NUTS 3). Predicted median probability from a two-way interaction model. Figure S9: Graduates’ social class by social class of origin, by percentages of professionals in the employment area (NUTS 3) and by geographic mobility. Predicted median probability from a three-way interaction model.
Author Contributions
Both authors A.D. and C.I. contributed to conceptualization, methodology, writing, reviewing and editing the paper. In addition, A.D. conducted the formal analysis, data curation and visualization and C.I. was involved in the funding acquisition.
Funding
This research was funded by the Economic and Social Research Council (ESRC), grant number ES/K006460/1 and it was conducted as part of the ‘Education and Social Stratification’ research strand in the Applied Quantitative Methods Network (AQMeN) Centre.
Conflicts of Interest
The authors declare no conflict of interest. The funders had no role in the design of the study; in the collection, analyses, or interpretation of data; in the writing of the manuscript, or in the decision to publish the results. Neither the Higher Education Statistics Agency Limited nor HESA Services Limited can accept responsibility for any inferences or conclusions derived by third parties from data or other information supplied by HESA Services.
References
- Boliver, Vikki. 2011. Expansion, differentiation and the persistence of social class inequalities in British higher education. Higher Education 61: 229–42. [Google Scholar] [CrossRef]
- Boliver, Vikki. 2017. Misplaced optimism: how higher education reproduces rather than reduces social inequality. British Journal of Sociology of Education 38: 423–32. [Google Scholar] [CrossRef]
- Britton, Jack, Lorraine Dearden, Neil Shephard, and Anna Vignoles. 2016. How English Domiciled Graduate Earnings Vary with Gender, Institution Attended, Subject and Socio-economic Background. IFS Working Paper W16/06. London, UK: Institute for Fiscal Studies. [Google Scholar]
- Brown, Phillip. 2013. Education, Opportunity and the Prospects for Social Mobility. British Journal of Sociology of Education 34: 678–700. [Google Scholar] [CrossRef]
- Bukodi, Erzsébet, John H. Goldthorpe, Lorraine Waller, and Jouni Kuha. 2015. The Mobility Problem in Britain: New Findings from the Analysis of Birth Cohort Data. British Journal of Sociology 66: 93–117. [Google Scholar] [CrossRef] [PubMed] [Green Version]
- Cabinet Office. 2011. Opening Doors, Breaking Barriers: A Strategy for Social Mobility; London: Information Policy Team. Available online: https://assets.publishing.service.gov.uk/government/uploads/system/uploads/attachment_data/file/61964/opening-doors-breaking-barriers.pdf (accessed on 17 October 2018).
- Champion, Tony, Mike Coombes, and Ian R. Gordon. 2013. Urban Escalators and Inter-regional Elevators: The Difference that Location, Mobility and Sectoral Specialisation Make to Occupational Progression. SERC Discussion Paper 139. Available online: https://ssrn.com/abstract=2342282 (accessed on 17 October 2018). [CrossRef]
- Crawford, Claire. 2014. Socio-Economic Differences in University Outcomes in the UK: Drop-Out, Degree Completion and Degree Class. IFS Working Papers, No. W14/31. London, UK: Institute for Fiscal Studies. [Google Scholar]
- Crawford, Claire, Paul Gregg, Lindsey Macmillan, Anna Vignoles, and Gill Wyness. 2016. Higher education, career opportunities and intergenerational inequality. Oxford Review of Economic Policy 32: 553–75. [Google Scholar] [CrossRef]
- Department for Education (DFE). 2017. Unlocking Talent, Fulfilling Potential: A Plan for Improving Social Mobility through Education. Available online: https://assets.publishing.service.gov.uk/government/uploads/system/uploads/attachment_data/file/667690/Social_Mobility_Action_Plan_-_for_printing.pdf (accessed on 17 October 2018).
- Docherty, David, and Rosa Fernandez. 2014. Career Portfolios and the Labour Market for Graduates and Postgraduates in the UK. London: National Centre for Universities and Businesses. [Google Scholar]
- Erikson, Robert, and John H. Goldthorpe. 1992. The Constant Flux: A Study of Class Mobility in Industrial Societies. Oxford: Clarendon Press. [Google Scholar]
- Faggian, Alessandra, Philip McCann, and Stephen Sheppard. 2007. Human Capital, Higher Education and Graduate Migration: An Analysis of Scottish and Welsh Students. Urban Studies 44: 2511–28. [Google Scholar] [CrossRef]
- Fielding, Anthony J. 1992. Migration and Social Mobility: South East England as an Escalator Region. Regional Studies 26: 1–15. [Google Scholar] [CrossRef] [PubMed]
- Friedman, Sam, and Daniel Laurison. 2017. Mind the gap: financial London and the regional class pay gap. British Journal of Sociology 68: 474–511. [Google Scholar] [CrossRef] [PubMed] [Green Version]
- Friedman, Sam, Daniel Laurison, and Lindsey Macmillan. 2017. Social Mobility, the Class Pay Gap and Intergenerational Worklessness: New Insights from the Labour Force Survey. Social Mobility Commission. Available online: https://assets.publishing.service.gov.uk/government/uploads/system/uploads/attachment_data/file/596945/The_class_pay_gap_and_intergenerational_worklessness.pdf (accessed on 3 August 2018).
- Gibbons, Stephen, Henry G. Overman, and Panu Pelkonen. 2010. Wage Disparities in Britain: People or Place? SERC Discussion Papers, SERCDP0060. London: Spatial Economics Research Centre (SERC), London School of Economics and Political Science. [Google Scholar]
- Goldthorpe, John H., and Colin Mills. 2004. Trends in intergenerational class mobility in Britain in the late twentieth century. In Social Mobility in Europe. Edited by Richard Breen and Ruud Luijkx. Oxford: Oxford University Press. [Google Scholar]
- Goldthorpe, John H. 1987. Social Mobility and Class Structure in Modern Britain. Oxford: Clarendon Press. [Google Scholar]
- Iannelli, Cristina, and Lindsay Paterson. 2006. Social Mobility in Scotland since the Middle of the Twentieth Century. Sociological Review 54: 520–45. [Google Scholar] [CrossRef]
- Iannelli, Cristina, and Lindsay Paterson. 2007. Education and Social Mobility in Scotland. Research in Social Stratification and Mobility 25: 21932. [Google Scholar] [CrossRef]
- Iannelli, Cristina, Emer Smyth, and Markus Klein. 2016. Curriculum Differentiation and Social Inequality in Higher Education Entry in Scotland and Ireland. British Educational Research Journal 42: 561–81. [Google Scholar] [CrossRef] [Green Version]
- Iannelli, Cristina, Adam Gamoran, and Lindsay Paterson. 2018. Fields of Study: Horizontal or Vertical Differentiation within Higher Education Sectors? Research in Social Stratification and Mobility. Available online: https://doi.org/10.1016/j.rssm.2018.06.004 (accessed on 17 October 2018).
- Jackson, Michelle, John H. Goldthorpe, and Colin Mills. 2005. Education, employers and class mobility. Research in Social Stratification and Mobility 23: 3–33. [Google Scholar] [CrossRef]
- Jacob, Marita, Markus Klein, and Cristina Iannelli. 2015. The Impact of Social Origin on Graduates’ Early Occupational Destinations—An Anglo-German Comparison. European Sociological Review 31: 460–76. [Google Scholar] [CrossRef]
- Kidd, Michael P., Nigel O’Leary, and Peter Sloane. 2017. The impact of mobility on early career earnings: A quantile regression approach for UK graduates. Economic Modelling 62: 90–102. [Google Scholar] [CrossRef]
- Laurison, Daniel, and Sam Friedman. 2016. The class pay gap in higher professional and managerial occupations. American Sociological Review 81: 668–95. [Google Scholar] [CrossRef] [Green Version]
- Gordon, Marshall, Newby Howard, Rose David, and Vogler Carol. 1988. Social Class in Modern Britain. London: Hutchinson. [Google Scholar]
- O’leary, Nigel C., and Peter J. Sloane. 2008. Rates of Return to Degrees across British Regions. Regional Studies 42: 199–213. [Google Scholar] [CrossRef] [Green Version]
- Office for National Statistics (ONS). 2018a. Regional Labour Market Statistics in the UK: July 2018. Available online: https://www.ons.gov.uk/employmentandlabourmarket/peopleinwork/employmentandemployeetypes/bulletins/regionallabourmarket/july2018 (accessed on 3 August 2018).
- Office for National Statistics (ONS). 2018b. Regional and Sub-Regional Productivity in the UK: February 2018. Available online: https://www.ons.gov.uk/employmentandlabourmarket/peopleinwork/labourproductivity/articles/regionalandsubregionalproductivityintheuk/february2018 (accessed on 3 August 2018).
- Office for National Statistics, Social Survey Division (ONS SSD). 2015. Annual Population Survey, October 2009–September 2010, 4th ed. [Data Collection]. UK Data Service. SN: 6754. Available online: http://doi.org/10.5255/UKDA-SN-6754-4 (accessed on 18 October 2018).
- Payne, Geoffrey. 1987. Employment and Opportunity. London: MacMillan Press. [Google Scholar]
- Rasbash, Jon, Fiona Steele, William Browne, and B. Prosser. 2015. A User’s Guide to MLwiN. Bristol: Centre for Multilevel Modelling, University of Bristol. [Google Scholar]
- Rose, David, David J. Pevalin, and Karen O’Reilly. 2005. The NS-SEC: Origins, Development and Use. London: Office for National Statistics, Swindon: Economic and Social Research Council. [Google Scholar]
- Social Mobility Commission. 2017. State of the Nation 2017: Social Mobility in Great Britain; London: HMSO. Available online: https://assets.publishing.service.gov.uk/government/uploads/system/uploads/attachment_data/file/662744/State_of_the_Nation_2017_-_Social_Mobility_in_Great_Britain.pdf (accessed on 3 August 2018).
- Sullivan, Alice, Samantha Parsons, Richard Wiggins, Anthony Heath, and Francis Green. 2014. Social origins, school type and higher education destinations. Oxford Review of Education 40: 739–63. [Google Scholar] [CrossRef]
- Sullivan, Alice, Samantha Parsons, Francis Green, Richard D. Wiggins, and George Ploubidis. 2017. The path from social origins to top jobs: Social reproduction via education. The British Journal of Sociology. [Google Scholar] [CrossRef]
- Triventi, Moris. 2013. The role of higher education stratification in the reproduction of social inequality in the labor market. Research in Social Stratification and Mobility 32: 45–63. [Google Scholar] [CrossRef] [Green Version]
- Van de Werfhorst, Herman G., Alice Sullivan, and Sin Yi Cheung. 2003. Social class, ability and choice of subject in secondary and tertiary education in Britain. British Educational Research Journal 29: 41–62. [Google Scholar] [CrossRef]
- Van Ham, Maarten, Allan Findlay, David Manley, and Peteke Feijten. 2012. Migration, Occupational Mobility and Regional Escalators in Scotland. Urban Studies Research. [Google Scholar] [CrossRef]
| 1 | More details about the sample and survey non-response rates are provided in the first section of the supplementary material. |
| 2 | Absolute numbers in this study are rounded according to HESA rounding policy (https://www.hesa.ac.uk/about/regulation/data-protection/rounding-and-suppression-anonymise-statistics). |
| 3 | Among the graduates who were not in employment, only 5 % were unemployed or inactive; the remaining 11% were enrolled in further study programmes. We checked the social composition of the ‘employed’, ‘unemployed/inactive’ and ‘in further education’ subsamples and we found that the subsample in employment is slightly more socially advantaged than the subsample unemployed/inactive but it is slightly less advantaged than the subsample in further education. However, the differences were generally small and did not raise concerns about potential biases introduced by the exclusion of non-employed people from the analyses. |
| 4 | The variables with the highest percentage of missing data were parental social class (16%) and area of employment (6%); the missing data for the rest of the variables was below 1%. See the supplementary material (section 2) for a full analysis of the missing values. |
| 5 | While full postcodes are necessary to derive NUTS 3 areas, some respondents only provided the outward postcode (i.e., the first 3-4 characters of a full postcode) of employment. To avoid dropping these cases, we used the full postcodes and the corresponding NUTS 3 lookup tables provided by the ONS NSPD (May 2009) and derived a measure of frequency of each NUTS 3 within each outward postcode and when only the outward postcode was available in our data, we assigned the most frequent NUTS 3 within that particular outward postcode. |
| 6 | Macro-indicators measuring unemployment and inactivity rates were also tested but they did not provide further insights into our analysis. Moreover, the three selected macro-indicators represent a more direct measure of job opportunities, which is a central concept in this study. |
| 7 | We also tested cross-classified multinomial multilevel models accounting simultaneously for both area of domicile and area of employment but we encountered convergence issues due to the little variance linked to the area of domicile. We tested this by running a set of separate binary logit models: the chances of entering ‘higher managerial and professional occupations’ were compared to the chances of entering all other classes together and to the chances of entering each of the other social classes of destinations. The results showed almost no variance at the domicile area level (VPC between 0 and 0.002) once area of employment was accounted for. |
| 8 | Moreover, allowing for a random intercept vs. a single-level model leads to a reduction in the Deviance Information Criterion (DIC) of 204.1, suggesting that the random intercept model fits better. |
| 9 | The area-level variance drops from 0.035 in the null model (M0) to 0.027 (M1) when contrasting NS-SEC 1 with NS-SEC 2 (M1), from 0.041 (M0) to 0.032 (M1) when compared with NS-SEC 3 and from 0.21 (M0) to 0.13 (M1) when examined against NS-SEC 4. |
| 10 | Percentages not mentioned given that some cells consisted of less than the recommended HESA threshold (i.e., 22.5). |
| 11 | The main predictors in the models without medicine remain ‘industry’ and ‘field of study’ followed by type of university (Table S7). |
Figure 1.
Graduates’ parental social class and their social class 3.5 years after graduation (weighted percentages).
Figure 1.
Graduates’ parental social class and their social class 3.5 years after graduation (weighted percentages).

Figure 2.
Graduates’ social class by social class of origin and by percentages of professionals in the employment area (NUTS 3). Predicted median probability from a two-way interaction model.
Figure 2.
Graduates’ social class by social class of origin and by percentages of professionals in the employment area (NUTS 3). Predicted median probability from a two-way interaction model.

Figure 3.
Graduates’ social class by social class of origin, by percentages of professionals in the employment area (NUTS 3) and by geographic mobility. Predicted median probability from a three-way interaction model.
Figure 3.
Graduates’ social class by social class of origin, by percentages of professionals in the employment area (NUTS 3) and by geographic mobility. Predicted median probability from a three-way interaction model.

Figure 4.
Graduates’ probability of attaining a top-level job by social class of origin and by percentages of professional jobs in the employment area (NUTS 3). Predicted median probability from several two-way interaction models. Note: DIC = Deviance Information Criteria.
Figure 4.
Graduates’ probability of attaining a top-level job by social class of origin and by percentages of professional jobs in the employment area (NUTS 3). Predicted median probability from several two-way interaction models. Note: DIC = Deviance Information Criteria.

Figure 5.
Graduates’ probability of attaining a top-level job by social class of origin, by percentages of professional jobs in the employment area (NUTS 3) and by type of industry. Predicted median probability from a three-way interaction model. Note: Primary industry suppressed due to small sample size.


Table 1.
Multilevel multinomial logit models estimating graduates’ probability of reaching different social classes 3.5 years since graduation vs. Higher managerial and professional social class (area-level variance, coefficients and standard errors).
Table 1.
Multilevel multinomial logit models estimating graduates’ probability of reaching different social classes 3.5 years since graduation vs. Higher managerial and professional social class (area-level variance, coefficients and standard errors).
| Graduates’ Social Class 3.5 Years Since Graduation | |||
|---|---|---|---|
| Reference Category: Higher Managerial & Professional | Lower Managerial & Professional | Intermediate | Semi-Routine & Routine |
| M0 | |||
| Intercept | 0.509 (0.025) | −0.351 (0.029) | −1.335 (0.051) |
| Area-level variance | 0.035 | 0.041 | 0.210 |
| (0.012) | (0.014) | (0.046) | |
| M1 | |||
| Intercept | 0.943 (0.129) | 0.050 (0.159) | –0.128 (0.258) |
| % professional | –0.024 (0.007) | –0.022 (0.008) | –0.066 (0.014) |
| Area-level variance | 0.027 (0.010) | 0.032 (0.012) | 0.130 (0.041) |
| M2 | |||
| Intercept | 0.562 (0.146) | –0.069 (0.171) | –1.004 (0.315) |
| % managerial | –0.005 (0.014) | –0.029 (0.017) | –0.034 (0.031) |
| Area-level variance | 0.032 (0.011) | 0.037 (0.015) | 0.200 (0.045) |
| M3 | |||
| Intercept | 1.372 (0.411) | 0.889 (0.440) | –0.194 (0.828) |
| Employment rate | –0.012 (0.006) | –0.018 (0.006) | –0.016 (0.012) |
| Area-level variance | 0.031 (0.009) | 0.035 (0.010) | 0.212 (0.045) |
© 2018 by the authors. Licensee MDPI, Basel, Switzerland. This article is an open access article distributed under the terms and conditions of the Creative Commons Attribution (CC BY) license (http://creativecommons.org/licenses/by/4.0/).
Share and Cite
MDPI and ACS Style
Duta, A.; Iannelli, C. Social Class Inequalities in Graduates’ Labour Market Outcomes: The Role of Spatial Job Opportunities. Soc. Sci. 2018, 7, 201. https://doi.org/10.3390/socsci7100201
AMA Style
Duta A, Iannelli C. Social Class Inequalities in Graduates’ Labour Market Outcomes: The Role of Spatial Job Opportunities. Social Sciences. 2018; 7(10):201. https://doi.org/10.3390/socsci7100201
Chicago/Turabian StyleDuta, Adriana, and Cristina Iannelli. 2018. "Social Class Inequalities in Graduates’ Labour Market Outcomes: The Role of Spatial Job Opportunities" Social Sciences 7, no. 10: 201. https://doi.org/10.3390/socsci7100201
Note that from the first issue of 2016, this journal uses article numbers instead of page numbers. See further details here.