
Physical Health of Food Consumers during the COVID-19 Pandemic
by
 , , , and
José Oliveira
1, 
Tânia Santos
2,3 ,
,
Marlene Sousa
2,3 ,
,
João M. Lopes
4,5 ,
,
Sofia Gomes
6 and
Márcio Oliveira
3,5,*
1
School of Economics and Management, University of Minho, Largo do Paço, 4704-553 Braga, Portugal
2
CICS.NOVA—Interdisciplinary Centre for Social Sciences, R. Dr. João Soares, 2400 Leiria, Portugal
3
Polytechnic Institute of Leiria, Apartado 4133, 2411-901 Leiria, Portugal
4
Miguel Torga Institute of Higher Education, 3000-132 Coimbra, Portugal
5
NECE—Research Unit in Business Sciences, University of Beira Interior, 6200-209 Covilhã, Portugal
6
REMIT—Research on Economics, Management and Information Technologies, University Portucalense, 4200-072 Porto, Portugal
*
Author to whom correspondence should be addressed.
Soc. Sci. 2021, 10(6), 218; https://doi.org/10.3390/socsci10060218
Submission received: 22 April 2021
/
Revised: 4 June 2021
/
Accepted: 4 June 2021
/
Published: 9 June 2021
(This article belongs to the Special Issue Understanding Policy Dynamics of COVID-19 in the EU and the Rest of the World: Challenges, Reactions, and Perspectives after One Year)
Abstract
:The present research aims to analyze the habits observed in the perception of the general physical health condition of Portuguese food consumers in the COVID-19 pandemic. The investigation is focused on indicators such as weight, physical activity, and consumption habits through the adoption of healthy and not healthy food. Centered on a quantitative approach, the research is based on the application of a questionnaire to a sample of 741 Portuguese consumers, between November 2020 and February 2021, a period during which the most severe measures of social isolation were imposed by the Portuguese government, since the beginning of the pandemic. Moreover, the questionnaire was applied to consumers over 18 years old. According to this population, and considering a 95% confidence level and a margin of error of 4%, the sample has a minimum of 601 responses. Being so, the results of this research are representative for the Portuguese food consumers. The theoretical model was estimated using Partial Least Squares (PLS) in the Smart PLS 3.0 software. The obtained results allowed us to conclude that the Portuguese perception of their weight did not change in the pandemic, despite showing that in general, the pandemic had a negative impact on their physical condition. On the other hand, the results show that the Portuguese associate the practice of physical exercise with physical well-being. Respondents also confirm a positive relationship between “positive eating behaviors (such as consumption of fruits and vegetables, low saturated foods and rich in monounsaturated and polyunsaturated fats” and water consumption) and “the perception of physical health in general”. On the contrary, respondents’ perception of the choice of negative eating behaviors (measured by the consumption of products with a high content of salt and sugar, snacks, and processed frozen and pre-cooked foods) have a negative impact on the “assessment of physical health, in the COVID-19 pandemic”. Hence, it was concluded that the Portuguese consider that an eventual increase in weight does not necessarily correspond to a perception of worse physical health; the practice of physical exercise and good eating habits corresponds to a perception of better physical health; the adoption of bad eating habits corresponds to the perception of bad physical health.
1. Introduction
Currently, we are facing a worldwide health problem, the COVID-19 pandemic. Pandemics are widely recognized as outbreaks that arise from large-scale infectious diseases and significantly increase mortality and morbidity in several regions of the globe. With pandemics, other problems emerge at the political, social, and economic levels (Madhav et al. 2017; Ruiz et al. 2021). On 11 March 2020, the World Health Organization (WHO) declared COVID-19 as a global pandemic, with proportions never seen before (Kickbusch et al. 2020; Phillipou et al. 2020).
After the appearance of COVID-19 pandemic, multiple countries around the world implemented distinct measures to mitigate, restrict, prevent, interrupt, or retard its spread. Such measures included recommendations to the population on individual disinfection, the use of mask, and physical and social distancing. The outcome of these procedures, resulted in a decrease in social interactions, consequently, decreasing employment, which affected the world economy (Phillipou et al. 2020). Confinements/lockdowns never seen before were introduced, these types of impositions, forced individuals to “stay at home”. Stores, places of worship, churches, schools were closed, and traveling was paused or severely restricted. During confinement, individuals could only leave their homes to care for dependent people, to work (only for jobs considered essential, others should use teleworking wherever possible), go to urgent health treatments, and buy essential products such as food and medicine (Ruiz et al. 2021).
Furthermore, the World Health Organization recommended limitations on the visualization time of generic news about the COVID-19 pandemic, searching for reliable information from official media, regular sleep, and healthy eating routines, physical activity, maintaining the family routine, and pursuit of a healthy lifestyle (Antunes et al. 2020; World Health Organization 2020). To achieve this, the practice of physical activity plays an essential role, particularly when taking into account that habits in daily routines can lead to an increase in sedentary behaviors (Chen et al. 2020). Moreover, it is widely recognized to reduce anxiety levels, even if physical activities are practiced at home instead of outdoors (Anderson and Shivakumar 2013; Hammami et al. 2020; Stubbs et al. 2017).
Although there was a state of emergency decreed on 18 March and 6 November 2020, the government allowed individual outdoor physical activity so there was no total restriction of movement imposed on the population. These measures allowed short-distance walking and pet hygiene walking. However, group physical activity was prohibited, and gyms and sports clubs were closed (Antunes et al. 2020).
Given the restrictions previously mentioned, and caused by the COVID-19 pandemic, the scale and long duration of these measures resulted in alterations in physical health, habits, and behavior in society (Li et al. 2020; Phillipou et al. 2020; Wang et al. 2020a). Thus, it is important to examine the perception of physical health, in the pandemic time (Mammen and Faulkner 2013; Parletta et al. 2016; Ruiz et al. 2021), as it is the people’s perception that it shapes their behavior, more than the reality itself (Bruce and Agras 1992; Kuijer and Boyce 2012; Phillipou et al. 2020).
That said, the objective of the present research is to analyze the habits observed in the perception of the general physical health condition of Portuguese food consumers in the COVID-19 pandemic. Moreover, it is also intended to study consumers’ eating behaviors in this pandemic.
2. Material and Methods
After the World Health Organization declared the disease COVID-19 as a global pandemic, several measures have been implemented to minimize virus transmission. Some of these measures included social distancing, isolation, and quarantine for those who had contracted (or potentially contracted) the disease. These imposed restrictions to reduce the transmission of COVID-19, which implied transformations in lifestyle habits and behaviors, could lead to possible deviations in sleep, alcohol consumption, physical exercise, and eating habits (Arora and Grey 2020; Durães et al. 2021). In line with the research objectives, we centered the literature review on two topics: (1) eating behaviors, and (2) exercise and physical health.
2.1. Eating Behaviors
Psycho-emotional and environmental variations on the habits experienced in the context of the pandemic caused alterations in the eating behavior of the general population (Abbas and Kamel 2020; Arora and Grey 2020; Durães et al. 2021; Herrera-Peco et al. 2021; Muscogiuri et al. 2020). The fact that a large part of the population is at home and there has been an increase in food consumption could mean that eventually, this population is preparing at home the meals they usually eat outside, using fresh ingredients, with fewer preservatives/additives (Arora and Grey 2020). On the other hand, prolonged stress and other psychological problems can lead to an increased feeling of hunger and a desire to consume foods rich in carbohydrates (snacking behaviors), which stimulate the production of serotonin and have a positive effect on the mood (Abbas and Kamel 2020; Muscogiuri et al. 2020).
Matias et al. (2020), agreed that comfort eating and drinking is a common strategy for some people who try to relieve the anxiety and suffering associated with confinement. Such behaviors are associated with weight gain and the development of obesity and eating disorders, especially in conditions of isolation and boredom.
Furthermore, it is important to accept the fact that in the pandemic, food and nutrition safety could be a very distant reality for many people. The acquisition of food was affected due to market changes, with implications for the most vulnerable population in social, economic, and health terms, with direct implications in the consumption upsurge of ultra-processed foods, due to their price, access, and ease of use. Additionally, the supply of fresh food is often restricted and is not sufficient (Durães et al. 2021; Ribeiro-Silva et al. 2020). A poor nutritional diet and an increase in energy intake can lead to weight gain and obesity, as well as other chronic diseases such as coronary heart disease, type 2 diabetes, mellitus, hyperlipidemia, and stroke (Arora and Grey 2020).
Ammar et al. (2020), concluded that, in the pandemic, people changed their eating habits, increasing the consumption of unhealthy foods, eating uncontrollably, eating more snacks between meals, and increasing the number of meals. According to these authors, the negative deviations in eating behaviors can be attributed to increased anxiety and boredom, a decrease in motivation to participate in physical activity to maintain a healthy diet or an increment in food intake motivated by mood.
2.2. Exercise and Physical Health
The restrictions imposed on social interaction and outdoor activities led to disruptions in the daily activities of millions of people (Arora and Grey 2020). Physical activity is important in the pandemic context in which we live, as exercise can help rebalance health, and physical and mental well-being (Chen et al. 2020; Dwyer et al. 2020; Matias et al. 2020; Raiol 2020).
Despite the recognition of the importance of this issue, there are only a few public health guidelines to support individuals in terms of maintaining their daily exercise or physical activity routines (Dwyer et al. 2020). The fact that people stay at home, to prevent the spread of the virus, can lead to reduced physical activity and increased sedentary behaviors (Chen et al. 2020).
Thus, maintaining regular levels of physical activity can be a challenge for most people, who saw the places where they used to exercise, closed (such as gyms, parks, sports associations, amongst others), due to the isolation measures and social distancing imposed by various governments around the world (Dwyer et al. 2020; Goh et al. 2021). There was a need to change the form and location where people exercised, with exercise being recommended at home, often using online classes with personal trainers or the use of exercise videos that focus on motivating and offering physical activity, or through the internet and mobile devices to maintain physical activity and physical health in this critical period (Amekran and El Hangouche 2021; Chen et al. 2020).
Cheval et al. (2021), confirmed that the increase in leisure time and physical activity is associated with better physical health, while the increase in sedentary time is associated with less physical health. These authors suggest that physically active behaviors and the reduction in physical inactivity in the confinement caused by COVID-19 improved the perception of physical health. Ammar et al. (2020) demonstrated that measures to combat COVID-19 reduced physical activity in general (in the number of days and hours) as well as access to physical exercise. Despite the increase in the offer of guidance and physical exercise classes available on social networks, it has not been possible for people to maintain their normal physical exercise patterns properly with home activities. For Dwyer et al. (2020), as long as social distancing is respected, physical activity personalized according to age, and the necessary clinical conditions and fitness level, are essential during the COVID-19 pandemic, as they provide multiple benefits for physical health. According to these authors, there must be specific recommendations to address home-based training in this pandemic period, to minimize the harmful effects that the confinement measures have on the physical health of the general population.
Although some information already exists, people seem to need more support to effectively use the services offered and to understand the consequences of a sedentary lifestyle (Ammar et al. 2020).
Considering the research objective and the relevant literature on the subject, the following research hypotheses were assumed:
Hypothesis 1 (H1).
Above-ideal weight has a negative impact on the assessment of physical health in general in the pandemic.
Hypothesis 2 (H2).
The practice of daily physical exercise has a positive impact on the assessment of physical health in general in the pandemic.
Hypothesis 3 (H3).
Positive eating behaviors have a positive impact on the assessment of physical health in general in the pandemic.
Hypothesis 4 (H4).
Negative eating behaviors have a negative impact on the assessment of physical health in general in the pandemic.
3. Methodology
The main objective of this research is to analyze the habits observed in the perception of the general physical health condition of Portuguese food consumers in the pandemic, through the assessment of the impact of weight, physical exercise, and the positive/negative eating behaviors in the pandemic on health. To accomplish this, a quantitative methodology was used. This type of methodology allows for the validation of theories and relationships between variables, generalizes results, and replicates with different samples (Chrysochou 2017; Malhotra et al. 2017).
The sample used is composed of 741 valid responses (representative of Portuguese consumers over 18 years, according to the Portuguese population data collected by PRODATA 2019), collected through a questionnaire made available online to Portuguese food consumers between November 2020 and February 2021. The applied questionnaire was adapted from the study “COVID-19 and Retail Management of Groceries: Insights from a Comprehensive Consumer Survey” (Wang et al. 2020b), which analyzed changes in consumer retail supermarket shopping behavior in the pandemic, and was answered by 2500 adults in the USA. This questionnaire was pre-validated (it was applied to 75 respondents, an Alpha Cronbach of 0.92 was obtained, showing a good internal consistency) before its dissemination. The questionnaire consists of 32 questions divided into six groups: (1) Health in general measured by two questions; (2) Weight measured also by two questions; (3) Physical exercise with a question about the time spent (in minutes) the practice of daily physical exercise in the pandemic; (4) positive eating behaviors comprising twelve questions about the consumption of vegetables, fruits, whole grains, leguminous, foods low in saturated fats and rich in monounsaturated and polyunsaturated fats, use of natural sweeteners, water consumption, cooked foods and low-fat dairy products; (5) negative eating behaviors comprising nine questions about the consumption of white sugar and artificial sweeteners, snacks, fast food, sweets, sugary drinks, fried foods, frozen and pre-cooked meals, processed meats and additional consumption of salt and (6) sociodemographic characteristics of the respondents with six questions, namely, gender, age, education level, marital status, employment situation and annual household income in the last year.
All responses to the questions were measured using a 7-point Likert scale, except for the question related to the daily physical exercise, which was measured in minutes, and questions related to sociodemographic characteristics. The group of questions of Health in General, to describe the general health condition in the pandemic a scale was used where 1 is very bad, and 7 is very good. As for the questions regarding the alteration of physical health in the pandemic, the respondents used a scale where 1 = it worsened a lot to 7 = it improved a lot. In the group of questions related to weight, the scaling was: 1 = much below the ideal weight and 7 = much above ideal weight, and 1 = I lost a lot of weight, and 7 = I gained a lot of weight in the pandemic. In the groups of questions related to positive and negative eating behaviors, the scale of 1 = totally disagree to 7 = totally agree was used.
For a general characterization of the sample, a statistical analysis of the sociodemographic variables was performed to describe the characteristics of the sample participants and an analysis of the mean and standard deviation of the answers to each of the questions that comprise the G1 to G5.
The analysis of the sociodemographic characteristics of the sample is summarized in Table 1. It should be noted that 67.2% of the Portuguese consumers surveyed are women; out of which 68.4% are single and 26.6% are married or live in a de facto union. The average age is 29.9 years, with 35.6% of respondents aged less than 20 years (and over 18 years), 30.8% aged between 21 and 30 years; 23.3% between 31 and 50 years old, and 10.3% are over 50 years old (the maximum age being 77 years old). A total of 42.5% have completed secondary level education (12th grade) and 40.8% have completed a degree. Regarding the employment status, 38.5% are dependent employees, 43% are students, and 6.1% are self-employed. In terms of the annual household income registered in the previous year, 38.5% of the respondents have an annual income below EUR 20,000 and 34.3% between EUR 20,000 and EUR 39,999. Table 1 contains the statistics of the sociodemographic characteristics of the Portuguese food consumers surveyed.
SPSS v.25 was also used to calculate the average and standard deviation of the questions that compose G1 to G5, and an analysis of the intra-group questions.
Considering the main objective of this research, five latent variables were created corresponding to the groups of questions from Q1 to Q5: general health, weight, physical exercise, positive eating behavior, and negative eating behavior. The relationships between the latent variables were established taking into account the main objective and the hypotheses to be tested.
Regarding the group of questions of general health (G1), weight (G2), physical exercise (G3), positive eating behavior (G4), and negative eating behavior (G5), the mean and standard deviation of the answers are found described in Table 2.
In average terms, the Portuguese respondents described their physical health as reasonably good (5.39) in the pandemic and that it neither improved nor worsened. In terms of weight, in average terms, respondents consider their current weight, neither very high nor slightly below the ideal weight (4.50) and without significant changes, in average terms (4.39). Additionally, in average terms, the Portuguese respondents practice 25.51 min of physical exercise daily.
Regarding positive eating behaviors, the highest average values were: fruits (4.30), vegetables (4.24), foods rich in monounsaturated and polyunsaturated fats (4.04), water (4.81), of cooked, steamed, grilled, or poached foods (4.26) and leaner meats (4.37). We also concluded that the Portuguese respondents did not significantly improve positive eating behaviors in the pandemic, with the highest average value being (4.81). Regarding negative eating behaviors, the consumption of sugary drinks, such as soft drinks, fruit juices, and sports drinks (2.77), more frozen and/or prepackaged meals (2.85), more processed meats as sausages, bacon, ham (2.93), the addition of more salt to the food (2.31) and higher consumption of fast food (2.59), were, on average, the most disagreeable matters for the respondents. This means, that in the pandemic, on average, Portuguese consumers did not increase their negative eating behaviors.
Once the statistical analysis of the sample was performed, the theoretical model was estimated using Partial Least Squares (PLS) in the Smart PLS 3.0 software (SmartPLS GmbH, Bönningstedt, Germany), the results of which are shown in the next section.
4. Results
4.1. Results Presentation
A descriptive model was created to explain the above measures (Figure 1). This model was estimated by Partial Least Squares (PLS) in the Smart PLS 3.0 software (Ringle et al. 2015). PLS is a covariance-based structural model used to estimate complex interrelationships between latent and observed variables and, in recent years, has been increasingly applied in empirical studies (Ringle et al. 2019, 2020). The use of PLS has the main advantages of allowing to estimate complex models with several latent variables, indicators, and structural paths without imposing the assumption of data distribution; allow testing the complexity of theoretical relationships defined by the supporting literature and, finally, increases the probability of identifying significant relationships between variables when in fact these relationships exist in the sample (Ketchen 2013; Leguina 2015; Ringle et al. 2019).
To use the PLS model, it is necessary to validate the sample size, which must be at least equal to one of the following conditions: (1) ten times greater than the number of indicators or (2) ten times greater than the number of directed structural paths to a latent variable in the structural model (Ketchen 2013; Leguina 2015). As can be concluded, the size of our sample is 741 observations, which is more than ten times the number of indicators (26 indicators) and, thus, the sample size fulfills the conditions to be applied to the PLS method.
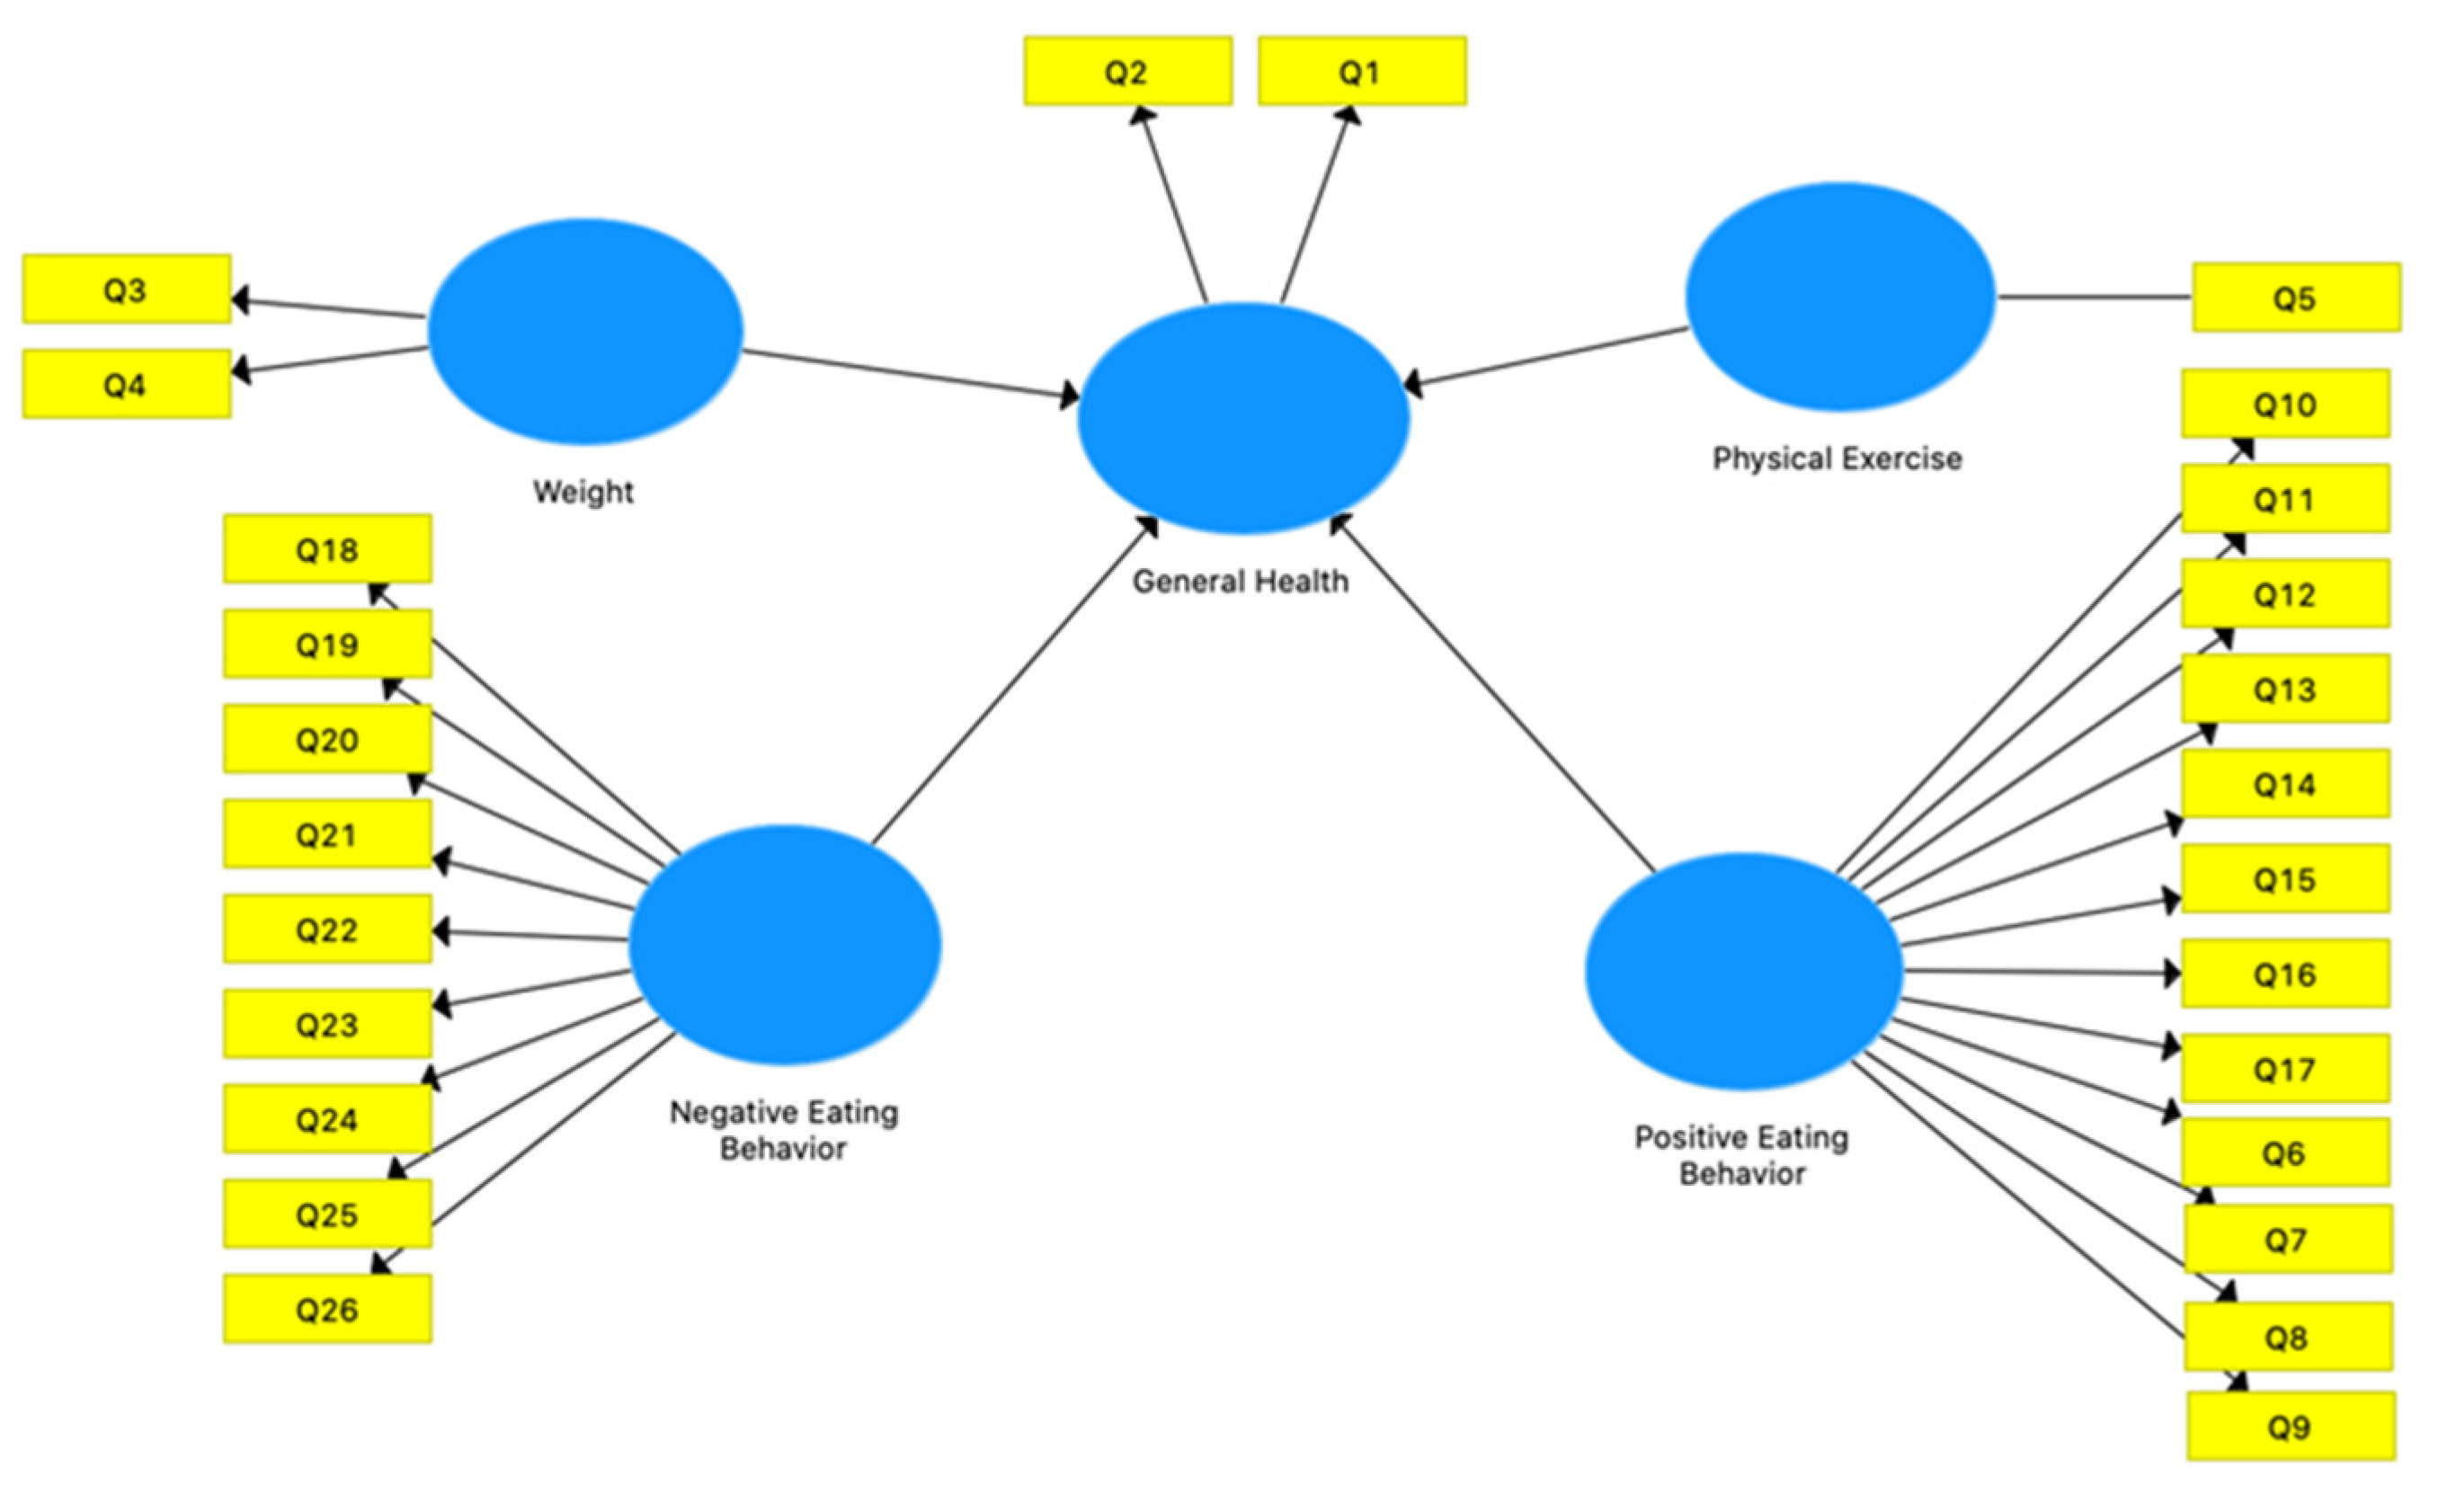
According to Figure 1, the Theoretical Path Model contains 26 indicators (represented in the rectangles), that is, the answers to the 26 questions in Table 2 and the five latent variables created—General Health; Negative Eating Behavior; Physical Exercise; Positive Eating Behavior and Weight (represented in circles). The relationship between the latent variables according to the hypotheses to be tested are: the latent variables Negative Eating Behavior; Physical Exercise; Positive Eating Behavior and Weight have a direct influence on the General Health latent variable.
Reliability and validity measures must be used to validate the estimated model, that is, instruments to mediate the relationship between the latent and observed variables of the model, which implies an analysis of the reliability of each latent variable at the indicator level and the convergent validity and discriminant. The validation in the model of this study is described in Table 3, which contains the outer loadings of each indicator (question) used, reliability, and average variance extracted (AVE) of the latent variables.
Latent variables (General Health; Negative Eating Behavior; Physical Exercise; Positive Eating Behavior and Weight) have high external loadings (greater than 0.647). The reliability coefficients of latent variables must be greater than 0.70 (Ringle et al. 2019). In this model, the values obtained for reliability coefficients of latent variables are higher than the reference value (General Health > 0.810; Negative Eating Behavior > 0.933; Physical Exercise > 1000; Positive Eating Behavior > 0.936; Weight > 0.841) and thus, reliability coefficients are “satisfactory to good”. Therefore, all latent variables are above the acceptable values for the outer loadings, reliability, and validity of the estimated model.
The model has acceptable validity and convergence measured by Cronbach’s Alpha (all the results of this indicator are greater than 0.700—reference value, except for Cronbach’s Alpha of the latent variable Weight, which is 0.695, which is only 0.005 below) and Average Variance Extracted—AVE (0.50 is the reference value for the AVE). We conclude that, all latent variables have a stroke above the reference value, that is, General Health > 0.682; Negative Eating Behavior > 0.608; Physical Exercise > 1000; Positive Eating Behavior > 0.552; Weight > 0.730).
The Fornell–Larcker criterion was also used, as a measure of Discriminant Validity. This criterion analyzes the cross-loadings that are indicators of the discriminant validity of latent variables. As we can see in Table 4, each AVE of the latent variables is superior to all the square correlations of the latent variables (elements outside the diagonal), thus establishing the discriminant validity of each of the five latent variables.
In summary, we conclude that the model shown in Figure 1 complies with the measures of reliability and validity, and discriminant validity, and, therefore, it is a valid model.
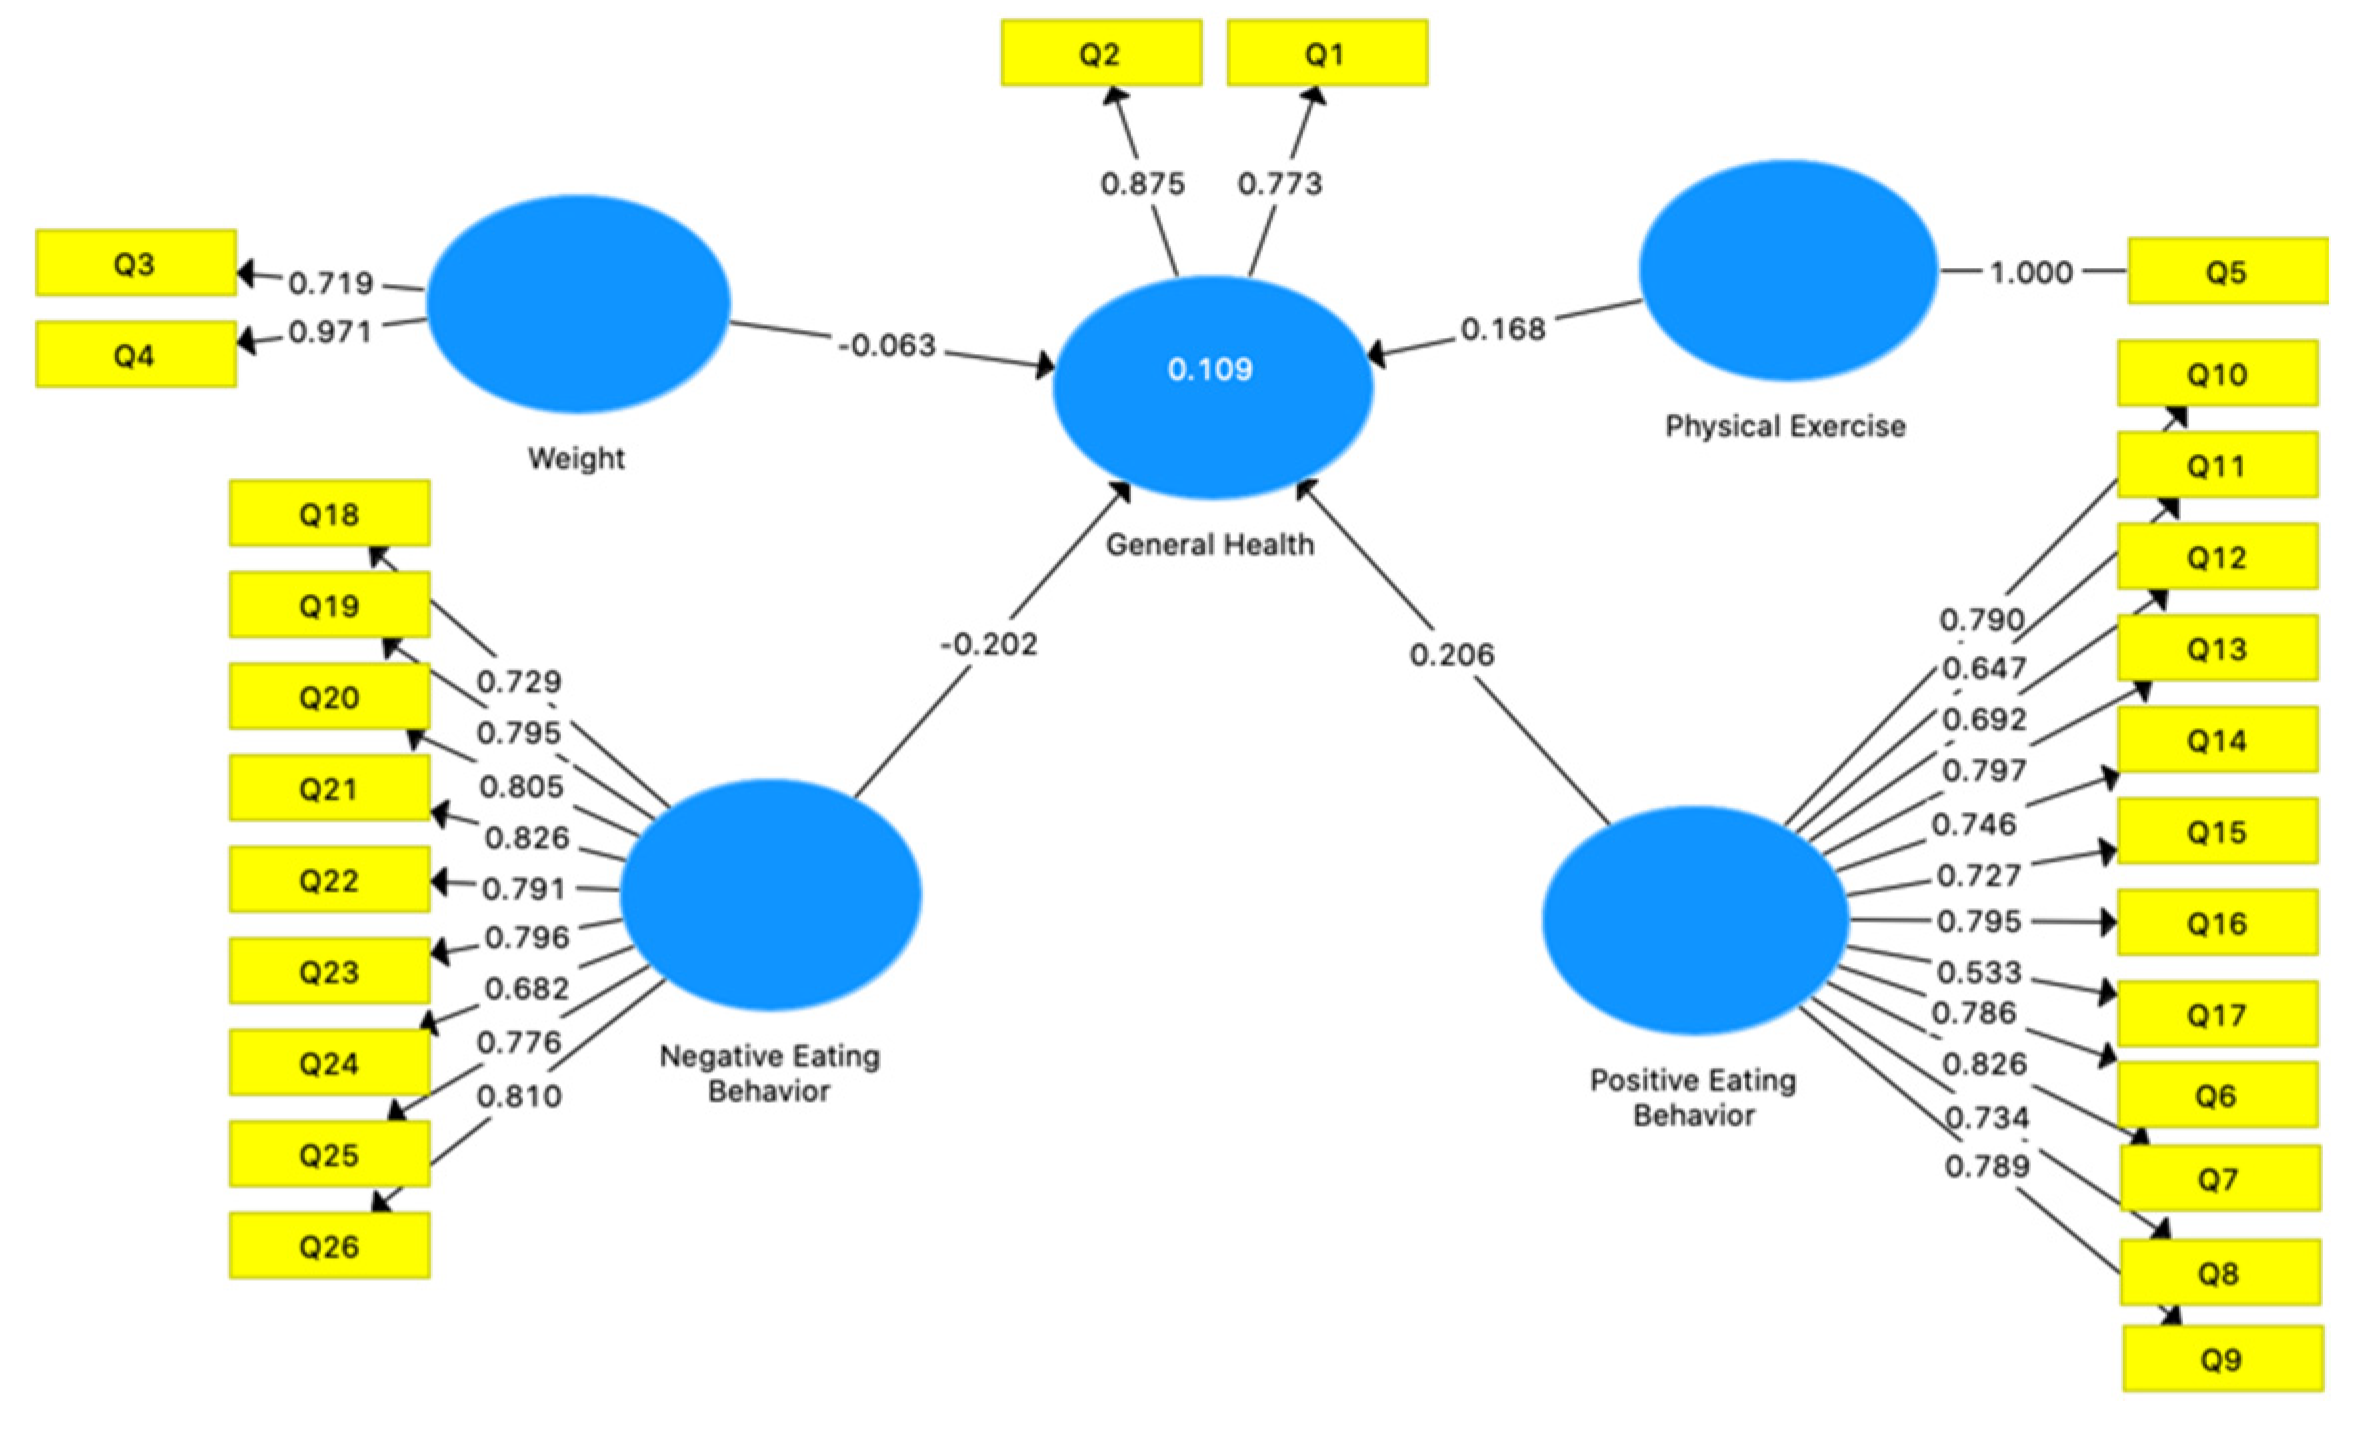
After validating the model, the next step is to estimate the model by PLS. To do this, it is necessary to check if the stopping criteria of the PLS algorithm is reached before the maximum number of iterations (repetition programming), which must be lower than that defined in the settings for the parameter of the PLS–SEM algorithm (in this case 300 iterations). The estimated model is shown in Figure 2 and the algorithm converged after the 7th iteration for the parameter of the PLS–SEM algorithm (out of 300 iterations).
The validation of the predictive precision of the model is performed through the values of R Square (R2) of the endogenous (dependent) latent variable, that is, General Health. According to Ritchey (2000), in social sciences (as is the case in this study), the reference values for R2 from 0.04 to 0.16 are considered moderately weak and from 0.20 to 0.49 are considered moderately strong. According to this criterion, the PLS algorithm calculated R2 moderately weak (0.109).
Path coefficients establish significant relationships between latent variables. As shown in Figure 2, a 10% variation in the Weight variable has a negative impact of 6.3% on General Health; a 10% variation in the Physical Exercise variable has a 16.8% positive impact on General Health; a 10% variation in the Positive Eating Behavior variable has a 20.6% positive impact on General Health and a 10% variation on the Negative Eating Behavior variable has a 20.2% negative impact on General Health.
Once the path coefficients were calculated, a bootstrap analysis was performed to assess their statistical significance (95% confidence interval). Table 5 shows the results of this significance test. We conclude that the latent variables negative eating behavior, physical exercise, and positive eating behavior are very significant (p < 0.000), and the latent variable Weight is not significant to explain the general health of the Portuguese surveyed.
4.2. Results Discussion
We started the present research with a first assumption that fits H1, that the weight above the ideal has a negative impact on the assessment of the general physical health of the respondents in the COVID-19 pandemic. It was possible to ascertain that, although the relationship between the latent variables is negative as formulated in hypothesis 1, this relationship is not significant, so the first hypothesis is rejected. It should be noted that, according to Table 2, the Portuguese respondents reported that, on average, they did not see significant habit variation in terms of weight in the pandemic and consider that the current weight is neither above nor below the ideal weight, which may justify the fact that, in general, weight does not have a significant impact on the assessment of physical health of the Portuguese respondents.
These data indicate that, although the respondents consider that the strategies pointed out in several studies (Abbas and Kamel 2020; Arora and Grey 2020; Muscogiuri et al. 2020), as ways of overcoming contexts of stress, anxiety, or other problems associated with isolation, such as snacking behaviors, comfort eating and drinking, have brought with it a consequent increase in weight, this reality does not influence the perception of worse general physical health.
The second hypothesis under study focuses on the influence of daily physical exercise for a positive impact on the assessment of physical health in general, in the COVID-19 pandemic, this hypothesis is confirmed in the present research. In this regard, several studies point out that the increase in leisure-time physical activity is associated with better physical health, that the increase in sedentary time is associated with less physical health, and that physical activity decreased in the COVID-19 pandemic. The present research allows us to perceive that there is a positive relationship between the respondents, who associate better physical health in general with the practice of physical exercise. Thus, these considerations are in line with the findings of Cheval et al. (2021), Chen et al. (2020), Dwyer et al. (2020), Matias et al. (2020) and Raiol (2020), which demonstrate that physically active behaviors and a reduction in physical inactivity in the confinement caused by COVID-19 improve the perception of physical health. It should be noted that, on average, the Portuguese respondents practice 25.51 min of physical exercise daily, demonstrating their concern for their physical health in general.
The third hypothesis of the research focuses on determining a relationship between positive eating behaviors and the positive impacts that result from this in the perception of physical health in general, in the COVID-19 pandemic, by the respondents. This positive eating behavior such as consumption of vegetables, fruits, whole grains, legumes, foods low in saturated fats and rich in monounsaturated and polyunsaturated fats, use of natural sweeteners, water consumption, cooked foods, and low-fat dairy products have a positive impact on respondents’ assessment of physical health in general in the pandemic. Respondents who adopt these food consumption behaviors tend to demonstrate a more positive perception of their physical health.
These findings are in line with the contributions of Arora and Grey (2020), Amekran and El Hangouche (2021) and Chen et al. (2020), since a significant part of eating behaviors in a period of greater isolation may correspond to the incorporation of healthy habits described above. By identifying this relationship which reveals that respondents positively associate these eating behaviors with the perception of better physical health, we can confirm H3.
The fourth hypothesis under study focuses on determining a relationship between the adoption of negative eating behaviors and a more negative assessment of physical health in general, in the COVID-19 pandemic, amongst the respondents. These negative eating behaviors are measured by the consumption of white sugar and artificial sweeteners, snacks, fast food, sweets, sugary drinks, fried foods, frozen and pre-cooked meals, processed meats, and additional consumption of salt.
The results show that respondents who adopt these food consumption behaviors tend to show a more negative perception of their physical health. These findings are in line with the contributions of Ammar et al. (2020), Durães et al. (2021) and Ribeiro-Silva et al. (2020), so we can say that H4 is confirmed in the present study.
A summary of the hypotheses under study is aggregated in Table 6, which describes which of the hypotheses are supported or not.
Although the analysis of the results obtained corroborates much of the relevant literature, the present study focuses only on physical health. Nonetheless, the importance of the balance between physical and mental health is important in times of normality. Given the current context, it would be important to determine the perception that these individuals have concerning this other component of their health. We consider this a gap to be addressed in future studies.
It is also recommended to carry out longitudinal studies, which allow us to perceive the evolution overtime on the perception of the physical health condition. Such should be done through the application of other indicators and widening the scope for physical health. It is also suggested to carry out comparative studies, to allow comparing perceptions of individuals from different cultural, geographic, and demographic backgrounds, under the effect of the same extreme global phenomenon as the pandemic COVID-19, with identical social and economic consequences.
5. Conclusions
The analysis of the results allows us to conclude that in general, an eventual increase in weight does not necessarily correspond to a perception of worse physical health. The practice of physical exercise and good eating habits corresponds to a perception of better physical health and the adoption of poor eating habits corresponds to the perception of worse physical health.
These conclusions make it possible to contribute and strengthen the theoretical framework on which good practices of food consumption and the practice of physical activity are to be implemented, namely in social and economic contexts such as the one we are experiencing in the COVID-19 pandemic. In a more practical sense, this research contributes to raise awareness, whether on individuals, entities, or organizations that, by its action, can influence public opinion, regarding the importance to create a correct perception of the individual health condition, this will be a determining aspect to create consciousness of the problem and the adoption of healthy behaviors. Public and social sector companies and organizations will be able to act fundamentally on the development of new products, services or guiding their policies, also according to these contributions.
Author Contributions
Conceptualization, J.M.L. and S.G.; methodology, S.G. and J.O.; software, S.G.; validation, T.S., M.S. and M.O.; formal analysis, T.S. and S.G.; investigation, J.M.L., T.S., M.S. and M.O.; resources, J.O.; data curation, S.G.; writing—original draft preparation, J.M.L., T.S., M.S. M.O. and J.O.; writing—review and editing, T.S., M.S., M.O. and J.O.; visualization, S.G. and J.M.L.; supervision, J.M.L.; project administration, J.M.L.; funding acquisition, J.M.L. and M.O. All authors have read and agreed to the published version of the manuscript.
Funding
This work is supported by national funds, through the FCT—Portuguese Foundation for Science and Technology under the project UIDB/04630/2020.
Institutional Review Board Statement
Not applicable.
Informed Consent Statement
Informed consent was obtained from all subjects involved in the study.
Acknowledgments
The authors would like to thank the University of Minho, Polytechnic Institute of Leiria, CICS.NOVA—Centro Interdisciplinar de Ciências Sociais da Faculdade de Ciências Sociais e Humanas (FCSH/NOVA), Miguel Torga Institute of Higher Education, University of Beira Interior, NECE—Research Unit in Business Sciences, University Portucalense and REMIT—Research on Economics, Management and Information Technologies, for their support.
Conflicts of Interest
The authors declare no conflict of interest.
References
- Abbas, Ahmed, and Mark Kamel. 2020. Dietary habits in adults during quarantine in the context of COVID-19 pandemic. Obesity Medicine 19: 100254. [Google Scholar] [CrossRef]
- Amekran, Youssra, and Abdelkader J. El Hangouche. 2021. Coronavirus disease (COVID-19) and the need to maintain regular physical activity. Journal of Sports Medicine and Physical Fitness 61: 159–60. [Google Scholar]
- Ammar, Achraf, Michael Brach, Khaled Trabelsi, Hamdi Chtourou, Omar Boukhris, Liwa Masmoudi, Bassem Bouaziz, Ellen Bentlage, Daniella How, Mona Ahmed, and et al. 2020. Effects of COVID-19 Home Confinement on Eating Behaviour and Physical Activity: Results of the ECLB-COVID19 International Online Survey. Nutrients 12: 1583. [Google Scholar] [CrossRef]
- Anderson, Elizabeth H., and Geetha Shivakumar. 2013. Effects of exercise and physical activity on anxiety. Front Psychiatry 4: 27. [Google Scholar] [CrossRef] [PubMed] [Green Version]
- Antunes, Raul, Roberta Frontini, Nuno Amaro, Rogério Salvador, Rui Matos, Pedro Morouço, and Ricardo Rebelo-Gonçalves. 2020. Exploring Lifestyle Habits, Physical Activity, Anxiety and Basic Psychological Needs in a Sample of Portuguese Adults during COVID-19. International Journal of Environmental Research and Public Health 17: 4360. [Google Scholar] [CrossRef] [PubMed]
- Arora, Teresa, and Ian Grey. 2020. Health behaviour changes during COVID-19 and the potential consequences: A mini-review. Journal of Health Psychology 25: 1155–63. [Google Scholar] [CrossRef] [PubMed]
- Bruce, Bonnie, and W. Stewart Agras. 1992. Binge eating in females: A population-based investigation. International Journal of Eating Disorders 12: 365–73. [Google Scholar] [CrossRef]
- Chen, Peijie, Lijuan Mao, George P. Nassis, Peter Harmer, Barbara E. Ainsworth, and Fuzhong Lif. 2020. Coronavirus disease (COVID-19): The need to maintain regular physical activity while taking precautions. Journal of Sport and Health Science 9: 103–4. [Google Scholar] [CrossRef]
- Cheval, Boris, Hamsini Sivaramakrishnan, Silvio Maltagliati, Layan Fessler, Cyril Forestier, Philippe Sarrazin, and Dan Orsholits. 2021. Relationships between changes in self-reported physical activity, sedentary behaviour and health during the coronavirus (COVID-19) pandemic in France and Switzerland. Journal of Sports Sciences 39: 699–704. [Google Scholar] [CrossRef] [PubMed]
- Chrysochou, Polymeros. 2017. Consumer Behavior Research Methods. In Consumer Perception of Product Risks and Benefits. Edited by Gerard Emilien, Rolf Weitkunat and Frank Lüdicke. Cham: Springer, pp. 409–28. [Google Scholar]
- Durães, S. A., T. S. Souza, Y. A. R. Gome, and L. D. Pinho. 2021. Implications of the covid-19 pandemic in food habits. Revista Unimontes Científica 22: 1–20. [Google Scholar] [CrossRef]
- Dwyer, Michael John, Margherita Pasini, Stefano De Dominicis, and Elda Righi. 2020. Physical activity: Benefits and challenges during the COVID-19 pandemic. Scandinavian Journal of Medicine and Science in Sports 30: 1291–94. [Google Scholar] [CrossRef] [PubMed]
- Goh, Y. Ingrid, Danielle R. Bullock, Janalee Taylor, Rajdeep Pooni, Tzielan C. Lee, Sheetal S. Vora, and Cagri Yildirim-Toruner. 2021. Exploring Pediatric Tele-Rheumatology Practices during COVID-19: A Survey of the PRCOIN Network. Frontiers in Pediatrics 9: 39. [Google Scholar] [CrossRef]
- Hammami, Amri, Basma Harrabi, Magni Mohr, and Peter Krustrup. 2020. Physical activity and coronavirus disease 2019 (COVID-19): Specific recommendations for home-based physical training. Managing Sport and Leisure, 1–6. [Google Scholar] [CrossRef]
- Herrera-Peco, Iván, Beatriz Jiménez-Gómez, Juan José Peña-Deudero, and Elvira Benítez De Gracia. 2021. Comments on nutritional recommendations for CoVID-19 quarantine. European Journal of Clinical Nutrition, 1–2. [Google Scholar]
- Ketchen, David J. 2013. A Primer on Partial Least Squares Structural Equation Modeling. Long Range Planning 46: 184–85. [Google Scholar] [CrossRef]
- Kickbusch, Ilona, Gabriel M. Leung, Zulfiqar A. Bhutta, Malebona Precious Matsoso, Chikwe Ihekweazu, and Kamran Abbasi. 2020. Covid-19: How a virus is turning the world upside down. The BMJ, 369. [Google Scholar] [CrossRef]
- Kuijer, Roeline G., and Jessica A. Boyce. 2012. Emotional eating and its effect on eating behaviour after a natural disaster. Appetite 58: 936–39. [Google Scholar] [CrossRef] [PubMed]
- Leguina, Adrian. 2015. A primer on partial least squares structural equation modeling (PLS-SEM). International Journal of Research & Method in Education 38: 220–21. [Google Scholar]
- Li, Sijia, Yilin Wang, Jia Xue, Nan Zhao, and Tingshao Zhu. 2020. The impact of covid-19 epidemic declaration on psychological consequences: A study on active weibo users. International Journal of Environmental Research and Public Health 17: 2032. [Google Scholar] [CrossRef] [PubMed] [Green Version]
- Madhav, Nita, Ben Oppenheim, Mark Gallivan, Prime Mulembakani, Edward Rubin, and Nathan Wolfe. 2017. Pandemics: Risks, Impacts, and Mitigation. In Disease Control Priorities: Improving Health and Reducing Poverty. Edited by Dean T. Jamison, Hellen Gelband, Susan Horton, Prabhat Jha and Ramanan Nugent. Washington, DC: World Bank Group, pp. 315–45. [Google Scholar]
- Malhotra, Naresh K., Daniel Nunan, and David F. Birks. 2017. Marketing Research: An Applied Approach. London: Pearson Education Limited. [Google Scholar]
- Mammen, George, and Guy Faulkner. 2013. Physical activity and the prevention of depression: A systematic review of prospective studies. American Journal of Preventive Medicine 45: 649–57. [Google Scholar] [CrossRef]
- Matias, Thiago, Fabio H. Dominski, and David F. Marks. 2020. Human needs in COVID-19 isolation. Journal of Health Psychology 25: 871–82. [Google Scholar] [CrossRef] [PubMed]
- Muscogiuri, Giovanna, Luigi Barrea, Silvia Savastano, and Annamaria Colao. 2020. Nutritional recommendations for CoVID-19 quarantine. European Journal of Clinical Nutrition 74: 850–51. [Google Scholar] [CrossRef]
- Parletta, Natalie, Yousef Aljeesh, and Bernhard T. Baune. 2016. Health behaviors, knowledge, life satisfaction, and wellbeing in people with mental illness across four countries and comparisons with normative sample. Frontiers in Psychiatry 7: 145. [Google Scholar] [CrossRef] [Green Version]
- Phillipou, Andrea, Denny Meyer, Erica Neill, Eric J. Tan, Wei Lin Toh, Tamsyn E. Van Rheenen, and Susan L. Rossell. 2020. Eating and exercise behaviors in eating disorders and the general population during the COVID-19 pandemic in Australia: Initial results from the COLLATE project. International Journal of Eating Disorders 53: 1158–65. [Google Scholar] [CrossRef]
- Raiol, Rodolfo A. 2020. Physical exercise is essential for physical and mental health during the COVID-19 Pandemic. Brazilian Journal of Health Review 3: 2804–13. [Google Scholar] [CrossRef]
- Ribeiro-Silva, Rita de Cássia, Marcos Pereira, Tereza Campello, Erica Aragao, Jane Mary de Medeiros Guimarães, Andrea J. F. Ferreira, Mauricio Lima Barreto, and Sandra Maria Chaves dos Santos. 2020. Covid-19 pandemic implications for food and nutrition security in Brazil. Ciência & Saúde Coletiva 25: 3421–30. [Google Scholar]
- Ringle, Christian M., Sven Wende, and Jan-Michael Becker. 2015. SmartPLS 3. SmartPLS GmbH, Boenningstedt. Journal of Service Science and Management 10: 3. [Google Scholar]
- Ringle, Christian M., Joseph F. Hair, Jeffrey J. Risher, and Marko Sarstedt. 2019. When to use and how to report the results of PLS-SEM. European Business Review 31: 2–24. [Google Scholar]
- Ringle, Christian M., Marko Sarstedt, Rebecca Mitchell, and Siegfried P. Gudergan. 2020. Partial least squares structural equation modeling in HRM research. International Journal of Human Resource Management 31: 1617–43. [Google Scholar] [CrossRef]
- Ritchey, Ferris Joseph. 2000. The Statistical Imagination: Elementary Statistics for the Social Sciences. Boston: McGraw-Hill. [Google Scholar]
- Ruiz, Montse C., Tracey J. Devonport, Chao-Hwa Josephine Chen-Wilson, Wendy Nicholls, Jonathan Y. Cagas, Javier Fernandez-Montalvo, Youngjun Choi, and Claudio Robazza. 2021. A Cross-Cultural Exploratory Study of Health Behaviors and Wellbeing during COVID-19. Frontiers in Psychology 11: 608216. [Google Scholar] [CrossRef]
- Stubbs, Brendon, Davy Vancampfort, Simon Rosenbaum, Joseph Firth, Theodore Cosco, Nicola Veronese, Giovanni A. Salum, and Felipe B. Schuch. 2017. An examination of the anxiolytic effects of exercise for people with anxiety and stress-related disorders: A meta-analysis. Psychiatry Research 249: 102–8. [Google Scholar] [CrossRef] [PubMed]
- Wang, Cuiyan, Riyu Pan, Xiaoyang Wan, Yilin Tan, Linkang Xu, Cyrus S. Ho, and Roger C. Ho. 2020a. Immediate psychological responses and associated factors during the initial stage of the 2019 coronavirus disease (COVID-19) epidemic among the general population in China. International Journal of Environmental Research and Public Health 17: 1729. [Google Scholar] [CrossRef] [PubMed] [Green Version]
- Wang, Yiru, Ran Xu, Marlene Schwartz, Debarchana Ghosh, and Xiang Chen. 2020b. COVID-19 and Retail Grocery Management: Insights from a Broad-Based Consumer Survey. IEEE Engineering Management Review 48: 202–11. [Google Scholar] [CrossRef]
- World Health Organization. 2020. Mental Health and Psychosocial Considerations during the COVID-19 Outbreak. Geneva: World Health Organization, March 18. [Google Scholar]
Figure 1.
Theoretical Path Model.

Figure 2.
PLS–SEM Path Model.


Table 1.
Statistics of sociodemographic variables.
| Variable | Frequency | Valid Percent |
|---|---|---|
| Gender | ||
| Male | 243 | 32.8 |
| Female | 498 | 67.2 |
| Age | ||
| Less than 20 years | 263 | 35.6 |
| 21–30 years | 227 | 30.8 |
| 31–40 years | 77 | 10.4 |
| 41–50 years | 95 | 12.9 |
| More than 51 years | 76 | 10.3 |
| Education | ||
| Doctorate | 8 | 1.1 |
| Basic level (9th year) | 35 | 4.7 |
| Secondary level (12th year) | 315 | 42.5 |
| Primary level (until the 4th year) | 4 | 0.5 |
| Undergraduate | 302 | 40.8 |
| Master | 77 | 10.4 |
| Civil Status | ||
| Married/De Facto union | 197 | 26.6 |
| Divorced | 30 | 4.0 |
| Single | 507 | 68.4 |
| Widow | 7 | 0.9 |
| Professional status | ||
| Employee | 285 | 38.5 |
| Self-employed | 45 | 6.1 |
| Student | 319 | 43.0 |
| Unemployed, looking for a job | 31 | 4.2 |
| Other | 61 | 8.2 |
| Annual household income | ||
| Less than EUR 20,000 | 288 | 38.9 |
| EUR 20,000–39,999 | 254 | 34.3 |
| EUR 40,000–59,999 | 73 | 9.9 |
| EUR 60,000–79,999 | 36 | 4.9 |
| EUR 80,000–99,999 | 24 | 3.2 |
| EUR 100,000–149,999 | 18 | 2.4 |
| EUR 150,000–200,000 | 21 | 2.8 |
| More than EUR 200,000 | 27 | 3.6 |
Table 2.
Mean and standard deviation of responses to questions from groups G1 to G5.
| Questions | Mean | Std. Deviation |
|---|---|---|
| G1—Health in general | ||
| Q1—How do you describe your overall physical health? | 5.39 | 1.118 |
| Q2—During COVID-19, did your physical health change? | 4.25 | 1.304 |
| G2—Weight | ||
| Q3—How do you consider your current weight? | 4.50 | 1.062 |
| Q4—During COVID-19, did your weight change? | 4.39 | 1.186 |
| G3—Physical exercise | ||
| Q5—During COVID-19, on average, how much time did you spend every day exercising? (Type your answer in minutes) | 25.51 | 31.172 |
| G4—Positive eating behavior | ||
| Q6—Eat more fruits | 4.30 | 1.805 |
| Q7—Eat more vegetables | 4.24 | 1.794 |
| Q8—Eat more whole grains (i.e., brown rice, buckwheat, quinoa, oats) | 3.53 | 1.865 |
| Q9—Eat more foods low in saturated fats and cholesterol | 3.87 | 1.736 |
| Q10—Eat more foods that are rich in monounsaturated and polyunsaturated fats (i.e., fish, olive oil, avocado, nuts, and seeds) | 4.04 | 1.698 |
| Q11—Use more natural sweeteners (i.e., raw honey, coconut sugar, dates) | 3.12 | 1.889 |
| Q12—Drink more water | 4.81 | 1.841 |
| Q13—Eat more cooked, steamed, grilled, or poached foods | 4.26 | 1.776 |
| Q14—Eat more lean meats such as poultry, fish, and eggs | 4.37 | 1.883 |
| Q15—Consume more low-fat dairy products (i.e., low-fat milk, yogurt, sour cream, cheese) | 3.77 | 1.849 |
| Q16—Consume more leguminous (i.e., beans, lentils, peas, peanuts) | 3.91 | 1.833 |
| G5—Negative eating behavior | ||
| Q17—Eat more refined grains (i.e., white rice, white bread, white flour) | 3.80 | 1.805 |
| Q18—Consume more white sugar or other artificial sweeteners | 3.05 | 1.802 |
| Q19—Eat more “snacks”, like fries, chocolate and/or sweets | 3.49 | 1.878 |
| Q20—Drink sugary drinks like sodas, fruit juices, and sports drinks | 2.77 | 1.774 |
| Q21—Eat more fried foods (i.e., French fries, fried chicken) | 3.00 | 1.720 |
| Q22—Eat more frozen and/or prepackaged meals | 2.85 | 1.801 |
| Q23—Eat more processed meats like sausages, bacon, ham | 2.93 | 1.772 |
| Q24—Add more salt to the food | 2.31 | 1.577 |
| Q25—Eat more fast food | 2.59 | 1.741 |
| Q26—Eat more sweets and/or products like croissants, pie, cake | 3.02 | 1.809 |
Table 3.
Results of the model’s reliability and validity measurements.
| Question | General Health | Negative Eating Behavior | Physical Exercise | Positive Eating Behavior | Weight |
|---|---|---|---|---|---|
| Q10 | 0.790 | ||||
| Q11 | 0.647 | ||||
| Q12 | 0.692 | ||||
| Q13 | 0.797 | ||||
| Q14 | 0.746 | ||||
| Q15 | 0.727 | ||||
| Q16 | 0.795 | ||||
| Q17 | 0.533 | ||||
| Q18 | 0.729 | ||||
| Q19 | 0.795 | ||||
| Q2 | 0.875 | ||||
| Q20 | 0.805 | ||||
| Q21 | 0.826 | ||||
| Q22 | 0.791 | ||||
| Q23 | 0.796 | ||||
| Q24 | 0.682 | ||||
| Q25 | 0.776 | ||||
| Q26 | 0.810 | ||||
| Q3 | 0.719 | ||||
| Q4 | 0.971 | ||||
| Q5 | 1.000 | ||||
| Q6 | 0.786 | ||||
| Q7 | 0.826 | ||||
| Q8 | 0.734 | ||||
| Q9 | 0.789 | ||||
| Q1 | 0.773 | ||||
| Cronbach’s Alpha | 0.739 | 0.922 | 1.000 | 0.926 | 0.695 |
| Composite Reliability | 0.810 | 0.933 | 1.000 | 0.936 | 0.841 |
| Average Variance Extracted (AVE) | 0.682 | 0.608 | 1.000 | 0.552 | 0.730 |
Table 4.
Results of the application of the Fornell–Larcker criterion.
| General Health | Negative Eating Behavior | Physical Exercise | Positive Eating Behavior | Weight | |
|---|---|---|---|---|---|
| General Health | 0.826 | ||||
| Negative Eating Behavior | −0.158 | 0.780 | |||
| Physical Exercise | 0.206 | 0.007 | 1.000 | ||
| Positive Eating Behavior | 0.173 | 0.253 | 0.141 | 0.743 | |
| Weight | −0.104 | 0.154 | −0.159 | 0.082 | 0.855 |
Table 5.
Significance Testing Results of the Structural Model Path Coefficients.
| Original Sample (O) | Sample Mean (M) | Standard Deviation (STDEV) | T Statistics (O/STDEV) | p-Values | |
|---|---|---|---|---|---|
| Negative Eating Behavior–General Health | −0.202 | −0.209 | 0.037 | 5.397 | 0.000 |
| Physical Exercise–General Health | 0.168 | 0.166 | 0.036 | 4.629 | 0.000 |
| Positive Eating Behavior–General Health | 0.206 | 0.214 | 0.036 | 5.766 | 0.000 |
| Weight–General Health | −0.063 | −0.068 | 0.057 | 1.103 | 0.271 |
Table 6.
Summary of hypotheses.
| Hypothesis | Supported or Not Supported |
|---|---|
| H1. Above-ideal weight has a negative impact on the assessment of physical health in general in the pandemic. | Not Supported |
| H2. The practice of daily physical exercise has a positive impact on the assessment of physical health in general in the pandemic. | Supported |
| H3. Positive eating behaviors have a positive impact on the assessment of physical health in general in the pandemic. | Supported |
| H4. Negative eating behaviors have a negative impact on the assessment of physical health in general in the pandemic. | Supported |
Publisher’s Note: MDPI stays neutral with regard to jurisdictional claims in published maps and institutional affiliations. |
© 2021 by the authors. Licensee MDPI, Basel, Switzerland. This article is an open access article distributed under the terms and conditions of the Creative Commons Attribution (CC BY) license (https://creativecommons.org/licenses/by/4.0/).
Share and Cite
MDPI and ACS Style
Oliveira, J.; Santos, T.; Sousa, M.; Lopes, J.M.; Gomes, S.; Oliveira, M. Physical Health of Food Consumers during the COVID-19 Pandemic. Soc. Sci. 2021, 10, 218. https://doi.org/10.3390/socsci10060218
AMA Style
Oliveira J, Santos T, Sousa M, Lopes JM, Gomes S, Oliveira M. Physical Health of Food Consumers during the COVID-19 Pandemic. Social Sciences. 2021; 10(6):218. https://doi.org/10.3390/socsci10060218
Chicago/Turabian StyleOliveira, José, Tânia Santos, Marlene Sousa, João M. Lopes, Sofia Gomes, and Márcio Oliveira. 2021. "Physical Health of Food Consumers during the COVID-19 Pandemic" Social Sciences 10, no. 6: 218. https://doi.org/10.3390/socsci10060218
Note that from the first issue of 2016, this journal uses article numbers instead of page numbers. See further details here.