Explainable Artificial Intelligence for Developing Smart Cities Solutions
by
 and
and
Dhavalkumar Thakker
1,*, 
Bhupesh Kumar Mishra
1,
Amr Abdullatif
1,
Suvodeep Mazumdar
2 and
Sydney Simpson
3 1
Department of Computer Science, University of Bradford, Bradford BD7 1DP, UK
2
Information School, University of Sheffield, Sheffield S10 2TN, UK
3
City of Bradford Metropolitan District Council, Bradford BD1 1HX, UK
*
Author to whom correspondence should be addressed.
Smart Cities 2020, 3(4), 1353-1382; https://doi.org/10.3390/smartcities3040065
Submission received: 29 September 2020
/
Revised: 25 October 2020
/
Accepted: 29 October 2020
/
Published: 13 November 2020
(This article belongs to the Special Issue Feature Papers for Smart Cities)
Abstract
:Traditional Artificial Intelligence (AI) technologies used in developing smart cities solutions, Machine Learning (ML) and recently Deep Learning (DL), rely more on utilising best representative training datasets and features engineering and less on the available domain expertise. We argue that such an approach to solution development makes the outcome of solutions less explainable, i.e., it is often not possible to explain the results of the model. There is a growing concern among policymakers in cities with this lack of explainability of AI solutions, and this is considered a major hindrance in the wider acceptability and trust in such AI-based solutions. In this work, we survey the concept of ‘explainable deep learning’ as a subset of the ‘explainable AI’ problem and propose a new solution using Semantic Web technologies, demonstrated with a smart cities flood monitoring application in the context of a European Commission-funded project. Monitoring of gullies and drainage in crucial geographical areas susceptible to flooding issues is an important aspect of any flood monitoring solution. Typical solutions for this problem involve the use of cameras to capture images showing the affected areas in real-time with different objects such as leaves, plastic bottles etc., and building a DL-based classifier to detect such objects and classify blockages based on the presence and coverage of these objects in the images. In this work, we uniquely propose an Explainable AI solution using DL and Semantic Web technologies to build a hybrid classifier. In this hybrid classifier, the DL component detects object presence and coverage level and semantic rules designed with close consultation with experts carry out the classification. By using the expert knowledge in the flooding context, our hybrid classifier provides the flexibility on categorising the image using objects and their coverage relationships. The experimental results demonstrated with a real-world use case showed that this hybrid approach of image classification has on average 11% improvement (F-Measure) in image classification performance compared to DL-only classifier. It also has the distinct advantage of integrating experts’ knowledge on defining the decision-making rules to represent the complex circumstances and using such knowledge to explain the results.

1. Introduction
In 2017 there were more than 250 smart cities projects in 178 cities worldwide. The prevalence of building smart cities across the globe is largely driven by the use of Internet of Things (IoT) and Big data technologies, with smartness attributed to the use of Artificial Intelligence (AI) techniques and tools [1]. In particular, Machine Learning (ML), and more recently Deep Learning (DL) techniques are utilised in solving various smart cities problems. A recent survey paper found that predictive analytics was the most common technique and smart mobility and smart environment were the most common areas addressed [2]. Image classification using ML is another popular area of application to address smart cities challenges including managing traffic congestion [3] managing public safety [4], footfall counting [5] and empowering self-driving and autonomous vehicles [6].
Over the years, numerous ML algorithms, such as decision tree, k-nearest-neighbours and maximum-likelihood minimum distance, have been applied for image classification tasks [7]. With the improvements in ML methodologies, including the advances in DL, the performance of intelligent systems is matching or even bettering human intelligence on several complex problems [8]. Most ML models are data-driven, where the accuracy of the model highly depends on the volume and variety of datasets used for training. A highly efficient and accurate ML model is developed by applying iterative training, evaluation and fine-tuning based on datasets. The nested non-linear structure of these models highly non-transparent [9]. It is inherently difficult to understand which aspects of the input data drive the decisions of the model, making the nature of these models appear as a black box to the end-users or policymakers relying on the results from the model. Human understanding, interpretation and explanation on decision making are crucial on complex tasks, such as many of the smart city applications. The ability to explain the reasoning behind any conclusive decisions has been the key feature of smart city applications as the fundamental tenant of democratic smart cities is for the policymakers to explain decisions made by smart solution powering public services in their cities. Singapore’s minister of foreign affairs and also the Minister-in-charge of the Smart Nation Programme Office, in his talk at the Smart City Expo World Congress in Barcelona in November 2019 said: “Many people think of AI as a black box—into which you throw in data and ask a question. We cannot approach AI like that. The solutions and answers it proposes have to be explainable in human terms. Without that ability—to explain how a solution has been arrived at—you will get pushback”. These words are a good reflection of policy makers and city administrators around the world who are keen to utilise AI in building smart solutions for chronic city problems, or for improving public service offerings to their citizens, but are wary of the black box nature of these solutions.
The loss of control over interpretability of decision making becoming a serious concern for high impact problems [9]. These expectations from policymakers are in line with results of other surveys done in the area of trust in autonomous systems [10] and where the end-users cite ‘explainability’ as one of the prerequisites for trust in such systems [11]. End-users and decision-makers who use the recommendations of the intelligent system require explanations to assure confidence and trust over the system through direct intervention [12]. Explainable AI enhances the trust on decision making, as has been the case for medical education, research and clinical decision making [13], detection of COVID-19 using chest X-ray, CT scan images [14], Multi-agent system through Blockchain Technology [15] or Intrusion Detection Systems [16]. Clearly, for sensitive tasks involving critical infrastructures and affecting human well-being and trust, it is crucial to limit the possibility of improper, non-explainable and unsafe decisions and actions [17]. Before deploying an AI system, we see a strong need to track and validate its behaviour, and thus establish guarantees that it will be reliable for long-term when deployed in a real-world environment [18]. There is a good deal of research highlighting that the explanations of decisions are equally important as the model’s accuracy [19].
This paper is from our experience of dealing with a similar issue while developing a flood monitoring application for a large consortium of European cities as part of a European Union-funded project—Smart Cities and Open Data REuse (SCORE, https://northsearegion.eu/score/) Real-time monitoring of gully and drainage blockage is an important part of flood monitoring applications. Building viable IoT sensors for detecting blockage is a complex task due to the limitations of deploying such sensors in situ. Image classification with deep learning is a potential alternative solution. To address these issues, we have built a novel image classification approach based on DL (Convolutional Neural Network: CNN) with an IoT-enabled camera to monitor gullies and drainages [20]. This approach utilises deep learning to develop an effective image classification model to classify blockage images into three different class labels based on the severity. However, preliminary evaluation with experts revealed that our model lacked transparency in terms of how objects were related to each other in the scenarios where it was known that drainage and gully blockages were mainly caused by the aggregation of multiple objects—and how the model was classifying drainage and gully images into different classes. The experts wanted to know the reasoning behind the classification to help them and us understand why the model was classifying an image in one of the three blockage categories (No Blockage, Partially Blocked and Fully Blocked). However, as the inherent limitations of how the CNN classifiers function, it was not possible to explain the crucial decisions made by the model. To address such ‘explainability’ deficit of the CNN models in this work we uniquely propose the use of Semantic Web technologies [21], in particular ontologies and reasoners [22]. Ontologies, also often referred to as knowledge graphs, allows us to capture the relationships between concepts and entities in a particular domain for better reasoning and explanation. For example, in the domain relevant to this paper, it is possible to work with drainage maintenance teams in city councils to capture the concepts of different ‘objects’ that are commonly found as obstructers when dealing with gully blockages, or the inter-relationship and level of their coverage leading to the different level of blockages, in ontological languages. In this paper, we demonstrate how such knowledge captured in ontologies can be used to classify an image and also to explain the result—why and how the algorithm arrived to that decision.
Considering these, an approach that combines both ML in the form of CNN and expert knowledge has been explored in this research. We propose a hybrid model that consists of machine learning and semantic rules set out to analyse the inclusion of expert knowledge in image classification. This approach can be utilised more transparently and effectively in the context of real-time applications. In this hybrid model, the semantic rules are defined to represent the context of the presence of objects in an image, whereas CNN been used to identify the object coverage from the image dataset. The use of semantic rules provides the capability to use multi-criteria decision making on any instances whereas CNN provides feature extraction in the form of objects coverage level within the image. The use of a hybrid approach for image classification can fill the gap between ML implementation and expert’s knowledge implementation on monitoring a real-time instance.
Section 2 of the paper surveys the literature in the area of the use of ML and Semantic web technologies in addressing challenges of building smart cities solutions. Section 3 provides context to this work and outlines the use case. Section 4 and Section 5 provide details of a hybrid image classification model consisting of Semantic Web technologies and the use of DL models. The experimental design and results are discussed in Section 6. Finally, we conclude in Section 7 by summarising the advantages of our unique approach and also outline the future work.
2. Literature Review
In general, a smart city is defined as a city that monitors and integrates critical infrastructure and services through sensor and IoT devices [23]. The IoT devices capture data of the instances under monitoring and those data are transferred and stored for further processing. Smart Cities application integrates real-time data using IoT and the rational method to design and plan any decision making more systematically. For decision making, human experts have been the core element of all analysis and objectives [24]. Human experts often make the decision based on data coming to any application. Decision making in the context of smart cities became more challenging because of the information available and the involvement of multiple stakeholders [25].
A wide range of sensors and IoT based applications data is being stored and processed in the digital infrastructure of the cities to support decision making [26]. With the change in tools and techniques on the digital platform, a variety of data from apps and other real-time data sources are combined to analyse and make a decision to address specific issues of the city [27]. There have been qualitative and quantitative data for decision making to meet some objectives, which often appear with conflict. Therefore, all smart city applications had to operate and adapt working routines in more effective ways. Any changes must be dependent on the data being used for the application, and hence, the decision making [28].
One of the major challenges of decision making in the smart city has been how to deal with application data and how to apply human expert knowledge. Semantic Web technology in combination with data analysis has been used for expert-based recommendation systems [29,30]. The semantic techniques give the flexibility to apply human experts’ knowledge and control over the prediction model. In different application-based system, the implementation of semantic representation enhanced the performance levels as the semantic rules were developed by applying high-level information, which was gathered from experts from the corresponding fields. We list several types of transparency expected in smart cites models. Each may require a different sort of explanation, requiring different measures of efficacy [18]:
- (1)
- For a company or a service provider: to understand and explain how their system works, aiming to identify the root cause of problems and see whether it is working well or not, and explain why.
- (2)
- For end-users: human users need to trust AI systems in obtaining their needs, but what should be the basis for this trust? In addition to providing end-users with knowledge on the system’s prediction accuracy and other aspects of the performance, providing users with an effective explanation for the AI system’s behaviour using semantic rules that are derived from the domain experts can enhance their trust in the system.
- (3)
- For society: it is important to consider the possible impact of AI in terms of increased inequality (bias) and unethical behaviours. We believe it is not acceptable to deploy an AI system which could make a negative impact on society.
Flood monitoring is one of the major concerns in most of the cities around the world. Over the years, rainfall forecast and satellite images have been used for predicting and monitoring flooding conditions. A wide range of examples also exists, primarily in the modelling of natural hazards and emergencies [31] or the wider context of flooding [32]. Methods such as Liquid level monitoring [33], the water level of gully pot monitoring [34,35] has been applied. Despite the improved access to rainfall data, water level reading, satellite imagery and improved forecasting accuracy, real-time monitoring to support decision making is still a challenge [36]. There are some limited examples of the application of semantic technology for flood risk analysis by applying an expert’s knowledge [37]. However, the model had not applied any machine learning to analyse and extract features from the existing flood-related data to support risk analysis. In this example, semantics were only used as a descriptive mechanism using high-level information for recommendation system. Much research in flood monitoring involves the use of imagery available in the public domain. However, these studies are either too generic or rely on further contextual data to support classification tasks [38].
Objects analysis has been used for analysing image-based decision-making applications. In such applications objects are identified and analysed individually based on extracted information [39,40,41]. This extracted information has been used to classify the images into corresponding classes. During the object analysis, target objects were often defined and all other objects were treated as noise [42]. An image can be classified into multiple classes depending on the types of objects present within the image along with the context of the object. In multi-object scenarios, multi-class label approaches are applied to classify such images [43,44]. In those approaches, one classifier is trained for each object to be analysed the image. The classified outputs are combined with the probabilities of the individual classes to classify the image. Object analysis along with semantic representation is also used for scene recognition [45,46], where the detection of objects and semantic segmentation is applied to recognise the scene. Apart from these approaches, ontology-based approaches are also used to retrieve a specified [31] image from the library [47,48]. In the ontology-based methods, computer vision and manual annotation are used to search the specified image from the library.
Machine learning algorithms have been widely used for image classification by analysing the characteristic features of the images and organising them into corresponding categories or classes. Explainability has been applied in recent years, which allowed control and understanding of a machine learning model. Sameket et al. [8] presented why explainability had been an effective alternative for detecting weaknesses in the model. Abdullatif et al. [49] showed that mining big data is challenging, as this may depend on time. Traditional solutions do not exploit the intrinsic streaming nature of the incoming data: a continuous, possibly unlimited flow of data that evolves during the time. Stream data mining algorithms, including fuzzy methods, can incrementally adapt to the non-stationary changes and data, by creating models that adapt their structure with new data. Moreover, these techniques can track changes in the incoming data with the ability to remove the outliers from it.
Adding explainability to a model allows to verify the system, understand the weakness and detect the biases of the model. Explainability helped to understand the models’ processes, how the model makes any predictions and why it sometimes it fails to make the correct predictions. The use of an explainable expert system allows extracting the detailed knowledge of the system, which gives the flexibility of modifying the model with new insights. Explainability defines the justification behind model predictions, inner workings and approaches of the model enhancement [9]. Model debugging is one of the approaches of analysing and fixing any errors within machine learning. A visualisation tool could be applied to understand the structure of the model. The visualisation could also help for understanding the data that is responsible for the prediction, and hence, clues for further improvement of the model.
Model refinement by incorporating expert knowledge through expert interaction has been applied for the improvement of the model. However, to design an explainable model, two major technical challenges need to be highlighted [19]. The first challenge was to accurately extract features from noisy and sparse data into the model since it was challenging to address the relationships between high-level and low-level features and their semantic meaning. The second challenge was to generate easy and understandable explanation from the multilevel model structure. A knowledge-base representation was applied to understand heterogeneous entities based on the embedded knowledge base [50]. The knowledge graph focused on how to represent different types of properties over heterogeneous entities.
The main goal of the explainable system is to link the human context-based reasoning with facts to construct contextual explanatory models [51]. Human understanding is applied for the intellectual understanding of the context apart from data. Humans can understand the context using very few data and bring reasoning into decision making in a particular task. In other words, the explainable system provides extensions to the existing system to apply human capabilities and understanding to make any decision or action. Explainability is used in multi-domain operations to strengthen confidence, knowledge representation and reasoning. Situational understanding is required to conclude multi-domain scenarios. However, the situational understanding depends on data coming from the machine and context considered by humans [52].
The effectiveness of the explainable system has been often restricted because the criteria are ill-defined and difficult to interpret [20]. Interpretability of the deep learning networks can be increased by applying learning via human-computer interactions and representation. Oftentimes, the explainable system is aimed to provide human-readable and interpretable explanations of decision making [53]. A twin system consists of a black-box built from the machine-learning method, and a white-box method built from human knowledge has been used for the interpretation of chronic renal disease since the black-box systems showed limited effectiveness on explaining the reason behind the predictions or classifications [54]. An adversarial approach was used to modify the explainable system, where modification of the system was based on the information of the relevant features [16]. Explanations had been provided for understanding the model’s reasoning, which was consistent with expert knowledge. A hybrid human-in-the-loop approach was applied where machine learning was improved using extracted domain expert knowledge [55]. Human-in-the-loop approaches iteratively apply experts’ input on machine learning with reasoning.
A combination of the logic-based approach and probabilistic machine learning approach is required to build context-adaptive systems [56]. Integration of these two approaches combines the strength of each to make an effective explainable knowledge-based system. A user-centric explainable decision support system was applied, where the system linked the human reasoning process with intelligent explainable techniques [57]. The system had scaled up the machine learning model with user understanding and observations of an event. An explainable framework was used for anomaly detection. In the framework, the deep learning model detected the anomalous event with the confidence in the description of the detected anomaly and the relevant factors, i.e., the framework had justified the decisions [58]. Deep Learning or black-box models are not suitable for cognitive cities where collaborative approaches have been used between the city and its citizens. Information and knowledge sharing between human and machines are required in cognitive cities. Explainable intelligent systems can adopt humans knowledge in such collaborative approaches [59].
Convolution Neural network (CNN) models had been applied in image classification tasks [42,60]. While building the CNN model, there had not been any single architecture for CNN development. The CNN structure had been modelled by altering network parameters such as the number and types of layers and activation function [61,62]. These parameters had been tuned iteratively to increase model accuracy. A CNN model as an image classifier takes an unclassified image as an input and classified the image into a class label based on the feature extracted. CNN is one of the approaches that has also been applied for the multi-class classification [62,63]. In an application, either one CNN model or multiple CNN models could be designed based on the task [64,65]. When multiple models were developed, each model performed a specific task, and the output of each model was combined.
CNN achieved remarkably higher accuracy on many image analysis applications. However, the network was heavily depended on the number of data that were used for the training [66]. There was a low number of training images in many application domains. Data augmentation is a commonly-used approach in many machine learning models to virtually increase the training dataset for the enhancement of the model accuracy along with for avoiding overfitting. Different augmentation techniques, such as geometric transformations, feature space augmentation, colour space augmentation and random erasing, were applied. Taylor and Nitschke [67] applied geometric transformation augmentation, which changed the shape, size and orientation of the original image during the augmentation. Image augmentation by pairing samples is another approach, where a new image is formed from an image by overlapping another image randomly selected from the dataset [68]. Auto-augmentation techniques were applied which defined probabilities to allow a function for the image augmentation in terms of translation, colour normalisation and rotation [69]. Different image augmentation techniques have been used in different applications; however, in all those applications, the common objective was to increase the training data set to enhance the model performance.
Semantic technologies have been one of the approaches to explore the real-time complex data stream, analyse it and provide higher-level of understandings in Smart City environments [70,71,72]. With the extremely complex nature of IoT data for smart cities such as the variety of representations, distribution, scales and densities, the semantic web offers a solution by providing a layer of abstraction, standardisation and semantics to solve interoperability issues [73]. Furthermore, this facilitates the fusion of a variety of IoT data with existing knowledge from standard data sources and linked data [74,75]. One of the challenges of smart cities has been integrating a large number of applications. The conventional applications might have been complex to communicate with multiple objects and heterogeneous data. Semantic technologies have been applied to integrate multiple heterogeneous IoT devices for data monitoring real-time events and reasoning to support intelligent systems [76,77,78], i.e., semantic technology has provided the flexibility to integrate heterogeneous data and functionalities into a common platform.
At the heart of semantic web applications, ontologies play a key role. In simplistic terms, ontologies are “partial, the simplified conceptualization of the world as it is assumed to exist” [79], and essentially involves the formal definition of a domain as a set of concepts and their entity types, properties and interrelationships [80]. The ontology-based semantic approach has improved the interoperability between the applications. To integrated many applications in smart cities, ontology catalogue was used [81]. Ontologies catalogue has allowed researchers to share and reuse domain knowledge. The ontology-based semantic approach has improved the interoperability between the applications. The ontological solution uses internal and external knowledge about environment, behaviour and activities [82]. One of the key motivations for applying ontologies is to ensure heterogeneous sensors can be integrated effectively during natural disasters and crises [83,84].
Several works have used semantics and ontologies within smart cities for a variety of functions, e.g., to add value to data collected from sensor and social data streams [85], to combine sensor and social data streams with machine learning techniques and to facilitate interoperability and information exchange [83]. A range of projects has explored the use of the semantic web in specific domains, such as energy and transport [28], mobility and autonomous vehicles [86], traffic jams and delay [87], surveillance system [88], emergency management [89], environment [90], parking [91], energy [92,93], water [94] and so on. Several projects and frameworks have also emerged, aiming to exploit semantics to enable interoperability, e.g., OpenIoT [95], CityPulse [96] and VITAL [97].
Over the past few years, a variety of ontologies have also been developed for use within smart cities environments for IoT, sensors, actuators and sensor observations, such as [28,98,99,100]. Over the past many years, there has been a considerable effort in developing ontologies for defining sensor networks, with particularly the SSN (Semantic Sensor Network) ontology being one of the most commonly extended and adapted ones. The SSN ontology is a domain-independent model that covers sensors, sensing and measurements, and also incorporates other models such as SensorML and Observations and Measurements (O&M). Many studies have also extended the SSN ontology to adapt to their specific needs and domains such as environment [101], smart buildings [102], energy monitoring [103] and transport [104]. Ontologies applied within flooding to incorporate sensor data, although available, are limited [105,106,107,108] and applied in specific scenarios, as noted in a recent systematic review of flooding ontologies [109]. However, the application of deep learning and semantic web in disaster response has been limited, primarily aimed at classification and identification of disaster-related information in social media [110,111,112] or analysing remote sensing [113] and aerial imagery [114]. The use of semantic technologies in smart cities has led to discovering new opportunities such as information discovery, categorisation of events, complex event processing and reasoning for decision making, as the semantic networks provide a powerful way of transforming knowledge into machine-readable content [115].
3. Flood Monitoring in Smart Cities
Flood monitoring has been one of the major issues in smart cities. Drainage and gully blockages have been identified as the foremost reason for urban flooding; hence, monitoring of drainage and gullies is an important aspect of flood monitoring systems. Blockage of drainage and gullies on the streets and roads is a condition when external objects obstruct the normal flow of water. However, building and installing electronic sensors to monitor them is complex and not always feasible. Therefore, an alternative technique is required to monitor drain and gully blockages for the effective monitoring of flooding instances. Real-time capturing of drainage and gully images using a smart camera, as shown in Figure 1, and hence, analysing and classifying the image, can detect the potential flooding threat. The effectiveness of the monitoring depends on the proficiency of the image classification task. Therefore, an efficient image classification method is required for classifying drainage and gully images to identify blockage level, and hence, the flooding alert. Drainage and gullies often get blocked due to accumulation of objects at the street and roads.
3.1. Major Objects and Their Significance
To learn about the list of major objects typically causing drainage and gully blockages, a workshop with five experts, working in the domain of drainage and gully blockage and cleaning section in the Bradford Metropolitan District Council, was organised. In discussion with the experts during the workshop and after analysing more than 50 randomly selected images. Four major objects, namely “Leaves”, “Mud”, “Plastic Bag and Bottle” and “Water”, were identified as the most common objects on monitoring drainage and gully blockage. These four major objects and their significance in drain and gully blockage is summarised as follows:
- i.
- Leaves: Leaves were raised as one of the most prevalent problems when it comes to blockages. Once leaves enter into the drainage, they become less of a problem, as they can pass through the sewage system relatively easily. The real problem is when the leaves gather on top of a drainage system and begin to form dams if they cannot pass through, as shown in Figure 2.
- ii.
- Slit (Mud): Silt is solid, dust-like sediment that water, ice and wind transport and deposit. Silt is made up of rock and mineral particles that are larger than clay but smaller than sand, as shown in Figure 3. During the discussion, silt was discussed as a major problem for drainage and gully blockage if they were not sufficiently cleaned regularly and were allowed to build up. Furthermore, if silt accumulated for a longer period, it can be fertile enough for vegetation to grow relatively easily, which can cause further problems with the drainage system.
- iii.
- Plastic and Bottles: Plastic and bottles were identified as another major risk to drainage system due to the capability of these objects being able to cover the drainage and restrict the water flow into the sewage system, as shown in Figure 4. Further discussions revealed that bottles by themselves are not an issue, but in combination with other litter or debris, raise the risk of blockage. As discussed with experts, bottles would typically be pushed up against the entryways to the drainage and gully, leaving the access way either blocked or restricted.
- iv.
- Water: Finally, water was identified as one of the four major objects to be monitored while deciding the drainage and gully blockage. The presence of water along with other objects and their coverage, as shown in Figure 5, is the key factor in deciding the blockage level.
3.2. Convolutional Neural Network for Object Coverage Detection
In this flood monitoring application, the drainage and gully images show multiple objects. The presence of these images causes blockages of drainage and gullies, and hence, urban flooding. Detection of the objects with their coverage level within the image is crucial for detecting drainage and gully blockages. An efficient image classification method is required for classifying drainage and gully images. Considering the need for object coverage detection based on image features, CNN models have been built. The details of the CNN models are presented in Section 5.4.1.
3.3. Semantics for Flood Monitoring
In our solution, semantic techniques enable understanding the characteristics of objects and the context of these objects, with the use of explicit formal rules. Decision making on detection of drainage and gully blockage is a contextual problem, as it depends on the presence of the types of objects and their proportion. For example, the detection of water coverage in an image is not enough to classify the blockage level in a flooding context. The presence of other objects in combination with accumulation of water define the severity of drainage and gully blockage, i.e., the presence of other objects and their relationship is crucial on decision making. The object coverage levels detected by CNN models do not provide the explainability on classification. Expert knowledge adds the explainability of the system for decision making. To bring control over decision making, semantic representation and formulation of semantic rules are defined. With the knowledge elicitation process, involving interviewing experts, the relationship among objects coverage level and the context of drainage and gully blockage instances have been articulated with semantic representations. Semantics rules bring the knowledge from the domain experts to the system on decision making to classify the image into a class label. The details on semantic rules formulation are presented in Section 5.5 and Section 5.6.
4. Hybrid Image Classification Models with Object Coverage Detectors and Semantic Rules
We propose a novel hybrid image classification model that classifies the drainage and gully images into a class label. This hybrid approach is a combination of machine learning and semantic techniques. In this hybrid approach, the machine learning algorithm is used to detect object coverage proportion within the image, whereas the semantic technique has been used to define the relationship among the objects based on the detected object coverage level. The classification process of this proposed hybrid image classifier is described with the conceptual flow diagram, as shown in Figure 6. In this hybrid image classifier, the classification method consists of three computational steps: “Object coverage detection”, “Semantic representation and rule base formulation (indicated by ‘Rule Base’)” and “Inference Engine”.
4.1. Object Coverage Detection
Drainage and gully may get blocked with litter materials such as leaves, mud, plastics and bottles. The list of individual objects causing the blockage is considerable, and hence, identifying every object’s coverage is not practically feasible within object coverage detection and image classification. Therefore, major objects coverage detection is crucial to develop an efficient image classification model. Information on the presence of the objects within an image is not sufficient to apply conclusive reasoning on deciding the blockage level. To strengthen the classification decision, the level of coverages of the detected object within the image is used. Coverage detectors are built using CNNs that classify the image into one among four coverage levels namely: Zero, One, Two and Three. These coverage detectors are iteratively modelled, trained and tested with sample images.
To detect the presence of objects within an image, the object coverage detector for each object was applied. Four object coverage detectors (one for each object) are built using CNN, where each detector has been modelled, trained and tested with sample images. Each object coverage detector detects the presence of those objects within the image.
4.2. Semantic Representation and Rule Base Formulation
Semantic rules for the image classification are defined based on expert knowledge captured during the workshop. During the workshop, experts were asked to categorise the sample images into three class labels: “fully blocked”, “partially blocked” or “no blockage”. Experts were also asked to identify the objects in the images and provide the reasoning on classifying the image into the corresponding class labels. Five experts were used to classify single images and as a result, we observed experts classifying images into different class labels. In such cases, the majority count approach was applied for knowledge extraction, i.e., the image was classified into the class label with the majority vote.
4.3. Inferencing and Image Classification
Inferencing is applied to classify the image based on object coverage and semantic rules. Inference engine selects appropriate rules from the rule-base. The selection of rules depends on the detection of each object’s coverage level. The most appropriate rule is selected to classify an image into the corresponding class label.
5. Methodology
In this section, preparation of training data for the image coverage detectors model, implementation details using machine learning and the use of semantic rules for image classification is presented in detail. Performance of the hybrid classification model in terms of accuracies on object coverage detection and image classification are also analysed. Moreover, the classification results are compared with the machine learning-based image classification model.
5.1. Data Construction
Preparing data sets for object detector was challenging due to the lack of public datasets on drainage and gully blockages. To overcome this, images are collected from publicly available image sources such as Google Image, YouTube videos and other public sources. These images are retrieved using multiple keywords, such as ‘drainage block’, ‘rubbish and drain blockage’ and ‘drain-grate and flooding’. It was observed that all the collected images were not useful considering our problem domain, owing to some being noisy, unwanted and blurred images. To remove those unwanted, noisy and blurred images from the dataset, manual supervision was applied for dataset preparation. During the manual supervision, each image was analysed in terms of their size, quality and how closely they are related to the problem domain. After data pre-processing, the image dataset for each object type was prepared.
5.2. Image Augmentation
Convolutional Neural Network (CNN) model with higher accuracy, lower training and validation loss are required. To build an effective CNN model, a larger training dataset is required [116]. However, there has been a limitation on accessing a large number of images for model training. To achieve this, image augmentation has proven to be a powerful technique to enrich the image dataset. In other words, image augmentation has found to be an effective alternative to enhance model performance [67,117,118]. Supported by the reported improvement in model performance using image augmentation in the literature, we have chosen to use image augmentation to build an improved CNN model for object coverage detector accuracy.
The main objective of applying image augmentation is to increase the training image dataset. Different image augmentation techniques such as geometric transformation, random erasing, colour space transformations and feature space augmentation have been applied for image augmentation. “ImageDataGenerator” class from Keras library has been used as an alternative for image augmentation to improve the image classification accuracy [69,119]. Images are augmented by changing augmentation parameters such as zoom, height shift, width shift, shear and brightness by altering the values as shown in Table 1. Random values are set within the range for different parameters to increase the diversity in image dataset. By applying image augmentation, the number of training images was increased by approximately 10 times.
5.3. Image Annotation and Coverage Level
One of the major issues on object coverage detection is to find the coverage proportion of each object within the image. The object count [120,121] method has been applied as an approach to find the density or proportion of object area within an image. However, the object count approach for small objects appearing in a group has been a limiting factor for object count analysis [122]. In this work, the object count method is not viewed as a feasible option, as leaves and plastic and bottles are small in size and often appears as a group. Additionally, water and mud cannot be counted in discrete numbers. The object count method also does not appropriately address the coverage area proportion. This can be illustrated with the example of analysing coverage of leaves as shown in Figure 7a,b. In these two figures, both the images have approximately 53 % leaves coverage of leaves. However, it can be observed that there is a considerable difference in the number of leaves in each image. Furthermore, it has also been visually observed in those figures that there is no uniform pattern on image coverages. The size and shape of the objects vary from image to image as well. Therefore, object counts within the image would not be a feasible option to categorise the image into different levels.
To overcome these complexities, image annotation techniques have been applied that mark the object of interest within the images. Using the annotation tool “labellmg (https://github.com/tzutalin/labelImg)”, images were manually annotated; an example of an annotated image is shown in Figure 8. During the annotation, boxes (boundaries) are created by covering the objects in the image. There are one or more than one boxes for individual objects within the image depending on the position and orientation of the objects. Mostly, each object covers some proportion of the total area within the image. However, there are overlapping boxes, mainly with the presence of water within the image.
The next challenge was to categorise the annotated image into different coverage levels. An analogy of the object count method within the frame, used for density calculation, has been adopted to define the coverage level [123]. The coverage area percentage was applied to categorise the images into different levels. To find the coverage percentage of each object within the images, the area of each box has been calculated for each object based on box coordinates. The areas of individual objects are summed, and hence, the percentage of coverage of each object within the image was calculated. Based on the coverage percentage, as listed in Table 2, annotated images have been categorised into four coverage class levels. Example of coverage level corresponding coverage percentage of three images, shown in Figure 9a–c, is listed in Table 3.
5.4. Coverage Detector Implementation
Object coverage detectors have been modelled, trained and implemented to detect the coverage level of each object within the image. Coverage detector model for each object, leaves, plastic and bottle and mud and water, has been designed as a CNN model.
5.4.1. Convolutional Neural Network
CNN is a feed-forward neural network made up of layers with learnable parameters including weights and biases. A CNN is typically composed of multiple layers interconnected to each other. Different layers that have been applied in CNN models are summarised as below.
Convolutional layers: Convolution layer is the first layer in the CNN model and works as a feature extractor to extract features, such as edges or textures from the input image. This layer uses a convolution operation on the input image and passes the extracted output to the next layer in the model. The three-dimensional input in terms of height, width and the number of channels are applied to the convolutional layer to get the output as a feature map. In this work, the number of convolution layers was adjusted based on the model training accuracy. After several iterations and adjustment of model parameters and based on the best training accuracy, two convolution layers was set for leaves and water coverage detector CNN models, whereas three convolutional layers were set for plastic and bottles and mud coverage detector CNN models.
Pooling layers: a pooling layer is a down-sampling layer, which is commonly applied after the convolution layer and takes feature maps as its input. The main purpose of applying pooling layers is to minimise the spatial resolution of the feature maps. Max pooling was implemented to progressively reduce the spatial size of the feature maps, and hence, reduce the number of parameters and computation in the network.
Flatten Layer: a flatten layer transforms the entire pooled feature map matrix into a single column. The transformed values are then fed to the next layer in the network for further processing. Flatten layers are applied to increase the training accuracy.
Dense Layer (a fully connected layer): several convolutional pooling layers and flatten layers are applied in combination to extract features. The dense layer that appears after these layers infers the feature representations and perform the reasoning. In this work, the dense layer classifies the input image into four levels. Softmax layer has been used to calculate the final probabilities of each class.
Activation function: the activation function decides whether or not a node in the network should be activated. The activation function introduces non-linearity to the network, which analyses whether the information that a node is receiving should be stored or ignored. ReLU function was applied as the activation for the CNN models.
Four CNN models are designed by altering the number of layers. The CNN model architecture, for the leaves coverage detector, is shown in Figure 10. Other coverage detectors have differed only in terms of the number of convolution and pooling layers that were used.
5.4.2. Model Regularisation and Parameter Selection
One of the most common problems in CNN training is overfitting. Regularisation has been applied as one of the approaches for improvement in CNN training accuracy [124]. Regularisation modifies the model’s learning parameters such that the performance of the model improves during models training. In this work, different parameters have been applied for the model regularisation:
L2 (lambda): L2 is also known as weight decay. It has been applied so that the weights concentrate toward zero. Lambda regularisation parameter value is set as 0.001.
Dropout: dropout randomly removes the output of some of the hidden nodes during the training and only updated the remaining nodes. We have defined 0.25 to 0.5 as the probability of dropout during the training. After analysing different ranges, a dropout probability of 0.4 was set for the model, as it shows the best training accuracy.
Image Augmentation: High number of training image dataset has been generated using data augmentation, as discussed in Section 4.2.
Padding: padding is mainly applied to add columns and rows with zeroes to keep the spatial sizes the same after convolution. Padding has been applied such that the output has the same length as the original input.
5.5. Semantic Representation
Semantic representation of the blockage instances was created after the analysis of an individual expert’s view on object identification, classification and reasoning. Structured knowledge is generated to represent the conceptual model on blockages of drainage and gully. The relationship between objects coverage level and classification instances: “Fully Blocked”, “Partial Blocked” and “No Blockages” instances have been presented with semantic representation, as shown in Figure 11. The concept map reflects the top-level concept of drainage and gully blockages. This representation shows the major components of an image in a certain combination, which defines the instances of blockages.
“Fully Blocked”, “Partially Blocked” and “No Blockage” instances are formulated based on objects and their coverage within the image. Using the experts’ reasoning in image classification into corresponding class labels, the semantic rule-base has been created. The drainage and gully blockages’ instances have been converted into the OWL (Web Ontology Language) ontology as shown in Figure 12.
5.6. Rule-Based Formulation
Experts have highlighted that an image is classified as “Fully Blocked” when there are many objects that cover most of the image portion with the sign of severe restriction of water flow through the drainage system, i.e., water cannot enter the drainage system due to objects that caused a blockage. Similarly, an image is classified into the “Partially Blocked” label when the water is hindered from entering the drainage system but is still able to enter to some degree. In a drainage system with this classification, there are fewer objects that block it, or the combination of objects are not as severe. An image is classified with the “No Blockage” category when water can freely flow into the drainage system and no obstruction-causing objects are detected. Considering that the flooding condition, the experts have also highlighted that the drains and gullies do not always cope with the amount of water, but also the location and rain duration are among the parameters that define the flooding scenarios. In this hybrid image classification model, the location and rain duration parameter is ignored, since with image analysis these parameters cannot be detected. Mutually exclusive semantic rules are defined to classify the image instances based on object coverage detection using experts knowledge of image classification. SWRL (Semantic Web Rule Language) rules have been created for all the possible instances depending on the presence of object coverage and their combinations; an example of one of such rules are presented in Figure 13. We discuss the rules in more detail in Section 6.2.
6. Experimental Design and Result Analysis
The simulation was performed on a machine with Intel(R) Core(TM) i7-8750 HCPU @2.20 GHz processor with 15.5 GB (usable) of RAM running on Windows-10 64-bit operating system. For CNN model training, the experimental setup for image size, the number of epochs and batch size have been set by altering their values in different iterations. Input image sizes 32, 64, 96 and 128 have been applied in different iterations, the number of epochs caries from 100 to 500, whereas the batch size varies from 8 to 32. The models with the best training and validation accuracy with the corresponding setup have been used for object coverage detection.
6.1. Object Coverage Detection Training
For the evaluation of models’ training, training accuracy, training loss, validation accuracy and validation loss have been analysed iteratively for each object coverage detectors. The models with the best training accuracy, training loss, validation accuracy and validation loss, as listed in Table 4, have been used for the object coverage detection. It was observed that these training performance parameters are not the same for each object coverage detectors. In other words, there has been a variance in the performance level of object coverage detectors such as training accuracy ranges from 0.9626 to 0.9983 and validation accuracy ranges from 0.7727 to 0.8955. The training accuracy and loss and validation accuracy and loss are analysed plots over 300 iterations are presented in Figure 14a–d. These plots showed that the model’s accuracies improve significantly, by up to 60 iterations, following which the accuracy and loss performance appears to stabilise. Therefore, the training of the models is limited to 300 iterations only.
6.2. Analysis of Semantic Rules Implementation
Class labels generated by the inference engine on the test images are compared with the class label defined by experts for those test images. These test images belong to all three categories with the presence of objects in many ways; some images have only one of the listed objects, whereas other images have more than one listed object. Figure 15 shows the examples of implementation of semantic rules for the image classification. The following examples illustrate how the matched rules are applied based on the object coverage detection and hence the classification decision. Analysis of rule selection is presented for three sample images of the category “Fully Blocked”, which has been correctly classified as “Fully Blocked” and others two images which are incorrectly classified as “Partially Blocked” and “No Blockage”. In the scenarios, when no rule is selected the default rule “No Blockage” is used for defining the class.
In the first image (Figure 15a), the object coverage detector detects Mud level three, Leaf level one, Plastic and Bottle Level zero and Water Level zero. The combination of these selects the following rule and correctly classified the image.
Rule: Image(?p1) ^ has_coverage(?p1, ?c1) ^ has_object(?c1, leaves) ^ has_coverage_level(?c1, one) ^ has_object(?c2, mud) ^ has_coverage_level(?c2, three) -> Fully_Blocked(?p1)
In the second image (Figure 15b), the object coverage detector detects Mud level one, Leaf level zero, Plastic $ Bottle Level zero and Water Level zero and selects the rule:
Rule: Image(?p1) ^ has_coverage(?p1, ?c1) ^ has_object(?c1, water) ^ has_coverage_level(?c1, zero) ^ has_object(?c1, plastic_bottle) ^ has_coverage_level(?c1, zero) ^ has_object(?c2, mud) ^ has_coverage_level(?c2, one) -> Partially_Blocked(?p1)
Similarly, for the third image (Figure 15c), the object coverage detector detects Mud level zero, Leaf level zero, Plastic $ Bottle Level zero and Water Level zero and selects the rule:
Rule: Image(?p1) ^ has_coverage(?p1, ?c1) ^ has_object(?c1, water) ^ has_coverage_level(?c1, zero) ^ has_object(?c1, leaves) ^ has_coverage_level(?c1, zero) ^ has_object(?c1, leaves) ^ has_coverage_level(?c1, zero) ^has_object(?c2, mud) ^ has_coverage_level(?c2, zero) -> No_Blockage(?p1)
Selection of the rule depends on the detection of the coverage level by the CNN model. The inference engine selects the appropriate rule form the rule base for the image classification. Semantic rule implementation has both correct and incorrect classification of all three instances of drainage and gully blockage.
6.3. Hybrid Class Performance Analysis
In general, the image classifier models’ accuracies have been a one-step evaluation [60,64,65,125]. The model performance is evaluated in terms of correctly classifying the test image into corresponding class labels. Those models were built using machine learning algorithms. Therefore, the models’ performance was evaluated in terms of model test accuracy. In this proposed hybrid image classifier, the performance of the model was analysed in two stages. First, the accuracy of the object coverage detector is analysed, and second, the accuracy of the hybrid image classifier by applying the semantic rules is analysed.
6.3.1. Accuracy of the Object Coverage Detector
Accuracy of the detection of objects’ coverage level within an image is crucial for the implementation of the semantic rules for image classification as the accuracy of semantic rules depends on the accuracy of objects coverage level detection. Individual object coverage detectors have been tested with 21 sample annotated images. The result is summarised with the combined confusion matrix of object coverage detectors in Table 5.
From the confusion matrix, it is clear that detector models do not have uniform accuracy. The accuracies of level Zero and level Three was found to be relatively higher in comparison to the accuracies of level One and level Two.
Level Zero has no or very low coverage of the representative object within the image, to generate characteristic features of that object during the model training, which could lead to higher accuracy for level Zero detection. For level Three coverage detection, there was more than 50% coverage of the representative object, which reflects the significant characteristic features representation of the object. Because of this, the modes have higher accuracy than level One and level Two during the model training. For level One and Two, coverage of representative objects is less, i.e., there are other objects or image background features that were extracted during the model training, and hence, there is a lower range of test accuracy. The analysis showed that the object detection accuracy ranged from 61.9 % to 76.2% and the aggregated accuracy of the object coverage detectors was 69.04%, as plotted in Figure 16.
6.3.2. Accuracy of the Hybrid Image Classifier
In the next stage of the image classifier, 26 test images are classified into corresponding class labels using semantic rules. These test images are selected such that they reflect the best match scenarios for drainage and gully blockage that can cause flooding. The classification accuracy of the proposed hybrid classifier has been compared with machine learning-based classifier based on deep learning. The performance has been evaluated on the accuracy on correctly classifying the Fully Blocked (FB) image as FB, the Partially Blocked (PB) image as PB and No Blockage (NB) images as NB, along with wrong classifications such as FB images classified as PB, PB images classified as NB and so on, as shown in Figure 17. The overall accuracy of the machine learning-based classifier and hybrid classifier has also been compared, also shown in Figure 17.
Figure 18, Figure 19 and Figure 20 present a further sensitivity analysis in terms of precision, recall and F-scores for individual instances of our classifier. We observe that the hybrid classifier outperforms the machine learning classifier.
Analysing Figure 17, it can be observed that the hybrid image classifier improved performance compared to that of machine learning-based classifier. The hybrid classifier has better accuracy on all the true positive classification, that is, classifying “Fully Blocked” as “Fully Blocked”, “Partially Blocked” as “Partially Blocked” and “No Blockage” as “No Blockage”. The overall accuracy of the hybrid classifier is 69.23%, which is an improvement of about 2% accuracy compared to the machine learning-based classifier. It has been reported in the literature that machine learning-based classifier accuracy depends on the number of training dataset used for CNN model training [126]. Since there have been fewer training datasets available for CNN model training, the machine learning-based model has the limitation of achieving higher accuracy. Apart from adjusting the model’s training parameter, there has been no other explainable reasoning or control for model training to enhance accuracy. Sensitivity analyses in terms of precision, recall and F-score for “Fully Blocked”, “Partially Blocked” and “No Blockage” have shown improved performance on the classification for each instance when a hybrid classifier has been applied.
In the hybrid model, the accuracy analysis of a hybrid classifier is a two-stage accuracy analysis. The overall accuracy of the classifier depends on the accuracy of the object coverage detectors and implementation of the semantic rules. In this work, the context of the object presence and their coverage levels have been important to define the class level. Use of semantic rules provides the flexibility to apply expert knowledge for context analysis. Expert knowledge in terms of semantic rules reflects the context of the image, which helps to correctly classify an image into the corresponding class label.
In the literature, the explainable AI presents some challenges in terms of it being used as a selective decision making that focuses on explanations and background knowledge [127], a large amount of information [128] and using case-specific decision making [129]. Moreover, we have faced other challenges as well in this work which might be useful to other researchers working on utilising Explainable AI for developing Smart Cities’ solutions. Availability of domain knowledge in the form of ontologies or knowledge graphs: in our case, we needed a domain-specific ontology that reflects the flood case scenarios. We had to create this ontology from scratch in our work, as the existing ontologies do not cover the case we have worked on. Access to domain experts: if no open-domain knowledge about the problem areas under investigation exists then domain knowledge in the form of ontologies have to be created with close consultation with experts. This is also often an iterative process. Skillset in knowledge engineering: knowledge engineering is a complex field, and capturing tacit knowledge is a complex task requiring specialist skillsets to build Explainable AI-based systems.
7. Conclusions and Future Work
In this work, we have made a case for ‘Explainable AI’ with a hybrid image classification model consisting of ontological representation of the domain including rules captured with the help of domain experts and a DL-based classifier. Such a hybrid model is applied in a real-world use case involving flood monitoring application in the context of a Smart Cities EU project. The hybrid model is based on machine learning and semantic technology, which classifies drainage and gully images into either of the following three blockage instances: “Fully Blocked”, “Partially Blocked” or “No Blockage”. We captured expert input as semantic rules and used them in our hybrid approach to identify four major objects primarily responsible for drainage and gully blockages. A set of images were classified into a classification label based on the knowledge elicitation process with experts in this project. Semantic web rule language was applied to define relationships between various objects’ coverage level within the image. In this hybrid image classification task, the classification process was divided into two phases. In the first phase, we applied object overage detection, in which object detectors were modelled and trained using CNN. To build our CNN models, publicly available images were manually annotated and then used for training. The annotated images were classified into four coverage levels based on the coverage percentage of each object within the image. In the second phase, semantic rules were applied based on the coverage of the object within the image to classify the image instance. The accuracy of our proposed hybrid image classification model was analysed in two stages. The accuracy for both object coverage detectors and the hybrid classifier based on inferencing semantic rules have been analysed. The accuracy analysis demonstrated an improvement in the accuracy of the hybrid classifier in comparison to the machine-based image classifier.
The major advantage of the hybrid image classifier is that it gives the flexibility to incorporate experts’ knowledge in the classification process. In the machine learning-based classifier, the classification performance depends only on the training of the model, whereas the hybrid classifier not only shows the improvement in classification accuracy but also adopts the expert’s knowledge. The analysis showed that some rules correctly predict the class label as “Partially Blocked”, whereas some rules predict incorrect class labels, for example classifying a “Partially Blocked” image into a “No Blockage” image. The hybrid model transparently showed which rules perform well and which rules need to be revised.
For our future work, the accuracy of both the object coverage detectors and hybrid classifier will be enhanced. The accuracy of coverage detectors will be improved by adding a higher number of application-focused images for training. Besides these four object coverage detectors, other object coverage detectors, such as grate, can also be included. The rules will be updated by revisiting rules that have been identified as the main contributors to low accuracy. The rules will be re-evaluated and rewritten to improve the overall classification accuracy. Future work will also explore the possibility of including additional contextual information, such as weather and rainfall (higher rainfall may increase surface run-off), seasonality (autumn involves increased leaves) or the occurrence of local events (local street events may increase litter), which could further help improve our approach. Fuzzy rules can be applied for the knowledge representation and rules generations when the domain knowledge has some kind of vagueness.
Author Contributions
D.T.: conceptualisation, methodology, software, validation, formal analysis, investigation, writing—review and editing, supervision, project administration, funding acquisition. B.K.M.: conceptualisation, methodology, software, validation, formal analysis, investigation, writing—review and editing, visualisation. A.A.: conceptualisation, methodology, software, validation, formal analysis, investigation, writing—review and editing. S.S.: validation, supervision, project administration, funding acquisition. S.M.: formal analysis, investigation, writing—review and editing. All authors have read and agreed to the published version of the manuscript.
Funding
This research was funded by Interreg EC grant
as part of Smart Cities and Open Data REuse (SCORE) project.
Acknowledgments
The research presented in this paper is funded by the European Commission Interreg project Smart Cities and Open Data REuse (SCORE). Authors would like to thank the five experts from Bradford City Council who took part in the knowledge elicitation and evaluation process. We would also like to thank Aberdeen City Council representatives in the SCORE project for their input to identify the generality of the application.
Conflicts of Interest
The authors declare no conflict of interest.
References
- Souza, J.T.; Francisco, A.C.; Piekarski, C.M.; Prado, G.F. Data Mining and Machine Learning to Promote Smart Cities: A Systematic Review from 2000 to 2018. Sustainability 2019, 11, 1077. [Google Scholar] [CrossRef] [Green Version]
- Chakraborty, P.; Adu-Gyamfi, Y.O.; Poddar, S.; Ahsani, V.; Sharma, A.; Sarkar, S. Traffic Congestion Detection from Camera Images using Deep Convolution Neural Networks. Transp. Res. Rec. J. Transp. Res. Board 2018, 2672, 222–231. [Google Scholar] [CrossRef] [Green Version]
- Yuan, Z.; Zhou, X.; Yang, T. Hetero-ConvLSTM. In Proceedings of the 24th ACM SIGKDD International Conference on Knowledge Discovery & Data Mining, London, UK, 19–23 August 2018; Association for Computing Machinery (ACM): New York, NY, USA, 2018; pp. 984–992. [Google Scholar]
- Shukla, U.; Verma, S.; Verma, A.K. An Algorithmic Approach for Real Time People Counting with Moving Background. J. Comput. Theor. Nanosci. 2020, 17, 499–504. [Google Scholar] [CrossRef]
- Chen, Q.; Wang, W.; Wu, F.; De, S.; Wang, R.; Zhang, B.; Huang, X. A Survey on an Emerging Area: Deep Learning for Smart City Data. IEEE Trans. Emerg. Top. Comput. Intell. 2019, 3, 392–410. [Google Scholar] [CrossRef] [Green Version]
- Simhambhatla, R.; Okiah, K.; Kuchkula, S.; Slater, R. Self-driving cars: Evaluation of deep learning techniques for object detection in different driving conditions. SMU Data Sci. Rev. 2019, 2, 23. [Google Scholar]
- Foody, G.M.; Mathur, A. A relative evaluation of multiclass image classification by support vector machines. IEEE Trans. Geosci. Remote Sens. 2004, 42, 1335–1343. [Google Scholar] [CrossRef] [Green Version]
- Samek, W.; Wiegand, T.; Müller, K.R. Explainable Artificial Intelligence: Understanding, Visualizing and Interpreting Deep Learning Models. arXiv 2017, arXiv:1708.08296. [Google Scholar]
- Choo, J.; Liu, S. Visual Analytics for Explainable Deep Learning. IEEE Eng. Med. Biol. Mag. 2018, 38, 84–92. [Google Scholar] [CrossRef] [Green Version]
- Shahrdar, S.; Menezes, L.; Nojoumian, M. A Survey on Trust in Autonomous Systems. In Advances in Intelligent Systems and Computing; Springer Science and Business Media LLC: Cham, Switzerland, 2018; pp. 368–386. [Google Scholar]
- Winikoff, M. Towards Trusting Autonomous Systems. In Lecture Notes in Computer Science; Springer Science and Business Media LLC: Cham, Switzerland, 2018; pp. 3–20. [Google Scholar]
- Al Ridhawi, I.; Otoum, S.; Aloqaily, M.; Boukerche, A. Generalizing AI: Challenges and Opportunities for Plug and Play AI Solutions. IEEE Netw. 2020, 1–8. [Google Scholar] [CrossRef]
- Holzinger, A.; Langs, G.; Denk, H.; Zatloukal, K.; Müller, H. Causability and explainability of artificial intelligence in medicine. Wiley Interdiscip. Rev. Data Min. Knowl. Discov. 2019, 9, 1312. [Google Scholar] [CrossRef] [Green Version]
- Hossain, M.S.; Muhammad, G.; Guizani, N. Explainable AI and Mass Surveillance System-Based Healthcare Framework to Combat COVID-I9 Like Pandemics. IEEE Netw. 2020, 34, 126–132. [Google Scholar] [CrossRef]
- Calvaresi, D.; Mualla, Y.; Najjar, A.; Galland, S.; Schumacher, M. Explainable Multi-Agent Systems Through Blockchain Technology. In Biometric Recognition; Springer Science and Business Media LLC: Cham, Switzerland, 2019; pp. 41–58. [Google Scholar]
- Marino, D.L.; Wickramasinghe, C.S.; Manic, M. An Adversarial Approach for Explainable AI in Intrusion Detection Systems. In Proceedings of the IECON 2018—44th Annual Conference of the IEEE Industrial Electronics Society, Washington, DC, USA, 21–23 October 2018; pp. 3237–3243. [Google Scholar]
- Abdullatif, A.; Masulli, F.; Rovetta, S. Tracking Time Evolving Data Streams for Short-Term Traffic Forecasting. Data Sci. Eng. 2017, 2, 210–223. [Google Scholar] [CrossRef] [Green Version]
- Fong, R.C.; Vedaldi, A. Interpretable Explanations of Black Boxes by Meaningful Perturbation. In Proceedings of the 2017 IEEE International Conference on Computer Vision (ICCV), Venice, Italy, 22–29 October 2017; pp. 3449–3457. [Google Scholar]
- Gao, J.; Wang, X.; Wang, Y.; Xie, X. Explainable Recommendation through Attentive Multi-View Learning. In Proceedings of the Thirty-Third AAAI Conference on Artificial Intelligence, Honolulu, HI, USA, 27 January–1 February 2019; Volume 3, pp. 3622–3629. [Google Scholar]
- Papernot, N.; McDaniel, P. Deep k-Nearest Neighbors: Towards Confident, Interpretable and Robust Deep Learning. arXiv 2018, arXiv:1803.04765. [Google Scholar]
- Berners-Lee, T.; Hendler, J.; Lassila, O. The Semantic Web. Sci. Am. 2001, 284, 34–43. [Google Scholar] [CrossRef]
- Dhavalkumar, T.; Fan, Y.-T.; Dimoklis, D. User Interaction with Linked Data: An Exploratory Search Approach. Int. J. Distrib. Syst. Technol. IJDST 2016, 7, 79–91. [Google Scholar]
- Escolar, S.; Villanueva, F.J.; Santofimia, M.J.; Villa, D.; Del Toro, X.; Lopez, J.C. A Multiple-Attribute Decision Making-based approach for smart city rankings design. Technol. Forecast. Soc. Chang. 2019, 142, 42–55. [Google Scholar] [CrossRef]
- Tobey, M.B.; Binder, R.B.; Chang, S.; Yoshida, T.; Yamagata, Y.; Yang, P.P.-J. Urban Systems Design: A Conceptual Framework for Planning Smart Communities. Smart Cities 2019, 2, 522–537. [Google Scholar] [CrossRef] [Green Version]
- Hoang, G.T.T.; Dupont, L.; Camargo, M. Application of Decision-Making Methods in Smart City Projects: A Systematic Literature Review. Smart Cities 2019, 2, 433–452. [Google Scholar] [CrossRef] [Green Version]
- Gupta, K.; Hall, R.P. Understanding the What, Why, and How of Becoming a Smart City: Experiences from Kakinada and Kanpur. Smart Cities 2020, 3, 232–247. [Google Scholar] [CrossRef] [Green Version]
- Browne, N.J.W. Regarding Smart Cities in China, the North and Emerging Economies—One Size Does Not Fit All. Smart Cities 2020, 3, 186–201. [Google Scholar] [CrossRef] [Green Version]
- Komninos, N.; Bratsas, C.; Kakderi, C.; Tsarchopoulos, P. Smart City Ontologies: Improving the effectiveness of smart city applications. J. Smart Cities 2016, 1, 31–46. [Google Scholar] [CrossRef] [Green Version]
- Subramaniyaswamy, V.; Manogaran, G.; Logesh, R.; Vijayakumar, V.; Chilamkurti, N.; Malathi, D.; Senthilselvan, N. An ontology-driven personalized food recommendation in IoT-based healthcare system. J. Supercomput. 2019, 75, 3184–3216. [Google Scholar] [CrossRef]
- Alkahtani, M.; Choudhary, A.; De, A.; Harding, J.A.; Harding, J. A decision support system based on ontology and data mining to improve design using warranty data. Comput. Ind. Eng. 2019, 128, 1027–1039. [Google Scholar] [CrossRef] [Green Version]
- Sermet, Y.; Demir, I. Towards an information centric flood ontology for information management and communication. Earth Sci. Inform. 2019, 12, 541–551. [Google Scholar] [CrossRef]
- Wu, Z.; Shen, Y.; Wang, H.; Wu, M. An ontology-based framework for heterogeneous data management and its application for urban flood disasters. Earth Sci. Inform. 2020, 13, 377–390. [Google Scholar] [CrossRef]
- Lin, C.-H.; Wang, S.; Chia, C.-; Wu, C.-M.; Huang, C.-M. Temperature Variation Tolerance High Resolution Real-time Liquid Level Monitoring System. In Proceedings of the 2018 IEEE 8th International Conference on Consumer Electronics—Berlin (ICCE-Berlin), Berlin, Germany, 2–5 September 2018; pp. 1–6. [Google Scholar]
- See, C.H.; Horoshenkov, K.V.; Abd-Alhmeed, R.; Hu, Y.F.; Tait, S. A Low Power Wireless Sensor Network for Gully Pot Monitoring in Urban Catchments. IEEE Sens. J. 2011, 12, 1545–1553. [Google Scholar] [CrossRef] [Green Version]
- Atojoko, A.; Jan, N.; Elmgri, F.; Abd-Alhameed, R.A.; See, C.H.; Noras, J.M. Energy efficient gully pot monitoring system using radio frequency identification (RFID). In Proceedings of the 2013 Loughborough Antennas & Propagation Conference (LAPC), Loughborough, UK, 11–12 November 2013; pp. 333–336. [Google Scholar]
- Sunkpho, J.; Ootamakorn, C. Real-time flood monitoring and warning system. Songklanakarin J. Sci. Technol. 2011, 33, 227–235. [Google Scholar]
- Scheuer, S.; Haase, D.; Meyer, V. Towards a flood risk assessment ontology—Knowledge integration into a multi-criteria risk assessment approach. Comput. Environ. Urban Syst. 2013, 37, 82–94. [Google Scholar] [CrossRef]
- Bischke, B.; Bhardwaj, P.; Gautam, A.; Helber, P.; Borth, D.; Dengel, A. Detection of Flooding Events in Social Multimedia and Satellite Imagery Using Deep Neural Networks. In Proceedings of the Working Notes Proceedings of the MediaEval 2017, Dublin, Ireland, 13–15 September 2017. [Google Scholar]
- Tamaazousti, Y.; Le Borgne, H.; Hudelot, C. Diverse Concept-Level Features for Multi-Object Classification. In Proceedings of the 2016 ACM on Internet Measurement Conference—IMC ’16, Santa Monica, CA, USA, 14–16 November 2016; Association for Computing Machinery (ACM): New York, NY, USA, 2016; pp. 63–70. [Google Scholar]
- Ginsca, A.; Popescu, A.; Le Borgne, H.; Ballas, N.; Vo, P.; Kanellos, I. Large-Scale Image Mining with Flickr Groups. In Lecture Notes in Computer Science; Springer Science and Business Media LLC: Cham, Switzerland, 2015; Volume 8935, pp. 318–334. [Google Scholar]
- Torresani, L.; Szummer, M.; FitzGibbon, A. Efficient Object Category Recognition Using Classemes. In Static Analysis; Springer Science and Business Media LLC: Cham, Switzerland, 2010; pp. 776–789. [Google Scholar]
- Xiong, Z.; Zheng, J.; Song, D.; Zhong, S.; Huang, Q. Passenger Flow Prediction of Urban Rail Transit Based on Deep Learning Methods. Smart Cities 2019, 2, 371–387. [Google Scholar] [CrossRef] [Green Version]
- Boutell, M.R.; Luo, J.; Shen, X.; Brown, C.M. Learning multi-label scene classification. Pattern Recogn. 2004, 37, 1757–1771. [Google Scholar] [CrossRef] [Green Version]
- Cheng, G.; Han, J.; Zhou, P.; Guo, L. Multi-class geospatial object detection and geographic image classification based on collection of part detectors. ISPRS J. Photogramm. Remote Sens. 2014, 98, 119–132. [Google Scholar] [CrossRef]
- Li, L.-J.; Su, H.; Lim, Y.; Fei-Fei, L. Objects as Attributes for Scene Classification. In Lecture Notes in Computer Science; Springer: Berlin/Heidelberg, Germany, 2012; pp. 57–69. [Google Scholar]
- Teichmann, M.; Weber, M.; Zollner, M.; Cipolla, R.; Urtasun, R. MultiNet: Real-time Joint Semantic Reasoning for Autonomous Driving. In Proceedings of the 2018 IEEE Intelligent Vehicles Symposium (IV), Changshu, China, 26–30 June 2018; pp. 1013–1020. [Google Scholar]
- Manzoor, U.; Balubaid, M.A.; Zafar, B.; Umar, H.; Khan, M.S. Semantic Image Retrieval: An Ontology Based Approach. Int. J. Adv. Res. Artif. Intell. 2015, 4. [Google Scholar] [CrossRef]
- Jiang, S.; Huang, T.; Gao, W. An Ontology-based Approach to Retrieve Digitized Art Images. In Proceedings of the IEEE/WIC/ACM International Conference on Web Intelligence (WI’04), Beijing, China, 20–24 September 2004; pp. 131–137. [Google Scholar]
- Abdullatif, A.; Masulli, F.; Rovetta, S. Clustering of nonstationary data streams: A survey of fuzzy partitional methods. Wiley Interdiscip. Rev. Data Min. Knowl. Discov. 2018, 8, e1258. [Google Scholar] [CrossRef] [Green Version]
- Ai, Q.; Azizi, V.; Chen, X.; Zhang, Y. Learning Heterogeneous Knowledge Base Embeddings for Explainable Recommendation. Algorithms 2018, 11, 137. [Google Scholar] [CrossRef] [Green Version]
- Holzinger, A. From Machine Learning to Explainable AI. In Proceedings of the 2018 World Symposium on Digital Intelligence for Systems and Machines (DISA), Kosice, Slovakia, 23–25 August 2018; pp. 55–66. [Google Scholar]
- Preece, A.; Braines, D.; Cerutti, F.; Pham, T. Explainable AI for Intelligence Augmentation in Multi-Domain Operations. arXiv 2019, arXiv:1910.07563v1, 1–7. [Google Scholar]
- Spinner, T.; Schlegel, U.; Schafer, H.; El-Assady, M. explAIner: A Visual Analytics Framework for Interactive and Explainable Machine Learning. IEEE Trans. Vis. Comput. Graph. 2019, 26, 1. [Google Scholar] [CrossRef] [Green Version]
- Vasquez-Morales, G.R.; Martinez-Monterrubio, S.M.; Moreno-Ger, P.; Recio-Garcia, J.A. Explainable Prediction of Chronic Renal Disease in the Colombian Population Using Neural Networks and Case-Based Reasoning. IEEE Access 2019, 7, 152900–152910. [Google Scholar] [CrossRef]
- Holzinger, A.; Biemann, C.; Pattichis, M.; Currin, A. What do we need to build explainable AI systems for the medical domain? arXiv 2017, arXiv:1712.09923, 1–28. [Google Scholar]
- Holzinger, A.; Kieseberg, P.; Weippl, E.R.; Tjoa, A.M. Current Advances, Trends and Challenges of Machine Learning and Knowledge Extraction: From Machine Learning to Explainable AI. In Intelligent Tutoring Systems; Springer Science and Business Media LLC: Cham, Switzerland, 2018; pp. 1–8. [Google Scholar]
- Wang, D.; Yang, Q.; Abdul, A.; Lim, B.Y. Designing Theory-Driven User-Centric Explainable AI. In Proceedings of the 2019 CHI Conference on Human Factors in Computing Systems—CHI ’19, Glasgow, UK, 4–9 May 2019; Association for Computing Machinery (ACM); pp. 1–15. [Google Scholar]
- Amarasinghe, K.; Kenney, K.; Manic, M. Toward Explainable Deep Neural Network Based Anomaly Detection. In Proceedings of the 2018 11th International Conference on Human System Interaction (HSI), Gdansk, Poland, 4–6 July 2018; pp. 311–317. [Google Scholar]
- Alonso, J.M.; Mencar, C. Building Cognitive Cities with Explainable Artificial Intelligent Systems. 2018. In Proceedings of the First International Workshop on Comprehensibility and Explanation in AI and ML 2017 co-Located with 16th International Conference of the Italian Association for Artificial Intelligence (AI*IA 2017), Bari, Italy, 16–17 November 2017; Published on CEUR-WS: 11-Mar-2018. Available online: http://ceur-ws.org/Vol-2071/CExAIIA_2017_paper_1.pdf (accessed on 1 November 2020).
- Lee, H.; Kwon, H. Going Deeper With Contextual CNN for Hyperspectral Image Classification. IEEE Trans. Image Process. 2017, 26, 4843–4855. [Google Scholar] [CrossRef] [Green Version]
- Gebrehiwot, A.; Hashemi-Beni, L.; Thompson, G.; Kordjamshidi, P.; Langan, T.E. Deep Convolutional Neural Network for Flood Extent Mapping Using Unmanned Aerial Vehicles Data. Sensors 2019, 19, 1486. [Google Scholar] [CrossRef] [Green Version]
- Rawat, W.; Wang, Z. Deep Convolutional Neural Networks for Image Classification: A Comprehensive Review. Neural Comput. 2017, 29, 2352–2449. [Google Scholar] [CrossRef] [PubMed]
- Murugan, P. Implementation of Deep Convolutional Neural Network in Multi-class Categorical Image Classification. arXiv 2018, arXiv:1801.01397. [Google Scholar]
- Chen, Y.; Jiang, H.; Li, C.; Jia, X.; Ghamisi, P. Deep Feature Extraction and Classification of Hyperspectral Images Based on Convolutional Neural Networks. IEEE Trans. Geosci. Remote Sens. 2016, 54, 6232–6251. [Google Scholar] [CrossRef] [Green Version]
- Zhang, C.; Sargent, I.; Pan, X.; Li, H.; Gardiner, A.; Hare, J.; Atkinson, P.M. An object-based convolutional neural network (OCNN) for urban land use classification. Remote Sens. Environ. 2018, 216, 57–70. [Google Scholar] [CrossRef] [Green Version]
- Shorten, C.; Khoshgoftaar, T.M. A survey on Image Data Augmentation for Deep Learning. J. Big Data 2019, 6, 60. [Google Scholar] [CrossRef]
- Taylor, L.; Nitschke, G. Improving Deep Learning with Generic Data Augmentation. In Proceedings of the 2018 IEEE Symposium Series on Computational Intelligence (SSCI), Bangalore, India, 18–21 November 2018; Volume 1708, pp. 1542–1547. [Google Scholar]
- Inoue, H. Data Augmentation by Pairing Samples for Images Classification. arXiv 2018, arXiv:1801.02929. [Google Scholar]
- Cubuk, E.D.; Zoph, B.; Mane, D.; Vasudevan, V.; Le, Q.V. AutoAugment: Learning Augmentation Strategies From Data. In Proceedings of the 2019 IEEE/CVF Conference on Computer Vision and Pattern Recognition (CVPR), Long Beach, CA, USA, 15–20 June 2019; pp. 113–123. [Google Scholar]
- D’Aniello, G.; Gaeta, M.; Orciuoli, F. An approach based on semantic stream reasoning to support decision processes in smart cities. Telemat. Inform. 2018, 35, 68–81. [Google Scholar] [CrossRef]
- Gyrard, A.; Serrano, M. A Unified Semantic Engine for Internet of Things and Smart Cities: From Sensor Data to End-Users Applications. In Proceedings of the 2015 IEEE International Conference on Data Science and Data Intensive Systems, Sydney, NSW, Australia, 11–13 December 2015; pp. 718–725. [Google Scholar]
- Ali, S.; Wang, G.; Fatima, K.; Liu, P. Semantic Knowledge Based Graph Model in Smart Cities. In Communications in Computer and Information Science; Springer Science and Business Media LLC: Cham, Switzerland, 2019; pp. 268–278. [Google Scholar]
- Zhang, N.; Chen, J.; Chen, X.; Chen, J. Semantic Framework of Internet of Things for Smart Cities: Case Studies. Sensors 2016, 16, 1501. [Google Scholar] [CrossRef]
- Bizer, C.; Heath, T.; Berners-Lee, T. Linked data: The story so far. In Semantic Services, Interoperability and Web Applications: Emerging Concepts; IGI Global: Hershey, PA, USA, 2011; pp. 205–227. [Google Scholar]
- Abid, T.; Laouar, M.R. Using Semantic Web and Linked Data for Integrating and Publishing Data in Smart Cities. In Proceedings of the 7th International Conference on Software Engineering and New Technologies, Hammamet, Tunisie, 26–28 December 2018; pp. 1–4, ISBN 978-1-4503-6101-9. [Google Scholar]
- Petrolo, R.; Loscrí, V.; Mitton, N. Towards a smart city based on cloud of things, a survey on the smart city vision and paradigms. Trans. Emerg. Telecommun. Technol. 2015, 28, e2931. [Google Scholar] [CrossRef] [Green Version]
- Kamilaris, A.; Gao, F.; Prenafeta-Boldu, F.X.; Ali, M.I. Agri-IoT: A semantic framework for Internet of Things-enabled smart farming applications. In Proceedings of the 2016 IEEE 3rd World Forum on Internet of Things (WF-IoT), Reston, VA, USA, 12–14 December 2016; pp. 442–447. [Google Scholar]
- Guo, K.; Lu, Y.; Gao, H.; Cao, R. Artificial Intelligence-Based Semantic Internet of Things in a User-Centric Smart City. Sensors 2018, 18, 1341. [Google Scholar] [CrossRef] [PubMed] [Green Version]
- Jacob, E.K. Ontologies and the Semantic Web. Bull. Am. Soc. Inf. Sci. Technol. 2005, 29, 19–22. [Google Scholar] [CrossRef]
- Keeling, M.; Dirks, S. A Vision of Smarter Cities; IBM Institute for Business Value: Cambridge, MA, USA, 2009. [Google Scholar]
- Gyrard, A.; Zimmermann, A.; Sheth, A. Building IoT-Based Applications for Smart Cities: How Can Ontology Catalogs Help? IEEE Internet Things J. 2018, 5, 3978–3990. [Google Scholar] [CrossRef] [Green Version]
- Saba, D.; Sahli, Y.; Abanda, F.H.; Maouedj, R.; Tidjar, B. Development of new ontological solution for an energy intelligent management in Adrar city. Sust. Comput. Inform. Syst. 2019, 21, 189–203. [Google Scholar] [CrossRef]
- Costin, A.; Eastman, C. Need for Interoperability to Enable Seamless Information Exchanges in Smart and Sustainable Urban Systems. J. Comput. Civ. Eng. 2019, 33, 04019008. [Google Scholar] [CrossRef]
- Rueda, C.; Galbraith, N.; Morris, R.A.; Bermudez, L.E.; Arko, R.A.; Graybeal, J. The MMI device ontology: Enabling sensor integration. In Proceedings of the AGU Fall Meeting Abstracts, San Francisco, CA, USA, 13–17 December 2010; p. 8. [Google Scholar]
- Vakali, A.; Anthopoulos, L.; Krčo, S. Smart Cities Data Streams Integration: Experimenting with Internet of Things and social data flows. In Proceedings of the 4th International Conference on Web Intelligence, Mining and Semantics (WIMS14), Thessaloniki, Greece, 2–4 June 2014; pp. 1–5. [Google Scholar] [CrossRef]
- Viktorović, M.; Yang, D.; De Vries, B.; Baken, N. Semantic web technologies as enablers for truly connected mobility within smart cities. Proc. Comput. Sci. 2019, 151, 31–36. [Google Scholar] [CrossRef]
- Balakrishna, S.; Thirumaran, M. Semantic Interoperable Traffic Management Framework for IoT Smart City Applications. EAI Endorsed Trans. Internet Things 2018, 4, 1–18. [Google Scholar] [CrossRef]
- Calavia, L.; Baladrón, C.; Aguiar, J.M.; Carro, B.; Sánchez-Esguevillas, A. A Semantic Autonomous Video Surveillance System for Dense Camera Networks in Smart Cities. Sensors 2012, 12, 10407–10429. [Google Scholar] [CrossRef]
- De Nicola, A.; Melchiori, M.; Villani, M.L. Creative design of emergency management scenarios driven by semantics: An application to smart cities. Inf. Syst. 2019, 81, 21–48. [Google Scholar] [CrossRef]
- Zheng, Y.; Chen, X.; Jin, Q.; Chen, Y.; Qu, X.; Liu, X.; Chang, E.; Ma, W.Y.; Rui, Y.; Sun, W. A Cloud-Based Knowledge Discovery System for Monitoring Fine-Grained Air Quality. MSR-TR-2014–40 Tech. Rep 2014. Available online: https://www.microsoft.com/en-us/research/wp-content/uploads/2016/02/UAir20Demo.pdf (accessed on 1 November 2020).
- Bellini, P.; Benigni, M.; Billero, R.; Nesi, P.; Rauch, N. Km4City ontology building vs data harvesting and cleaning for smart-city services. J. Vis. Lang. Comput. 2014, 25, 827–839. [Google Scholar] [CrossRef] [Green Version]
- Shang, J.; Zheng, Y.; Tong, W.; Chang, E.; Yu, Y. Inferring gas consumption and pollution emission of vehicles throughout a city. In Proceedings of the 20th ACM SIGKDD International Conference on Knowledge Discovery and Data Mining—KDD ’14, New York, NY, USA, 24–27 August 2014; pp. 1027–1036. [Google Scholar] [CrossRef]
- Choi, C.; Esposito, C.; Wang, H.; Liu, Z.; Choi, J. Intelligent Power Equipment Management Based on Distributed Context-Aware Inference in Smart Cities. IEEE Commun. Mag. 2018, 56, 212–217. [Google Scholar] [CrossRef]
- Howell, S.; Rezgui, Y.; Beach, T.H. Integrating building and urban semantics to empower smart water solutions. Autom. Constr. 2017, 81, 434–448. [Google Scholar] [CrossRef]
- Soldatos, J.; Kefalakis, N.; Hauswirth, M.; Serrano, M.; Calbimonte, J.-P.; Riahi, M.; Aberer, K.; Jayaraman, P.P.; Zaslavsky, A.; Žarko, I.P.; et al. OpenIoT: Open Source Internet-of-Things in the Cloud. In The Semantic Web; Springer Science and Business Media LLC: Cham, Switzerland, 2015; pp. 13–25. [Google Scholar]
- Barnaghi, P.; Tönjes, R.; Höller, J.; Hauswirth, M.; Sheth, A.; Anantharam, P. CityPulse: Real-Time Iot Stream Processing and Large-Scale Data Analytics for Smart City Applications. In Europen Semantic Web Conference (ESWC). 2014. Available online: http://www.ict-citypulse.eu/doc/CityPulse_ExtendedAbstract_ESWC_EU.pdf (accessed on 1 November 2020).
- Petrolo, R.; Loscri, V.; Mitton, N. Towards a Cloud of Things Smart City. IEEE COMSOC MMTC E Lett. 2014, 9, 44–48. [Google Scholar]
- Lefrançois, J.; Ghariani, T.; Zimmermann, A. The SEAS Knowledge Model; Technical Report, ITEA2 12004 Smart Energy Aware Systems; ITEA: Eindhoven, The Netherlands, 2017. [Google Scholar]
- Seydoux, N.; Drira, K.; Hernandez, N.; Monteil, T. IoT-O, a Core-Domain IoT Ontology to Represent Connected Devices Networks. In Pattern Recognition and Computer Vision; Springer Science and Business Media LLC: Cham, Switzerland, 2016; pp. 561–576. [Google Scholar]
- Janowicz, K.; Haller, A.; Cox, S.; Le Phuoc, D.; Lefrancois, M. SOSA: A Lightweight Ontology for Sensors, Observations, Samples, and Actuators. SSRN Electron. J. 2018, 56, 1–10. [Google Scholar] [CrossRef] [Green Version]
- Llaves, A.; Corcho, O.; Taylor, P.; Taylor, K. Enabling RDF Stream Processing for Sensor Data Management in the Environmental Domain. Int. J. Semantic Web Inf. Syst. 2016, 12, 1–21. [Google Scholar] [CrossRef]
- Ploennigs, J.; Schumann, A.; Lécué, F. Adapting semantic sensor networks for smart building diagnosis. In International Semantic Web Conference; Springer: Cham, Switzerland, 2014; pp. 308–323. [Google Scholar]
- Dey, S.; Jaiswal, D.; Dasgupta, R.; Mukherjee, A. Organization and management of Semantic Sensor information using SSN ontology: An energy meter use case. In Proceedings of the 2015 9th International Conference on Sensing Technology (ICST), Auckland, New Zealand, 8–10 December 2015; pp. 468–473. [Google Scholar]
- Fernandez, S.; Ito, T. Using SSN Ontology for Automatic Traffic Light Settings on Inteligent Transportation Systems. In Proceedings of the 2016 IEEE International Conference on Agents (ICA), Matsue, Japan, 28–30 September 2016; pp. 106–107. [Google Scholar]
- Agresta, A.; Fattoruso, G.; Pollino, M.; Pasanisi, F.; Tebano, C.; De Vito, S.; Di Francia, G. An Ontology Framework for Flooding Forecasting. In Proceedings of the Lecture Notes in Computer Science; Springer Science and Business Media LLC: Cham, Switzerland, 2014; Volume 8582, pp. 417–428. [Google Scholar]
- Wang, C.; Chen, N.; Wang, W.; Chen, Z. A Hydrological Sensor Web Ontology Based on the SSN Ontology: A Case Study for a Flood. ISPRS Int. J. Geo Inform. 2017, 7, 2. [Google Scholar] [CrossRef] [Green Version]
- Ding, Y.; Zhu, Q.; Lin, H. An integrated virtual geographic environmental simulation framework: A case study of flood disaster simulation. Geo Spat. Inf. Sci. 2014, 17, 190–200. [Google Scholar] [CrossRef] [Green Version]
- Sun, J.; De Sousa, G.; Roussey, C.; Chanet, J.P.; Pinet, F.; Hou, K.M. Intelligent Flood Adaptive Context-aware System: How Wireless Sensors Adapt their Configuration based on Environmental Phenomenon Events. Sens. Transduc. 2016, 206, 68. [Google Scholar]
- Sinha, P.K.; Dutta, B. A Systematic Analysis of Flood Ontologies: A Parametric Approach. Knowl. Organ. 2020, 47, 138–159. [Google Scholar] [CrossRef]
- Ning, H.; Li, Z.; Hodgson, M.E.; Wang, C. Prototyping a Social Media Flooding Photo Screening System Based on Deep Learning. ISPRS Int. J. Geo Inform. 2020, 9, 104. [Google Scholar] [CrossRef] [Green Version]
- Sit, M.A.; Koylu, C.; Demir, I. Identifying disaster-related tweets and their semantic, spatial and temporal context using deep learning, natural language processing and spatial analysis: A case study of Hurricane Irma. Int. J. Digit. Earth 2019, 12, 1205–1229. [Google Scholar] [CrossRef]
- Burel, G.; Saif, H.; Alani, H. Semantic Wide and Deep Learning for Detecting Crisis-Information Categories on Social Media. In Proceedings of the Lecture Notes in Computer Science; Springer Science and Business Media LLC: Cham, Switzerland, 2017; Volume 10587, pp. 138–155. [Google Scholar]
- Sublime, J.; Kalinicheva, E. Automatic post-disaster damage mapping using deep-learning techniques for change detection: Case Study of the Tohoku Tsunami. Remote Sens. 2019, 11, 1123. [Google Scholar] [CrossRef] [Green Version]
- Cavaliere, D.; Saggese, A.; Senatore, S.; Vento, M.; Loia, V. Empowering UAV scene perception by semantic spatio-temporal features. In Proceedings of the 2018 IEEE International Conference on Environmental Engineering, Milan, Italy, 12–14 March 2018; pp. 1–6. [Google Scholar]
- Cretu, L.-G. Smart Cities Design using Event-driven Paradigm and Semantic Web. Inform. Econ. 2012, 16, 57–67. [Google Scholar]
- Abdulnabi, A.H.; Wang, G.; Lu, J.; Jia, K. Multi-Task CNN Model for Attribute Prediction. IEEE Trans. Multimedia 2015, 17, 1949–1959. [Google Scholar] [CrossRef] [Green Version]
- Perez, L.; Wang, J. The Effectiveness of Data Augmentation in Image Classification using Deep Learning. arXiv 2017, arXiv:1712.04621. [Google Scholar]
- Chen, Y.; Lin, Z.; Zhao, X.; Wang, G.; Gu, Y. Deep Learning-Based Classification of Hyperspectral Data. IEEE J. Sel. Top. Appl. Earth Obs. Remote Sens. 2014, 7, 2094–2107. [Google Scholar] [CrossRef]
- Ahmed, T.U.; Hossain, S.; Hossain, M.S.; Islam, R.U.; Andersson, K. Facial Expression Recognition using Convolutional Neural Network with Data Augmentation. In Proceedings of the 2019 Joint 8th International Conference on Informatics, Electronics & Vision (ICIEV) and 2019 3rd International Conference on Imaging, Vision & Pattern Recognition (icIVPR), Spokane, WA, USA, 30 May–2 June 2019; pp. 336–341. [Google Scholar]
- Ma, R.; Li, L.; Huang, W.; Tian, Q. On pixel count based crowd density estimation for visual surveillance. In Proceedings of the IEEE Conference on Cybernetics and Intelligent Systems, Singapore, 1–3 December 2004; Volume 1, pp. 170–173. [Google Scholar]
- Vandoni, J.; Aldea, E.; Le Hegarat-Mascle, S. Active learning for high-density crowd count regression. In Proceedings of the 2017 14th IEEE International Conference on Advanced Video and Signal Based Surveillance (AVSS), Lecce, Italy, 29 August–1 September 2017; pp. 1–6. [Google Scholar]
- Redmon, J.; Divvala, S.; Girshick, R.; Farhadi, A. You Only Look Once: Unified, Real-Time Object Detection. In Proceedings of the IEEE Conference on Computer Vision and Pattern Recognition (CVPR), Las Vegas, NV, USA, 27–30 June 2016; pp. 779–788. [Google Scholar]
- Zhang, C.; Li, H.; Wang, X.; Yang, X. Cross-scene crowd counting via deep convolutional neural networks. In Proceedings of the 2015 IEEE Conference on Computer Vision and Pattern Recognition (CVPR), Boston, MA, USA, 7–12 June 2015; pp. 833–841. [Google Scholar]
- Ide, H.; Kurita, T. Improvement of learning for CNN with ReLU activation by sparse regularization. In Proceedings of the 2017 International Joint Conference on Neural Networks (IJCNN), Anchorage, AK, USA, 14–19 May 2017; pp. 2684–2691. [Google Scholar]
- Hao, W.; Bie, R.; Guo, J.; Meng, X.; Wang, S. Optimized CNN Based Image Recognition Through Target Region Selection. Optik 2018, 156, 772–777. [Google Scholar] [CrossRef]
- Gómez-Ríos, A.; Tabik, S.; Luengo, J.; Shihavuddin, A.; Krawczyk, B.; Herrera, F. Towards highly accurate coral texture images classification using deep convolutional neural networks and data augmentation. Expert Syst. Appl. 2019, 118, 315–328. [Google Scholar] [CrossRef] [Green Version]
- Arrieta, A.B.; Díaz-Rodríguez, N.; Del Ser, J.; Bennetot, A.; Tabik, S.; Barbado, A.; Garcia, S.; Gil-Lopez, S.; Molina, D.; Benjamins, R.; et al. Explainable Artificial Intelligence (XAI): Concepts, taxonomies, opportunities and challenges toward responsible AI. Inf. Fusion 2020, 58, 82–115. [Google Scholar] [CrossRef] [Green Version]
- Wu, Y.; Zhang, Z.; Kou, G.; Zhang, H.; Chao, X.; Li, C.-C.; Dong, Y.; Herrera, F. Distributed linguistic representations in decision making: Taxonomy, key elements and applications, and challenges in data science and explainable artificial intelligence. Inf. Fusion 2021, 65, 165–178. [Google Scholar] [CrossRef]
- Alzetta, F.; Giorgini, P.; Najjar, A.; Schumacher, M.; Calvaresi, D. In-Time Explainability in Multi-Agent Systems: Challenges, Opportunities, and Roadmap. In Lecture Notes in Computer Science; Springer Science and Business Media LLC: Cham, Switzerland, 2020; pp. 39–53. [Google Scholar]
Figure 1.
Basic Flow of Flood Monitoring, with an example image of a drain blocked by leaves.

Figure 2.
Sample image for object: Leaves.

Figure 3.
Sample image for object: Mud.

Figure 4.
Sample image for Object: Plastic Bag and Bottle.

Figure 5.
Sample image for object: Restricted water flow.

Figure 6.
Conceptual flow diagram of Hybrid Image Classifier.

Figure 7.
(a,b). Leave Coverage within the image, indicating the same coverage, but with a different count of objects.
Figure 7.
(a,b). Leave Coverage within the image, indicating the same coverage, but with a different count of objects.

Figure 8.
Screenshot of “Image Annotation”.

Figure 9.
Sample Images of Different Coverage Level (a): Two, (b): One, (c): Two.

Figure 10.
Convolutional Neural Network (CNN) model (Leaves).

Figure 11.
Concept Map with the top-level concept related to Blockage.

Figure 12.
OWL ontology of drain and gully blockage.

Figure 13.
Sample of SWRL rule.

Figure 14.
Training and Validation plot of (a) Leaves, (b) Mud, (c) Plastic and Bottles and (d) Water.
Figure 14.
Training and Validation plot of (a) Leaves, (b) Mud, (c) Plastic and Bottles and (d) Water.

Figure 15.
(a–c). Sample of Image Classification (a) FB as FB (b) FB as PB (c) FB as NB. FB: “Fully Blocked”, PB: “Partially Blocked” and NB: “No Blockage”.
Figure 15.
(a–c). Sample of Image Classification (a) FB as FB (b) FB as PB (c) FB as NB. FB: “Fully Blocked”, PB: “Partially Blocked” and NB: “No Blockage”.

Figure 16.
Individual object coverage test accuracy and overall coverage detectors accuracy.

Figure 17.
Image classification accuracies comparison between “Machine Learning-Based Classifier” and “Hybrid Classifier (Machine Learning + Semantic). FB: “Fully Blocked”, PB: “Partially Blocked” and NB: “No Blockage”.
Figure 17.
Image classification accuracies comparison between “Machine Learning-Based Classifier” and “Hybrid Classifier (Machine Learning + Semantic). FB: “Fully Blocked”, PB: “Partially Blocked” and NB: “No Blockage”.

Figure 18.
Precision Plot of “Machine Learning-Based Classifier” and “Hybrid Classifier (Machine Learning + Semantic). FB: “Fully Blocked”, PB: “Partially Blocked” and NB: “No Blockage.
Figure 18.
Precision Plot of “Machine Learning-Based Classifier” and “Hybrid Classifier (Machine Learning + Semantic). FB: “Fully Blocked”, PB: “Partially Blocked” and NB: “No Blockage.

Figure 19.
Recall Plot of “Machine Learning-Based Classifier” and “Hybrid Classifier (Machine Learning + Semantic). FB: “Fully Blocked”, PB: “Partially Blocked” and NB: “No Blockage.
Figure 19.
Recall Plot of “Machine Learning-Based Classifier” and “Hybrid Classifier (Machine Learning + Semantic). FB: “Fully Blocked”, PB: “Partially Blocked” and NB: “No Blockage.

Figure 20.
F-Score plot of “Machine Learning-Based Classifier” and “Hybrid Classifier (Machine Learning + Semantic). FB: “Fully Blocked”, PB: “Partially Blocked” and NB: “No Blockage.
Figure 20.
F-Score plot of “Machine Learning-Based Classifier” and “Hybrid Classifier (Machine Learning + Semantic). FB: “Fully Blocked”, PB: “Partially Blocked” and NB: “No Blockage.


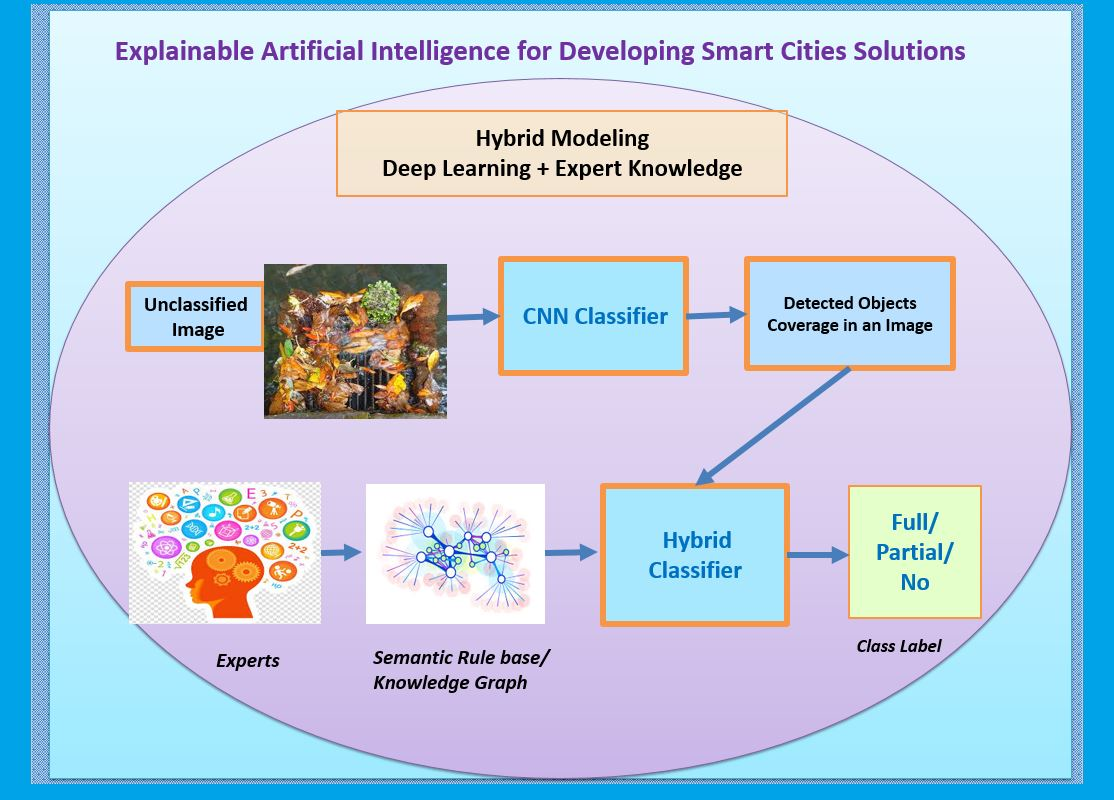
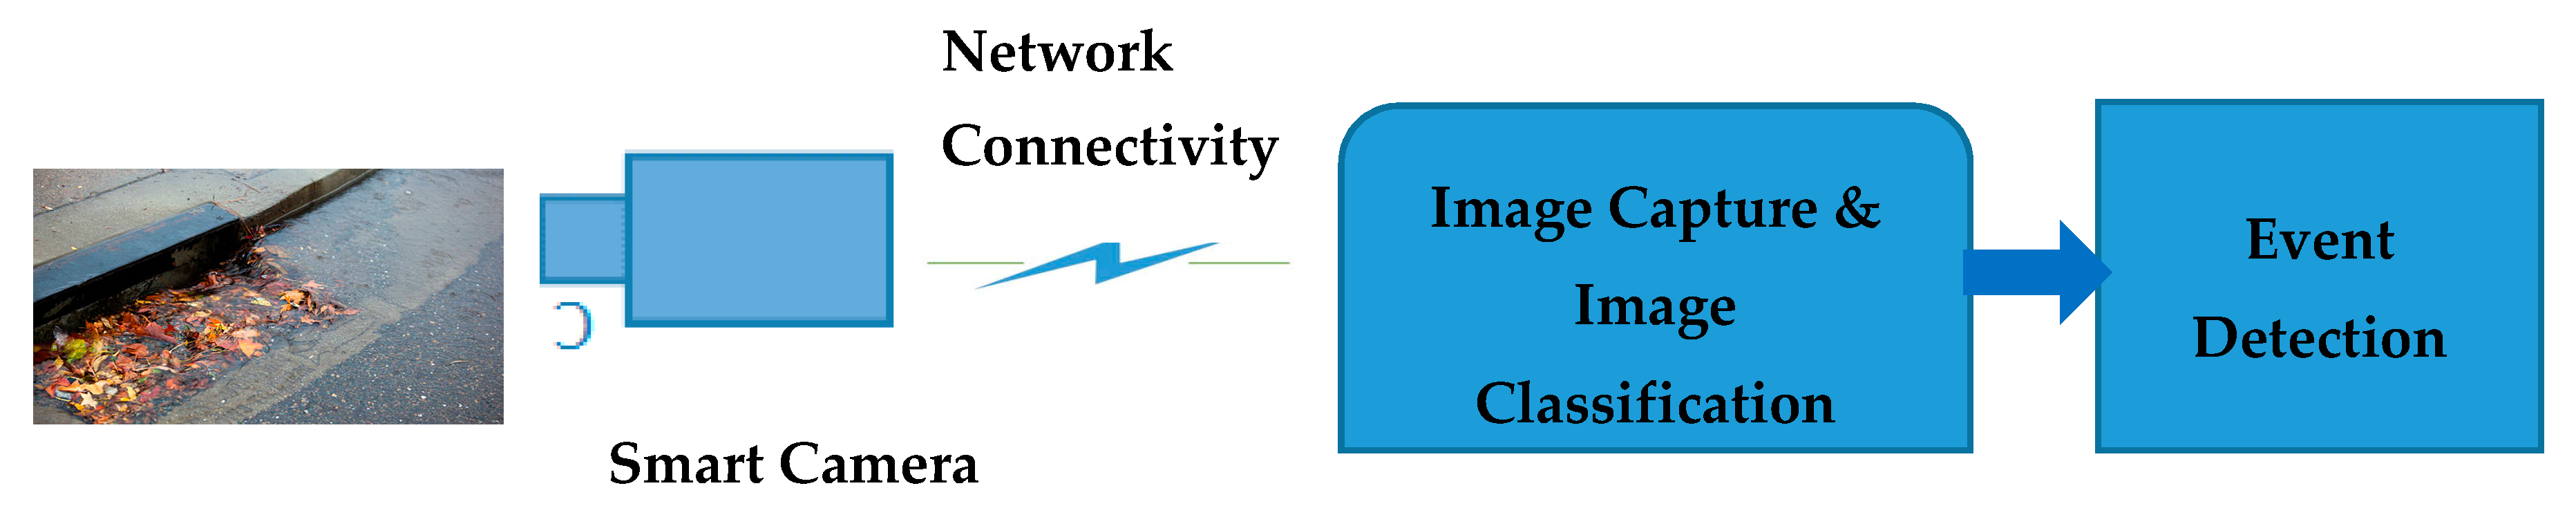
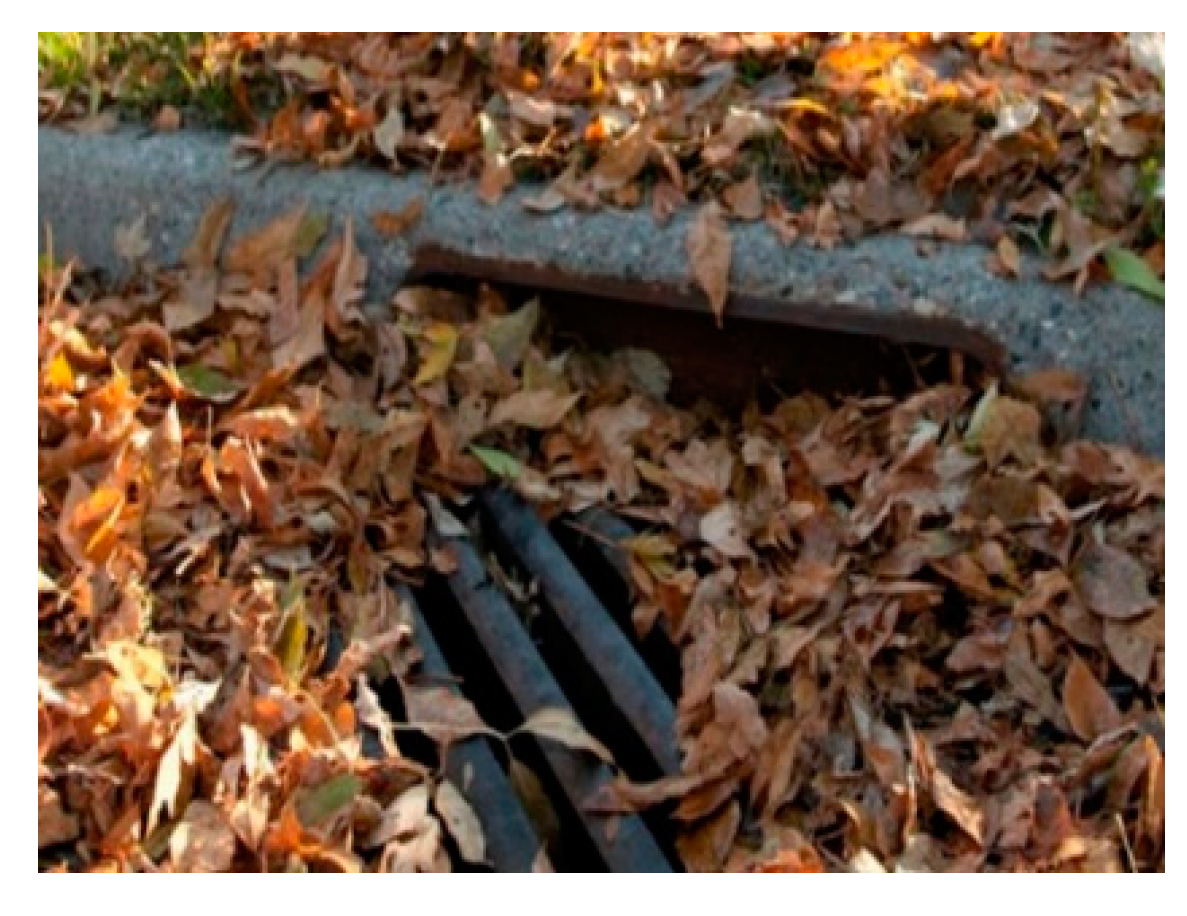
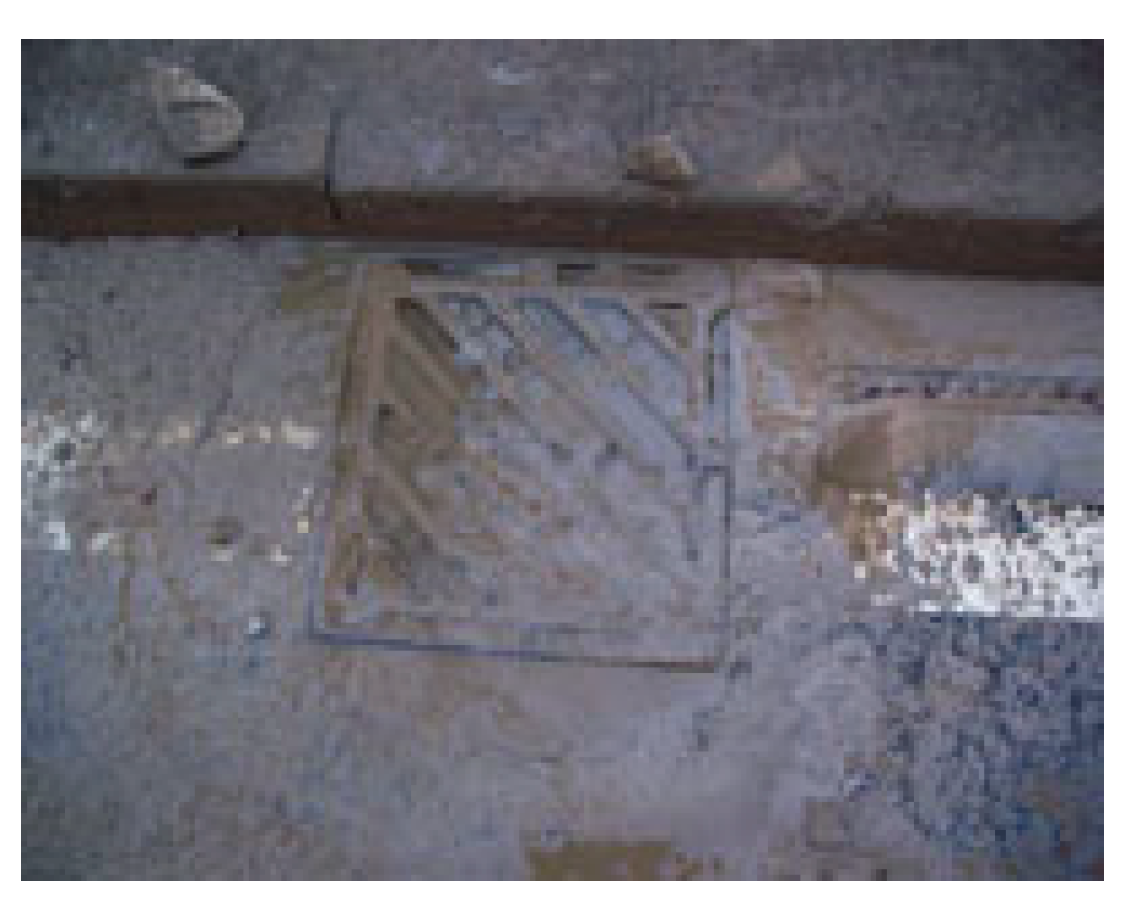
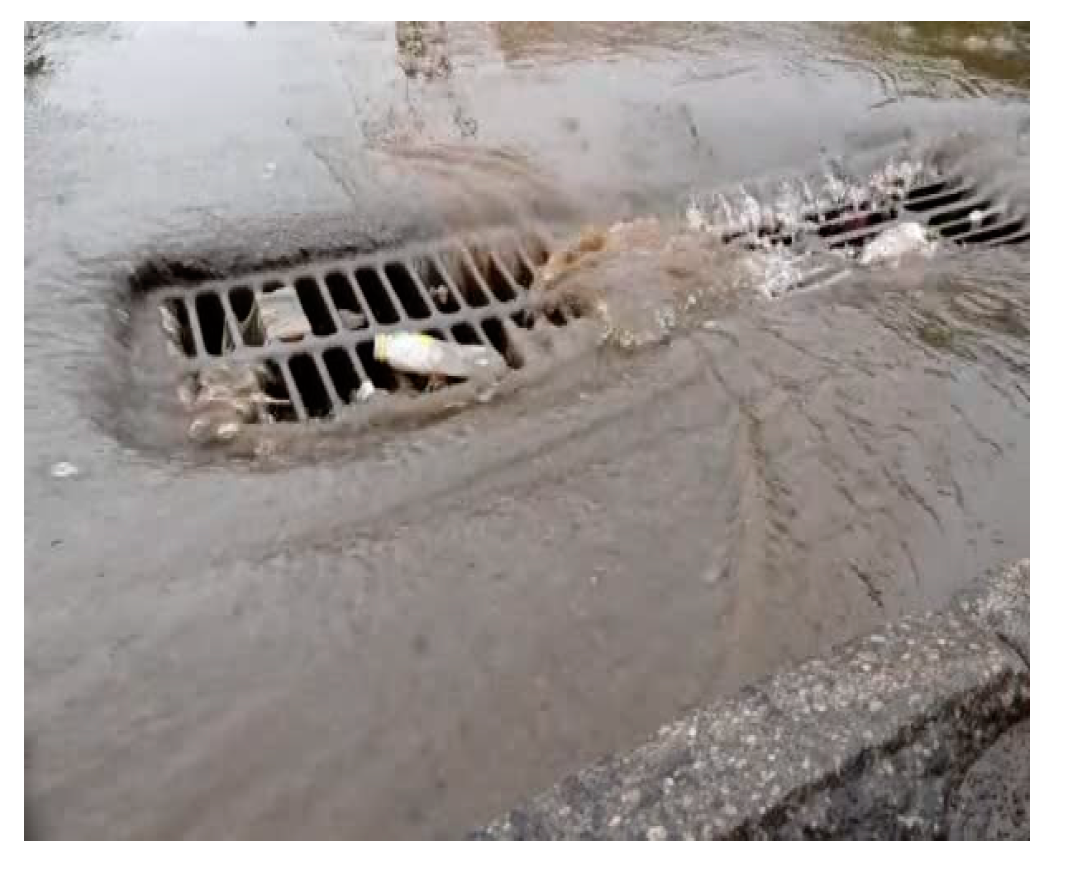
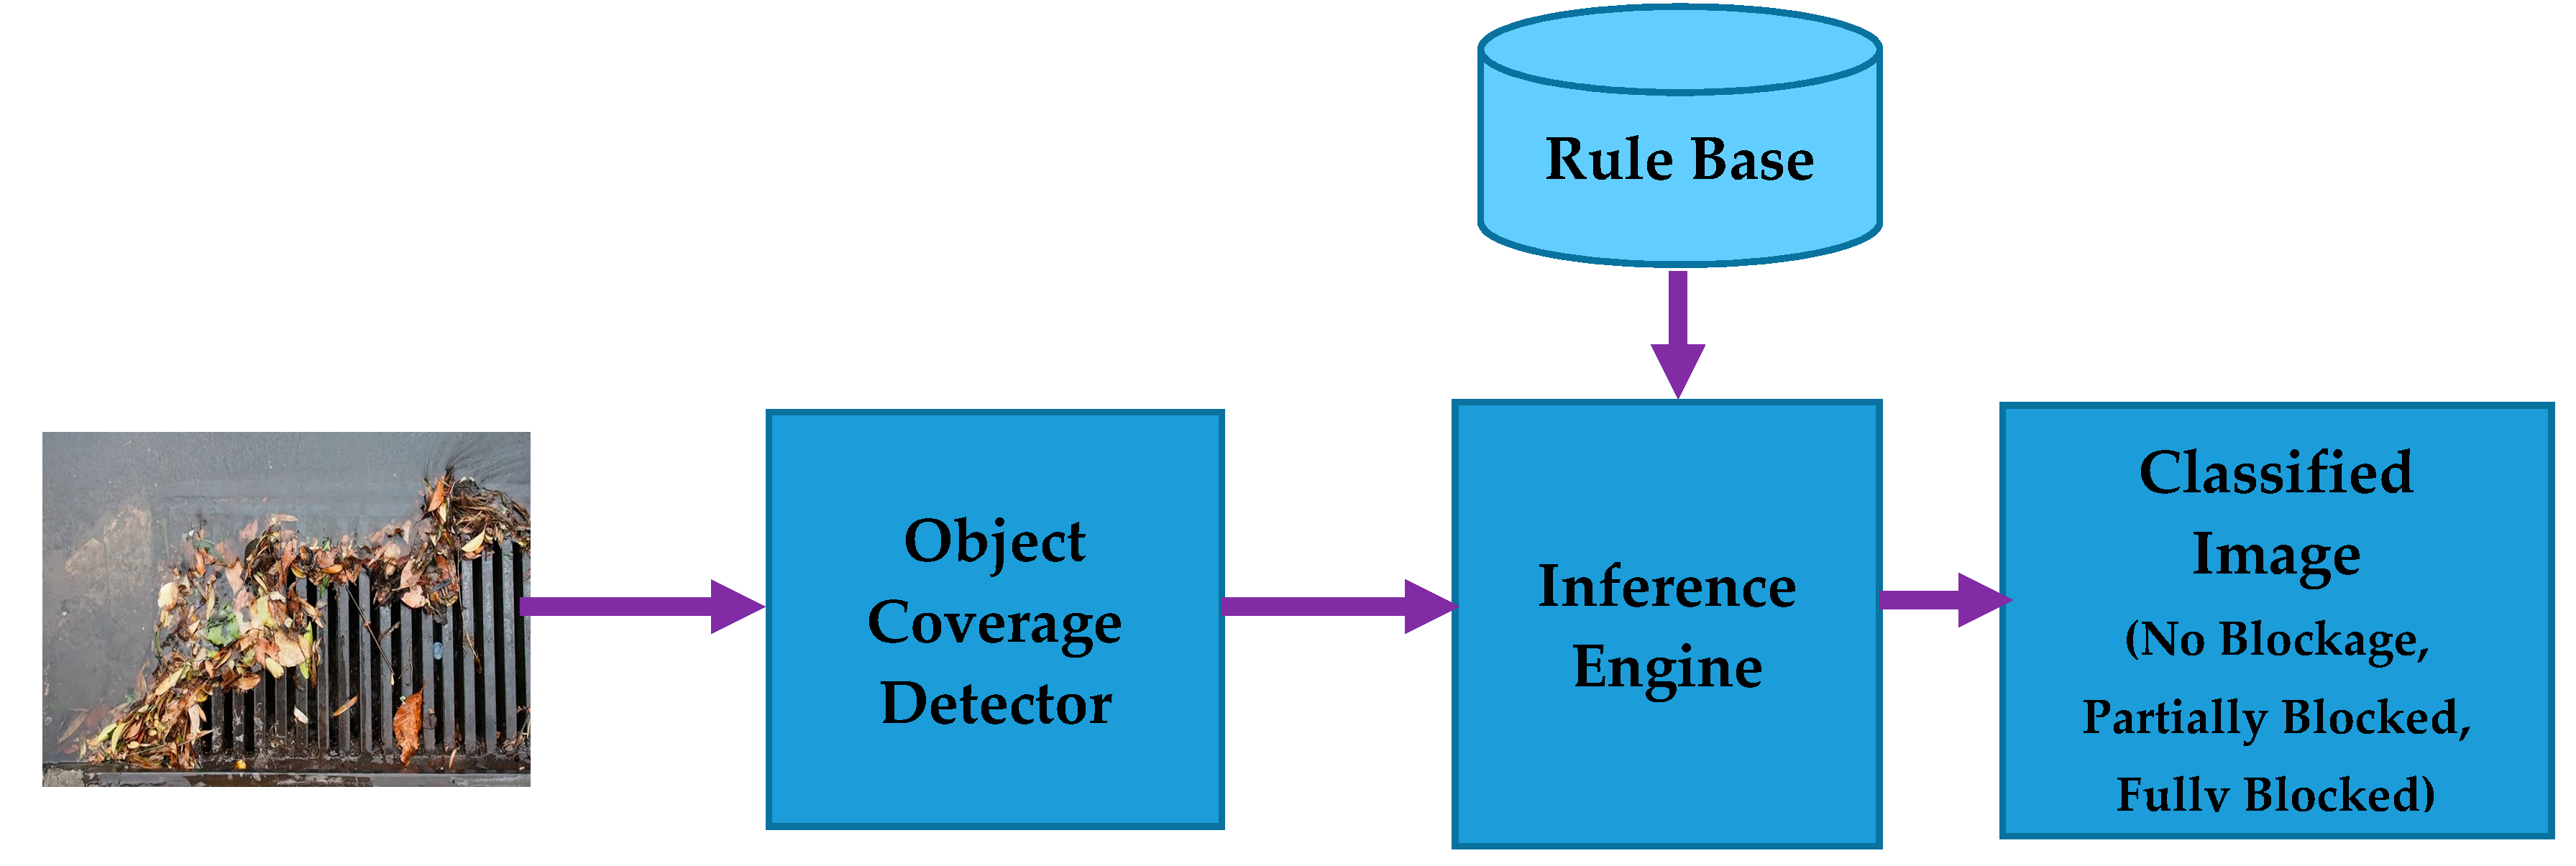
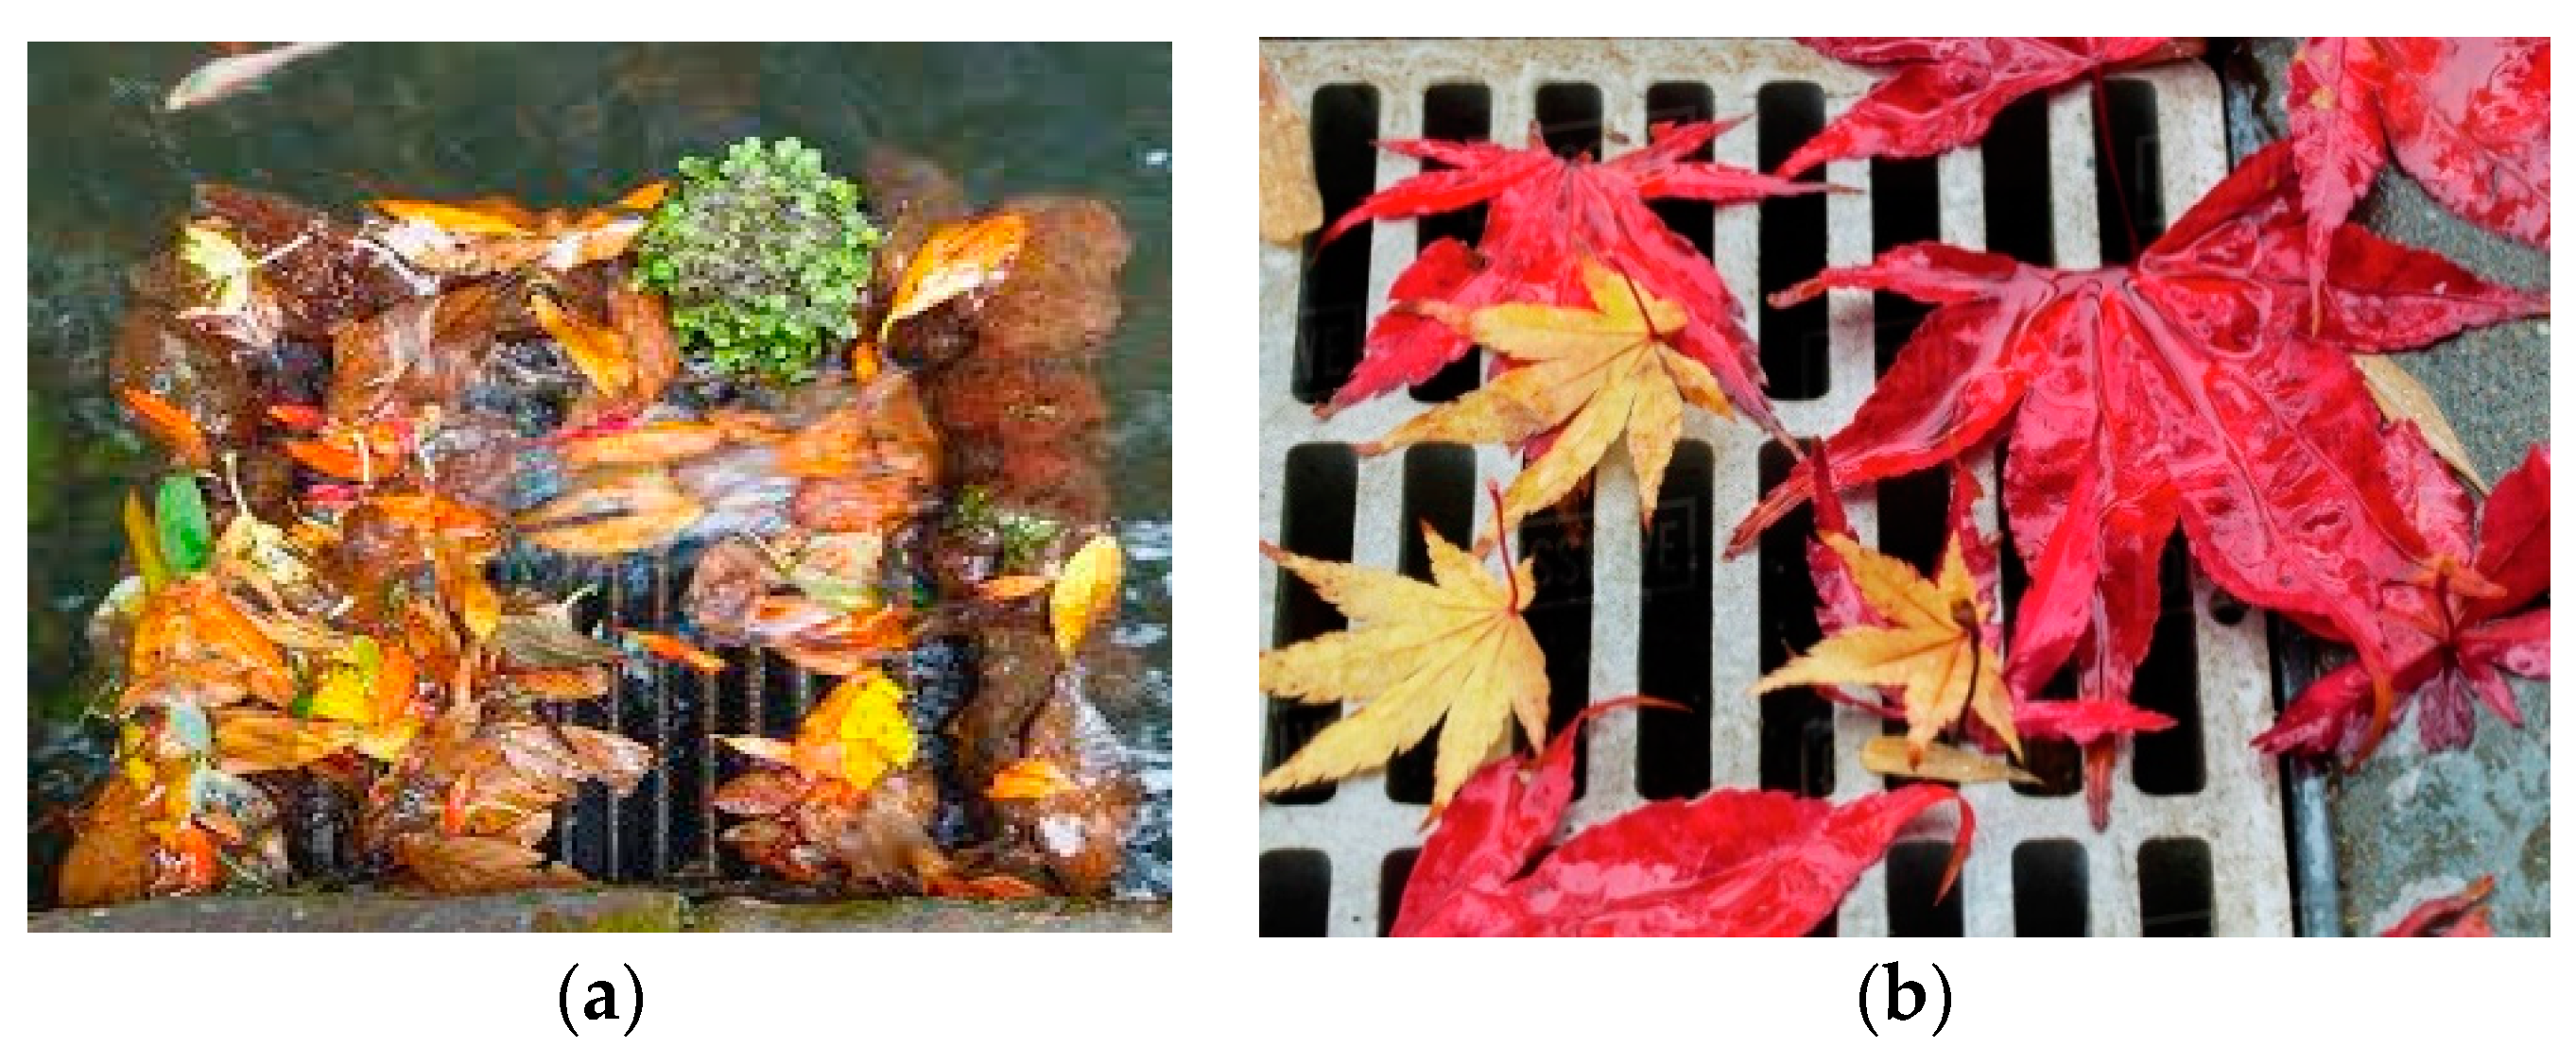
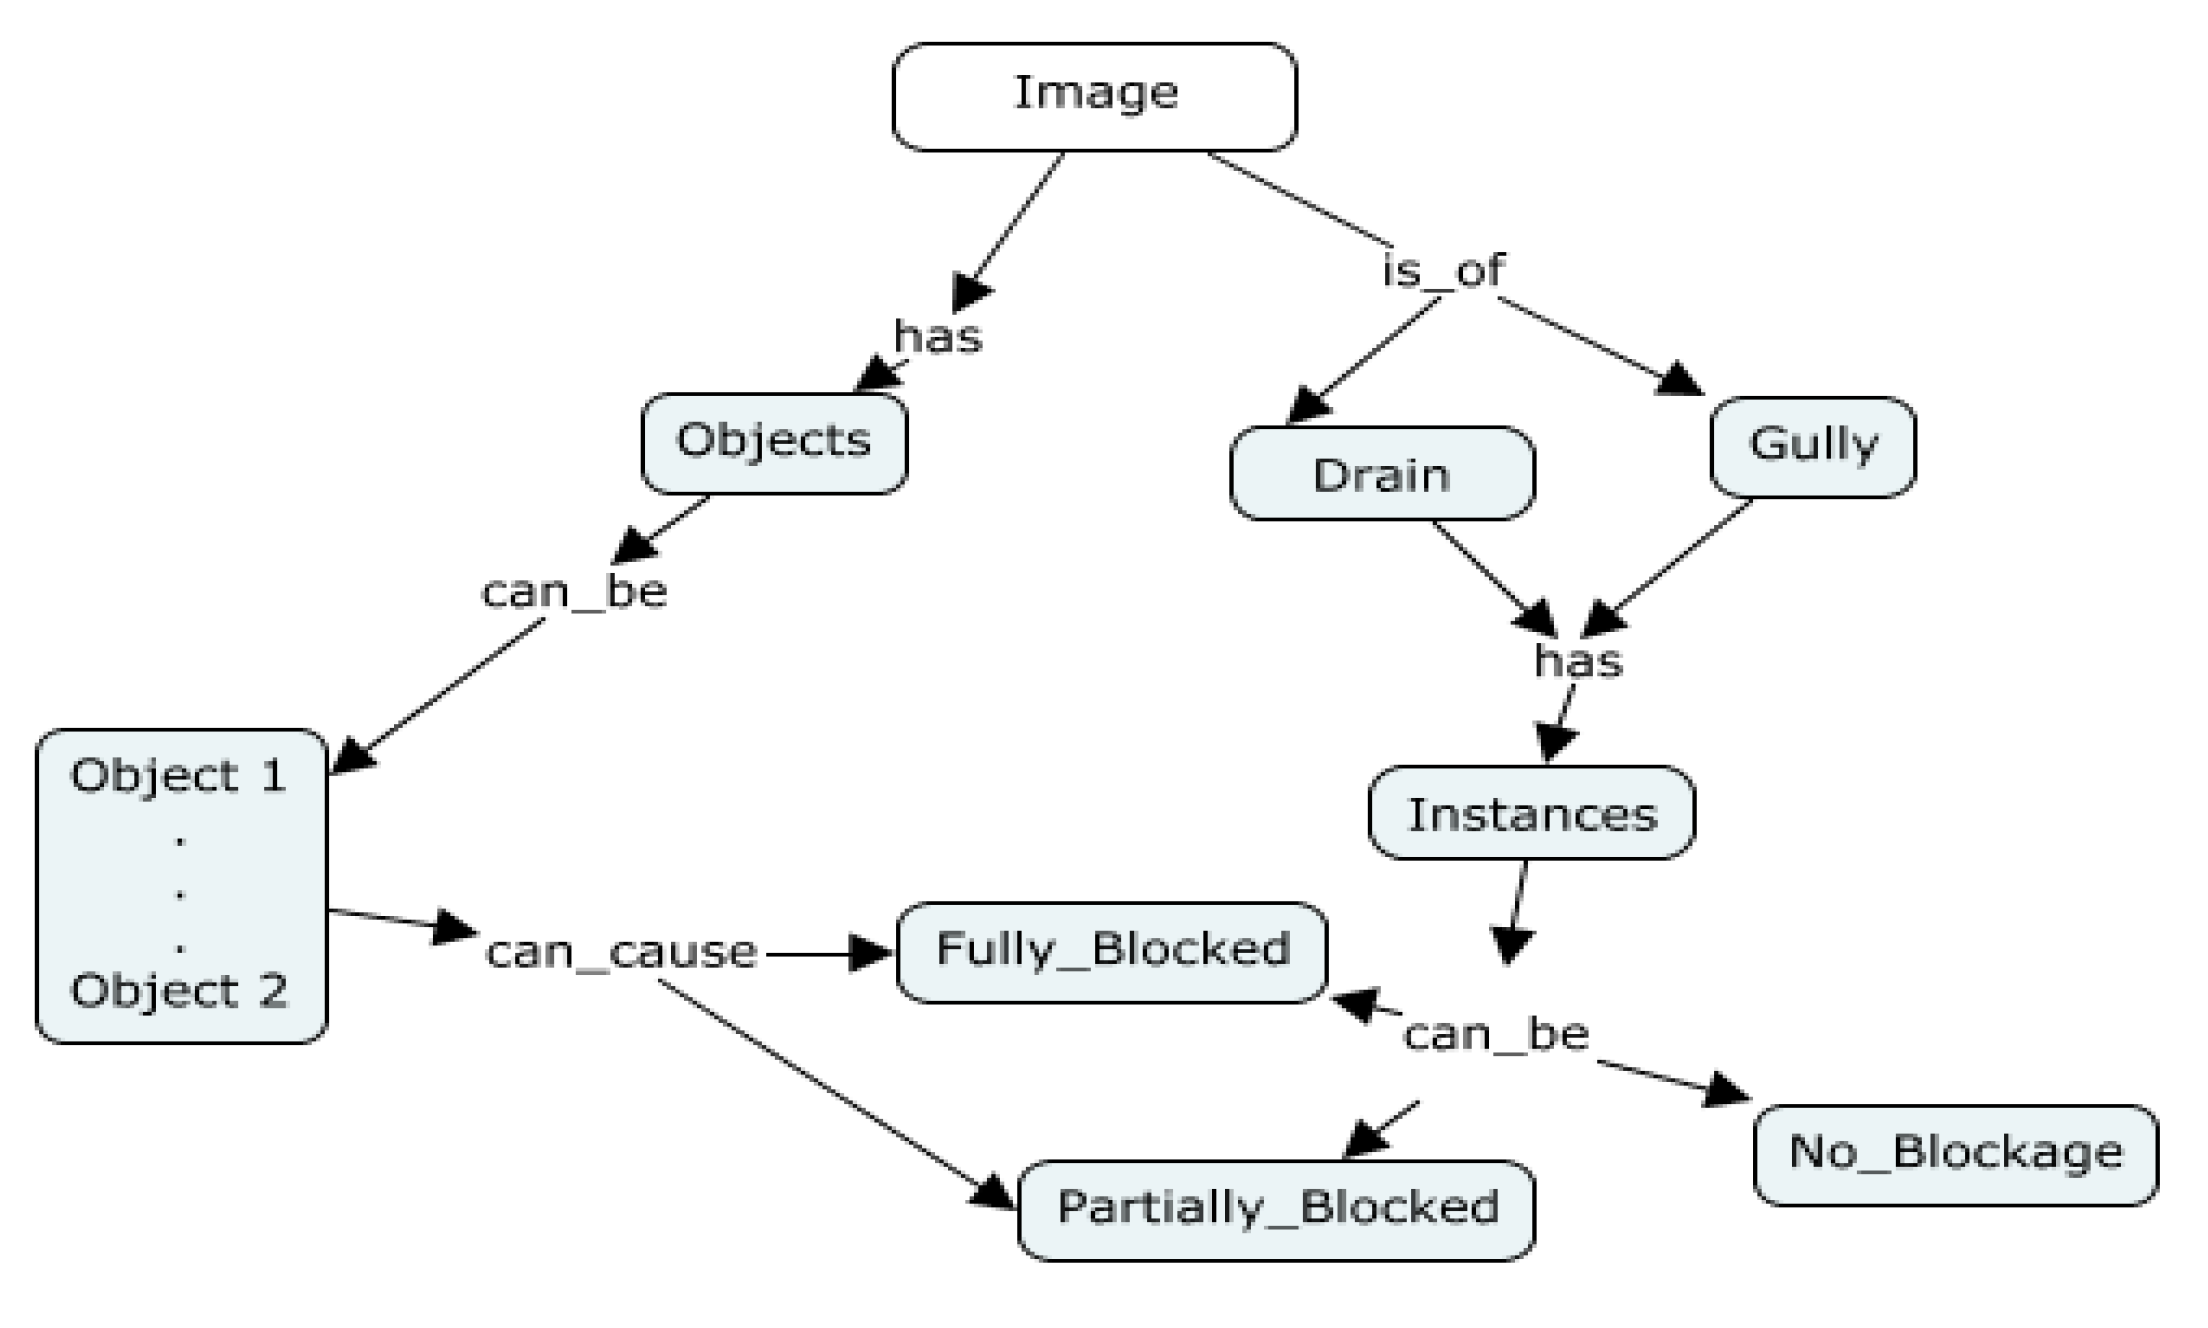
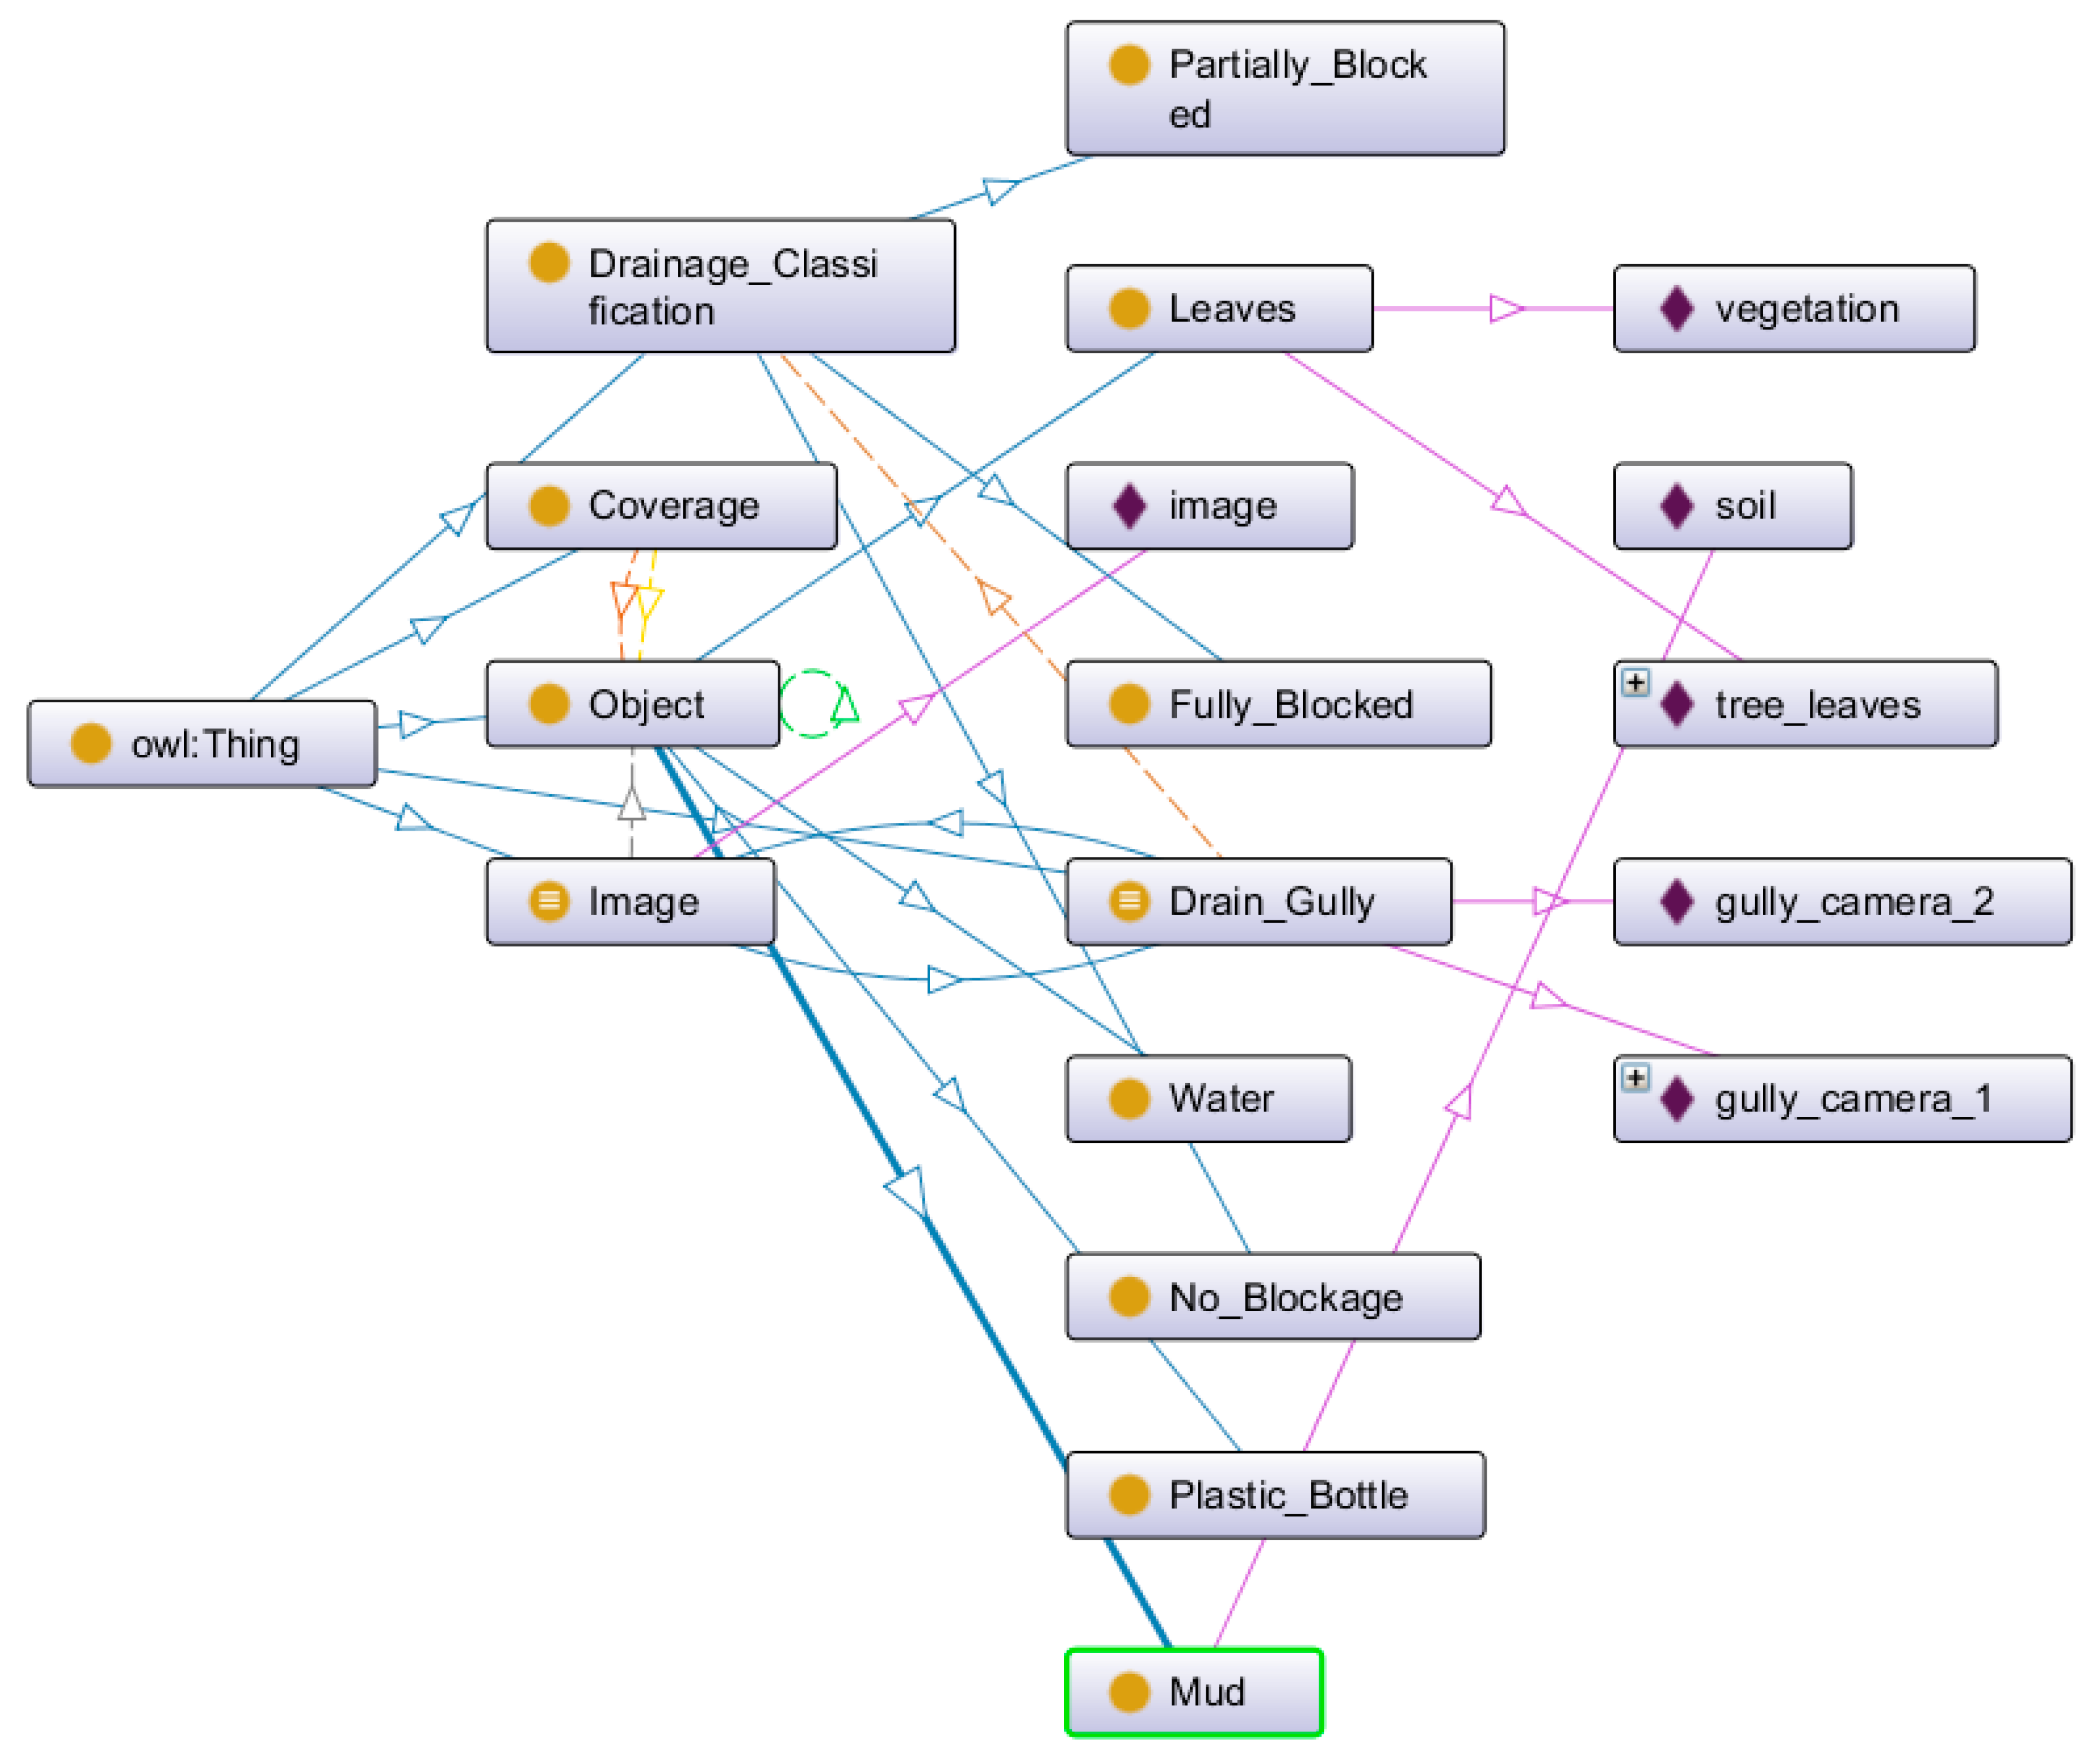
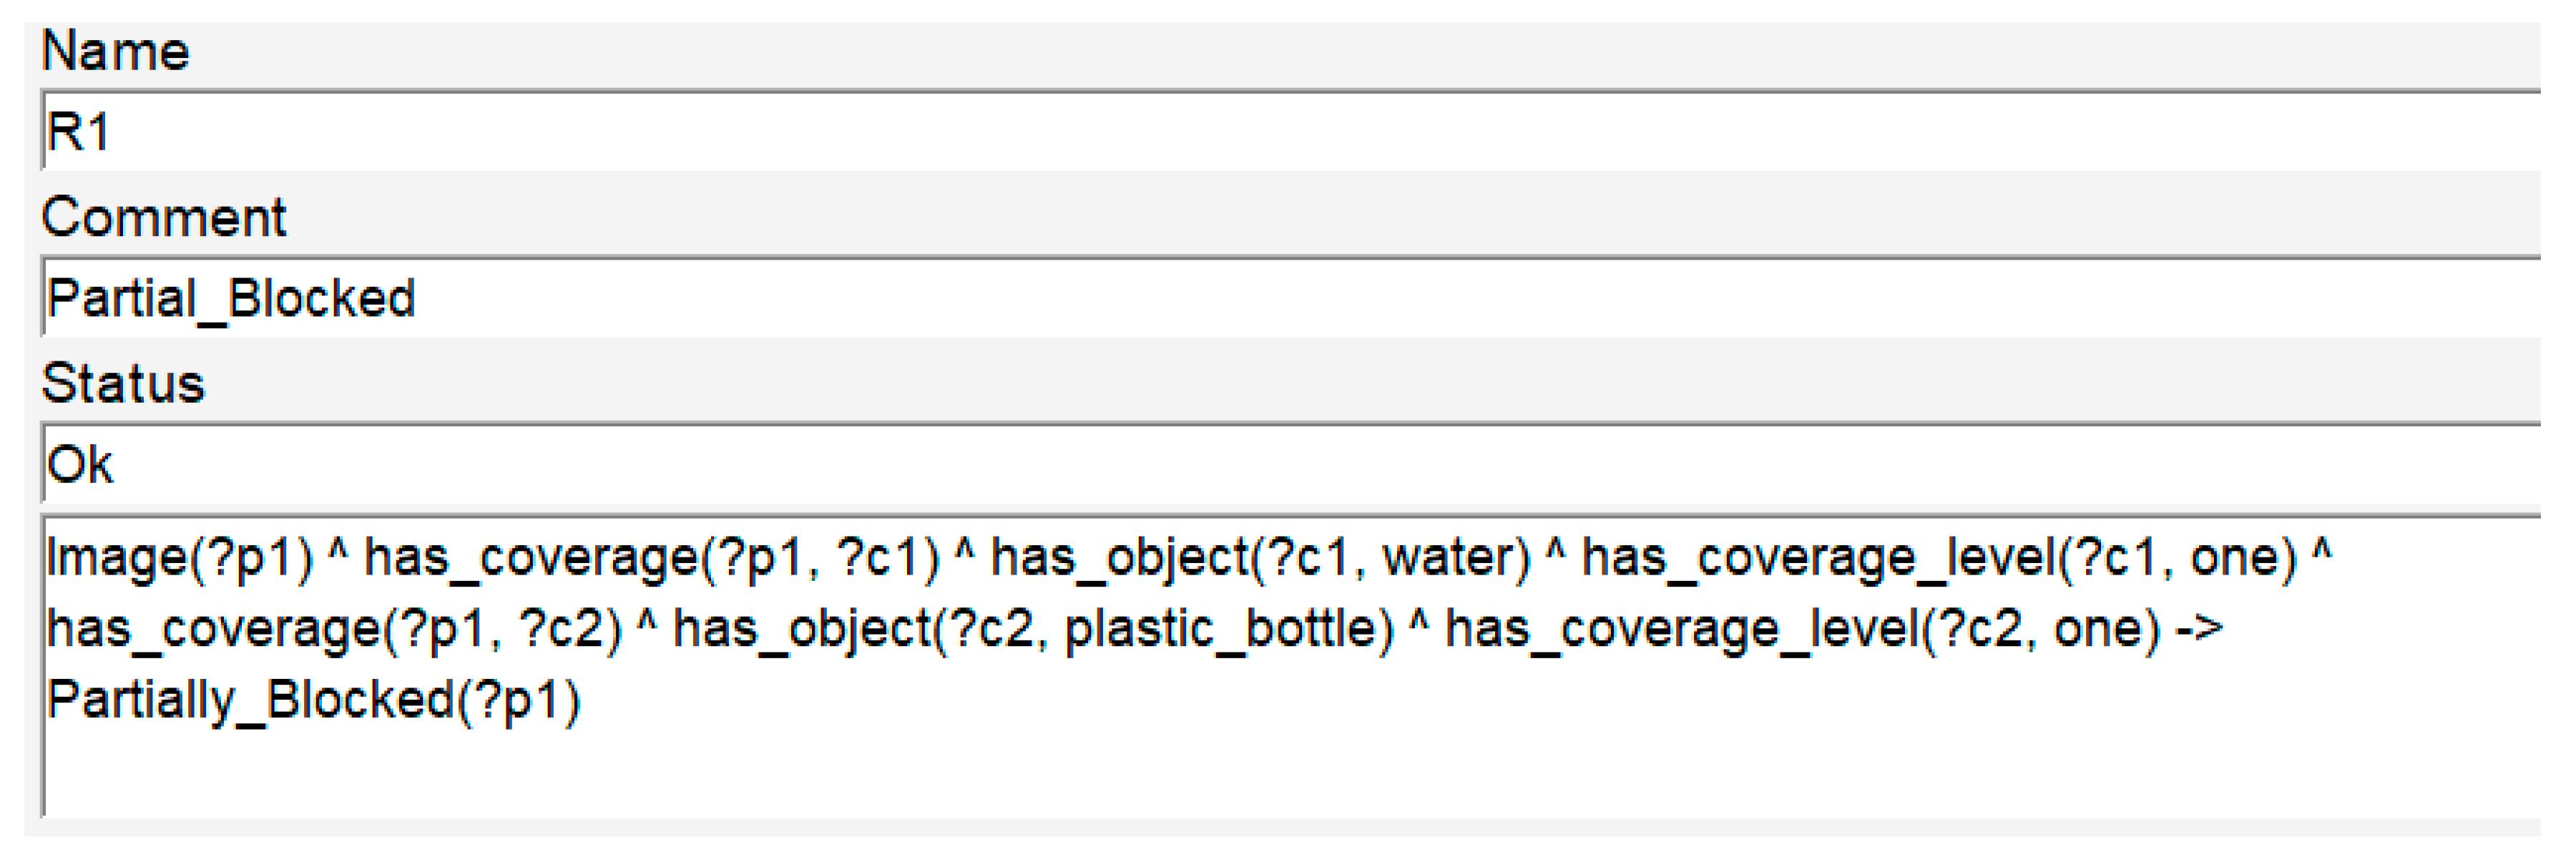
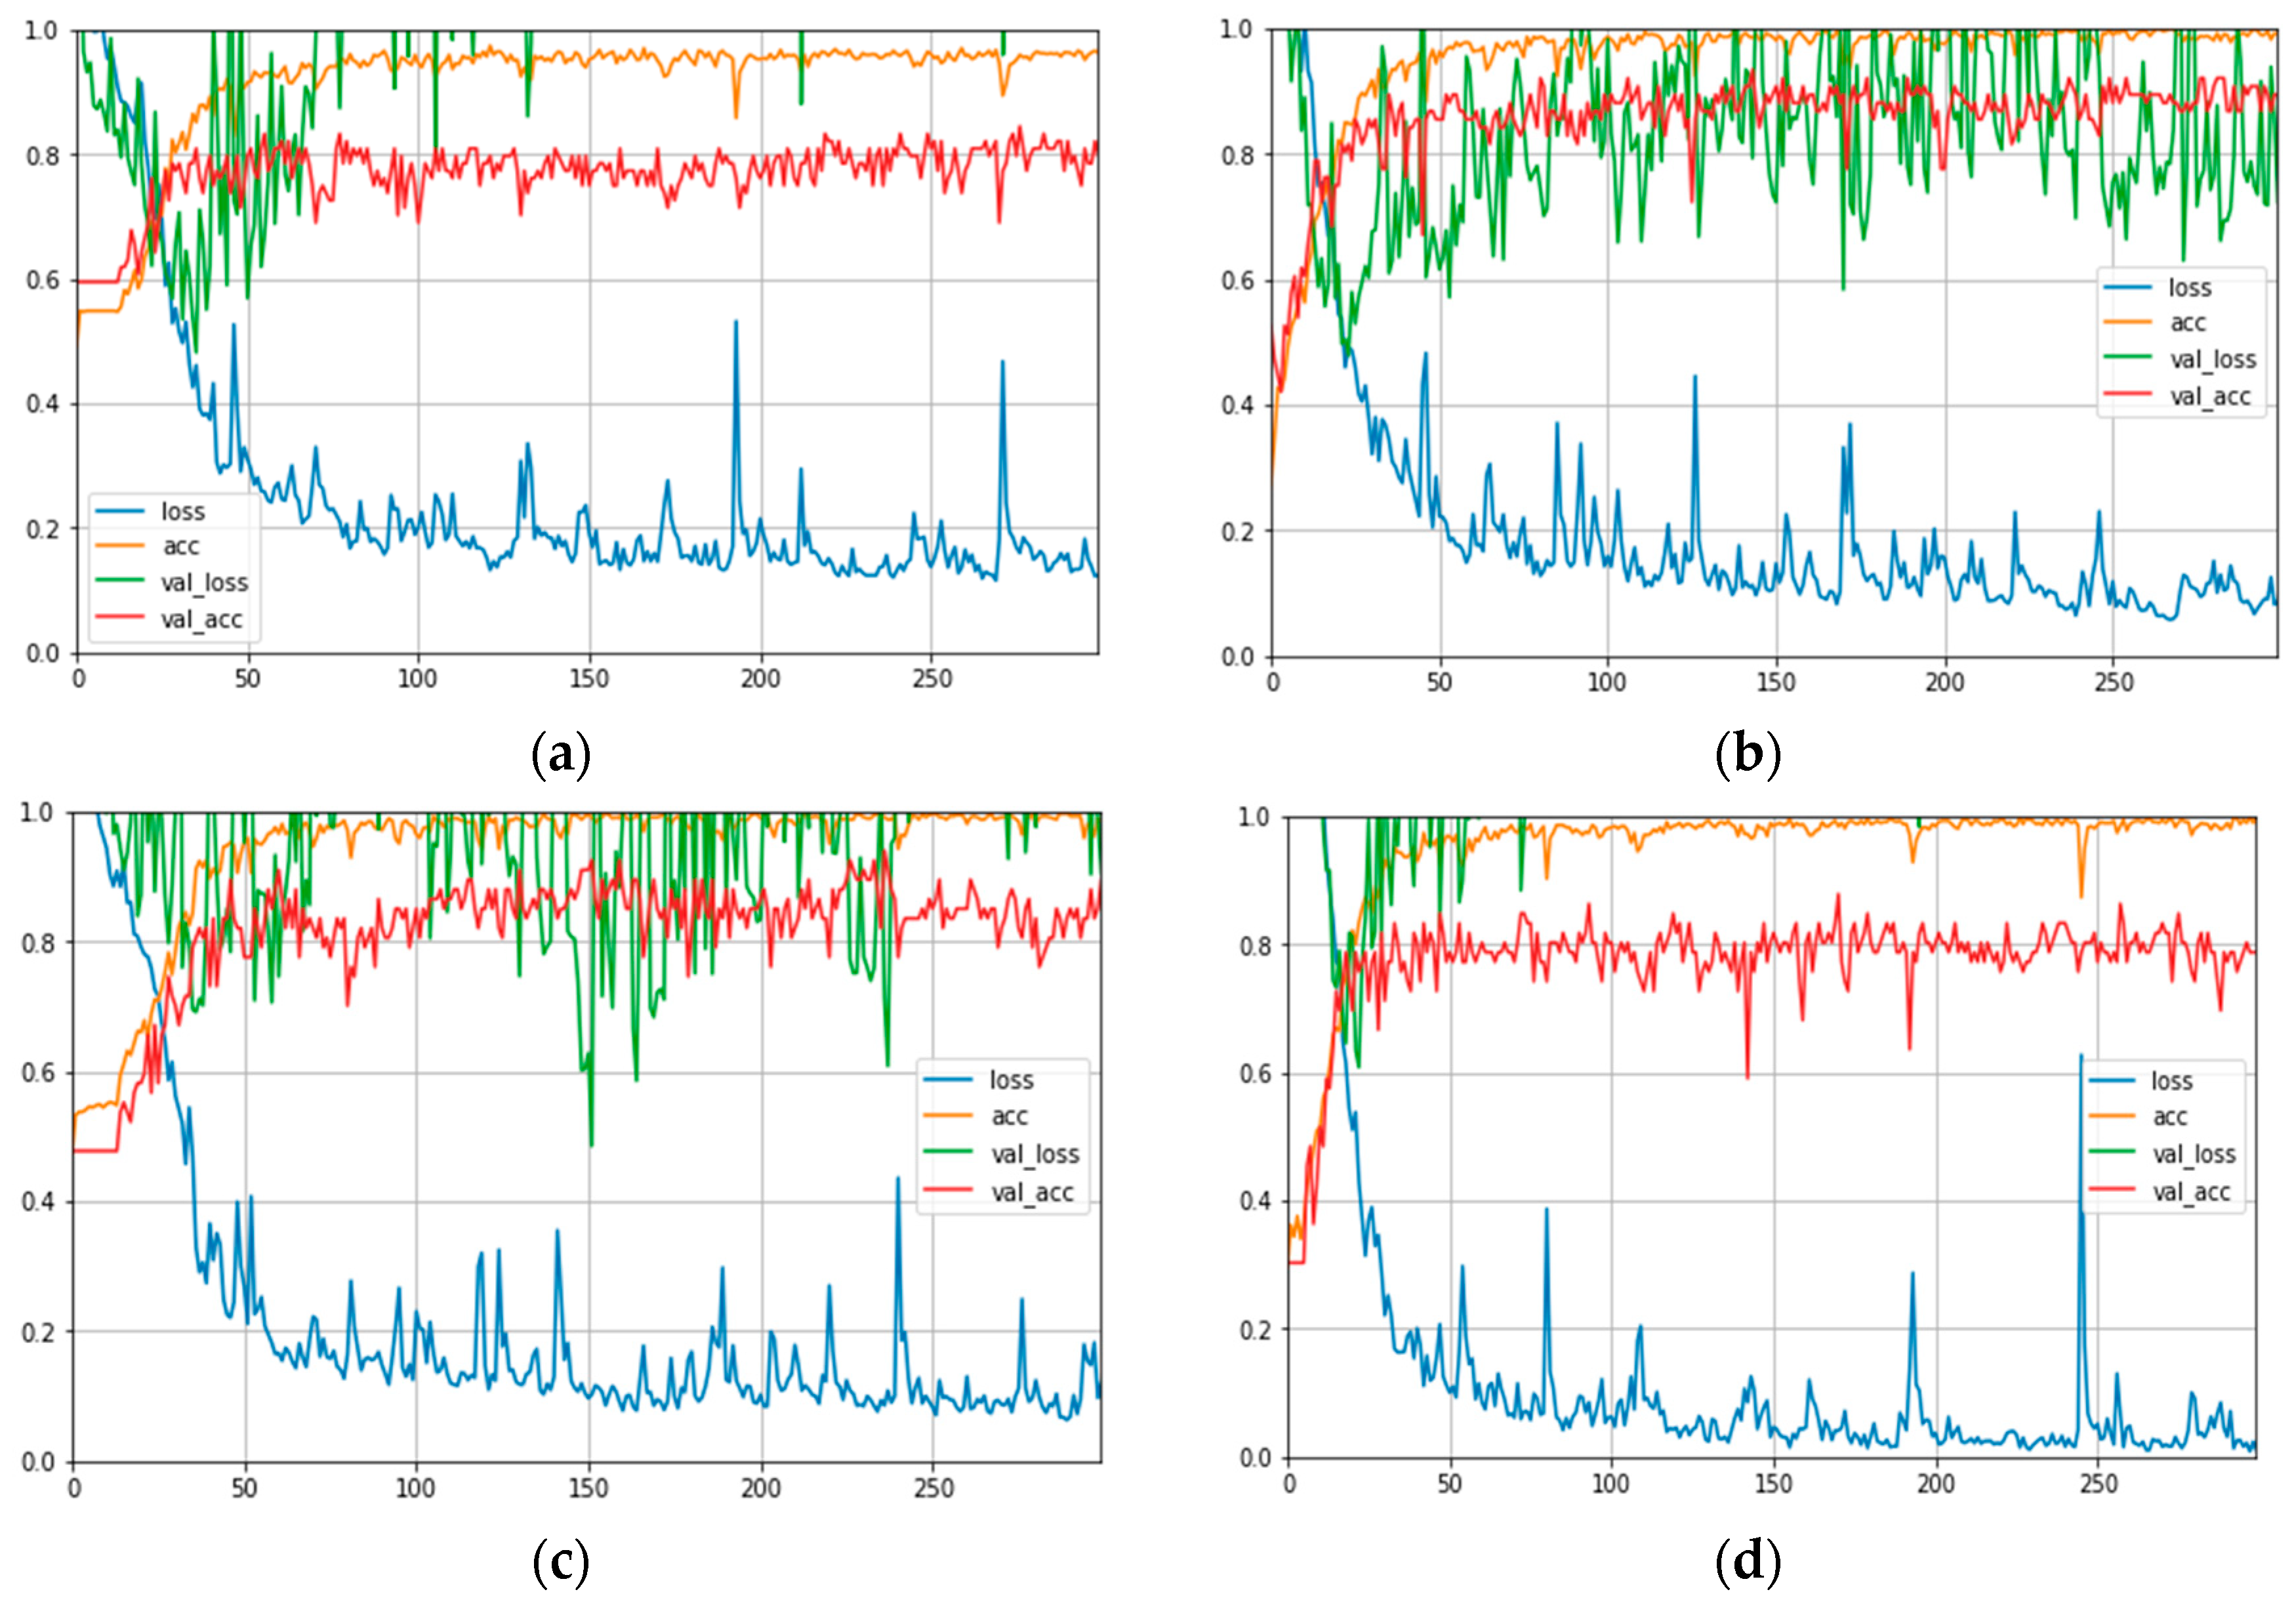
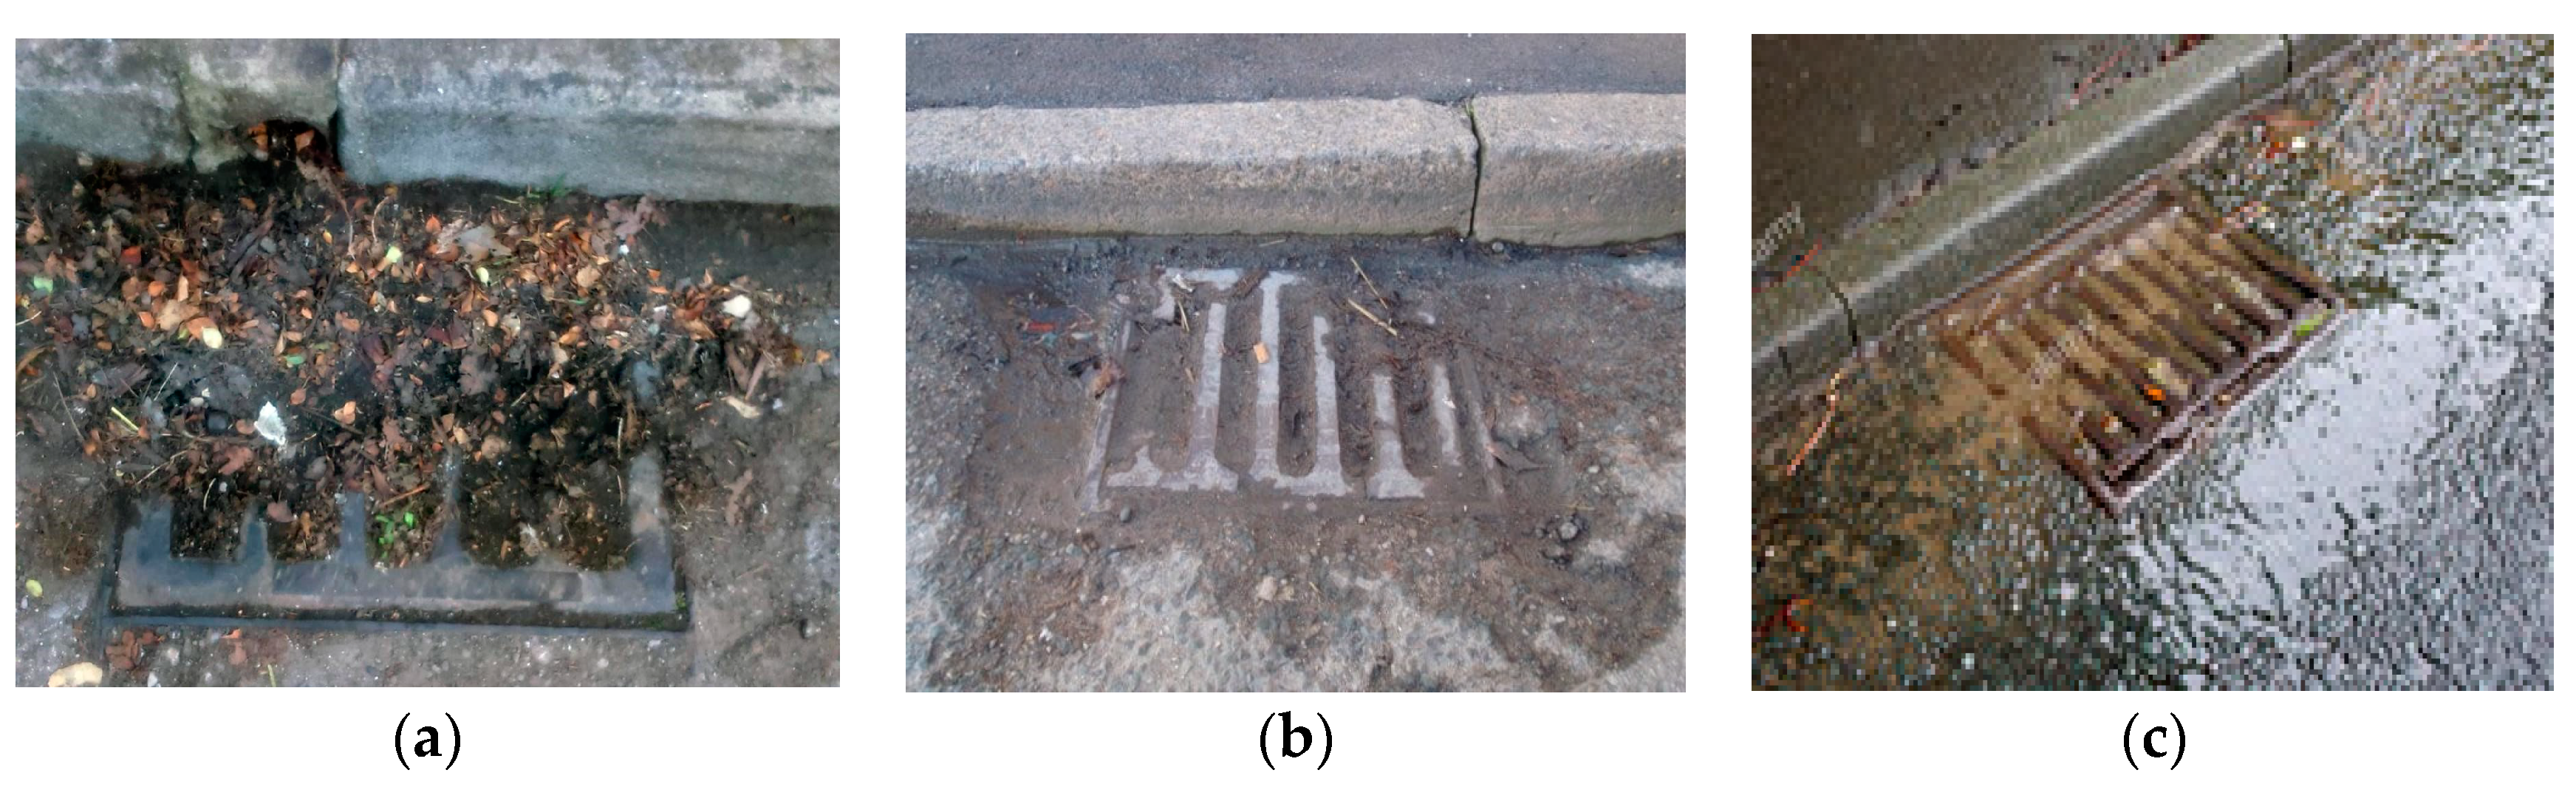
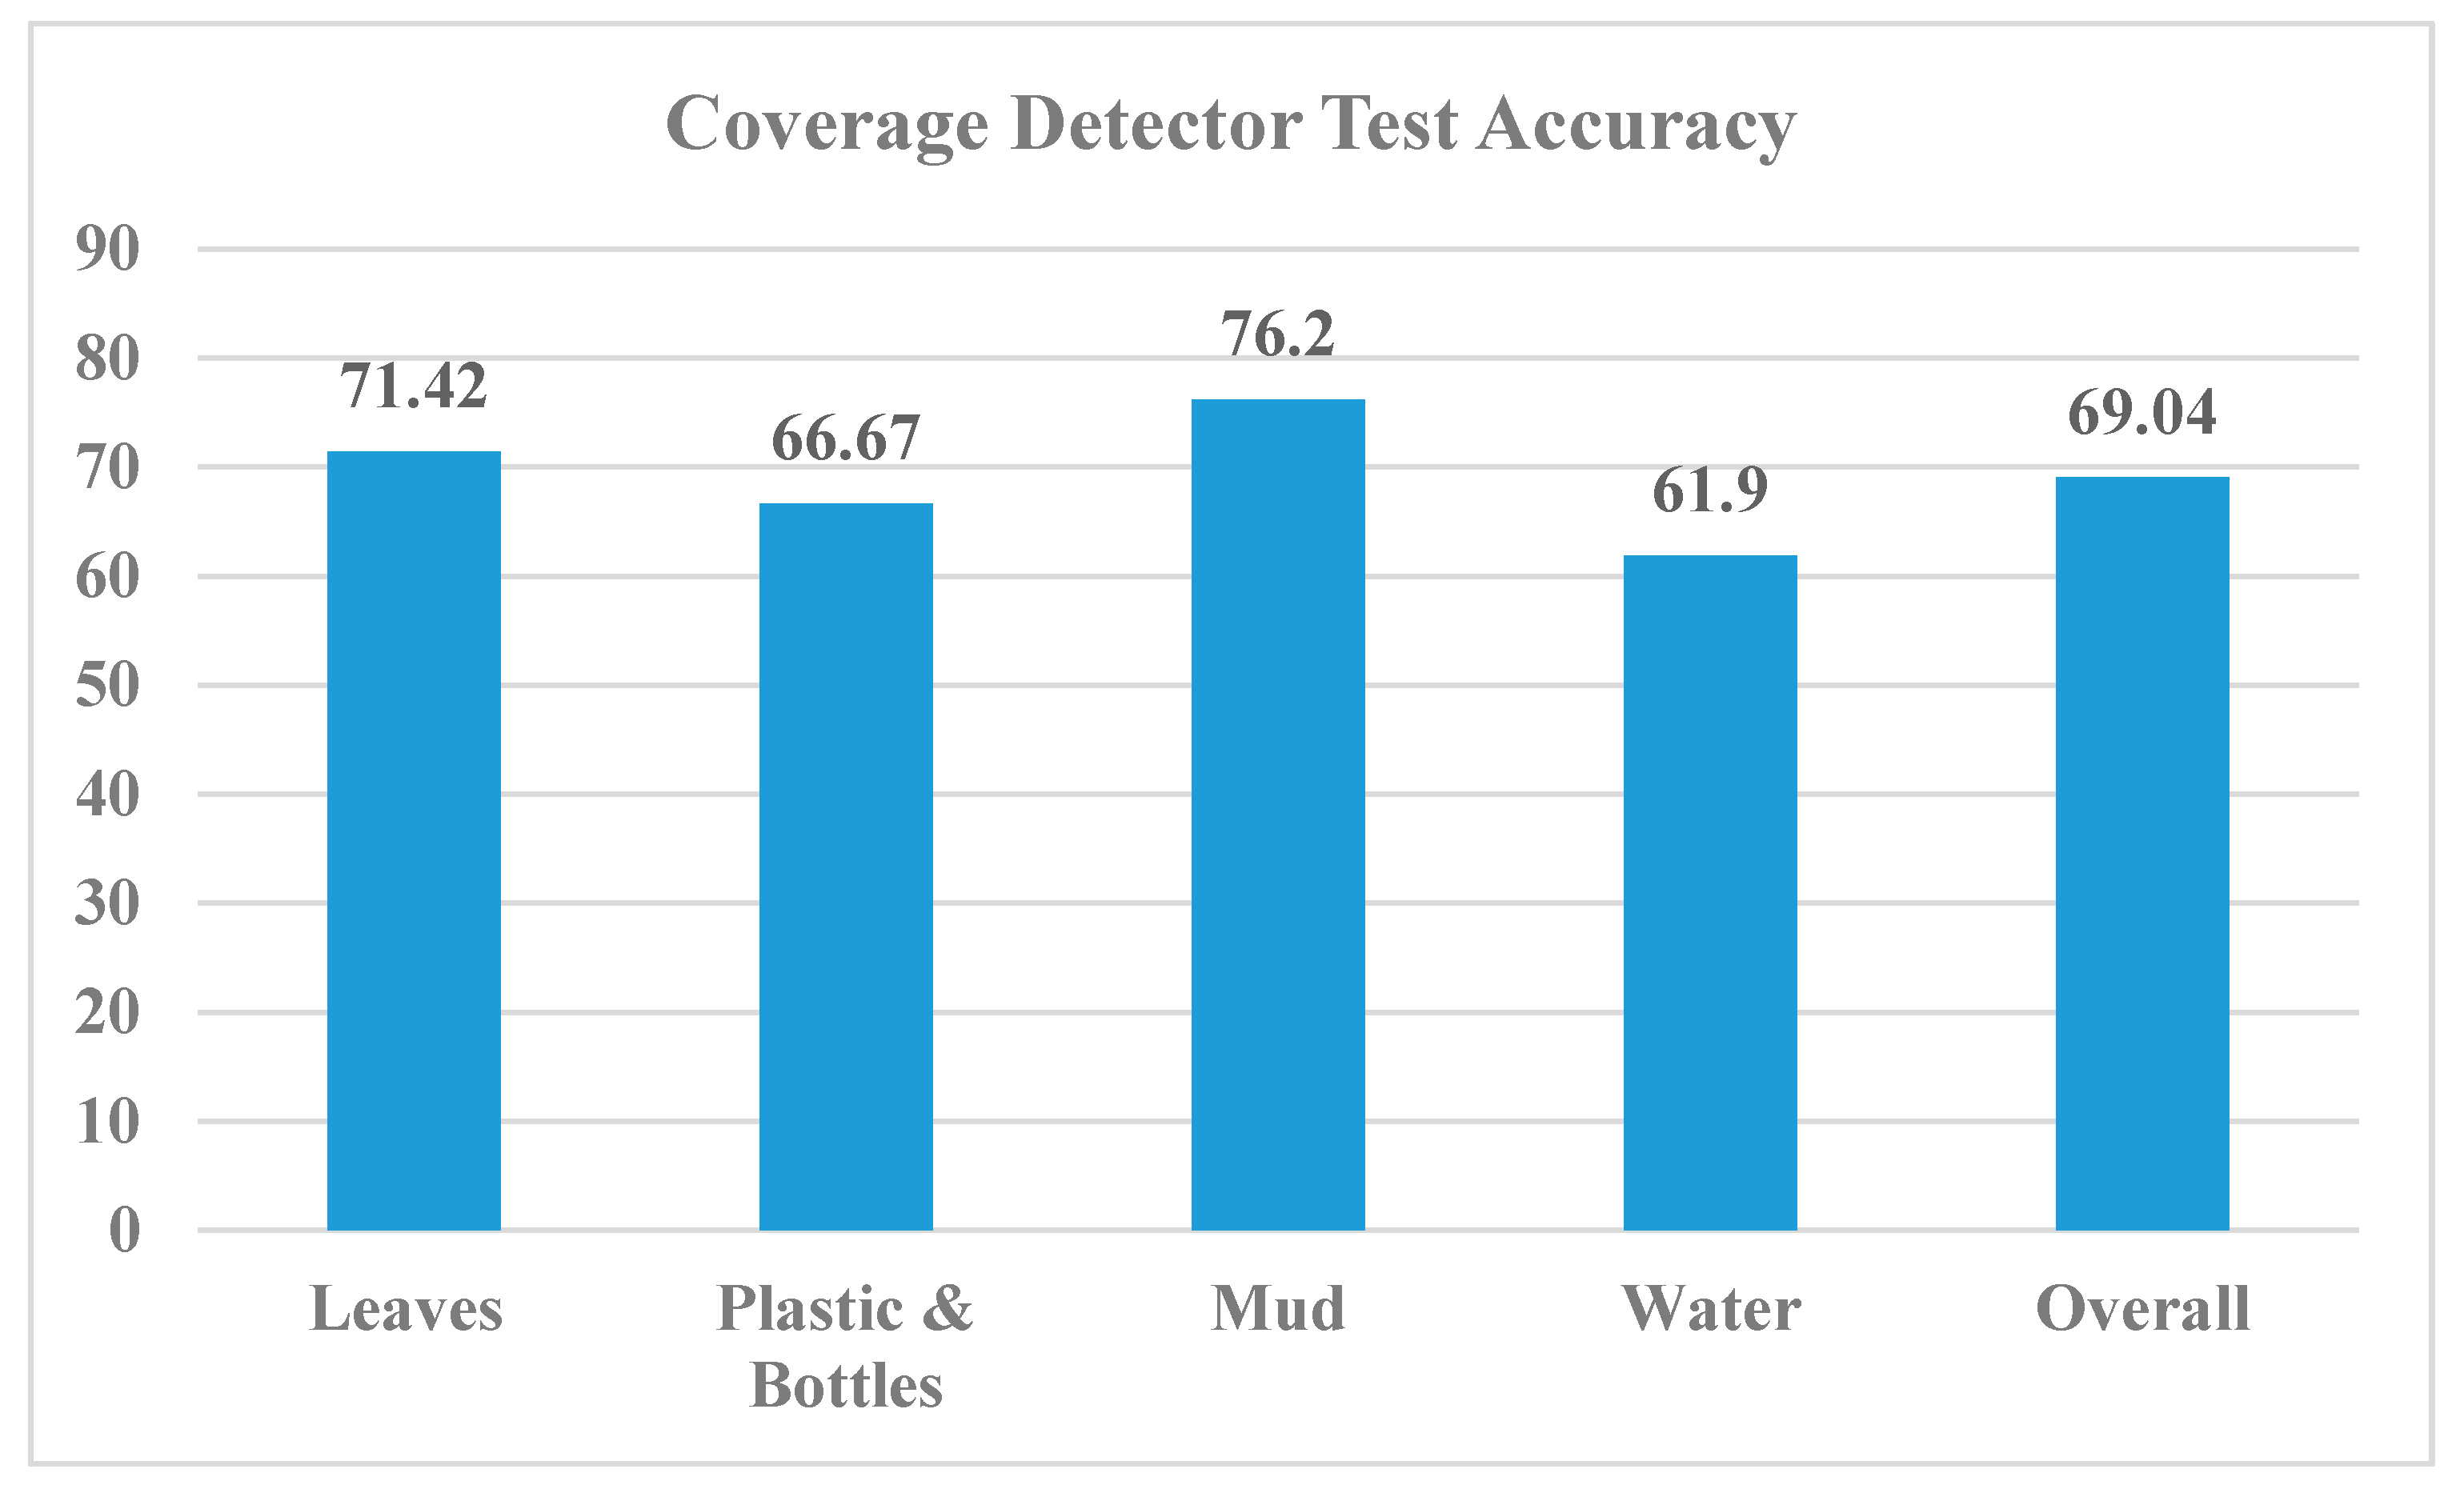
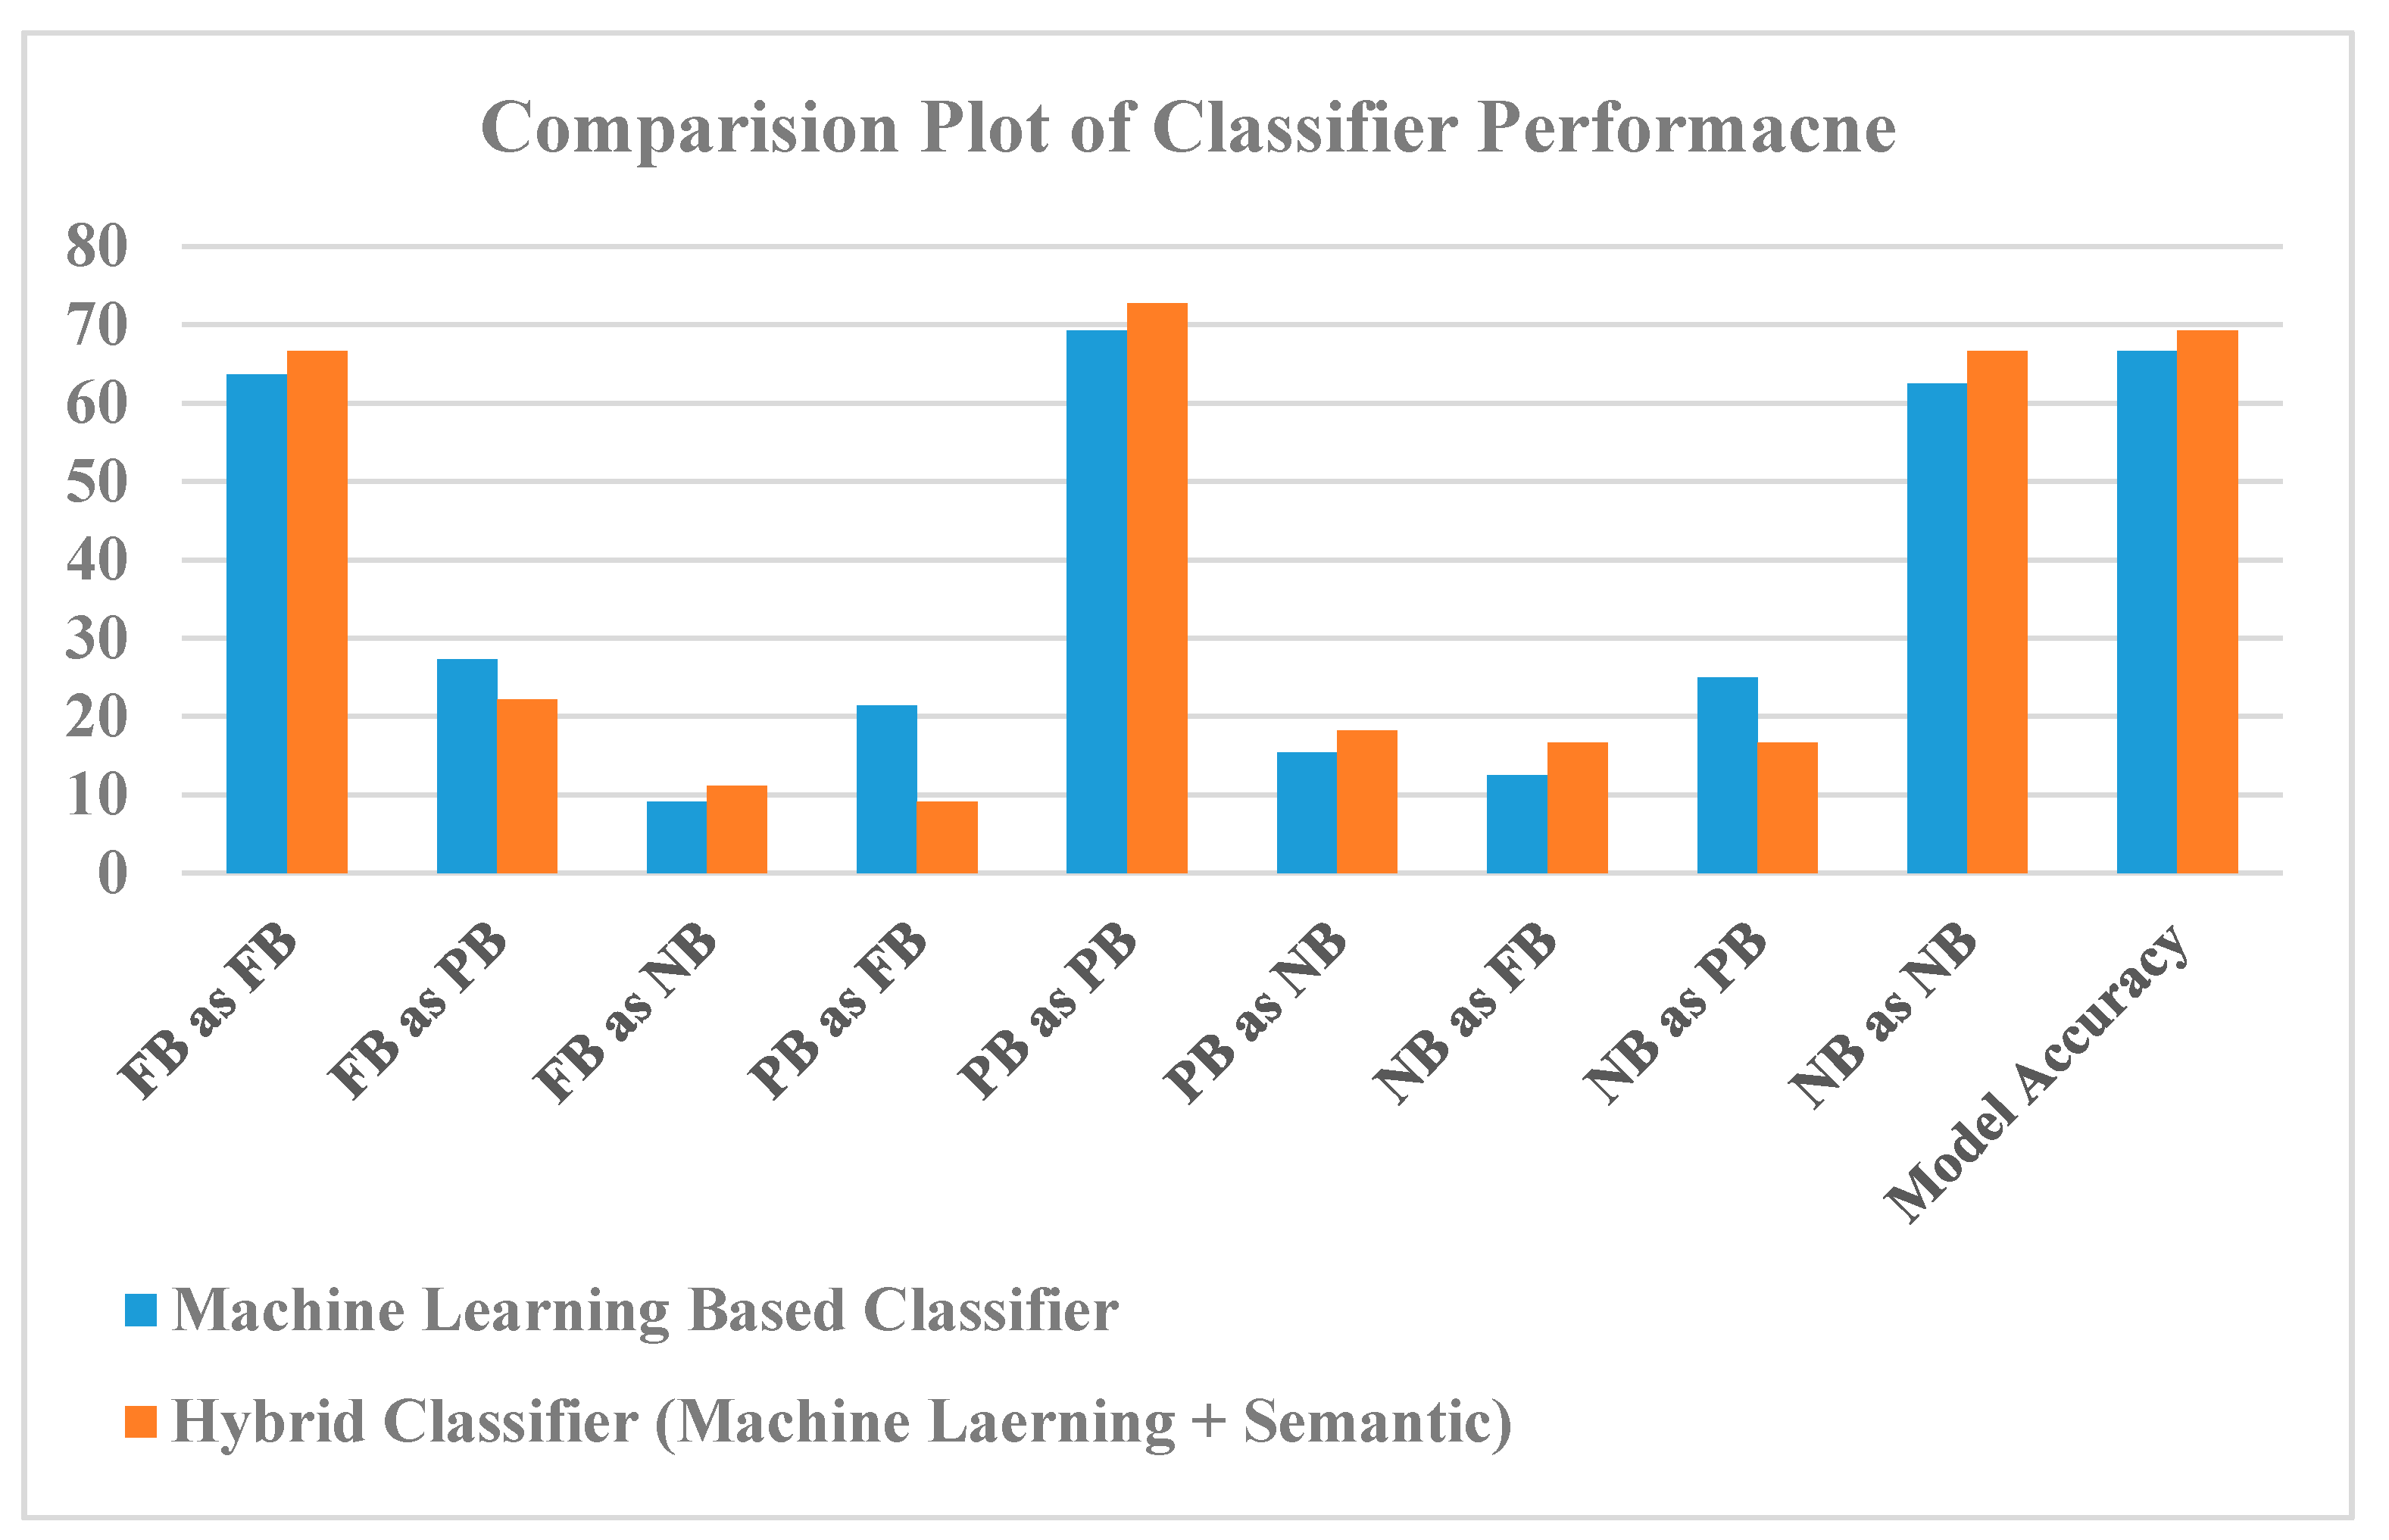
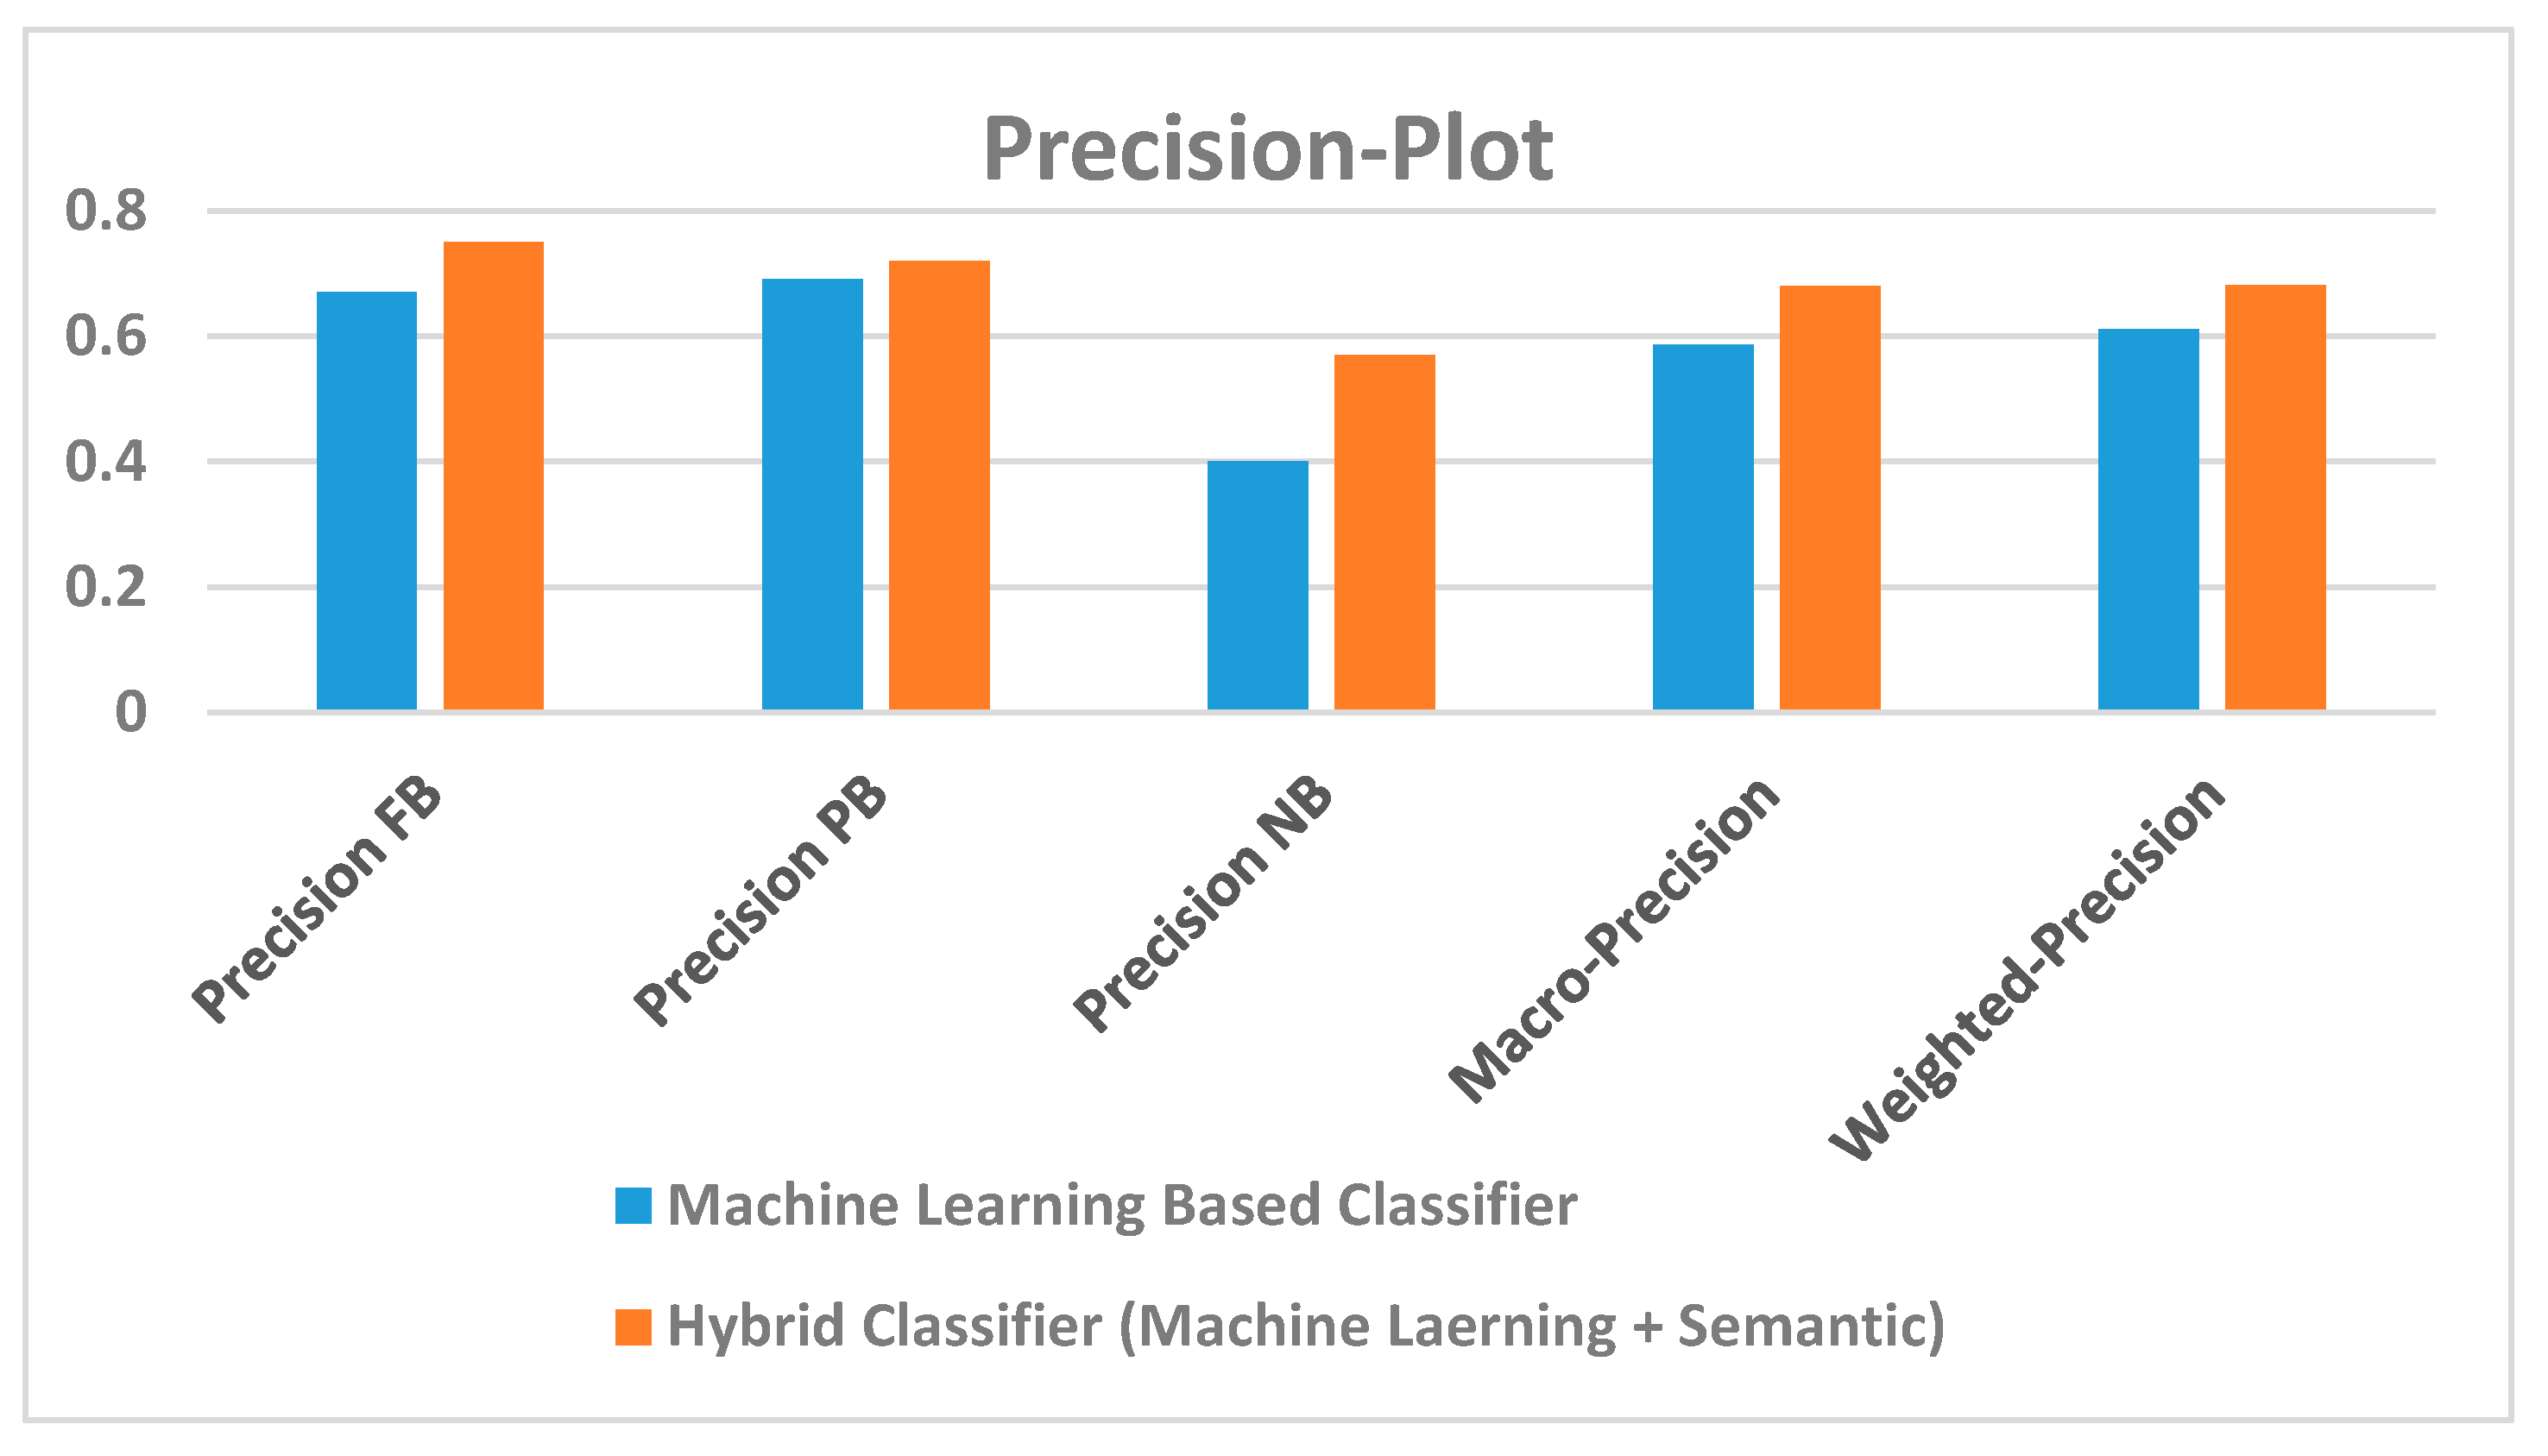
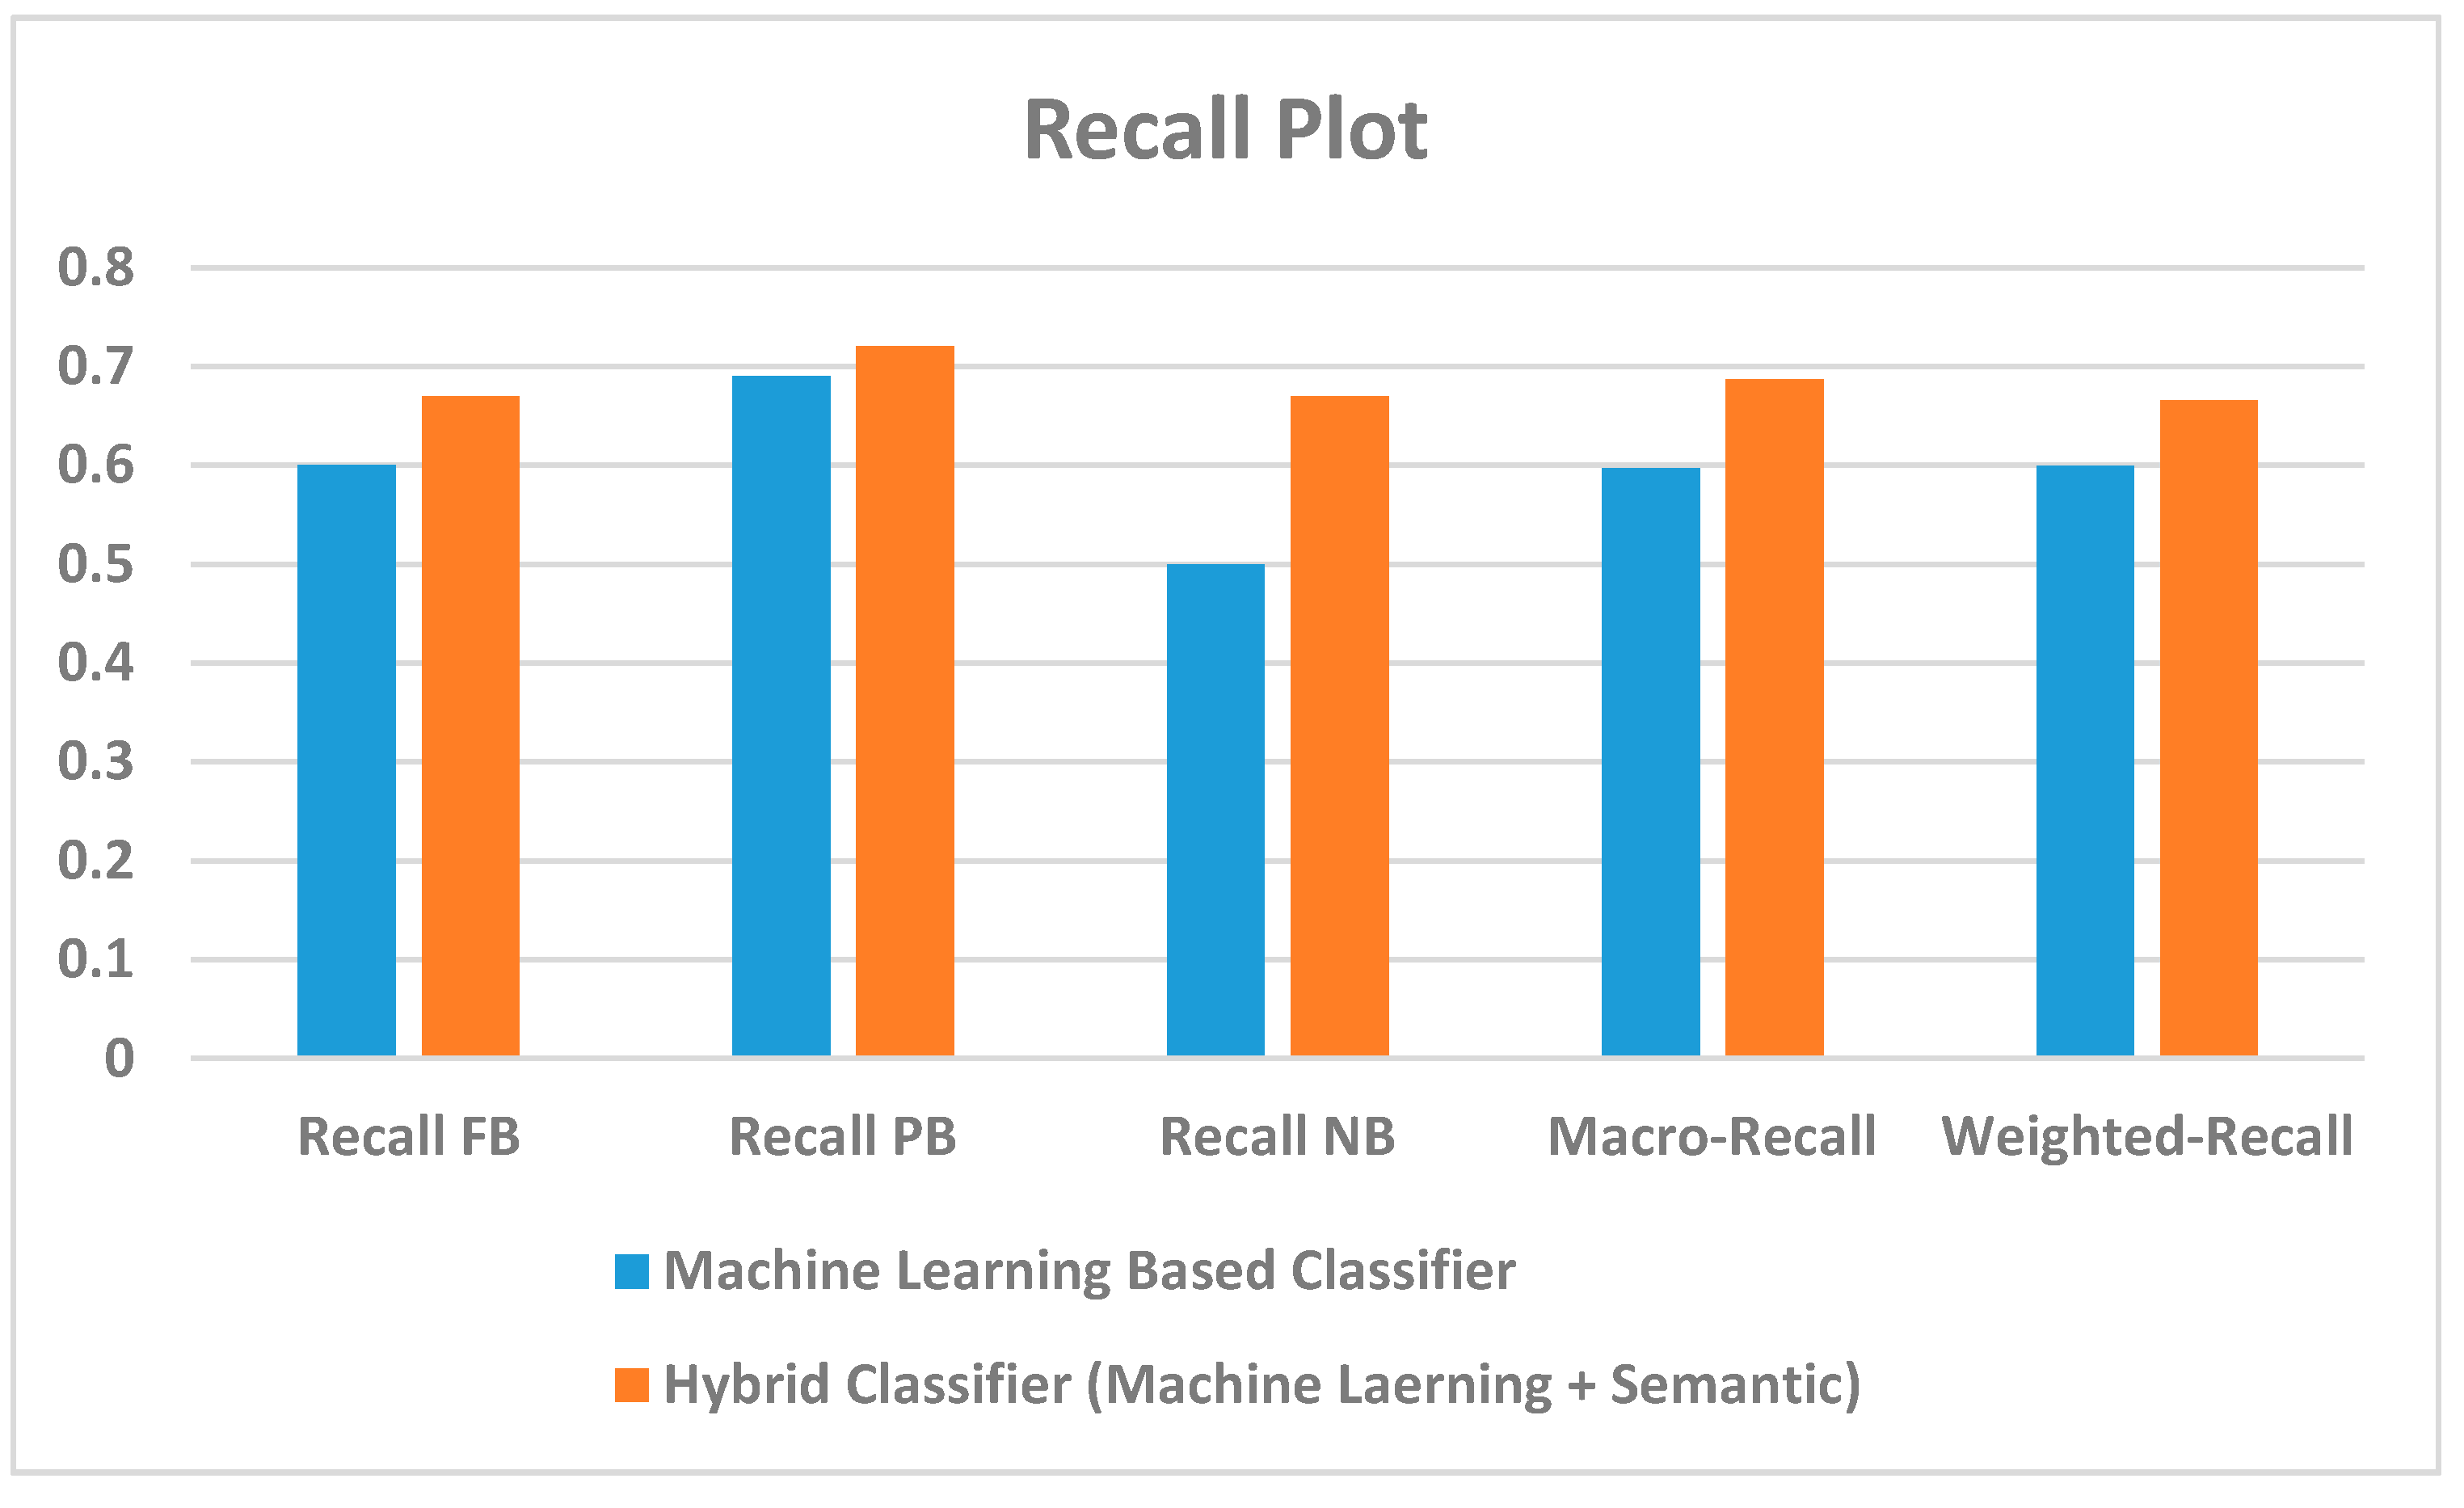
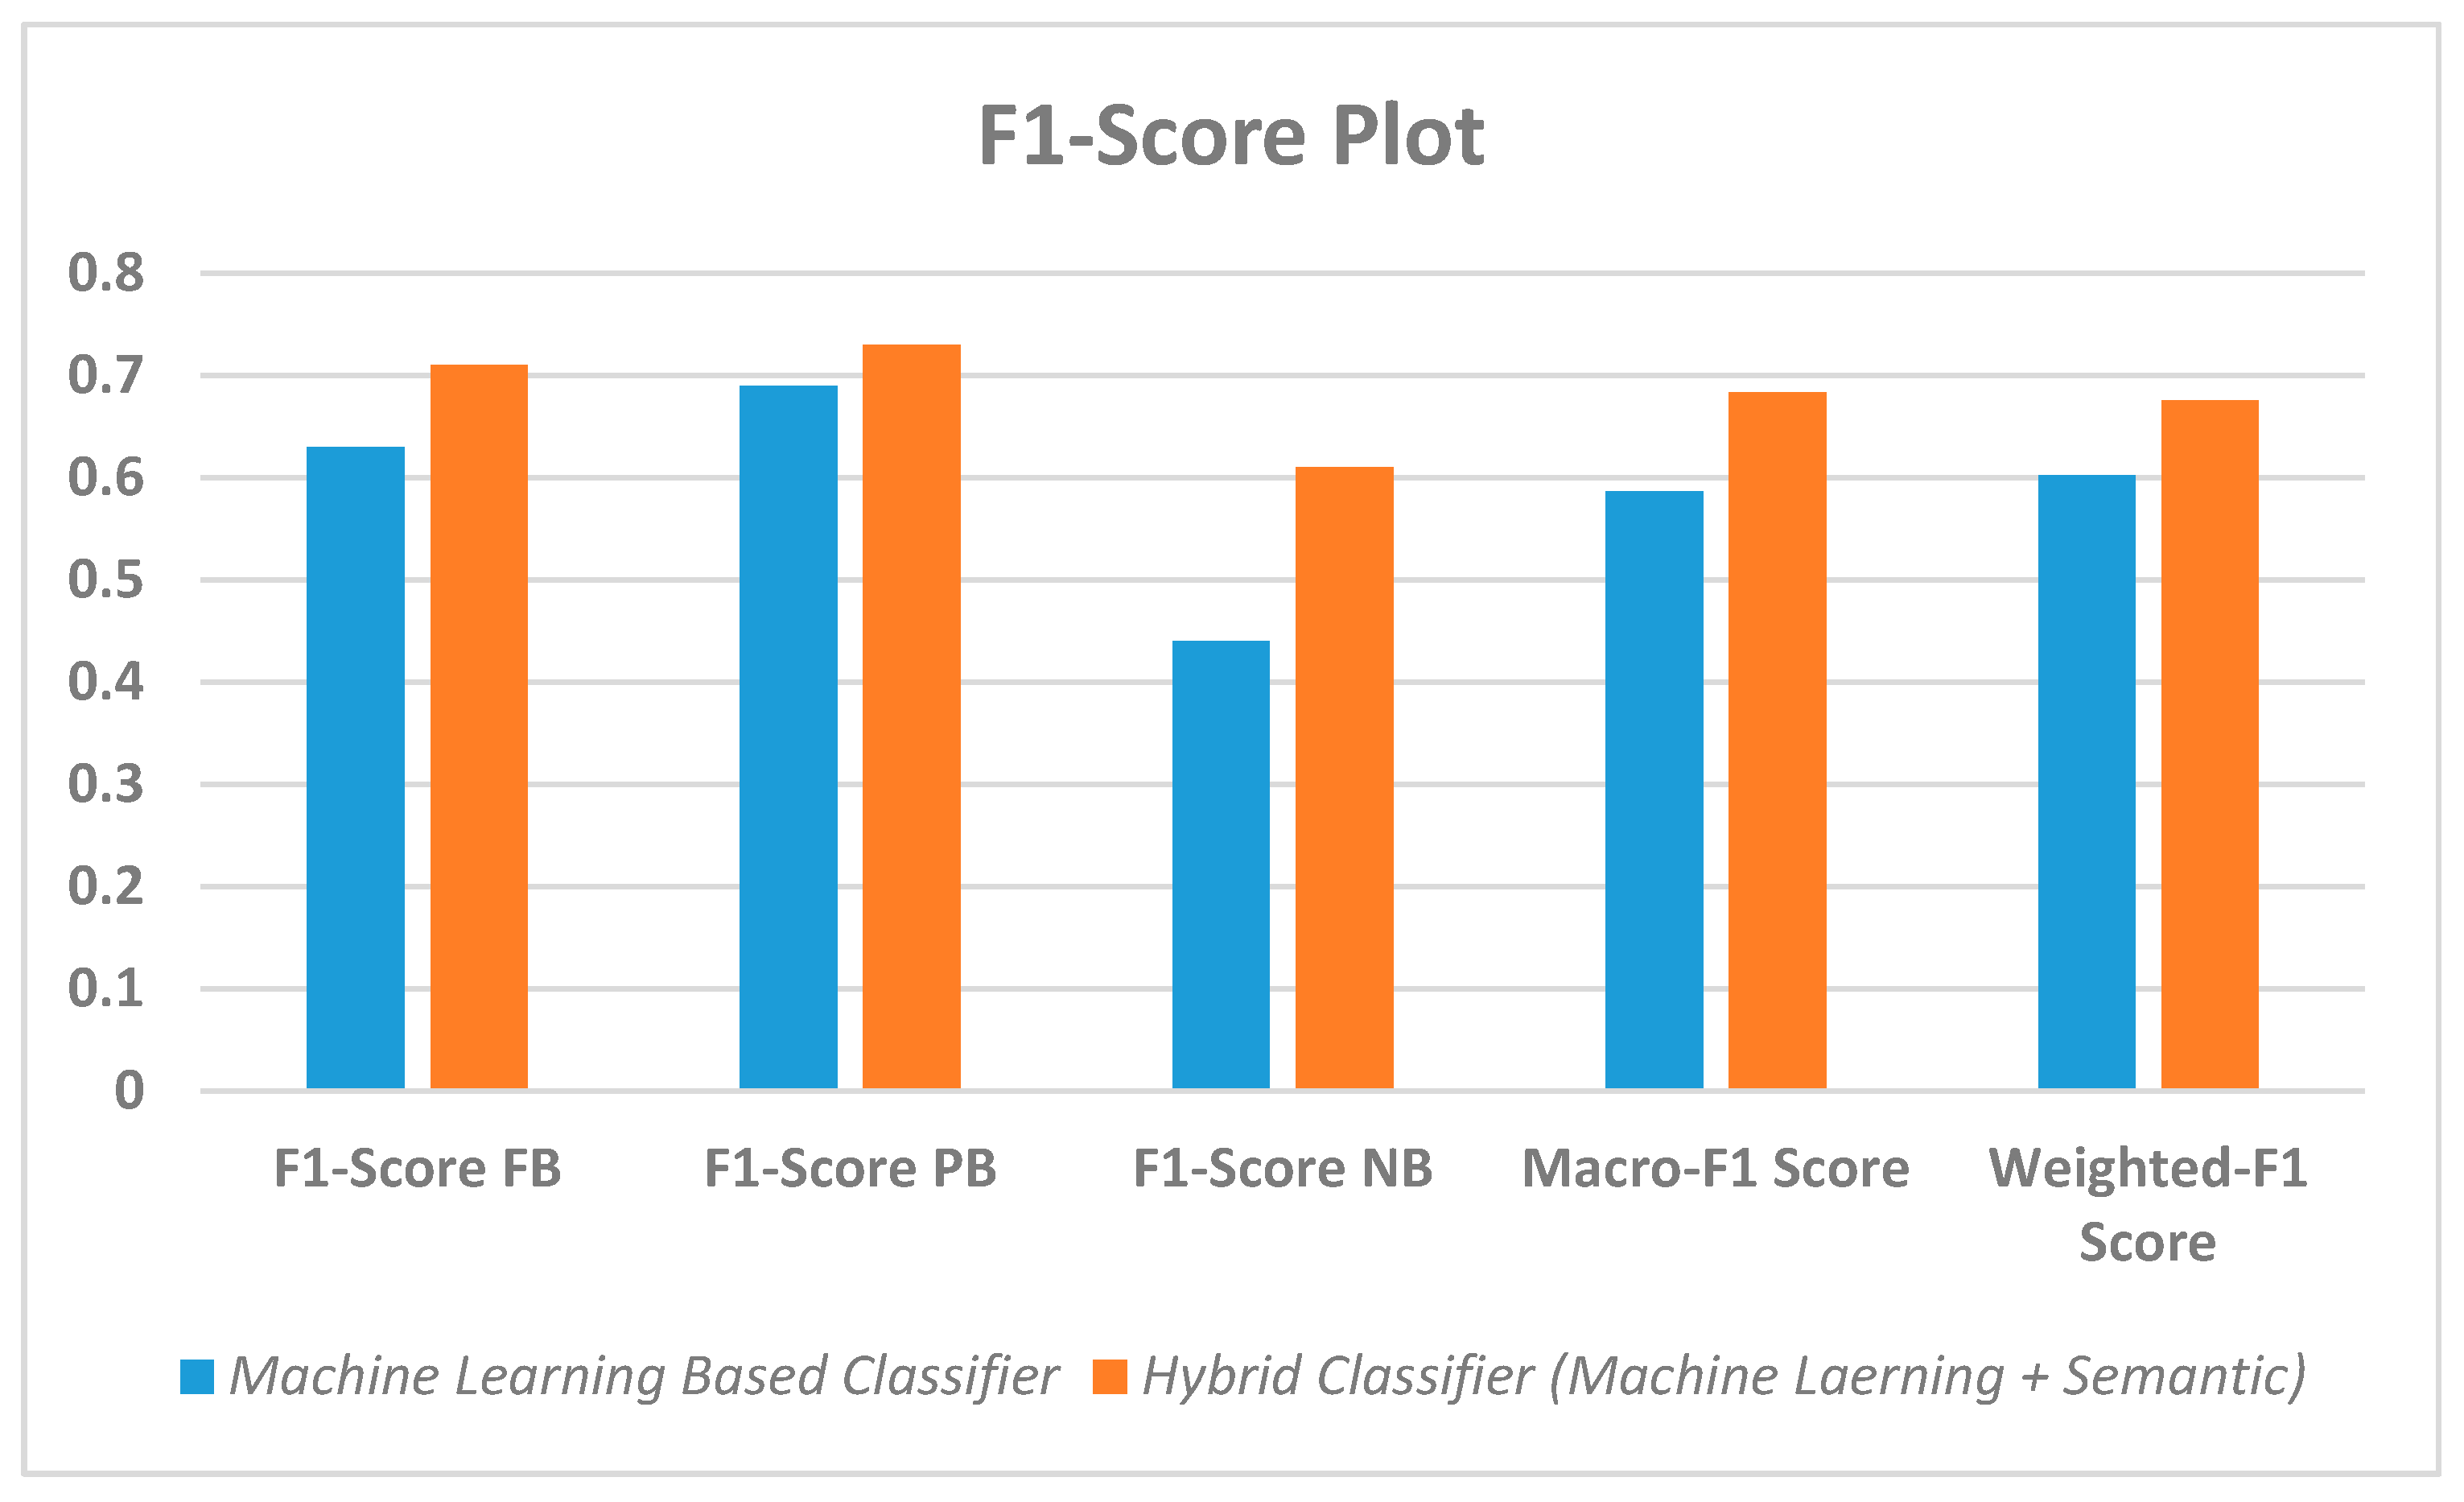
Table 1.
Image Augmentation parameters and value range.
| Parameter | Value (Range) |
|---|---|
| Rotation Range | 5–20 |
| Width Shift Range | 0.1–0.25 |
| Height Shift Range | 0.1–0.25 |
| Shear Range | 0.05–0.2 |
| Zoom Range | 0.05–0.15 |
| Horizontal Flip | True |
| Fill Mode | Nearest |
| Data Format | Channel Last |
| Brightness Range | 0.05–1.5 |
Table 2.
Coverage level and coverage percentage.
| Coverage Level | Coverage Percentage |
|---|---|
| Zero | Coverage Percentage < 5% |
| One | 5% <= Coverage Percentage < 20% |
| Two | 20% <= Coverage Percentage < 50% |
| Three | Coverage Percentage >= 50% |
Table 3.
Example of Object Coverage Percentage and Corresponding Level.
| Figure | Leaf Coverage (%) | Coverage Level | Plastic $Bottle Coverage (%) | Coverage Level | Mud Coverage (%) | Coverage Level | Water Coverage (%) | Coverage Level |
|---|---|---|---|---|---|---|---|---|
| 9.a | 40.25 | Two | 0 | Zero | 0 | Zero | 43.92 | Two |
| 9.b | 14.19 | One | 0 | Zero | 15.02 | One | 42.95 | Two |
| 9.c | 22.54 | Two | 5.25 | One | 0 | Zero | 8.40 | One |
Table 4.
Training and Validation Performance of Coverage Detector.
| Object Detector | Training Loss | Training Accuracy | Validation Loss | Validation Accuracy |
|---|---|---|---|---|
| Leaves | 0.2081 | 0.9633 | 1.4371 | 0.8421 |
| Mud | 0.0335 | 0.9880 | 1.1784 | 0.7717 |
| Plastic & Bottle | 0.1250 | 0.9626 | 1.5632 | 0.7976 |
| Water | 0.1208 | 0.9983 | 0.9052 | 0.8955 |
Table 5.
Combined confusion matrix of coverage detectors.
| Object/Level | Zero | One | Two | Three | |
|---|---|---|---|---|---|
| Leaves | Zero | 75% | 25% | 0% | 0% |
| One | 20% | 80% | 0% | 0% | |
| Two | 0% | 0% | 60% | 40% | |
| Three | 0% | 0% | 33.14% | 66.34% | |
| Plastic and Bottles | Zero | 71.42% | 14.28% | 7.15% | 7.15% |
| One | 0% | 50% | 0% | 50% | |
| Two | 0% | 20% | 80% | 0% | |
| Three | 0% | 0% | 33.33% | 66.67% | |
| Mud | Zero | 92.3% | 7.7% | 0% | 0% |
| One | 33.33% | 33.33% | 0% | 33.34% | |
| Two | 50% | 0% | 50% | 0% | |
| Three | 25% | 25% | 0% | 50% | |
| Water | Zero | 75% | 0% | 25% | 0% |
| One | 50% | 50% | 0% | 0% | |
| Two | 33.33% | 0% | 50% | 16.67% | |
| Three | 0% | 0% | 33.33% | 66.67% |
Publisher’s Note: MDPI stays neutral with regard to jurisdictional claims in published maps and institutional affiliations. |
© 2020 by the authors. Licensee MDPI, Basel, Switzerland. This article is an open access article distributed under the terms and conditions of the Creative Commons Attribution (CC BY) license (http://creativecommons.org/licenses/by/4.0/).
Share and Cite
MDPI and ACS Style
Thakker, D.; Mishra, B.K.; Abdullatif, A.; Mazumdar, S.; Simpson, S. Explainable Artificial Intelligence for Developing Smart Cities Solutions. Smart Cities 2020, 3, 1353-1382. https://doi.org/10.3390/smartcities3040065
AMA Style
Thakker D, Mishra BK, Abdullatif A, Mazumdar S, Simpson S. Explainable Artificial Intelligence for Developing Smart Cities Solutions. Smart Cities. 2020; 3(4):1353-1382. https://doi.org/10.3390/smartcities3040065
Chicago/Turabian StyleThakker, Dhavalkumar, Bhupesh Kumar Mishra, Amr Abdullatif, Suvodeep Mazumdar, and Sydney Simpson. 2020. "Explainable Artificial Intelligence for Developing Smart Cities Solutions" Smart Cities 3, no. 4: 1353-1382. https://doi.org/10.3390/smartcities3040065