

Examination of Condensation Liquid Formation in Istanbul Natural Gas Distribution Network

Department of Mechanical Engineering, Faculty of Mechanical Engineering, Yildiz Technical University, 34349 Istanbul, Turkey
*
Author to whom correspondence should be addressed.
Separations 2023, 10(2), 135; https://doi.org/10.3390/separations10020135
Submission received: 16 January 2023
/
Revised: 12 February 2023
/
Accepted: 14 February 2023
/
Published: 16 February 2023
(This article belongs to the Special Issue Comprehensive Separations of Complex Mixtures by Gas Chromatography/Mass Spectrometry)
Abstract
:In this study, the formation of natural gas liquid in gas distribution lines, particularly at regional stations, service boxes, customer installations, and gas meters, was investigated. The study aims to address the problems associated with natural gas liquid formation, such as interruption of supply and decreased efficiency of combustion devices. The indirect measurement of the hydrocarbon dew point was analyzed using C6+ chromatograph data, and the model based on directly measured C6+ data were converted into C6/C7/C8 data by four different methods. As distinct from studies in the literature, this study experimentally determines the distribution of heavy hydrocarbons from C9 to C19 based on indirect methods for acquiring C8+ data and direct measurement of C6+ data. The hydrocarbon dew point temperature was calculated using the Peng–Robinson (PR) and Soave–Redlich–Kwong (SRK) equations of state. The results of the analysis performed on two city gate stations showed that the critical temperatures were 4.21 °C at a pressure of 10.81 bar and 8.27 °C at a pressure of 11.25 bar, respectively. These values were obtained from a model designed to determine the dew point temperature in the area where natural gas liquid formation was most prevalent. The experimental analysis and indirect measurements indicated the occurrence of a two-phase gas–liquid formation.
1. Introduction
Natural gas, a significant energy source, is extracted from underground wells and is often a by-product of crude oil production. Initially, the extracted natural gas, which contains various gases, particles, and water, is transferred to a central processing unit via collection pipes and compressors. The processing unit removes acid gases, separates phases, dries the gas, and adjusts its composition. The cleaned natural gas is then transported to the delivery region and delivered to the end-user through various methods [1].
Natural gas, brought to city gate stations through high-pressure transmission lines, is reduced to the network pressure and delivered to large consumers such as regional stations, power generation facilities, and factories, through steel pipelines. The pressure from the district stations is reduced, and the natural gas is then distributed to residential, industrial, and commercial consumers through a polyethylene distribution network. An example of natural gas distribution line user distributions can be seen in Figure 1.
Natural gas, which is supplied to RM-A station from BOTAS with a pressure range of 35–70 bar through pipelines, undergoes preheating and pressure reduction to 20 bar at the RM-A station. The natural gas is then dispersed from the RM-A station through steel pipelines to locations with industrial and residential consumers. After entering the inner-city RM-B stations at a pressure range of 12–20 bar, it is distributed through polyethylene lines at 4-bar levels. The natural gas transported to the end-user service boxes through polyethylene lines at 1–4 bar pressure can be further reduced to 21 or 300 mbar, providing gas supply to the consumers [2].
The increasing value of natural gas relative to natural gas liquids (NGLs) has led to a decrease in the economic importance placed on the separation of NGLs during the liquefaction process. This has made it necessary for companies that handle the transmission and distribution of gas to continuously monitor and regulate the Hydrocarbon Dew Point (HCDP) in their pipelines. NGLs, produced as a by-product of the liquefaction of heavy hydrocarbons in natural gas, pose a significant risk to the delivery network. They can cause measurement errors and energy losses and negatively impact end-users, through, for example, excessive burning in appliances. Hence, it is imperative to monitor and control the presence of NGLs in the natural gas industry to ensure safe and efficient delivery of natural gas to end-users [3].
1.1. Literature Review
According to a research article published by Questar Pipeline Company, the presence of natural gas liquids in transmission pipelines has seen an increase, which has been accompanied by a decline in the price difference between natural gas and natural gas liquids. This shift has led to an increased focus on the monitoring of the HCDP by pipeline companies in order to ensure the safety and reliability of the system. The study explored both indirect and direct methods for the determination and implementation of HCDP in pipelines. A direct method, the Chilled Mirror method, was used to measure HCDP directly on the pipeline, and these measurements were compared with indirect HCDP temperature data obtained by analyzing the composition data from a chromatograph, calculated using state equations [4]. In the article by Barbosa, the HCDP was investigated by utilizing both direct and indirect methods. Based on the results of these measurements, recommendations were proposed for selecting the appropriate method to detect HCDP [5]. In the study conducted by Benton, the effectiveness of various methods for detecting HCDP in natural gas transmission pipelines was compared. The study compared the Chilled Mirror method and indirect measurement method with automatic dew point detection methods. The results showed that the use of automatic measuring devices was more efficient in determining HCDP with a high sensitivity. The increasing demand for natural gas highlights the importance of accurate HCDP determination in ensuring the safety and reliability of the gas transmission system [6]. In the study conducted by Aniefiok and Boniface, the hydrocarbon dew point temperature, which plays a crucial role in pipeline operation, was determined using the equation of state (EOS) and gas chromatography analysis methods. The study outlines a method for determining the composition of the C6/C7/C8 components of C6+ data, including the calculation of specific gravity through iteration [7]. In the study by Aniefiok, the limitations of C6+ separation methods in determining the composition of natural gas liquids for the prediction of HCDP temperature were explored. Three different methods of C6+ decomposition were applied, utilizing PR and SRK state equations, and the results were analyzed using HYSYS. The study found that the HCDP temperature was ranked differently among the models created, with variations in the 50/25/25, 47/26/17, and 60/30/10 splitting ratios [8]. In the article by E. Voutsas, the aim was to determine the dew points of gas condensate mixtures using thermodynamic modeling. The significance of accurate and robust phase equation models for the oil and natural gas industry was highlighted. The UMR-PRU equation of state was applied and compared with the commonly used cubic models PR and SRK, as well as the non-cubic PC-SAFT equation of state. The model was evaluated on both synthetic and real gases, and it was found that the UMR-PRU equation of state provides a precise prediction of the dew point and liquid formation point of gas condensates [9]. In the study conducted by Pu Zhang, it was highlighted that there is a scarcity of data on hydrocarbon dew point measurements, leading to uncertainty in existing models. In order to address this, the study aimed to establish a new model using a dataset of approximately 1000 hydrocarbon dew point measurements. The dataset was modeled using eight known equations of state, including SRK, SRK-Twu, PR, and GERG-2008. The results showed that there were significant deviations in the high-pressure region above 6 MPa, compared to the low-pressure region below 6 MPa. Among the models tested, GERG-2008 performed best for synthetic gases, with a deviation of 1.44 °C. For real gases, the PSRK and SRK-Twu models showed the best performance, with an average deviation of 2.5 °C. These results were discussed in the study [10]. In the study conducted by Mu and Cui in 2018, the hydrocarbon dew points of eight synthetic natural gas mixtures were measured using the Isothermal Pressure Search method and high-pressure transparent sapphire cells. The experimental temperature range was from 234.5 K to 295.35 K, and the pressure range was from 1.706 MPa to 11.495 MPa. The results were used to evaluate the prediction performance of the SRK and PR equations of state. The findings showed that the cricondentherm and cricondenbar decreased as the concentration of methane increased. Conversely, the cricondentherm and cricondenbar increased with increasing concentrations of other hydrocarbon components, such as ethane and C3+. The results indicated that a 0.98% molar change in N-pentane concentration resulted in a 22 K decrease in the critical condensation temperature and a 1.9 to 2.7 MPa decrease in the cricondenbar. The PR method showed mean absolute deviations of 0.79–1.53% with the experimental data, while the SRK method showed clear deviation from the measured values [11]. In the study by Di Fan, a method for tracking the composition of natural gas in pipe networks was developed. The method combines hydraulic simulation and heat transfer modeling, utilizing a specialized grid system to accurately predict gas composition in real-time. The method includes simulation of transient flow, tracking of gas composition, and calculation of relevant parameters. The results show accurate predictions of gas composition and reliable simulation of transient flow. However, care must be taken when considering the effects of LNG/H2 injection into the network [12]. A new model for tracking the gas composition in a transportation network has been introduced by Bermúdez. The model involves a system of differential equations and is coupled with a flow model to maintain mass conservation of each species. The validity of the model was tested on a real network and the results were in good agreement with actual measurements [13]. In the study by the Mechanical Engineering Department of the Eindhoven University of Technology, a 32-component Russian gas is modeled to study the formation of a liquid film layer. Based on soil temperature, the formation rate is estimated to be between 4.5 to 6 mm/year. The study utilizes the Aspen HYSYS to model the formation of the liquid film layer under various conditions, and the results indicate that the C12/C13/C14 layer is primarily affected [14]. In the study by Bullin, the determination of the hydrocarbon dew point was investigated through the use of the Chilled Mirror and indirect methods. The study involved the addition of 0.45 m3/h of liquid, and the results indicated that phase change and condensate formation were not observed at this level. The analysis conducted in the study focused on determining the dew point through these detection methods [15]. In the study conducted by Navarro-Ochoa and Figueredo-Medina, the critical temperature parameters of Colombian natural gas were determined. According to the Colombian regulations for natural gas transmission, the cricondentherm must not exceed 7.2 °C. However, the study suggests that a different cricondentherm limit could be proposed for the Caribbean coast based on the weather conditions. An investigation was conducted in the study on the methods of determining hydrocarbon dew points in gas transmission lines globally, and a thermodynamic and hydraulic study was developed considering the weather conditions on the Caribbean coast. The PR was utilized as the thermodynamic model in the study. The unprocessed natural gas composition from three different gas wells was used as reference. Based on the results, it was concluded that a new critical condensing temperature was determined to be between 10–12.6 °C due to the hot weather conditions in Colombia [16]. The study by M.S. Shah aimed to determine the hydrocarbon dew point of natural gas resources in different locations in Bangladesh in order to avoid hydrocarbon condensation. To achieve this, experiments were conducted to determine the effects of sample volume, chamber temperature, and sample conditioning on the measured dew points. The results showed that there was no effect from sample volume or sample conditioning, but the chamber temperature was observed to have a slight effect of approximately 0.9 °C on the measured dew points. The findings highlight the importance of carefully controlling the conditions during the measurement process to accurately determine the hydrocarbon dew point [17]. According to the study presented by W. Zamrudy at the ATASEC conference, the offshore natural gas lines of a gas company have a depth of 70 m, which poses a risk of condensation. The aim of the study was to evaluate the impact of different operating conditions on condensate formation between two stations located 105 km apart. The Aspen HYSYS program was used to simulate the data received from the gas chromatograph device at station A, as well as the piping properties and operating conditions from station B. The results showed that liquid phase formation occurred in the offshore pipeline between stations B and C on the second day. To prevent this, the authors proposed passing the natural gas through a separator or treating it with carbon dioxide separation and cleaning the pipeline through pigging [18]. In this study, presented at the Abu Dhabi International Fair and Congress, the authors aim to determine the hydrocarbon dew point pressure using smart algorithms. The estimation of the hydrocarbon dew point temperature is challenging due to the variability of composition and distribution in natural gas reserves. Currently, various methods such as equations of state, analytical methods, and empirical correlations are used to estimate the hydrocarbon dew point pressure at variable temperatures and compositions. However, these methods have limitations such as low precision or high computational costs. To address these limitations, the authors develop a new empirical correlation for hydrocarbon dew point pressure estimation using computational intelligence algorithms, such as artificial neural networks, functional networks, and support vector machines. The results show that hydrocarbon dew point pressure estimation is possible within a short calculation time, and among the models used, artificial neural networks have the lowest average absolute error, the highest coefficient of determination, and a mathematical model that does not require specialized knowledge [19]. In the research conducted by Schouten, it is observed that changes in pressure and temperature within the pipeline can result in the temperature of the natural gas approaching the hydrocarbon dew point temperature, thereby increasing the likelihood of natural gas liquid formation. To address this issue, the study investigates the effect of adding hydrogen to the mixture. The results of the analysis, which included a 16.7% addition of hydrogen, suggest that the mixture had a positive impact on reducing the formation of liquid [20].
In the study conducted by Olsen, the aim is to produce hydrocarbons at the highest level within the framework of economic and environmentally friendly practices in the oil and natural gas industry. The research focuses on evaluating various physical and chemical methods for the recovery of natural gas liquids and examining the advantages and disadvantages of these methods. [21]. In the article by Abeer M. Shoaib, simulation of parameters such as pressure, temperature, and bypass ratio are conducted to calculate the density of condensate in the DPCU unit of the Dabaa gas production facility in Egypt. Additionally, a study is presented that explores the replacement of the JT valve with a turboexpander [22]. In the study conducted by Zaidi, an economic model is presented for the prevention of the formation of natural gas liquid. The objective of the research is to convert valuable and unaccounted natural gas liquids into liquid fuel through filtration. The cost analyses of cyclonic and cartridge-based filtration options are performed [23]. In the article authored by Bian and Cao, the application of supersonic separation technology in the production of natural gas is evaluated. This technology, used to separate impurities, water, and natural gas liquids from natural gas, is explored through theoretical analysis, experimentation, and numerical analysis of the condensation characteristics of the Laval nozzle and the separation mechanism of the supersonic separator. The study also provides a summary of the research on natural gas liquefaction and the separation of acidic gases. The cooling performances of the Laval nozzle, turboexpander, vortex tube, and JT valve are compared, with the Laval nozzle emerging as a promising new technology with superior cooling performance [24].
Studies of Natural Gas Liquids in natural gas facilities have been conducted to understand the causes of formation and methods to eliminate them. The focus of these studies has been on the methods of indirect and direct measurement of the hydrocarbon dew point temperature. These methods are primarily used for direct and indirect measurement on transmission lines and for the basic operation of liquid dispersion in accompanying gas production processes. Although some literature references the distribution networks below 50 bar pressure, there are limited direct studies on comprehensive analysis and measurement for low-pressure networks. Natural gas lines have different designs for transportation from production to distribution and delivery to end-users. Hence, each natural gas transmission or distribution network should be evaluated based on its design values and analyzed accordingly. The study presented in this article compares indirect analysis using decomposition methods specified in the literature, as well as a new approach created based on C6+ measurement data and compared to the accepted methods.
1.2. Purpose and Scope of the Study
The objective of the article is to verify the presence of heavy hydrocarbons in natural gas transmission lines, particularly those that have not undergone fractionation due to various reasons such as fractionation costs. The current gas chromatography devices used in the system are unable to measure heavy hydrocarbons, since they are C6+. Therefore, determining heavy hydrocarbon presence is not possible with the current operation methods. In the study, the C6+ natural gas data were first fractionated into C6, C7, and C8 using commonly used methods in the literature. Subsequently, experimental methods were used to determine the distribution of heavy hydrocarbons between C9–C19, thereby indirectly analyzing new data. The results of the indirect analysis were compared to the formation characteristics of the natural gas liquid problem encountered by the regional regulators. This comparison was made by monitoring the output temperatures of the regional stations manually and through SCADA, observing the two-phase flow situation detected in the analysis. All indirect analyses were carried out for the purpose of data analysis validation, with the aim of creating alternative methods to prevent the formation of natural gas liquids that are likely to exist and are present in the system.
In this study, the indirect analysis method was used to calculate cricondenbar and cricondentherm values for four different splitted C6/C7/C8 compositions. Additionally, the heavy hydrocarbon composition from C9 to C19 was deduced based on the distribution of C6+ direct measurement data. The newly created composition was analyzed using the indirect method to estimate the hydrocarbon dew point temperature and pressure with greater precision. The results of the calculation based on the data from the C6+ gas chromatograph showed that it was highly unlikely for a gas/liquid two-phase region to occur in the system. This study aimed to determine the pressure and temperature conditions under which the formation of a gas/liquid two-phase region occurs, by performing more sensitive analyses for the indirect hydrocarbon dew point.
2. Methodology
2.1. Definition of the Problem
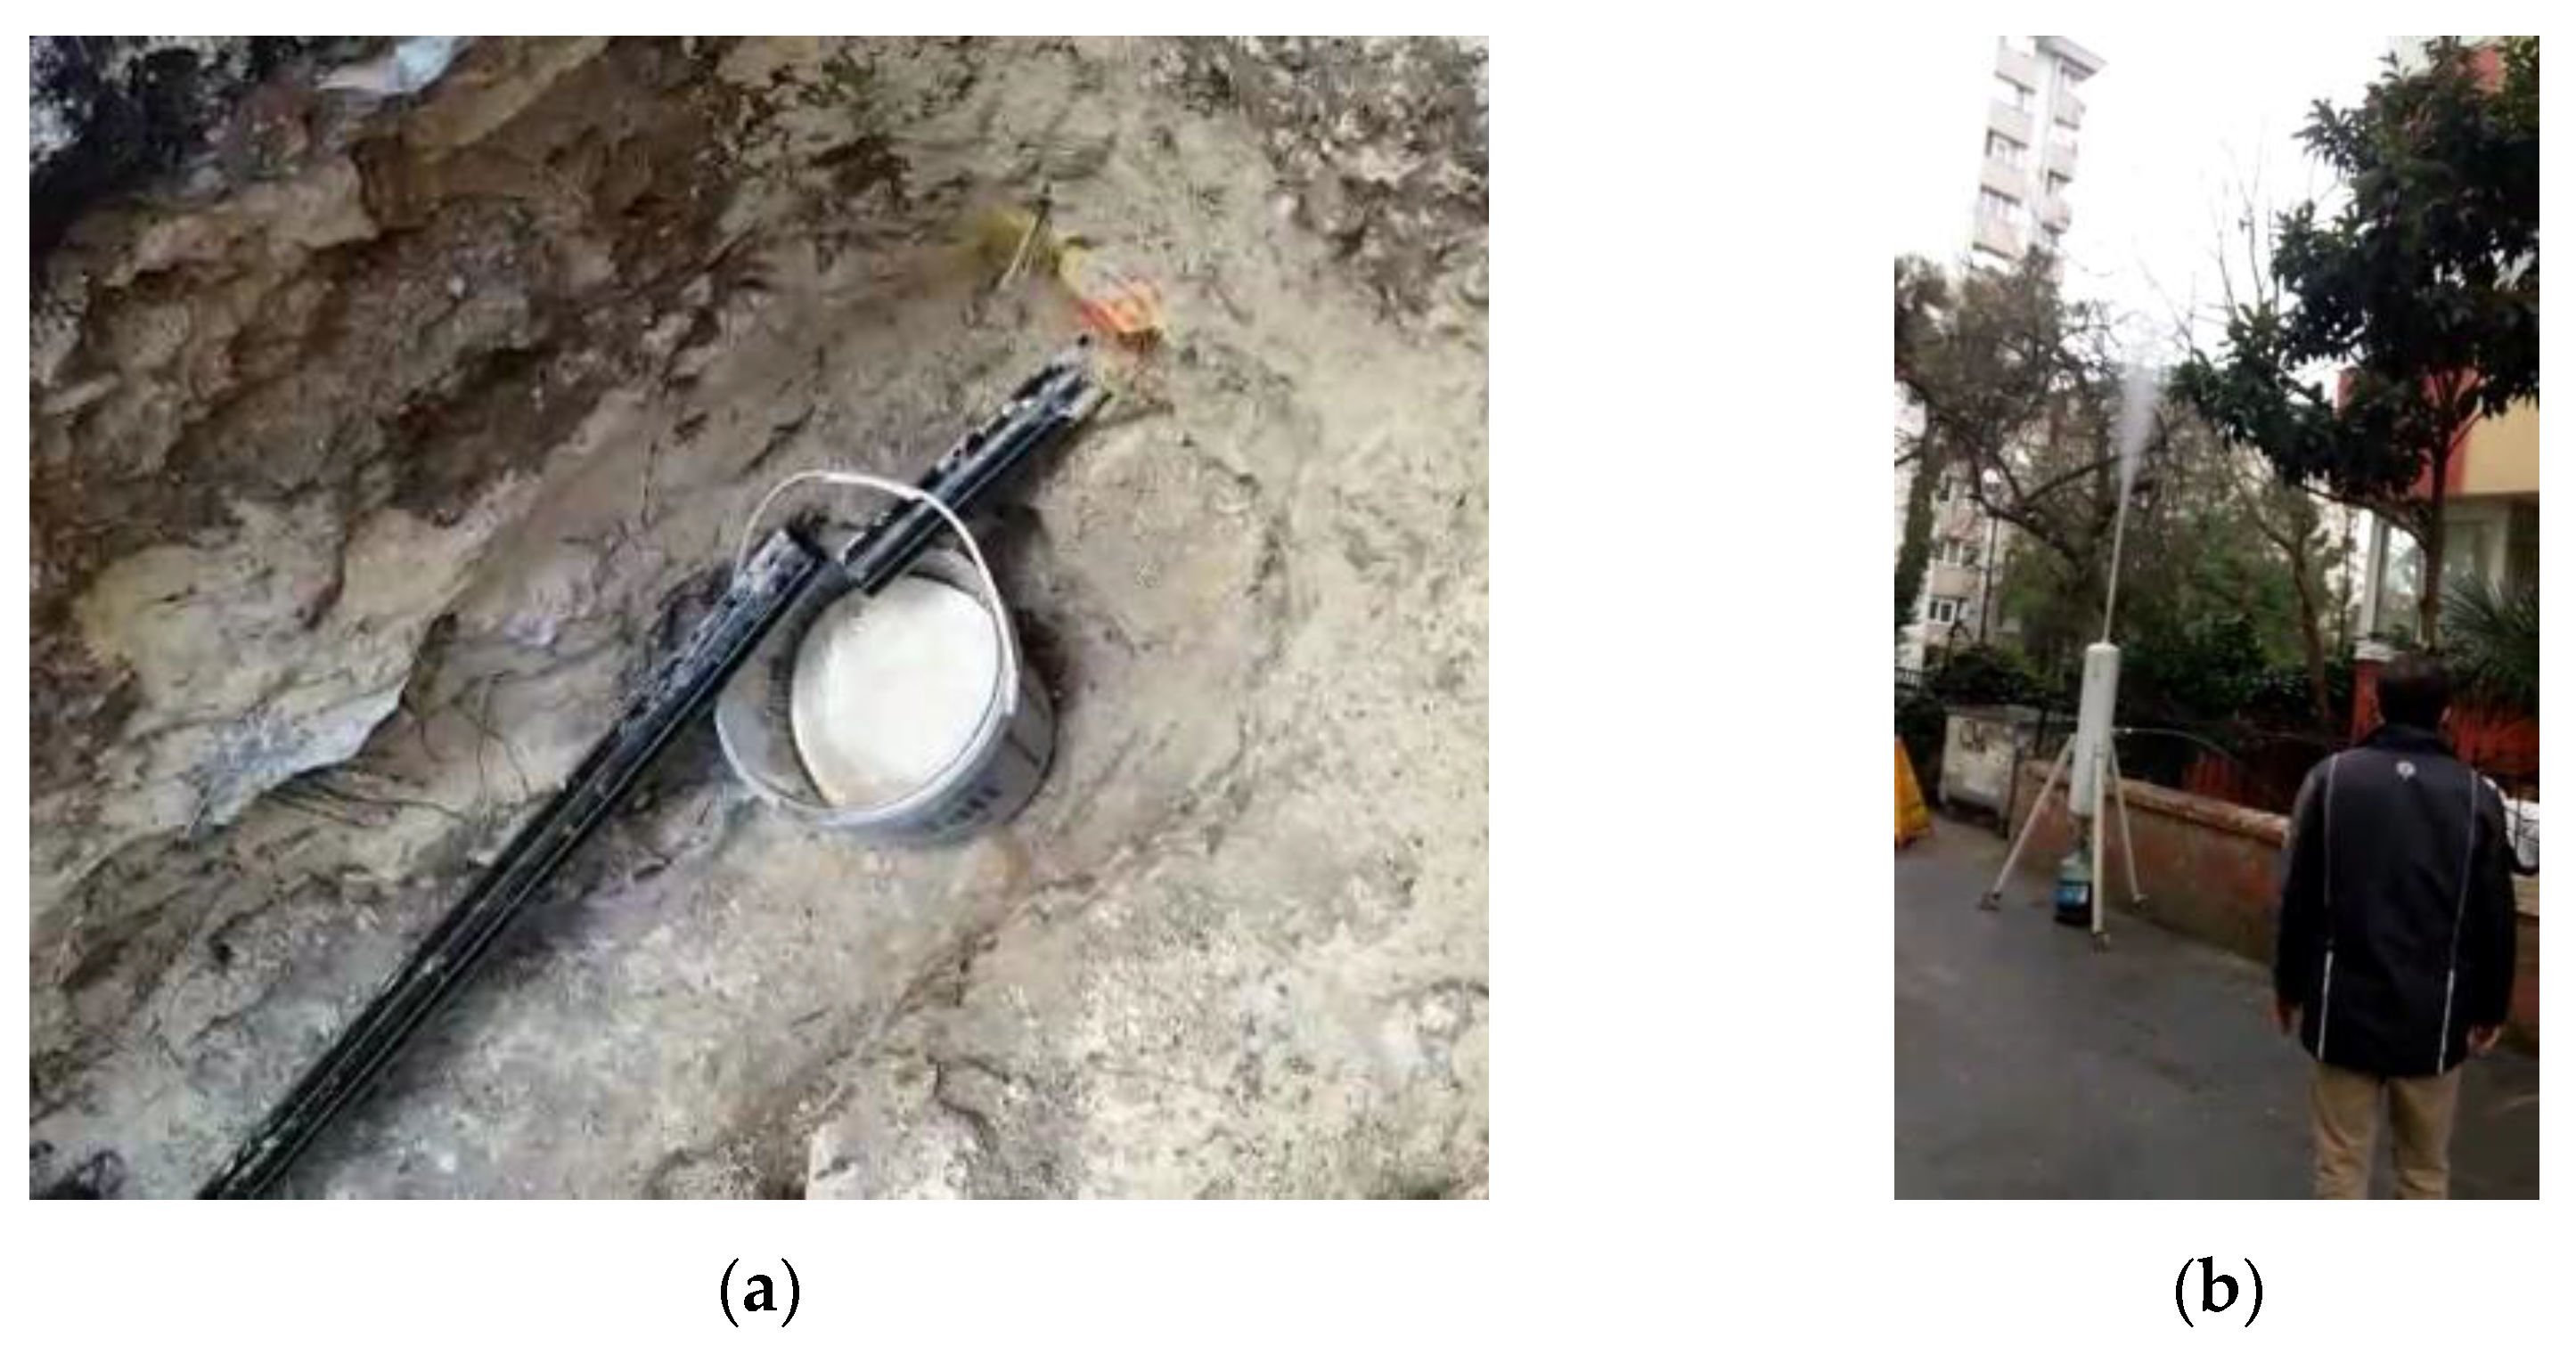
Natural gas, which is distributed at 20 bar pressure from city gate stations, is reduced to 4 bar pressure at B-stage stations without applying additional heating. After B-stage stations, natural gas liquids can accumulate in the regulators, meters, and combustors of end users fed from pipelines. These natural gas liquids can be removed using various methods, as shown in the figures in Figure 2.
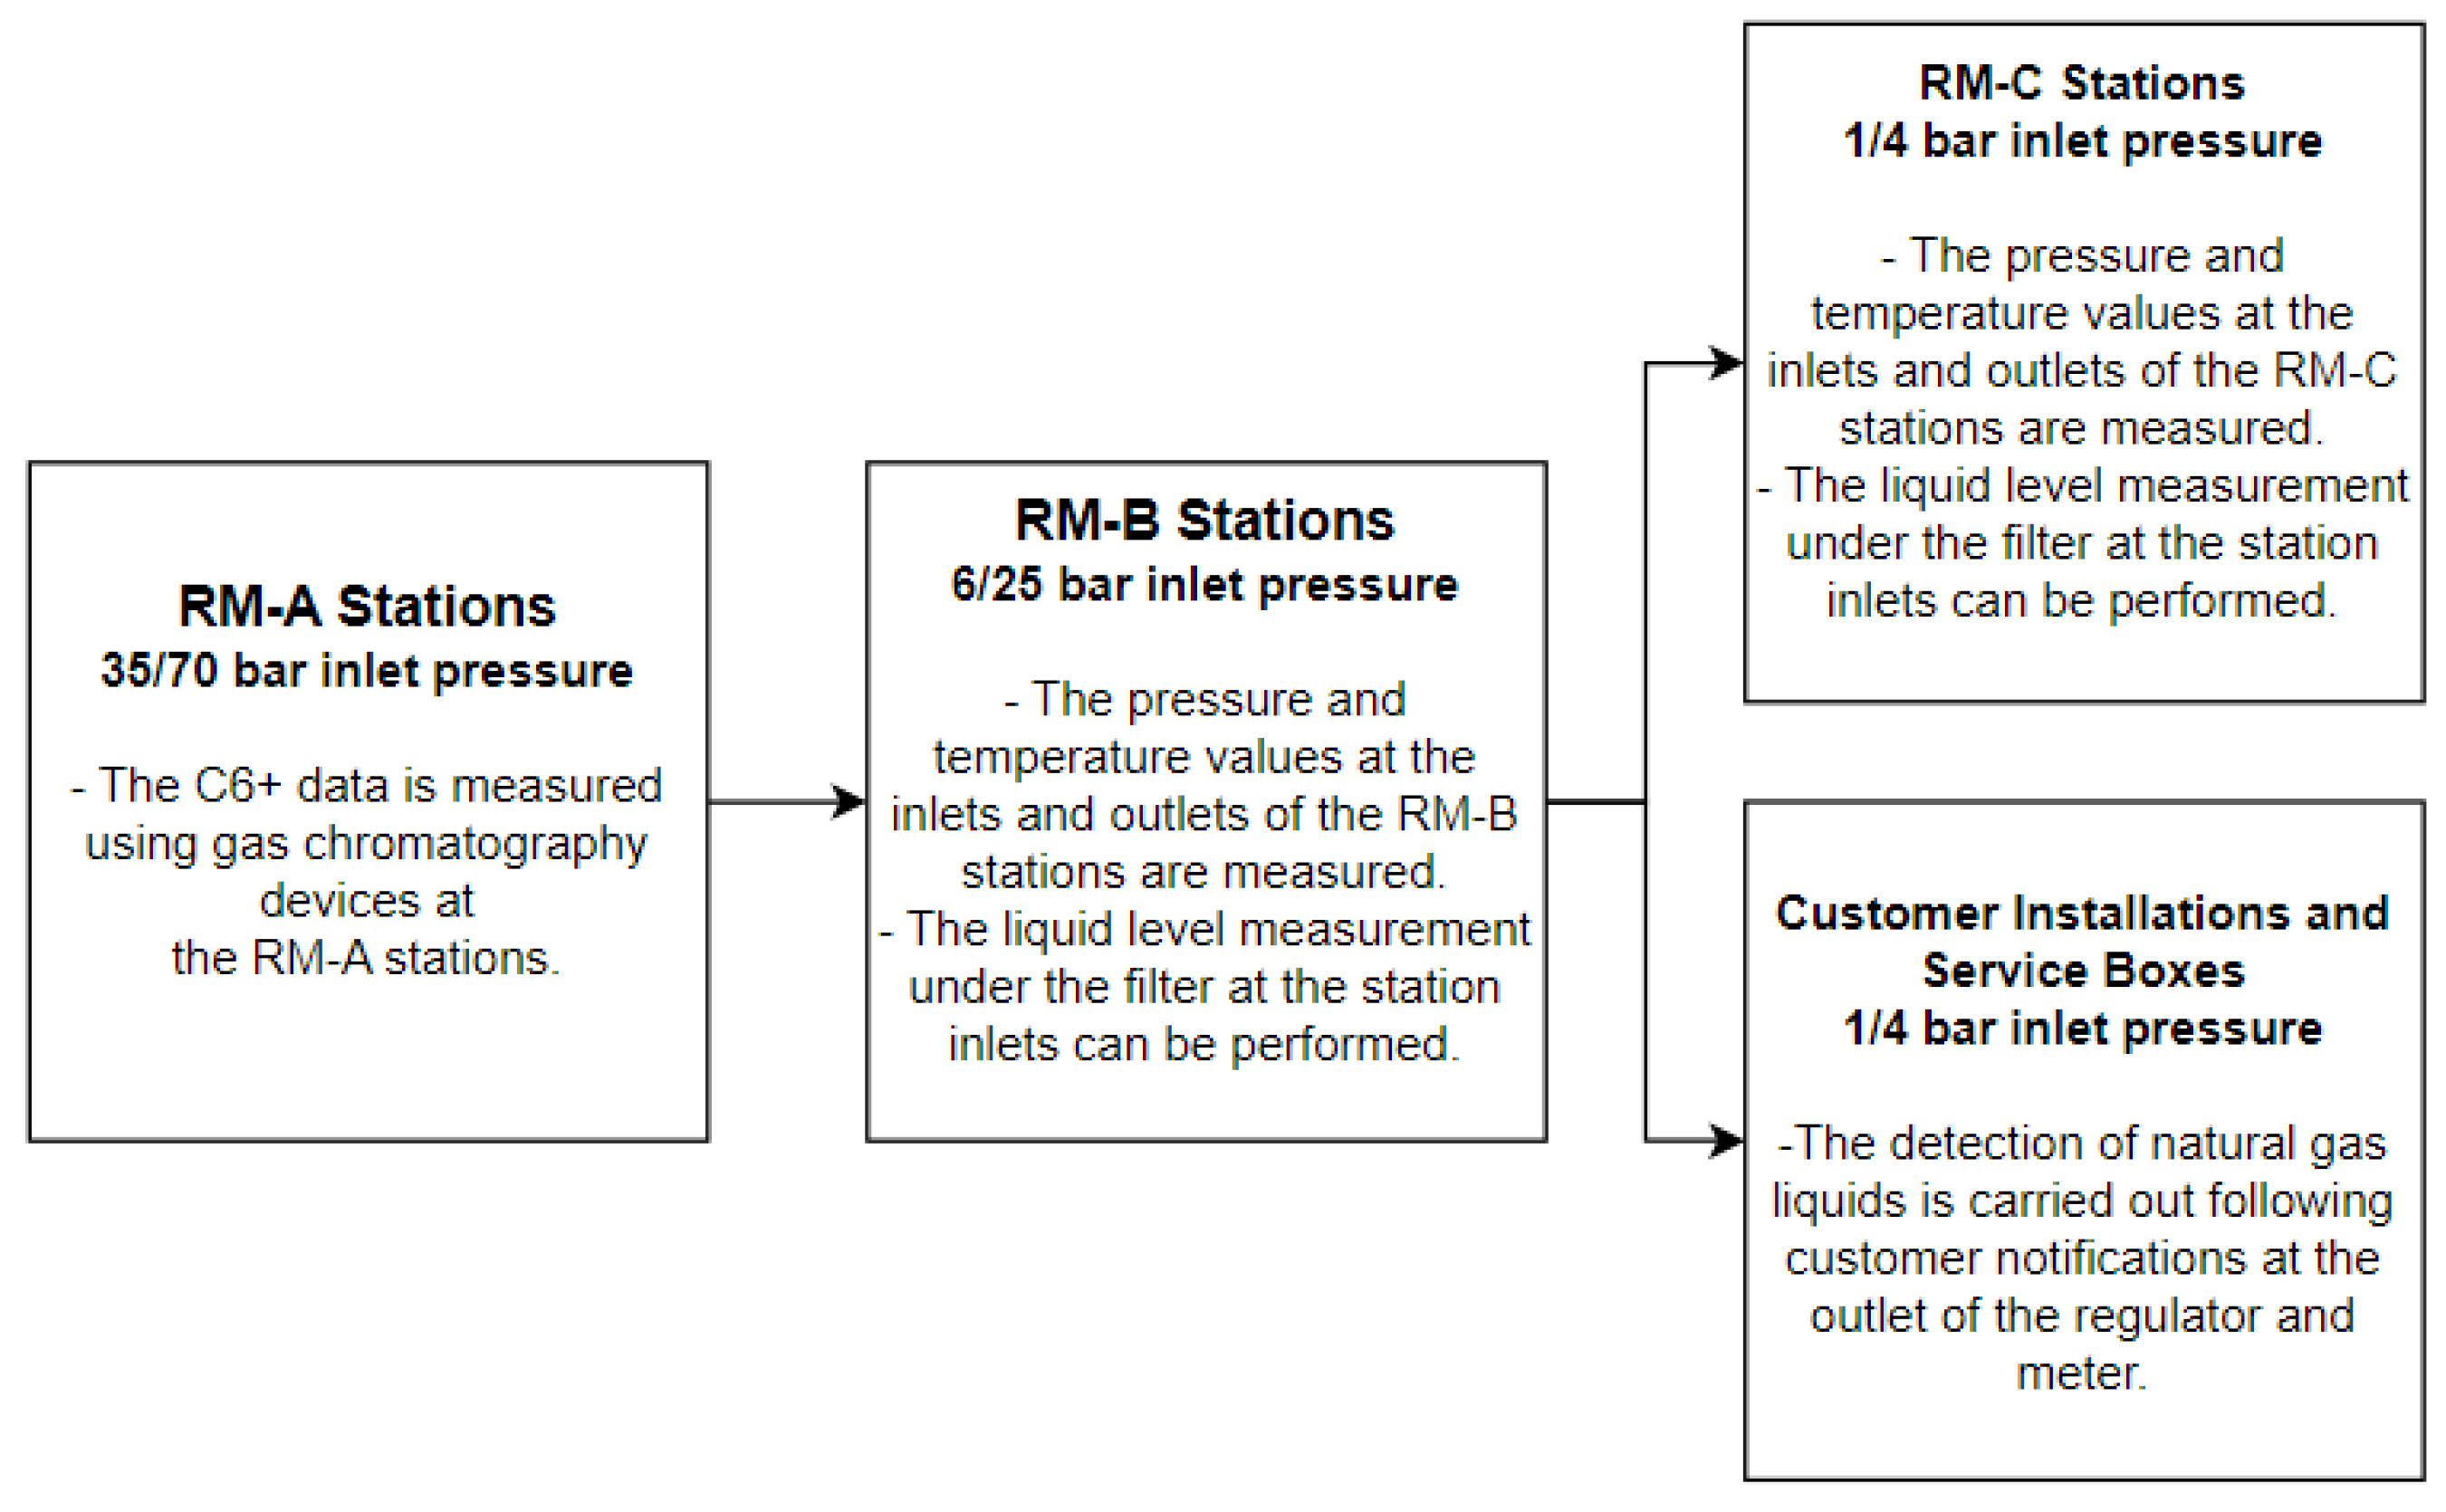
The natural gas distribution process, starting from the RM-A station to the final consumer, involves a number of measurements such as analysis values, pressure, and temperature at the RM-A station. At the second-stage station, RM-B, pressure, temperature, and liquid level values are measured in regions with natural gas liquid issues. Temperature and pressure values are also measured at RM-C stations, which are the final part of the distribution network. The measurements performed regarding natural gas are summarized in Figure 3.
In this study, the formation of natural gas liquids is investigated and the problem is addressed at its source through a thorough examination and subsequent analysis. During the second stage regulation, the natural gas cools down by approximately 8 °C as a result of a 16-bar pressure drop, in accordance with the JT expansion principle. As the B stations are above-ground facilities, it has been observed that the inlet temperatures can drop below 0 °C during winter conditions, resulting in outlet temperatures of −8 °C after regulation [25,26].
2.2. Gas Chromatography and Hydrocarbon Splitting Methods
At the city gate stations of natural gas distribution pipelines, direct measurements of the inlet gas are taken using C6+ or C9+ gas chromatography devices, in accordance with the methods outlined by American Gas Association (AGA). Further analysis is performed using data from two different C6+ gas chromatography devices [27]. In the analysis of natural gas mixtures using gas chromatography, the methods developed by Gas Producers’ Association (GPA) are utilized for determining the compositions [28]. The dew point temperature of natural gas can also be measured directly using a gas analyzer or a Chilled Mirror device. The adoption of these devices at the stations has made it possible to measure the dew point temperature continuously with an accuracy of approximately 2 °C [29]. In this study, data obtained from C6+ gas chromatography are analyzed using methods approved by the AGA, providing a more precise composition. The data are further analyzed through the SimSci Pro II software program (Version 9.0, Invensys Systems, Lake Forest, CA, USA), utilizing PR state equations, leading to the development of an estimation for the hydrocarbon dew point.
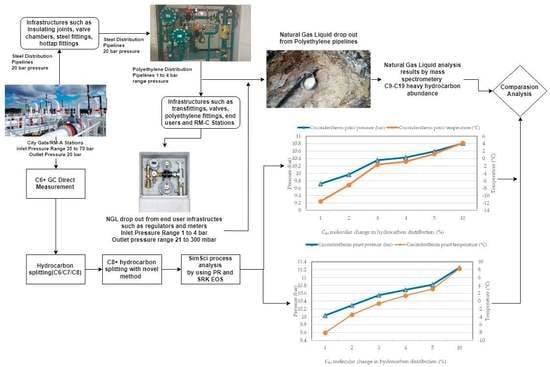
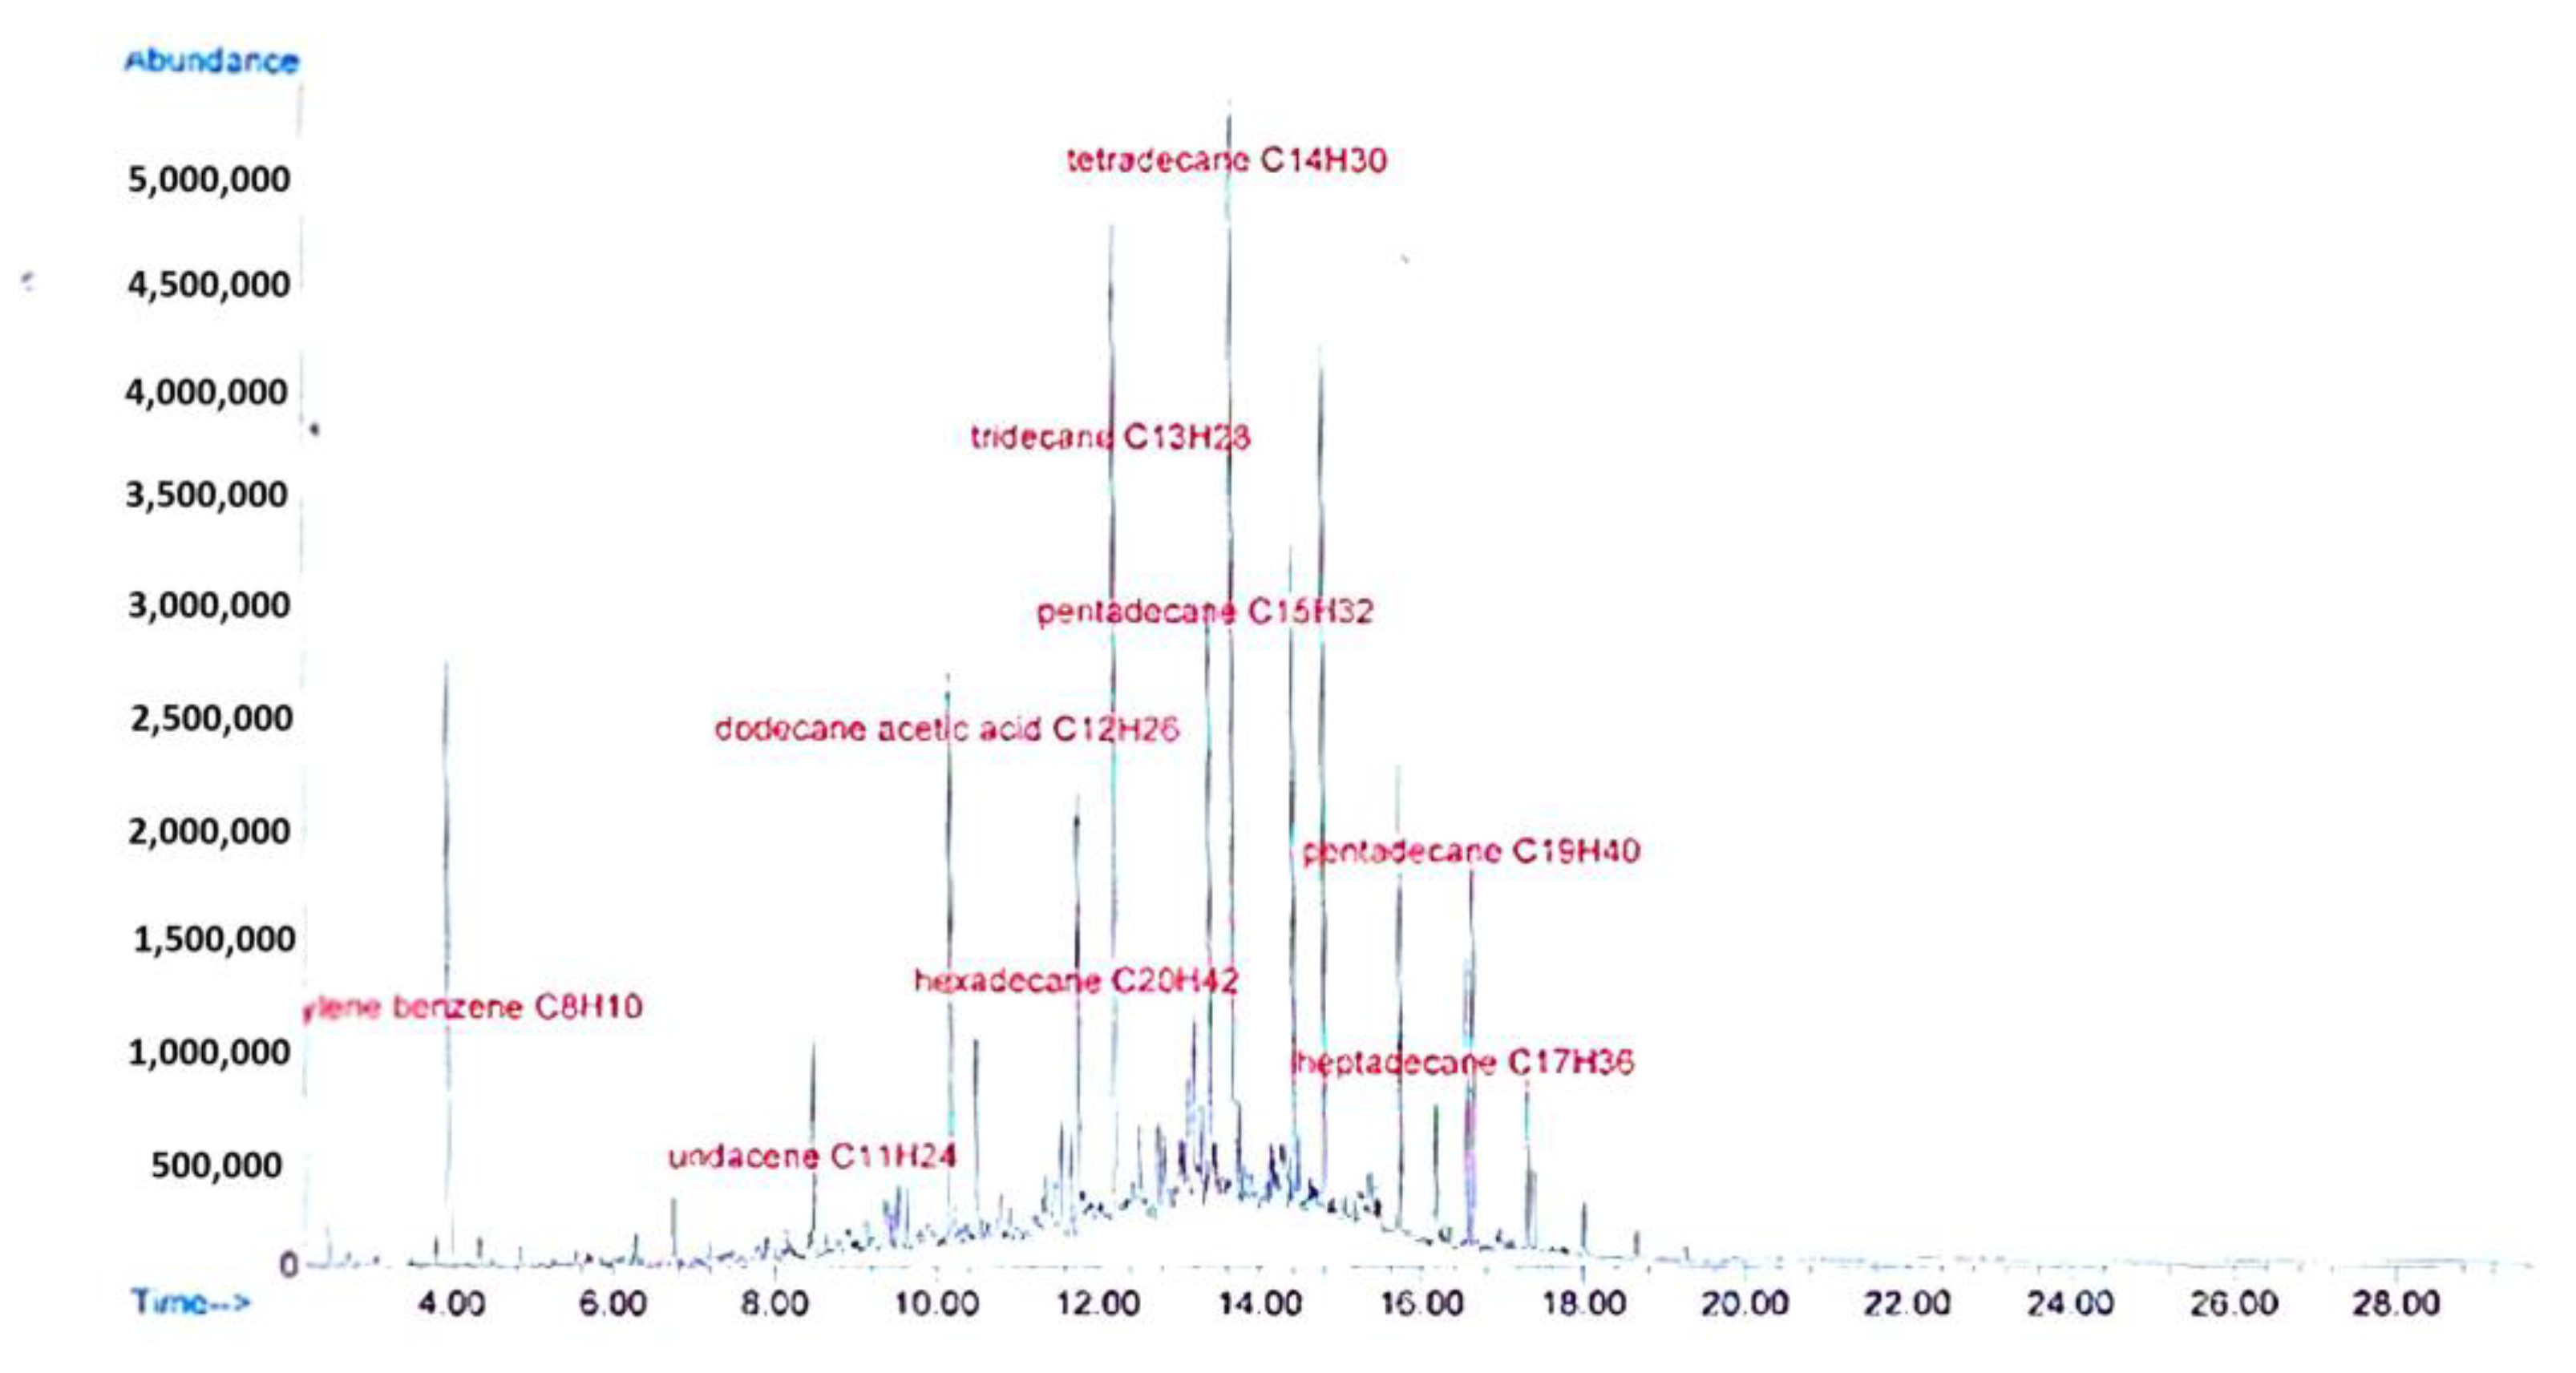
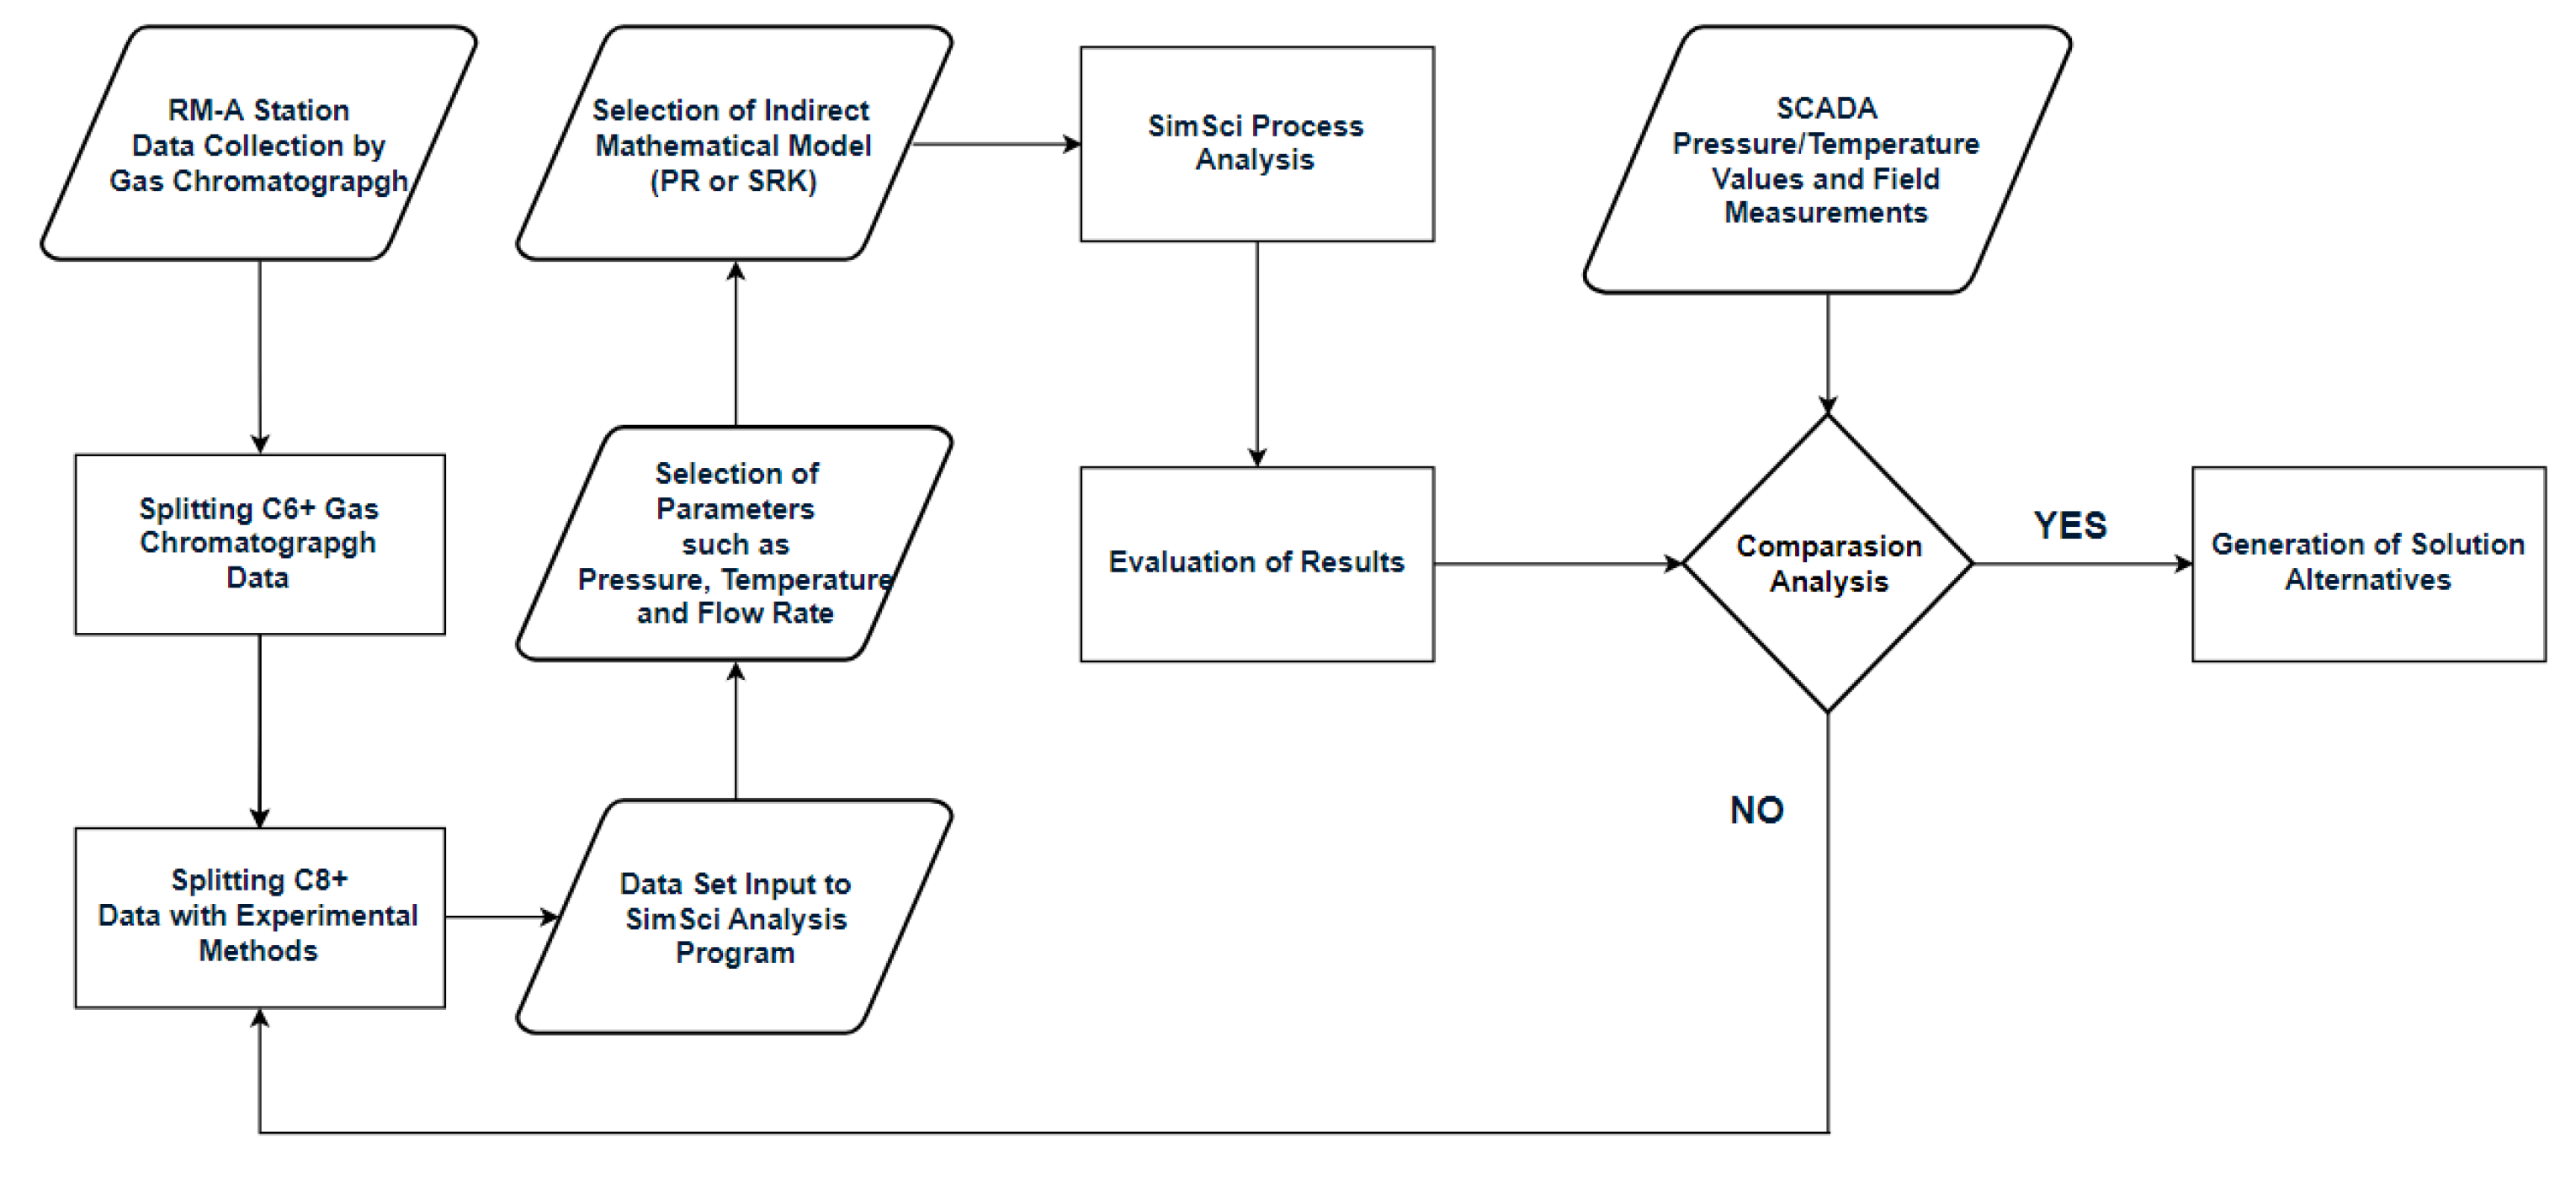
In the present study, the dew point temperature of natural gas was determined using mass spectrometry analysis. The analysis was performed on a liquid sample extracted from the natural gas mixture, and the density of the sample was determined to be C12–C13. The results of the analysis, which showed the presence of heavy hydrocarbons up to C19, are presented in Figure 4. In addition to the C1–C5 data obtained from gas chromatography, the C6–C7–C8 components were separated by using accepted experimental methods. The data for the C9 to C19 components were separated experimentally and the HCDP temperature and heavy hydrocarbon density were then analyzed based on the measurement point temperatures. The flow chart of the analyses performed is given in Figure 5 below.
3. RM-A Stations Process Analysis
3.1. Equations of State
In the analysis studies carried out in the gas industry, the Peng–Robinson state equation and Soave–Redlich–Kwong state equation are commonly used and recognized as the volume equations. The algebraic form of these two equations is identical, with some differences being observed in the parametric coefficients.
The foundation of the volume equations lies in the ideal gas equation, and parameters are added to the volume equations to account for the non-ideal behavior of real gases. The Peng–Robinson state equation and the Soave–Redlich–Kwong state equation have been given in the same form in the following Equation (1).
The Peng–Robinson and Soave–Redlich–Kwong equations utilize different values for some parametric coefficients. Nevertheless, they give quite different boiling point temperature values for the same gas sample. The comparison of the acentric parameters in the two state equations is given in the following Equations (2) and (3). The comparison of the parameters used in the equations is given in Table 1 below.
The parameters used in the Peng–Robinson and Soave–Redlich–Kwong equations are based on experimental parameters for pure gases. Modifications must be made to calculate these parameters in mixtures of multiple gases. Equations for mixtures of multiple gases are described below in Equations (4)–(6) [30].
3.2. SimSci Analysis of City Gate Stations
In the study, analyses were conducted on the gas distribution network of Istanbul. Results from two active RM-A stations in the city, obtained from the C6+ chromatograph device, were utilized as indicated in Table 2 and Table 3 below.
PR equations are applied to analyze the data obtained from the gas chromatography measurements at the city gate stations using the SimSci Pro II program. The C6+ components are not separated prior to simulation, and mathematical methods are used to separate them into C6, C7, and C8 components. Result are showed in Table 4 and Table 5 below.
Four methods have been utilized for the C6+ split, including GPA 60/30/10, Daniels 47/36/17, GPA 50/25/25 and 37.3/36.6/26.1 (Method A), developed by Aniefiok and Boniface. These methods are widely employed by international natural gas distribution companies and are accepted by API [7].
In the research, a comparison was made between the values obtained from C6+ chromatography and four different indirect analysis methods using the SimSci process analysis program. The results of this comparison were recorded in Table 6.
The process analyses of the C8+ data using indirect methods, including the newly developed Method A by Aniefiok and Boniface, were performed. The analysis also involved the experimental differentiation of the heavy hydrocarbon density between C9–C19, which was detected in the analysis and triggers the two-phase flow region.
The results in Table 7 are utilized for the separation of hydrocarbon data between C9–C19. The most effective method for determining the hydrocarbon dew point among the prioritized methods is identified. It is concluded that the indirect calculation results obtained using the 37.3/36.6/26.1 (Method A) decomposition method are closest to the two-phase region. This separation is performed as expressed in Equations (7) and (8).
The distribution of C8+ data were calculated based on the presence of C8, with a variation ranging from 99% to 90%. The remaining 1% to 10% was distributed among the remaining C9–C19 compounds. This distribution was calculated using Equations (9)–(14), with a focus on the average values of the hydrocarbon concentration data between C1–C5 obtained from the C6+ gas chromatograph. To minimize the effect of increasing hydrocarbon density, the remaining percentage was experimentally distributed, starting from C14 to C19. The resulting distribution of C9–C19 is presented in Table 7.
The distribution ratios specified in Table 7 have been applied to the C9+ composition between C9 to C19, as indicated in Equation (14).
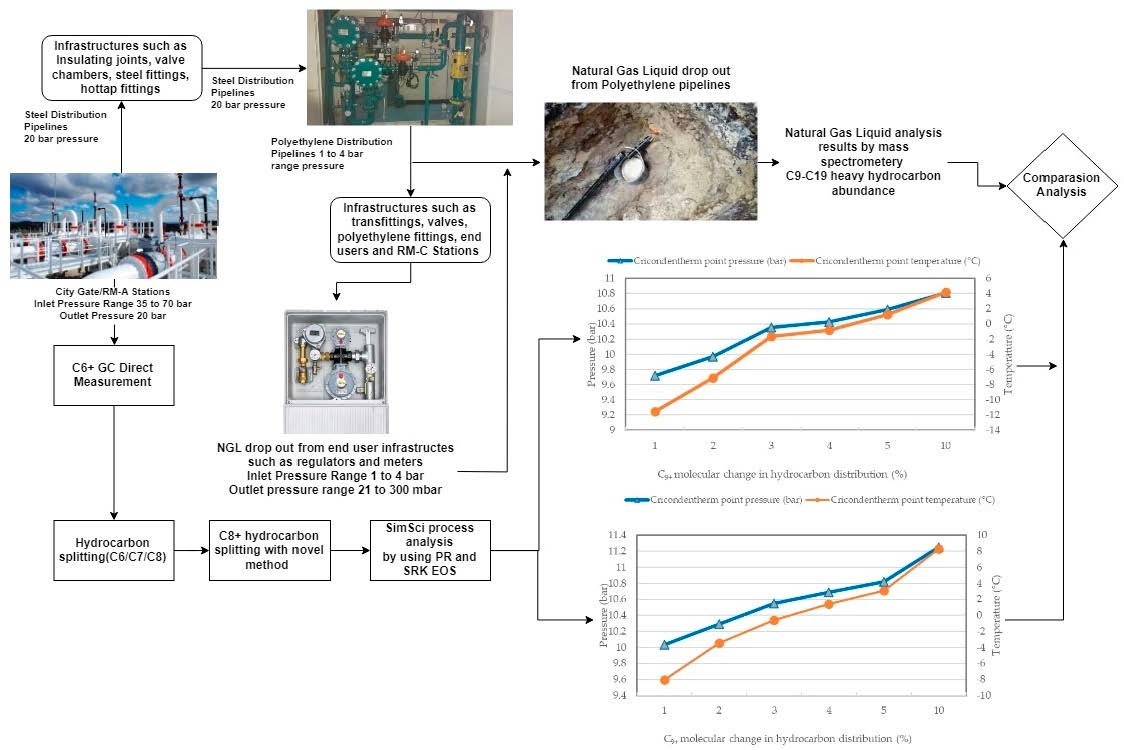
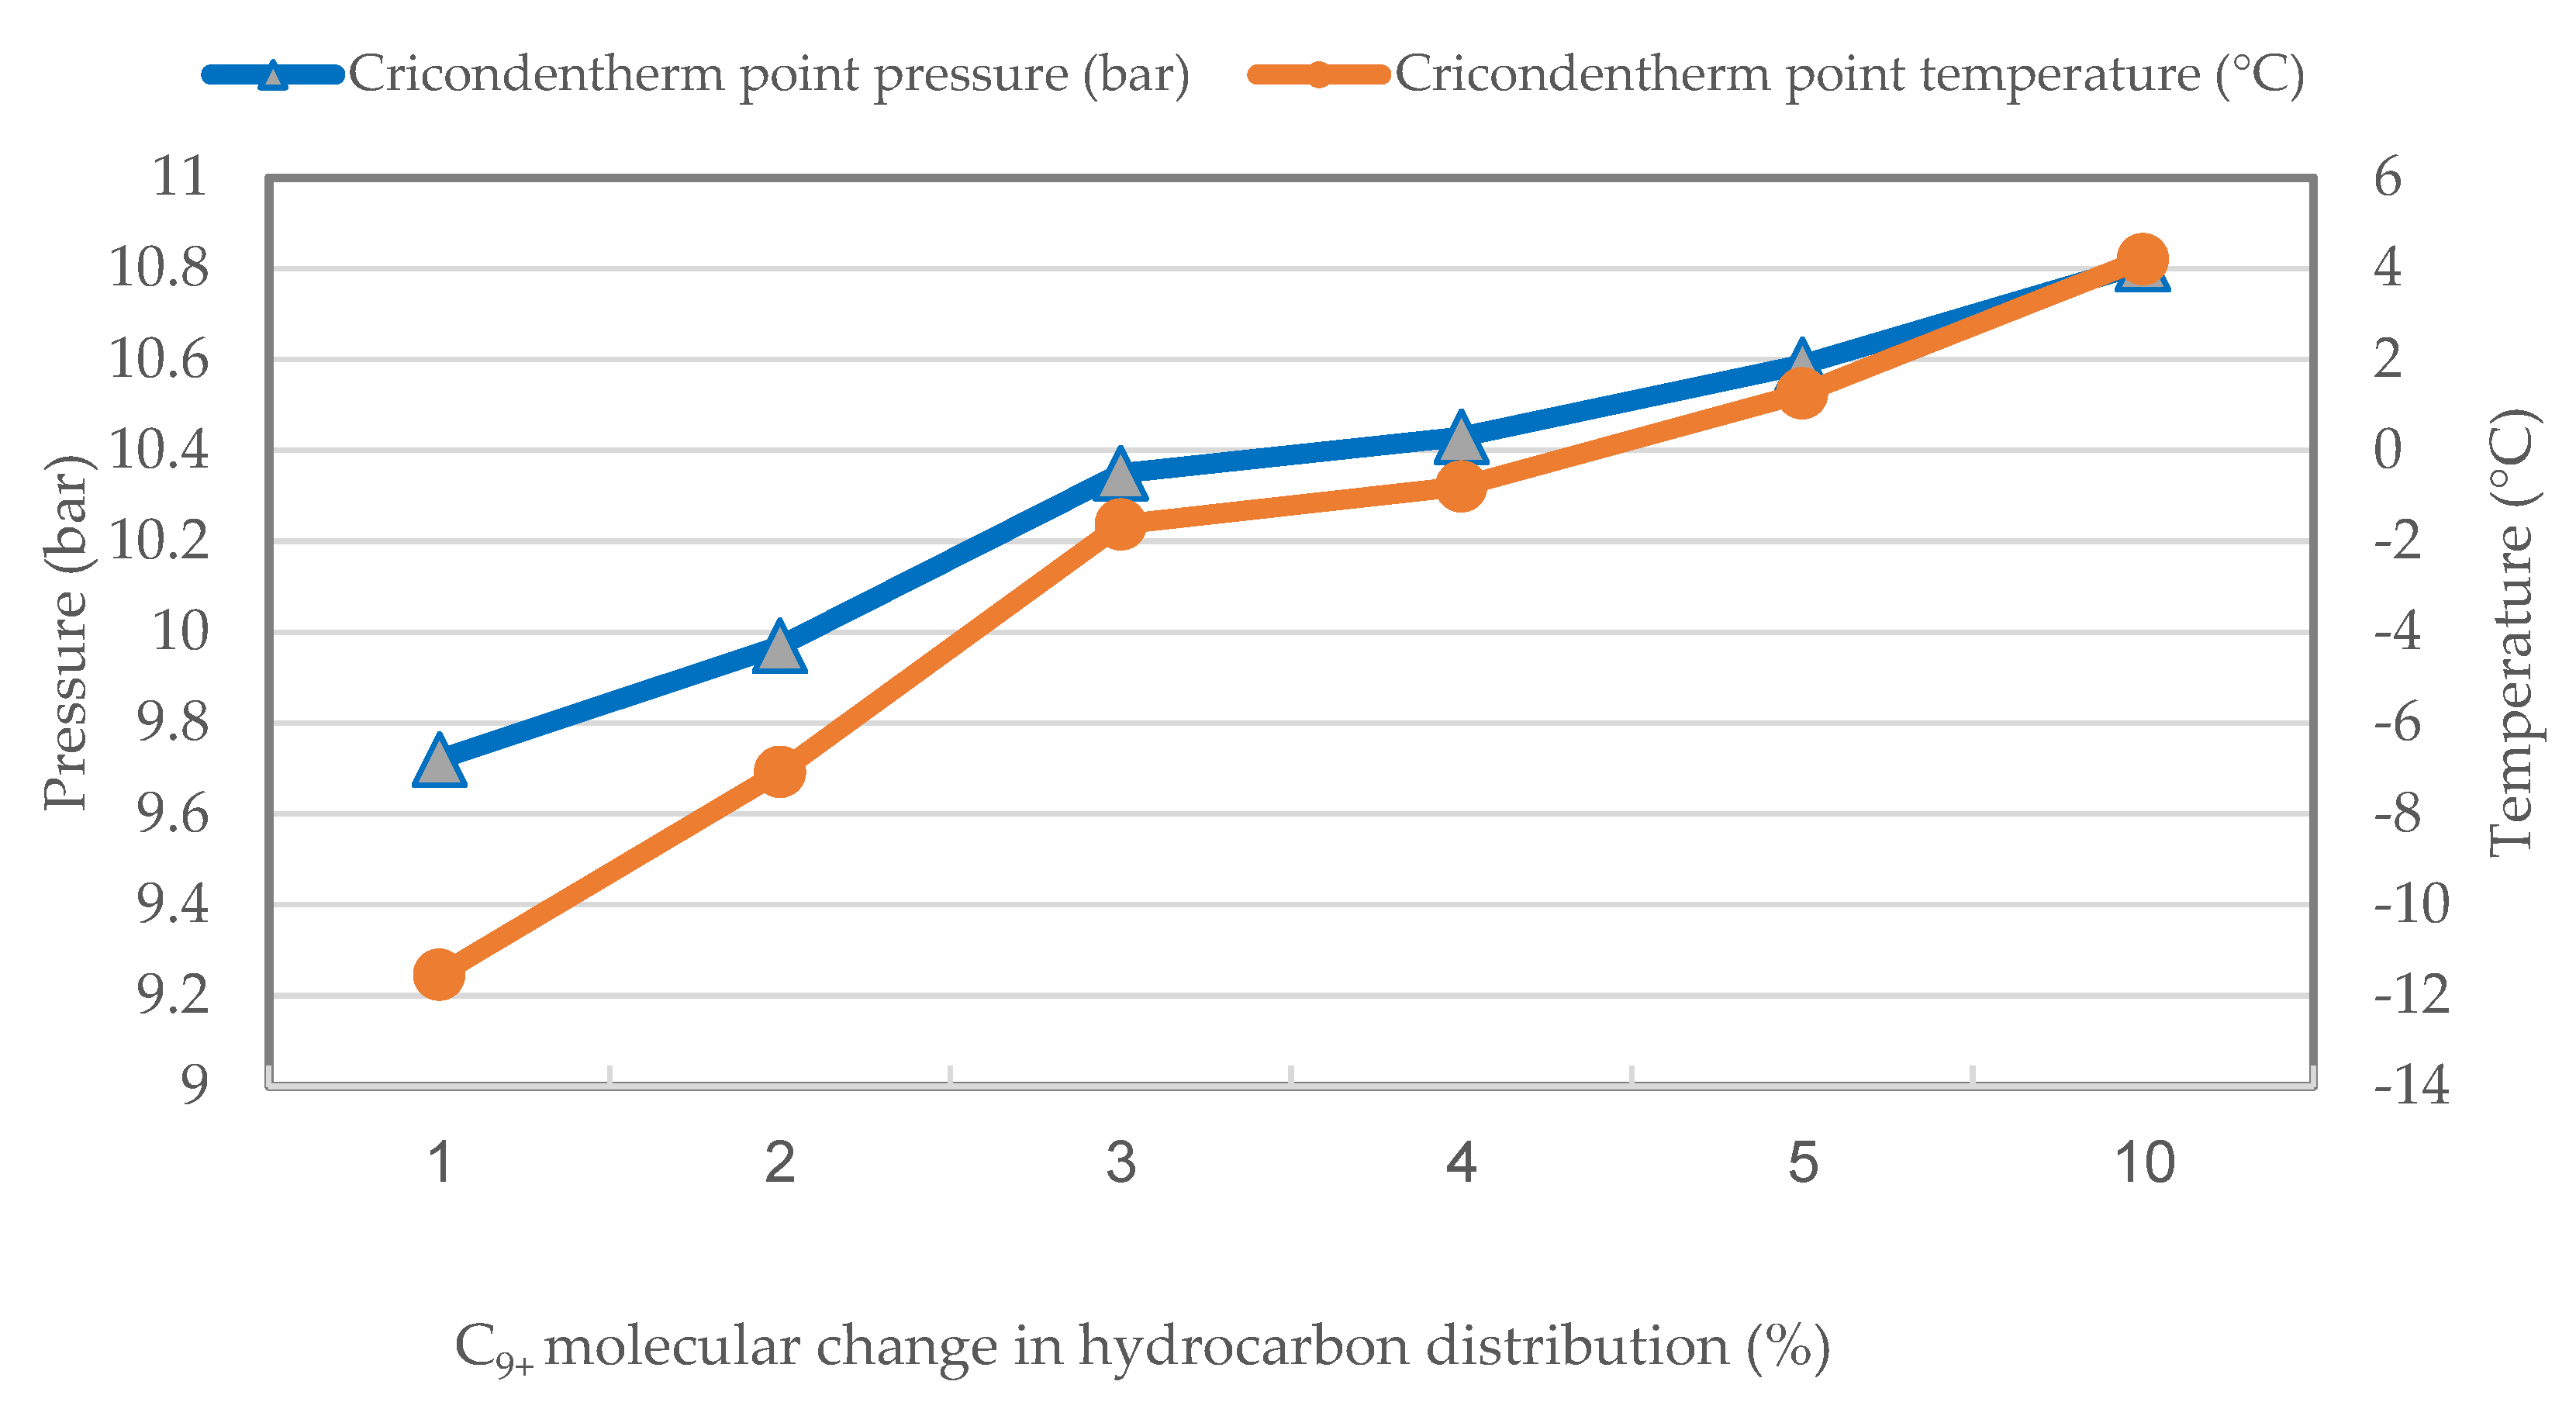
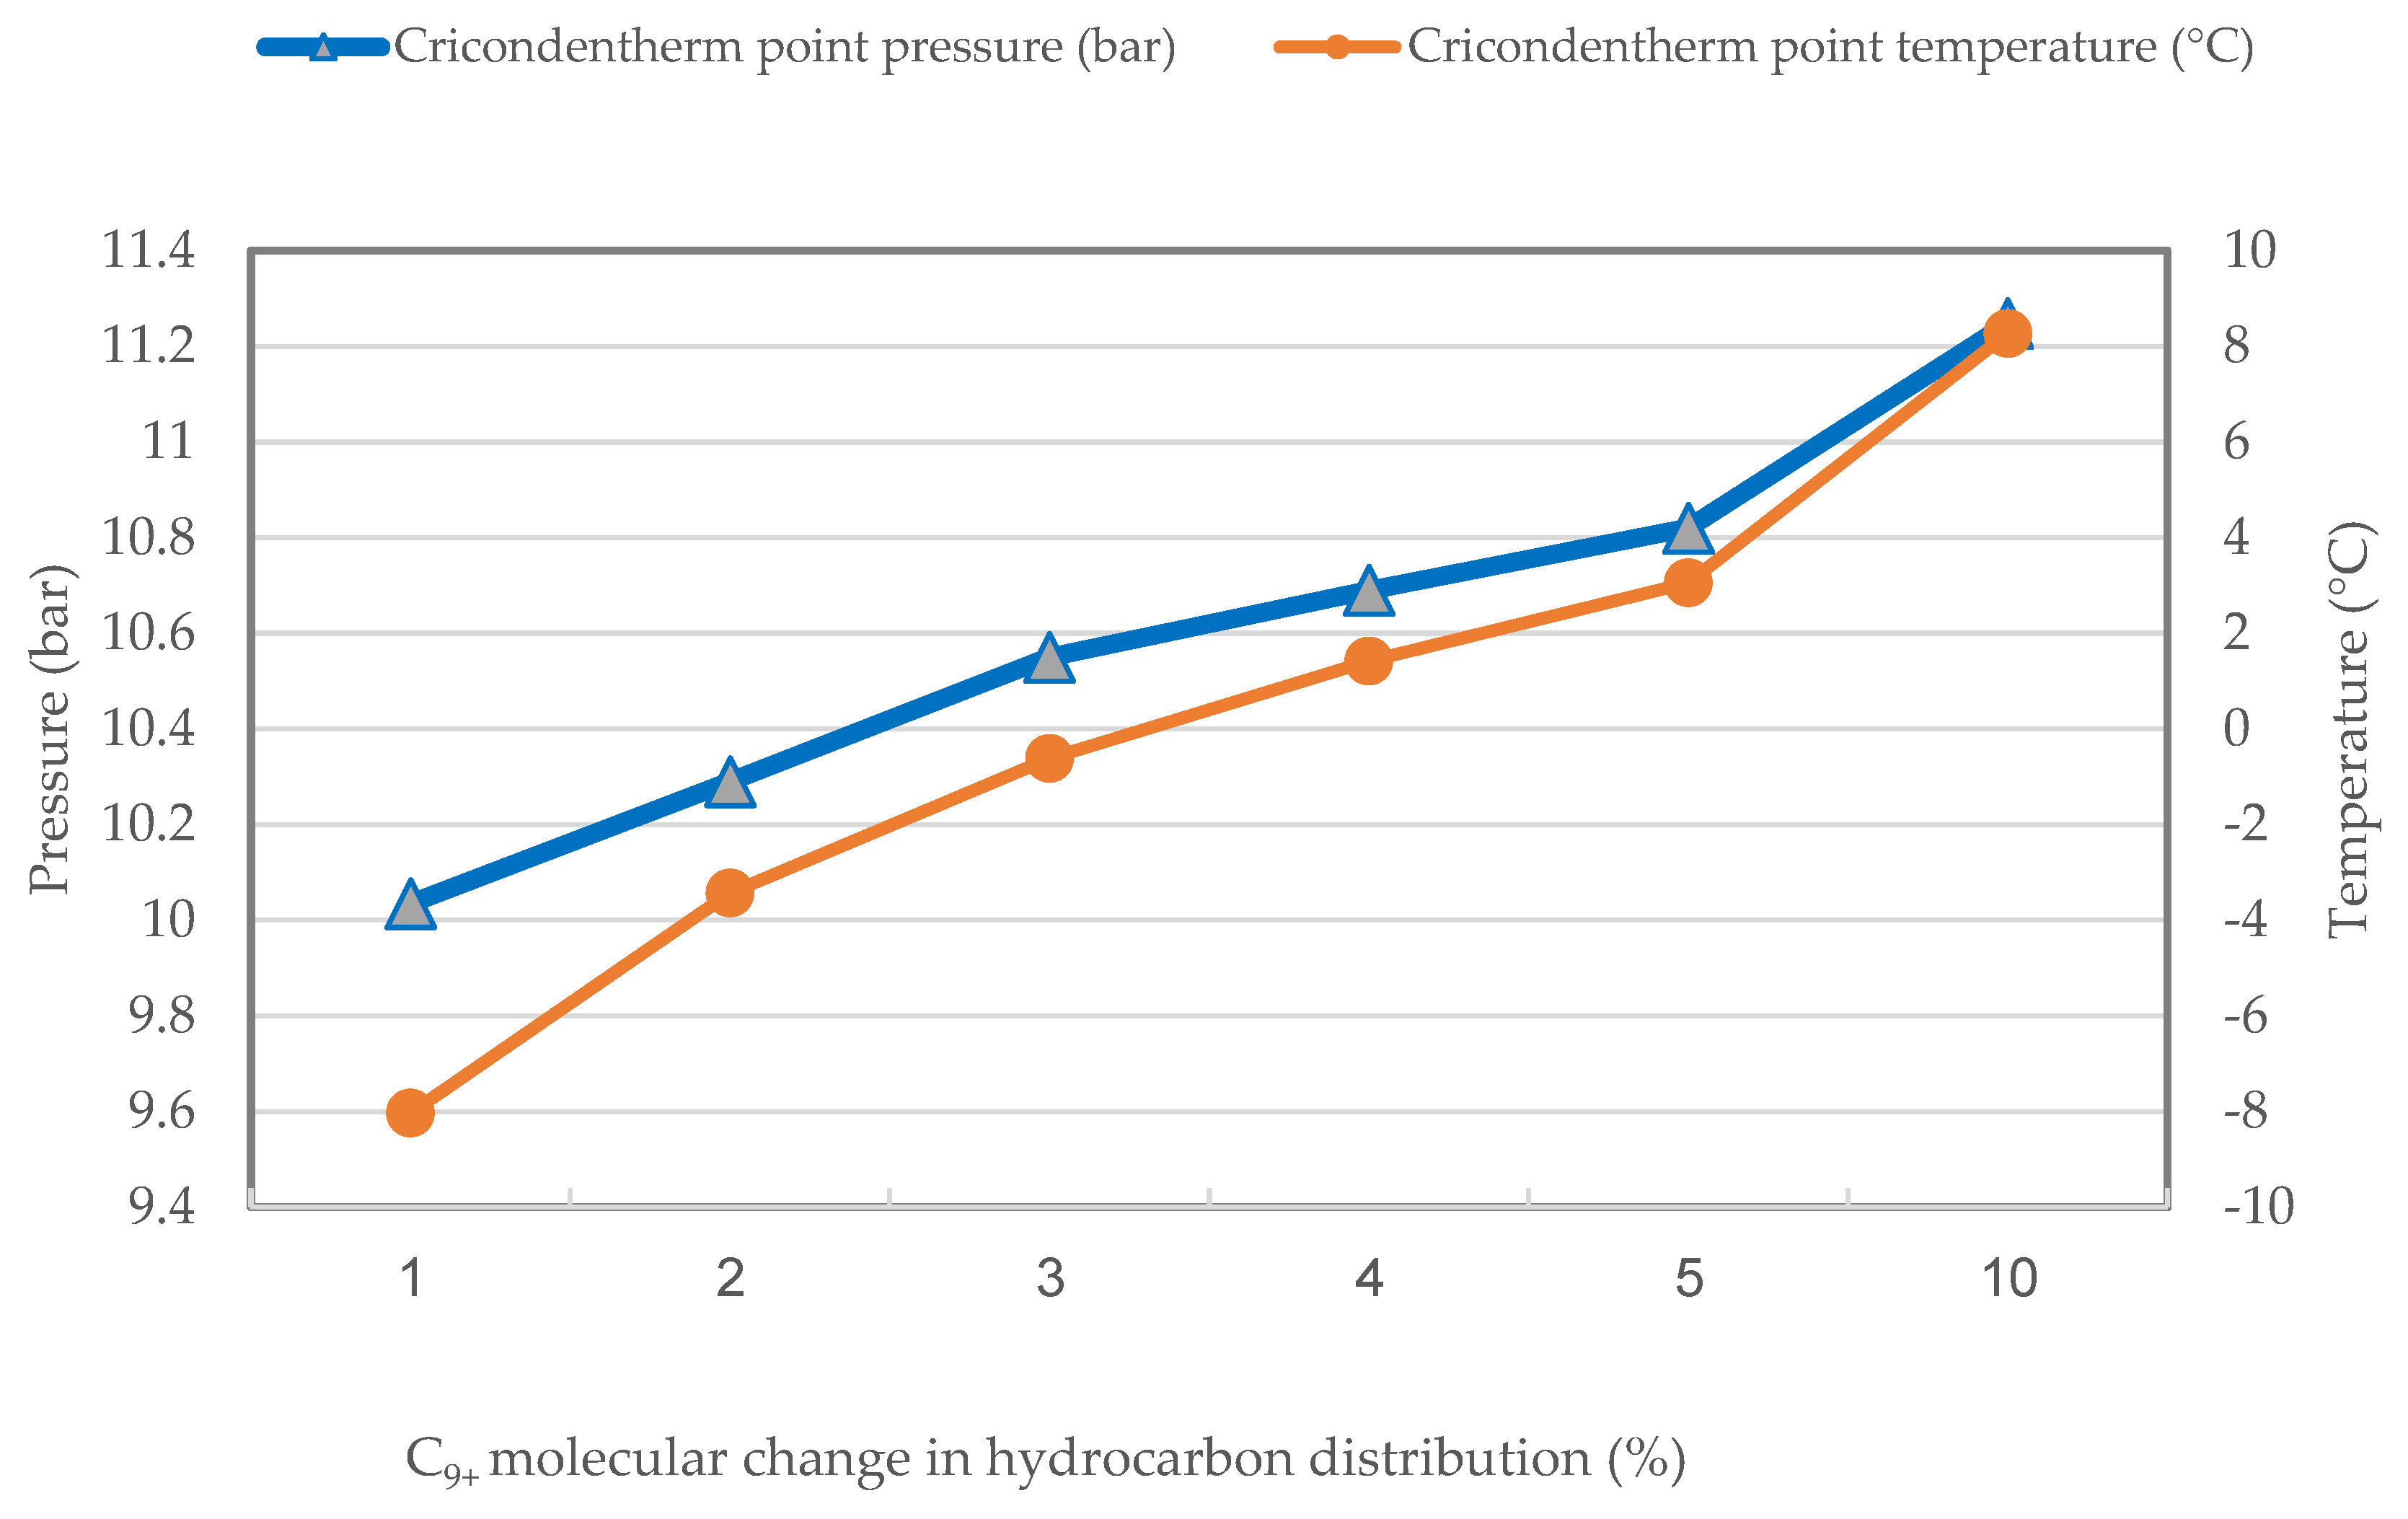
The results of the analysis of the hydrocarbon distribution between C9 and C19 in the natural gas pipeline from Pendik and Esenyurt RM-A stations were re-examined by applying chromatographic data from the station, as presented in Table 7. The values obtained from the indirect analysis are depicted in Table A1 and Table A2, Figure 6 and Figure 7.
The C9+ distribution ratios calculated in Figure 6 and Figure 7, based on the values obtained from the analysis results, and in Table A1 and Table A2, were calculated using Method A. The C8+ data calculated using Method A were separated into C8 and C9+. This separation was performed based on the assumption that the density of C8 constituted the majority in the composition. The composition of C9+ was formed at six different points ranging from 1% to 10% for the resulting composition. The heavy hydrocarbons between C9–C19 were made in accordance with the experimental distribution ratios in Table 7. As a result, when the C9+ data were concentrated, the slope of the graph increased.
The findings demonstrate an increase in the critical temperature of condensation due to the refinement of the hydrocarbon mixture’s concentration. Additionally, the results indicate the formation of a two-phase flow regime, particularly during the second stage control.
4. Conclusions
The analysis of the data collected from the city gate stations using gas chromatographs was performed using SimSci Pro II. The thermodynamic analysis was carried out using the commonly used PR and SRK state equations. Results are given according to PR equations. Similar results are also observed by using SRK equations. It was noted that the measurement sensitivity of the gas chromatograph is limited to C6+, thus resulting in the inability to measure hydrocarbons heavier than C6. In order to determine the hydrocarbon dew point more accurately, mathematical separation methods commonly used by international natural gas companies were employed to separate the C6+ data.
In the SimSci Pro II program, gas compositions at two different city gate stations in Istanbul were evaluated using the aforementioned methods. The sensitivity of the gas analysis was found to result in a shift of the hydrocarbon dew point temperature in a positive direction. The limited measurement of C6+ using the gas chromatography devices was found to be insufficient in determining the hydrocarbon dew point accurately. Hence, it is crucial to improve the precision of gas composition measurement at city gate stations.
In conclusion, the cricondentherm temperature was observed to have increased from −52.33 °C to 8.27 °C at the Esenyurt RM-A station. At the points where the cricondentherm was measured in the phase diagram at the Esenyurt RM-A station, the corresponding pressure values were 28.14 bar and 11.25 bar, respectively. At the Pendik RM-A station, the cricondentherm temperature increased from −50.87 °C to 4.21 °C, and the corresponding pressure values were 30.73 bar and 10.81 bar.
Two-phase flow is a potential issue in the outlet pipelines of regional stations during high-demand periods, when gas pressure decreases and velocity increases. The exact flow regimes and conditions for two-phase flow are difficult to determine, as they are dependent on the gas velocity. Nonetheless, it is recognized that different conditions can occur depending on the gas velocity. This risk was specifically noted in the RM-B stations, particularly during the winter months when the natural gas temperature is −8 °C and the pressure is 10–11 bar.
Author Contributions
Conceptualization, E.N.A. and A.V.A.; methodology, E.N.A.; software, E.N.A.; validation, E.N.A. and A.V.A.; formal analysis, E.N.A.; investigation, E.N.A. and A.V.A.; resources, E.N.A.; data curation, E.N.A.; writing—original draft preparation, E.N.A.; writing—review and editing, E.N.A. and A.V.A.; visualization, E.N.A.; supervision, A.V.A.; project administration, A.V.A.; funding acquisition, E.N.A. All authors have read and agreed to the published version of the manuscript.
Funding
This research received no external funding.
Data Availability Statement
Not applicable.
Acknowledgments
The authors wish to thank Istanbul gas distribution company and Yildiz Technical University for assistance to this work.
Conflicts of Interest
The authors declare no conflict of interest.
Abbreviations
| AGA | American gas association |
| API | American petroleum institute |
| ATASEC | applied science and engineering conference |
| BOTAS | Turkish petroleum transport corporation |
| DPCU | dew point control unit |
| EOS | equation of state |
| GC | gas chromatography |
| GERG | European gas research group |
| GPA | gas producers’ association |
| HCDP | hydrocarbon dew point |
| HYSYS | Hyprotech chemical process simulator |
| JT | Joule–Thompson |
| PC-SAFT | perturbed chain statistical associating fluid theory |
| PR | Peng–Robinson equation |
| PSRK | predictive Soave–Redlich–Kwong equation |
| RM-A | city gate station |
| RM-B | district regulator |
| SRK | Soave–Redlich–Kwong equation |
| SRK-Twu | Soave–Redlich–Kwong and Twu combined model |
| UMR-PRU | Transformed Peng–Robinson thermodynamic model |
Appendix A

Table A1.
C9–C19 data analysis of Pendik RM-A station.
| State-1 | State-2 | State-3 | State-4 | State-5 | State-6 | |
|---|---|---|---|---|---|---|
| C8+ Molar Weight (%) | 0.00129 | |||||
| C9+ Distribution Percentage (%) | 1 | 2 | 3 | 4 | 5 | 10 |
| C9+ Molar Weight (%) | 1.29 × 10⁵ | 2.58 × 10⁵ | 3.87 × 10⁵ | 5.16 × 10⁵ | 6.45 × 10⁵ | 1.29 × 10⁴ |
| C8 Molar Weight (%) | 1.28 × 10³ | 1.26 × 10³ | 1.25 × 10³ | 1.24 × 10³ | 1.23 × 10³ | 1.16 × 10³ |
| C9 (% Weight-Molar Weight) | 95 | |||||
| 1.23 × 10⁵ | 2.45 × 10⁵ | 3.68 × 10⁵ | 4.90 × 10⁵ | 6.13 × 10⁵ | 1.23 × 10⁴ | |
| C10 (% Weight-Molar Weight) | 3.5 | |||||
| 4.52 × 10⁷ | 9.03 × 10⁷ | 1.35 × 10⁶ | 1.81 × 10⁶ | 2.26 × 10⁶ | 4.52 × 10⁶ | |
| C11 (% Weight-Molar Weight) | 0.5 | |||||
| 6.45 × 10⁸ | 1.29 × 10⁷ | 1.94 × 10⁷ | 2.58 × 10⁷ | 3.23 × 10⁷ | 6.45 × 10⁷ | |
| C12 (% Weight-Molar Weight | 0.25 | |||||
| 3.23 × 10⁸ | 6.45 × 10⁸ | 9.68 × 10⁸ | 1.29 × 10⁷ | 1.61 × 10⁷ | 3.23 × 10⁷ | |
| C13 (% Weight-Molar Weight) | 0.15 | |||||
| 1.94 × 10⁸ | 3.87 × 10⁸ | 5.81 × 10⁸ | 7.74 × 10⁸ | 9.68 × 10⁸ | 1.94 × 10⁷ | |
| C14 (% Weight-Molar Weight) | 0.13 | |||||
| 1.68 × 10⁸ | 3.35 × 10⁸ | 5.03 × 10⁸ | 6.71 × 10⁸ | 8.39 × 10⁸ | 1.68 × 10⁷ | |
| C15 (% Weight-Molar Weight) | 0.11 | |||||
| 1.42 × 10⁸ | 2.84 × 10⁸ | 4.26 × 10⁸ | 5.68 × 10⁸ | 7.10 × 10⁸ | 1.42 × 10⁷ | |
| C16 (% Weight-Molar Weight) | 0.09 | |||||
| 1.16 × 10⁸ | 2.32 × 10⁸ | 3.48 × 10⁸ | 4.64 × 10⁸ | 5.81 × 10⁸ | 1.16 × 10⁷ | |
| C17 (% Weight-Molar Weight) | 0.09 | |||||
| 1.16 × 10⁸ | 2.32 × 10⁸ | 3.48 × 10⁸ | 4.64 × 10⁸ | 5.81 × 10⁸ | 1.16 × 10⁷ | |
| C18 (% Weight-Molar Weight) | 0.09 | |||||
| 1.16 × 10⁸ | 2.32 × 10⁸ | 3.48 × 10⁸ | 4.64 × 10⁸ | 5.81 × 10⁸ | 1.16 × 10⁷ | |
| C19 (% Weight-Molar Weight) | 0.09 | |||||
| 1.16 × 10⁸ | 2.32 × 10⁸ | 3.48 × 10⁸ | 4.64 × 10⁸ | 5.81 × 10⁸ | 1.16 × 10⁷ | |
| Cricondentherm (°C) @ Natural Gas Pressure (bar) | −11.54 | −7.08 | −1.63 | −0.798 | 1.257 | 4.21 |
| 9.72 | 9.97 | 10.35 | 10.43 | 10.5886 | 10.81 | |
| Cricondenbar (bar) | 59.18 | 60.19 | 61.04 | 59.7 | 62.3 | 64.39 |
Table A2.
C9–C19 data analysis of Esenyurt RM-A station.
| State-1 | State-2 | State-3 | State-4 | State-5 | State-6 | |
|---|---|---|---|---|---|---|
| C8+ Molar Weight (%) | 0.0021768 | |||||
| C9+ Distribution Percentage (%) | 1 | 2 | 3 | 4 | 5 | 10 |
| C9+ Molar Weight (%) | 2.18 × 10⁵ | 4.35 × 10⁵ | 6.53 × 10⁵ | 8.71 × 10⁵ | 1.09 × 10⁴ | 2.18 × 10⁴ |
| C8 Molar Weight (%) | 2.16 × 10³ | 2.13 × 10³ | 2.11 × 10³ | 2.09 × 10³ | 2.07 × 10³ | 1.96 × 10³ |
| C9 (% Weight-Molar Weight) | 95 | |||||
| 2.07 × 10⁵ | 4.14 × 10⁵ | 6.20 × 10⁵ | 8.27 × 10⁵ | 1.04 × 10⁴ | 2.07 × 10⁴ | |
| C10 (% Weight-Molar Weight) | 3.5 | |||||
| 7.62 × 10⁷ | 1.52 × 10⁶ | 2.29 × 10⁶ | 3.05 × 10⁶ | 3.82 × 10⁶ | 7.63 × 10⁶ | |
| C11 (% Weight-Molar Weight) | 0.5 | |||||
| 1.09 × 10⁷ | 2.18 × 10⁷ | 3.27 × 10⁷ | 4.35 × 10⁷ | 5.45 × 10⁷ | 1.09 × 10⁶ | |
| C12 (% Weight-Molar Weight | 0.25 | |||||
| 5.44 × 10⁸ | 1.09 × 10⁷ | 1.63 × 10⁷ | 2.18 × 10⁷ | 2.73 × 10⁷ | 5.45 × 10⁷ | |
| C13 (% Weight-Molar Weight) | 0.15 | |||||
| 3.27 × 10⁸ | 6.53 × 10⁸ | 9.80 × 10⁸ | 1.31 × 10⁷ | 1.64 × 10⁷ | 3.27 × 10⁷ | |
| C14 (% Weight-Molar Weight) | 0.13 | |||||
| 2.83 × 10⁸ | 5.66 × 10⁸ | 8.49 × 10⁸ | 1.13 × 10⁷ | 1.42 × 10⁷ | 2.83 × 10⁷ | |
| C15 (% Weight-Molar Weight) | 0.11 | |||||
| 2.39 × 10⁸ | 4.79 × 10⁸ | 7.18 × 10⁸ | 9.58 × 10⁸ | 1.20 × 10⁷ | 2.40 × 10⁷ | |
| C16 (% Weight-Molar Weight) | 0.09 | |||||
| 1.96 × 10⁸ | 3.92 × 10⁸ | 5.88 × 10⁸ | 7.84 × 10⁸ | 9.81 × 10⁸ | 1.96 × 10⁷ | |
| C17 (% Weight-Molar Weight) | 0.09 | |||||
| 1.96 × 10⁸ | 3.92 × 10⁸ | 5.88 × 10⁸ | 7.84 × 10⁸ | 9.81 × 10⁸ | 1.96 × 10⁷ | |
| C18 (% Weight-Molar Weight) | 0.09 | |||||
| 1.96 × 10⁸ | 3.92 × 10⁸ | 5.88 × 10⁸ | 7.84 × 10⁸ | 9.81 × 10⁸ | 1.96 × 10⁷ | |
| C19 (% Weight-Molar Weight) | 0.09 | |||||
| 1.96 × 10⁸ | 3.92 × 10⁸ | 5.88 × 10⁸ | 7.84 × 10⁸ | 9.81 × 10⁸ | 1.96 × 10⁷ | |
| Cricondentherm (°C) @ Natural Gas Pressure (bar) | −8.03 | −3.43 | −0.62 | 1.42 | 3.06 | 8.27128 |
| 10.035 | 10.29 | 10.55 | 10.69 | 10.82 | 11.2479 | |
| Cricondenbar (bar) | 60.06 | 61.42 | 62.43 | 63.23 | 63.9 | 66.29 |
References
- Mokhatap, S.; Poe, W.A.; Mak, J.Y. Handbook of Natural Gas Transmission and Processing-Principles and Practices, 3rd ed.; Gulf Professional Publishing: Houston, TX, USA, 2015. [Google Scholar] [CrossRef]
- Turkel, V. Design Construction and Management in Natural Gas Distribution, 2nd ed.; IGDAS Publications: Istanbul, Turkey, 2012. [Google Scholar]
- NGC+ Liquid Hydrocarbon Drop Out Task Group. White Paper on Liquid Hydrocarbon Drop Out in Natural Gas Infrastructure. Available online: https://www.beg.utexas.edu/files/cee/legacy/NGC_HDP_Paper.pdf (accessed on 19 July 2017).
- Dustman, T.; Drenker, J.; Bergman, D.F.; Bullin, J.A. An Analysis and Prediction of Hydrocarbon Dew Points and Liquid in Gas Transmission Lines. Available online: https://www.researchgate.net/publication/289908439 (accessed on 30 November 2017).
- Barbosa, C.H.; Oliveira, E.C.; Farias, S.L. Mapping The State of Art of Measurement of Hydrocarbon Dew Point in Natural Gas; Rio Pipeline Conference and Exposition: Rio de Janerio, Brazil, 2015. [Google Scholar]
- Benton, A. Determination of Hydrocarbon Dew Point in Natural Gas. Available online: https://asgmt.com/wp-content/uploads/pdf-docs/2009/1/066.pdf (accessed on 15 April 2019).
- Aniefiok, L.; Boniface, O. A new approach of splitting C6+ composition of pipeline gas for hydrocarbon dew point determination. J. Petrol. Explor. Prod. Technol. 2014, 4, 201–207. [Google Scholar] [CrossRef] [Green Version]
- Aniefiok, L. Comparative Study of the Consistency of C6+ Composition Splits of Pipeline Gas for Hydrocarbon Dewpoint Determination. Indian J. Adv. Chem. Sci. 2015, 3, 274–281. [Google Scholar]
- Novak, N.; Louli, V.; Skouras, S.; Voutsas, E. Prediction of dew points and liquid dropouts of gas condensate mixtures. Fluid Phase Equilibria 2018, 457, 62–73. [Google Scholar]
- Zang, P.; Zhou, L.; Zeng, W.; Xiong, G.; Huang, H.; Cai, L.; Ye, H.; Qu, S. Hydrocarbon Dew Point Measurement and Model Evaluation of Synthetic and Real Natural Gases. ACS Omega 2020, 5, 8463–8473. [Google Scholar] [CrossRef] [PubMed] [Green Version]
- Mu, L.; Cui, Q. Measurement and prediction of hydrocarbon dew points of synthetic natural gas mixtures. J. Chem. Eng. Data 2018, 63, 4226–4233. [Google Scholar] [CrossRef]
- Fan, D.; Gong, J.; Zhang, S.; Shi, G.; Kang, Q.; Xiao, Y.; Wu, C. A Transient Composition Tracking Method for Natural Gas Pipe Networks. Energy 2021, 215, 119131. [Google Scholar] [CrossRef]
- Bermudez, A.; Shabani, M. Numerical simulation of gas composition tracking in a gas transportation network. Energy 2022, 247, 123459. [Google Scholar] [CrossRef]
- Van der Geld, C.W.M.; Schmidt, J. Condensation of Low Volatile Components in Lean Natural Gas Transmission Pipelines; Report No. WPC 2006.07; Eindhoven University of Technology, Mechanical Engineering Department: Eindhoven, The Netherlands, 2006. [Google Scholar]
- Bullin, J.; Fitz, C.; Dustman, T. Practical Hydrocarbon Dew Point Specification for Natural Gas Transmission Lines. Available online: https://www.digitalrefining.com/article/1000452/practical-hydrocarbon-dew-point-specification-for-natural-gas-transmission-lines#.Y5i1XHZBxPY (accessed on 30 May 2019).
- Navarro-Ochoa, I.; Figueredo-Medina, M. Technical evaluation for the proposal of a different cricondentherm limit for the Caribbean coast within Colombian gas quality regulations. Ing. Univ. Eng. Dev. Dev. 2018, 22, 2011–2769. [Google Scholar]
- Leon, S.M.; Shah, M.S.; Ahmed, S.I.; Hossain, M.S.; Nausheen, T.J.; Nipa, F.Y.; Rafi, R. Measurement of Hydrocarbon Dew Point for Natural Gas of Titas Gas Field in Bangladesh. Pet. Sci. Eng. 2018, 2, 50–59. [Google Scholar]
- Zamrudy, W.; Rahmatullah, A.; Prayitno, P.; Wibowo, A.A. Analysis of the condensate phase in offshore pipe gas company. In The 2nd Annual Technology Applied Science and Engineering Conference; IOP Conference Series: Materials Science and Engineering: Malang, Indonesia, 2020. [Google Scholar]
- Khan, M.R.; Kalam, S.; Tariq, Z.; Abdulraheem, A. A Novel Emperical Correlation to Predict the Dew Point Pressure Using Intelligent Algorithms; Abu Dhabi International Petroleum Exhibition & Conference: Abu Dhabi, United Arab Emirates, 2019. [Google Scholar]
- Schouten, J.A.; Rosmalen, R.J.; Michels, J.P.J. Condensation in gas transmission pipelines phase behavior of mixtures of hydrogen with natural gas. Int. J. Hydrog. Energy 2004, 30, 661–668. [Google Scholar] [CrossRef]
- Olsen, C.; Kozman, T.A.; Lee, J.; Yuvamitra, K. A Comparative Study of Natural Gas Liquids Recovery Methods. Distrib. Gener. Altern. Energy J. 2012, 27, 42–55. [Google Scholar] [CrossRef]
- Shoaib, A.M.; Bhran, A.A.; Awad, M.E.; El-Sayad, N.A.; Fathy, T. Optimum operation conditions for improving natural gas dew point and condensate throughput. J. Nat. Gas Sci. Eng. 2018, 49, 324–330. [Google Scholar] [CrossRef]
- Zaidi, S.Z.J. Economic Analysis of Liquid drop-out Minimization in Natural Gas Pipelines. J. Fac. Eng. Technol. 2014, 21, 1–8. [Google Scholar]
- Cao, X.; Bian, J. Supersonic separation technology for natural gas processing: A review. Chem. Eng. Process. Process Intensif. 2019, 136, 138–151. [Google Scholar] [CrossRef]
- Cengel, Y.; Boles, M. Termodynamics: An Engineering Approach, 5th ed.; Izmir Guven Kitapevi: Izmir, Turkey, 2008. [Google Scholar]
- Pozivil, J. Use of Expansion Turbines in Natural Gas Pressure Reduction Stations. Acta Montan. Slovaca 2004, 9, 258–260. [Google Scholar]
- Grimley, T.A. An Overview of the AGA Gas Quality Management Manual. Available online: https://asgmt.com/paper/an-overview-of-the-aga-gas-quality-management-manual-4/ (accessed on 13 December 2022).
- Gas Processors Association. GPA 2261: Analysis of Natural Gas and Similar Gaseous Mixtures by Gas Chromatography. Available online: https://law.resource.org/pub/us/cfr/ibr/004/gpa.2261-00.2000.pdf (accessed on 5 May 2019).
- Ernest, K.; Pettigrew, D. Hydrocarbon Dew Point Monitoring of Natural Gas Using Field-Mounted, On-Line Gas Chromatographs. Pipeline Gas J. 2005, 232, 43–45. [Google Scholar]
- George, D.L. Development of Accurate Methods for Predicting Hydrocarbon Dew Points. Southwest Research Institute. Available online: https://www.bsee.gov/sites/bsee.gov/files/tap-technical-assessment-program/534aa.pdf (accessed on 13 December 2022).
Figure 1.
Istanbul natural gas distribution network.

Figure 2.
Natural gas liquid drop-out for polyethylene pipelines; (a) Liquid drop-out from PE pipes; (b) Two-phase mixture by discharging PE pipeline.
Figure 2.
Natural gas liquid drop-out for polyethylene pipelines; (a) Liquid drop-out from PE pipes; (b) Two-phase mixture by discharging PE pipeline.

Figure 3.
Sampling and measurement points of the natural gas network.

Figure 4.
Natural gas liquid mass spectrometry analysis.

Figure 5.
Flow chart of the methodology analysis.

Figure 6.
Results of C9–C19 data analysis of Pendik RM-A natural gas station.

Figure 7.
Results of C9–C19 data analysis of Esenyurt RM-A natural gas station.

Table 1.
Parameters of the Peng–Robinson and Soave–Redlich-Kwong equation.
| Equation of State | ac | b | b1 | b2 |
|---|---|---|---|---|
| Peng–Robinson | ||||
| Soave–Redlich–Kwong |
Table 2.
Pendik RM-A station gas chromatograph values.
| Gas Composition (% mol) | ||||||
|---|---|---|---|---|---|---|
| Methane | Ethane | Propane | I-Butane | N-Butane | I-Pentane | N-Pentane |
| 95.249 | 2.9672 | 0.7297 | 0.1144 | 0.1122 | 0.0155 | 0.021 |
| C6+ | N2 | CO2 | Flow Rate (m3/h) | Inlet Pressure (barg) | Inlet Temperature (°C) | Outlet Temperature (°C) |
| 0.0056 | 0.6068 | 0.173 | 633137 | 48.78 | 26 | 11.26 |
Table 3.
Esenyurt RM-A station gas chromatograph values.
| Gas Composition (% mol) | ||||||
|---|---|---|---|---|---|---|
| Methane | Ethane | Propane | I-Butane | N-Butane | I-Pentane | N-Pentane |
| 95.0586 | 3.2582 | 0.6412 | 0.1082 | 0.0139 | 0.0202 | 0.0139 |
| C6+ | N2 | CO2 | Flow Rate (m3/h) | Inlet Pressure (barg) | Inlet Temperature (°C) | Outlet Temperature (°C) |
| 0.0085 | 0.6055 | 0.1653 | 553147 | 40.32 | 23.5 | 11.69 |
Table 4.
Pendik RM-A station gas C6/C7/C8 separated component values.
| Composition | GPA 60/30/10 | Daniels 47/36/17 | GPA 50/25/25 | Metod A |
|---|---|---|---|---|
| C6 (%mol) | 0.00336 | 0.002632 | 0.0028 | 0.002105 |
| C7 (%mol) | 0.00168 | 0.002016 | 0.0014 | 0.002061 |
| C8+ (%mol) | 0.00056 | 0.000952 | 0.0014 | 0.001434 |
Table 5.
Esenyurt RM-A station gas C6/C7/C8 separated component values.
| Composition | GPA 60/30/10 | Daniels 47/36/17 | GPA 50/25/25 | Metod A |
|---|---|---|---|---|
| C6 (%mol) | 0.0051 | 0.003995 | 0.00425 | 0.003195 |
| C7 (%mol) | 0.00255 | 0.00306 | 0.002125 | 0.003128 |
| C8+ (%mol) | 0.00085 | 0.001445 | 0.002125 | 0.002177 |
Table 6.
Comparison of the splitting methods for process analysis.
| Splitting Methods | Pendik RM-A Station | Esenyurt RM-A Station | ||
|---|---|---|---|---|
| Cricondenbar (bar) | Cricondentherm (°C) @ Gas Pressure (bar) | Cricondenbar (bar) | Cricondentherm (°C) @ Gas Pressure (bar) | |
| C6+ | 57.28 | −50.87 @ 30.73 | 55.78 | −52.33 @ 28.14 |
| GPA 60/30/10 | 57.62 | −42.79 @ 24.58 | 56.08 | −40.67 @ 22.51 |
| Daniels GC 47/36/17 | 57.88 | −39.99 @ 23.72 | 56.89 | −37.21 @ 22.31 |
| GPA 50/25/25 | 58.07 | −38.28 @ 23.17 | 57.43 | −35.21 @ 22.1 |
| 37.3/36.6/26.1(Method-A) | 58.26 | −37.57 @ 23.2 | 57.83 | −34.38 @ 22.21 |
Table 7.
C9–C19 hydrocarbon distribution.
| Hydrocarbon (Cn) | Distribution Index (a) | Distribution Ratio (%) |
|---|---|---|
| C9 | a9 | 95 |
| C10 | a10 | 3.5 |
| C11 | a11 | 0.5 |
| C12 | a12 | 0.25 |
| C13 | a13 | 0.15 |
| C14 | a14 | 0.13 |
| C15 | a15 | 0.11 |
| C16 | a16 | 0.09 |
| C17 | a17 | 0.09 |
| C18 | a18 | 0.09 |
| C19 | a19 | 0.09 |
Disclaimer/Publisher’s Note: The statements, opinions and data contained in all publications are solely those of the individual author(s) and contributor(s) and not of MDPI and/or the editor(s). MDPI and/or the editor(s) disclaim responsibility for any injury to people or property resulting from any ideas, methods, instructions or products referred to in the content. |
© 2023 by the authors. Licensee MDPI, Basel, Switzerland. This article is an open access article distributed under the terms and conditions of the Creative Commons Attribution (CC BY) license (https://creativecommons.org/licenses/by/4.0/).
Share and Cite
MDPI and ACS Style
Aytaş, E.N.; Akkaya, A.V. Examination of Condensation Liquid Formation in Istanbul Natural Gas Distribution Network. Separations 2023, 10, 135. https://doi.org/10.3390/separations10020135
AMA Style
Aytaş EN, Akkaya AV. Examination of Condensation Liquid Formation in Istanbul Natural Gas Distribution Network. Separations. 2023; 10(2):135. https://doi.org/10.3390/separations10020135
Chicago/Turabian StyleAytaş, Eyüp Numan, and Ali Volkan Akkaya. 2023. "Examination of Condensation Liquid Formation in Istanbul Natural Gas Distribution Network" Separations 10, no. 2: 135. https://doi.org/10.3390/separations10020135
Note that from the first issue of 2016, this journal uses article numbers instead of page numbers. See further details here.