
Dataset Evaluation Method and Application for Performance Testing of SSVEP-BCI Decoding Algorithm


1
China Academy of Information and Communications Technology, Beijing 100161, China
2
Department of Biomedical Engineering, School of Medicine, Tsinghua University, Beijing 100084, China
*
Author to whom correspondence should be addressed.
Sensors 2023, 23(14), 6310; https://doi.org/10.3390/s23146310
Submission received: 25 May 2023
/
Revised: 24 June 2023
/
Accepted: 7 July 2023
/
Published: 11 July 2023
(This article belongs to the Section Intelligent Sensors)
Abstract
:Steady-state visual evoked potential (SSVEP)-based brain–computer interface (BCI) systems have been extensively researched over the past two decades, and multiple sets of standard datasets have been published and widely used. However, there are differences in sample distribution and collection equipment across different datasets, and there is a lack of a unified evaluation method. Most new SSVEP decoding algorithms are tested based on self-collected data or offline performance verification using one or two previous datasets, which can lead to performance differences when used in actual application scenarios. To address these issues, this paper proposed a SSVEP dataset evaluation method and analyzed six datasets with frequency and phase modulation paradigms to form an SSVEP algorithm evaluation dataset system. Finally, based on the above datasets, performance tests were carried out on the four existing SSVEP decoding algorithms. The findings reveal that the performance of the same algorithm varies significantly when tested on diverse datasets. Substantial performance variations were observed among subjects, ranging from the best-performing to the worst-performing. The above results demonstrate that the SSVEP dataset evaluation method can integrate six datasets to form a SSVEP algorithm performance testing dataset system. This system can test and verify the SSVEP decoding algorithm from different perspectives such as different subjects, different environments, and different equipment, which is helpful for the research of new SSVEP decoding algorithms and has significant reference value for other BCI application fields.
1. Introduction
Brain–computer interface is a direct interaction, communication, and control system established between the brain and external devices without relying on peripheral nerves and muscle tissue [1,2,3]. The SSVEP paradigm is a classic brain–computer interface paradigm that has been extensively studied for over 20 years [4,5,6,7] due to its high signal-to-noise ratio, stable response, and high information transfer rate (ITR). Decoding algorithms are a crucial component of brain–computer interface research, as they process and analyze brain signals, and convert them into instructions that can be understood by external devices. Data required for algorithm research are typically self-collected by researchers recruiting subjects or obtained from public datasets published in the field. Thus, the publication of public datasets with standardized collection specifications and detailed descriptions is crucial for effectively verifying algorithm performance and promoting iterative algorithm progress. In recent years, several classic datasets in the SSVEP-BCI field have been released [8,9,10,11,12,13], and have been widely applied and verified, which effectively promoting the development of the SSVEP-BCI field.
However, the majority of current algorithmic research utilizes one or two datasets to verify their performance [14,15,16,17,18,19,20,21,22,23,24,25,26,27,28,29], which did not make full use of public data resources, and the results were limited by the distribution of data samples in individual datasets, so it was not conducive to judge the application effect of the algorithm in the actual scene through the result. This issue has two underlying causes. Firstly, existing datasets in the field lack unified organization and evaluation, with some datasets yet to gain widespread attention. Secondly, there is a lack of unified analysis and evaluation methods for multiple datasets in the field.
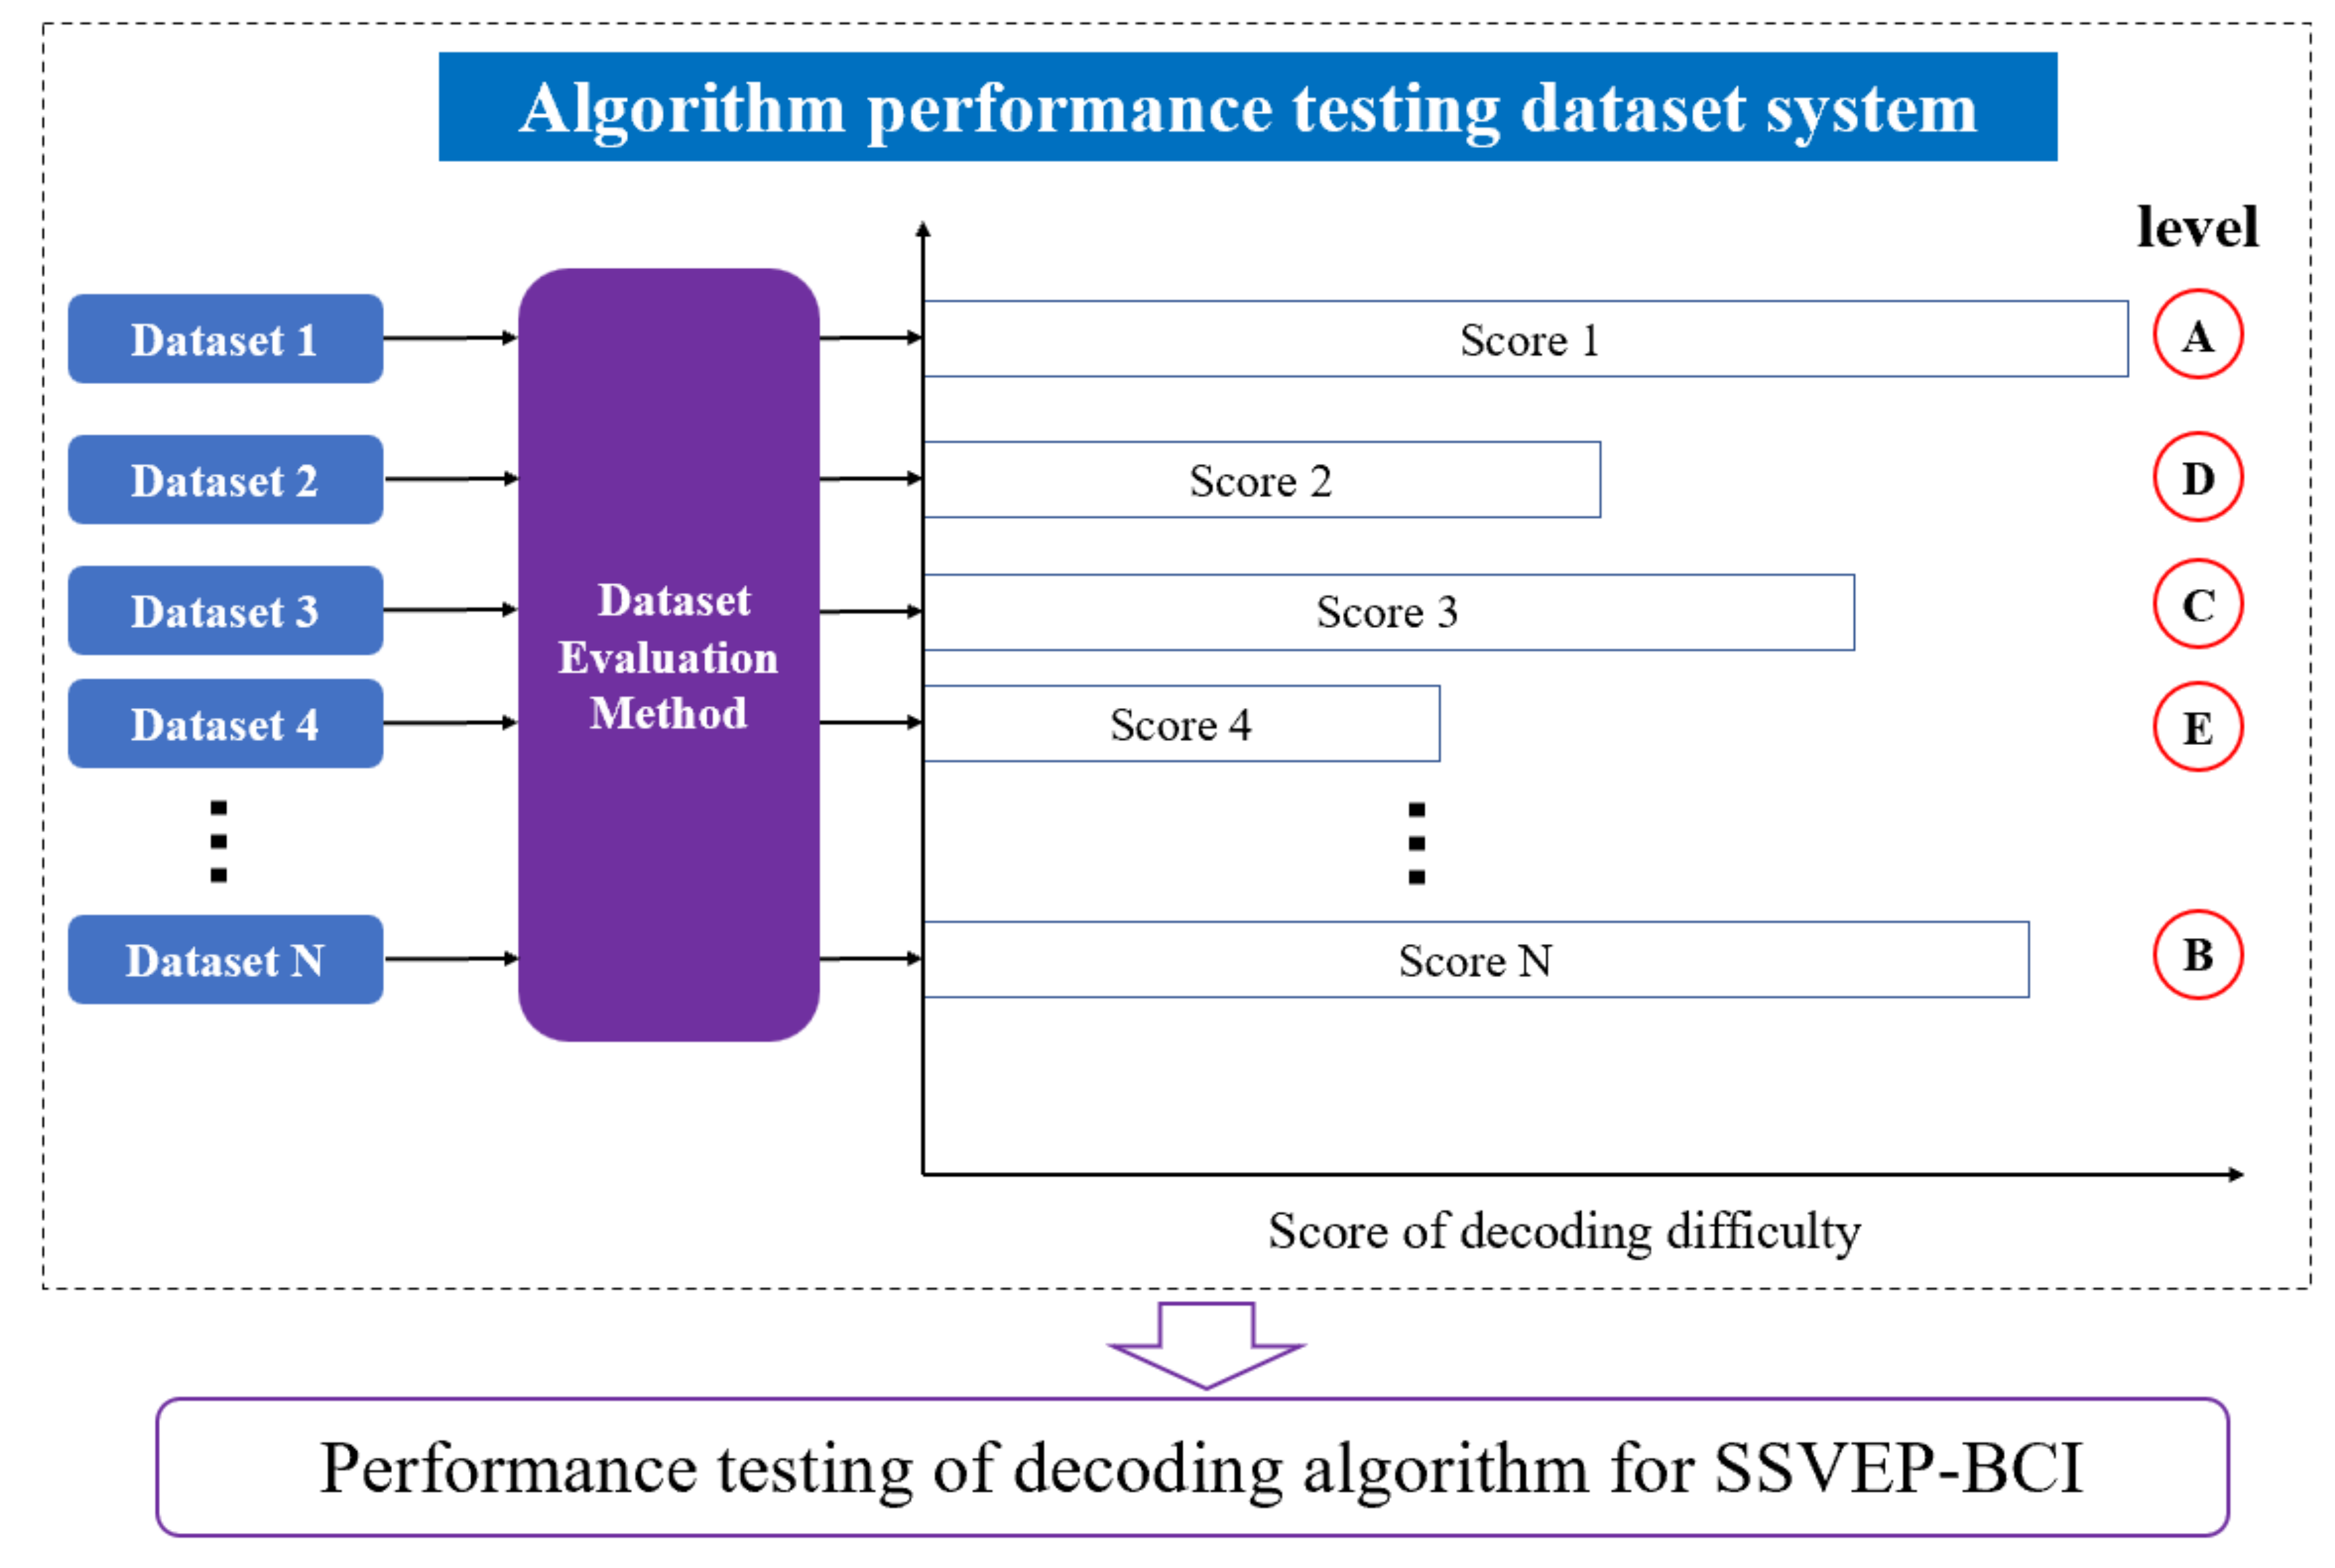
In order to solve the above problems, this paper sorted out six sets of frequency and phase modulation paradigms datasets [8,9,10,11,12,30] that were publicly available in the field of SSVEP-BCI. This paper further proposed an SSVEP dataset evaluation method and analyzed the above six datasets, forming a dataset system for algorithm performance testing that includes datasets with different sample population distributions, devices, and acquisition environments (as shown in Figure 1). Based on this dataset system, comprehensive testing of the SSVEP-BCI decoding algorithm performance was conducted, ultimately achieving an efficient simulation of the actual application effect of the decoding algorithm and avoiding significant differences between the actual BCI system application performance and the data validation results caused by independent dataset validation.
2. Materials and Methods
2.1. Datasets
The current research on decoding algorithms in the BCI field often corresponds to the paradigm. To ensure horizontal comparability between the dataset and the decoding algorithm, this paper selected the most influential frequency and phase modulation paradigm in the SSVEP field [31] (the existing public SSVEP datasets mainly adopt this paradigm), and then sorted out all the six public datasets of the frequency and phase modulation paradigm that can be obtained currently, as shown in Table 1.
SSVEP benchmark dataset (dataset1). The SSVEP benchmark dataset was collected and published by Wang et al. [8], containing EEG data from 35 subjects performing a 40-target frequency and phase modulation SSVEP typing task. Each stimulus target includes six trials, with each trial lasting 5 s. For more detailed information about the dataset1, please refer to reference [8]. This dataset will be referred to as dataset1 in this paper.
SSVEP BETA dataset (dataset2). The SSVEP BETA dataset [9] serves as an extension to the SSVEP benchmark dataset, with a different environment and subject group. Liu et al. [9] collected and released this dataset, which includes 70 participants and 4 online experiments. Each experiment consists of 40 trials, beginning with a 0.5 s cue period, followed by the flicker task period, and ending with a 0.5 s rest period. For the first 15 participants (S1–S15) in the dataset, the flicker task period lasts at least 2 s, while for the remaining 55 participants (S16–S70), it lasts at least 3 s. For more detailed information about dataset2, please refer to reference [9]. This dataset will be referred to as dataset2 in this paper.
SSVEP Wearable dataset (dataset3). The SSVEP wearable dataset [10] is currently the largest and most standardized wearable BCI dataset available within the SSVEP-BCI field. It contains experimental data from 102 participants, which was collected and released by Zhu et al. [10].
This dataset includes two collection methods of dry electrode and wet electrode, and each electrode collects 10 blocks of data, respectively. Each block consists of 10 trials per stimulus target, with a total duration of 2.84 s per trial, comprising a 0.5 s cue period, a 2 s task period, as well as an additional 0.14 s visual latency, and a 0.2 s visual after-effect period. For more detailed information on this dataset, please refer to the original publication [10]. Since this dataset includes data from both dry and wet electrodes, we will refer to them as dataset3a (dry electrode data) and dataset3b (wet electrode data), respectively in the following sections.
SSVEP elder dataset (dataset4). The SSVEP elder dataset [11] contains experimental data from 100 elderly participants and was collected and released by Liu et al. [11]. This dataset employs a nine targets SSVEP paradigm and is divided into six blocks. Each block consists of one trial for each stimulus target, with a total duration of 6 s per trial, including a 0.5 s pre-stimulus period, 5 s of stimulus presentation, and a 0.5 s post-stimulus period. For more detailed information on this dataset, please refer to the original publication [11]. This dataset will be referred to as dataset4 in this paper.
SSVEP FBCCA-DW dataset (dataset5). The FBCCA-DW dataset was collected by Yang et al. [30], including 14 subjects performing a 40-target SSVEP paradigm (same as dataset1). The experiment was divided into four blocks, with each block consisting of one trial for each stimulus target, and each trial lasting for 3 s. For more detailed information on this dataset, please refer to the original publication [30]. This dataset will be referred to as dataset5 in this paper.
SSVEP USCD dataset (dataset6). The USCD dataset was collected and published by Nakanishi et al. [12] and includes data from 10 healthy subjects. The dataset includes 12 stimulus targets, divided into 15 blocks with each block collecting one trial of each target. Each trial had a stimulus duration of 4 s. A detailed introduction to the dataset can be found in reference [12]. This dataset will be referred to as dataset6 in this paper.
2.2. Decoding Algorithm
This study tested the popular four decoding algorithms in the SSVEP-BCI field including canonical correlation analysis (CCA) [4], filter bank canonical correlation analysis (FBCCA) [32], ensemble task-related component analysis (eTRCA) [7], and task discriminant component analysis (TDCA) [33]. CCA, FBCCA, and eTRCA have all been considered as significant milestones in the development of SSVEP-BCI decoding algorithms and have led to many subsequent improvements. This study proposed a dataset system for evaluating SSVEP decoding algorithms and, therefore, focuses on the three most influential algorithms mentioned above. Furthermore, since the previously mentioned three algorithms were proposed several years ago (with the latest eTRCA algorithm being proposed in 2017), this study introduced a newly proposed eTRCA algorithm improvement called TDCA for validation. TDCA is also a widely recognized training-based decoding algorithm in the field.
Furthermore, among the four aforementioned algorithms, CCA and FBCCA are both non-training algorithms, while eTRCA and TDCA are training algorithms. In this study, eTRCA and TDCA algorithms were trained on data consisting of six trials for each task target (stimulation frequency) using cross-validation for trial selection. A filter bank consisting of five filters was used, and its design and weight curves were kept consistent with the reference [7]. In addition, the number of components in the TDCA algorithm was selected as nine after tuning (increasing it further did not improve performance but only added to the algorithm’s complexity). Another important parameter of TDCA is Np, which refers to the length of the sliding window. Typically, the data window length used for calculation needs to be greater than 1 s, so that Np can range from 0.1 s to 1 s (in intervals of 0.1 s). In this study, when the data window length was less than 1 s, the corresponding Np parameter was set as the maximum value supported by that window length. For instance, if the window length was 0.5 s, Np would take values from 0.1 s to 0.5 s (in intervals of 0.1 s). For more detailed information regarding the principles of the four decoding algorithms mentioned above, please refer to the respective references.
2.3. Dataset Evaluation Method
2.3.1. Evaluation Indexes
The core feature of SSVEP is the EEG frequency response corresponding to the stimulation frequency [34]. Therefore, the frequency signal-to-noise ratio is the most direct indicator for evaluating the strength of the SSVEP-induced response, and it has two analysis methods: narrowband SNR and broadband SNR. In addition, the accuracy of recognition, optimal response time, and ITR are the core indicators of a broad consensus on the performance evaluation of the SSVEP-BCI algorithm [7,32]. The six analyzed datasets in this study possess varying paradigm coding parameters, collection equipment, and test groups. Consequently, the results of the aforementioned five indexes typically vary significantly among different samples [9]. To summarize, this paper proposed five indexes for data evaluation, including the narrow-band signal-to-noise ratio (SNR), wide-band SNR, accuracy of recognition, optimal response time, and information transfer rate (ITR).
In addition, since different algorithms yield different results for accuracy of recognition, optimal response time, and ITR, this study needs to select a widely accepted and influential decoding algorithm in the field as a standard algorithm. The FBCCA algorithm [32] is a milestone in the SSVEP-BCI field for its non-training decoding algorithm, which first introduced the concept of spatial filter banks and greatly improved the effectiveness of SSVEP decoding. Therefore, FBCCA is widely used in the development of BCI systems and is considered a highly influential and stable algorithm. Thus, the FBCCA was used as the standard algorithm for data analysis in this study.
The following section provides the specific definitions and calculation methods for the five indexes:
- (1)
- The narrow-band SNR
The narrow-band SNR is defined as the ratio of the spectral amplitude of the stimulation frequency to its surrounding frequencies and is represented as SNRt. The calculation method is shown in Equation (1).
Here, refers to the signal amplitude spectrum calculated by fast Fourier transform, and df represents the spectral resolution. The SNRt in this context is defined as the ratio of the amplitude spectrum value of to that of the frequencies 1 Hz apart on either side, and the unit is decibel (dB). During the calculation process, EEG data from the same frequency trials (usually 4–6 trials, depending on the data collection of different datasets) were first overlaid and averaged before calculating SNRt.
- (2)
- Wide-band SNR
The wide-band SNR is defined as the ratio of the spectral amplitude of the stimulation frequency and its harmonic responses to the amplitude of other frequencies in a wideband range. This variable is represented as SNRw (as shown in Equation (2)).
Nh denotes the number of harmonics, P(f) refers to the power spectrum at frequency f, and fs/2 represents the Nyquist frequency.
- (3)
- Accuracy of recognition using standard algorithm
The accuracy of multi-target recognition under FBCCA is referred to as ACCstand. The data window length used by the FBCCA algorithm is 2 s. If the window length of the dataset is less than 2 s, the maximum window length of the dataset is taken.
- (4)
- Optimal response time of standard algorithm
Response time is an important index of BCI performance that can be matched to standard algorithms in the field for data analysis and discrimination with specific paradigms and scenarios. In this paper, the optimal response time for the multiple target recognition of data calculated by FBCCA is represented by Tbest (the time coordinate at the inflection points where the recognition accuracy is greater than 90%). If the maximum data window length has not yet reached an average recognition accuracy of 90%, then the optimal response time will be adjusted based on the accuracy obtained under the condition of the maximum data window length in the dataset. The specific calculation method is shown in Equation (3).
where Tmax represents the maximum data window length supported by the dataset, and represents the average recognition accuracy of the FBCCA algorithm under the condition of Tmax data window length.
- (5)
- Optimal information transfer rate of standard algorithm
Information transfer rate (ITR) is an evaluation index that comprehensively considers recognition accuracy, coding target number, and response time. The calculation of ITR is shown in Equation (4):
T represents the calculation response window length, N represents the number of stimulation targets, and P represents the recognition accuracy. T is an important influencing factor in the calculation of ITR. When calculating ITR data in this research, the response time window length T was calculated as the recognition window length plus 0.5 s. This additional 0.5 s was considered to be the switching time that occurred when users shifted their gaze between targets in actual use scenarios [7,31]. Recognition accuracy is the most critical measure of BCI system performance as it determines the system usability. Therefore, the in this research is defined as the highest ITR score obtained under a response window length T corresponding to recognition rates exceeding 90%. If using any length of time window cannot achieve a recognition accuracy of over 90%, the calculation of the is based on the maximum time window length supported by the dataset.
2.3.2. Index Scoring Method
Regarding the five evaluation indexes (SNRt, SNRw, ACCstand, Tbest, ITRbest) introduced in the previous section, this study designed a percentage-based scoring method. The corresponding scoring calculation methods (score1–score5) were provided, and the total score was obtained by summing them up. However, score1–score5 were not designed to be 20 points for each item (the average of five indicators in percentage), but were slightly adjusted based on the importance of each indicator. Specifically, the corresponding total score of SNRw and Tbest were reduced to 15 points, while that of ACCstand and ITRbest were increased to 25 points. The reasons for the specific adjustments are as follows: Although is an indicator that measures the strength of SSVEP response, the wideband noise can be reduced by filtering in the frequency or spatial domain during algorithm development (while narrowband noise is difficult to filter out). Therefore, score1 is not adjusted, while score2 is slightly reduced. Although Tbest is a crucial indicator that reflects the performance of the BCI system, the evaluation of the BCI system currently focuses on the accuracy and the information transfer rate [7,18,35]. Therefore, score4 was appropriately reduced, while score3 and score5 were appropriately increased.
In addition, this study introduced the log10 function to adjust the score change curve, aiming to compress the parameter range of the lower scores appropriately so that more complex data under different conditions can obtain some scores (e.g., dataset3b). The subsequent section will outline the specific calculation methods of score1–score5.
- (1)
- Score of SNRt
The response SNRt distribution of SSVEP in the occipital region is typically in the range of −5 dB to 20 dB [9], thus a corresponding data score ‘score1’ can be given as shown in Equation (5).
The value 15.1 is a parameter that ensures that score1 approximates 20 when SNRt reaches 10 dB, and it does not hold any physical significance. Similar parameter settings can be found in Equations (6)–(9) in the subsequent section.
- (2)
- Score of SNRw
The response SNRw distribution of SSVEP in the occipital region is typically in the range of −35 dB to 0 dB [9], thus a corresponding data score ‘score2’ can be given as shown in Equation (6).
- (3)
- Score of the ACCstand
Using the FBCCA algorithm [32] to compute the data, the accuracy of multiple target identification is referred to as ACCstand. In consideration of system performance and availability, a corresponding score can be assigned to represent data evaluation, denoted as score3 and shown in Equation (7).
- (4)
- Score of the Tbest
The calculation method of score4 (score of Tbest) is presented in Equation (8). If the recognition accuracy can achieve 90% within 2 s data length, full marks will be awarded for this item. If the Tbest falls between 2 and 8 s, a corresponding score will be assigned based on the number of targets (the C in Equation (8)) and Tbest. If Tbest exceeds 8 s, indicating low system availability, the score for this item will be zero.
- (5)
- Score of the ITRbest
When using the FBCCA algorithm to compute the classic dataset in this paper, the obtained ITRbest falls within the range of 30 bits/min to 100 bits/min. Hence, the score calculation for ITRbest (score5) is given by Equation (9).
- (6)
- Total score
This study established the data range of relevant indexes and provided corresponding score assessments based on the analysis and judgment of SSVEP datasets. By summing up the scores of five indexes and referring to Table 2, the level of SSVEP datasets can be determined. Table 2 shows that the higher the final score, the lower the decoding difficulty of the dataset.
2.4. Algorithm Performance Evaluation Index
To evaluate algorithm performance, this study used recognition accuracy, best response time, and ITR as indices. The definitions and computation methods of these indices have been introduced in the dataset evaluation method section.
3. Result
3.1. The Calculation Results of Six Datasets
Table 3 presents the calculation results for the six datasets based on the five SSVEP dataset evaluation indexes and six score (score1–score5 and total score) proposed in this paper.
Table 3 indicates that there are differences in the evaluation scores of six datasets in terms of SNRt, SNRw, ACCstand, Tbest, and ITRbest. Dataset3a, which uses wearable SSVEP data collected by dry electrode headbands has the highest decoding difficulty, while dataset1, which strictly controls subject age, state, and collection environment has the lowest decoding difficulty due to its outstanding decoding performance. To summarize, the aforementioned six datasets establish a system for verifying algorithm performance with a vertically distributed decoding difficulty rating.
3.2. Algorithm Performance Testing
Comprehensive testing and verification of the performance of CCA, FBCCA, eTRCA, and TDCA algorithms were conducted using the six datasets analyzed in this paper, with the results shown in Figure 2, Table 4 and Table 5. Figure 2 examines the performance of the same algorithm on different datasets, while Table 4 and Table 5 examine the performance of different algorithms on the same dataset.
In Figure 2, the data lengths refer to the duration of the extracted EEG data starting from the onset of the stimulus trial, representing the length of EEG data used for algorithm recognition. From Figure 2, it can be observed that the same algorithm exhibited differences in recognition accuracy when applied to different datasets. Furthermore, these differences vary based on different data window length conditions. For instance, in the case of the CCA algorithm, the recognition result for dataset1 is the lowest (among the six datasets) with a 0.4-s time window length. However, when the window length is extended to 1 s or longer, there is a significant improvement in the recognition result for dataset1. This also indicates that the six datasets mentioned above do exhibit a vertical distribution decoding difficulty and can be comprehensively tested and evaluated for algorithm performance in different subject populations, collection devices, and collection environments.
Using a window length of 1 s, a comparison study between any two methods was conducted using the paired sample t-test. The corresponding p-value after the Bonferroni correction is listed in Table 5.
Table 4 and Table 5 demonstrate that the accuracy calculation results of eTRCA and TDCA algorithms are higher than those of CCA and FBCCA algorithms, and the performance of TDCA is better than that of eTRCA, while the performance of FBCCA is better than that of CCA. However, there are exceptions, such as when using dataset3 with high decoding difficulty, the computational performance of FBCCA and CCA is similar. When using dataset6, the computational performance of TDCA and eTRCA is comparable. These results indicate that the performance of algorithms under different environmental and demographic conditions is not fixed.
Furthermore, after Bonferroni correction, there were no significant differences in the calculation results between eTRCA and TDCA algorithms. However, the independent T-tests between the two algorithms showed significant differences in some datasets (Dataset1: p < 0.05; Dataset2: p < 0.001; Dataseta3a: p < 0.001; Dataset3b: p < 0.001; Dataset4: p < 0.001; Dataset5: p = 0.09; Dataset6: p = 0.67). Moreover, although the statistical results calculated for dataset5 after Bonferroni correction were non-significant, the T-test results between these four algorithms without Bonferroni correction showed significant differences (except for the p-value between eTRCA and TDCA).
Additionally, the decoding performance of specific datasets is not fixed. Taking dataset1 as an example, it can be observed that the decoding performance of this dataset is significantly worse when using non-training algorithms (CCA and FBCCA) compared to dataset4 and dataset5. However, the opposite results were obtained when using training algorithms (eTRCA and TDCA). These results suggest that different algorithms perform differently on the gradients of the six datasets presented in terms of decoding difficulty. Therefore, the proposed decoding difficulty gradient distribution in this paper may facilitate comprehensive performance testing of different algorithms.
3.3. Result of Typical Subjects
There are large individual differences in the brain response between different people. Therefore, when analyzing the performance of the decoding algorithm, we should not only focus on the mean value of the calculated results but also pay attention to the lowest and highest values. The highest value indicates the performance upper limit that the algorithm can achieve. For example, if the corresponding BCI system is applied in specific operational scenarios [36,37], selecting individuals with excellent performance from a large pool of operators can achieve the best system performance. The minimum value indicates the lower limit of algorithmic performance, which should be improved in mass usage scenarios [3,38,39] to enable a wider range of users to use it. Table 6 shows the statistical results of the best and worst subjects for the four algorithms analyzed on six datasets under the condition of a 2 s data window length.
Table 6 shows that there is a large difference in accuracy and ITR between the best and worst performance subjects for the same algorithm and dataset. Additionally, for the same dataset, the best and worst subjects for different algorithms are not entirely identical. This result objectively reflects the individual variability of SSVEP response. Furthermore, the worst performing subjects did not achieve an identification accuracy above 80% for the 2 s data window length (except for eTRCA and TDCA on dataset1 and dataset6), while the accuracy of the best performance subjects was all exceeding 90%. These results suggest that further optimization and improvement are needed for the SSVEP-BCI developed based on the above four algorithms to enhance the adaptability of acquisition equipment and environment, as well as expand the applicable population.
4. Discussion
4.1. Advantages of the Dataset System over Individual Datasets
The dataset system proposed in this paper is valuable because it can verify the performance of SSVEP-BCI decoding algorithms under different conditions, including different subject populations, acquisition devices, acquisition environments, and decoding difficulties. Figure 3 summarizes the results from Figure 2, Table 4 and Table 5, indicating that the performance of the same decoding algorithm varies significantly across different datasets, and not all calculated results meet the performance requirements for BCI systems in actual scenarios.
Therefore, if only 1–2 datasets are used in the decoding algorithm research process, the algorithm’s performance may fluctuate significantly in actual application scenarios. It is recommended to use multiple datasets to test and evaluate decoding algorithms to ensure their reliability and effectiveness in various real-world scenarios.
Further analysis Table 4 and Table 5, taking the most widely used dataset (dataset1) as an example, shows that eTRCA achieves an identification accuracy of 94.3 ± 10.9% in a 1 s window length, while TDCA achieves an accuracy of 96.5 ± 6.1% and FBCCA achieves an identification accuracy of 90.2 ± 13.3% for a 2 s window length. Without further validation on other datasets, these accuracy results suggest that FBCCA, eTRCA, and TDCA are expected to meet the needs of actual BCI use.
However, in reality, the actual performance of these algorithms can vary significantly when the acquisition environment, participant group, and electrode materials change. For instance, when using dataset2 to simulate real application environments with a more open acquisition environment and a wider range of participant groups, eTRCA achieves only 75.5 ± 22.0% accuracy with a 1 s window length, while TDCA achieves an accuracy of 82.5 ± 16.6% with a 1 s window length, and FBCCA achieves an accuracy of 81.8 ± 15.7% with a 2 s window length. Moreover, when using dry electrode data in dataset3a, the accuracy of these algorithms will decrease to 58.1 ± 31.0% (eTRCA using 1 s window length), 79.4 ± 21.7 (TDCA using 1-s window length), and 59.3 ± 27.3% (FBCCA using a 2 s window length). These identification accuracy results are difficult to meet the practical requirements of BCI, and the difference between them and the high-performance results obtained under strictly controlled conditions (dataset1) is significant. Thus, it is highly recommended to use multiple datasets with a gradient distribution of the decoding difficulty level to test the performance of decoding algorithms in SSVEP-BCI.
Furthermore, the dataset system constructed in this study can be expanded in the future to include more high-value datasets that reflect realistic BCI scenarios, as shown in Figure 3. This will enhance the accuracy and applicability of decoding algorithms in practical BCI systems.
4.2. Value of Dataset Decoding Difficulty Assessment
This study evaluated six datasets of the frequency and phase modulation SSVEP paradigm (as shown in Table 3). The six datasets covered decoding difficulty ratings of A, B, C, D, and E, and the rating results corresponded to the results in Figure 2 and Table 4, indicating that the performance indexes calculated by different decoding algorithms were relatively lower for datasets with higher decoding difficulty. Therefore, the dataset decoding difficulty assessment method can be used to construct a dataset system with differentiated decoding difficulty levels to achieve comprehensive testing of decoding algorithm performance. Furthermore, it can provide a reference for algorithm performance testing and improvement. For example, although CCA, FBCCA, eTRCA, and TDCA performed poorly on dataset3a, the decoding difficulty rating of E for this dataset confirms the rationality of the results and provides ideas for subsequent improvements to the decoding algorithm (i.e., studying the signal characteristics of dataset3a and focusing on improving algorithm performance based on dataset3a).
4.3. Current Situation of Dataset Usage in SSVEP Decoding Algorithm Research
This study conducted a further analysis of the current state of dataset usage in the latest research papers on SSVEP decoding algorithms. The selection of papers followed specific criteria, including using the Web of Science Core Collection with the keywords “SSVEP & algorithm” as the primary topic, limiting the document type to papers, and restricting the search results to papers published before April 2023. In addition, we manually excluded studies that were not related to decoding algorithms such as research on BCI system applications involving algorithm validation and usage, algorithm review papers, and dataset papers. Subsequently, we sorted the search results chronologically and selected the 20 most recently published papers and analysis of their dataset usage, which is presented in Table 7.
Table 7 shows that the majority of the 20 SSVEP decoding algorithm papers analyzed used more than one dataset, with only three papers [18,20,25] using self-collected data verification methods. Among the 20 papers, 40% (8/20) used only one dataset, while 80% (16/20) used no more than two datasets, and the remaining four papers used only three datasets for verification. Therefore, there is significant room for expansion in dataset usage in current research on SSVEP decoding algorithms.
Regarding dataset usage, it can be seen that in the 20 papers of Table 7, SSVEP Benchmark [8] (dataset1) was used 11 times, SSVEP BETA [9] (dataset2) was used 5 times, SSVEP UCSD [12] (dataset6) was used 4 times, and SSVEP Wearable [10] (dataset3) was used twice (this dataset was released in 2021). Other datasets were used no more than twice. It can be seen that there are significant differences in the frequency of use of different datasets. From the perspective of the number of subjects, it can be observed that the use of previous datasets for algorithm verification involves a much larger number of subjects than using self-collected data. Therefore, releasing SSVEP datasets can promote algorithm research. It is hoped that research teams with capabilities in this field can collect more self-generated validation data and make them public on the basis of using existing datasets.
In summary, the dataset evaluation method and algorithm testing dataset system proposed in this study can provide more references for future algorithm research. The decoding algorithm research can attempt performance testing and verification on more newly shared datasets (such as dataset2, dataset3, and dataset4).
4.4. Subsequent Extensions of This Study
This paper proposed a decoding difficulty evaluation method for SSVEP datasets. Among them, ACCstand, Tbest, and ITRbest are all based on the calculation results of the most classic non-training algorithm FBCCA. However, during the actual analysis process (Figure 2, Table 4 and Table 5), it can be found that the ACCstand, Tbest, and ITRbest of different decoding algorithms are different. Therefore, in future studies, a variety of decoding algorithms can be explored and used to comprehensively evaluate the decoding difficulty of the datasets.
Furthermore, this study analyzed four representative SSVEP decoding algorithms that have the potential for further testing and expansion to include other algorithms. Additionally, there is still room for expansion of the six frequency and phase modulation SSVEP datasets compiled in this study. Future studies can attempt to expand the analysis to include datasets from SSVEP paradigms that are not entirely identical (For example, combining the frequency and phase modulation paradigm with the dual-frequency modulation SSVEP paradigm [42]). This can promote the development of performance improvements for SSVEP-BCI general decoding algorithms (e.g., eTRCA can be used for various SSVEP paradigms). Further attempts can also be made to conduct comprehensive analyses of visual BCI paradigms that are similar to SSVEP paradigms (such as the C-VEP paradigm [51]) to promote research on general decoding algorithms for visual BCI. Other BCI paradigms (such as the motor imagery paradigm [52], P300 paradigm [41], etc.) can also build corresponding dataset systems based on their own data characteristics.
5. Conclusions
In summary, this paper summarized six open-source datasets of the frequency and phase modulation paradigm of SSVEP-BCI. Additionally, this paper proposed a dataset decoding difficulty evaluation method and integrated the above six datasets to form a set of SSVEP algorithm performance testing dataset systems. Finally, based on the dataset system, the existing four classic algorithms (CCA, FBCCA, eTRCA, and TDCA) were tested and verified, and significant differences were found in the calculation results of different algorithms on different datasets. This demonstrates the importance of utilizing an algorithm evaluation dataset system that includes different subject groups, scenarios, and collection devices for new SSVEP decoding algorithm research. Furthermore, this work may serve as a reference for dataset evaluation and algorithm performance testing of other BCI paradigms.
Author Contributions
Conceptualization, L.L.; methodology, L.L.; software, Q.Z.; validation, Q.Z., J.Z. and L.L.; formal analysis, L.L.; investigation, L.L. and Q.Z.; resources, Q.Z. and J.Z.; data curation, L.L. and J.Z.; writing—original draft preparation, L.L.; writing—review and editing, Q.Z., W.L. and X.G.; visualization, Q.Z.; supervision, W.L. and Q.Z.; project administration, W.L.; funding acquisition, W.L. and X.G. All authors have read and agreed to the published version of the manuscript.
Funding
This research was supported by National Key Research and Development Program of China (No. 2021YFF0601801), Key Research and Development Program of Ningxia Province of China (No. 2022CMG02026).
Institutional Review Board Statement
Not applicable.
Informed Consent Statement
Not applicable.
Data Availability Statement
The data that support the findings of this study are openly available. Among them, dataset1-dataset5 can be downloaded from “bci.med.tsinghua.edu.cn” (accessed on 9 January 2023) The download instructions for dataset6 can be found in the article written by Nakanishi et al. [12].
Acknowledgments
The authors would like to thank Tsinghua University, Institute of Semiconductors, Chinese Academy of Sciences, and Tianjin Institute of Biomedical Engineering for their support on the SSVEP dataset.
Conflicts of Interest
The authors declare no conflict of interest.
References
- Gao, X.; Wang, Y.; Chen, X.; Gao, S. Interface, interaction, and intelligence in generalized brain-computer interfaces. Trends Cogn. Sci. 2021, 25, 671–684. [Google Scholar] [CrossRef] [PubMed]
- Wolpaw, J.R.; Birbaumer, N.; Mcfarland, D.J.; Pfurtscheller, G.; Vaughan, T.M. Brain-computer interfaces for communication and control. Suppl. Clin. Neurophysiol. 2002, 113, 767–791. [Google Scholar] [CrossRef] [PubMed]
- Erp, J.V. Brain-Computer Interfaces: Beyond Medical Applications. Computer 2012, 45, 26–34. [Google Scholar] [CrossRef] [Green Version]
- Bin, G.; Gao, X.; Yan, Z.; Hong, B.; Gao, S. An online multi-channel SSVEP-based brain-computer interface using a canonical correlation analysis method. J. Neural Eng. 2009, 6, 046002. [Google Scholar] [CrossRef]
- Mueller-Putz, G.R.; Scherer, R.; Brauneis, C.; Pfurtscheller, G. Steady-state visual evoked potential (SSVEP)-based communication: Impact of harmonic frequency components. J. Neural Eng. 2005, 2, 123–130. [Google Scholar] [CrossRef]
- Xu, L.; Xu, M.; Jung, T.-P.; Ming, D. Review of brain encoding and decoding mechanisms for EEG-based brain-computer interface. Cogn. Neurodyn. 2021, 15, 569–584. [Google Scholar] [CrossRef]
- Nakanishi, M.; Wang, Y.; Chen, X.; Wang, Y.-T.; Gao, X.; Jung, T.-P. Enhancing Detection of SSVEPs for a High-Speed Brain Speller Using Task-Related Component Analysis. IEEE Trans. Biomed. Eng. 2018, 65, 104–112. [Google Scholar] [CrossRef]
- Wang, Y.; Chen, X.; Gao, X.; Gao, S. A Benchmark Dataset for SSVEP-Based Brain-Computer Interfaces. IEEE Trans. Neural Syst. Rehabil. Eng. 2017, 25, 1746–1752. [Google Scholar] [CrossRef]
- Liu, B.; Huang, X.; Wang, Y.; Chen, X.; Gao, X. BETA: A large benchmark database toward SSVEP-BCI application. Front. Neurosci. 2020, 14, 627. [Google Scholar] [CrossRef]
- Zhu, F.; Jiang, L.; Dong, G.; Gao, X.; Wang, Y. An Open Dataset for Wearable SSVEP-Based Brain-Computer Interfaces. Sensors 2021, 21, 1256. [Google Scholar] [CrossRef]
- Liu, B.; Wang, Y.; Gao, X.; Chen, X. eldBETA: A Large Eldercare-oriented Benchmark Database of SSVEP-BCI for the Aging Population. Sci. Data 2022, 9, 252. [Google Scholar] [CrossRef] [PubMed]
- Masaki, N.; Wang, Y.; Wang, Y.T.; Tzyy-Ping, J.; Yao, D. A Comparison Study of Canonical Correlation Analysis Based Methods for Detecting Steady-State Visual Evoked Potentials. PLoS ONE 2015, 10, 0140703. [Google Scholar]
- Oikonomou, V.P.; Liaros, G.; Georgiadis, K.; Chatzilari, E.; Adam, K.; Nikolopoulos, S.; Kompatsiaris, I. Comparative evaluation of state-of-the-art algorithms for SSVEP-based BCIs. arXiv 2016, arXiv:1602.00904. [Google Scholar]
- Mu, J.; Tan, Y.; Grayden, D.B.; Oetomo, D. Linear Diophantine equation (LDE) decoder: A training-free decoding algorithm for multifrequency SSVEP with reduced computation cost. Asian J. Control. 2023, 1–13. [Google Scholar] [CrossRef]
- Oikonomou, V.P.P. Human Recognition Using Deep Neural Networks and Spatial Patterns of SSVEP Signals. Sensors 2023, 23, 2425. [Google Scholar] [CrossRef]
- Wang, Z.; Wong, C.M.; Rosa, A.; Qian, T.; Jung, T.-P.; Wan, F. Stimulus-Stimulus Transfer Based on Time-Frequency-Joint Representation in SSVEP-Based BCIs. IEEE Trans. Biomed. Eng. 2023, 70, 603–615. [Google Scholar] [CrossRef] [PubMed]
- Guney, O.B.; Ozkan, H. Transfer learning of an ensemble of DNNs for SSVEP BCI spellers without user-specific training. J. Neural Eng. 2023, 20, 016013. [Google Scholar] [CrossRef]
- Zhang, R.; Cao, L.; Xu, Z.; Zhang, Y.; Zhang, L.; Hu, Y.; Chen, M.; Yao, D. Improving AR-SSVEP Recognition Accuracy Under High Ambient Brightness Through Iterative Learning. IEEE Trans. Neural Syst. Rehabil. Eng. 2023, 31, 1796–1806. [Google Scholar] [CrossRef]
- Yin, X.; Lin, M. Multi-information improves the performance of CCA-based SSVEP classification. Cogn. Neurodyn 2023. [Google Scholar] [CrossRef]
- Ke, Y.; Du, J.; Liu, S.; Ming, D. Enhancing Detection of Control State for High-Speed Asynchronous SSVEP-BCIs Using Frequency-Specific Framework. IEEE Trans. Neural Syst. Rehabil. Eng. 2023, 31, 1405–1417. [Google Scholar] [CrossRef]
- Tabanfar, Z.; Ghassemi, F.; Moradi, M.H. A subject-independent SSVEP-based BCI target detection system based on fuzzy ordering of EEG task-related components. Biomed. Signal Process. Control. 2023, 79, 104171. [Google Scholar] [CrossRef]
- Lee, T.; Nam, S.; Hyun, D.J. Adaptive Window Method Based on FBCCA for Optimal SSVEP Recognition. IEEE Trans. Neural Syst. Rehabil. Eng. 2023, 31, 78–86. [Google Scholar] [CrossRef] [PubMed]
- Ziafati, A.; Maleki, A. Genetic algorithm based ensemble system using MLR and MsetCCA methods for SSVEP frequency recognition. Med. Eng. Phys. 2023, 111, 103945. [Google Scholar] [CrossRef] [PubMed]
- Luo, R.; Xu, M.; Zhou, X.; Xiao, X.; Jung, T.-P.; Ming, D. Data augmentation of SSVEPs using source aliasing matrix estimation for brain-computer interfaces. IEEE Trans. BioMed. Eng. 2022, 70, 1775–1785. [Google Scholar] [CrossRef]
- Chuang, C.-C.; Lee, C.-C.; So, E.-C.; Yeng, C.-H.; Chen, Y.-J. Multi-Task Learning-Based Deep Neural Network for Steady-State Visual Evoked Potential-Based Brain-Computer Interfaces. Sensors 2022, 22, 8303. [Google Scholar] [CrossRef] [PubMed]
- Pan, Y.; Chen, J.; Zhang, Y.; Zhang, Y. An efficient CNN-LSTM network with spectral normalization and label smoothing technologies for SSVEP frequency recognition. J. Neural Eng. 2022, 19, 056014. [Google Scholar] [CrossRef]
- Oikonomou, V.P. An Adaptive Task-Related Component Analysis Method for SSVEP Recognition. Sensors 2022, 22, 7715. [Google Scholar] [CrossRef]
- Yan, W.; Wu, Y.; Du, C.; Xu, G. An improved cross-subject spatial filter transfer method for SSVEP-based BCI. J. Neural Eng. 2022, 19, 046028. [Google Scholar] [CrossRef]
- Zhang, X.; Qiu, S.; Zhang, Y.; Wang, K.; Wang, Y.; He, H. Bidirectional Siamese correlation analysis method for enhancing the detection of SSVEPs. J. Neural Eng. 2022, 19, 046027. [Google Scholar] [CrossRef]
- Yang, C.; Han, X.; Wang, Y.; Saab, R.; Gao, S.; Gao, X. A Dynamic Window Recognition Algorithm for SSVEP-Based Brain-Computer Interfaces Using a Spatio-Temporal Equalizer. Int. J. Neural Syst. 2018, 28, 1850028. [Google Scholar] [CrossRef]
- Chen, X.; Wang, Y.; Masaki, N.; Gao, X.; Tzyy-Ping, J.; Gao, S. High-speed spelling with a noninvasive brain-computer interface. Proc. Natl. Acad. Sci. USA 2015, 112, E6058–E6067. [Google Scholar] [CrossRef] [PubMed]
- Chen, X.; Wang, Y.; Gao, S.; Jung, T.-P.; Gao, X. Filter bank canonical correlation analysis for implementing a high-speed SSVEP-based brain–computer interface. J. Neural Eng. 2015, 12, 046008. [Google Scholar] [CrossRef]
- Liu, B.; Chen, X.; Shi, N.; Wang, Y.; Gao, S.; Gao, X. Improving the Performance of Individually Calibrated SSVEP-BCI by Task- Discriminant Component Analysis. IEEE Trans. Neural Syst. Rehabil. Eng. 2021, 29, 1998–2007. [Google Scholar] [CrossRef]
- Regan, D. Human Brain Electrophysiology: Evoked Potentials and Evoked Magnetic Fields in Science and Medicine; Elsevier Science Publishing: New York, NY, USA, 1989. [Google Scholar]
- Wong, C.M.; Wang, Z.; Wang, B.; Rosa, A.; Jung, T.-P.; Wan, F. Enhancing Detection of Multi-Frequency-Modulated SSVEP Using Phase Difference Constrained Canonical Correlation Analysis. IEEE Trans. Neural Syst. Rehabil. Eng. 2023, 31, 1343–1352. [Google Scholar] [CrossRef]
- Oh, J.; Jongheon, K. Military application study of BCI technology using brain waves in Republic of Korea Army: Focusing on personal firearms. J. Adv. Mil. Stud. 2022, 5, 35–48. [Google Scholar] [CrossRef]
- Czech, A. Brain-Computer Interface Use to Control Military Weapons and Tools. In Proceedings of the 4th International Scientific Conference on Brain-Computer Interfaces (IC BCI), Opole, Poland, 21 September 2021; pp. 196–204. [Google Scholar]
- Tan, D.S.; Nijholt, A. Brain-Computer Interfacing and Games; Springer: London, UK, 2010; pp. 149–178. [Google Scholar]
- Sun, S.; Thomas, K.P.; Smitha, K.G.; Vinod, A.P. Two player EEG-based neurofeedback ball game for attention enhancement. In Proceedings of the 2014 IEEE International Conference on Systems, Man and Cybernetics—SMC, San Diego, CA, USA, 5–8 October 2014; pp. 3150–3155. [Google Scholar]
- Mu, J.; Grayden, D.B.; Tan, Y.; Oetomo, D. Frequency Superposition—A Multi-Frequency Stimulation Method in SSVEP-based BCIs. In Proceedings of the 43rd Annual International Conference of the IEEE Engineering in Medicine & Biology Society (EMBC), Virtual, 1–5 November 2021; pp. 5924–5927. [Google Scholar]
- Chen, Y.; Yang, C.; Ye, X.; Chen, X.; Wang, Y.; Gao, X. Implementing a calibration-free SSVEP-based BCI system with 160 targets. J. Neural Eng. 2021, 18, 046094. [Google Scholar] [CrossRef] [PubMed]
- Liang, L.; Lin, J.; Yang, C.; Wang, Y.; Gao, X. Optimizing a dual-frequency and phase modulation method for SSVEP-based BCIs. J. Neural Eng. 2020, 17, 046026. [Google Scholar] [CrossRef]
- Chang, M.H.; Baek, H.J.; Lee, S.M.; Park, K.S. An amplitude-modulated visual stimulation for reducing eye fatigue in SSVEP-based brain-computer interfaces. Clin. Neurophysiol. 2014, 125, 1380–1391. [Google Scholar] [CrossRef]
- Kołodziej, M.; Majkowski, A.; Rak, R.J. A new method of spatial filters design for brain-computer interface based on steady state visually evoked potentials. In Proceedings of the 2015 IEEE 8th International Conference on Intelligent Data Acquisition and Advanced Computing Systems: Technology and Applications (IDAACS), Warsaw, Poland, 24–26 September 2015; pp. 697–700. [Google Scholar]
- Lee, M.-H.; Kwon, O.-Y.; Kim, Y.-J.; Kim, H.-K.; Lee, Y.-E.; Williamson, J.; Fazli, S.; Lee, S.-W. EEG dataset and OpenBMI toolbox for three BCI paradigms: An investigation into BCI illiteracy. GigaScience 2019, 8, giz002. [Google Scholar] [CrossRef] [PubMed] [Green Version]
- Bian, R.; Wu, H.; Liu, B.; Wu, D. Small Data Least-Squares Transformation (sd-LST) for Fast Calibration of SSVEP-Based BCIs. IEEE Trans. Neural Syst. Rehabil. Eng. 2023, 31, 446–455. [Google Scholar] [CrossRef]
- Yu, Z.; Guoxu, Z.; Jing, J.; Xingyu, W.; Andrzej, C. Frequency Recognition in Ssvep-Based Bci Using Multiset Canonical Correlation Analysis. Int. J. Neural Syst. 2014, 24, 1450013. [Google Scholar] [CrossRef] [Green Version]
- Wang, H.; Zhang, Y.; Waytowich, N.R.; Krusienski, D.J.; Zhou, G.; Jin, J.; Wang, X.; Cichocki, A. Discriminative Feature Extraction via Multivariate Linear Regression for SSVEP-Based BCI. IEEE Trans. Neural Syst. Rehabil. Eng. 2016, 24, 532–541. [Google Scholar] [CrossRef] [PubMed]
- Zhou, W.; Liu, A.; Wu, L.; Chen, X. A L1 normalization enhanced dynamic window method for SSVEP-based BCIs. J. Neurosci. Methods 2022, 380, 109688. [Google Scholar] [CrossRef]
- Bassi, P.R.A.S.; Attux, R. FBDNN: Filter banks and deep neural networks for portable and fast brain-computer interfaces. Biomed. Phys. Eng. Express 2022, 8, 035018. [Google Scholar] [CrossRef] [PubMed]
- Sun, Q.; Zheng, L.; Pei, W.; Gao, X.; Wang, Y. A 120-target brain-computer interface based on code-modulated visual evoked potentials. J. Neurosci. Methods 2022, 375, 109597. [Google Scholar] [CrossRef]
- Pfurtscheller, G.; Neuper, C. Motor imagery and direct brain-computer communication. Proc. IEEE 2001, 89, 1123–1134. [Google Scholar] [CrossRef]
Figure 1.
Dataset evaluation method and application for performance testing of SSVEP-BCI decoding algorithm.
Figure 1.
Dataset evaluation method and application for performance testing of SSVEP-BCI decoding algorithm.

Figure 2.
Recognition accuracy statistics for the same algorithm on different datasets. (a) CCA (b) FBCCA (c) eTRCA (d) TDCA.
Figure 2.
Recognition accuracy statistics for the same algorithm on different datasets. (a) CCA (b) FBCCA (c) eTRCA (d) TDCA.

Figure 3.
Performance testing SSVEP-BCI decoding algorithm based on dataset system.


Table 1.
Information statistics of six SSVEP-BCI datasets.
| Dataset | Citation | Subjects | Target | Channels |
|---|---|---|---|---|
| Benchmark dataset (dataset1) | Wang et al. [8] | 35 | 40 | 64 |
| SSVEP BETA dataset (dataset2) | Liu et al. [9] | 70 | 40 | 64 |
| SSVEP Wearable dataset (dataset3) | Zhu et al. [10] | 102 | 12 | 8 |
| SSVEP elder dataset (dataset4) | Liu et al. [11] | 100 | 9 | 64 |
| SSVEP FBCCA-DW dataset (dataset5) | Yang et al. [30] | 14 | 40 | 64 |
| SSVEP UCSD dataset (dataset6) | Nakanishi et al. [12] | 10 | 12 | 8 |
Table 2.
Decoding difficulty level of SSVEP dataset.
| Total Score | Decoding Difficulty Level |
|---|---|
| [85, 100] | A |
| [70, 85) | B |
| [55, 70) | C |
| [40, 55) | D |
| [0, 40) | E |
Table 3.
Results of decoding difficulty evaluation for datasets.
| Dataset | Dataset1 | Dataset2 | Dataset3a | Dataset3b | Dataset4 | Dataset5 | Dataset6 |
|---|---|---|---|---|---|---|---|
| SNRt (dB) | 5.1 ± 8.1 | −3.1 ± 6.5 | −9.6 ± 4.2 | −9.9 ± 4.6 | 2.0 ± 8.7 | −2.9 ± 6.6 | 4.0 ± 7.7 |
| Score1 | 16.5 | 11.2 | 4.9 | 4.8 | 14.5 | 11.6 | 16.1 |
| SNRw (dB) | −11.5 ± 6.1 | −10.5 ± 5.1 | −54.4 ± 7.9 | −36.0 ± 8.4 | −10.6 ± 5.1 | −36.9 ± 9.7 | −33.8 ± 14.3 |
| Score2 | 14.4 | 14.6 | 0.4 | 5.2 | 14.6 | 5.6 | 6.8 |
| ACCstand (%) | 90.2 ± 13.5 | 81.8 ± 15.8 | 59.3 ± 27.4 | 77.9 ± 21.6 | 80.3 ± 19.7 | 89.4 ± 10.8 | 75.8 ± 23.0 |
| Score3 | 23.4 | 21.6 | 12.4 | 19.0 | 20.5 | 24.0 | 18.6 |
| Tbest (s) | 1.9 ± 0.8 | 2.2 ± 0.8 | 4.1 ± 3.4 | 2.3 ± 1.5 | 3.2 ± 2.6 | 1.8 ± 0.7 | 3.0 ± 1.6 |
| Score4 | 13.6 | 13.1 | 8.9 | 12.1 | 10.2 | 13.8 | 10.5 |
| ITRbest (bits/min) | 126.6 ± 41.1 | 101.2 ± 40.5 | 40.1 ±37.3 | 65.8 ±41.3 | 60.4 ±40.4 | 124.7 ±44.4 | 54.3 ±28.4 |
| Score5 | 24.4 | 22.6 | 9.7 | 16.1 | 14.6 | 24.5 | 16.5 |
| Total score | 92.4 | 83.2 | 36.3 | 57.1 | 74.4 | 79.5 | 68.5 |
| Level | A | B | E | C | B | B | C |
Table 4.
Accuracy calculation results of four algorithms on different datasets.
| Accuracy (%) | |||||
|---|---|---|---|---|---|
| Data length | Dataset\Algorithm | CCA | FBCCA | eTRCA | TDCA |
| 0.5 s | Dataset1 | 14.2 ± 8.0 | 21.4 ± 12.0 | 81.9 ± 19.1 | 84.6 ± 15.9 |
| Dataset2 | 15.3 ± 10.1 | 21.9 ± 12.5 | 60.8 ± 23.5 | 66.4 ± 21.9 | |
| Dataset3a | 27.3 ± 17.0 | 25.7 ± 17.1 | 52.6 ± 29.1 | 68.4 ± 23.4 | |
| Dataset3b | 40.9 ± 19.1 | 43.0 ± 20.6 | 81.5 ± 20.2 | 85.6 ± 14.4 | |
| Dataset4 | 34.1 ± 16.2 | 43.0 ± 19.6 | 81.3 ± 20.2 | 86.9 ± 15.2 | |
| Dataset5 | 21.1 ± 13.6 | 31.1 ± 16.6 | 48.0 ± 19.1 | 47.8 ± 15.7 | |
| Dataset6 | 24.4 ± 9.8 | 23.8 ± 8.7 | 92.5 ± 8.7 | 86.6 ± 14.2 | |
| 1 s | Dataset\Algorithm | CCA | FBCCA | eTRCA | TDCA |
| Dataset1 | 47.8 ± 20.5 | 66.0 ± 21.7 | 94.3 ± 10.9 | 96.5 ± 6.1 | |
| Dataset2 | 39.4 ± 22.4 | 56.9 ± 22.0 | 75.5 ± 22.0 | 82.5 ± 16.6 | |
| Dataset3a | 46.0 ± 25.7 | 42.1 ± 25.2 | 58.1 ± 31.0 | 79.4 ± 21.7 | |
| Dataset3b | 64.6 ± 23.0 | 61.9 ± 24.2 | 88.4 ± 15.8 | 92.0 ± 15.8 | |
| Dataset4 | 51.5 ± 22.2 | 63.7 ± 23.7 | 86.7 ± 18.0 | 92.4 ± 11.8 | |
| Dataset5 | 50.3 ± 25.3 | 67.4 ± 20.8 | 66.3 ± 16.6 | 69.4 ± 11.4 | |
| Dataset6 | 56.9 ± 22.2 | 48.8 ± 21.5 | 98.1 ± 2.8 | 97.8 ± 3.4 | |
| 2 s | Dataset\Algorithm | CCA | FBCCA | eTRCA | TDCA |
| Dataset1 | 77.6 ± 21.3 | 90.2 ± 13.3 | 98.3 ± 3.0 | 99.0 ± 1.3 | |
| Dataset2 | 67.4 ± 24.2 | 81.8 ± 15.7 | 85.8 ± 15.3 | 90.5 ± 9.5 | |
| Dataset3a | 63.2 ± 26.3 | 59.3 ± 27.3 | 61.2 ± 32.1 | 81.2 ± 22.6 | |
| Dataset3b | 80.3 ± 19.8 | 77.9 ± 21.5 | 88.1 ± 19.3 | 95.8 ± 6.7 | |
| Dataset4 | 67.7 ± 23.0 | 80.3 ± 19.6 | 91.2 ± 15.2 | 95.2 ± 10.0 | |
| Dataset5 | 78.8 ± 20.6 | 89.4 ± 10.4 | 79.5 ± 13.1 | 84.1 ± 7.1 | |
| Dataset6 | 80.4 ± 20.4 | 75.8 ± 21.9 | 99.4 ± 1.7 | 99.4 ± 1.3 | |
Table 5.
Accuracy comparison results based on the paired t-test with Bonferroni correction.
| Method Comparison (M1 vs. M2) | Dataset1 | Dataset2 | Dataset3a | Dataset3b | Dataset4 | Dataset5 | Dataset6 |
|---|---|---|---|---|---|---|---|
| CCA vs. FBCCA | < *** | < *** | N.S. | N.S. | < *** | N.S. | N.S. |
| CCA vs. eTRCA | < *** | < *** | < ** | < *** | < *** | N.S. | < *** |
| CCA vs. TDCA | < *** | < *** | < *** | < *** | < *** | N.S. | < *** |
| FBCCA vs. eTRCA | < *** | < *** | < *** | < *** | < *** | N.S. | < *** |
| FBCCA vs. TDCA | < *** | < *** | < *** | < *** | < *** | N.S. | < *** |
| eTRCA vs. TDCA | N.S. | N.S. | N.S. | N.S. | N.S. | N.S. | N.S. |
1: < *** and < ** denote that M1 is worse than M2 at different significant levels of 0.001 and 0.01. 2: N.S. indicates no significant difference between M1 and M2.
Table 6.
The accuracy of the best performance subjects and the worst performance subjects.
| Dataset | Algorithm | Worst Sub | Best Sub | ||||
|---|---|---|---|---|---|---|---|
| Sub | 2 s ACC (%) | 2 s ITR (bits/min) | Sub | 2 s ACC (%) | 2 s ITR (bits/min) | ||
| Dataset1 | CCA | s16 | 27.9 | 15.8 | s5 | 98.3 | 122.7 |
| FBCCA | s11 | 52.5 | 43.5 | s25 | 100.0 | 127.7 | |
| eTRCA | s19 | 87.5 | 98.8 | s14 | 100.0 | 127.7 | |
| TDCA | s33 | 93.3 | 110.8 | s13 | 100.0 | 127.7 | |
| Dataset2 | CCA | s17 | 16.3 | 6.1 | s23 | 100.0 | 127.7 |
| FBCCA | s41 | 37.5 | 25.5 | s23 | 100.0 | 127.7 | |
| eTRCA | s61 | 38.8 | 26.9 | s23 | 99.4 | 125.6 | |
| TDCA | s44 | 65.0 | 60.9 | s30 | 100.0 | 127.7 | |
| Dataset3a | CCA | s74 | 10.0 | 0.1 | s87 | 100.0 | 86.0 |
| FBCCA | s22 | 9.2 | 0.0 | s52 | 100.0 | 86.0 | |
| eTRCA | s96 | 4.2 | 0.5 | s7 | 100.0 | 86.0 | |
| TDCA | s74 | 5.8 | 0.2 | s7 | 100.0 | 86.0 | |
| Dataset3b | CCA | s46 | 20.8 | 2.6 | s7 | 100.0 | 86.0 |
| FBCCA | s42 | 20.8 | 2.6 | s7 | 100.0 | 86.0 | |
| eTRCA | s1 | 15.0 | 0.8 | s3 | 100.0 | 86.0 | |
| TDCA | s61 | 70.0 | 40.0 | s3 | 100.0 | 86.0 | |
| Dataset4 | CCA | s21 | 11.1 | 0.0 | s31 | 100.0 | 76.1 |
| FBCCA | s34 | 15.9 | 0.4 | s27 | 100.0 | 76.1 | |
| eTRCA | s34 | 14.3 | 0.2 | s3 | 100.0 | 76.1 | |
| TDCA | s24 | 42.9 | 11.3 | s3 | 100.0 | 76.1 | |
| Dataset5 | CCA | s8 | 33.1 | 20.9 | s1 | 99.4 | 125.6 |
| FBCCA | s8 | 63.8 | 59.1 | s1 | 100.0 | 127.7 | |
| eTRCA | s6 | 44.4 | 33.4 | s1 | 93.1 | 110.3 | |
| TDCA | s4 | 70.0 | 68.5 | s1 | 93.8 | 111.7 | |
| Dataset6 | CCA | s2 | 37.8 | 11.4 | s8 | 100.0 | 86.0 |
| FBCCA | s2 | 35.6 | 10.0 | s8 | 99.4 | 84.4 | |
| eTRCA | s2 | 94.4 | 74.0 | s1 | 100.0 | 86.0 | |
| TDCA | s2 | 95.6 | 76.1 | s1 | 100.0 | 86.0 | |
Table 7.
The current situation of dataset usage in SSVEP decoding algorithm research.
| Citation | Data Sources | Data Publicly Available | Experiment | Subjects | Year |
|---|---|---|---|---|---|
| Mu et al. [14] | Mu et al. [40] | -- | offline | 9 | 2022 |
| Oikonomou et al. [15] | EPOC dataset [13] | Yes | offline | 11 | 2023 |
| Wang et al. [16] | SSVEP Benchmark [8] | Yes | offline | 35 | 2023 |
| Guney et al. [17] | SSVEP Benchmark [8] | Yes | offline | 35 | 2023 |
| SSVEP BETA [9] | Yes | 70 | |||
| Zhang et al. [18] | Self-collected | -- | offline | 20 | 2023 |
| Yin et al. [19] | SSVEP Benchmark [8] | Yes | offline | 35 | 2023 |
| Ke et al. [20] | Self-collected | -- | offline online | 15 14 | 2023 |
| Wong et al. [35] | Chen et al. [41] | Yes | offline | 8 and 12 | 2023 |
| Liang et al. [42] | Yes | 12 | |||
| Chang et al. [43] | -- | 12 | |||
| Tabanfar et al. [21] | Kołodziej et al. [44] | -- | offline | 5 | 2023 |
| Lee et al. [22] | SSVEP Benchmark [8] | Yes | offline | 35 | 2023 |
| OpenBMI dataset [45] | Yes | 54 | |||
| Bian et al. [46] | SSVEP Benchmark [8] | Yes | offline | 35 | 2023 |
| SSVEP BETA [9] | Yes | 70 | |||
| SSVEP UCSD [12] | Yes | 10 | |||
| Ziafati et al. [23] | Zhang et al. [47] | Yes | offline | 10 | 2023 |
| Luo et al. [24] | SSVEP Benchmark [8] | Yes | offline | 35 | 2022 |
| SSVEP BETA [9] | Yes | 70 | |||
| Chuang et al. [25] | Self-collected | -- | offline | 24 | 2022 |
| Pan et al. [26] | SSVEP UCSD [12] | Yes | offline | 10 | 2022 |
| Wang et al. [48] | -- | 10 | |||
| Oikonomou et al. [27] | SSVEP Benchmark [8] | Yes | offline | 35 | 2022 |
| EPOC dataset [13] | Yes | 11 | |||
| Zhou et al. [49] | SSVEP UCSD [12] | Yes | offline | 10 | 2022 |
| SSVEP Benchmark [8] | Yes | 35 | |||
| SSVEP BETA [9] | Yes | 70 | |||
| Yan et al. [28] | SSVEP Benchmark [8] | Yes | offline | 35 | 2022 |
| SSVEP UCSD [12] | Yes | 10 | |||
| Zhang et al. [29] | SSVEP Benchmark [8] | Yes | offline | 35 | 2022 |
| SSVEP Wearable [10] | Yes | 102 | |||
| Bassi et al. [50] | SSVEP Benchmark [8] | Yes | offline | 35 | 2022 |
| SSVEP BETA [9] | Yes | 70 | |||
| SSVEP Wearable [10] | Yes | 102 |
Disclaimer/Publisher’s Note: The statements, opinions and data contained in all publications are solely those of the individual author(s) and contributor(s) and not of MDPI and/or the editor(s). MDPI and/or the editor(s) disclaim responsibility for any injury to people or property resulting from any ideas, methods, instructions or products referred to in the content. |
© 2023 by the authors. Licensee MDPI, Basel, Switzerland. This article is an open access article distributed under the terms and conditions of the Creative Commons Attribution (CC BY) license (https://creativecommons.org/licenses/by/4.0/).
Share and Cite
MDPI and ACS Style
Liang, L.; Zhang, Q.; Zhou, J.; Li, W.; Gao, X. Dataset Evaluation Method and Application for Performance Testing of SSVEP-BCI Decoding Algorithm. Sensors 2023, 23, 6310. https://doi.org/10.3390/s23146310
AMA Style
Liang L, Zhang Q, Zhou J, Li W, Gao X. Dataset Evaluation Method and Application for Performance Testing of SSVEP-BCI Decoding Algorithm. Sensors. 2023; 23(14):6310. https://doi.org/10.3390/s23146310
Chicago/Turabian StyleLiang, Liyan, Qian Zhang, Jie Zhou, Wenyu Li, and Xiaorong Gao. 2023. "Dataset Evaluation Method and Application for Performance Testing of SSVEP-BCI Decoding Algorithm" Sensors 23, no. 14: 6310. https://doi.org/10.3390/s23146310
Note that from the first issue of 2016, this journal uses article numbers instead of page numbers. See further details here.