Article

Crystalline Hydrate Dehydration Sensing Based on Integrated Terahertz Whispering Gallery Mode Resonators

1
Wuhan National Laboratory for Optoelectronics and School of Optical and Electronic Information, Huazhong University of Science and Technology, Wuhan 430074, China
2
School of Electronic and Information Engineering, Beihang University, Beijing 100191, China
3
Optics Valley Laboratory, Wuhan 430074, China
*
Authors to whom correspondence should be addressed.
Sensors 2022, 22(23), 9116; https://doi.org/10.3390/s22239116
Submission received: 3 October 2022 / Revised: 17 November 2022 / Accepted: 21 November 2022 / Published: 24 November 2022
(This article belongs to the Section Optical Sensors)

Abstract

:
Water molecules play a very important role in the hydration and dehydration process of hydrates, which may lead to distinct physical and chemical properties, affecting their availability in practical applications. However, miniaturized, integrated sensors capable of the rapid, sensitive sensing of water molecules in the hydrate are still lacking, limiting their proliferation. Here, we realize the high-sensitivity sensing of water molecules in copper sulfate pentahydrate (CuSO4·5H2O), based on an on-chip terahertz whispering gallery mode resonator (THz-WGMR) fabricated on silicon material via CMOS-compatible technologies. An integrated THz-WGMR with a high-Q factor of 3305 and a resonance frequency of 410.497 GHz was proposed and fabricated. Then, the sensor was employed to distinguish the CuSO4·xH2O (x = 5, 3, 1). The static characterization from the CuSO4·5H2O to the copper sulfate trihydrate (CuSO4·3H2O) experienced blueshifts of 0.55 GHz/μmol, whereas the dehydration process of CuSO4·3H2O to copper sulfate monohydrate (CuSO4·H2O) exhibited blueshifts of 0.21 GHz/μmol. Finally, the dynamic dehydration processes of CuSO4·5H2O to CuSO4·3H2O at different temperatures were monitored. We believe that our proposed THz-WGMR sensors with highly sensitive substance identification capabilities can provide a versatile and integrated platform for studying the transformation between substances, contributing to hydrated/crystal water-assisted biochemical applications.

1. Introduction

Water molecules exist in many substances, such as copper sulfate pentahydrate (CuSO4·5H2O) [1,2], α-lactose monohydrate (C12H22O11·H2O) [3], and sodium thiosulphate pentahydrate (Na2S2O3·5H2O) [4,5,6]. Hydrate formation or dehydration of specific hydrates may produce a great impact on material properties, such as elastic properties [7,8,9], thermal structures [10,11,12], rheological properties [10,13,14,15], electrical properties [16], and activation energies [17]. The changes in the hydration state of crystalline compounds are usually unavoidable throughout the manufacturing process; hence, highly sensitive sensors for hydrates and hydration/dehydration monitoring are urgently required. At present, single-crystal X-ray diffraction (SCXRD) [18], powder XRD [19], infrared spectroscopy (IR) [20,21], Raman spectroscopy [22,23], nuclear magnetic resonance (NMR) spectroscopy [24], thermogravimetric analysis (TGA) [25,26,27,28], and corresponding auxiliary technology are commonly used to determine the content of crystal water. Compared with power XRD, SCXRD has the advantage of unambiguous peak indexing; however, it requires a single crystal of an adequate quality and size. IR and Raman spectroscopy fulfill the investigation of the vibrational mode, but the resolution is the limitation. NMR spectroscopy has the disadvantage of substantial cost. TGA requires a relatively large amount of samples (~mg) and a long time (~10 min) to perform. Therefore, a sensor with high accuracy and miniaturization is needed for crystal water sensing.
Terahertz (THz) sensing has received more and more attention in recent years. Most studies use terahertz time-domain spectroscopy (TDS) [29,30,31,32]. These kinds of methods have disadvantages such as demanding the preparation of sample tablets and relatively low-detection sensitivity. Terahertz resonators can be used for sensing and have the advantages of high accuracy and integration. Similar methods mainly focus on the terahertz whispering gallery mode resonators (THz-WGMRs) [33,34,35,36,37], metasurfaces [38,39,40,41], and photonic crystals [42,43,44]. THz-WGMRs possess high sensitivity because of high Q factors. The higher the Q implies the narrower the resonance dip in the transmission spectrum. High-Q microresonators can confine radiation with exquisitely low losses. Such low losses give rise to ultra-narrow resonance features that imply very fine frequency selectivity. Moreover, even a slight change in the surrounding medium will perturb the resonances to a measurable extent, allowing for environmental sensitivity [45] Therefore, THz-WGMRs have been employed in relevant research works in the fields of water vapor concentration measurement [45], particle distance sensing [46], and so on. However, THz-WGMRs have not been reported on crystal water sensing.
In this work, we designed an experiment to study the influence of CuSO4·xH2O (x = 5, 3, 1) on the THz spectrum of the THz-WGMR. Water molecules in CuSO4·5H2O combine in different chemical combinations. Investigating their dehydration process provides an auxiliary means to comprehend the chemical structure [17]. In addition, CuSO4·5H2O is rich in crystal water, and the temperature required for material transformation is easy to approach (less than 100 °C) [21,30]. Furthermore, the melting point is higher than the dehydration temperature, and consequently, the distribution of the substances maintains stability. The effect of crystal water on the refractive index and absorption coefficient of the material was analyzed. The proposed THz-WGMRs could distinguish CuSO4·xH2O (x = 5, 3, 1) with enhanced sensitivity and efficiency. The detection sensitivities of the THz-WGMR for CuSO4·5H2O, copper sulfate trihydrate (CuSO4·3H2O), and copper sulfate monohydrate (CuSO4·H2O) were 1.32, 0.77, and 0.56 GHz/μmol, respectively. Finally, we used this sensor to monitor the dehydration process at different temperatures.

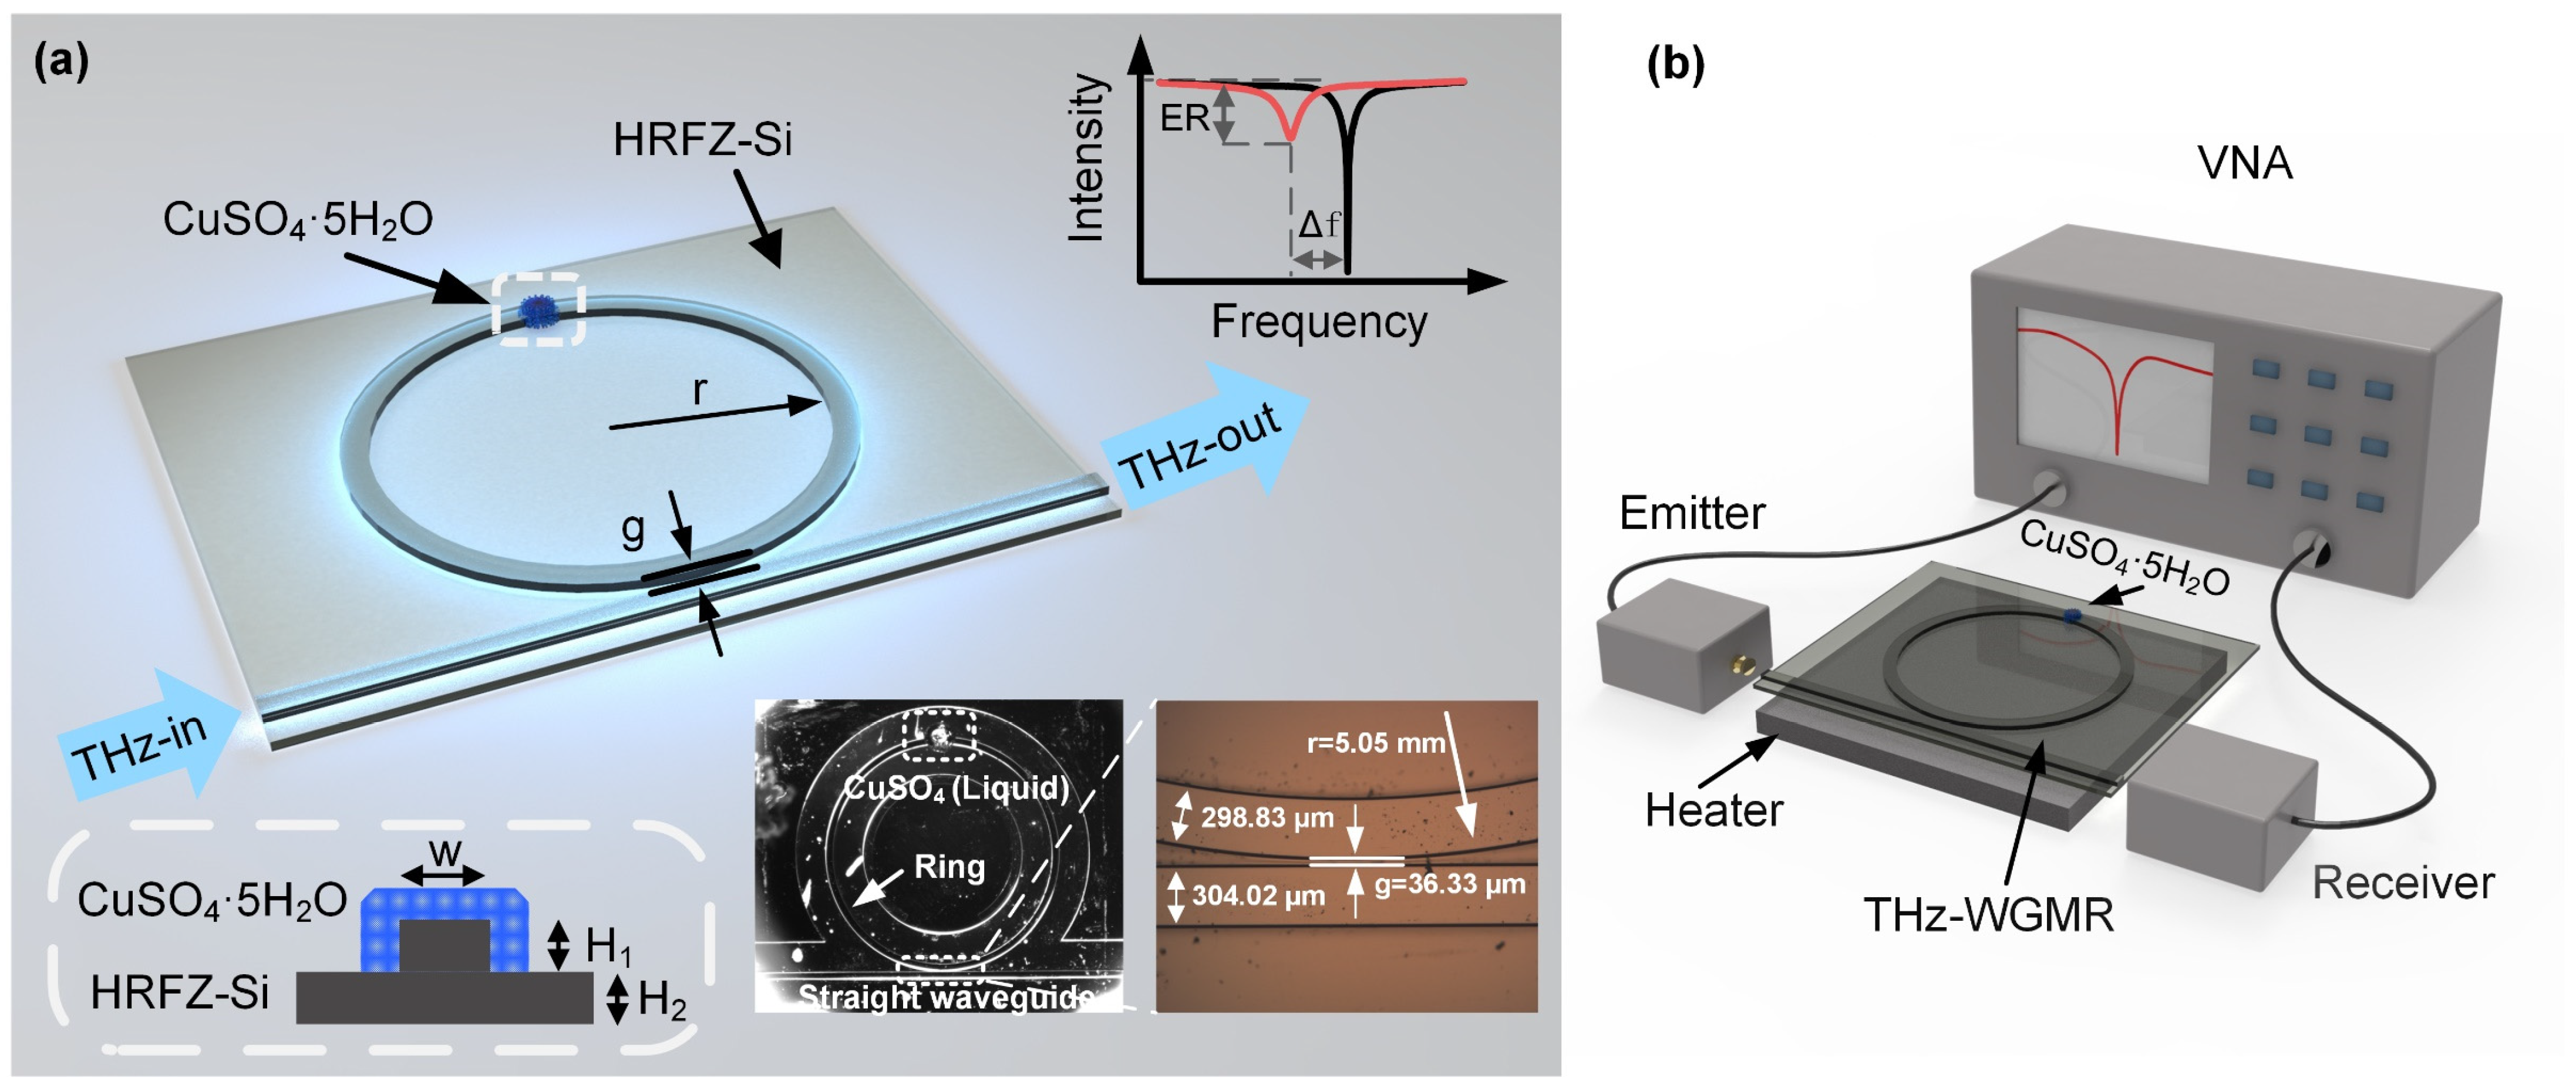
2. Design of Devices and Experiments

The THz-WGMR, shown in Figure 1a, consists of a straight coupling waveguide and ring resonator, and the WGMs are excited through the terahertz waves in the straight waveguide. First, the THz wave is coupled into the straight waveguide. Then, the THz wave is coupled into the ring resonator where it is transmitted to the coupling region between the ring resonator and straight waveguide. Finally, the THz waves pass through the sample and export at the other end of the straight waveguide. The central resonant frequency f of the ring resonator can be expressed as
f = m c / L e f f
in which Leff represents the roundtrip length of the microring, m is an integer, and c represents the speed of light in vacuum. The intensity transmissivity Tt and the phase ϕ transmissivity of the microring resonator can be expressed as [47]
T t = r 2 + a 2 2 r a cos φ 1 + r 2 a 2 2 r a cos φ
ϕ = φ + π + tan 1 r sin φ a r cos φ + tan 1 a r sin φ 1 a r cos φ ,
respectively, where r represents the self-coupling coefficient, a is the single-pass amplitude transmission coefficient of the ring resonator, and φ represents the single-pass phase shift of the ring. When the self-coupling coefficient r is equal to the single-pass amplitude transmission coefficient a, the THz-WGMR works in the critical coupling state, indicating the sensor exhibits the highest sensitivity to the surrounding environment.
The measurements were performed using a vector network analyzer (VNA) (Ceyear 3649B) with a frequency range of 0.325~0.5 THz, as shown in Figure 1b. The inner hole size of the metal waveguide was 508 × 254 μm2 (WR-2.2). A linearly polarized THz radiation was generated from the emitter and received by the receiver. The VNA obtained the intensity transmission spectrum and phase spectrum of the THz-WGMR in the target frequency band using frequency scanning.
In this work, a high-Q THz-WGMR based on high-resistance float-zone silicon (HRFZ-Si) using traditional CMOS-compatible technologies was proposed and fabricated [46], as shown in the inset of Figure 1a. The radius r of the ring resonator was 5.05 mm, and the width w of the straight waveguide was 304.02 μm. The width w of the ring waveguide was 298.83 μm. The total thickness of the chip was 120 μm, and the thickness of ridge H1 was 63.13 μm. The gap g between the straight waveguide and the microring was 36.33 μm. The proposed THz-WGMR suppresses high-order modes, guaranteeing the purity of the spectrum.
We used the THz-WGMR to measure the change in the complex refractive index of the substance as the sensing theory, for which different substances usually have different complex refractive indices which make different effects on the resonance dip of the resonator. In detail, the substance overlapping with the evanescent field will change the mode extinction coefficient and mode refractive index corresponding to the change in the single-pass amplitude transmission coefficient a and the roundtrip length Leff, which leads to the change in the transmissivity Tt and resonance frequency f of the THz-WGMR, respectively.
In this experiment, the type (CuSO4·5H2O, CuSO4·3H2O, and CuSO4·H2O) of hydrate and the amount of CuSO4·xH2O (x = 5, 3, 1) covering the THz-WGMR were independent variables. The transmission spectrum of the THz-WGMR was measured to demonstrate the relationship between the complex refractive indices and the crystal water content. In addition, the dynamic dehydration and transformation from CuSO4·5H2O to CuSO4·3H2O at different temperatures was observed. To quantify the sample, the supersaturation CuSO4 solution with a concentration of 2 mol/L was first prepared. Then, the solution was transferred using a pipette (0.1~2.5 μL) quantitatively every time and then cooled to crystallize to obtain CuSO4·5H2O.

3. Results and Discussion

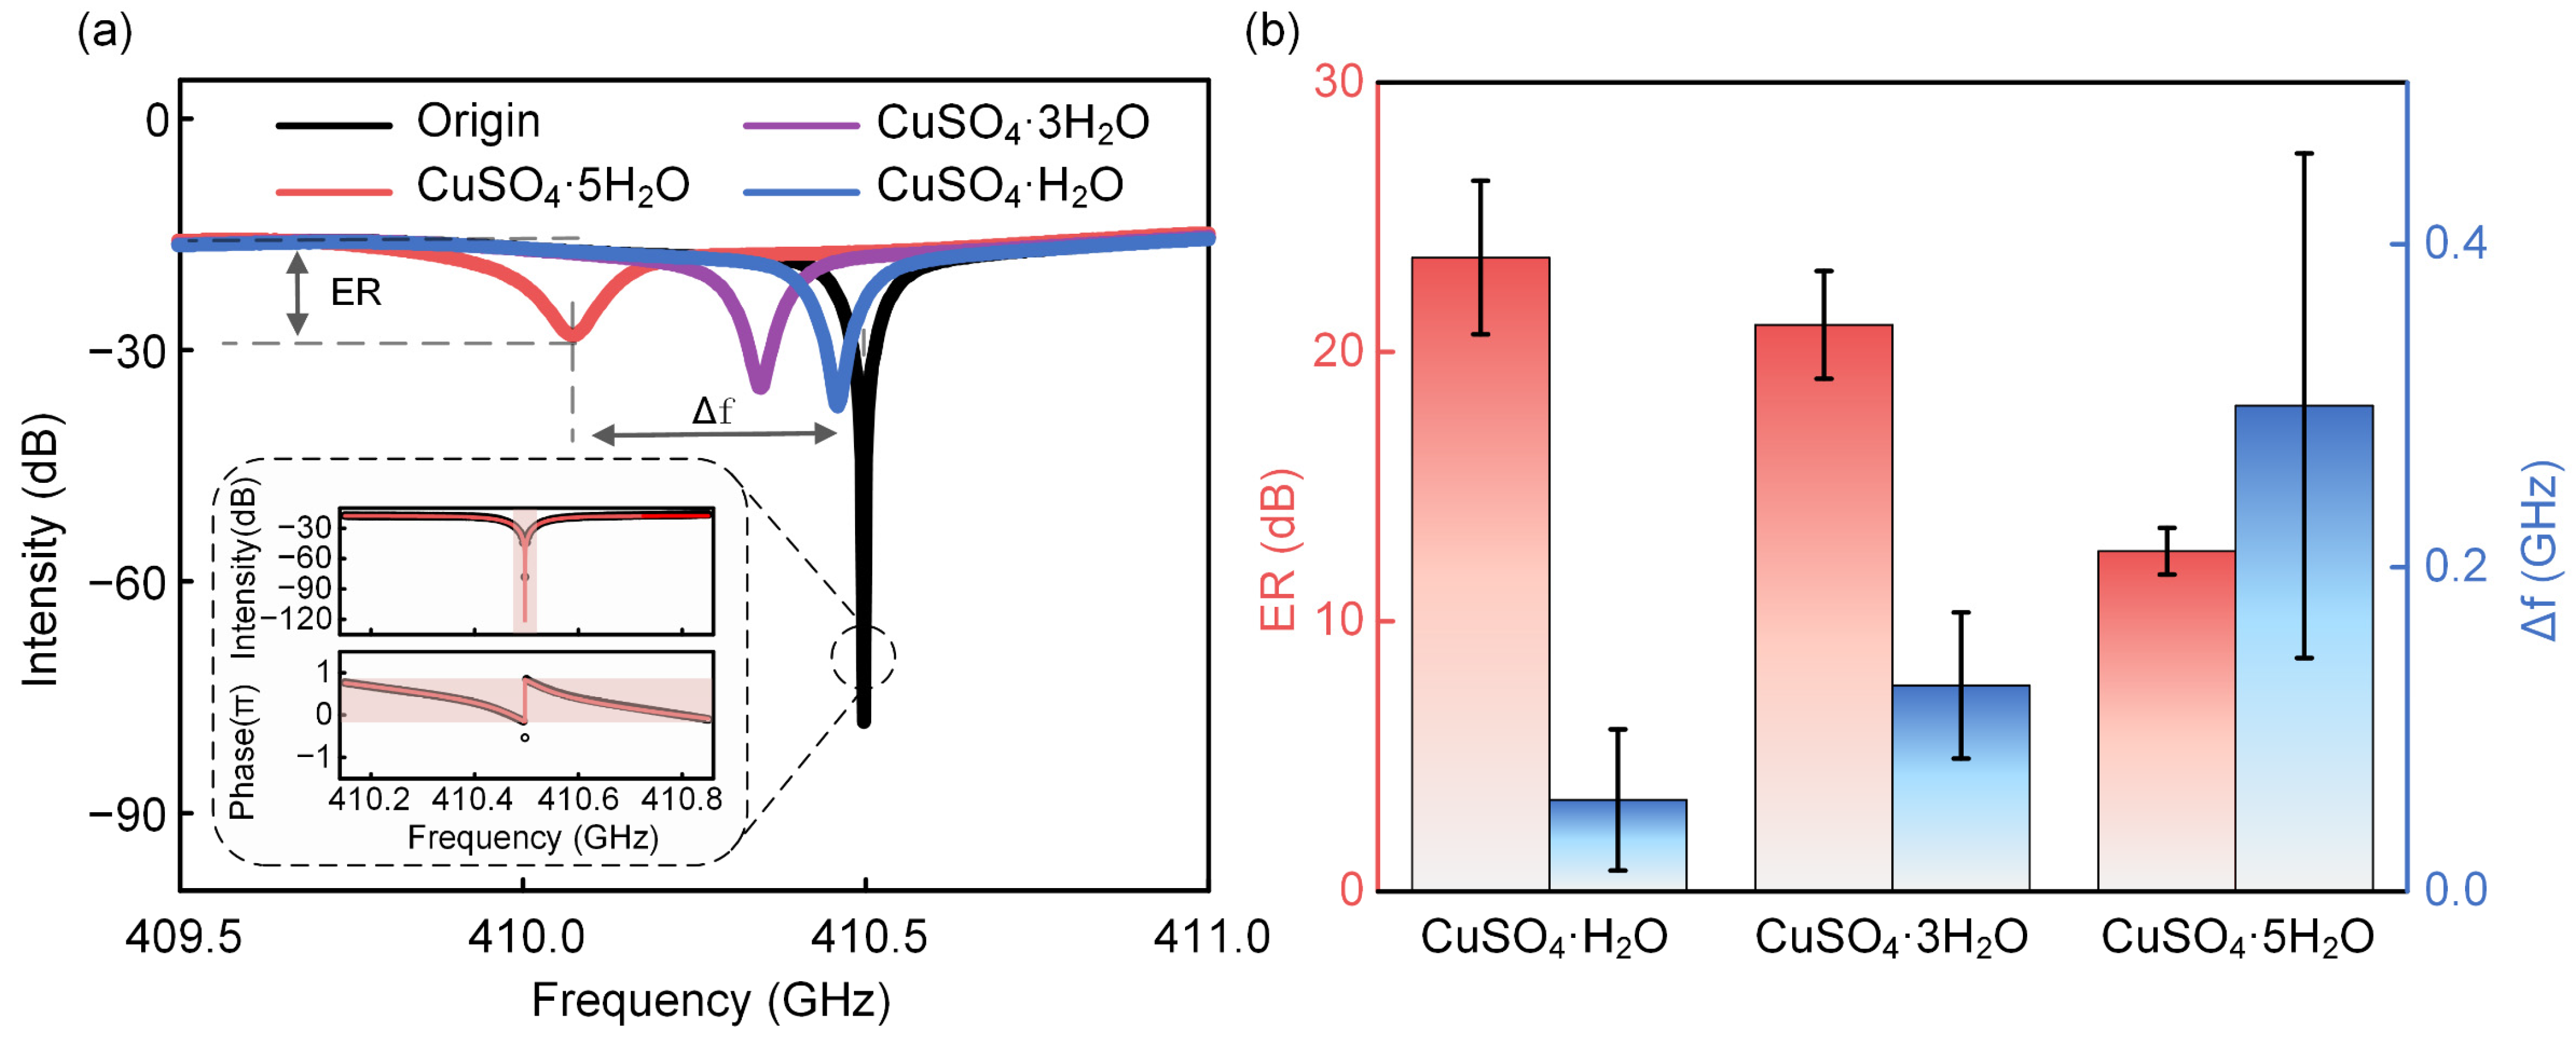
3.1. Water Content Identification of CuSO4·xH2O (x = 5, 3, 1)

To verify the feasibility of the THz-WGMR for crystal water sensing, the device was utilized to distinguish CuSO4·xH2O (x = 5, 3, 1) using complex refractive indices measurement. We observed the extinction ratio (ER) and the frequency shift of the resonance dip, which corresponded to the absorption coefficient and refractive index of the CuSO4·xH2O (x = 5, 3, 1), respectively. The transmission spectra of the THz-WGMR with CuSO4·xH2O (x = 5, 3, 1) on the ring resonator were measured.
To determine the change in the hydration state of the crystalline compounds, the experimental procedure was specially designed. The specific operations are shown in Supplementary Note S1. Briefly, we first prepared 2 mol/L of supersaturated CuSO4 solution at 80 °C, then quantitatively transferred the liquid to the surface of the ring resonator with a pipette, and finally, crystallized the solution at 25 °C to precipitate the CuSO4·5H2O crystal based on a temperature control plate under the chip. Here, one drop of 0.5 μL of the supersaturated CuSO4 solution was placed above the ring resonator, as shown in Figure 1a. After cooling and crystallizing, one dot of 1 μmol of CuSO4·5H2O was successfully obtained above the ring resonator. The above transfer method keeps the amount and distribution of CuSO4·5H2O stable as far as possible in repeat experiments. Then, the method of heating dehydration was used to realize the transformation from CuSO4·5H2O to CuSO4·3H2O and finally, to CuSO4·H2O, as detailed in Supplementary Note S2. In general, CuSO4·5H2O will gradually transform into CuSO4·3H2O when the heating temperature is higher than 50 °C, and it will gradually transform into CuSO4·H2O when the heating temperature is higher than 90 °C [21,30]. After measuring the spectrum of the THz-WGMR with the CuSO4·5H2O, the heating temperature was adjusted to 60 °C to fulfill the transformation from CuSO4·5H2O to CuSO4·3H2O, then the spectrum of the THz-WGMR with the CuSO4·3H2O was recorded. Similarly, the heating temperature was adjusted to 100 °C to fulfill the transformation from CuSO4·3H2O to CuSO4·H2O, and the spectrum of the THz-WGMR with the CuSO4·H2O was finally acquired. This method possesses a high accuracy in the experimental results by avoiding the complex operations of the addition and removal of substances during the measurement. The ambient temperatures will change the ER and resonant frequency of the resonator which affects the experimental results. Therefore, to keep the results reasonable, all the transmission spectra were recorded at a temperature of 25 °C. The time for the hydration of the CuSO4·H2O and CuSO4·3H2O by moisture adsorption at 25 °C beyond one hour was far larger than the operational time, which was approximately 5 min to adjust the temperature and the time to acquire and store the data (10 s), as illustrated in Supplementary Note S3. The transformation from CuSO4·H2O to CuSO4·3H2O and from CuSO4·3H2O to CuSO4·5H2O during the operational process was less than one percent.
The intensity transmission spectra of the THz-WGMR covered by one dot of 1 μmol of CuSO4·xH2O (x = 5, 3, 1) are illustrated in Figure 2a. The insets illustrate the measured intensity spectrum and the phase profile together with the fit lines, which demonstrate that the THz-WGMR works in the critical coupling state with the Q value of 3305 at the resonant frequency of 410.497 GHz. From the results, the substances increase the transmission loss of the THz-WGMR which pushes the coupling state away from the critical coupling state, therefore, leading to the decrease in the ER. In addition, the more the crystal water content implies the smaller the ER of the resonance dip. Roughly, the water content possesses a negative correlation with the ER, implying a positive correlation with the absorption coefficient of the substances. Focusing on the frequency shift, as the effective roundtrip length of the THz-WGMR increases with the effect of the substances, the resonant frequency of the THz-WGMR decreases. The more the crystal water content implies the greater the frequency shifts of the resonance dip. Roughly, the water content possesses a positive correlation with the frequency shift, implying a positive correlation with the refractive index.
Further, from the transmission spectra in Figure 2a, the ER will change greatly when the transmission loss of the THz-WGMR changes, especially for the THz-WGMR which is close to the critical coupling state. Hence, these sensors possess advantages in tiny substance detection. The ERs and frequency shifts were extracted from Figure 2a, and the experiments were repeated three times. Figure 2b illustrates the mean values and standard deviations of the ERs and frequency shifts caused by one dot of 1 μmol of CuSO4·xH2O (x = 5, 3, 1). As shown in Figure 2b, the higher water contents imply lower ERs and higher frequency shifts. Focusing on the standard deviation of the ER, the result from the CuSO4·H2O possesses the largest value, which is 2.8 dB, per the above argument; as shown in Figure 2a, the blue curve (CuSO4·H2O) is closer to the critical coupling state and, therefore, possesses the most intense change in the ER from the deviation of the amount and distribution of the substances. However, focusing on the standard deviations of the frequency shifts, the result from the CuSO4·5H2O possesses the largest value, which is 0.16 GHz, resulting from the largest refractive index, for which the deviation of the amount and distribution of the CuSO4·5H2O on the ring resonator will bring remarkable deviations. Nevertheless, these sensors distinguish CuSO4·xH2O (x = 5, 3, 1) clearly both in the ERs and frequency shifts corresponding with the substance absorption coefficients and refractive indexes. It is noteworthy that these sensors exhibit application potential in trace amount crystalline hydrate sensing.

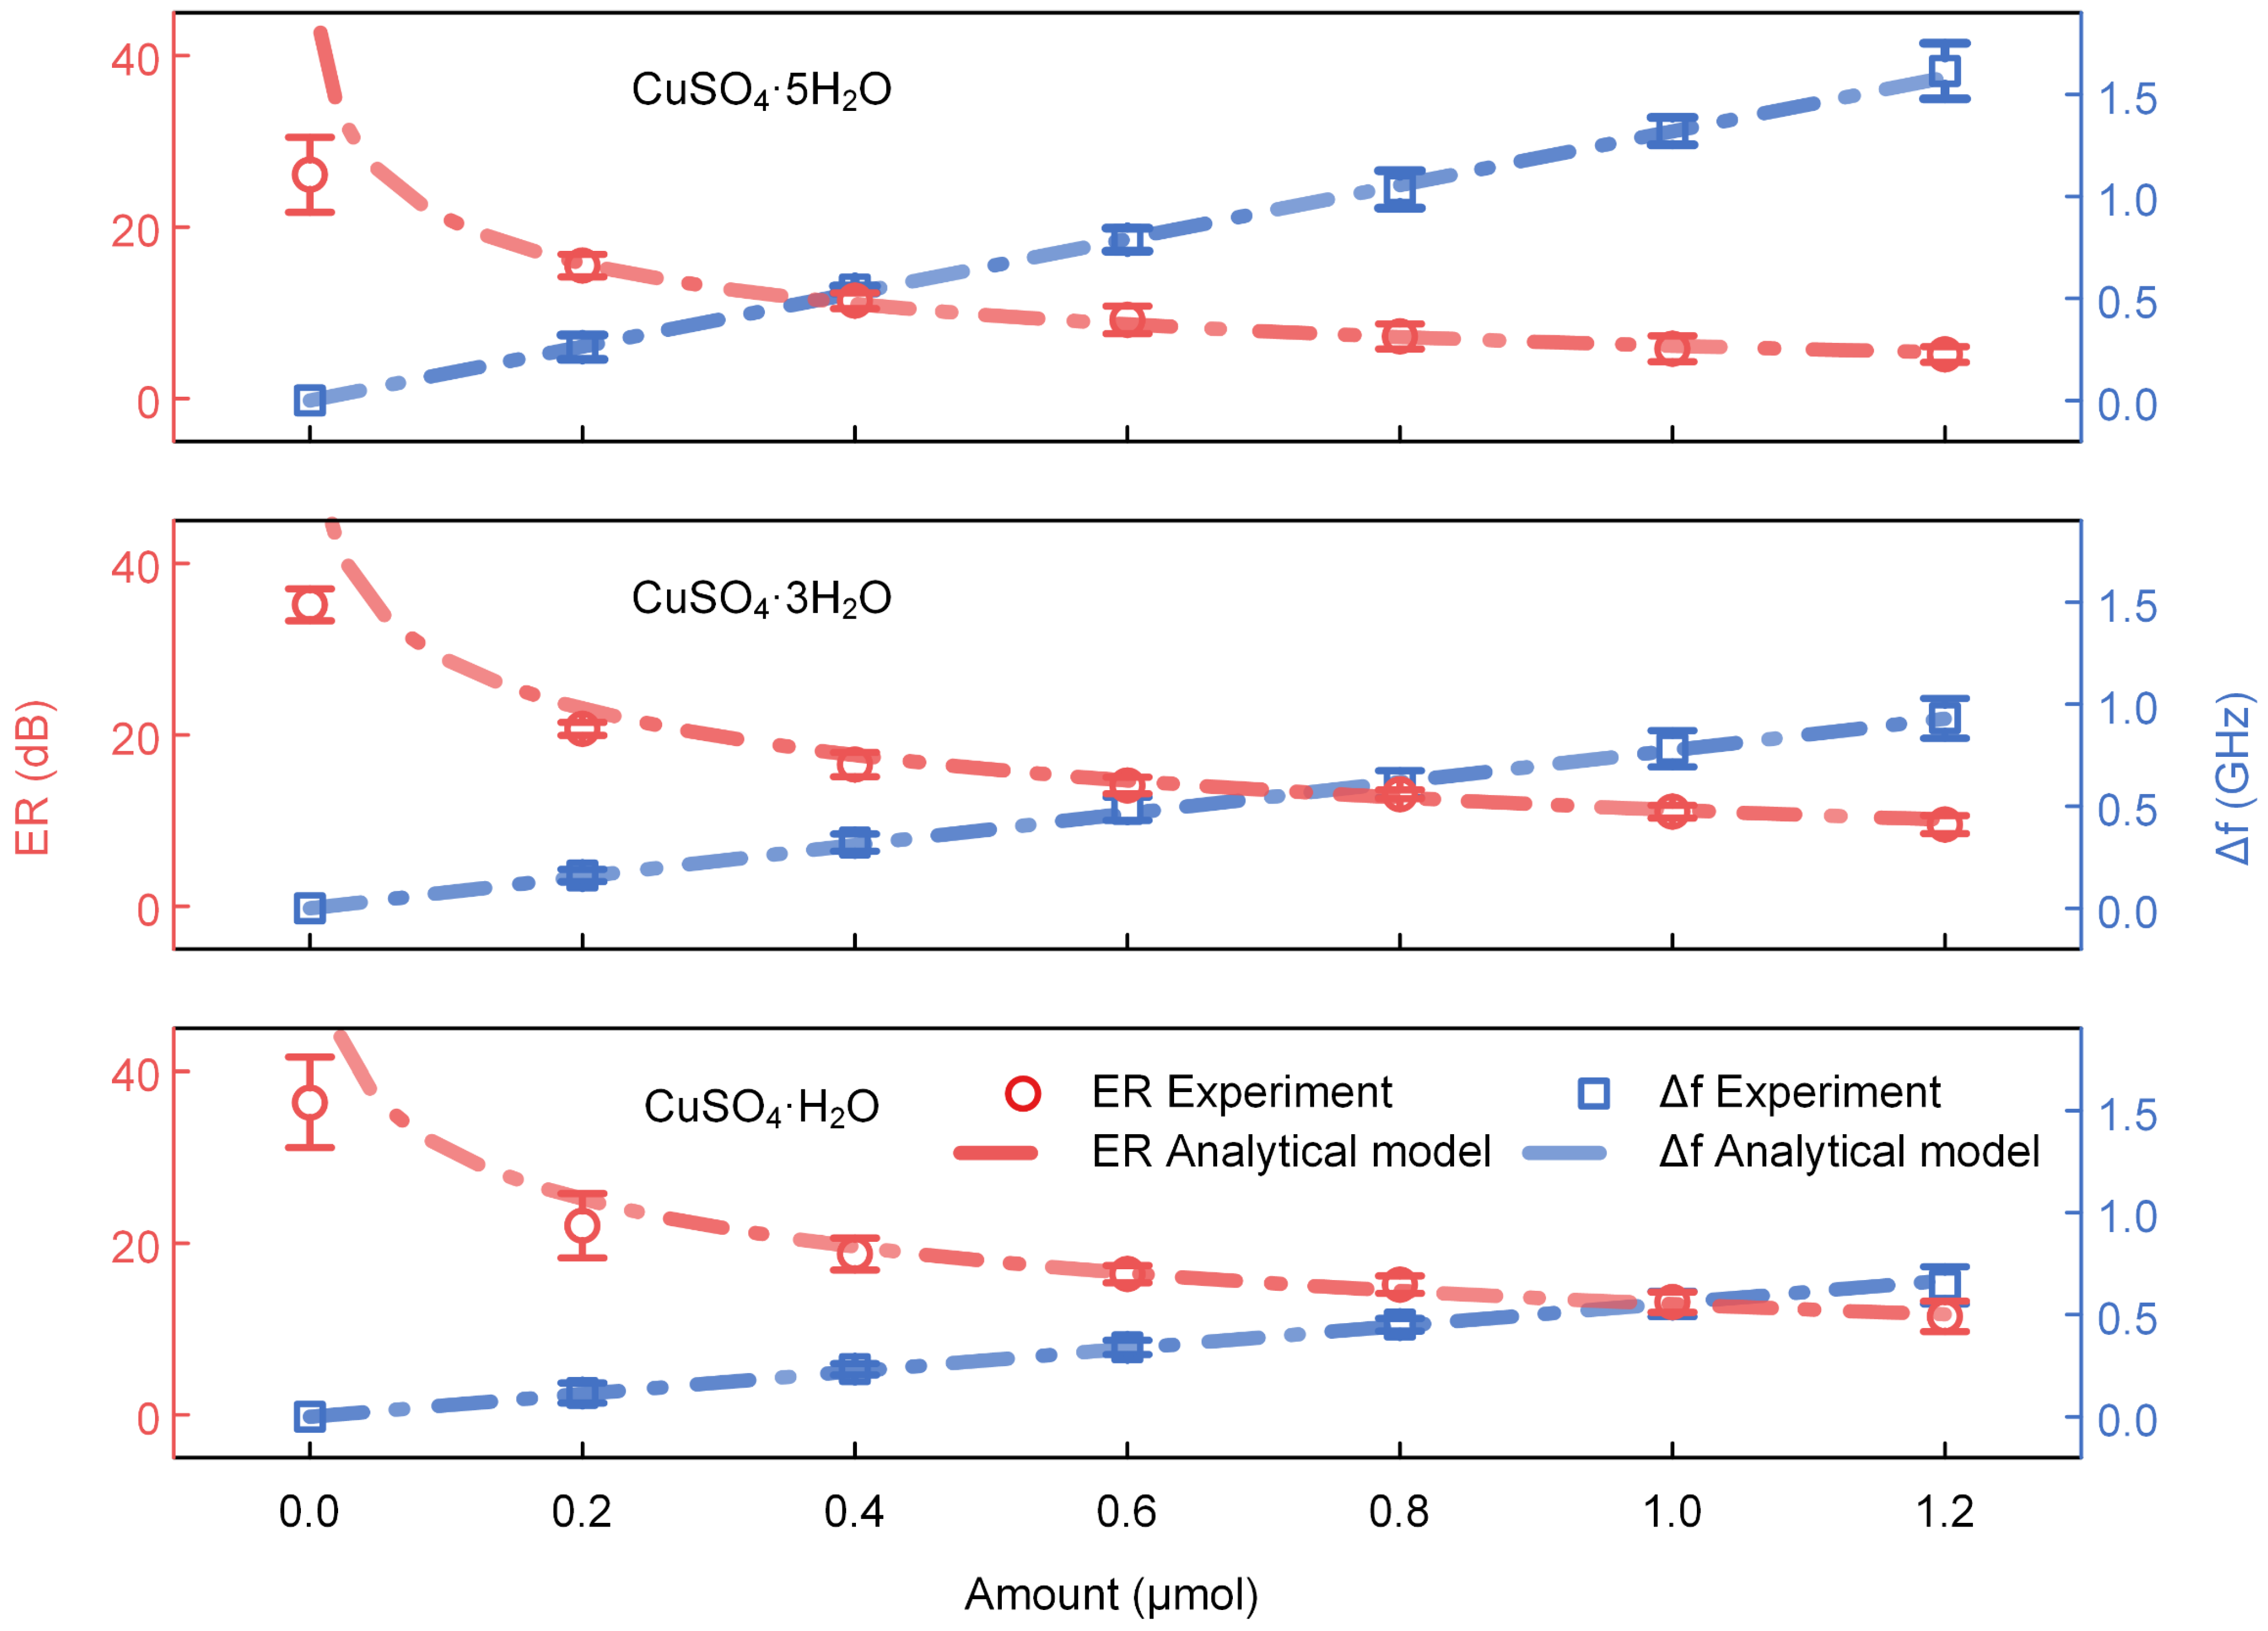
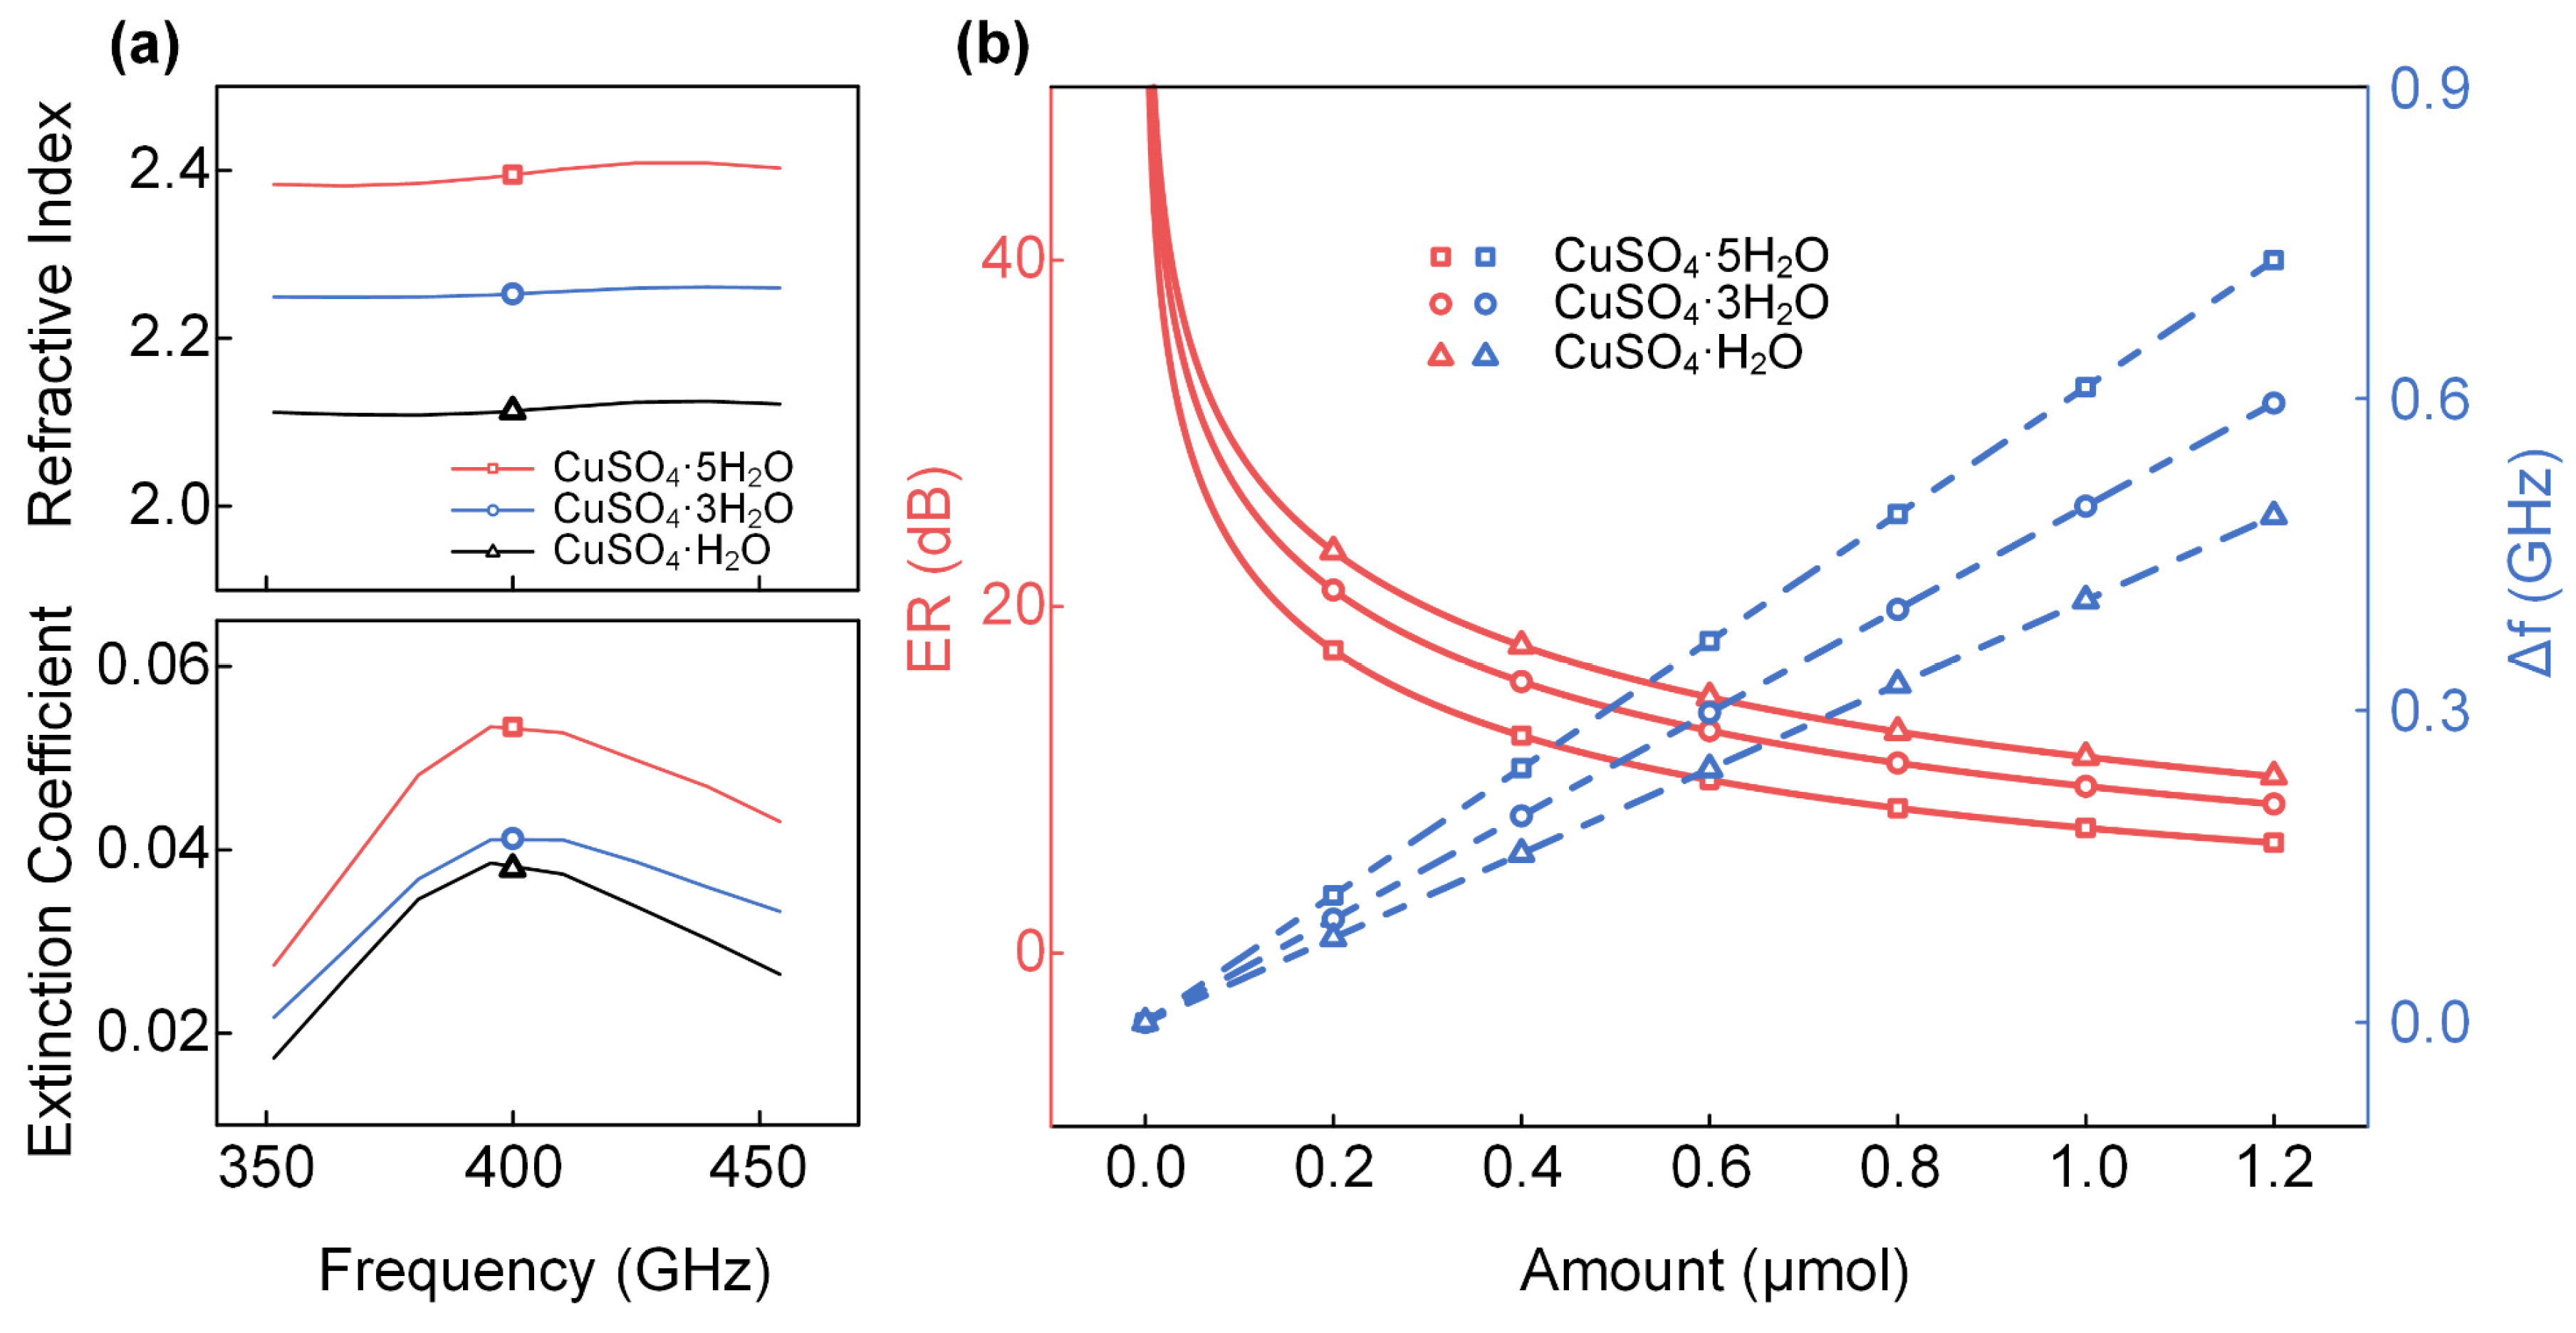
3.2. Sensitivity Characterization

To demonstrate the sensitivity of the THz-WGMR for CuSO4·xH2O (x = 5, 3, 1), different amounts of CuSO4·xH2O (x = 5, 3, 1) were used to perform the sensing and characterization of the sensitivity.
In this experiment, six drops of supersaturated CuSO4 solution with a concentration of 2 mol/L and a volume of 0.1 μL per drop were first transferred onto the surface of the ring resonator discretely using a pipette and then cooled to crystallize at 25 °C to obtain six dots of 0.2 μmol per dot of CuSO4·5H2O, as shown in Supplementary Note, Figure S1b. After that, one dot of 0.2 μmol of CuSO4·5H2O was removed with a cotton swab step by step; meanwhile, the spectrum of the THz-WGMR was recorded. Next, the transmission spectra of the THz-WGMR covered with 1.2, 1, 0.8, 0.6, 0.4, 0.2, and 0 μmol of CuSO4·5H2O were measured, respectively, and the ERs and frequency shifts of the resonance dip were extracted, as shown in Figure 3. According to the above recommendation in Section 3.1, the heated dehydration process should fulfill the transformation from CuSO4·5H2O to CuSO4·3H2O and from CuSO4·3H2O to CuSO4·H2O, then follow the same removal operation to obtain the ERs and frequency shifts caused by the different amounts of CuSO4·3H2O and CuSO4·H2O. We speculated that the variety of the volume of the drops and the overlapping areas between the substances and the evanescent fields of the waves in the THz-WGMR were the main sources of the deviations. We estimated the deviation of the overlapping areas, and the statistical result was ±6.5%, as demonstrated in Supplementary Note S4.
The experimental results (dots) were fitted using the formula (2). As shown in Figure 3, the ERs decrease with the increase in the amount of CuSO4·xH2O (x = 5, 3, 1) due to the increase in the extinction coefficients which push the THz-WGMR away from the critical coupling state. However, the frequency shifts increase linearly owing to the linear increase in the effective roundtrip length. We observed that the fitting values and the ERs mismatch at the amount of 0 μmol, mainly due to the residues of CuSO4·xH2O (x = 5, 3, 1) affecting the THz-WGMR when the amount is 0. Furthermore, the ER is sensitive to the surrounding environment when the THz-WGMR works near the critical coupling state, leading to an obvious deviation. The residues of CuSO4·xH2O (x = 5, 3, 1) arise from the operation procedures. As demonstrated in Supplementary Note S1, six dots of 0.2 μmol per dot of CuSO4·xH2O were transferred onto the surface of the ring resonator discretely, and then they were removed one by one with cotton swabs. Therefore, there inevitably were residues on the surface.
According to the results in Figure 3, the relationship between the amount of CuSO4·xH2O (x = 5, 3, 1) and frequency shifts maintain high linearity in a relatively large range, which makes it an appropriate index to define the sensing sensitivity of the sensor. The ERs demonstrate a nonlinear relationship with the amount of CuSO4·xH2O (x = 5, 3, 1) in the experimental range, resulting from the nonlinear relationship between the transmissivity Tt and the single-pass amplitude transmission coefficient a. However, they can be approximated as a linear relationship in a small range. By calculating the slopes of the blue fitting lines, the sensitivities of the sensor for CuSO4·xH2O (x = 5, 3, 1) were obtained as 1.32, 0.77, and 0.56 GHz/μmol, respectively.
In fact, in this experiment, to ensure a high-crystallization rate, a high concentration of 2 mol/L of supersaturated CuSO4 solution was used, which led to the minimum transferable amount of 0.2 μmol of the substance in this experiment. However, it was found that 0.2 μmol of substances does not completely interact with the evanescent field of the THz wave around the THz-WGMR, implying that the practical detection sensitivity of the sensor is higher than the results in the experiment.
To verify the experimental results, the effects of different amounts of CuSO4·xH2O (x = 5, 3, 1) on the transmission spectra of the THz-WGMR were simulated and analyzed. To establish the simulated model, the complex refractive indices of CuSO4·xH2O (x = 5, 3, 1) were required to measure first. The processes were as follows. Firstly, the CuSO4·xH2O (x = 5, 3, 1) tablets were prepared using a tablet machine, then their transmission spectra were measured using the THz-TDS. The thicknesses and transmission spectra of the tablets were acquired and used to calculate the refractive indexes and extinction coefficients. The details are shown in Supplementary Note S5. The results are shown in Figure 4a, and we noticed that the crystal water content of the CuSO4 crystal possesses a positive correlation with its refractive index and extinction coefficient, which is consistent with the experimental results. In detail, the refractive indexes of CuSO4·xH2O (x = 5, 3, 1) at 410.5 GHz are 2.4, 2.3, and 2.1, respectively, and the extinction coefficients are 0.053, 0.041, and 0.037, respectively.
After measuring the size of the devices and samples, a two-dimensional axisymmetric model was established in COMSOL, as detailed in Supplementary Note, Figure S5, and then the mode refractive indexes and mode extinction coefficients of the THz wave interacting with the CuSO4·xH2O (x = 5, 3, 1) were simulated. According to the data from Figure 3, the mode refractive indexes and mode extinction coefficients of the THz waves in the experiments can be calculated too. Comparing the calculated results with the simulated one, the relative errors of the mode refractive indexes caused by CuSO4·xH2O (x = 5, 3, 1) are 0.021, 0.003, and 0.011, respectively and the relative errors of the mode extinction coefficients caused by CuSO4·xH2O (x = 5, 3, 1) are 0.19, 0.31, and 0.28, respectively. The detailed values are listed in Supplementary Note, Table S2. Interestingly, the mode refractive indexes from the two methods correctly match each other. However, the mode extinction coefficients possess large relative errors, which result from the reflective loss from the samples which is not considered in the simulations, and unfortunately, the surface morphology and porosity of the substances are hard to obtain; hence, the detected substances are not perfectly reproduced in the simulation. Nevertheless, we simulated the effects of the different amounts of CuSO4·xH2O (x = 5, 3, 1) on the ERs and frequency shifts of the resonance dip, and the results are shown in Figure 4b. It is noteworthy that the ERs demonstrate a nonlinear relationship with the amount of the CuSO4·xH2O (x = 5, 3, 1), and the frequency shifts increase linearly with the amount of the CuSO4·xH2O (x = 5, 3, 1), which is qualitatively consistent with the experimental results in Figure 3.

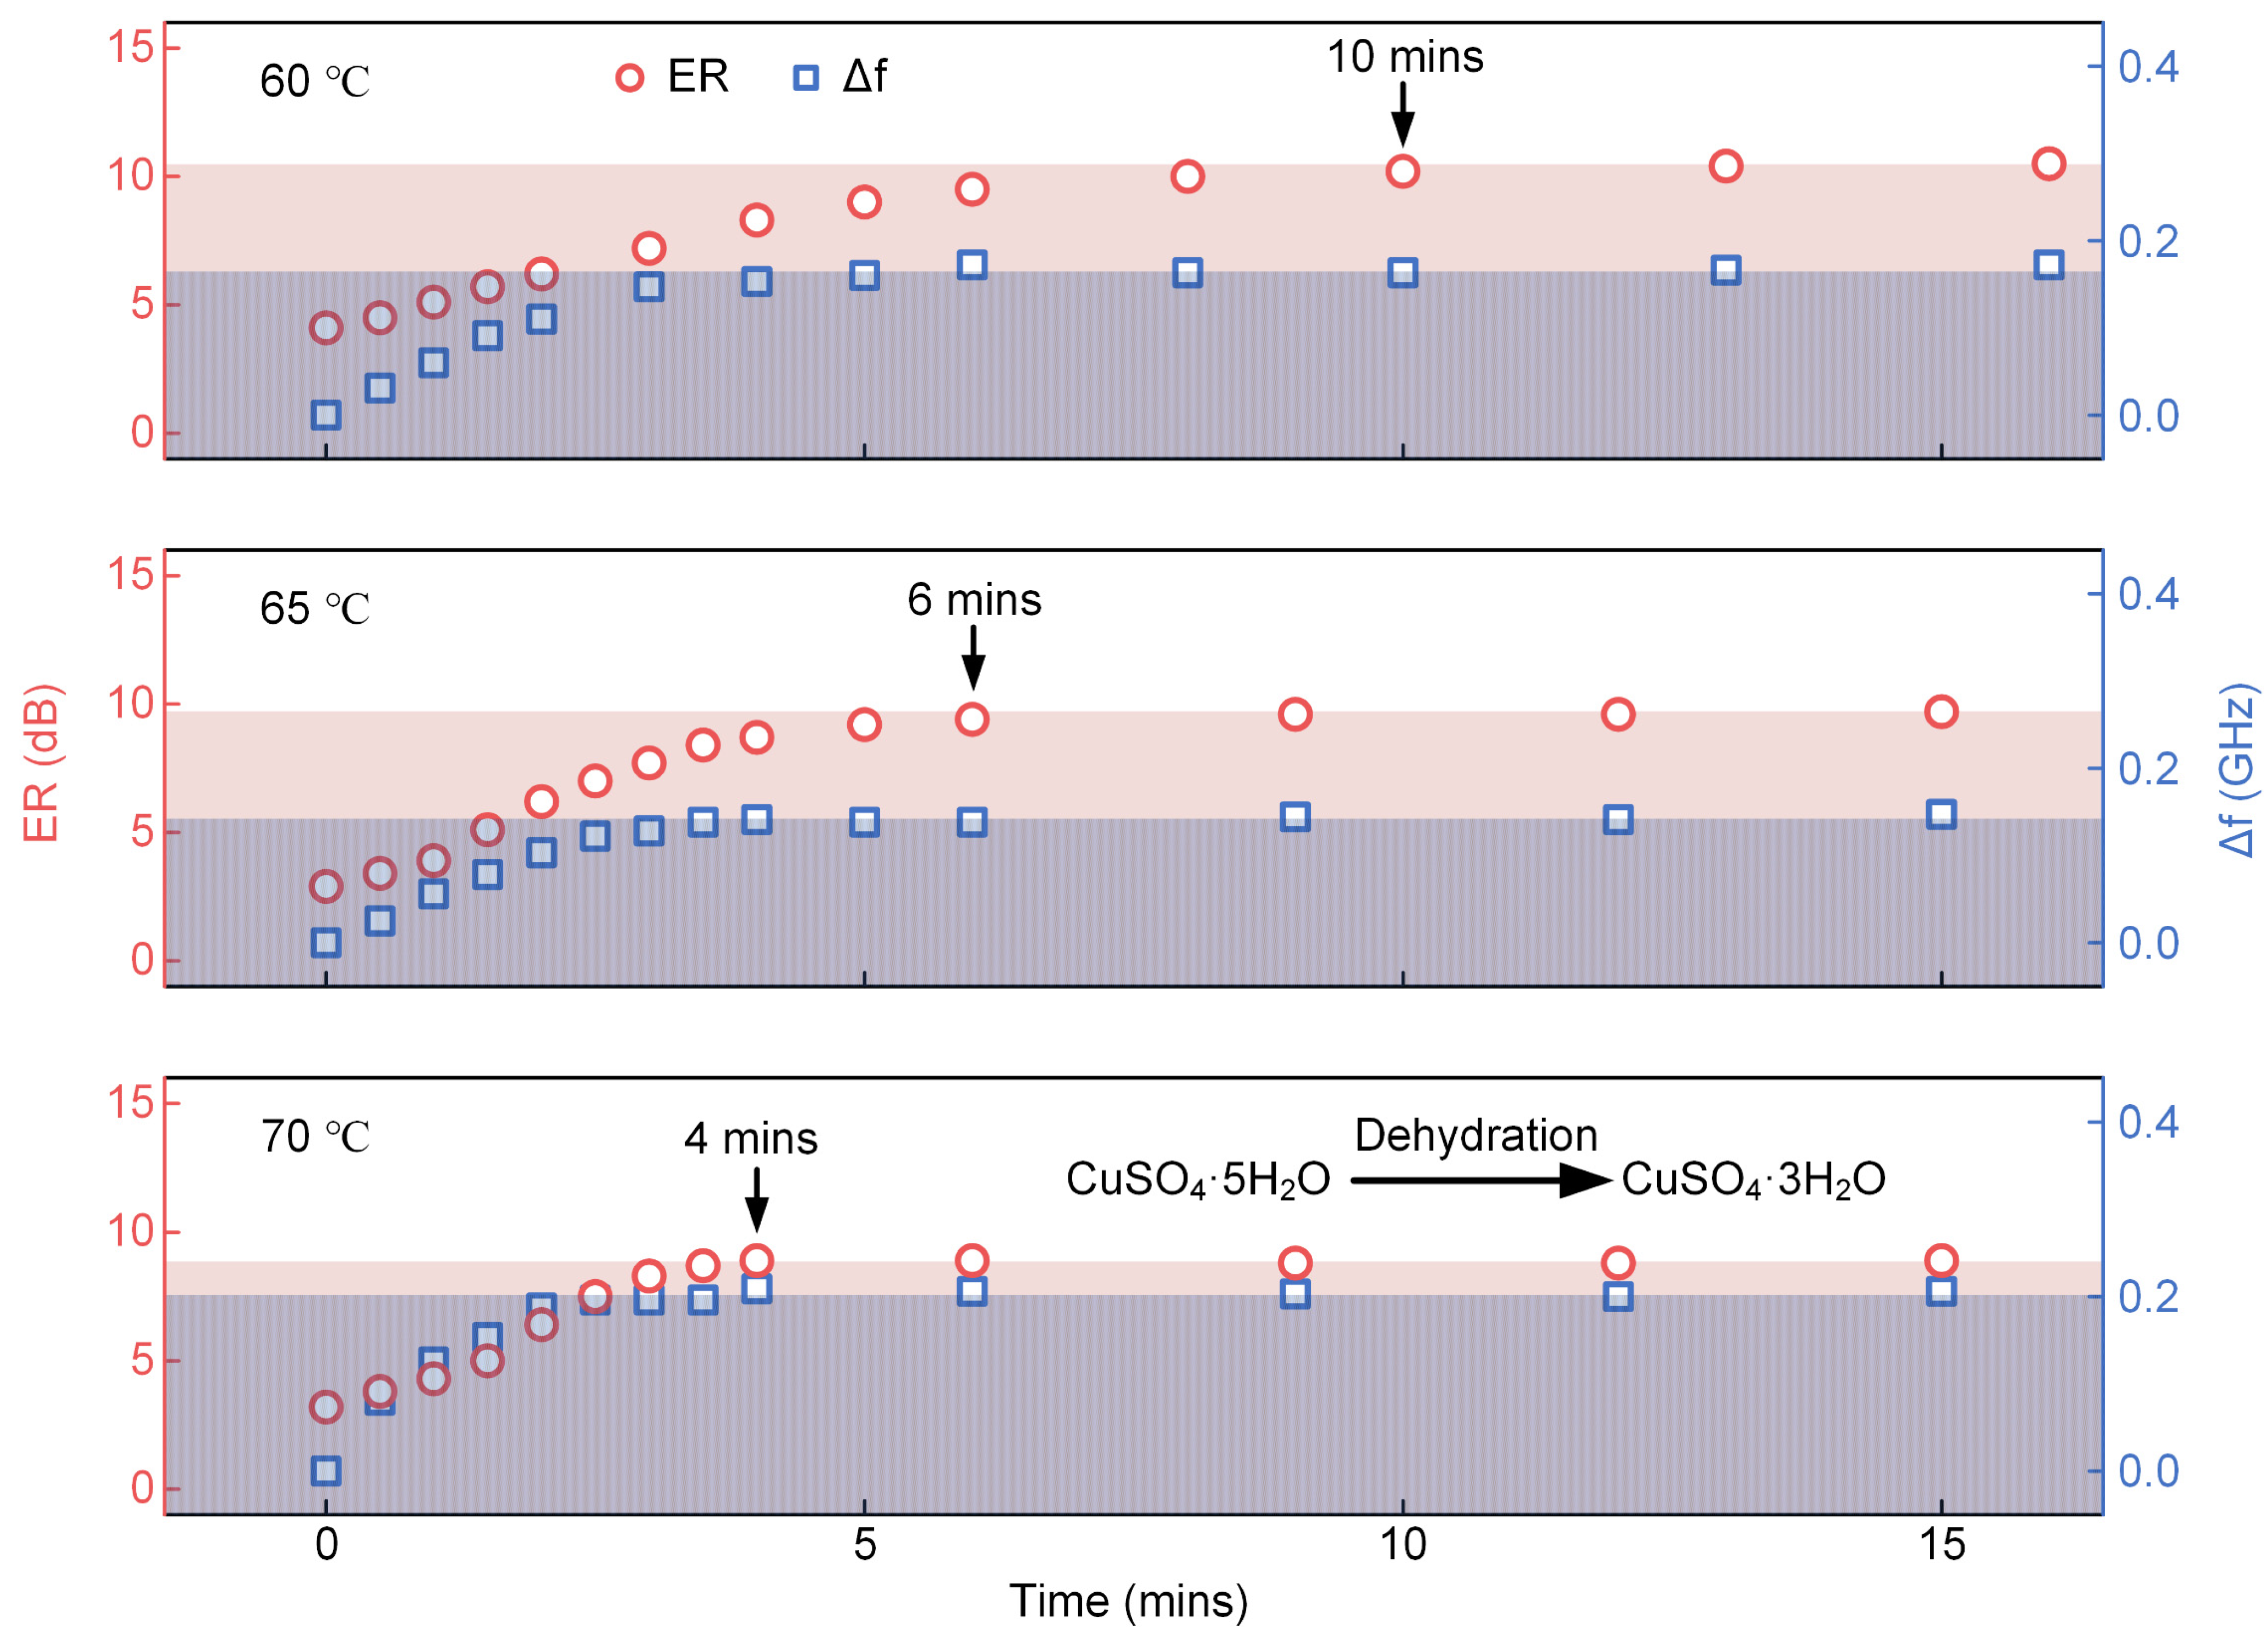
3.3. Monitoring of Dynamic Dehydration from CuSO4·5H2O to CuSO4·3H2O at Different Temperatures

Finally, the processes of CuSO4·5H2O dehydration and transformation into CuSO4·3H2O at different temperatures are exhibited in Figure 5. First, the heating temperatures were set as 60, 65, and 70 °C, respectively, and then the CuSO4·5H2O particles were directly transferred above the THz-WGMR. As demonstrated in Figure 5, the ER and frequency shift of the resonance dip increase over time until a steady state is reached. This phenomenon arises as the extinction coefficient and refractive index decrease when the CuSO4·5H2O dehydrates into the CuSO4·3H2O. The decrease in the extinction coefficient makes the THz-WGMR get closer to the critical coupling state which explains the increase in the ER. In addition, the decrease in the refractive index accumulates the frequency shift. Finally, the dynamic process reaches a steady state when the CuSO4·5H2O completely transforms into CuSO4·3H2O.
The results in Figure 5 demonstrate that the higher the temperature is, the less time there is to reach the steady state, indicating a higher dehydration rate with the augments in temperature. We speculate that the dehydration rate mainly depends on the temperature in this experiment. The ERs and frequency shifts increase synchronously and then reach steady states almost at the same time. During the experiment, we noticed that there was a clearer temperature fluctuation with a higher heating temperature, and the temperature fluctuation mainly affected the frequency shifts. Hence, taking the time when ER reaches the steady state as the observation index, the transformation time can be expressed more accurately, as marked in Figure 5.
Generally, this experiment demonstrates that these sensors possess the ability to dynamically monitor the dehydration process of substances, providing a method for analysis and the investigation of the dynamic change in substances.

4. Conclusions

In conclusion, an on-chip THz-WGMR was proposed and fabricated, enabling sensitive and rapid sensing of crystal water. The device was applied to measure different amounts of CuSO4·xH2O (x = 5, 3, 1). The detection sensitivities of the THz-WGMR for CuSO4·xH2O (x = 5, 3, 1) were 1.32, 0.77, and 0.56 GHz/μmol, respectively. The experimental results are in good agreement with the simulation results qualitatively, indicating that the extinction coefficient and refractive index increase with the increase in crystal water content. This difference in the determination parameters can be used to identify specific substances with different crystal water content. The experiment also demonstrates the dehydrated process from CuSO4·5H2O to CuSO4·3H2O with increased time at different temperatures, suggestive of the dynamic monitoring capability of the proposed device. The results show that a higher temperature implies a higher dehydration rate. It is noteworthy that the ability of tiny substance detection from the THz-WGMR was verified by the experiment, and its feasibility in the dynamic sensing of crystal water was proved. We believe that these sensors will provide a powerful tool for material analysis and the dynamic monitoring of biochemical reactions.

Supplementary Materials

The following supporting information can be downloaded at: https://www.mdpi.com/article/10.3390/s22239116/s1, Figure S1: The operation diagram; Figure S2: The diagram of the equipment; Figure S3: The weight curve of the CuSO4·H2O during hydration; Figure S4: The optical microscopic images of the liquid drop; Figure S5: The simulated electric field distribution for the ridge waveguide of the ring resonator; Figure S6: The setup of the THz-TDS; Table S1: The contact angles and lengths of six drops of CuSO4 solution; Table S2: The mode refractive indexes and the mode extinction coefficients acquired by THz-TDS and THz-WGMR respectively; References [21,30,48,49,50].

Author Contributions

Z.H.: investigation, visualization, formal analysis, data curation, validation, fabricated the devices and conducted the whole experiments, and writing—original draft. S.Y.: formal analysis, data curation, validation, and writing—review and editing. W.D.: fabricated the devices and writing—review and editing. J.C.: measured the complex refractive indices of CuSO4·xH2O (x = 5, 3, 1) using TDS and writing—review and editing. Y.Q.: prepared the tablets of CuSO4·xH2O (x = 5, 3, 1). Y.Z.: investigation, formal analysis, validation, and writing—review and editing. Z.W.: proposed and designed the device. L.C.: validation and writing—review and editing. H.L.: supervision. X.W.: supervision. X.Z.: supervision and funding acquisition. All authors have read and agreed to the published version of the manuscript.

Funding

This research was funded by the National Natural Science Foundation of China (NSFC) with grant numbers 61927817, 62005090, 61735006, 61631166003, 61675081, and 61505060.

Institutional Review Board Statement

Not applicable.

Informed Consent Statement

Not applicable.

Data Availability Statement

Data is available upon request. Please contact the corresponding author.

Acknowledgments

Authors are grateful for the advice of Xiwei Mo, Yilun Wang, and Bin Hu. Thanks for their efforts in the characterization of liquid drop morphology.

Conflicts of Interest

The authors declare that they do not have any competing financial or personal interests which may influence the work reported in this paper.

References

  1. Soda, G.; Chiba, T. Deuteron Magnetic Resonance Study of Cupric Sulfate Pentahydrate. J. Chem. Phys. 1969, 50, 439–455. [Google Scholar] [CrossRef]
  2. Zhang, Y.; Hsung, R.P.; Tracey, M.R.; Kurtz, K.C.M.; Vera, E.L. Copper Sulfate-Pentahydrate-1,10-Phenanthroline Catalyzed Amidations of Alkynyl Bromides. Synthesis of Heteroaromatic Amine Substituted Ynamides. Org. Lett. 2004, 6, 1151–1154. [Google Scholar] [CrossRef] [PubMed]
  3. Bonfoh, B.; Zinsstag, J.; Farah, Z.; Simbé, C.F.; Alfaroukh, I.O.; Aebi, R.; Badertscher, R.; Collomb, M.; Meyer, J.; Rehberger, B. Raw milk composition of Malian Zebu cows (Bos indicus) raised under traditional system. J. Food Compos. Anal. 2005, 18, 29–38. [Google Scholar] [CrossRef]
  4. Sharma, S.K.; Jotshi, C.K.; Kumar, S. Thermal stability of sodium salt hydrates for solar energy storage applications. Sol. Energy 1990, 45, 177–181. [Google Scholar] [CrossRef]
  5. Hadjieva, M.; Stoykov, R.; Filipova, T. Composite salt-hydrate concrete system for building energy storage. Renew. Energy 2000, 19, 111–115. [Google Scholar] [CrossRef]
  6. Kiatsiriroat, T.; Tiansuwan, J.; Suparos, T.; Na Thalang, K. Performance analysis of a direct-contact thermal energy storage-solidification. Renew. Energy 2000, 20, 195–206. [Google Scholar] [CrossRef]
  7. Reynard, B.; Bass, J.D. Elasticity of lawsonite and seismological signature of metamorphism and water cycling in the subducting oceanic crust. J. Metamorph. Geol. 2014, 32, 479–487. [Google Scholar] [CrossRef]
  8. Bezacier, L.; Reynard, B.; Bass, J.D.; Sanchez-Valle, C.; Van de Moortèle, B. Elasticity of antigorite, seismic detection of serpentinites, and anisotropy in subduction zones. Earth Planet. Sci. Lett. 2010, 289, 198–208. [Google Scholar] [CrossRef]
  9. Chantel, J.; Mookherjee, M.; Frost, D.J. The elasticity of lawsonite at high pressure and the origin of low velocity layers in subduction zones. Earth Planet. Sci. Lett. 2012, 349–350, 116–125. [Google Scholar] [CrossRef]
  10. Kameda, J.; Hirauchi, K.-i. Rheological properties of composite serpentine-brucite suspensions: Implications for mudflow behavior on forearc seamounts. Mar. Geol. 2018, 403, 191–196. [Google Scholar] [CrossRef]
  11. Wendlandt, W.W. A new look at the thermal properties of copper sulfate 5-hydrate. Thermochim. Acta 1970, 1, 419–427. [Google Scholar] [CrossRef]
  12. Charbonnier, F. Thermal behaviour of two new salts of malonic acid: Cu(C3H2O4)·4H2O and Cu(NH4)2(C3H2O4)2. Thermochim. Acta 1974, 10, 285–298. [Google Scholar] [CrossRef]
  13. Yang, D.; Xie, L.; Bobicki, E.; Xu, Z.; Liu, Q.; Zeng, H. Probing Anisotropic Surface Properties and Interaction Forces of Chrysotile Rods by Atomic Force Microscopy and Rheology. Langmuir 2014, 30, 10809–10817. [Google Scholar] [CrossRef]
  14. Pignon, F.; Magnin, A.; Piau, J.M. Thixotropic colloidal suspensions and flow curves with minimum: Identification of flow regimes and rheometric consequences. J. Rheol. 1996, 40, 573–587. [Google Scholar] [CrossRef]
  15. Ndlovu, B.; Forbes, E.; Farrokhpay, S.; Becker, M.; Bradshaw, D.; Deglon, D. A preliminary rheological classification of phyllosilicate group minerals. Miner. Eng. 2014, 55, 190–200. [Google Scholar] [CrossRef]
  16. Karato, S.-I. Mapping Water Content in the Upper Mantle. Geophys. Monogr. Ser. 2004, 138, 135–152. [Google Scholar] [CrossRef]
  17. de Castelnuovo, S.; Harness, J.B.; McColm, I.J. The Role of Liquid Water in Crystalline Hydrate Dehydration: Copper sulphate pentahydrate. J. Therm. Anal. Calorim. 2001, 63, 233–247. [Google Scholar] [CrossRef]
  18. Xu, J.; Zhang, D.; Tkachev, S.N.; Dera, P.K. Partnership for eXtreme Xtallography (PX2)—A state-of-the-art experimental facility for extreme-conditions crystallography: A case study of pressure-induced phase transition in natural ilvaite. Matter Radiat. Extremes 2022, 7, 028401. [Google Scholar] [CrossRef]
  19. Dong, Z.; Young, V.G.; Sheth, A.; Munson, E.J.; Schroeder, S.A.; Prakash, I.; Grant, D.J.W. Crystal Structure of Neotame Anhydrate Polymorph G. Pharm. Res. 2002, 19, 1549–1553. [Google Scholar] [CrossRef]
  20. Peets, P.; Kaupmees, K.; Vahur, S.; Leito, I. Reflectance FT-IR spectroscopy as a viable option for textile fiber identification. Heritage Sci. 2019, 7, 93. [Google Scholar] [CrossRef]
  21. White, R.L. Variable temperature infrared study of copper sulfate pentahydrate dehydration. Thermochim. Acta 2012, 528, 58–62. [Google Scholar] [CrossRef]
  22. Taylor, E.A.; Mileti, C.J.; Ganesan, S.; Kim, J.H.; Donnelly, E. Measures of Bone Mineral Carbonate Content and Mineral Maturity/Crystallinity for FT-IR and Raman Spectroscopic Imaging Differentially Relate to Physical–Chemical Properties of Carbonate-Substituted Hydroxyapatite. Calcif. Tissue Int. 2021, 109, 77–91. [Google Scholar] [CrossRef]
  23. Chang, H.; Huang, P.J. Dehydration of CuSO4 5H2O Studied by Thermo-Raman Spectroscopy. J. Chin. Chem. Soc. 1998, 45, 59–66. [Google Scholar] [CrossRef]
  24. Jurczak, E.; Mazurek, A.H.; Szeleszczuk, Ł.; Pisklak, D.M.; Zielińska-Pisklak, M. Pharmaceutical Hydrates Analysis—Overview of Methods and Recent Advances. Pharmaceutics 2020, 12, 959. [Google Scholar] [CrossRef] [PubMed]
  25. Sensogut, C.; Yildirim, O.S.; Cinar, I.; Ozdeniz, A.H. A Statistical Study on Thermogravimetry of Some Coals in Turkey. Energy Sources Part A 2007, 30, 334–338. [Google Scholar] [CrossRef]
  26. Sava, I.; Burescu, A.; Lisa, G. Study of thermal behavior of polyimides containing pendent-substituted azobenzene units. Polym. Bull. 2014, 71, 1359–1373. [Google Scholar] [CrossRef]
  27. Ng, W.-L.; Ho, C.-C.; Ng, S.-K. Isothermal dehydration of copper sulfate pentahydrate and trihydrate. J. Inorg. Nucl. Chem. 1978, 40, 459–462. [Google Scholar] [CrossRef]
  28. El-Houte, S.; El-Sayed Ali, M.; Sørensen, O.T. Dehydration of CuSO4·5H2O studied by conventional and advanced thermal analysis techniques. Thermochim. Acta 1989, 138, 107–114. [Google Scholar] [CrossRef]
  29. Davies, A.G.; Linfield, E.H.; Pepper, M.; Crowe, T.W.; Globus, T.; Woolard, D.L.; Hesler, J.L. Terahertz sources and detectors and their application to biological sensing. Philos. Trans. R. Soc. London. Ser. A: Math. Phys. Eng. Sci. 2004, 362, 365–377. [Google Scholar] [CrossRef]
  30. Fu, X.; Yang, G.; Sun, J.; Zhou, J. Vibrational Spectra of Copper Sulfate Hydrates Investigated with Low-Temperature Raman Spectroscopy and Terahertz Time Domain Spectroscopy. J. Phys. Chem. A 2012, 116, 7314–7318. [Google Scholar] [CrossRef]
  31. Ruggiero, M.T.; Korter, T.M. Uncovering the Terahertz Spectrum of Copper Sulfate Pentahydrate. J. Phys. Chem. A 2016, 120, 227–232. [Google Scholar] [CrossRef] [PubMed]
  32. Afsah-Hejri, L.; Hajeb, P.; Ara, P.; Ehsani, R.J. A Comprehensive Review on Food Applications of Terahertz Spectroscopy and Imaging. Compr. Rev. Food Sci. Food Saf. 2019, 18, 1563–1621. [Google Scholar] [CrossRef] [PubMed]
  33. Vogt, D.W.; Jones, A.H.; Haase, T.A.; Leonhardt, R. Subwavelength thick ultrahigh-Q terahertz disc microresonators. Photonics Res. 2020, 8, 1183–1188. [Google Scholar] [CrossRef]
  34. Vogt, D.W.; Jones, A.H.; Schwefel, H.G.L.; Leonhardt, R. Anomalous blue-shift of terahertz whispering-gallery modes via dielectric and metallic tuning. Opt. Lett. 2019, 44, 1319–1322. [Google Scholar] [CrossRef] [Green Version]
  35. Vogt, D.W.; Leonhardt, R. Terahertz whispering gallery mode bubble resonator. Optica 2017, 4, 809–812. [Google Scholar] [CrossRef] [Green Version]
  36. Vogt, D.W.; Leonhardt, R. Ultra-high Q terahertz whispering-gallery modes in a silicon resonator. APL Photonics 2018, 3, 051702. [Google Scholar] [CrossRef] [Green Version]
  37. Yuan, S.; Chen, L.; Wang, Z.; Wang, R.; Wu, X.; Zhang, X. Tunable high-quality Fano resonance in coupled terahertz whispering-gallery-mode resonators. Appl. Phys. Lett. 2019, 115, 201102. [Google Scholar] [CrossRef] [Green Version]
  38. Xu, W.; Xie, L.; Ying, Y. Mechanisms and applications of terahertz metamaterial sensing: A review. Nanoscale 2017, 9, 13864–13878. [Google Scholar] [CrossRef]
  39. Ako, R.T.; Upadhyay, A.; Withayachumnankul, W.; Bhaskaran, M.; Sriram, S. Dielectrics for Terahertz Metasurfaces: Material Selection and Fabrication Techniques. Adv. Opt. Mater. 2020, 8, 1900750. [Google Scholar] [CrossRef]
  40. Chen, H.T.; O’Hara, J.F.; Azad, A.K.; Taylor, A.J. Manipulation of terahertz radiation using metamaterials. Laser Photonics Rev. 2011, 5, 513–533. [Google Scholar] [CrossRef]
  41. Walia, S.; Shah, C.M.; Gutruf, P.; Nili, H.; Chowdhury, D.R.; Withayachumnankul, W.; Bhaskaran, M.; Sriram, S. Flexible metasurfaces and metamaterials: A review of materials and fabrication processes at micro- and nano-scales. Appl. Phys. Rev. 2015, 2, 011303. [Google Scholar] [CrossRef]
  42. Okamoto, K.; Tsuruda, K.; Diebold, S.; Hisatake, S.; Fujita, M.; Nagatsuma, T. Terahertz Sensor Using Photonic Crystal Cavity and Resonant Tunneling Diodes. J. Infrared Millim. Terahertz Waves 2017, 38, 1085–1097. [Google Scholar] [CrossRef]
  43. Kurt, H.; Citrin, D.S. Photonic crystals for biochemical sensing in the terahertz region. Appl. Phys. Lett. 2005, 87, 041108. [Google Scholar] [CrossRef]
  44. Islam, M.S.; Sultana, J.; Ahmed, K.; Islam, M.R.; Dinovitser, A.; Ng, B.W.H.; Abbott, D. A Novel Approach for Spectroscopic Chemical Identification Using Photonic Crystal Fiber in the Terahertz Regime. IEEE Sens. J. 2018, 18, 575–582. [Google Scholar] [CrossRef]
  45. Vogt, D.W.; Jones, A.H.; Leonhardt, R. Terahertz Gas-Phase Spectroscopy Using a Sub-Wavelength Thick Ultrahigh-Q Microresonator. Sensors 2020, 20, 3005. [Google Scholar] [CrossRef] [PubMed]
  46. Wang, Z.; Yuan, S.; Dong, G.; Wang, R.; Chen, L.; Wu, X.; Zhang, X. On-chip single-mode high-Q terahertz whispering gallery mode resonator. Opt. Lett. 2019, 44, 2835–2838. [Google Scholar] [CrossRef]
  47. Bogaerts, W.; De Heyn, P.; Van Vaerenbergh, T.; De Vos, K.; Kumar Selvaraja, S.; Claes, T.; Dumon, P.; Bienstman, P.; Van Thourhout, D.; Baets, R. Silicon microring resonators. Laser Photonics Rev. 2012, 6, 47–73. [Google Scholar] [CrossRef]
  48. Liu, L.; Dong, J.; Gao, D.; Zheng, A.; Zhang, X. On-chip passive three-port circuit of all-optical ordered-route transmission. Sci. Rep. 2015, 5, 10190. [Google Scholar] [CrossRef] [Green Version]
  49. Yuan, S.; Chen, L.; Wang, Z.; Wang, R.; Wu, X.; Zhang, X. Tunable high-quality Fano resonance in coupled terahertz whispering-gallery-mode resonators. Appl. Phys. Lett. 2019, 115, 201102. [Google Scholar] [CrossRef] [Green Version]
  50. Vogt, D.W.; Jones, A.H.; Leonhardt, R. Thermal tuning of silicon terahertz whispering-gallery mode resonators. Appl. Phys. Lett. 2018, 113, 011101. [Google Scholar] [CrossRef]
Figure 1. The schematic diagram of the terahertz whispering gallery mode resonator (THz-WGMR) together with its sensing principle and the diagram of the experimental setup. (a) The schematic diagram of the THz-WGMR. The inset in the lower left shows the cross-section of the ridge waveguide. The spectra in the upper right illustrate the principle of sense. The photographs in the lower right show the real chip which consists of a straight coupling waveguide and a ring resonator. The supersaturated CuSO4 solution of 0.5 μL covers the ring resonator. The optical microscopic image on the right shows the coupling region of the THz-WGMR. (b) The illustration of the experimental setup. The heating plate under the chip is used to adjust and maintain the temperature. The end faces of the straight waveguide are aligned with the emitter and receiver, and the transmission spectrum is shown on the screen of the vector network analyzer (VNA).
Sensors 22 09116 g001
Figure 2. The spectra of the THz-WGMR and the experimental results for CuSO4·xH2O (x = 5, 3, 1). (a) The intensity spectra of the THz-WGMR covered with one dot of 1 μmol CuSO4·xH2O (x = 5, 3, 1). The insets are the intensity spectrum and phase profile of the THz-WGMR. The black circles and red lines in insets represent the experimental and analytical results, respectively. The intensity spectrum of the THz-WGMR illustrates the resonance frequency of 410.497 GHz and the quality (Q) value of 3305. The phase profile demonstrates a π shift, indicating the THz-WGMR works in the critical coupling state. (b) The extinction ratios (ERs) and frequency shifts of the resonance dip caused by one dot of 1 μmol (0.5 µL) CuSO4·xH2O (x = 5, 3, 1).
Sensors 22 09116 g002
Figure 3. The experimental results (dots) and fitting results (lines) for different amounts of CuSO4·xH2O (x = 5, 3, 1). The red and blue dots (curves) represent the ERs and frequency shifts of the resonance dip, respectively.
Sensors 22 09116 g003
Figure 4. The complex refractive indices of CuSO4·xH2O (x = 5, 3, 1) and the simulated sensing results for different amounts of CuSO4·xH2O (x = 5, 3, 1). (a) Refractive indexes and extinction coefficients of CuSO4·xH2O (x = 5, 3, 1) with the frequency from 350 to 450 GHz. (b) The ERs (red) and frequency shifts (blue) of the resonance dip.
Sensors 22 09116 g004
Figure 5. The dynamic dehydration from CuSO4·5H2O to CuSO4·3H2O at 60, 65, and 70 °C, respectively. The ERs (red circles) and frequency shifts (blue squares) of the resonance dip along the time are demonstrated.
Sensors 22 09116 g005
Publisher’s Note: MDPI stays neutral with regard to jurisdictional claims in published maps and institutional affiliations.

