
An Intelligent Correlation Real-Time Analysis Method for the Mechanical Properties of Members in Super-Span Valve Hall Grid Structure Hoisting Process

Abstract
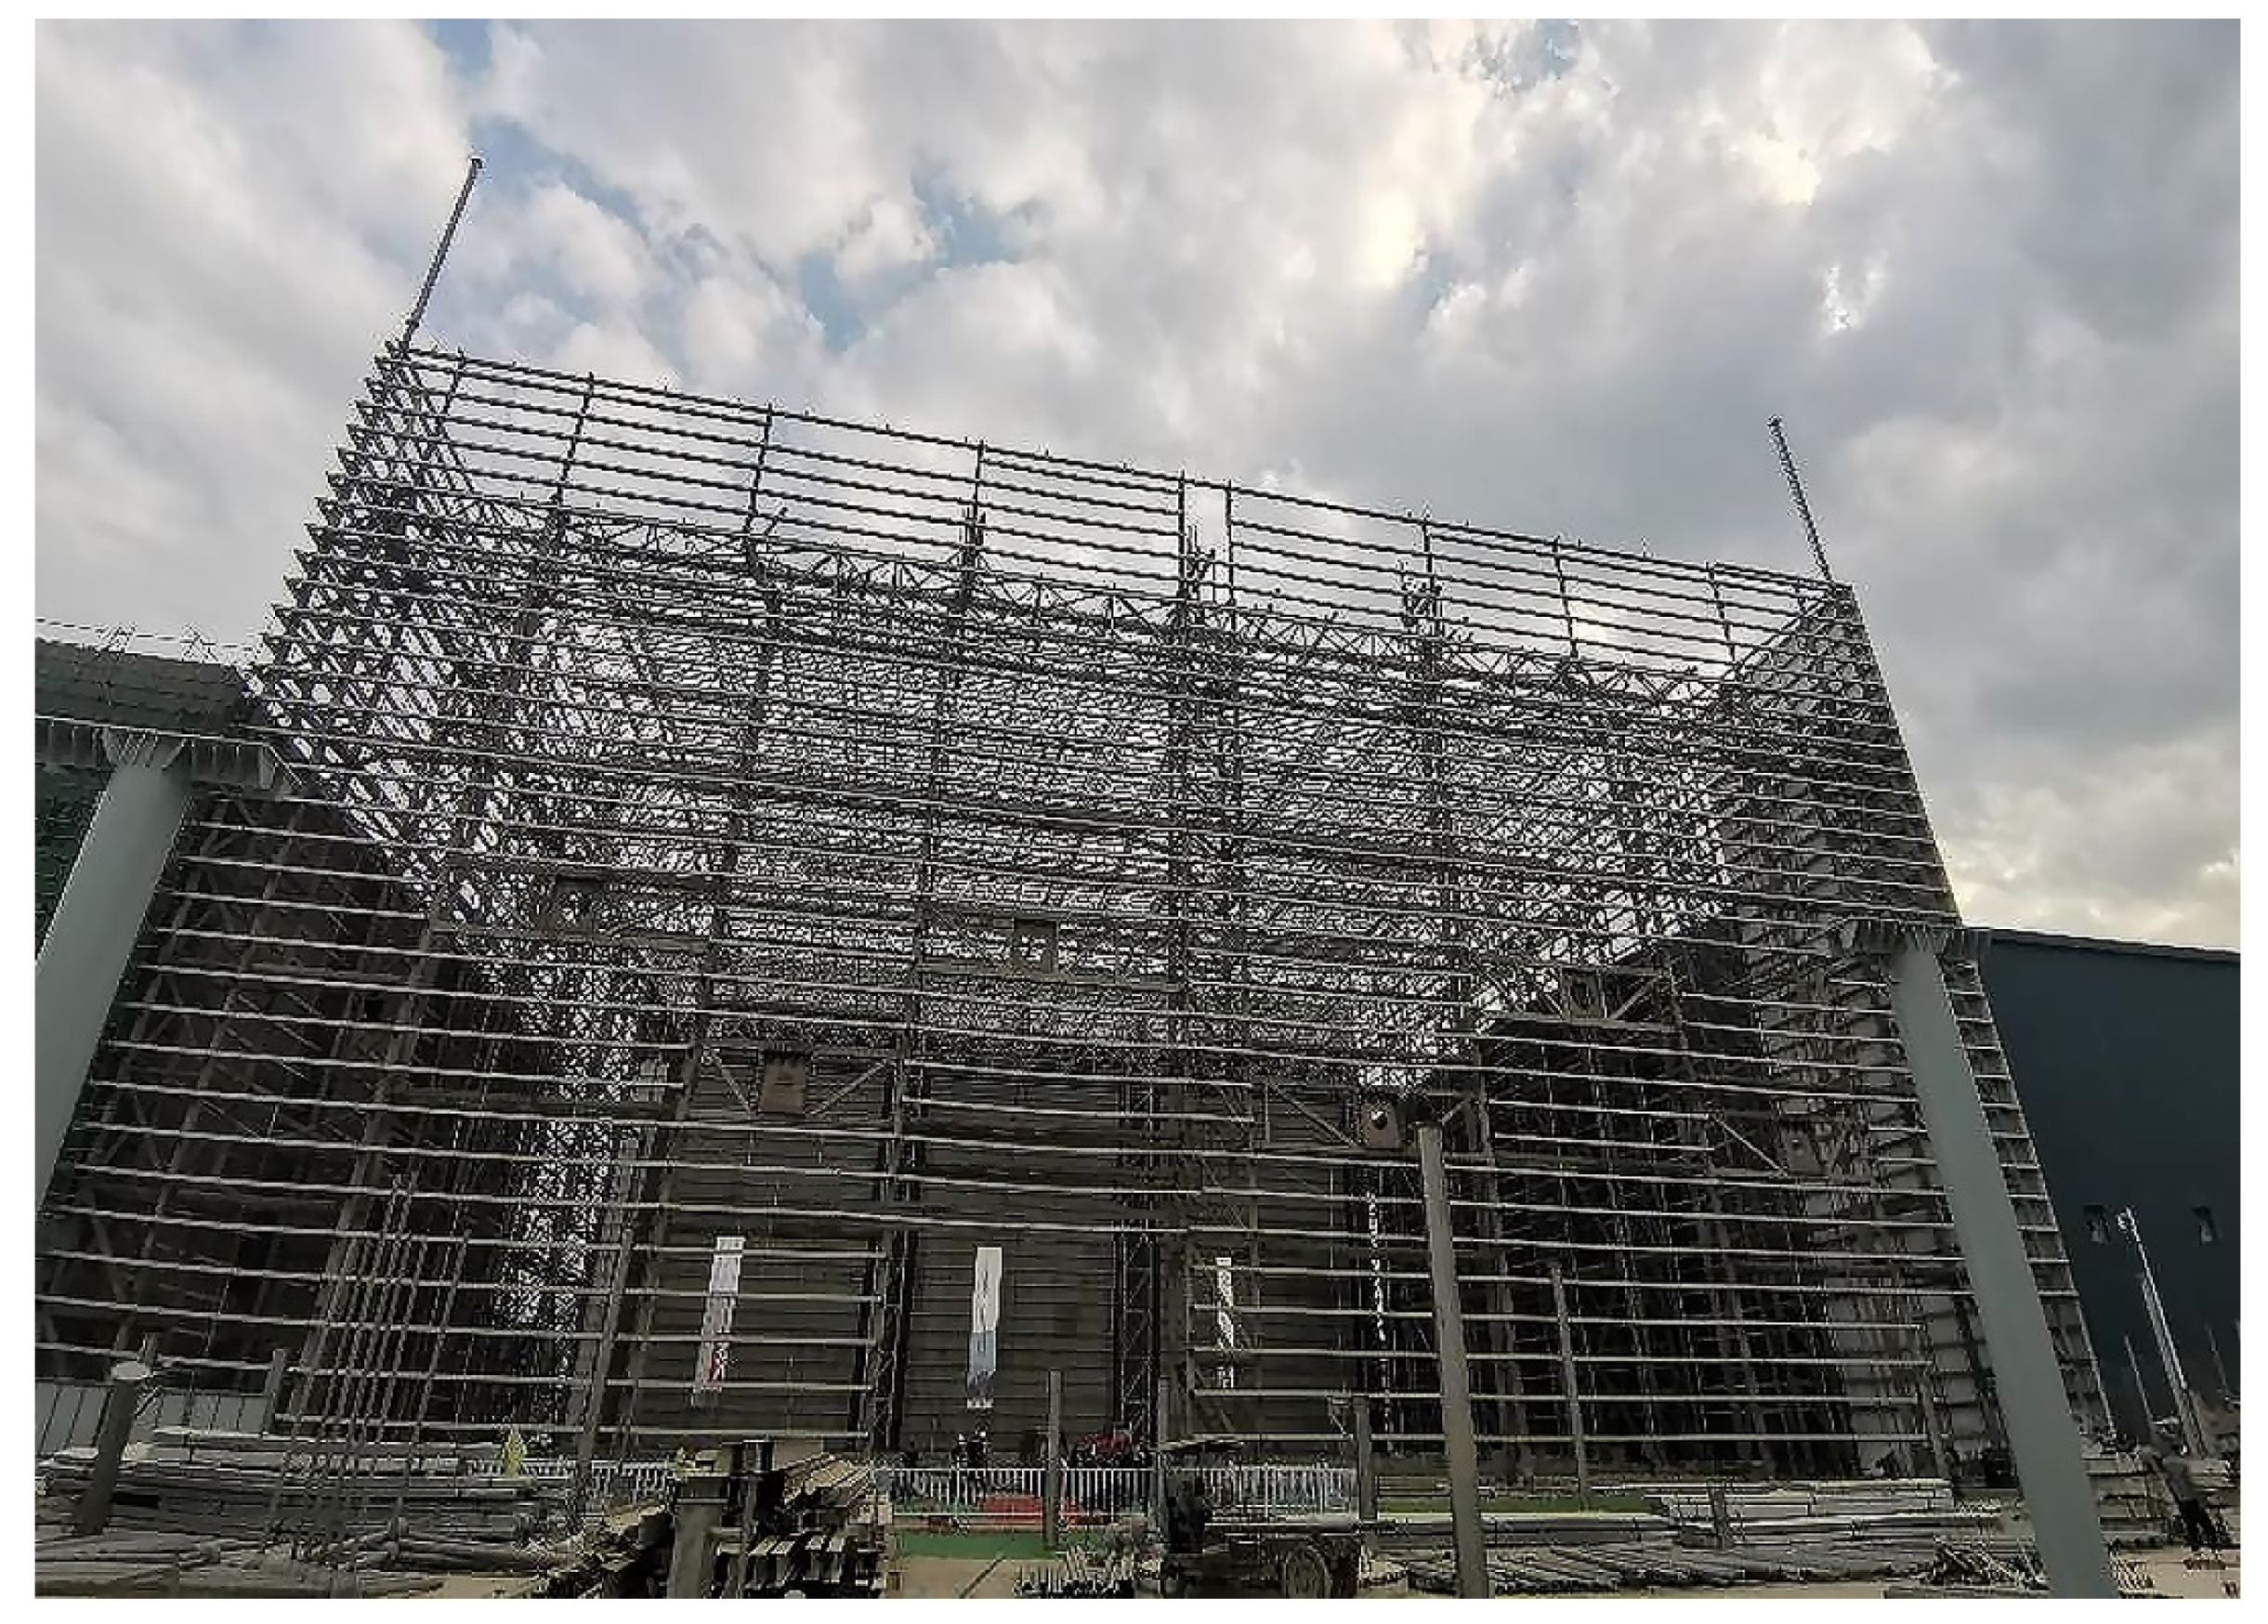
:1. Introduction
2. Materials and Methods
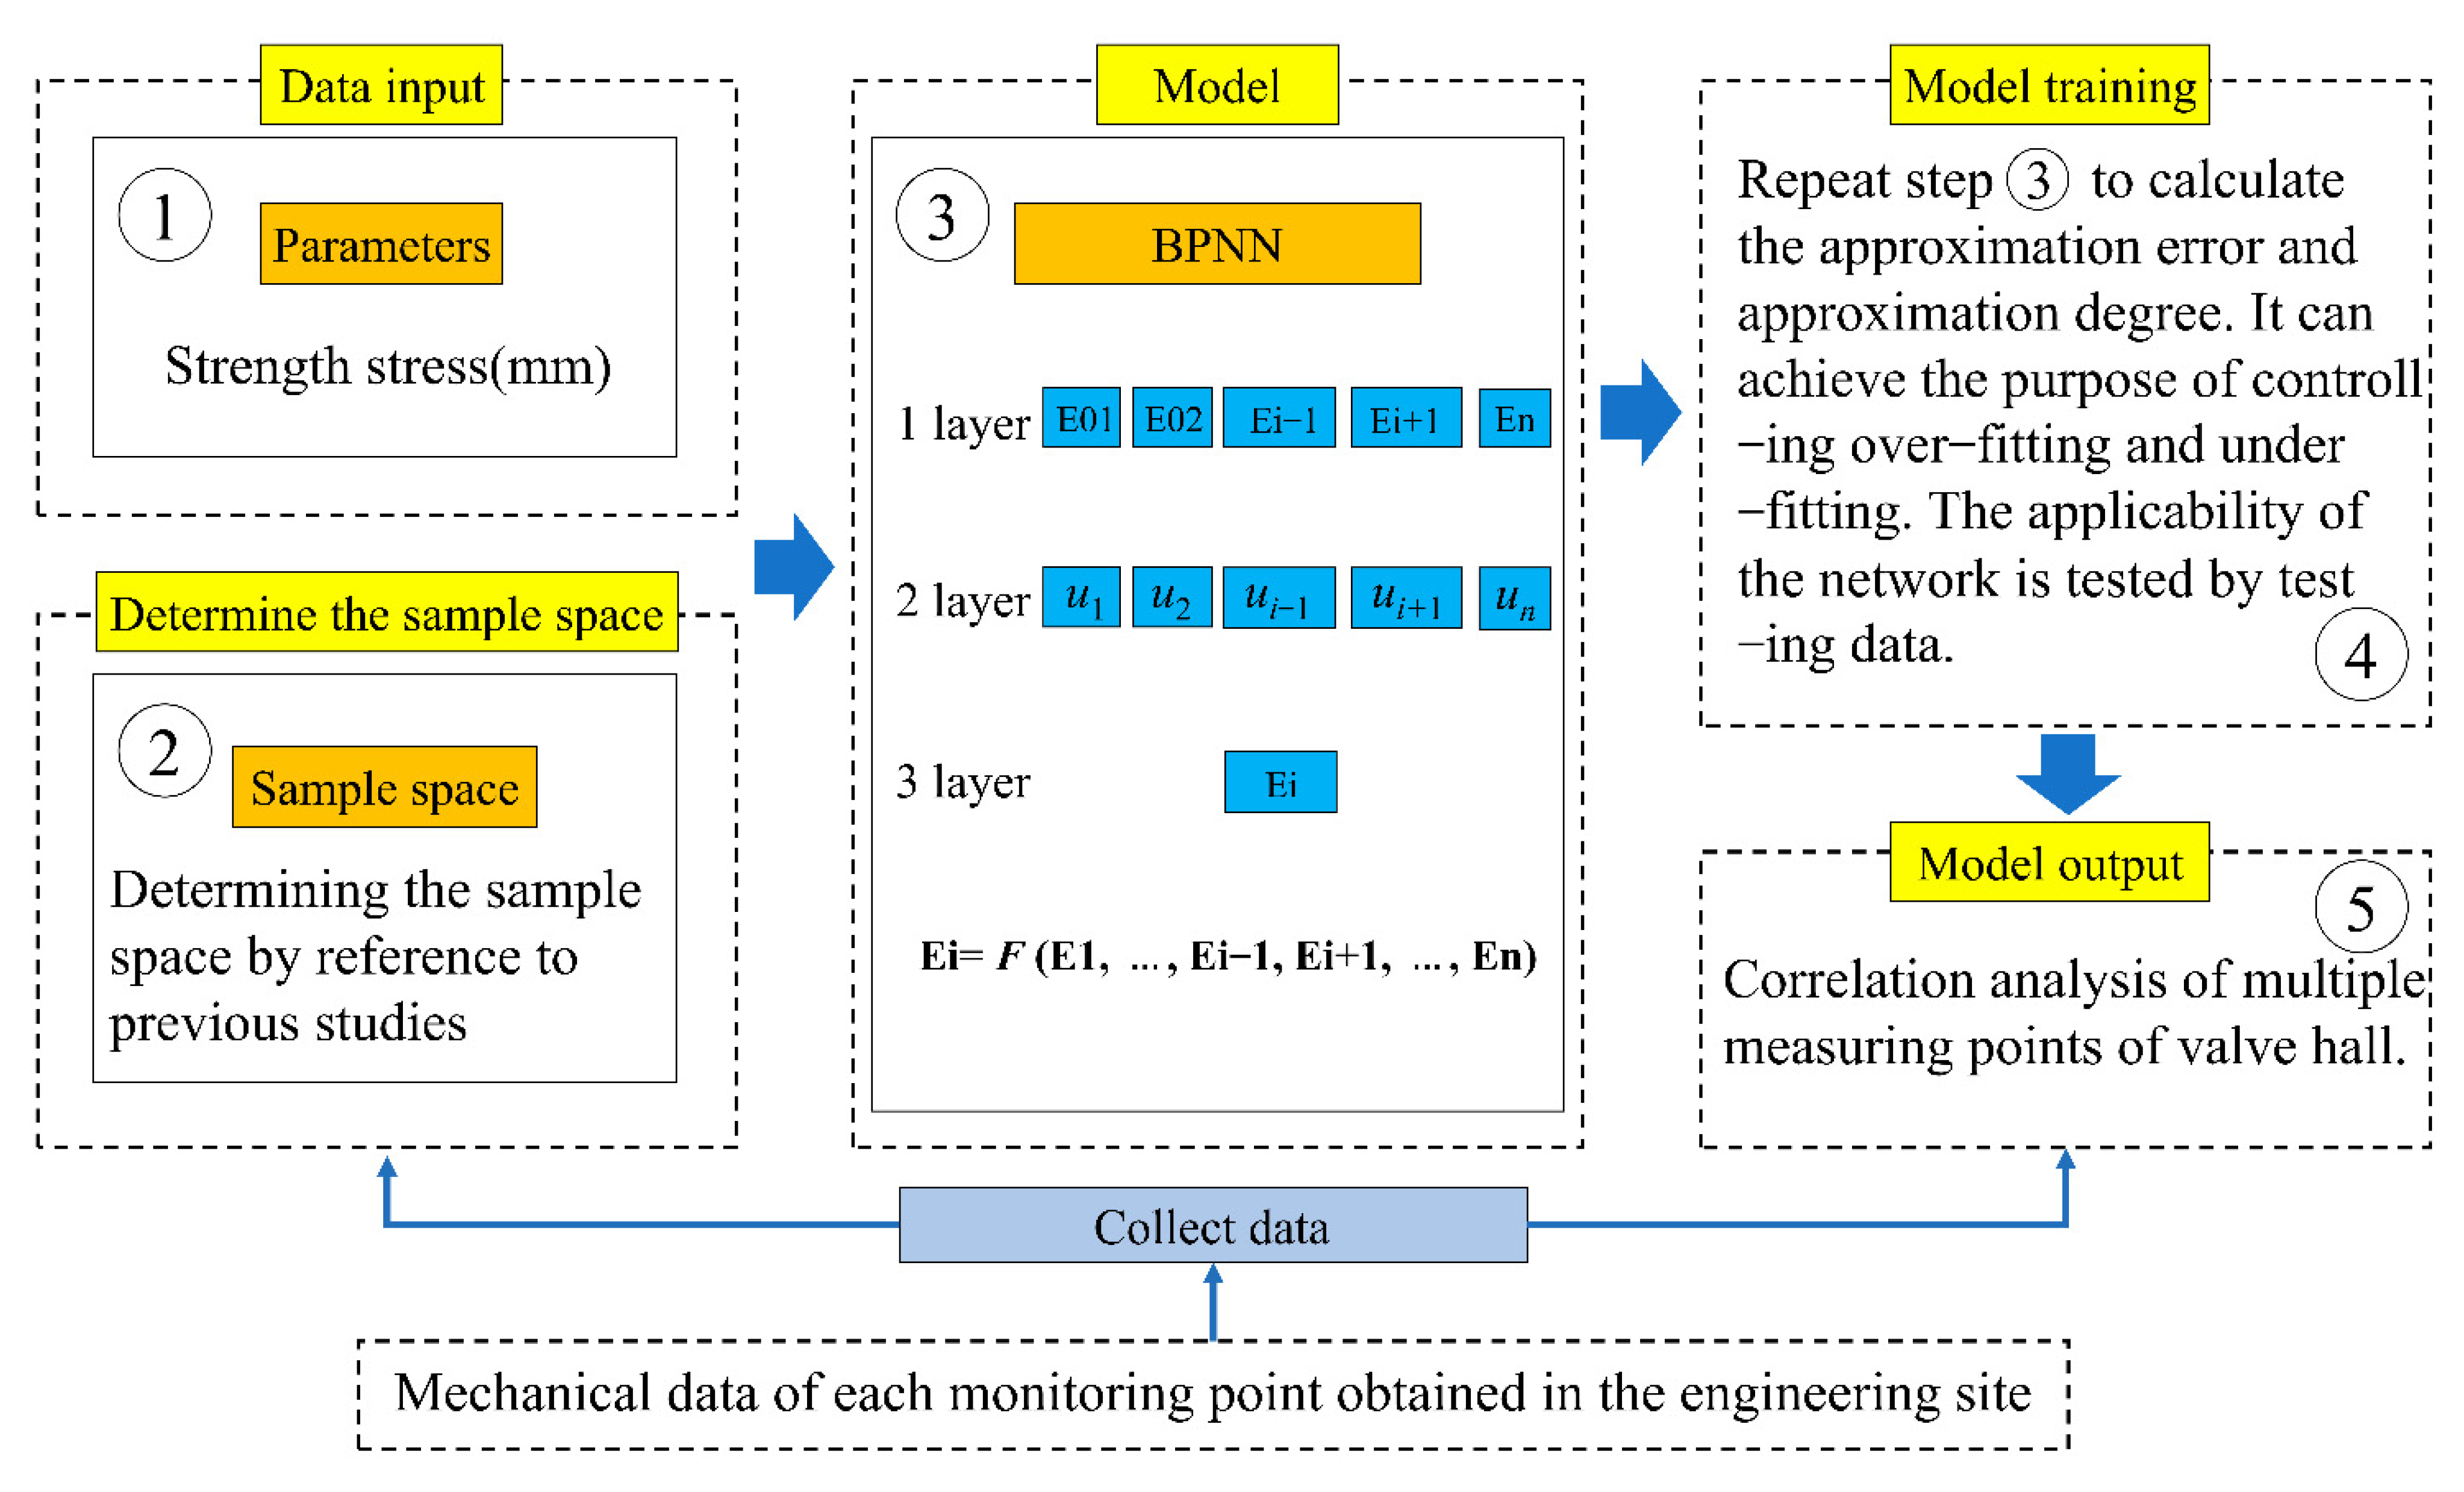
2.1. Intelligent Correlation Principle for Mechanical Properties of Multiple Measuring Points
2.2. Mechanical Property Correlation Model of Multiple Measuring Points
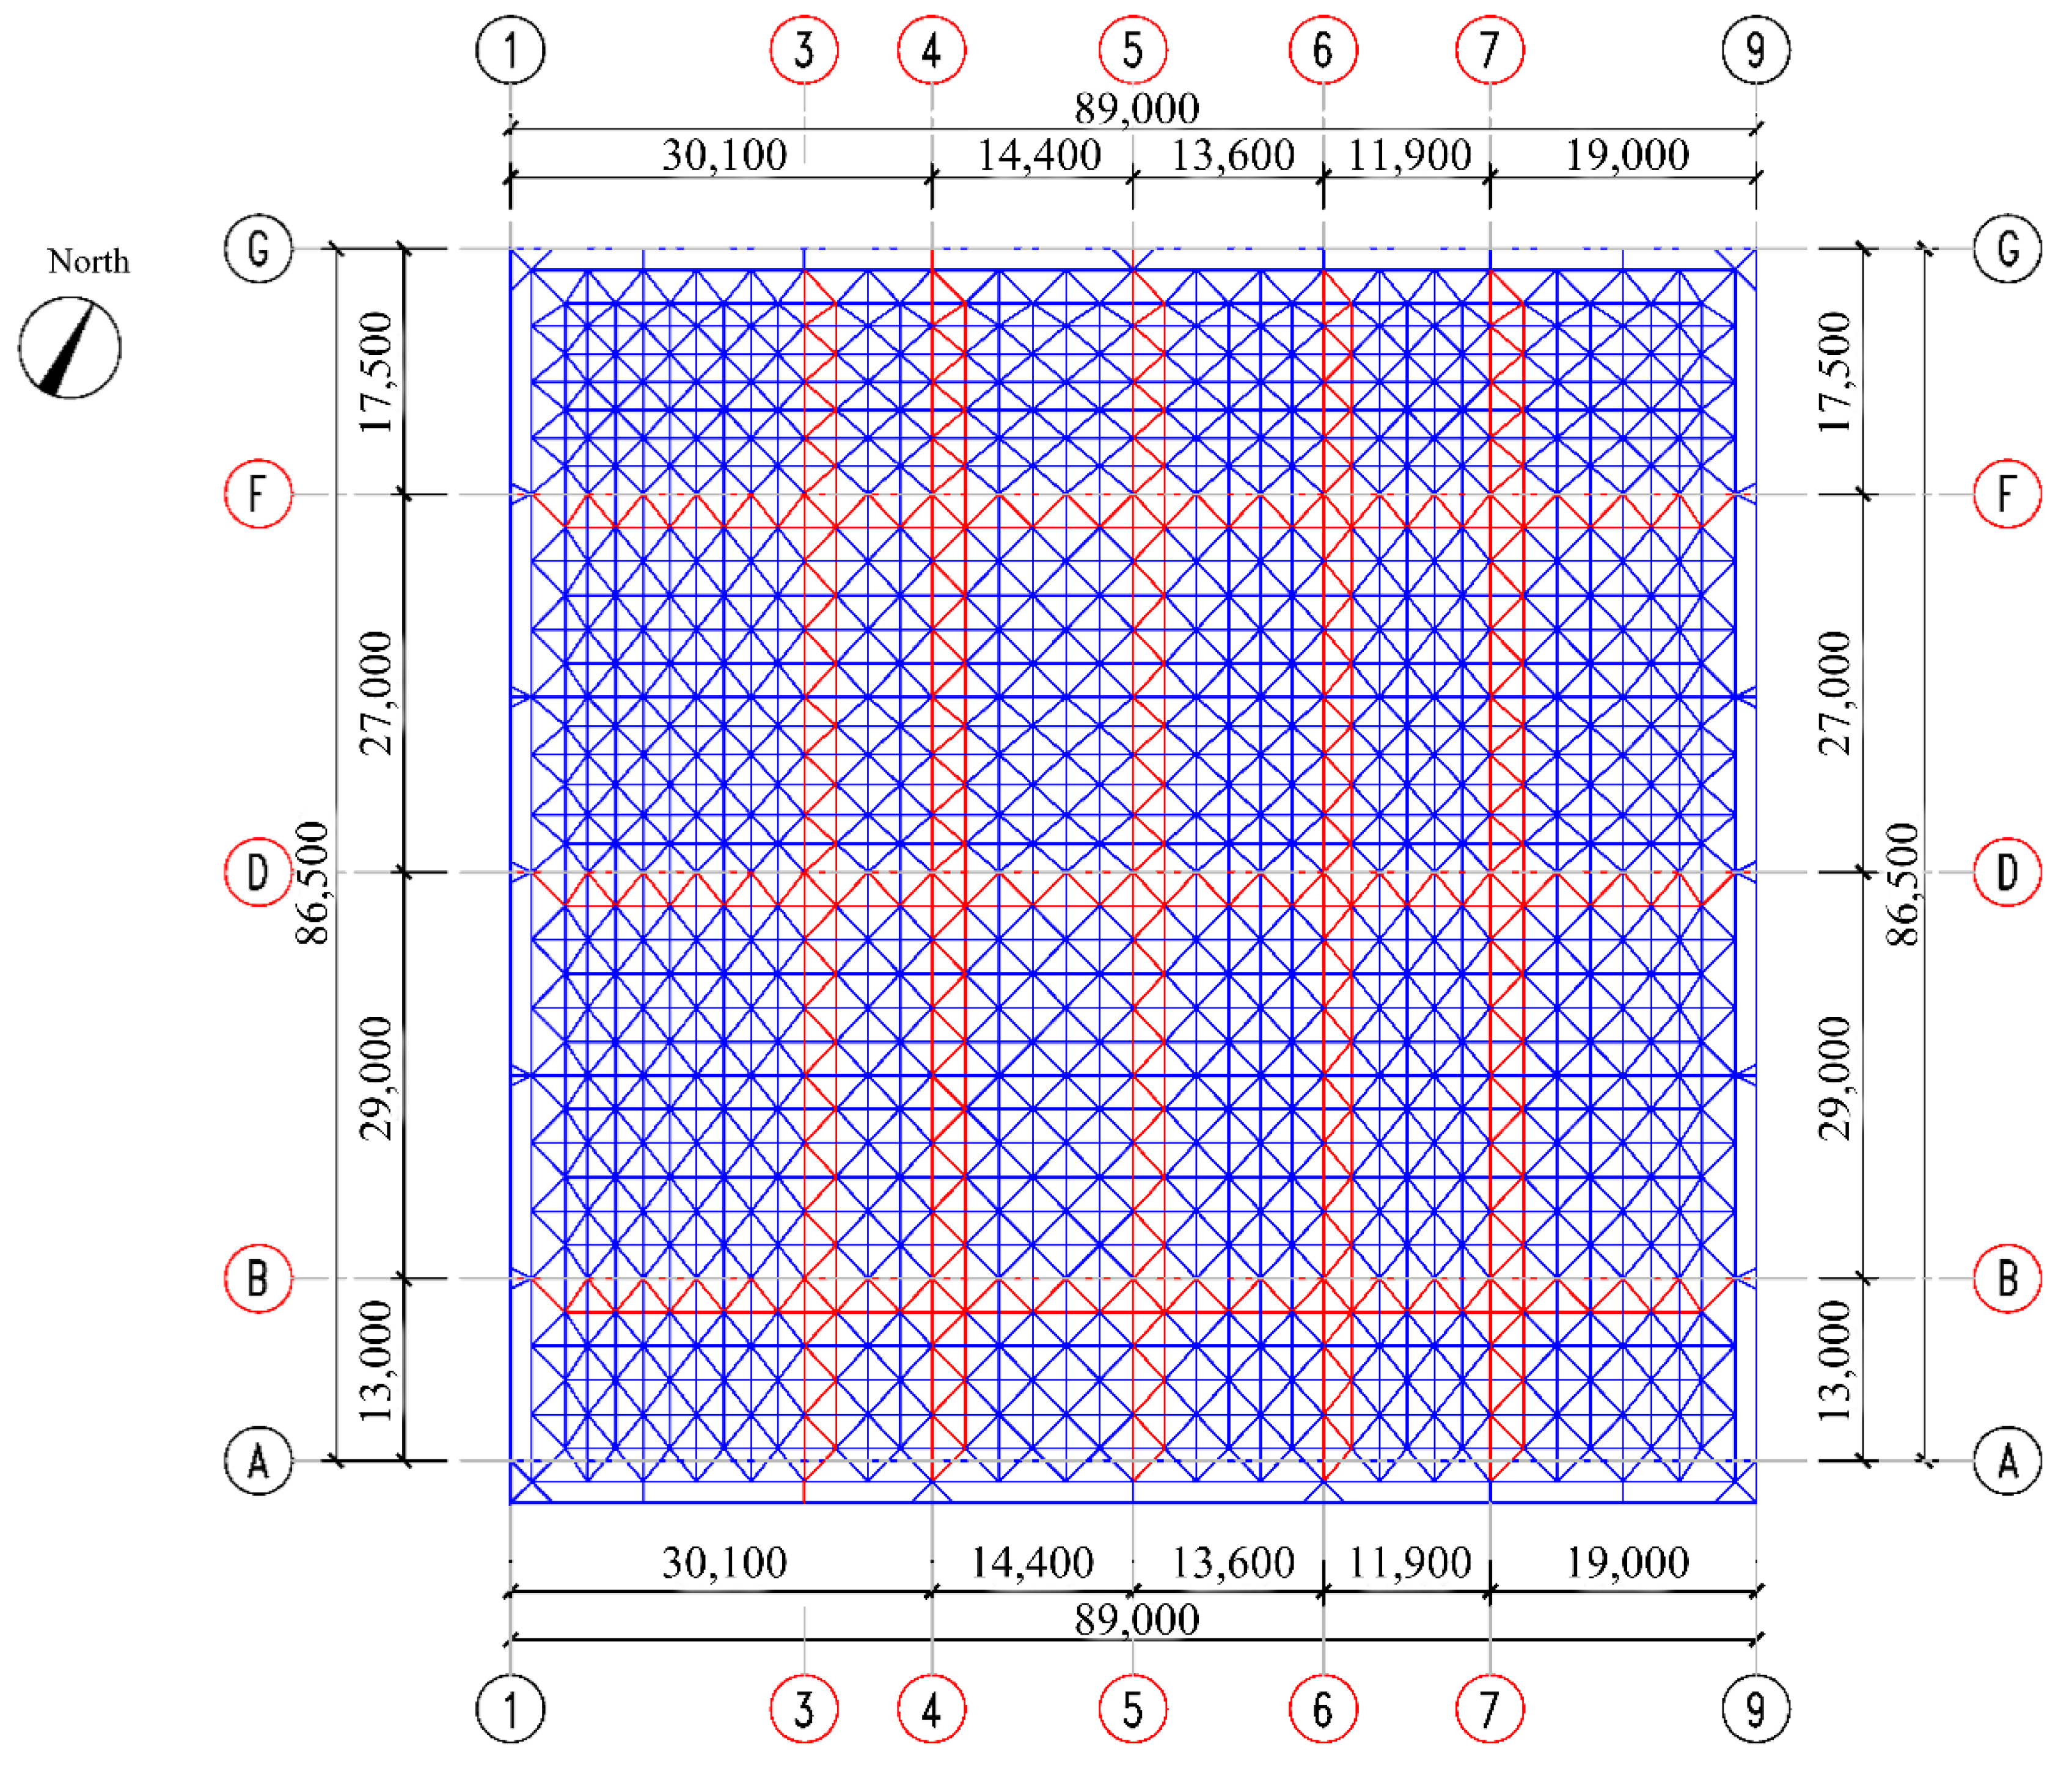
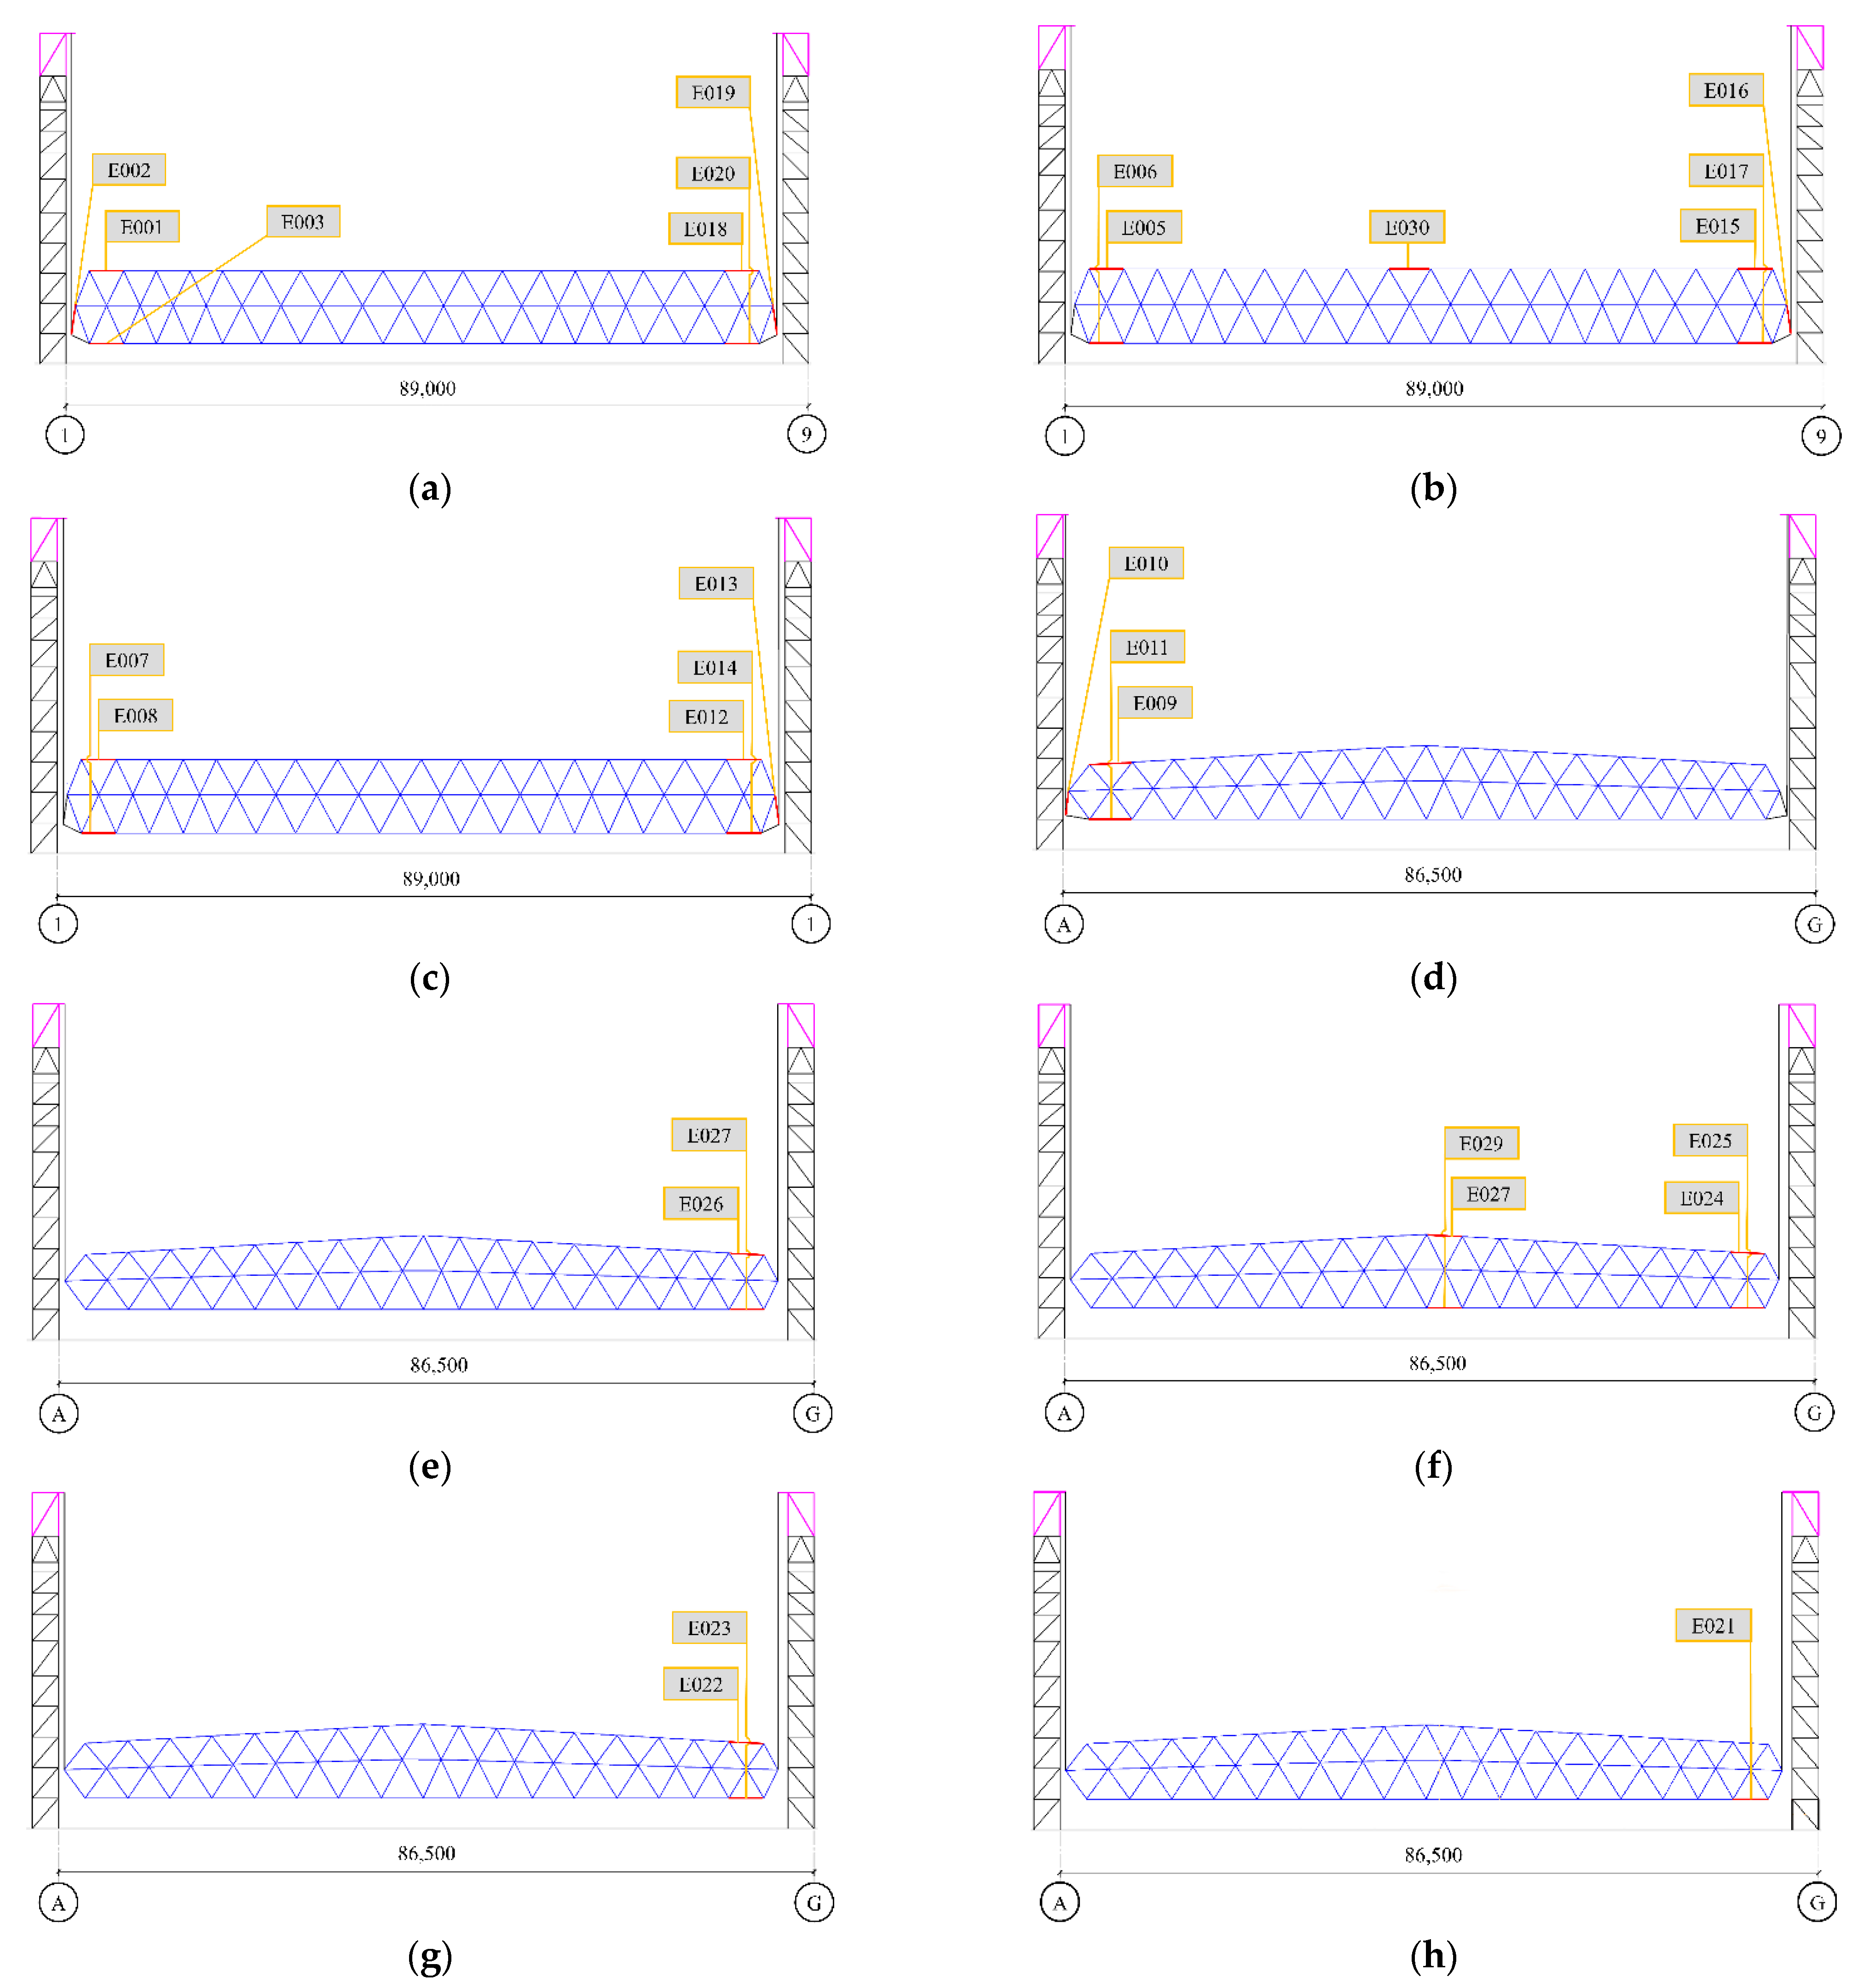
2.2.1. Determination of Sample Space of the Model
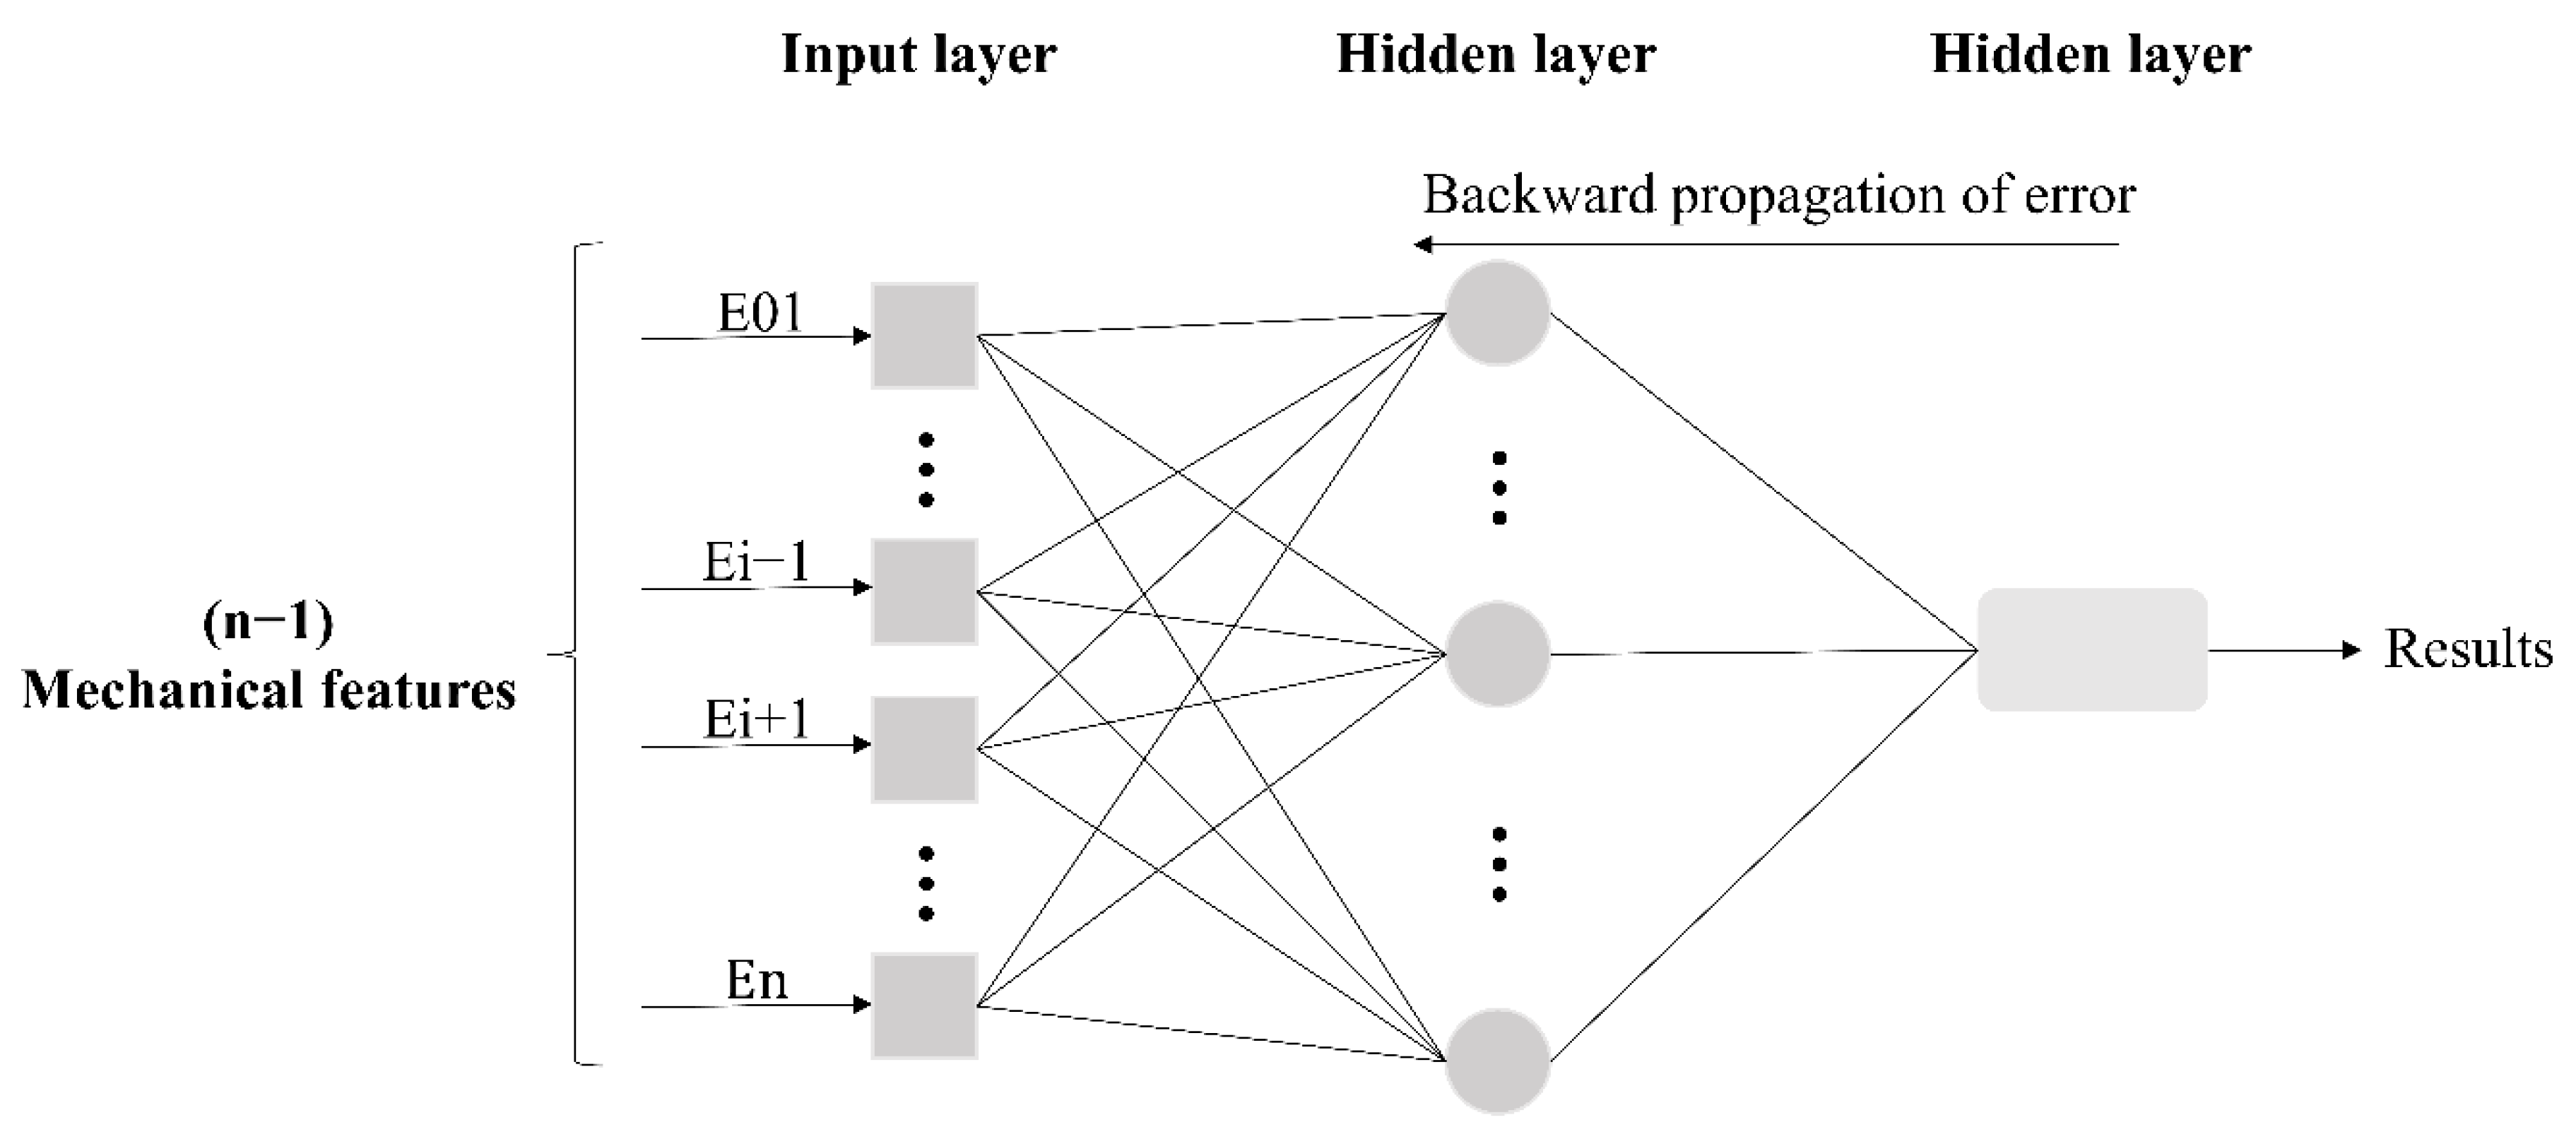
2.2.2. BPNN Construction
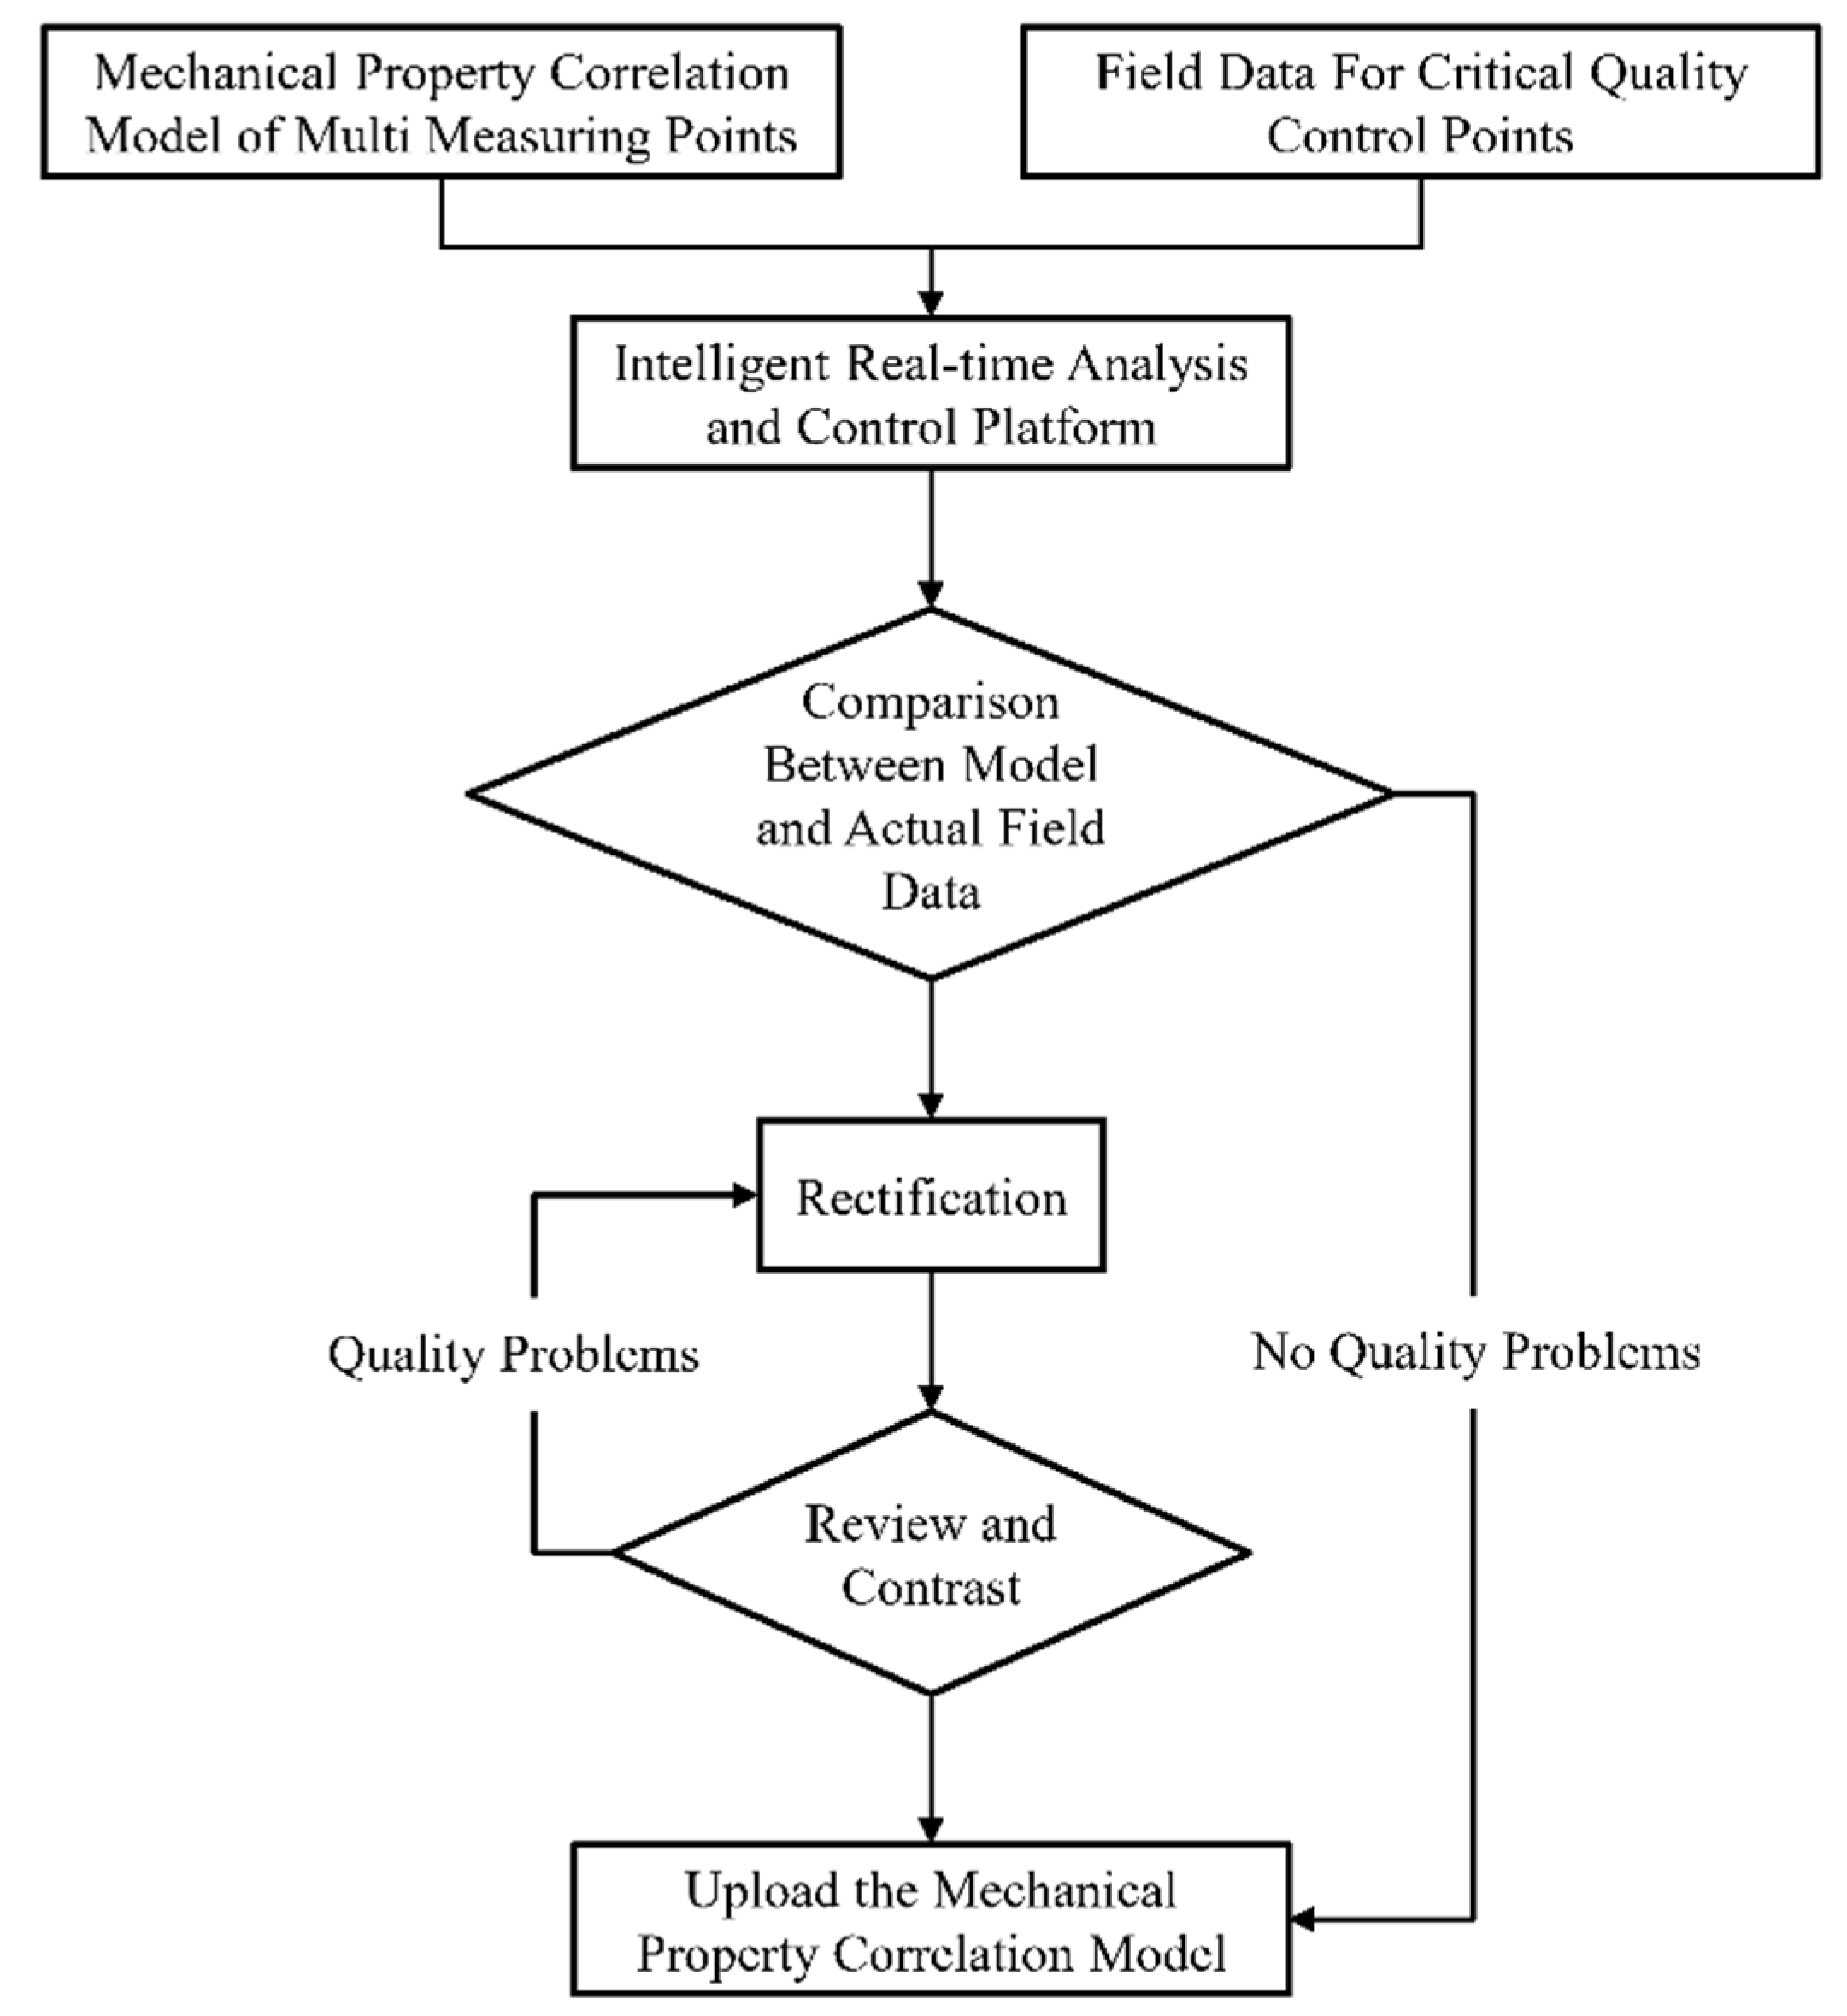
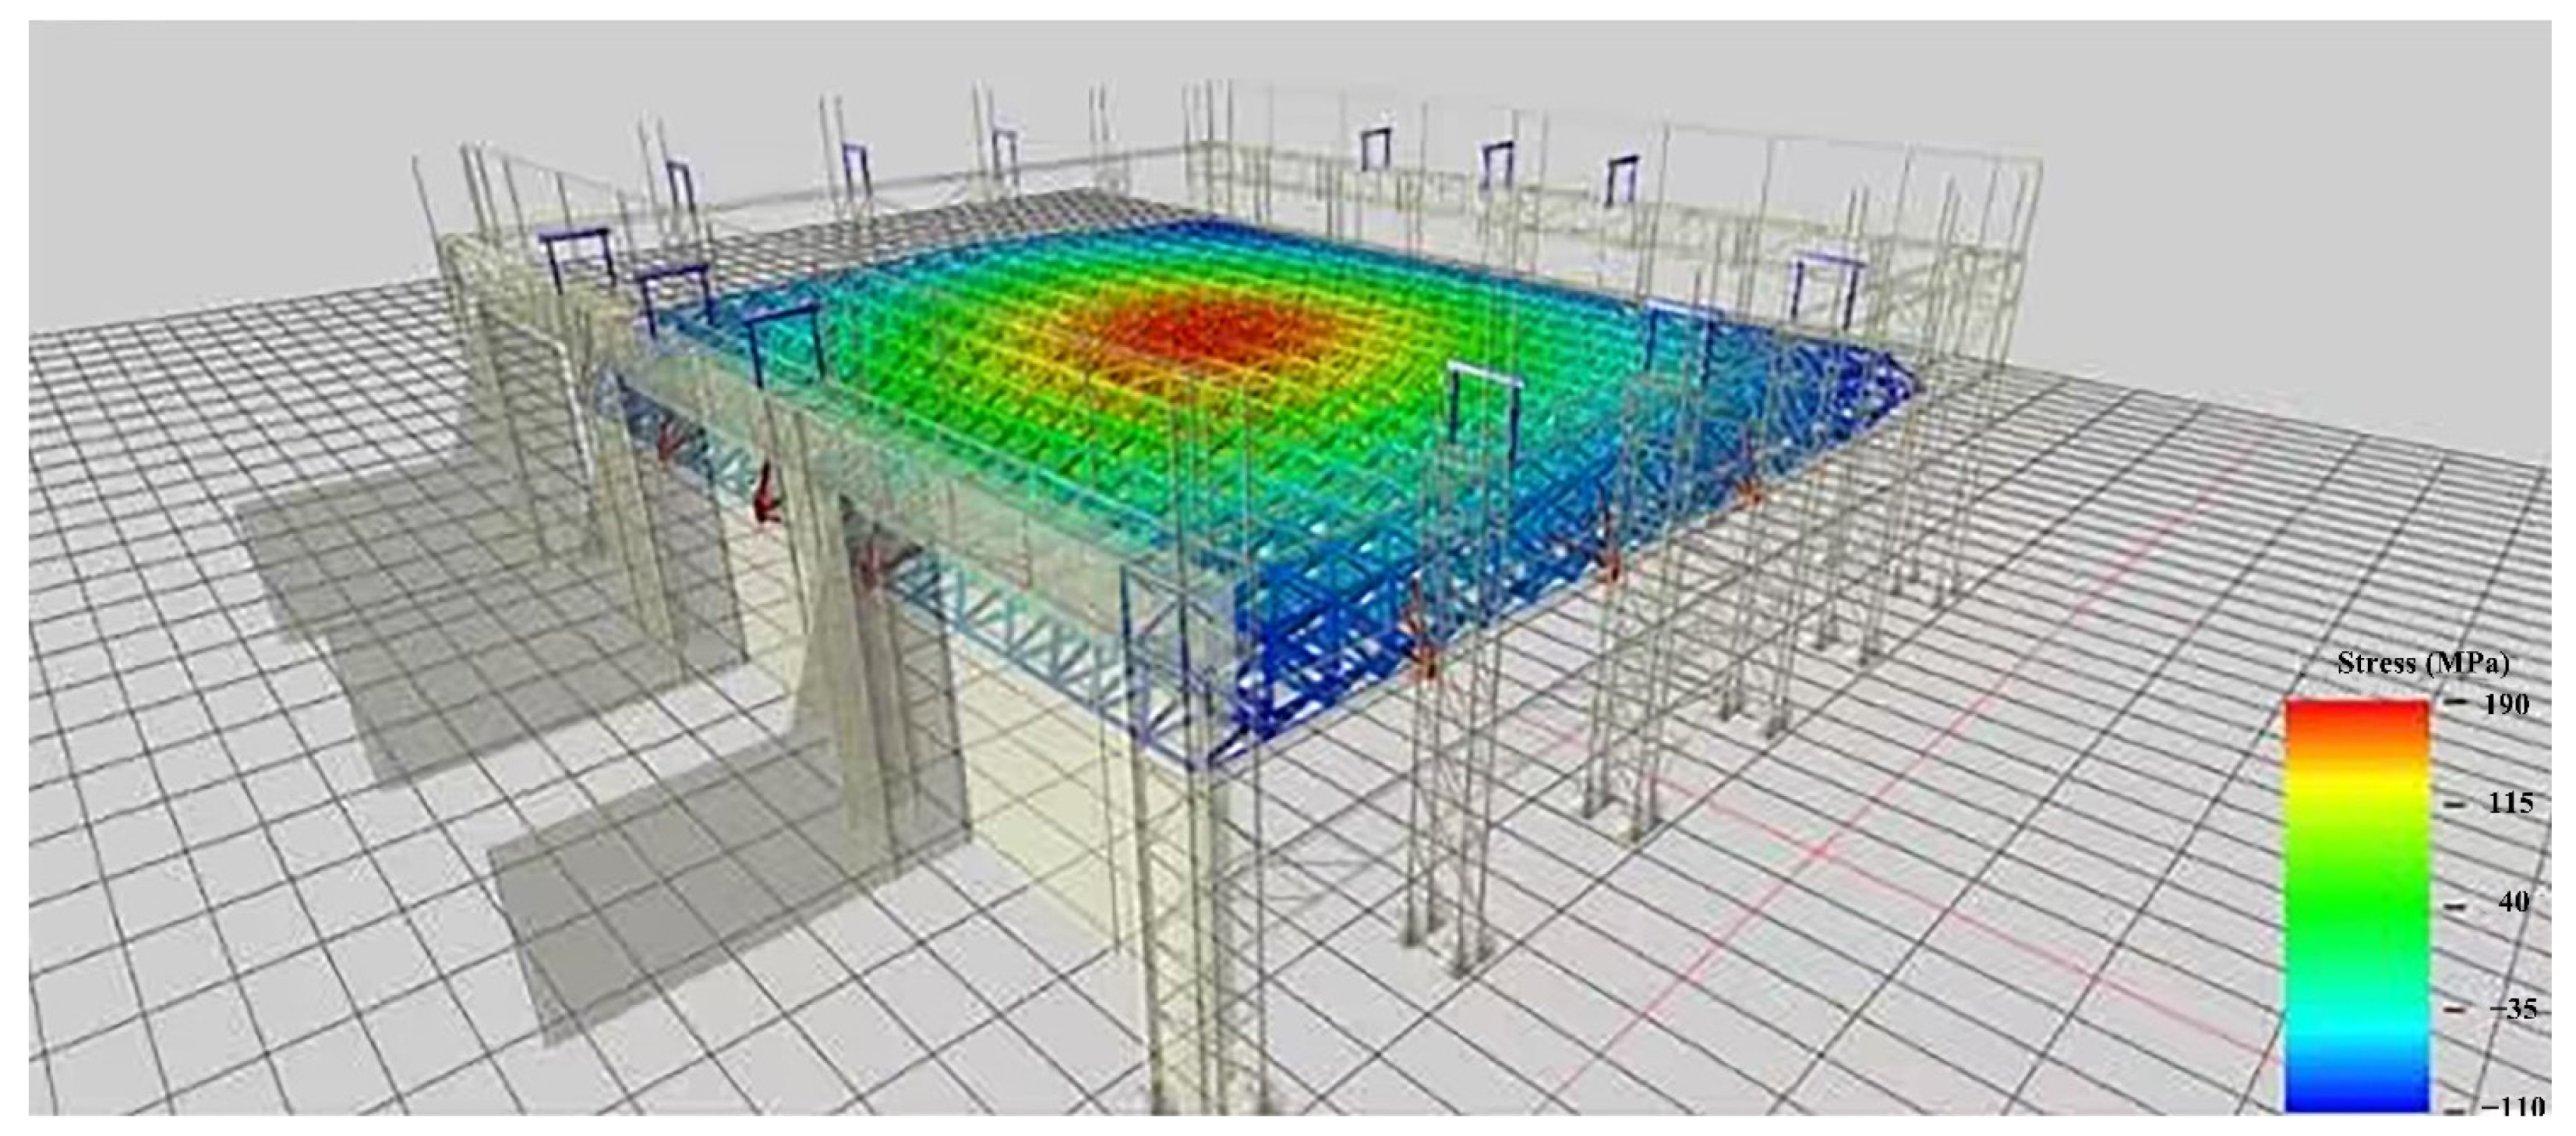
2.3. An Intelligent Real-Time Analysis System for the Mechanical Properties of Grid Members
3. Results and Discussion
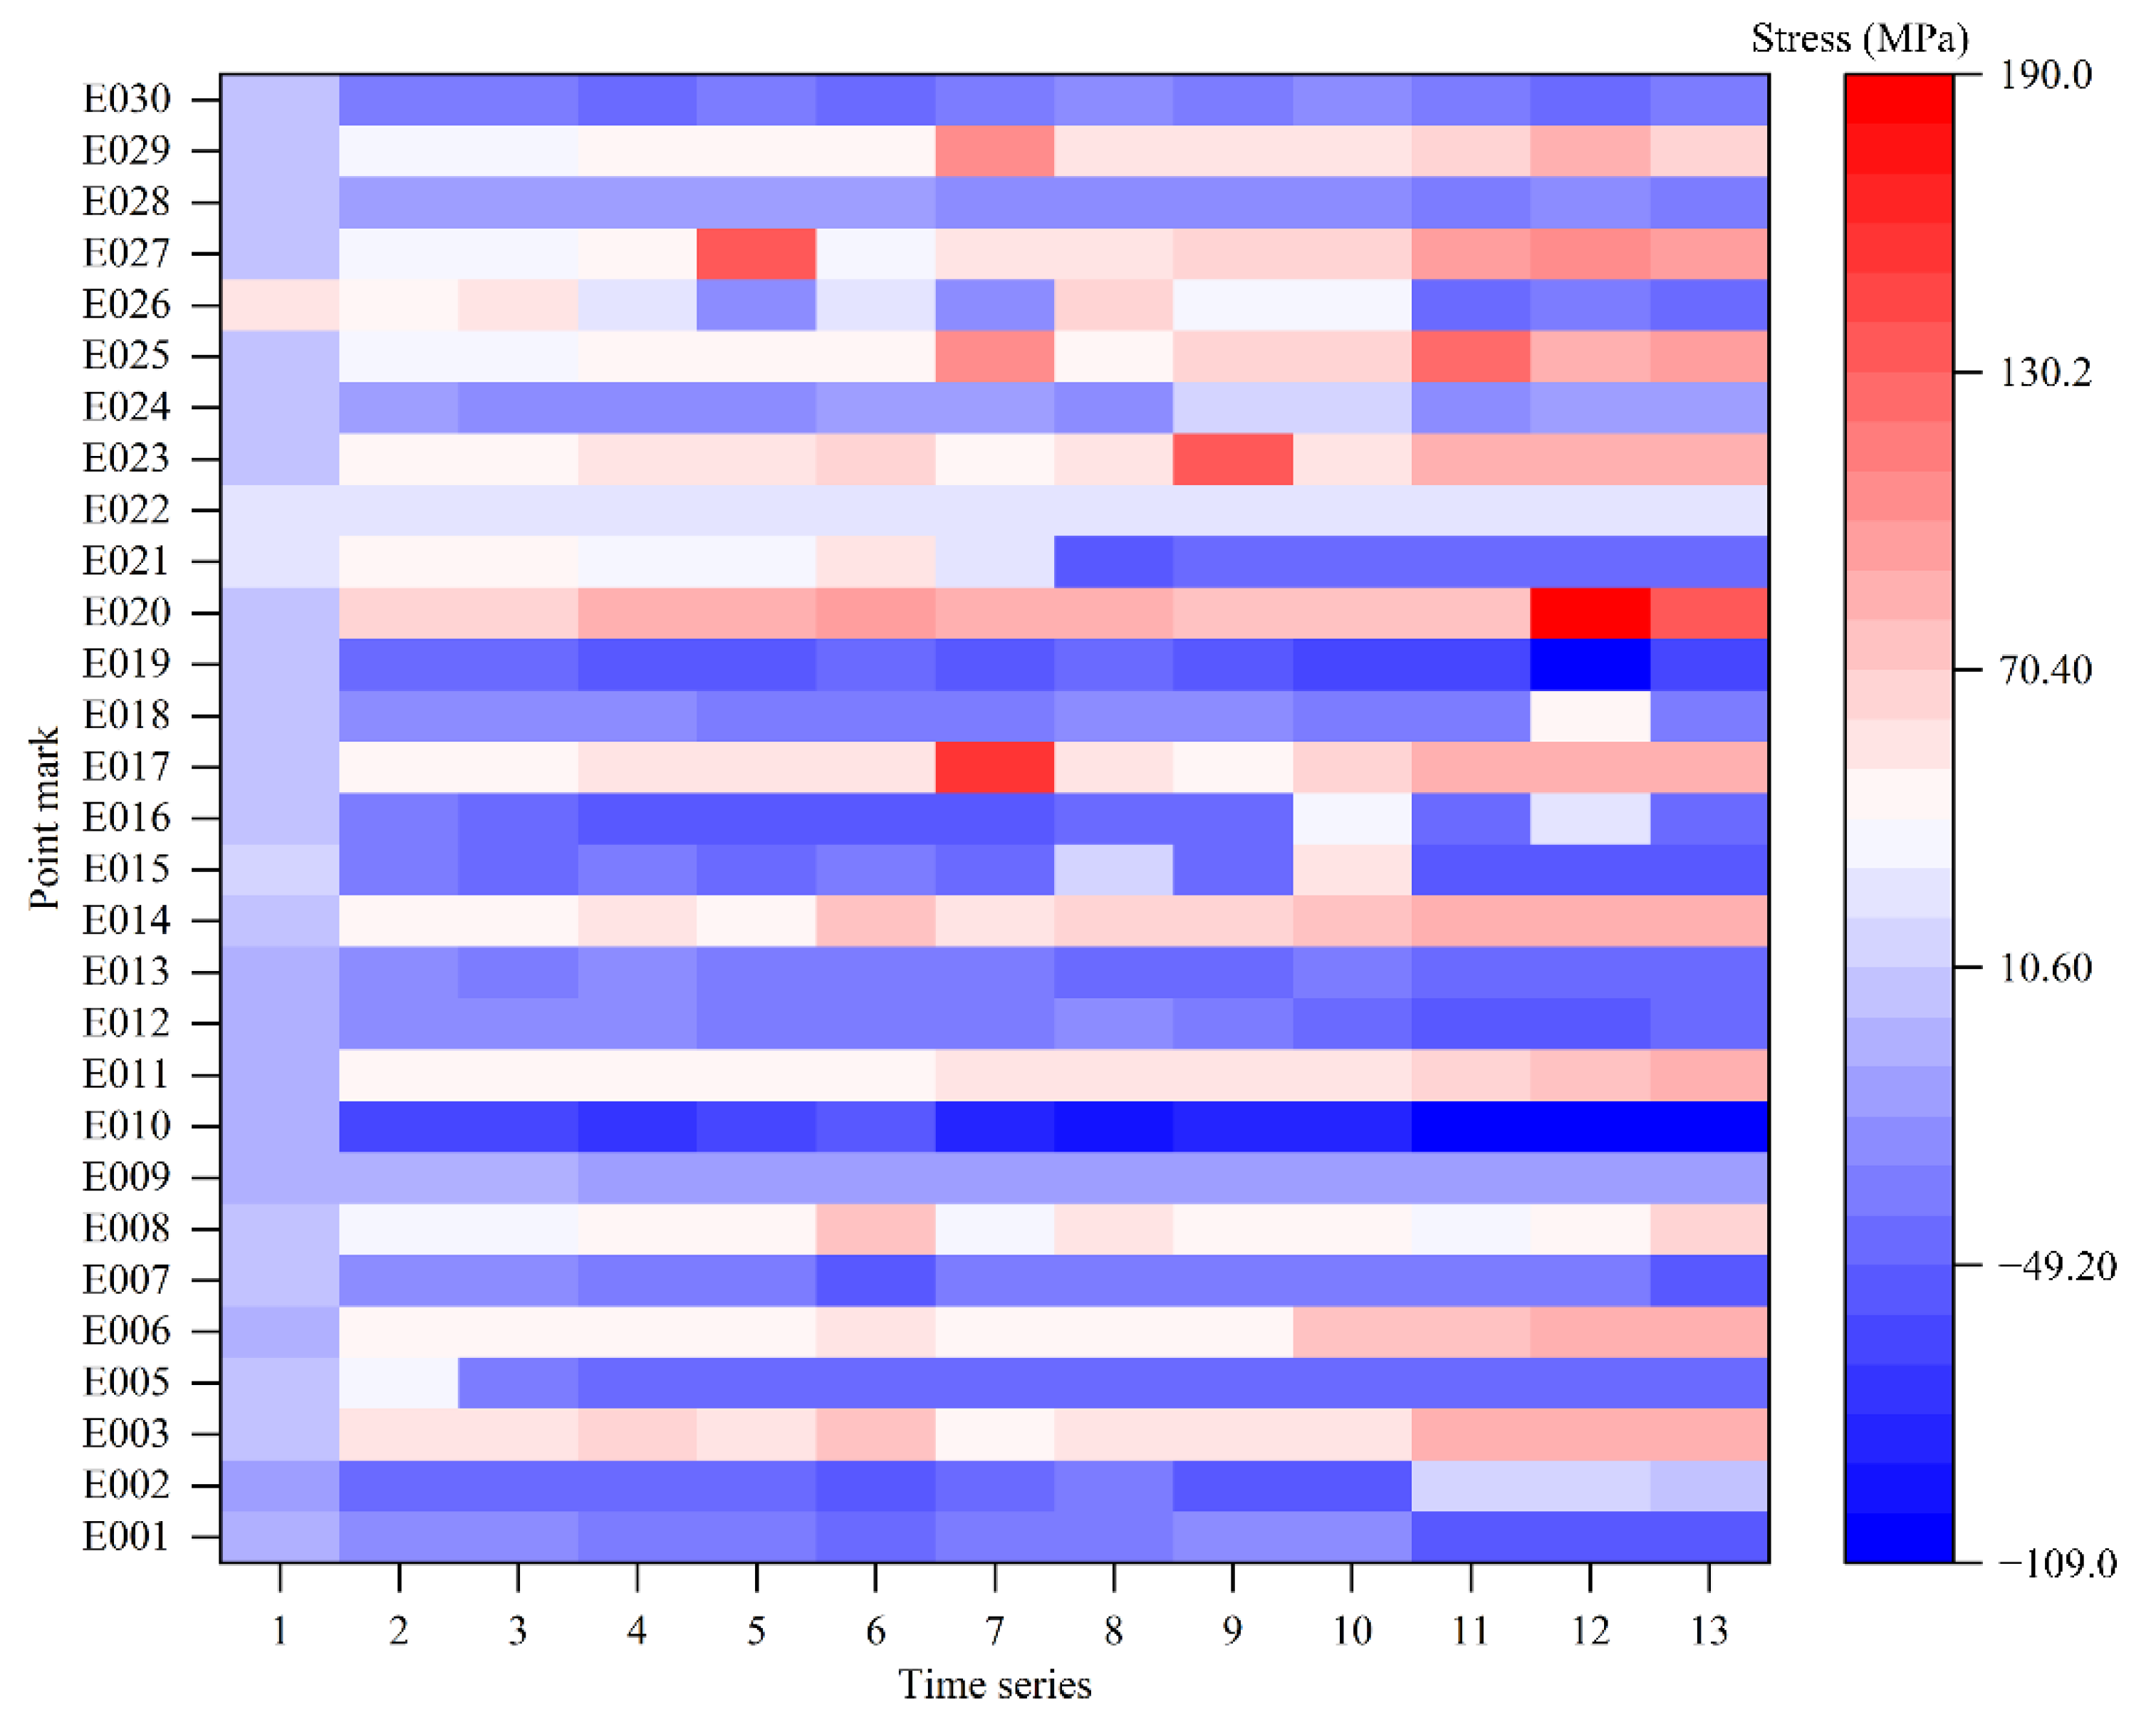
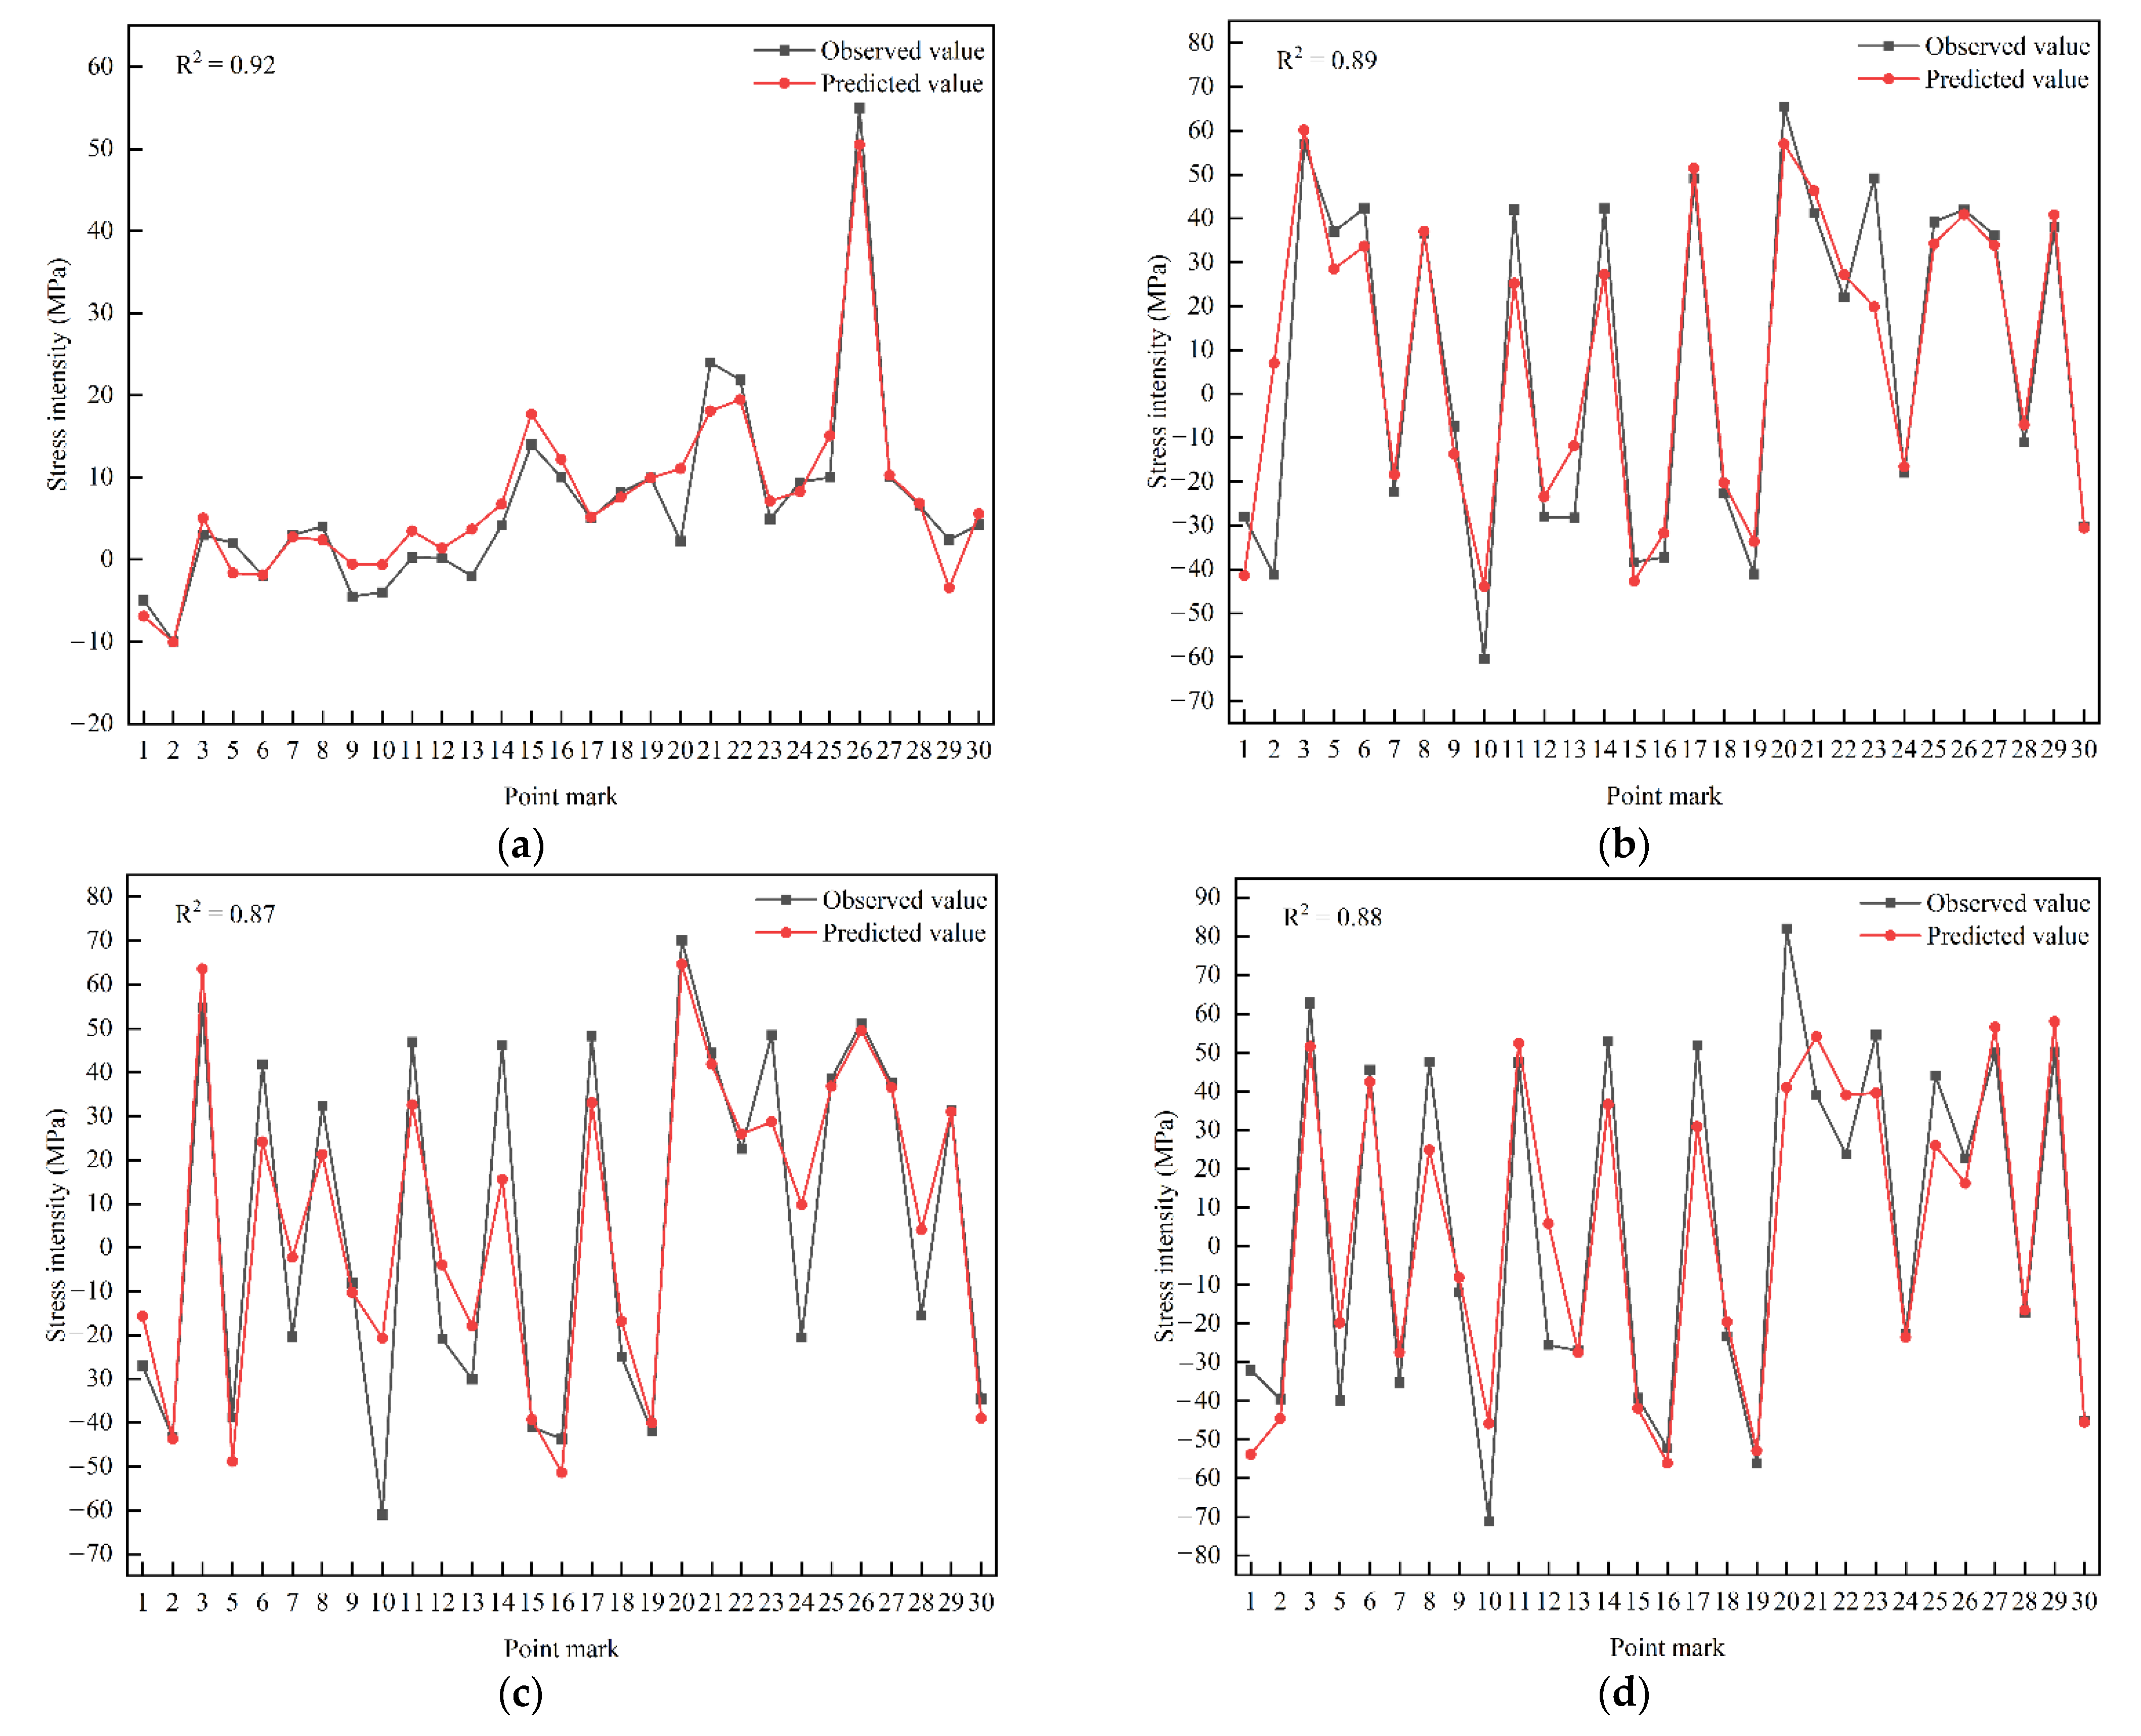
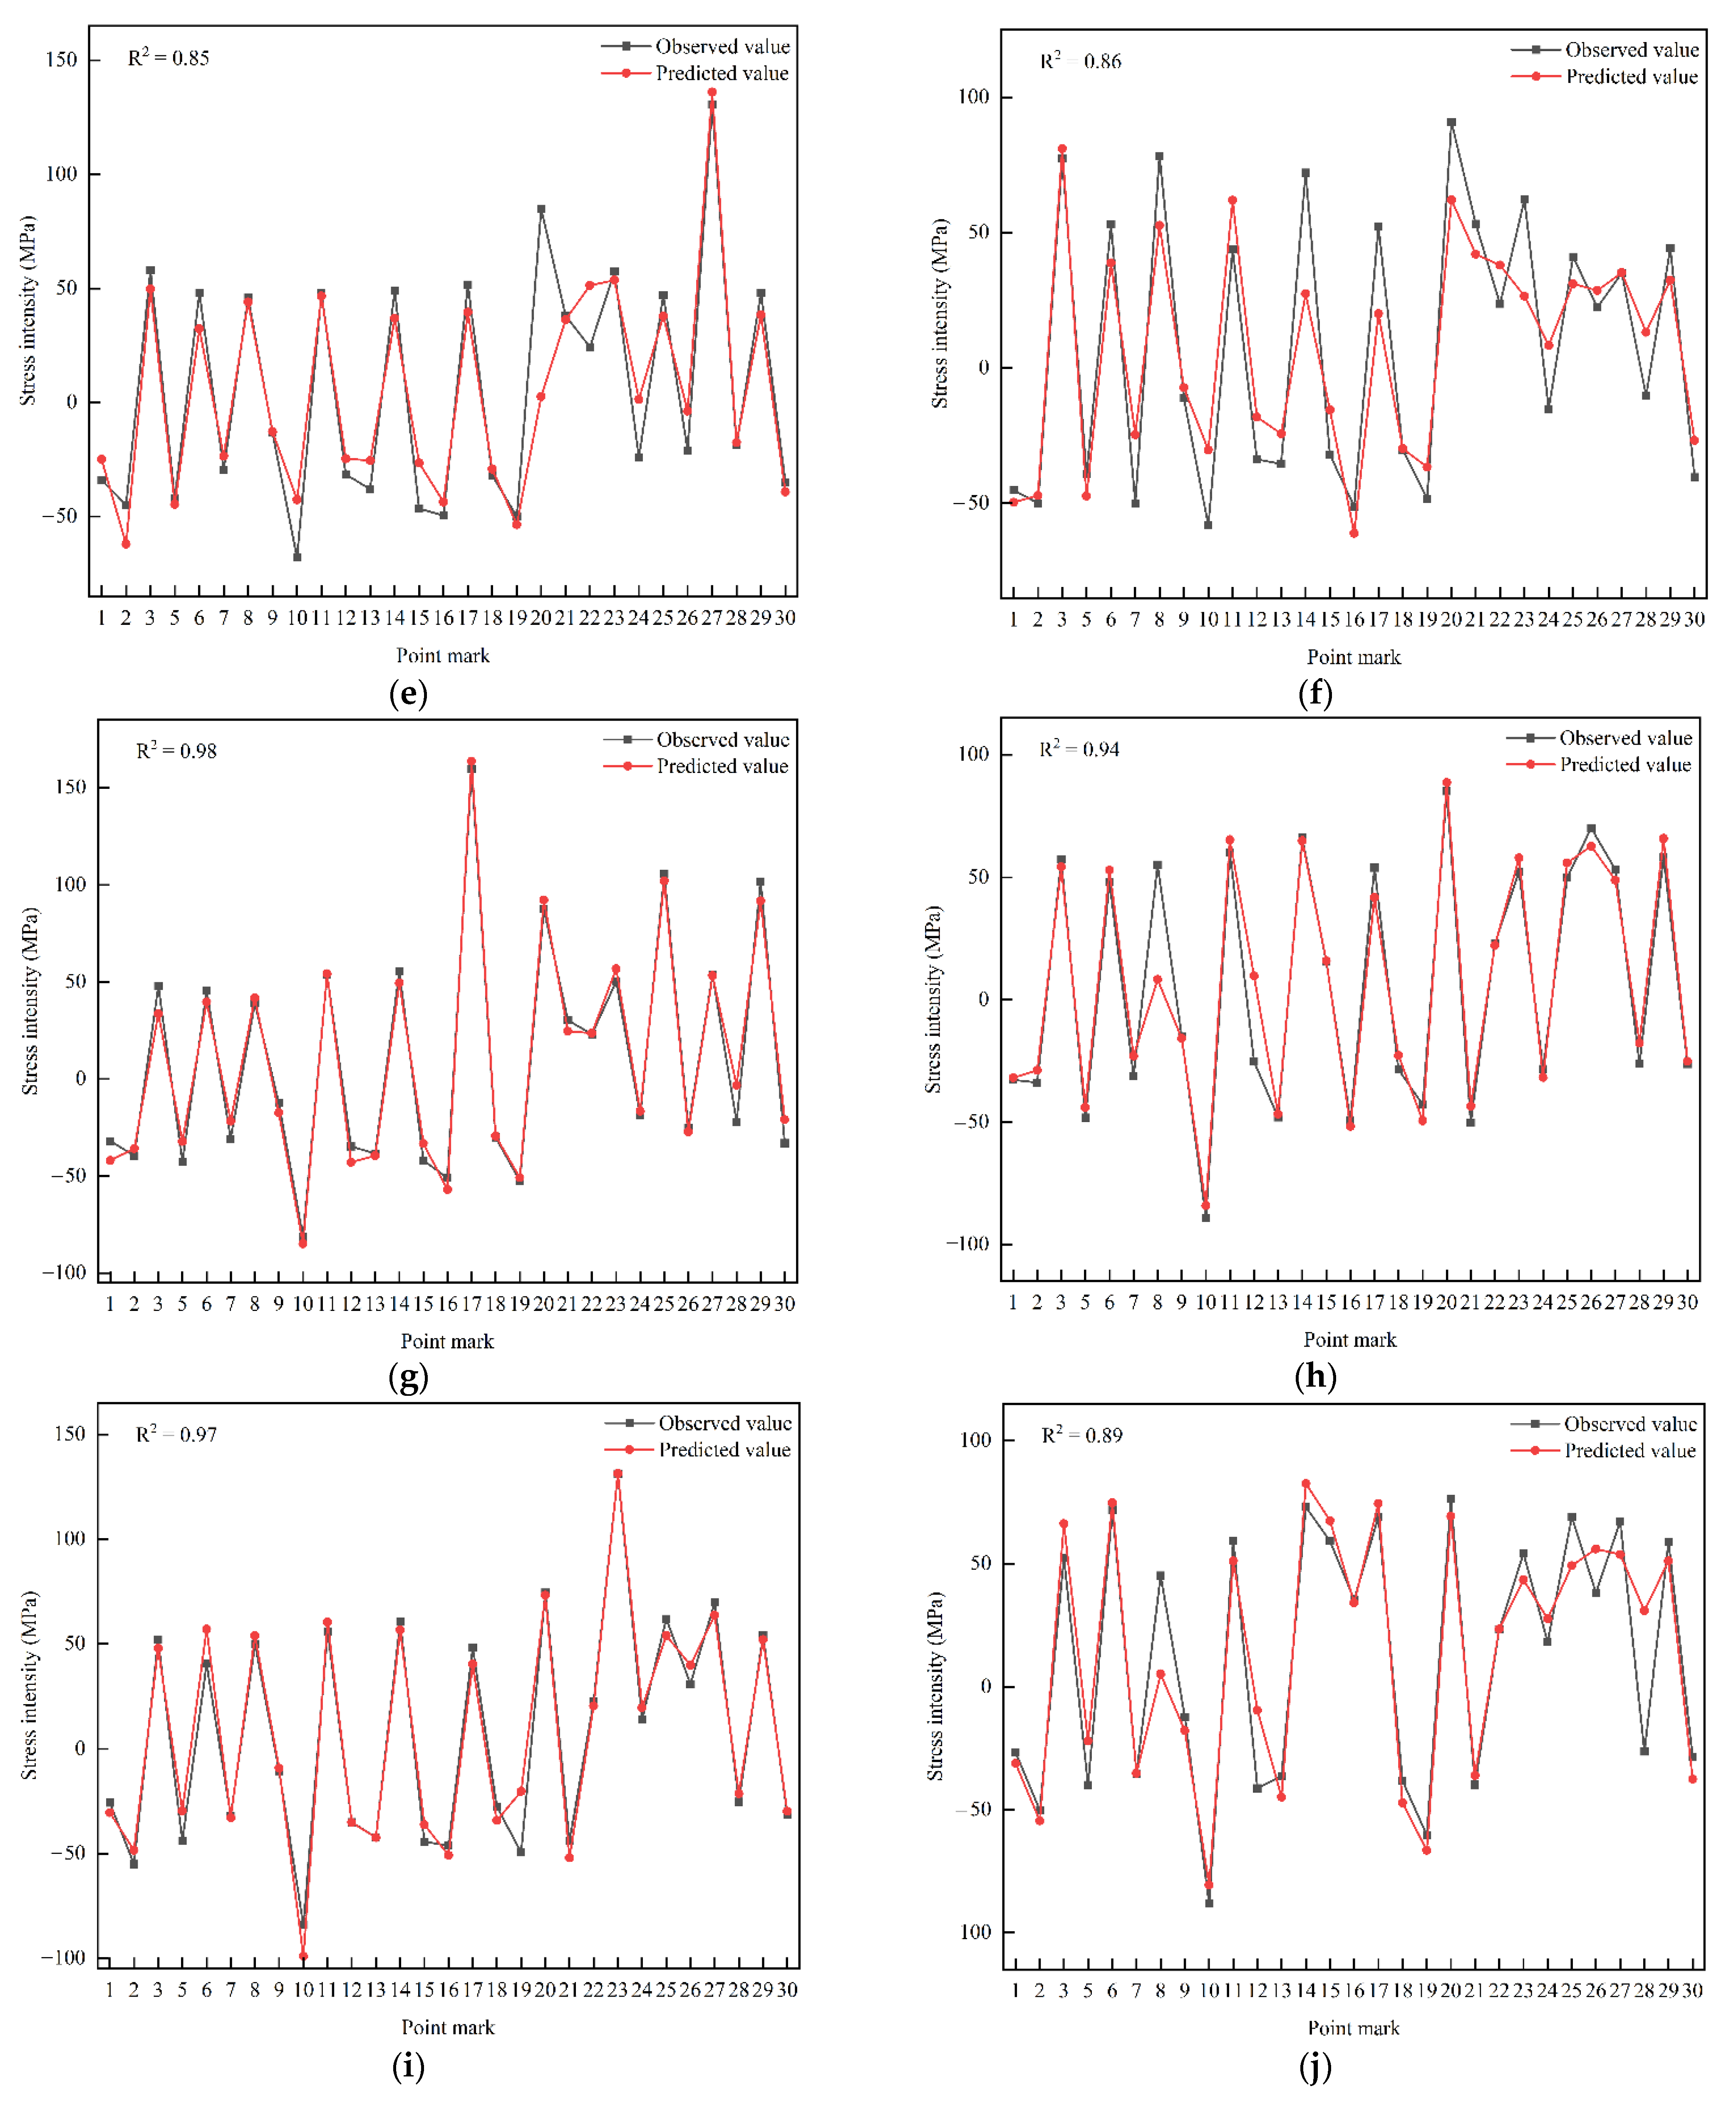
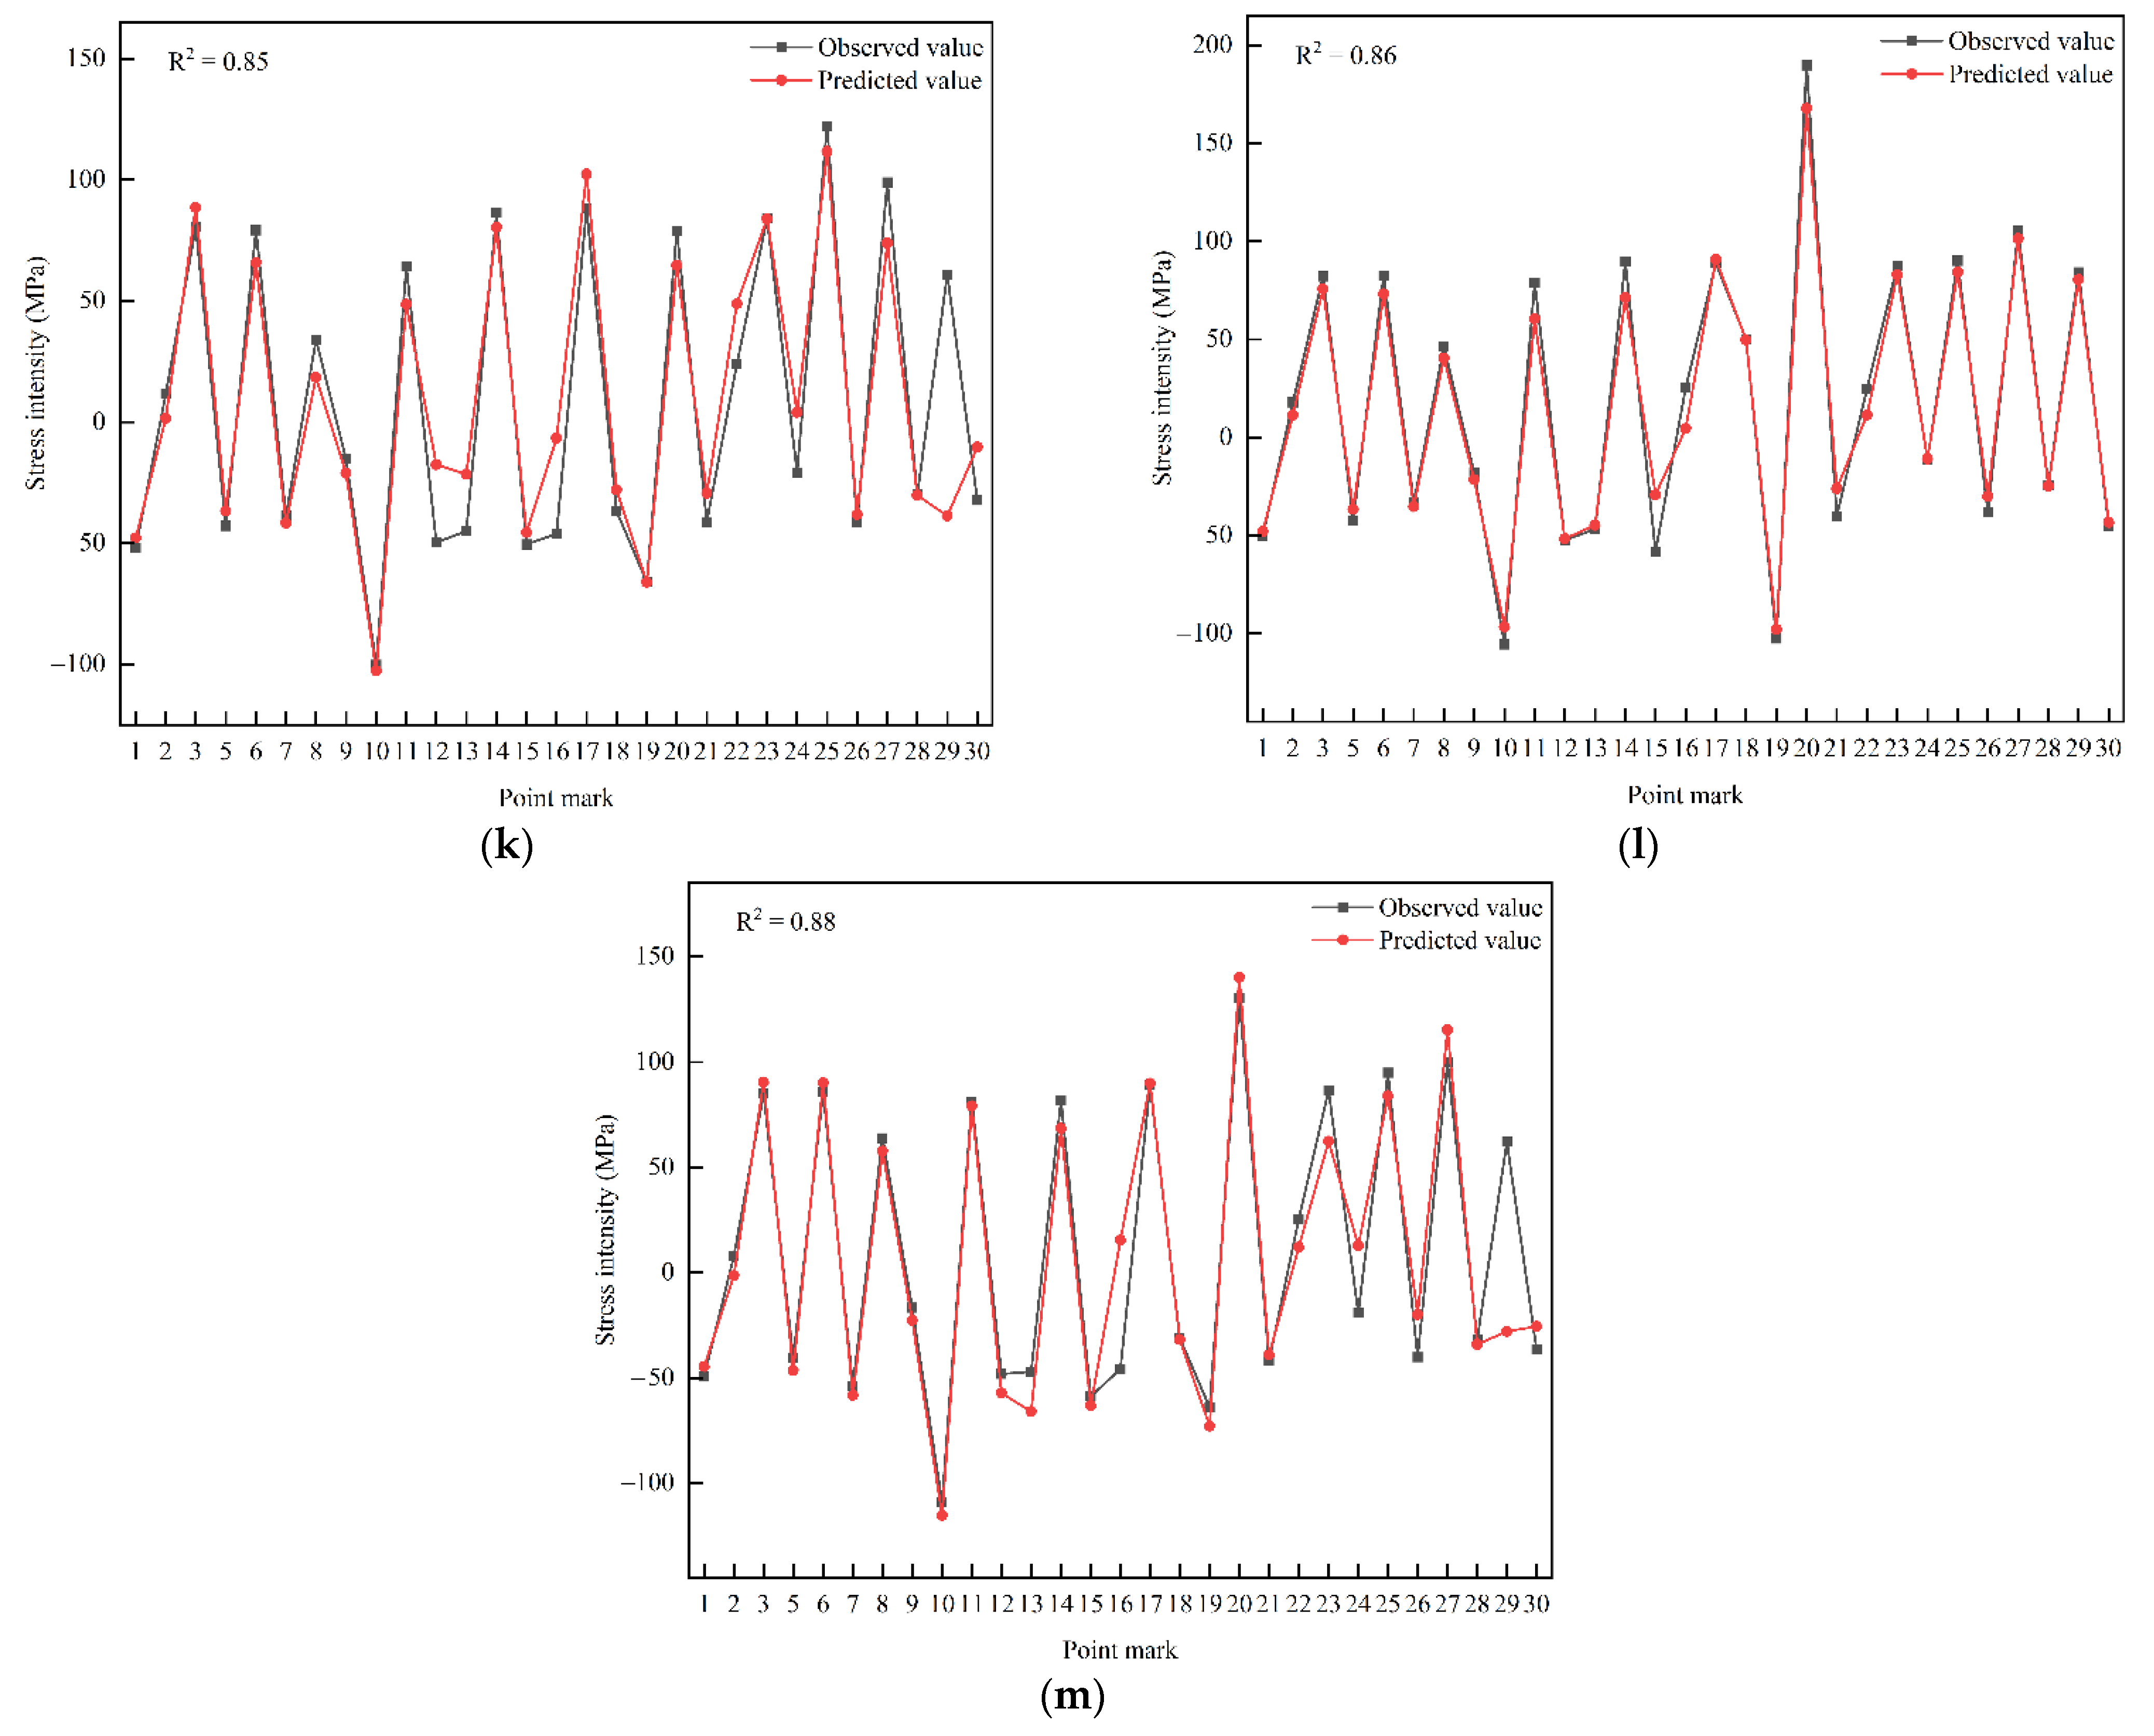
3.1. Multiple-Measuring-Point Mechanical Property Associated Sample Training Test of Member
3.2. Identification of Abnormal Members with Multiple Measuring Points
3.2.1. Identification Principle of Abnormal Members with Multiple Measuring Points
3.2.2. Training Test Analysis of Abnormal Data Samples of Multiple-Measuring-Point Mechanical Members
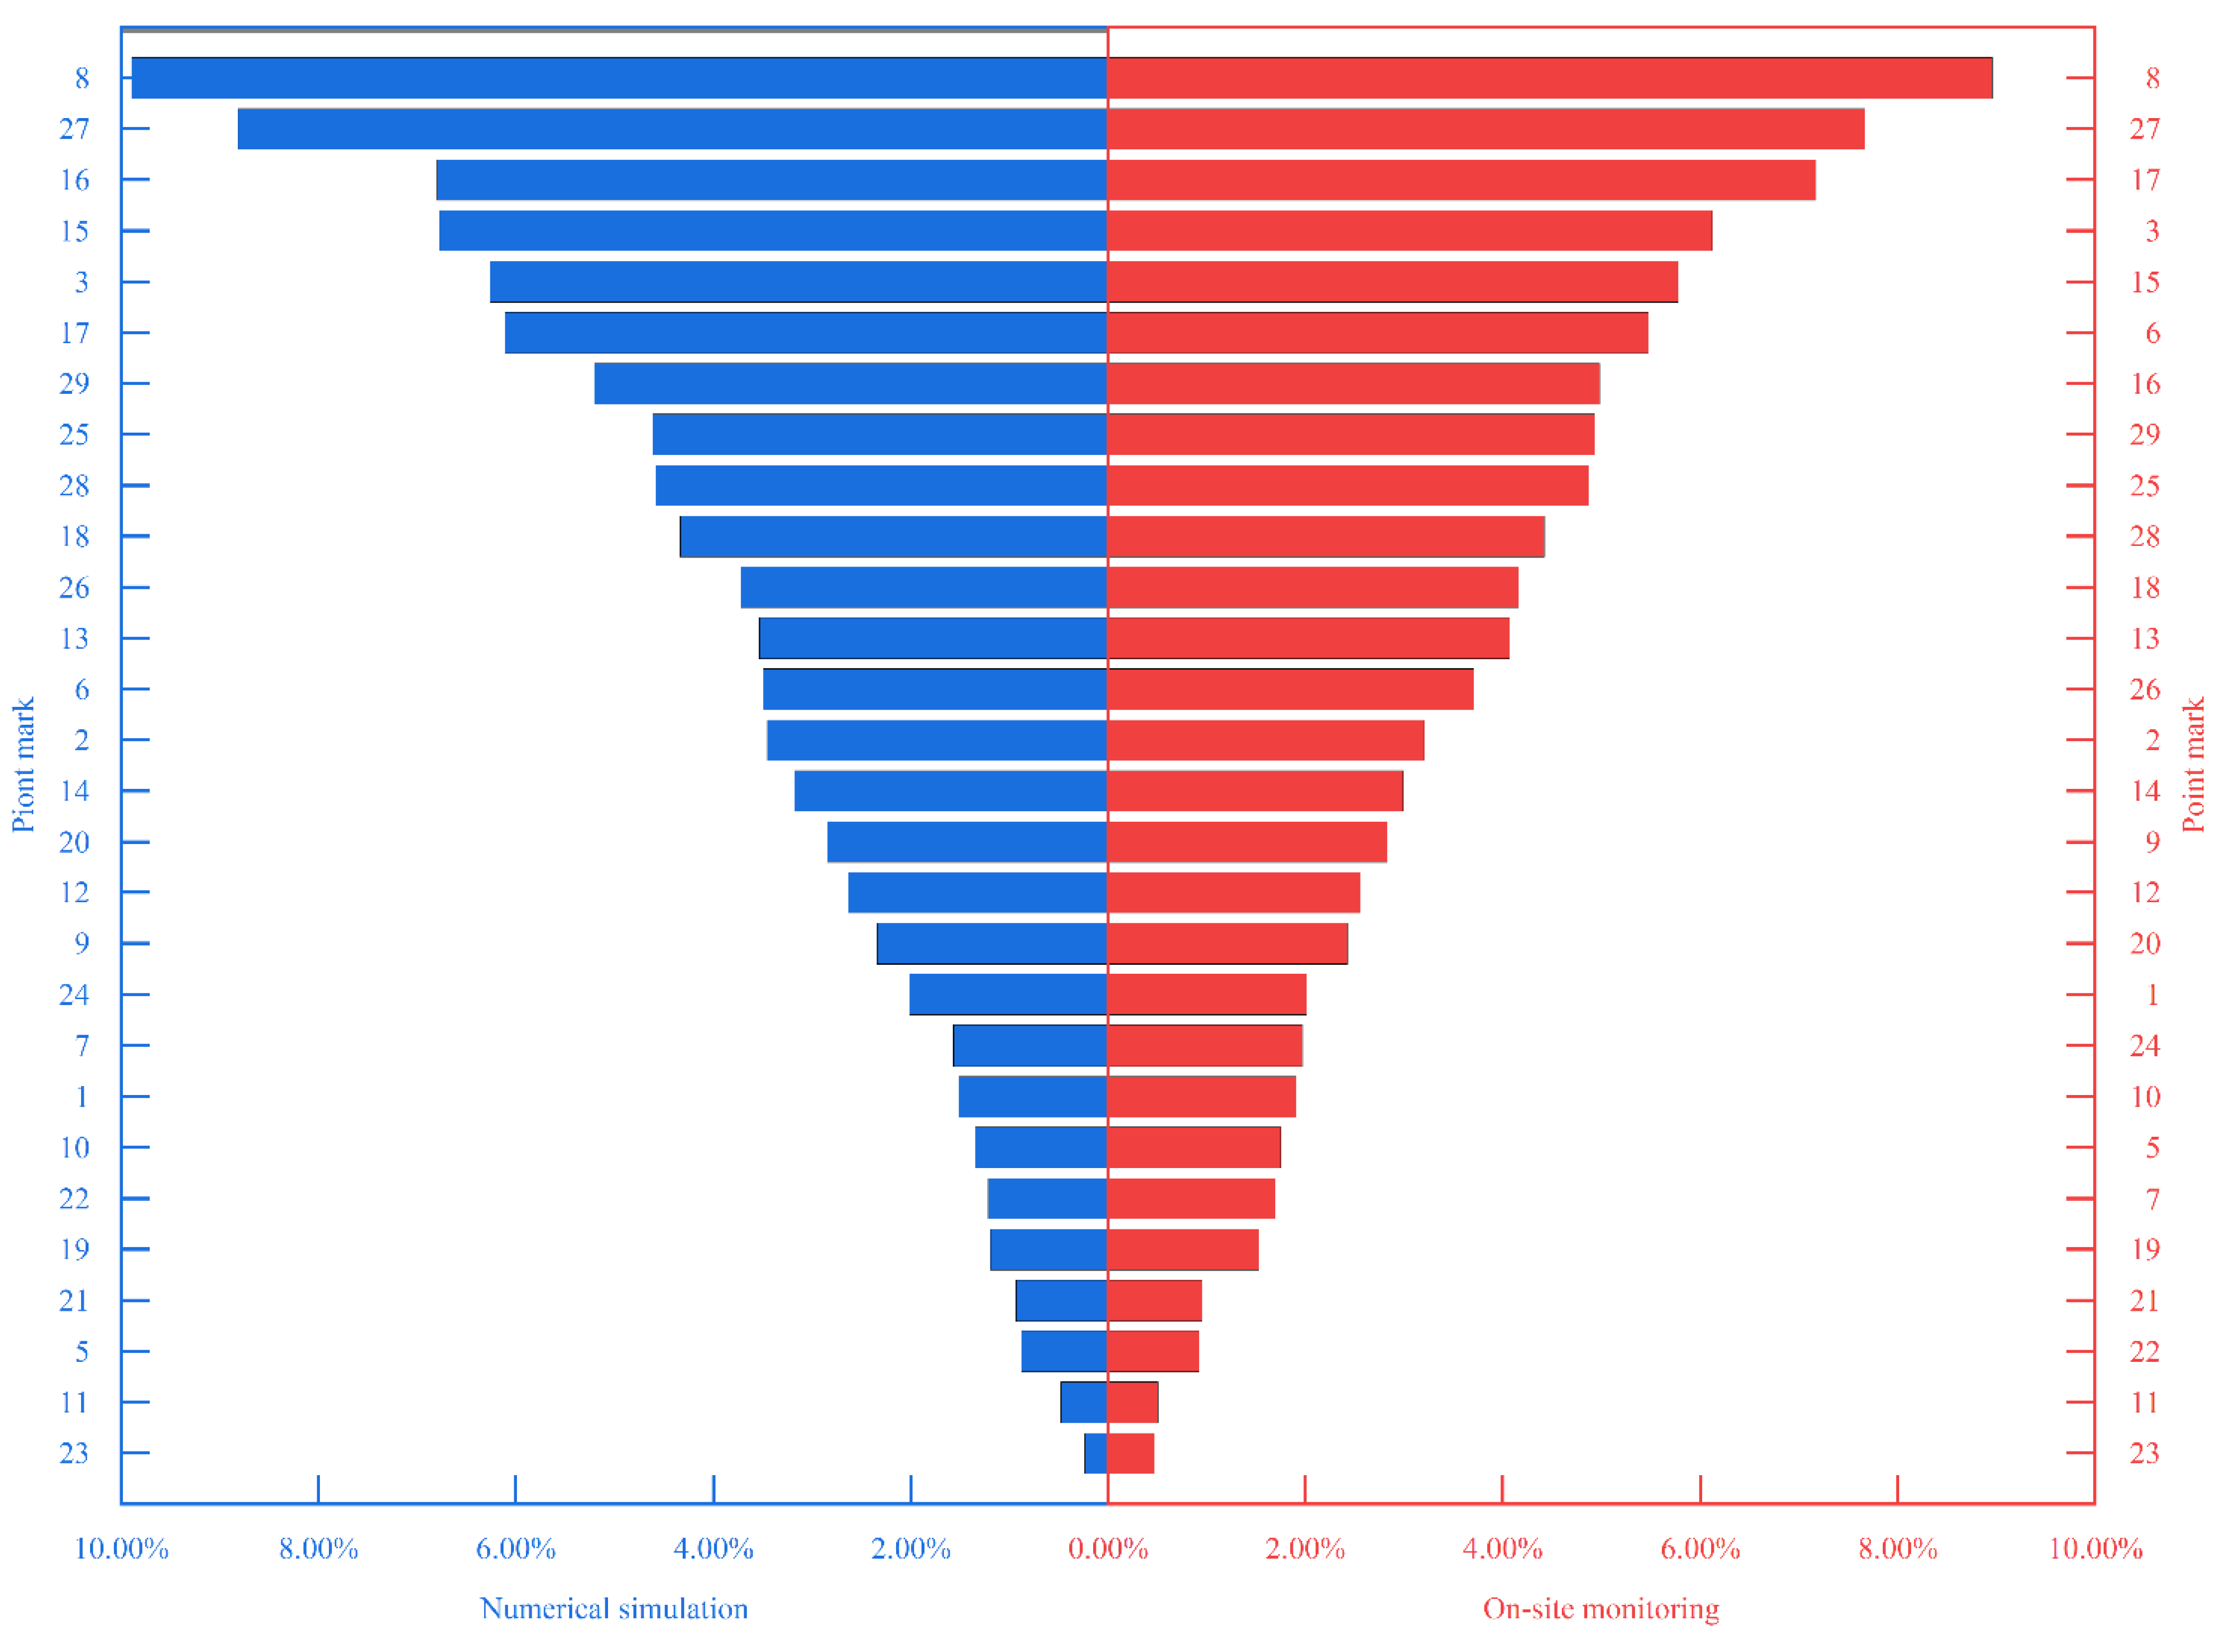
3.2.3. Sample Evaluation of Abnormal Mechanical Data of Grid Members
4. Conclusions
Author Contributions
Funding
Institutional Review Board Statement
Informed Consent Statement
Data Availability Statement
Conflicts of Interest
References
- Jiang, Y.; Liang, B.; Tao, M.; Liu, Y. Research on Distribution Method of Online Monitoring System of Operation Environment and Sensor of Valve Hall in Converter Station. High Volt. Appar. 2021, 57, 77–82. [Google Scholar]
- Li, Z.X. Structure Mechanics Analysis with Different Construction Schemes in Large-span Space Grid Structure. In Proceedings of the International Conference on Material Engineering, Chemistry and Environment (MECE 2013), Wuhan, China, 24–25 August 2013; pp. 534–537. [Google Scholar]
- Liu, Z.S.; Yuan, C.; Sun, Z.; Cao, C.F. Digital Twins-Based Impact Response Prediction of Prestressed Steel Structure. Sensors 2022, 22, 1647. [Google Scholar] [CrossRef] [PubMed]
- Zhibin, Z.; Yuling, Z. Stress Monitoring System of Large-Span Steel Structure of the National Stadium while Unloading. China Railw. Sci. 2008, 29, 139–144. [Google Scholar]
- Jiao, P.; Egbe, K.-J.I.; Xie, Y.; Matin Nazar, A.; Alavi, A.H. Piezoelectric Sensing Techniques in Structural Health Monitoring: A State-of-the-Art Review. Sensors 2020, 20, 3730. [Google Scholar] [CrossRef]
- Yan, J.-B.; Qian, X.; Liew, J.Y.R.; Zong, L. Damage plasticity based numerical analysis on steel–concrete–steel sandwich shells used in the Arctic offshore structure. Eng. Struct. 2016, 117, 542–559. [Google Scholar] [CrossRef]
- Jia, D.F.; Zhang, W.P.; Wang, Y.H.; Liu, Y.P. A New Approach for Cylindrical Steel Structure Deformation Monitoring by Dense Point Clouds. Remote Sens. 2021, 13, 2263. [Google Scholar] [CrossRef]
- Litos, J.; Vejmelkova, E.; Konvalinka, P. Monitoring of Deformation of Steel Structure Roof of Football Stadium Slavia Prague. In Proceedings of the International Conference on Measurement, Instrumentation and Automation (ICMIA 2012), Guangzhou, China, 15–16 September 2012; pp. 622–630. [Google Scholar]
- Liu, Q.L.; Zhu, Y.J.; Yuan, X.Z.; Zhang, J.; Wu, R.; Dou, Q.W.; Liu, S. Internet of Things Health Detection System in Steel Structure Construction Management. IEEE Access 2020, 8, 147162–147172. [Google Scholar] [CrossRef]
- Liu, Z.; Liu, P.; Zhou, C.; Huang, Y.; Zhang, L. Structural Health Monitoring of Underground Structures in Reclamation Area Using Fiber Bragg Grating Sensors. Sensors 2019, 19, 2849. [Google Scholar] [CrossRef] [Green Version]
- Ndubuaku, O.; Li, Y.; Cheng, J.J.R.; Martens, M.; Adeeb, S. A semi-empirical modeling approach for predicting the deformational capacity of axially-compressed cylindrical shells based on a novel material stress-strain characterization method. Thin-Walled Struct. 2019, 143, 106216. [Google Scholar] [CrossRef]
- Leung, C.K.Y.; Wan, K.T.; Inaudi, D.; Bao, X.Y.; Habel, W.; Zhou, Z.; Ou, J.P.; Ghandehari, M.; Wu, H.C.; Imai, M. Review: Optical fiber sensors for civil engineering applications. Mater. Struct. 2015, 48, 871–906. [Google Scholar] [CrossRef] [Green Version]
- Park, H.S.; Lee, H.M.; Adeli, H.; Lee, I. A new approach for health monitoring of structures: Terrestrial laser scanning. Comput.-Aided Civ. Infrastruct. Eng. 2007, 22, 19–30. [Google Scholar] [CrossRef]
- Ali, L.; Khan, S.; Bashmal, S.; Iqbal, N.; Dai, W.; Bai, Y. Fatigue Crack Monitoring of T-Type Joints in Steel Offshore Oil and Gas Jacket Platform. Sensors 2021, 21, 3294. [Google Scholar] [CrossRef] [PubMed]
- Riveiro, B.; Morer, P.; Arias, P.; de Arteaga, I. Terrestrial laser scanning and limit analysis of masonry arch bridges. Constr. Build. Mater. 2011, 25, 1726–1735. [Google Scholar] [CrossRef]
- He, Y.; Zheng, Y.; Yin, F.; Jiang, Y.; Tang, J. Terrestrial laser scanning and simulation analysis of large steel structure of high-rise building. World Earthq. Eng. 2016, 32, 12–20. [Google Scholar]
- Chalioris, C.E.; Kytinou, V.K.; Voutetaki, M.E.; Karayannis, C.G. Flexural Damage Diagnosis in Reinforced Concrete Beams Using a Wireless Admittance Monitoring System—Tests and Finite Element Analysis. Sensors 2021, 21, 679. [Google Scholar] [CrossRef] [PubMed]
- Hai, Y.; Min, X.; Lin, P.; He, W.; Zhansheng, H. Research on Abnormal Condition Monitoring System of UHV Converter Valve Based on Infrared/UV Image. In Advances in 3D Image and Graphics Representation, Analysis, Computing and Information Technology; Springer: Singapore, 2020; pp. 393–399. [Google Scholar]
- Zhang, S.; He, Y.; Gong, L.; Guo, Q. Operation Condition Monitoring Method of Bushing for UHV Converter Valve Hall Based on Intelligent Image Processing and 3D Modeling Technology. Insul. Mater. 2022, 55, 87–94. [Google Scholar]
- Xuejun, Z.; Rongqian, Y.; Xiao, M.; Yuan, X. Application of Health Monitoring Technology in Steel Structure Engineering of Jinan Olympic Sports Center. Appl. Mech. Mater. 2014, 578, 1170–1176. [Google Scholar]
- Qian, Q.; WeiZhen, M.; HaiYan, W. Management of construction cost of large-span steel structure project based on variable-two-dimensional cloud model. Proc. SPIE 2022, 12158, 203–210. [Google Scholar]
- Qiao, M.W.; Wei, Y.B. The Design of Automatic Monitoring System for Steel Structure Construction Safety and Its Application. In Proceedings of the Chinese Automation Congress (CAC), Hangzhou, China, 22–24 November 2019; pp. 4137–4140. [Google Scholar]
- Yang, Q.; Yu, S.L.; Zhang, X.W.; Wang, Z.J.; Yan, J.S.; Chen, X.X. The Construction Technology of Roof Steel Structure in YanCheng NanYang Airport. Adv. Civ. Eng. 2018, 2018, 6386020. [Google Scholar] [CrossRef] [Green Version]
- Liu, Z.P.; Chen, K.; Li, Z.C.; Jiang, X.L. Crack Monitoring Method for an FRP-Strengthened Steel Structure Based on an Antenna Sensor. Sensors 2017, 17, 2394. [Google Scholar] [CrossRef] [Green Version]
- Zhou, C.Y.; Du, Z.C.; Ouyang, J.W.; Zhang, Z.L.; Liu, Z. A 3D geological model and cutting algorithm based on a vertically projected triangulated network. Comput. Geosci. 2020, 143, 104562. [Google Scholar] [CrossRef]
- Zeng, Q.H.; Ming, W.H.; Luo, J.; Zhang, S.A.; Hu, W.; Liu, Z.; Zhou, C.Y. A three-dimensional intelligent engineering management and control system for the construction of a long-span valve hall project based on a microservice architecture. PLoS ONE 2021, 16, e0261012. [Google Scholar] [CrossRef] [PubMed]
- Zhu, Y.F.; Gao, Y.; Zeng, Q.H.; Liao, J.; Liu, Z.; Zhou, C.Y. Real-Time Structural Monitoring of the Multi-Point Hoisting of a Long-Span Converter Station Steel Structure. Sensors 2021, 21, 4737. [Google Scholar] [CrossRef] [PubMed]
- LeCun, Y.; Bengio, Y.; Hinton, G. Deep learning. Nature 2015, 521, 436–444. [Google Scholar] [CrossRef]
- Goodfellow, I.; Bengio, Y.; Courville, A. Deep Learning; MIT Press: Cambridge, MA, USA, 2016. [Google Scholar]
- Minsky, M. Steps toward artificial intelligence. Proc. IRE 1961, 49, 8–30. [Google Scholar] [CrossRef]
- Gulli, A.; Pal, S. Deep Learning with Keras; Packt Publishing Ltd.: Birmingham, UK, 2017; ISBN 978-1-78712-842-2. [Google Scholar]
- Bender, M.A.; McCauley, S.; McGregor, A.; Singh, S.; Vu, H.T. Run Generation Revisited: What Goes Up May or May Not Come Down. In Proceedings of the 26th International Symposium on Algorithms and Computation (ISAAC), Nagoya, Japan, 9–11 December 2015; pp. 703–714. [Google Scholar]
- Zhou, J. Study on the operation time of FFT permutation algorithm. In Proceedings of the 2021 IEEE International Conference on Electronic Technology, Communication and Information (ICETCI), Changchun, China, 27–29 August 2021; pp. 117–120. [Google Scholar]


Publisher’s Note: MDPI stays neutral with regard to jurisdictional claims in published maps and institutional affiliations. |
© 2022 by the authors. Licensee MDPI, Basel, Switzerland. This article is an open access article distributed under the terms and conditions of the Creative Commons Attribution (CC BY) license (https://creativecommons.org/licenses/by/4.0/).
Share and Cite
Zeng, Q.; Liao, J.; Huang, X.; Ming, W.; Gao, Y.; Zhou, C.; Liu, Z. An Intelligent Correlation Real-Time Analysis Method for the Mechanical Properties of Members in Super-Span Valve Hall Grid Structure Hoisting Process. Sensors 2022, 22, 8111. https://doi.org/10.3390/s22218111
Zeng Q, Liao J, Huang X, Ming W, Gao Y, Zhou C, Liu Z. An Intelligent Correlation Real-Time Analysis Method for the Mechanical Properties of Members in Super-Span Valve Hall Grid Structure Hoisting Process. Sensors. 2022; 22(21):8111. https://doi.org/10.3390/s22218111
Chicago/Turabian StyleZeng, Qinghe, Jin Liao, Xionghui Huang, Weihua Ming, Yi Gao, Cuiying Zhou, and Zhen Liu. 2022. "An Intelligent Correlation Real-Time Analysis Method for the Mechanical Properties of Members in Super-Span Valve Hall Grid Structure Hoisting Process" Sensors 22, no. 21: 8111. https://doi.org/10.3390/s22218111