
A Data-Driven Model with Feedback Calibration Embedded Blood Pressure Estimator Using Reflective Photoplethysmography


 and
and
Abstract
:1. Introduction
2. Materials and Methods
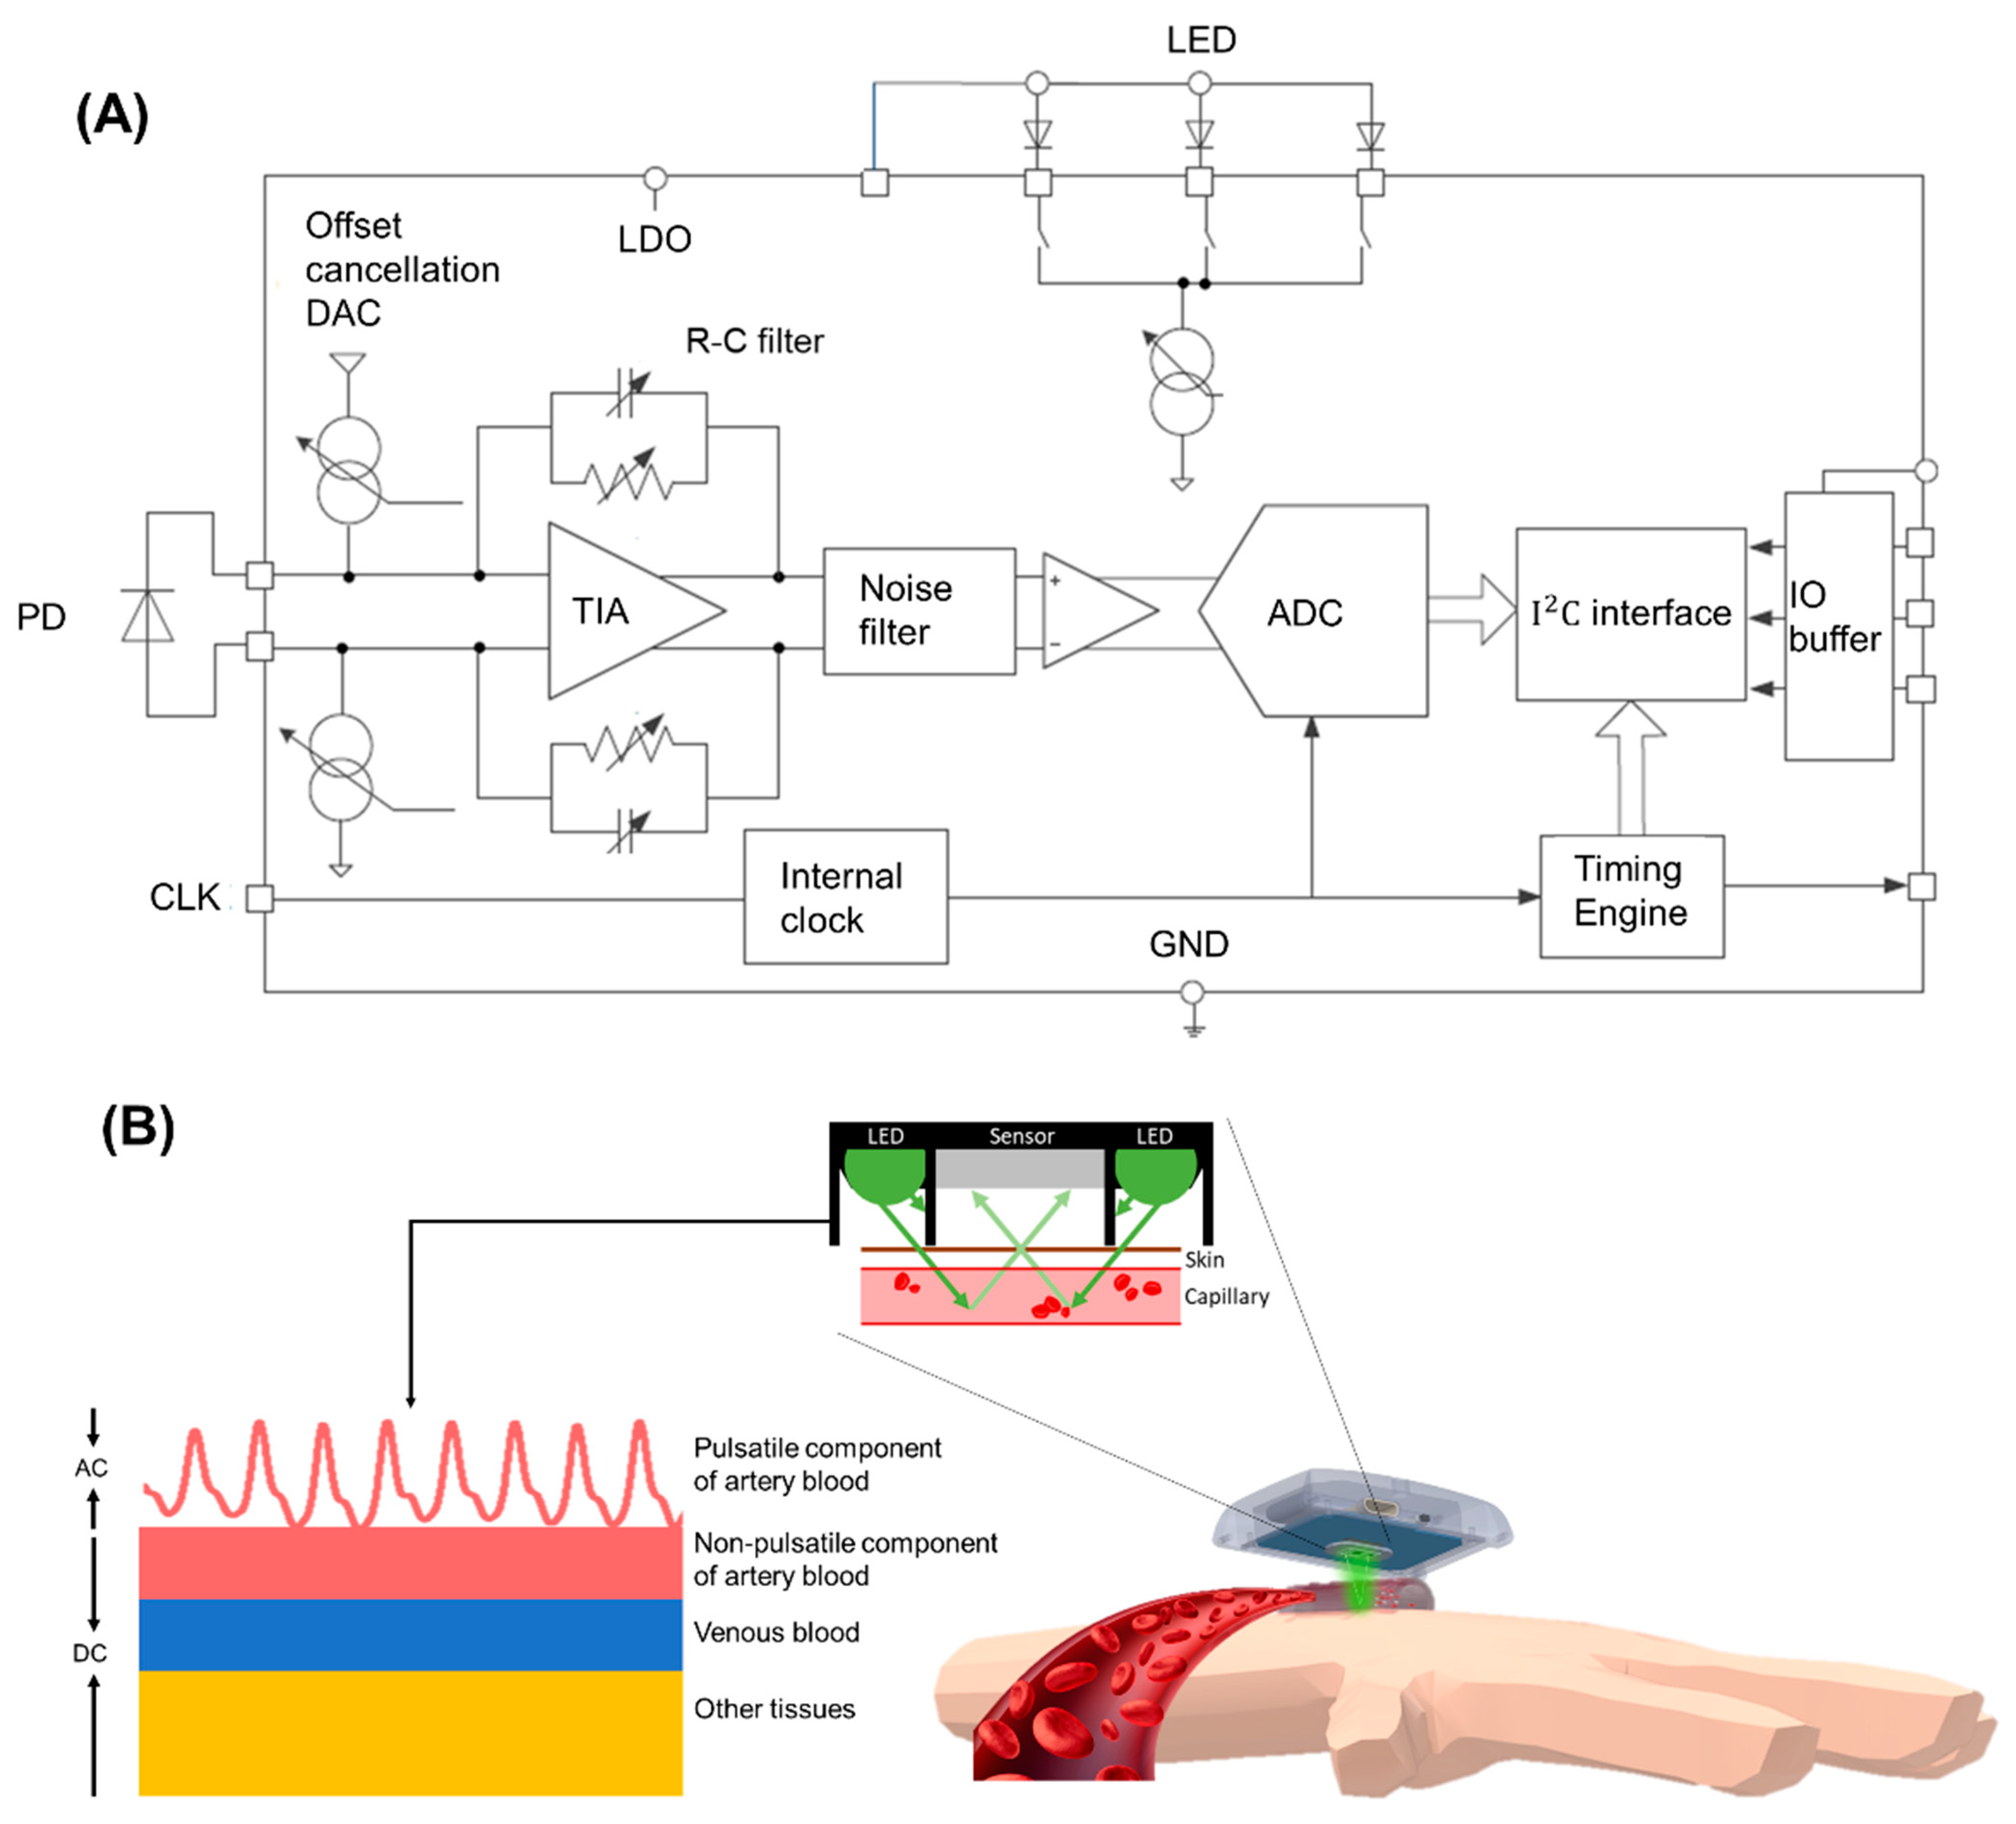
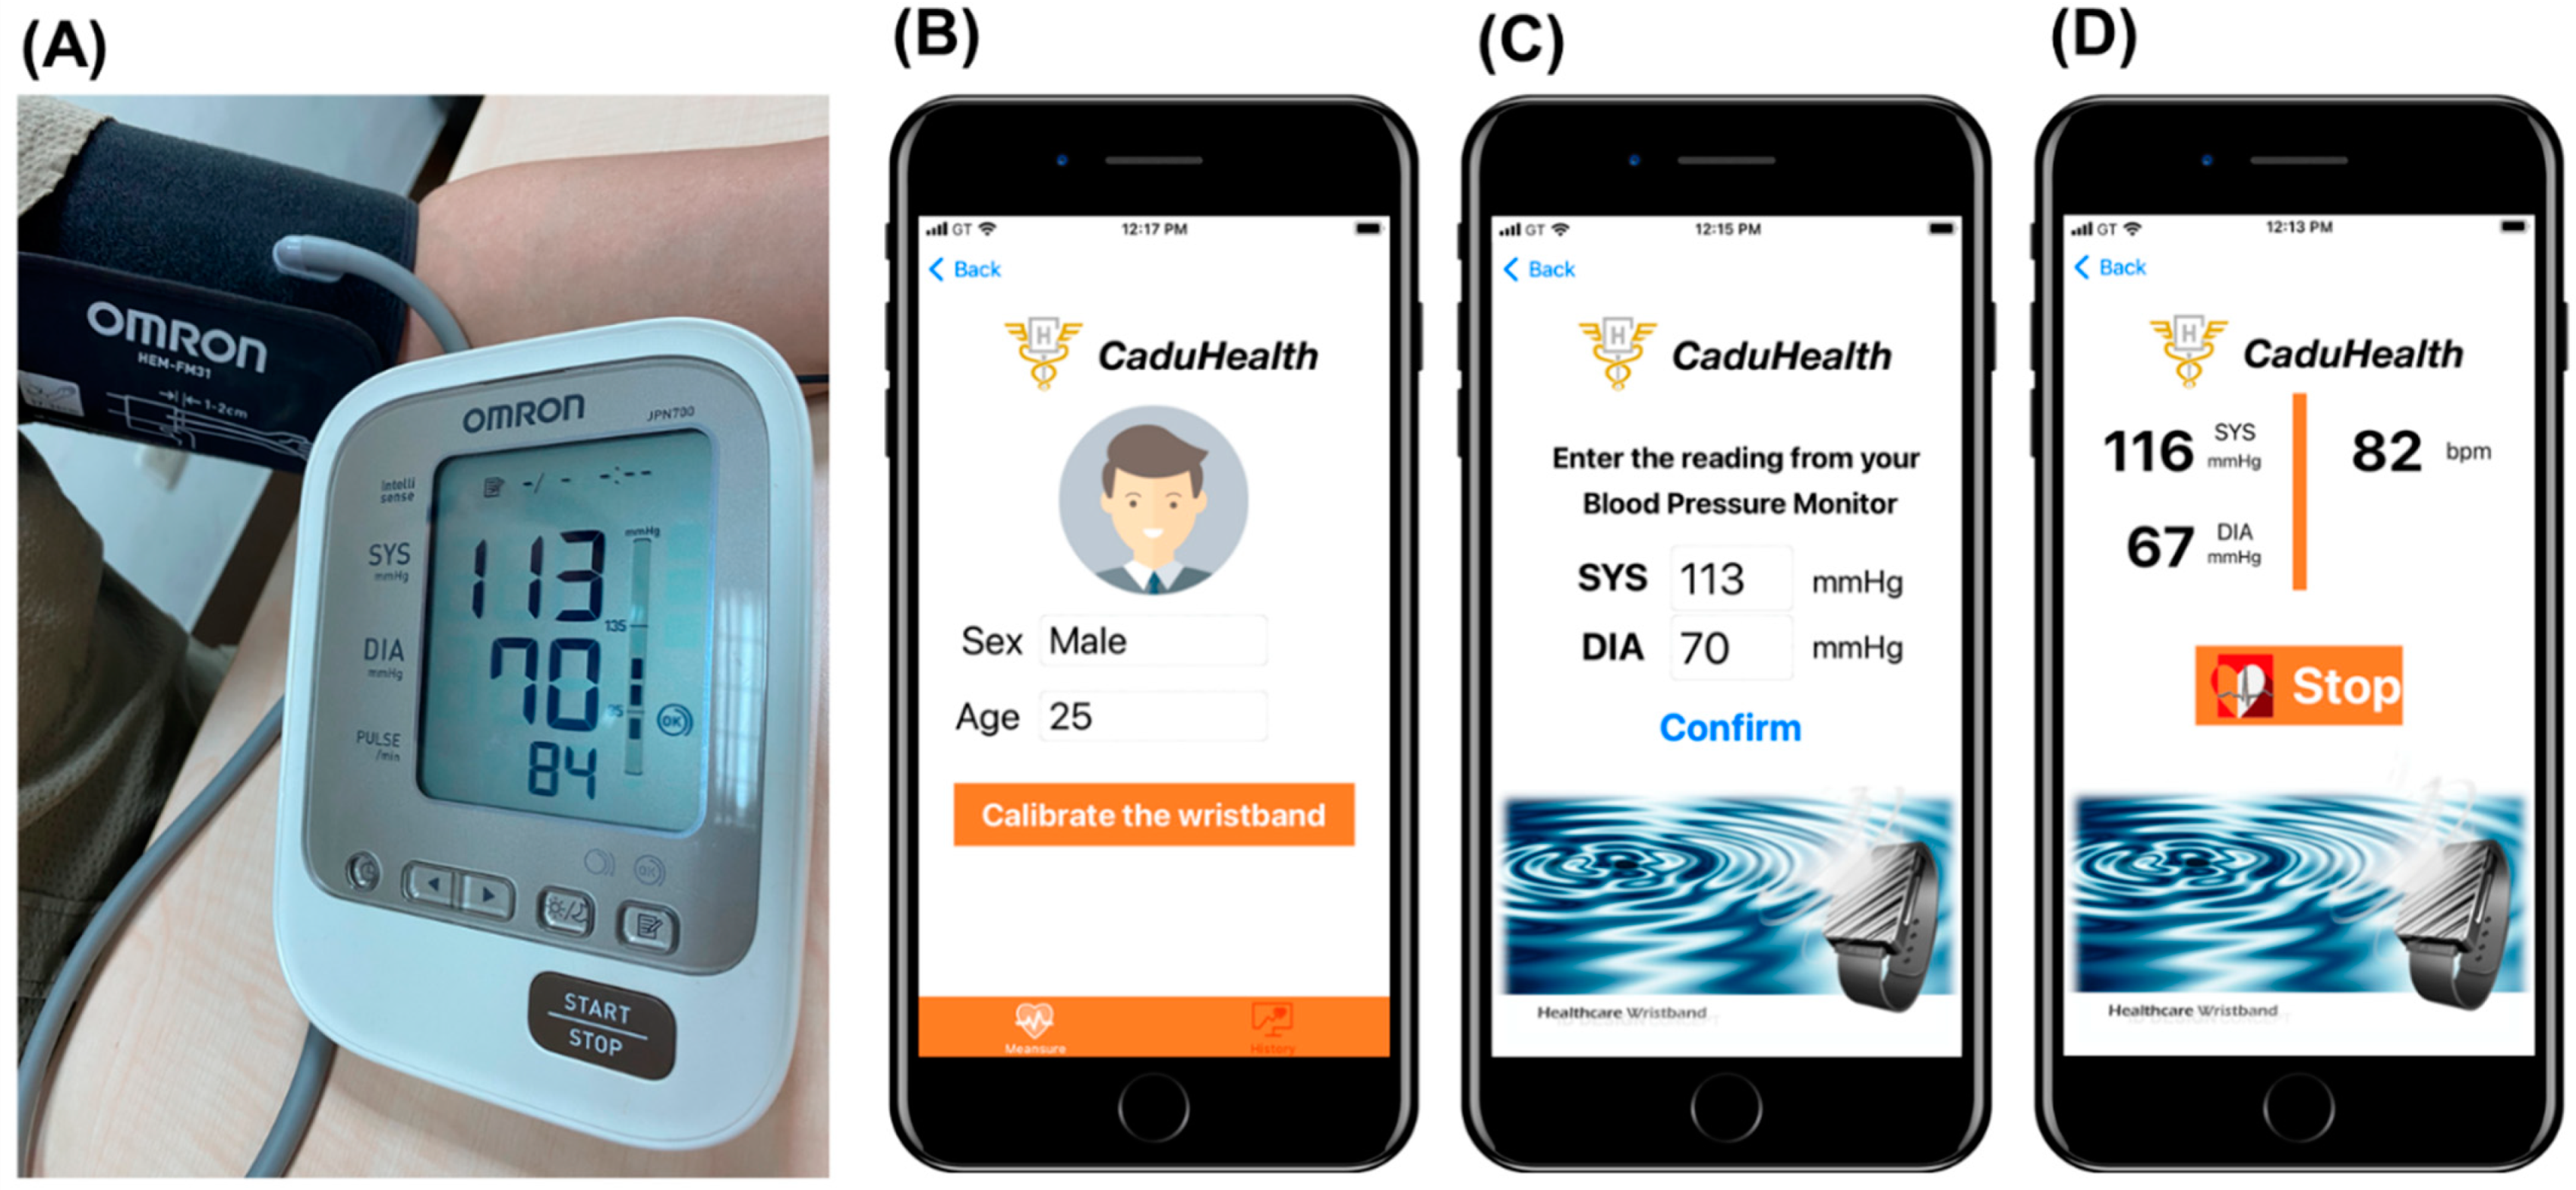
2.1. A Proof-of-Concept Wrist-Type PPG Device for BP Estimation Using Reflective PPG
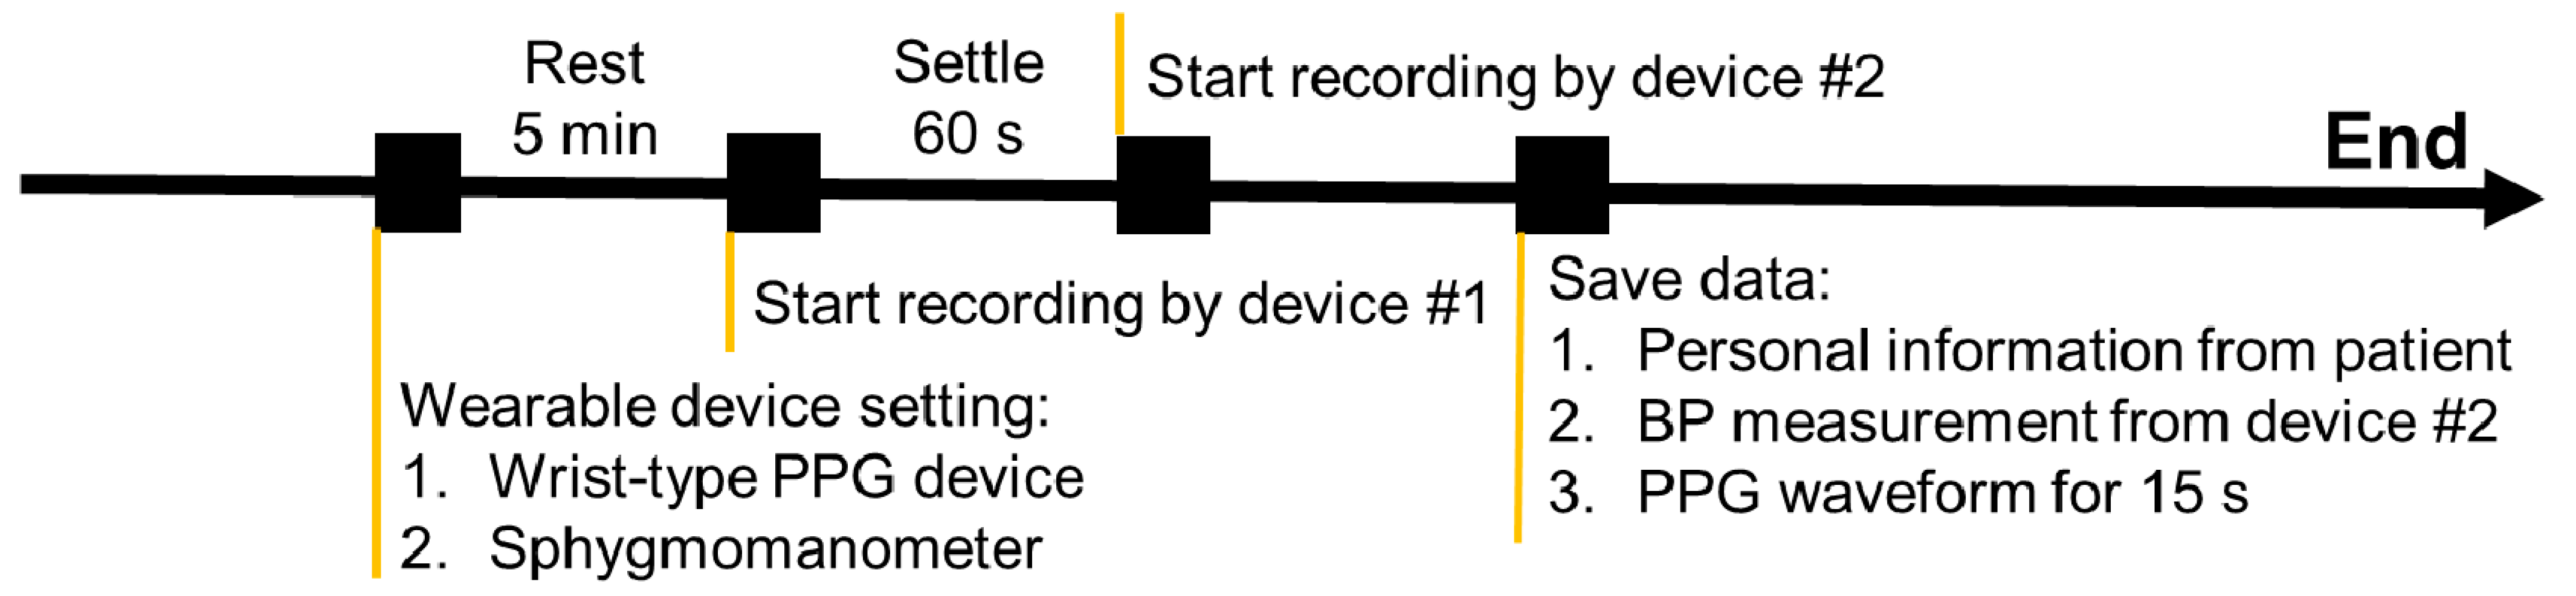
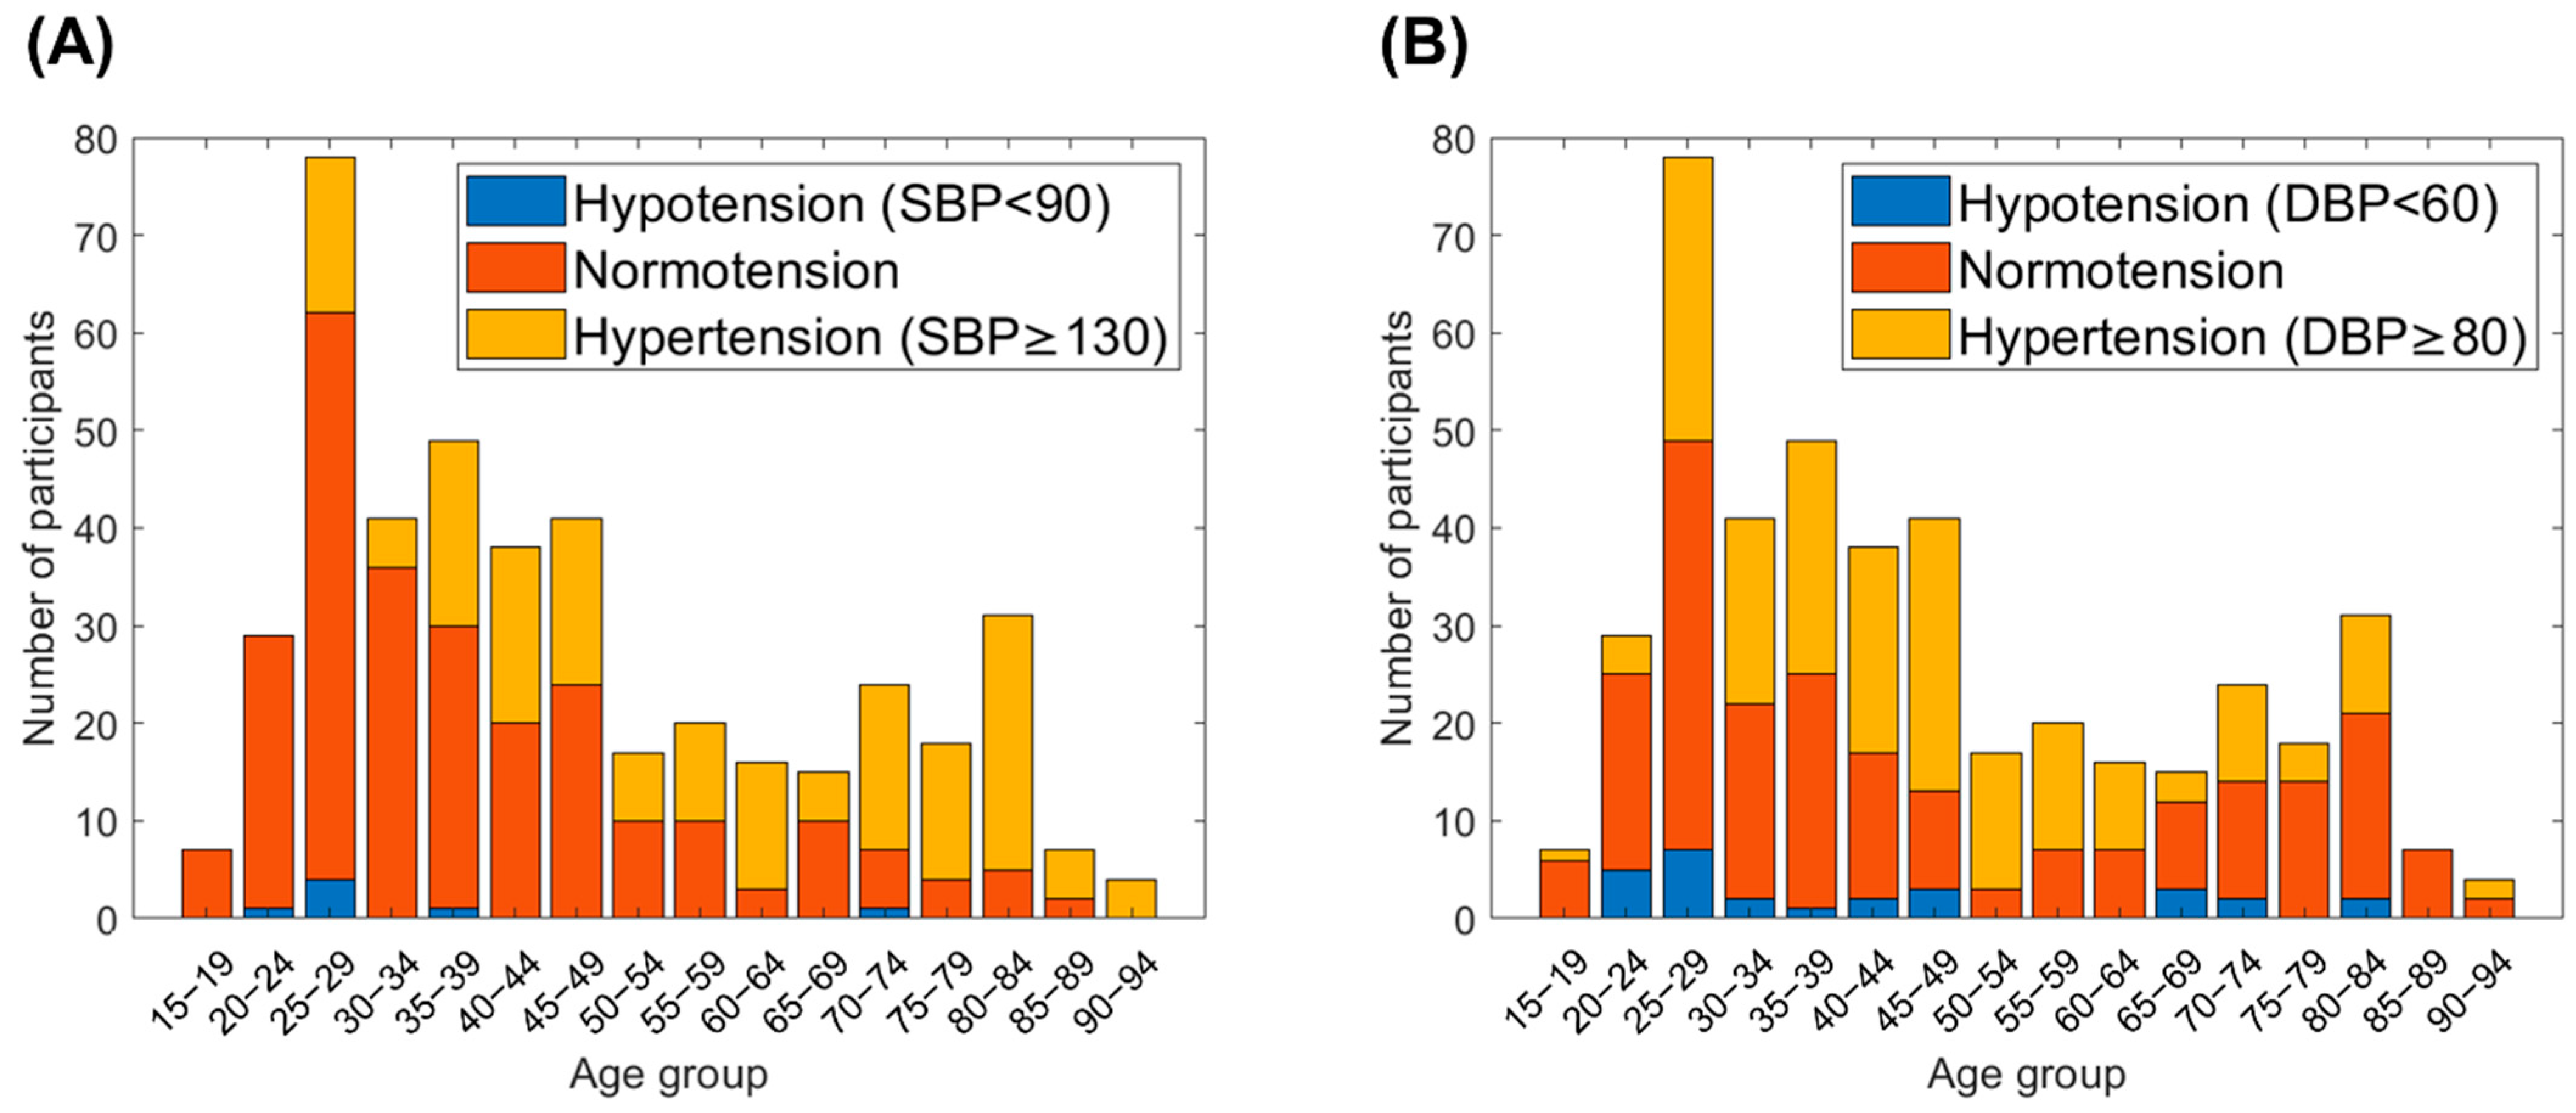
2.2. Clinical Trial for Validation of the Difference of Estimated and Actual BP
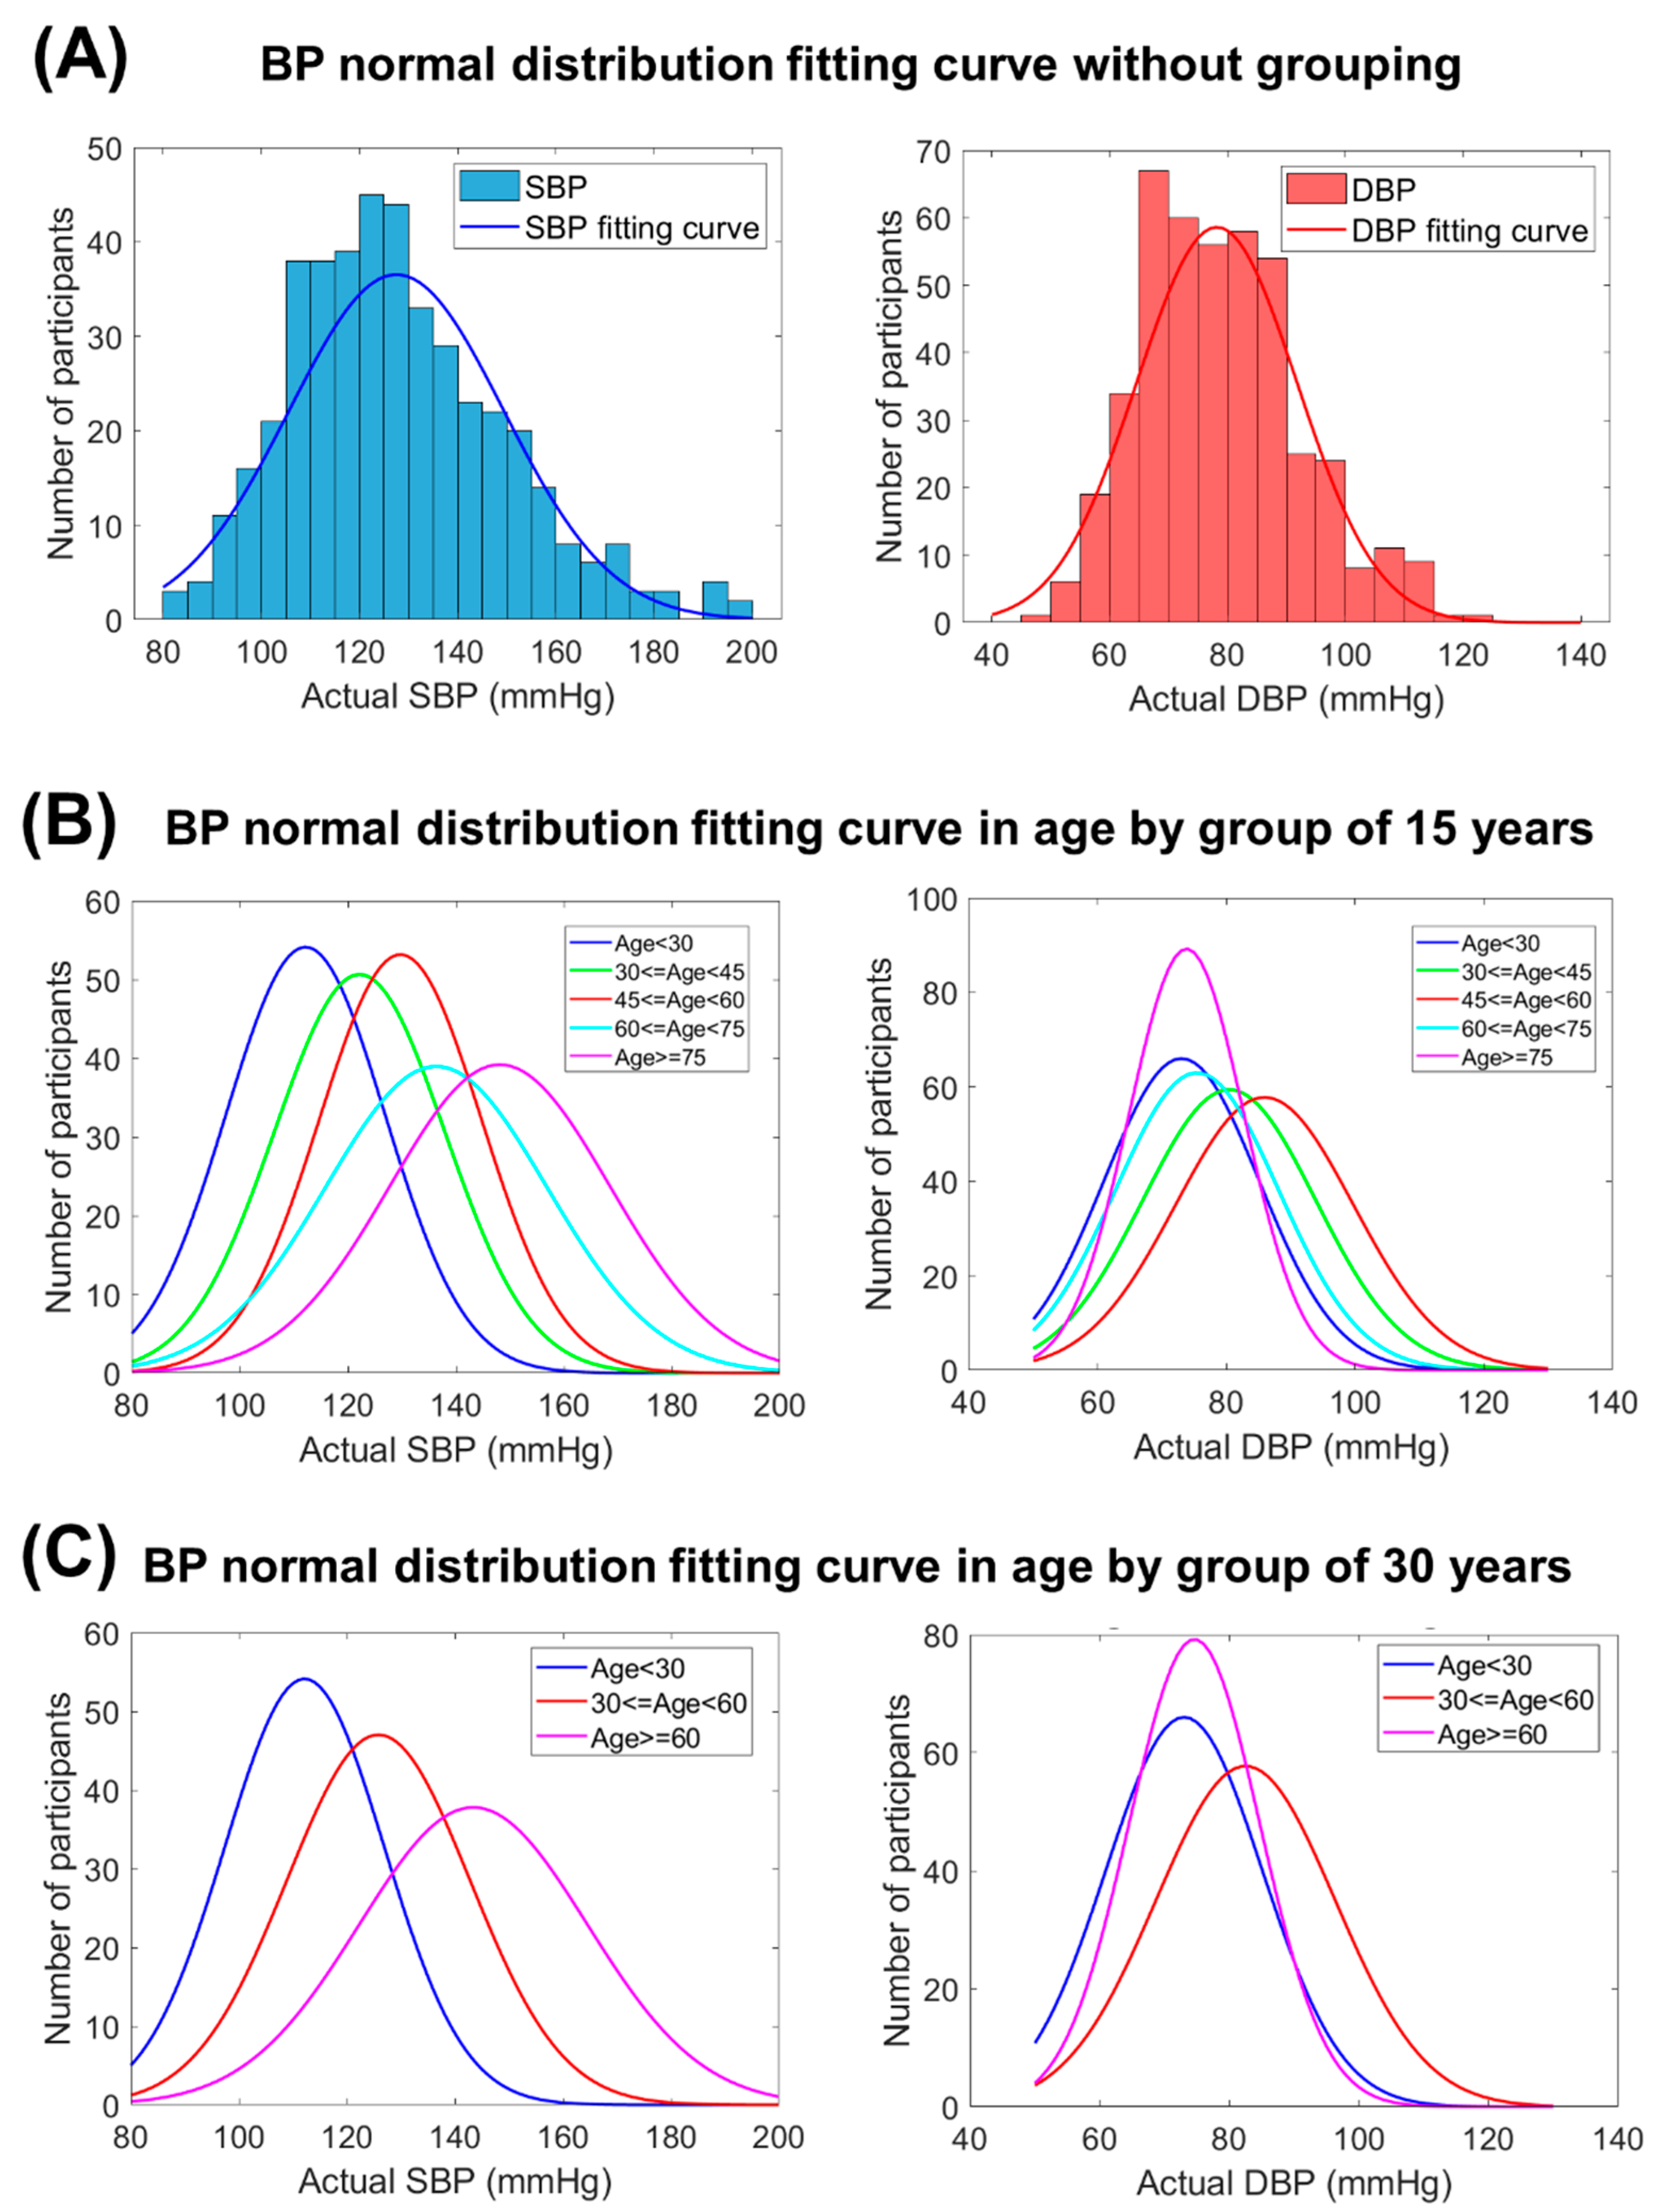
2.3. ML-Based BP Estimation with the Calibrated Model by Age Grouping
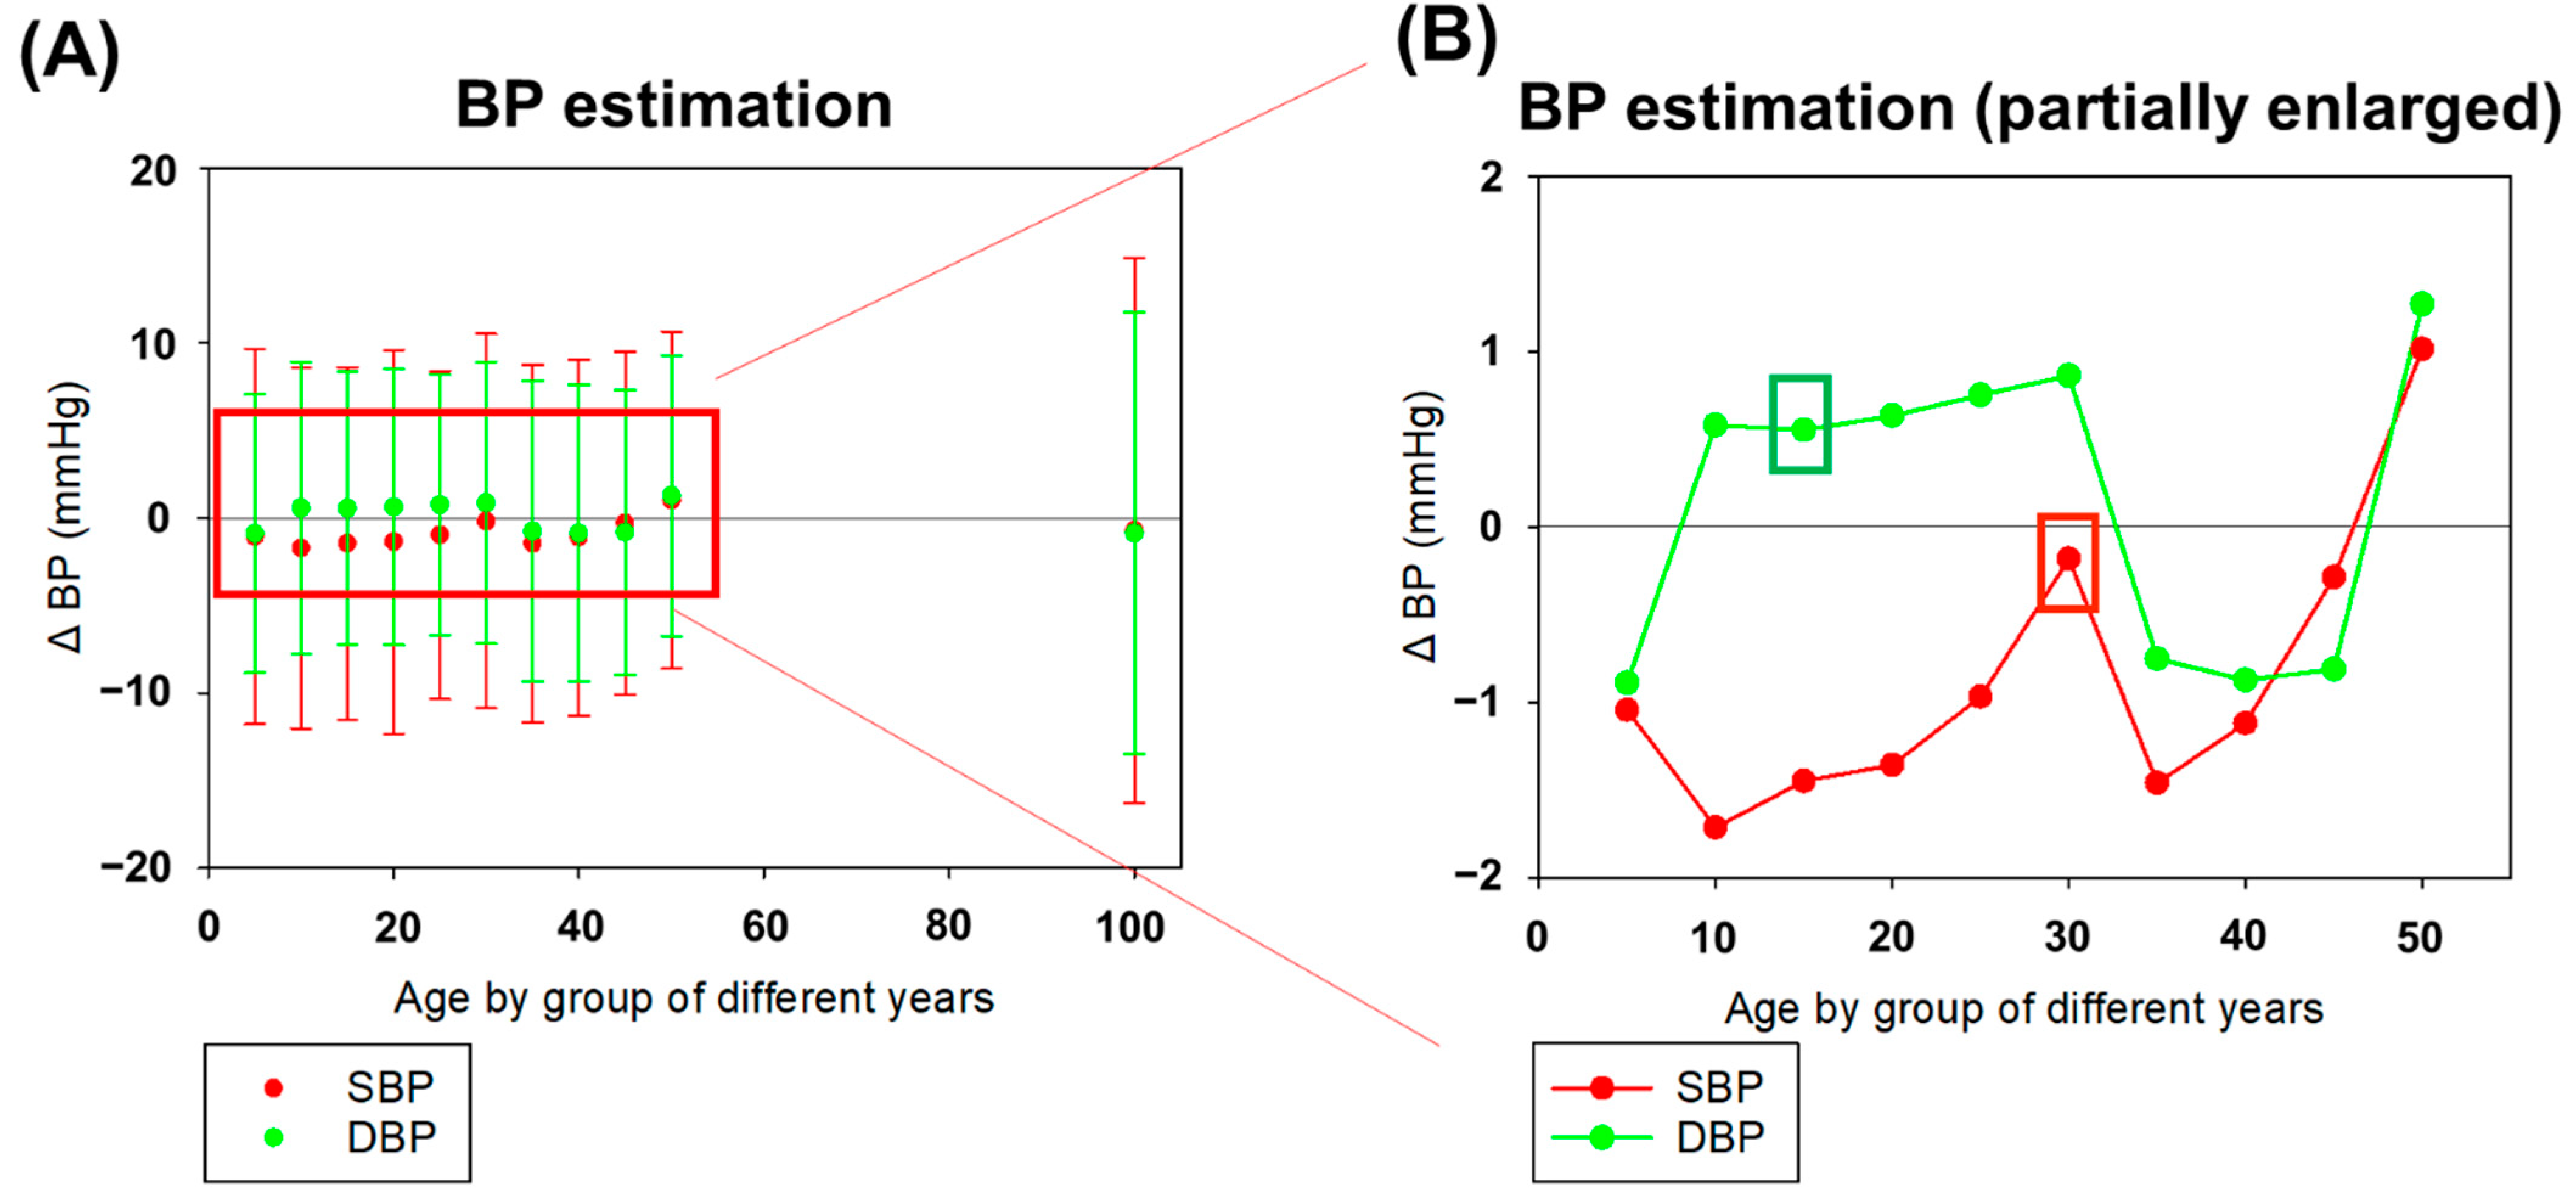
2.4. Statistical Analysis of BP Estimation in Accordance with International Standards
3. Results
3.1. Evaluation of Best Performing ML-Based Algorithm for BP Estimation
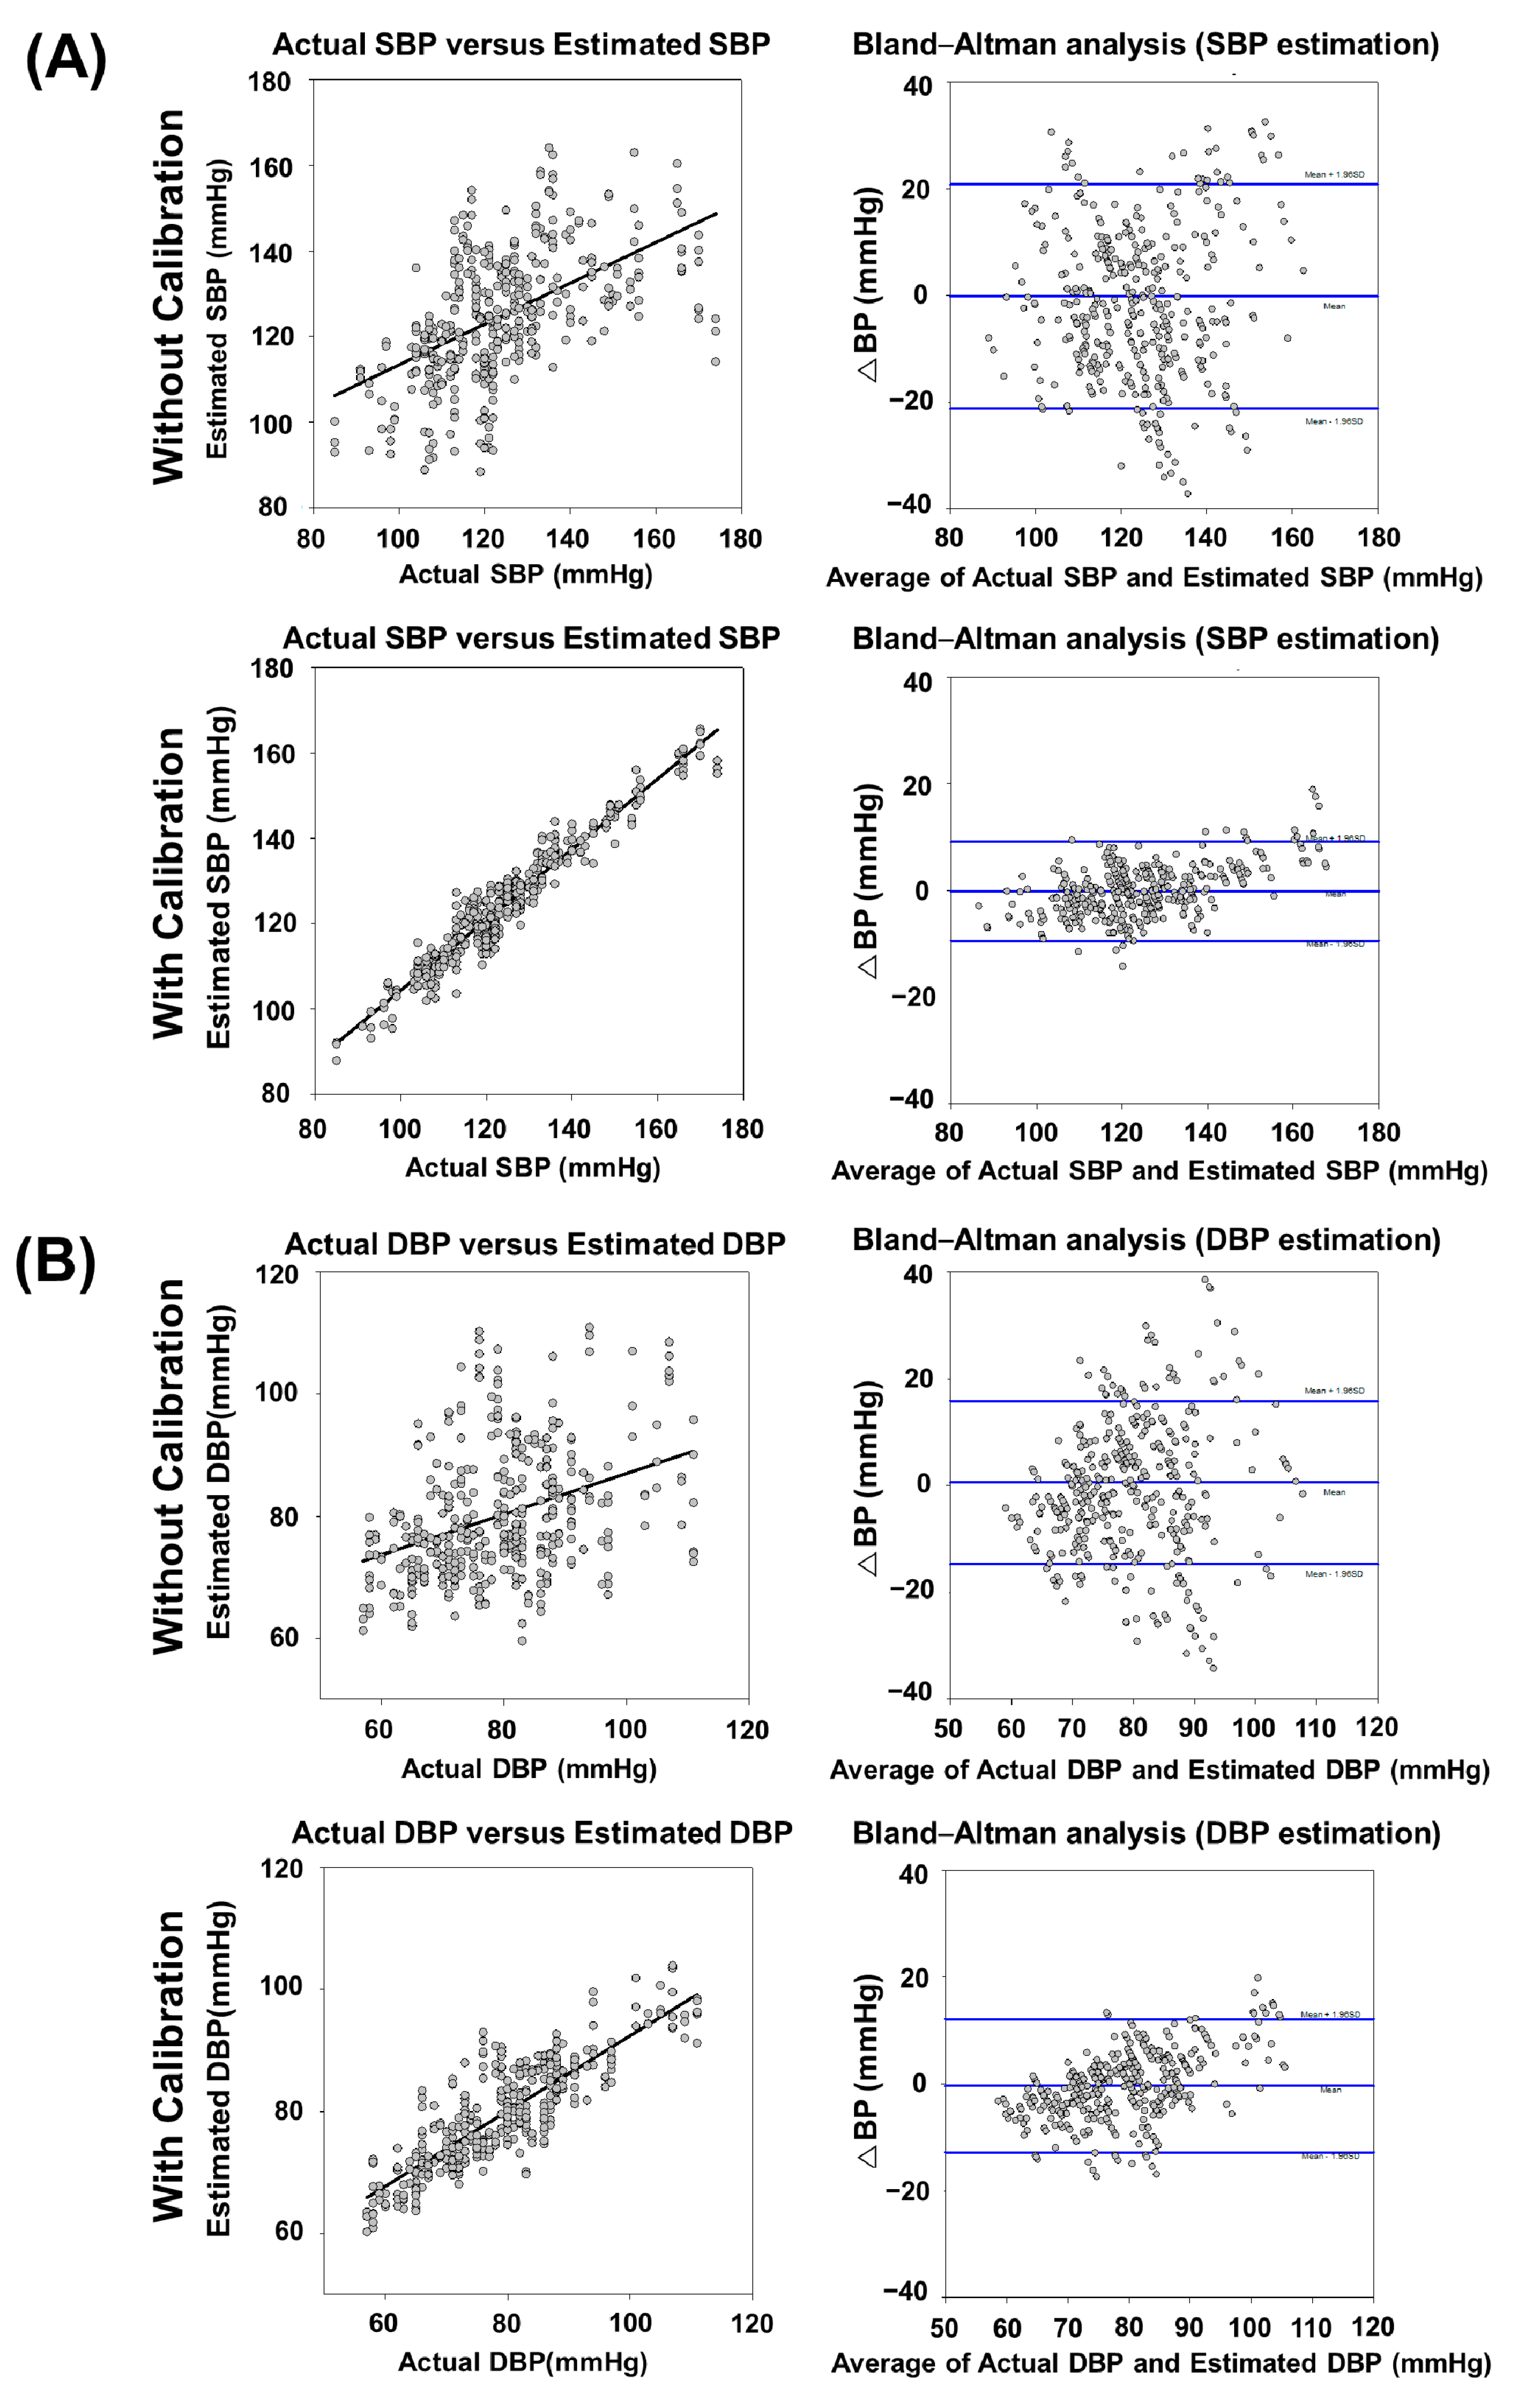
3.2. Comparison of the Proposed BP Estimation Model with and without Calibration
4. Discussion
5. Conclusions
Author Contributions
Funding
Institutional Review Board Statement
Informed Consent Statement
Data Availability Statement
Acknowledgments
Conflicts of Interest
References
- World Health Organization. 2021. Available online: https://www.who.int/health-topics/cardiovascular-diseases#tab=tab_1 (accessed on 15 October 2021).
- Timmis, A.; Townsend, N.; Gale, C.P.; Torbica, A.; Lettino, M.; Petersen, S.E.; Mossialos, E.A.; Maggioni, A.P.; Kazakiewicz, D.; May, H.T.; et al. European Society of Cardiology: Cardiovascular Disease Statistics 2019. Eur. Heart J. 2020, 41, 12–85. [Google Scholar] [CrossRef] [PubMed]
- World Health Organization. 2021. Available online: http://www.who.int/news-room/fact-sheets/detail/cardiovascular-diseases-(cvds) (accessed on 15 October 2021).
- Dunbar, S.B.; Khavjou, O.A.; Bakas, T.; Hunt, G.; Kirch, R.A.; Leib, A.R.; Morrison, R.S.; Poehler, D.C.; Roger, V.L.; Whitsel, L.P.; et al. Projected costs of informal caregiving for cardiovascular disease: 2015 to 2035: A policy statement from the American Heart Association. Circulation 2018, 137, e558–e577. [Google Scholar] [CrossRef] [PubMed]
- He, J.; Whelton, P.K. Elevated systolic blood pressure and risk of cardiovascular and renal disease: Overview of evidence from observational epidemiologic studies and randomized controlled trials. Am. Heart J. 1999, 138, S211–S219. [Google Scholar] [CrossRef]
- Fernández, J.R.; Mojón, A.; Hermida, R.C. Chronotherapy of hypertension: Advantages of 48-h ambulatory blood pressure monitoring assessments in MAPEC and Hygia Chronotherapy Trial. Chronobiol. Int. 2020, 37, 739–750. [Google Scholar] [CrossRef]
- Barvik, D.; Cerny, M.; Penhaker, M.; Noury, N. Noninvasive Continuous Blood Pressure Estimation from Pulse Transit Time: A review of the calibration models. IEEE Rev. Biomed. Eng. 2021, 15, 138–151. [Google Scholar] [CrossRef]
- Ganti, V.G.; Carek, A.M.; Jung, H.; Srivatsa, A.V.; Cherry, D.; Johnson, L.N.; Inan, O.T. Enabling Wearable Pulse Transit Time-Based Blood Pressure Estimation for Medically Underserved Areas and Health Equity: Comprehensive Evaluation Study. JMIR Mhealth Uhealth 2021, 9, e27466. [Google Scholar] [CrossRef]
- Patzak, A.; Mendoza, Y.; Gesche, H.; Konermann, M. Continuous blood pressure measurement using the pulse transit time: Comparison to intra-arterial measurement. Blood Press. 2015, 24, 217–221. [Google Scholar] [CrossRef]
- Mukherjee, R.; Ghosh, S.; Gupta, B.; Chakravarty, T. A literature review on current and proposed technologies of noninvasive blood pressure measurement. Telemed. e-Health 2018, 24, 185–193. [Google Scholar] [CrossRef]
- Holyoke, P.; Yogaratnam, K.; Kalles, E. Web-Based Smartphone Algorithm for Calculating Blood Pressure From Photoplethysmography Remotely in a General Adult Population: Validation Study. J. Med. Internet Res. 2021, 23, e19187. [Google Scholar] [CrossRef]
- Goli, S.; Jayanthi, T. Cuff less continuous non-invasive blood pressure measurement using pulse transit time measurement. Int. J. Recent Dev. Eng. Technol. 2014, 2, 16–86. [Google Scholar]
- Ganti, V.G.; Carek, A.M.; Nevius, B.N.; Heller, J.A.; Etemadi, M.; Inan, O.T. Wearable cuff-less blood pressure estimation at home via pulse transit time. IEEE J. Biomed. Health Inform. 2021, 25, 1926–1937. [Google Scholar] [CrossRef] [PubMed]
- Yamanaka, S.; Morikawa, K.; Morita, H.; Huh, J.Y.; Yamamura, O. Calibration-Free Cuffless Blood Pressure Estimation Based on a Population With a Diverse Range of Age and Blood Pressure. Front. Med. Technol. 2021, 36, 695356. [Google Scholar] [CrossRef]
- Mejía-Mejía, E.; May, J.M.; Elgendi, M.; Kyriacou, P.A. Classification of blood pressure in critically ill patients using photoplethysmography and machine learning. Comput. Methods Programs Biomed. 2021, 208, 106222. [Google Scholar] [CrossRef] [PubMed]
- Elgendi, M.; Fletcher, R.; Norton, I.; Brearley, M.; Abbott, D.; Lovell, N.H.; Schuurmans, D. On time domain analysis of photoplethysmogram signals for monitoring heat stress. Sensors 2015, 15, 24716–24734. [Google Scholar] [CrossRef] [Green Version]
- Mol, A.; Meskers, C.G.; Niehof, S.P.; Maier, A.B.; Van Wezel, R.J. Pulse transit time as a proxy for vasoconstriction in younger and older adults. Exp. Gerontol. 2020, 135, 110938. [Google Scholar] [CrossRef] [PubMed]
- Liang, Y.; Chen, Z.; Liu, G.; Elgendi, M. A new, short-recorded photoplethysmogram dataset for blood pressure monitoring in China. Sci. Data 2018, 5, 1–7. [Google Scholar] [CrossRef] [Green Version]
- Martínez, G.; Howard, N.; Abbott, D.; Lim, K.; Ward, R.; Elgendi, M. Can Photoplethysmography Replace Arterial Blood Pressure in the Assessment of Blood Pressure? J. Clin. Med. 2018, 7, 316. [Google Scholar] [CrossRef] [Green Version]
- Aguirre, N.; Grall-Maës, E.; Cymberknop, L.; Armentano, R. Blood pressure morphology assessment from photoplethysmogram and demographic information using deep learning with attention mechanism. Sensors 2021, 21, 2167. [Google Scholar] [CrossRef]
- Athaya, T.; Choi, S. An estimation method of continuous non-invasive arterial blood pressure waveform using photoplethysmography: A U-Net architecture-based approach. Sensors 2021, 21, 1867. [Google Scholar] [CrossRef]
- Liang, Y.; Chen, Z.; Ward, R.; Elgendi, M. Photoplethysmography and deep learning: Enhancing hypertension risk stratification. Biosensors 2018, 8, 101. [Google Scholar] [CrossRef] [Green Version]
- Makarem, N.; Shechter, A.; Carnethon, M.; Mullington, J.M.; Hall, M.H.; Abdalla, M. Sleep duration and blood pressure: Recent advances and future directions. Curr. Hypertens. Rep. 2019, 21, 1–12. [Google Scholar] [CrossRef] [PubMed]
- Whelton, P.K.; Carey, R.M.; Aronow, W.S.; Casey, D.E.; Collins, K.J.; Dennison Himmelfarb, C.; DePalma, S.M.; Gidding, S.; Jamerson, K.A.; Jones, D.W.; et al. 2017 ACC/AHA/AAPA/ABC/ACPM/AGS/APhA/ASH/ASPC/NMA/PCNA guideline for the prevention, detection, evaluation, and management of high blood pressure in adults: A report of the American College of Cardiology/American Heart Association Task Force on Clinical Practice Guidelines. J. Am. Coll. Cardiol. 2018, 71, e127–e248. [Google Scholar] [PubMed]
- Maqsood, S.; Xu, S.; Springer, M.; Mohawesh, R. A Benchmark Study of Machine Learning for Analysis of Signal Feature Extraction Techniques for Blood Pressure Estimation Using Photoplethysmography (PPG). IEEE Access 2021, 9, 138817–138833. [Google Scholar] [CrossRef]
- Wang, L.; Zhou, W.; Xing, Y.; Zhou, X. A novel neural network model for blood pressure estimation using photoplethesmography without electrocardiogram. J. Healthc. Eng. 2018, 2018, 1–9. [Google Scholar] [CrossRef]
- Pandey, R.K.; Lin, T.-Y.; Chao, P.C.-P. Design and implementation of a photoplethysmography acquisition system with an optimized artificial neural network for accurate blood pressure measurement. Microsyst. Technol. 2021, 27, 2345–2367. [Google Scholar] [CrossRef]
- Wu, J.; Liang, H.; Ding, C.; Huang, X.; Huang, J.; Peng, Q. Improving the Accuracy in Classification of Blood Pressure from Photoplethysmography Using Continuous Wavelet Transform and Deep Learning. Int. J. Hypertens. 2021, 2021, 1–9. [Google Scholar] [CrossRef]
- Kachuee, M.; Kiani, M.M.; Mohammadzade, H.; Shabany, M. Cuffless blood pressure estimation algorithms for continuous health-care monitoring. IEEE Trans. Biomed. Eng. 2016, 64, 859–869. [Google Scholar] [CrossRef]
- Esmaelpoor, J.; Moradi, M.H.; Kadkhodamohammadi, A. A multistage deep neural network model for blood pressure estimation using photoplethysmogram signals. Comput. Biol. Med. 2020, 120, 103719. [Google Scholar] [CrossRef]
- Mottaghi, S.; Moradi, M.; Roohisefat, L. Cuffless blood pressure estimation during exercise stress test. Int. J. Biosci. Biochem. Bioinform. 2012, 2, 394. [Google Scholar] [CrossRef] [Green Version]
- Yang, S.; Morgan, S.P.; Cho, S.-Y.; Correia, R.; Wen, L.; Zhang, Y. Non-invasive cuff-less blood pressure machine learning algorithm using photoplethysmography and prior physiological data. Blood Press. Monit. 2021, 26, 312–320. [Google Scholar] [CrossRef]
- Seeger, M. Gaussian processes for machine learning. Int. J. Neural Syst. 2004, 14, 69–106. [Google Scholar] [CrossRef] [PubMed] [Green Version]
- Hsiu, H.; Hsu, C.L.; Chen, C.T.; Hsu, W.C.; Hu, H.F.; Chen, F.C. Correlation of harmonic components between the blood pressure and photoplethysmography waveforms following local-heating stimulation. Int. J. Biosci. Biochem. Bioinform. 2012, 2, 248. [Google Scholar] [CrossRef]
- Hsiu, H.; Huang, S.-M.; Hsu, C.-L.; Hu, S.-F.; Lin, H.-W. Effects of cold stimulation on the harmonic structure of the blood pressure and photoplethysmography waveforms. Photomed. Laser Surg. 2012, 30, 77–84. [Google Scholar] [CrossRef] [PubMed]
- Boonya-Ananta, T.; Rodriguez, A.J.; Ajmal, A.; Du Le, V.N.; Hansen, A.K.; Hutcheson, J.D.; Ramella-Roman, J.C. Synthetic photoplethysmography (PPG) of the radial artery through parallelized Monte Carlo and its correlation to body mass index (BMI). Sci. Rep. 2021, 11, 1–11. [Google Scholar]
- Chowienczyk, P.; Kelly, R.P.; MacCallum, H.; Millasseau, S.C.; Andersson, T.L.; Gosling, R.G.; Ritter, J.M.; Änggård, E.E. Photoplethysmographic assessment of pulse wave reflection: Blunted response to endothelium-dependent beta2-adrenergic vasodilation in type II diabetes mellitus. J. Am. Coll. Cardiol. 1999, 34, 2007–2014. [Google Scholar] [CrossRef] [Green Version]
- Li, K.; Zhang, S.; Yang, L.; Chi, Z.; Wang, A.; Yang, Y.; Li, X.; Hao, D.; Zhang, L.; Zheng, D. Changes of arterial pulse waveform characteristics with gestational age during normal pregnancy. Sci. Rep. 2018, 8, 1–8. [Google Scholar] [CrossRef] [Green Version]
- Yang, Y.; Seok, H.; Noh, G.; Choi, B.; Shin, H. Postoperative pain assessment indices based on photoplethysmography waveform analysis. Front. Physiol. 2018, 9, 1199. [Google Scholar] [CrossRef]
- Rong, M.; Li, K. A multi-type features fusion neural network for blood pressure prediction based on photoplethysmography. Biomed. Signal Process. Control 2021, 68, 102772. [Google Scholar] [CrossRef]
- Arathy, R.; Nabeel, P.M.; Joseph, J.; Sivaprakasam, M. Accelerometric patch probe for cuffless blood pressure evaluation from carotid local pulse wave velocity: Design, development, and in vivo experimental study. Biomed. Phys. Eng. Express 2019, 5, 045010. [Google Scholar] [CrossRef]
- Nabeel, P.; Jayaraj, J.; Mohanasankar, S. Single-source PPG-based local pulse wave velocity measurement: A potential cuffless blood pressure estimation technique. Physiol. Meas. 2017, 38, 2122. [Google Scholar] [CrossRef]
- Ding, X.-R.; Zhang, Y.-T.; Liu, J.; Dai, W.-X.; Tsang, H.K. Continuous cuffless blood pressure estimation using pulse transit time and photoplethysmogram intensity ratio. IEEE Trans. Biomed. Eng. 2015, 63, 964–972. [Google Scholar] [CrossRef]
- Mousavi, S.S.; Firouzmand, M.; Charmi, M.; Hemmati, M.; Moghadam, M.; Ghorbani, Y. Blood pressure estimation from appropriate and inappropriate PPG signals using A whole-based method. Biomed. Signal Process. Control 2019, 47, 196–206. [Google Scholar] [CrossRef]
- Lin, W.-H.; Chen, F.; Geng, Y.; Ji, N.; Fang, P.; Li, G. Towards accurate estimation of cuffless and continuous blood pressure using multi-order derivative and multivariate photoplethysmogram features. Biomed. Signal Process. Control 2021, 63, 102198. [Google Scholar] [CrossRef]
- Wang, G.; Atef, M.; Lian, Y. Towards a continuous non-invasive cuffless blood pressure monitoring system using PPG: Systems and circuits review. IEEE Circuits Syst. Mag. 2018, 18, 6–26. [Google Scholar] [CrossRef]
- Slapničar, G.; Luštrek, M.; Marinko, M. Continuous blood pressure estimation from PPG signal. Informatica 2018, 42, 33–42. [Google Scholar]
- Franklin, S.S.; Wong, G., 4th; Wong, N.D.; Larson, M.G.; Weber, M.A.; Kannel, W.B.; Levy, D. Hemodynamic patterns of age-related changes in blood pressure: The Framingham Heart Study. Circulation 1997, 96, 308–315. [Google Scholar] [CrossRef] [Green Version]
- Simjanoska, M.; Gjoreski, M.; Gams, M.; Bogdanova, A.M. Non-invasive blood pressure estimation from ECG using machine learning techniques. Sensors 2018, 18, 1160. [Google Scholar] [CrossRef] [Green Version]
- O’Brien, E.; Petrie, J.; Littler, W.; de Swiet, M.; Padfield, P.L.; O’Malley, K.; Jamieson, M.; Altman, D.; Bland, M.; Atkins, N. The British Hypertension Society protocol for the evaluation of blood pressure measuring devices. J. Hypertens. 1993, 11 (Suppl. 2), S43–S62. [Google Scholar]
- Stergiou, G.S.; Alpert, B.; Mieke, S.; Asmar, R.; Atkins, N.; Eckert, S.; Frick, G.; Friedman, B.; Graßl, T.; Ichikawa, T.; et al. A universal standard for the validation of blood pressure measuring devices: Association for the Advancement of Medical Instrumentation/European Society of Hypertension/International Organization for Standardization (AAMI/ESH/ISO) Collaboration Statement. Hypertension 2018, 71, 368–374. [Google Scholar] [CrossRef]
- Baek, H.J.; Shin, J.; Cho, J. The effect of optical crosstalk on accuracy of reflectance-type pulse oximeter for mobile healthcare. J. Healthc. Eng. 2018, 2018, 1–8. [Google Scholar] [CrossRef] [Green Version]
- JCS Joint Working Group. Guidelines for the clinical use of 24 hour ambulatory blood pressure monitoring (ABPM)(JCS 2010). Circ. J. 2012, 76, 508–519. [Google Scholar] [CrossRef] [PubMed] [Green Version]
- Hermida, R.C.; Smolensky, M.H.; Ayala, D.E.; Portaluppi, F.; Crespo, J.J.; Fabbian, F.; Haus, E.; Manfredini, R.; Mojón, A.; Moyá, A.; et al. 2013 Ambulatory blood pressure monitoring recommendations for the diagnosis of adult hypertension, assessment of cardiovascular and other hypertension-associated risk, and attainment of therapeutic goals: Joint recommendations from the International Society for Chronobiology (ISC), American Association of Medical Chronobiology and Chronotherapeutics (AAMCC), Spanish Society of Applied Chronobiology, Chronotherapy, and Vascular Risk (SECAC), Spanish Society of Atherosclerosis (SEA), and Romanian Society of Internal Medicine (RSIM). Chronobiol. Int. 2013, 30, 355–410. [Google Scholar] [PubMed]
- Zheng, Y.-L.; Yan, B.P.; Zhang, Y.; Poon, C.C.Y. An armband wearable device for overnight and cuff-less blood pressure measurement. IEEE Trans. Biomed. Eng. 2014, 61, 2179–2186. [Google Scholar] [CrossRef] [PubMed]
- Verdecchia, P.; Angeli, F.; Borgioni, C.; Gattobigio, R.; Reboldi, G. Ambulatory blood pressure and cardiovascular outcome in relation to perceived sleep deprivation. Hypertension 2007, 49, 777–783. [Google Scholar] [CrossRef] [Green Version]
- Arunkumar, K.; Bhaskar, M. CASINOR: Combination of adaptive filters using single noise reference signal for heart rate estimation from PPG signals. Signal Image Video Process. 2020, 14, 1507–1515. [Google Scholar] [CrossRef]
- Dong, Y.; Li, X.; Dezert, J.; Zhou, R.; Zhu, C.; Ge, S.S. Multi-Criteria Analysis of Sensor Reliability for Wearable Human Activity Recognition. IEEE Sens. J. 2021, 21, 19144–19156. [Google Scholar] [CrossRef]
- Bent, B.; Goldstein, B.A.; Kibbe, W.A.; Dunn, J.P. Investigating sources of inaccuracy in wearable optical heart rate sensors. NPJ Digit. Med. 2020, 3, 1–9. [Google Scholar] [CrossRef] [Green Version]
- Xing, X.; Sun, M. Optical blood pressure estimation with photoplethysmography and FFT-based neural networks. Biomed. Opt. Express 2016, 7, 3007–3020. [Google Scholar] [CrossRef] [Green Version]
- Mitchell, G.F.; Parise, H.; Benjamin, E.J.; Larson, M.G.; Keyes, M.J.; Vita, J.A.; Vasan, R.S.; Levy, D. Changes in arterial stiffness and wave reflection with advancing age in healthy men and women: The Framingham Heart Study. Hypertension 2004, 43, 1239–1245. [Google Scholar] [CrossRef] [Green Version]
- Shapiro, S.S.; Wilk, M.B. An analysis of variance test for normality (complete samples). Biometrika 1965, 52, 591–611. [Google Scholar] [CrossRef]
- O’Brien, E.; Mee, F.; Atkins, N.; Thomas, P. Evaluation of three devices for self-measurement of blood pressure according to the revised British Hypertension Society Protocol: The Omron HEM-705CP, Philips HP5332, and Nissei DS-175. Blood Press. Monit. 1996, 1, 55–61. [Google Scholar] [PubMed]
- Staessen, J.A.; Fagard, R.; Thijs, L.; Amery, A. A consensus view on the technique of ambulatory blood pressure monitoring. Hypertension 1995, 26, 912–918. [Google Scholar] [CrossRef] [PubMed]
- Dörr, M.; Weber, S.; Birkemeyer, R.; Leonardi, L.; Winterhalder, C.; Raichle, C.J.; Brasier, N.; Burkard, T.; Eckstein, J. iPhone App compared with standard blood pressure measurement–The iPARR trial. Am. Heart J. 2021, 233, 102–108. [Google Scholar] [CrossRef] [PubMed]


| Criterion | Details |
|---|---|
| Age | ≥18 years (males and females). |
| Document | Willing to voluntarily sign the study-specific informed consent form. |
| History | No previous percutaneous coronary intervention, coronary artery bypass graft, abdominal aortic aneurysm, peripheral vascular disease, aortic stenosis, arrhythmia, tremors (before or during procedure), diabetes, kidney disease, or carotid bruits. |
| Clinical trial setting | SBP ranged from 80 mmHg to 250 mmHg and DBP ranged from 40 mmHg to 150 mmHg. |
| In a controlled laboratory environment, with constant temperature, pressure, and silence ensured. |
| Item | PPG Morphological Characteristic Parameter | Personal Information Parameter | ||
|---|---|---|---|---|
| PPG Waveform Parameter | PPG Time-Related Parameter (Unit: s) | |||
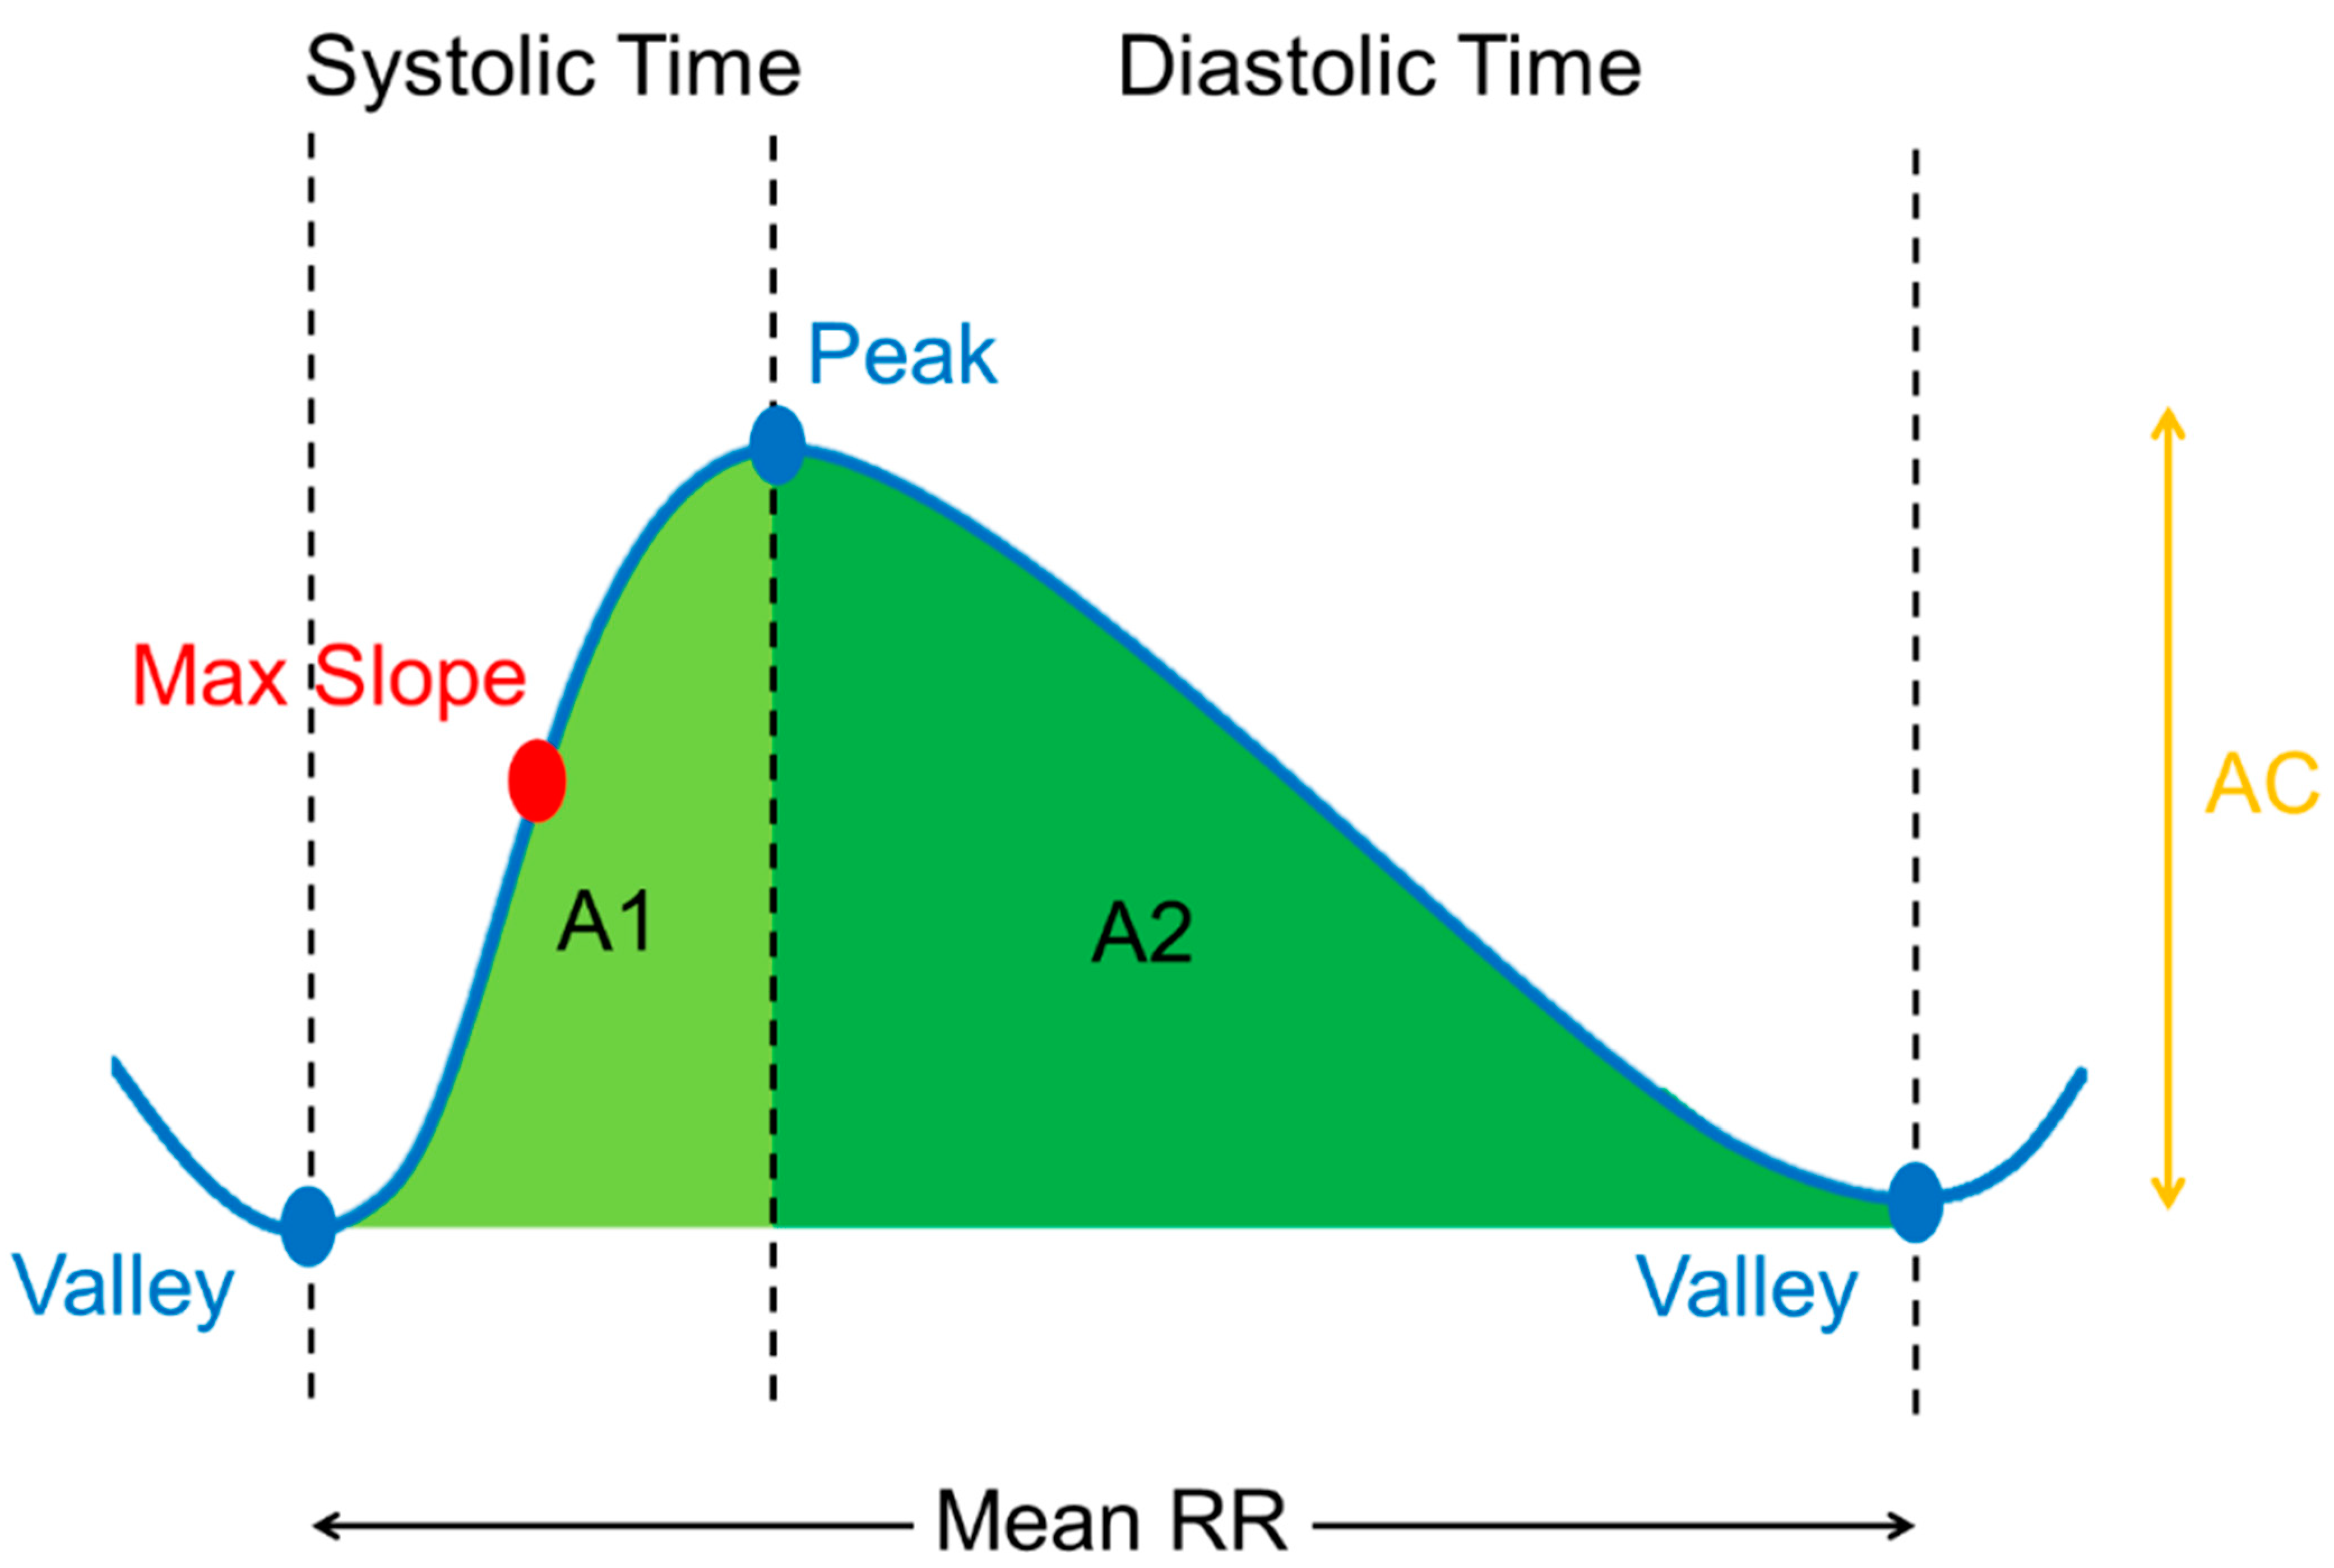
| Without Calibration | A1/(A1 + A2) A2/(A1 + A2) A1/AC A2/AC Max Slope | Systolic Time Diastolic Time Mean RR | Real | |
| Age (y/o) Gender (0 or 1) | ||||
| With Calibration | A1/(A1 + A2) A2/(A1 + A2) A1/AC A2/AC Max Slope | Systolic Time Diastolic Time Mean RR | Real (For initial use) | Optimized |
| SBP (mmHg) DBP (mmHg) | Age (y/o) Gender (0 or 1) | |||
| Blood Pressure | SBP | DBP | ||||||||
|---|---|---|---|---|---|---|---|---|---|---|
| Model | r | ≤5 (%) | ≤10 (%) | ≤15 (%) | ΔBP (mmHg) | r | ≤5 (%) | ≤10 (%) | ≤15 (%) | ΔBP (mmHg) |
| Exponential GPR (this study) | 0.44 *** | 27.131 (D) | 56.072 (D) | 67.441 (D) | −0.716 ± 15.5851 | 0.31 *** | 35.401 (D) | 55.814 (D) | 77.261 (D) | −0.869 ± 12.6172 |
| Bagged Trees | 0.43 *** | 32.041 (D) | 53.746 (D) | 71.576 (D) | 3.141 ± 14.9823 | 0.23 *** | 32.041 (D) | 58.914 (D) | 77.002 (D) | 1.846 ± 12.2447 |
| Boosted Trees | 0.43 *** | 25.581 (D) | 50.387 (D) | 67.441 (D) | 1.145 ± 16.1572 | 0.28 *** | 30.491 (D) | 55.038 (D) | 77.519 (D) | −1.328 ± 12.4168 |
| Coarse Gaussian SVM | 0.40 *** | 20.930 (D) | 44.702 (D) | 57.622 (D) | −3.328 ± 19.2503 | 0.25 *** | 34.366 (D) | 60.465 (D) | 77.519 (D) | −1.964 ± 12.4512 |
| Coarse Tree | 0.37 *** | 25.581 (D) | 50.387 (D) | 70.801 (D) | −1.402 ± 15.0477 | 0.18 *** | 35.142 (D) | 64.082 (D) | 81.657 (D) | 1.782 ± 11.6775 |
| Cubic SVM | 0.32 *** | 22.222 (D) | 43.152 (D) | 62.015 (D) | −1.943 ± 18.1104 | 0.21 *** | 28.423 (D) | 50.129 (D) | 72.35 4(D) | −1.015 ± 13.7282 |
| Fine Gaussian SVM | 0.30 *** | 20.413 (D) | 46.511 (D) | 66.149 (D) | −2.324 ± 16.3242 | 0.24 *** | 30.232 (D) | 51.938 (D) | 73.901 (D) | −0.801 ± 14.0499 |
| Fine Tree | 0.28 *** | 23.772 (D) | 45.219 (D) | 68.733 (D) | −1.861 ± 16.5967 | 0.21 *** | 33.333 (D) | 59.173 (D) | 77.261 (D) | −1.869 ± 12.6172 |
| Interactions Linear | 0.39 *** | 17.312 (D) | 40.051 (D) | 58.656 (D) | −5.003 ± 17.5311 | 0.28 *** | 19.638 (D) | 42.118 (D) | 64.599 (D) | −1.835 ± 16.0832 |
| Linear | 0.31 *** | 23.772 (D) | 50.646 (D) | 68.992 (D) | 1.746 ± 20.0023 | 0.18 *** | 33.850 (D) | 61.757 (D) | 78.553 (D) | 1.508 ± 12.0335 |
| Linear SVM | 0.32 *** | 23.255 (D) | 47.803 (D) | 66.667 (D) | −1.068 ± 16.0259 | 0.21 *** | 32.558 (D) | 60.981 (D) | 79.586 (D) | 1.221 ± 12.7356 |
| Matern5/2 GPR | 0.43 *** | 24.031 (D) | 51.938 (D) | 71.317 (D) | 1.345 ± 15.6983 | 0.30 *** | 32.041 (D) | 62.532 (D) | 81.395 (D) | 2.237± 12.549 |
| Medium Gaussian SVM | 0.47 *** | 21.705 (D) | 44.444 (D) | 64.857 (D) | −1.943 ± 17.5536 | 0.30 *** | 33.333 (D) | 58.139 (D) | 77.519 (D) | −1.877 ± 12.8238 |
| Medium Tree | 0.34 *** | 22.739 (D) | 41.860 (D) | 63.307 (D) | −2.063 ± 18.2236 | 0.14 *** | 25.839 (D) | 46.253 (D) | 69.251 (D) | −1.018 ± 14.9782 |
| Quadratic SVM | 0.44 *** | 25.581 (D) | 47.028 (D) | 66.149 (D) | −1.875 ± 15.978 | 0.29 *** | 36.692 (D) | 61.498 (D) | 78.294 (D) | −1.325 ± 11.6168 |
| Rational Quadratic GPR | 0.43 *** | 20.413 (D) | 41.860 (D) | 60.465 (D) | −4.198 ± 17.2031 | 0.31 *** | 32.816 (D) | 59.431 (D) | 77.002 (D) | −1.838 ± 12.7787 |
| Robust Linear | 0.32 *** | 24.547 (D) | 53.488 (D) | 72.351 (D) | 1.496 ± 15.1054 | 0.19 *** | 32.816 (D) | 60.465 (D) | 79.586 (D) | 1.279 ± 12.7838 |
| Squared Exponential GPR | 0.41 *** | 24.806 (D) | 45.736 (D) | 63.824 (D) | −1.344 ± 15.9769 | 0.32 *** | 32.041 (D) | 58.139 (D) | 76.227 (D) | −1.883 ± 12.9418 |
| Stepwise Linear | 0.40 *** | 25.323 (D) | 47.545 (D) | 67.183 (D) | −1.587 ± 16.163 | 0.26 *** | 33.333 (D) | 60.206 (D) | 79.069 (D) | 1.587 ± 12.2077 |
| Gaussian Mixture Model | 0.17 ** | 4.333 (D) | 11.333 (D) | 16.676 (D) | −21.937± 38.1851 | 0.12 * | 13.000 (D) | 21.000 (D) | 35.672 (D) | −17.211± 30.0149 |
| Exponential GPR Model | Without Calibration | With Calibration | |||||||
|---|---|---|---|---|---|---|---|---|---|
| Total Mode | ≤5 (%) | ≤10 (%) | ≤15 (%) | ΔBP (mmHg) | ≤5 (%) | ≤10 (%) | ≤15 (%) | ΔBP (mmHg) | |
| DBP | 37.936 (D) | 63.637 (D) | 78.072 (D) | 0.5539 ± 7.8138 | 60.723 (A) | 88.372 (A) | 98.191 (A) | −0.3846 ± 6.3688 | |
| SBP | 37.421 (D) | 58.379 (D) | 70.974 (D) | −0.1809 ± 10.7177 | 71.834 (A) | 96.382 (A) | 99.225 (A) | −0.1776 ± 4.7361 | |
| Interval Mode | ≤5 (%) | ≤10 (%) | ≤15 (%) | ΔBP (mmHg) | ≤5 (%) | ≤10 (%) | ≤15 (%) | ΔBP (mmHg) | |
| DBP | hypotension <60 | 16.667 (D) | 33.333 (D) | 60.000 (D) | −12.5832 ± 5.5526 | 50.000 (B) | 80.000 (B) | 100.000 (A) | −7.5400 ± 3.7221 |
| normotension 60–79 | 39.891 (D) | 65.295 (C) | 78.689 (D) | −7.5627 ± 6.8504 | 65.027 (A) | 89.617 (A) | 97.814 (A) | −3.9673 ± 4.7367 | |
| hypertension ≥80 | 29.101 (D) | 58.201 (D) | 77.249 (D) | 6.5413 ± 9.9935 | 59.788 (B) | 87.831 (A) | 98.413 (A) | 3.6523 ± 5.2502 | |
| SBP | hypotension <90 | 20.000 (D) | 33.333 (D) | 66.667 (D) | −11.1238 ± 3.6607 | 53.333 (B) | 100.000 (A) | 100.000 (A) | −5.5844 ± 2.3086 |
| normotension 90–129 | 40.621 (C) | 61.136 (D) | 72.348 (D) | −4.6248 ± 9.9551 | 73.863 (A) | 98.482 (A) | 100.000 (A) | −1.5600 ± 3.9808 | |
| hypertension ≥130 | 20.000 (D) | 42.500 (D) | 56.667 (D) | 8.1414 ± 12.3490 | 68.333 (A) | 91.674 (A) | 97.501 (A) | 2.9987 ± 4.7528 | |
Publisher’s Note: MDPI stays neutral with regard to jurisdictional claims in published maps and institutional affiliations. |
© 2022 by the authors. Licensee MDPI, Basel, Switzerland. This article is an open access article distributed under the terms and conditions of the Creative Commons Attribution (CC BY) license (https://creativecommons.org/licenses/by/4.0/).
Share and Cite
Chen, J.-W.; Huang, H.-K.; Fang, Y.-T.; Lin, Y.-T.; Li, S.-Z.; Chen, B.-W.; Lo, Y.-C.; Chen, P.-C.; Wang, C.-F.; Chen, Y.-Y. A Data-Driven Model with Feedback Calibration Embedded Blood Pressure Estimator Using Reflective Photoplethysmography. Sensors 2022, 22, 1873. https://doi.org/10.3390/s22051873
Chen J-W, Huang H-K, Fang Y-T, Lin Y-T, Li S-Z, Chen B-W, Lo Y-C, Chen P-C, Wang C-F, Chen Y-Y. A Data-Driven Model with Feedback Calibration Embedded Blood Pressure Estimator Using Reflective Photoplethysmography. Sensors. 2022; 22(5):1873. https://doi.org/10.3390/s22051873
Chicago/Turabian StyleChen, Jia-Wei, Hsin-Kai Huang, Yu-Ting Fang, Yen-Ting Lin, Shih-Zhang Li, Bo-Wei Chen, Yu-Chun Lo, Po-Chuan Chen, Ching-Fu Wang, and You-Yin Chen. 2022. "A Data-Driven Model with Feedback Calibration Embedded Blood Pressure Estimator Using Reflective Photoplethysmography" Sensors 22, no. 5: 1873. https://doi.org/10.3390/s22051873