
A Novel Approach to Dining Bowl Reconstruction for Image-Based Food Volume Estimation

 , , , ,
  ,
,
Abstract
:1. Introduction
2. Methods
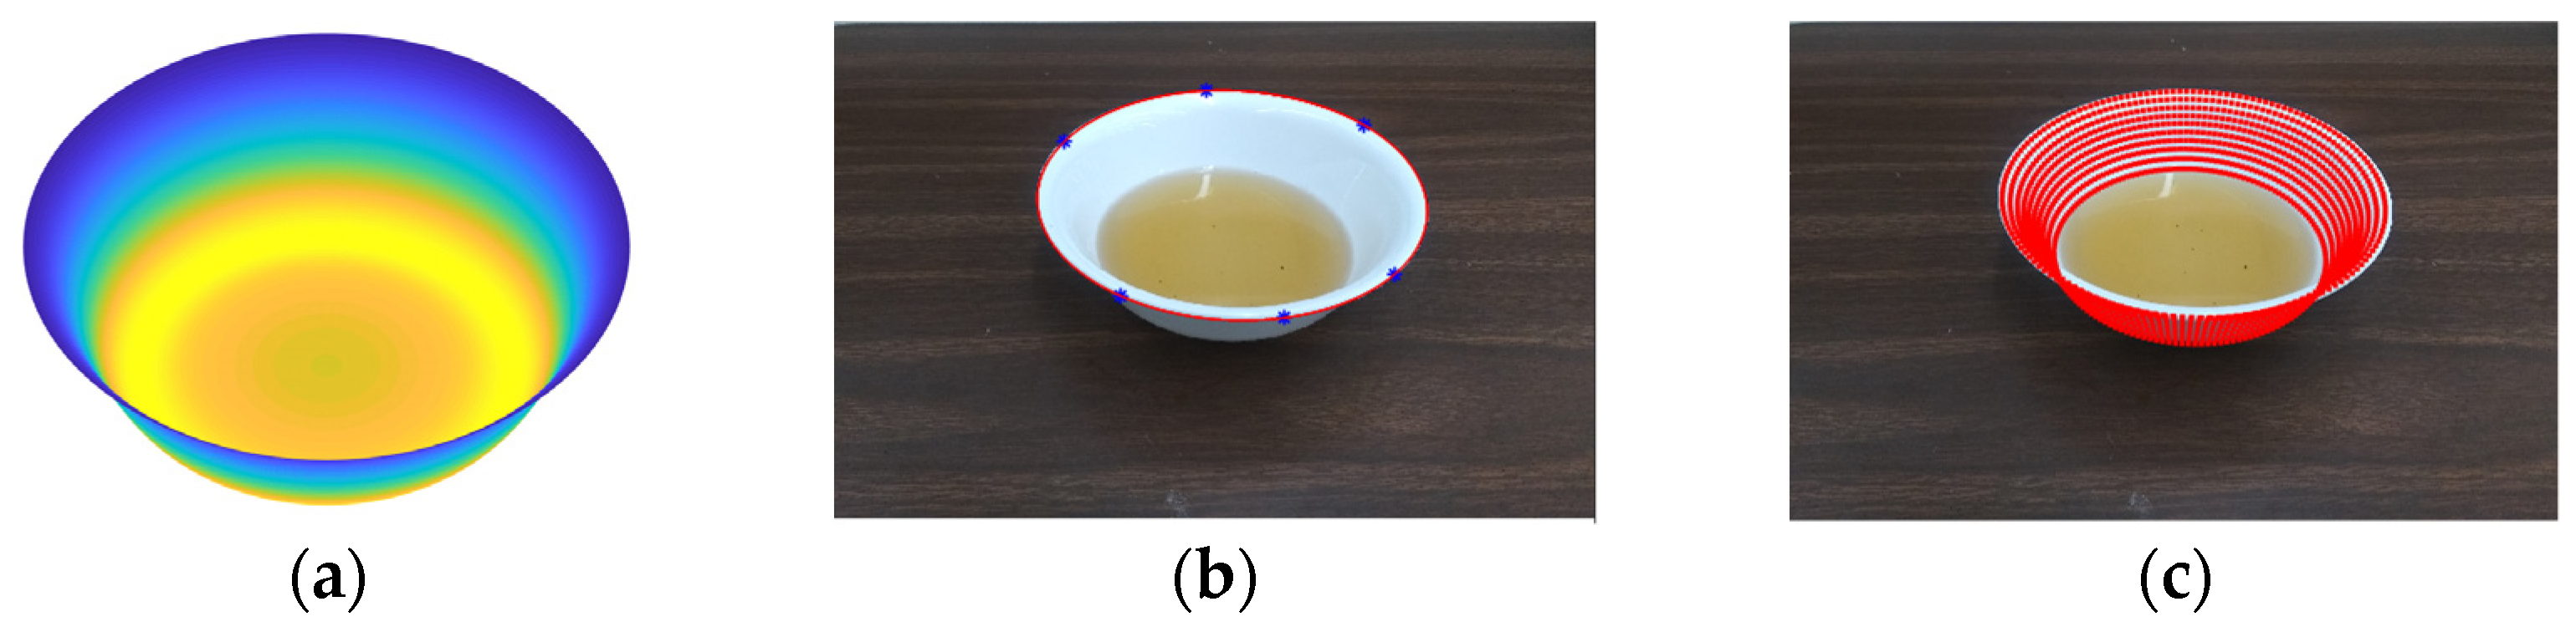
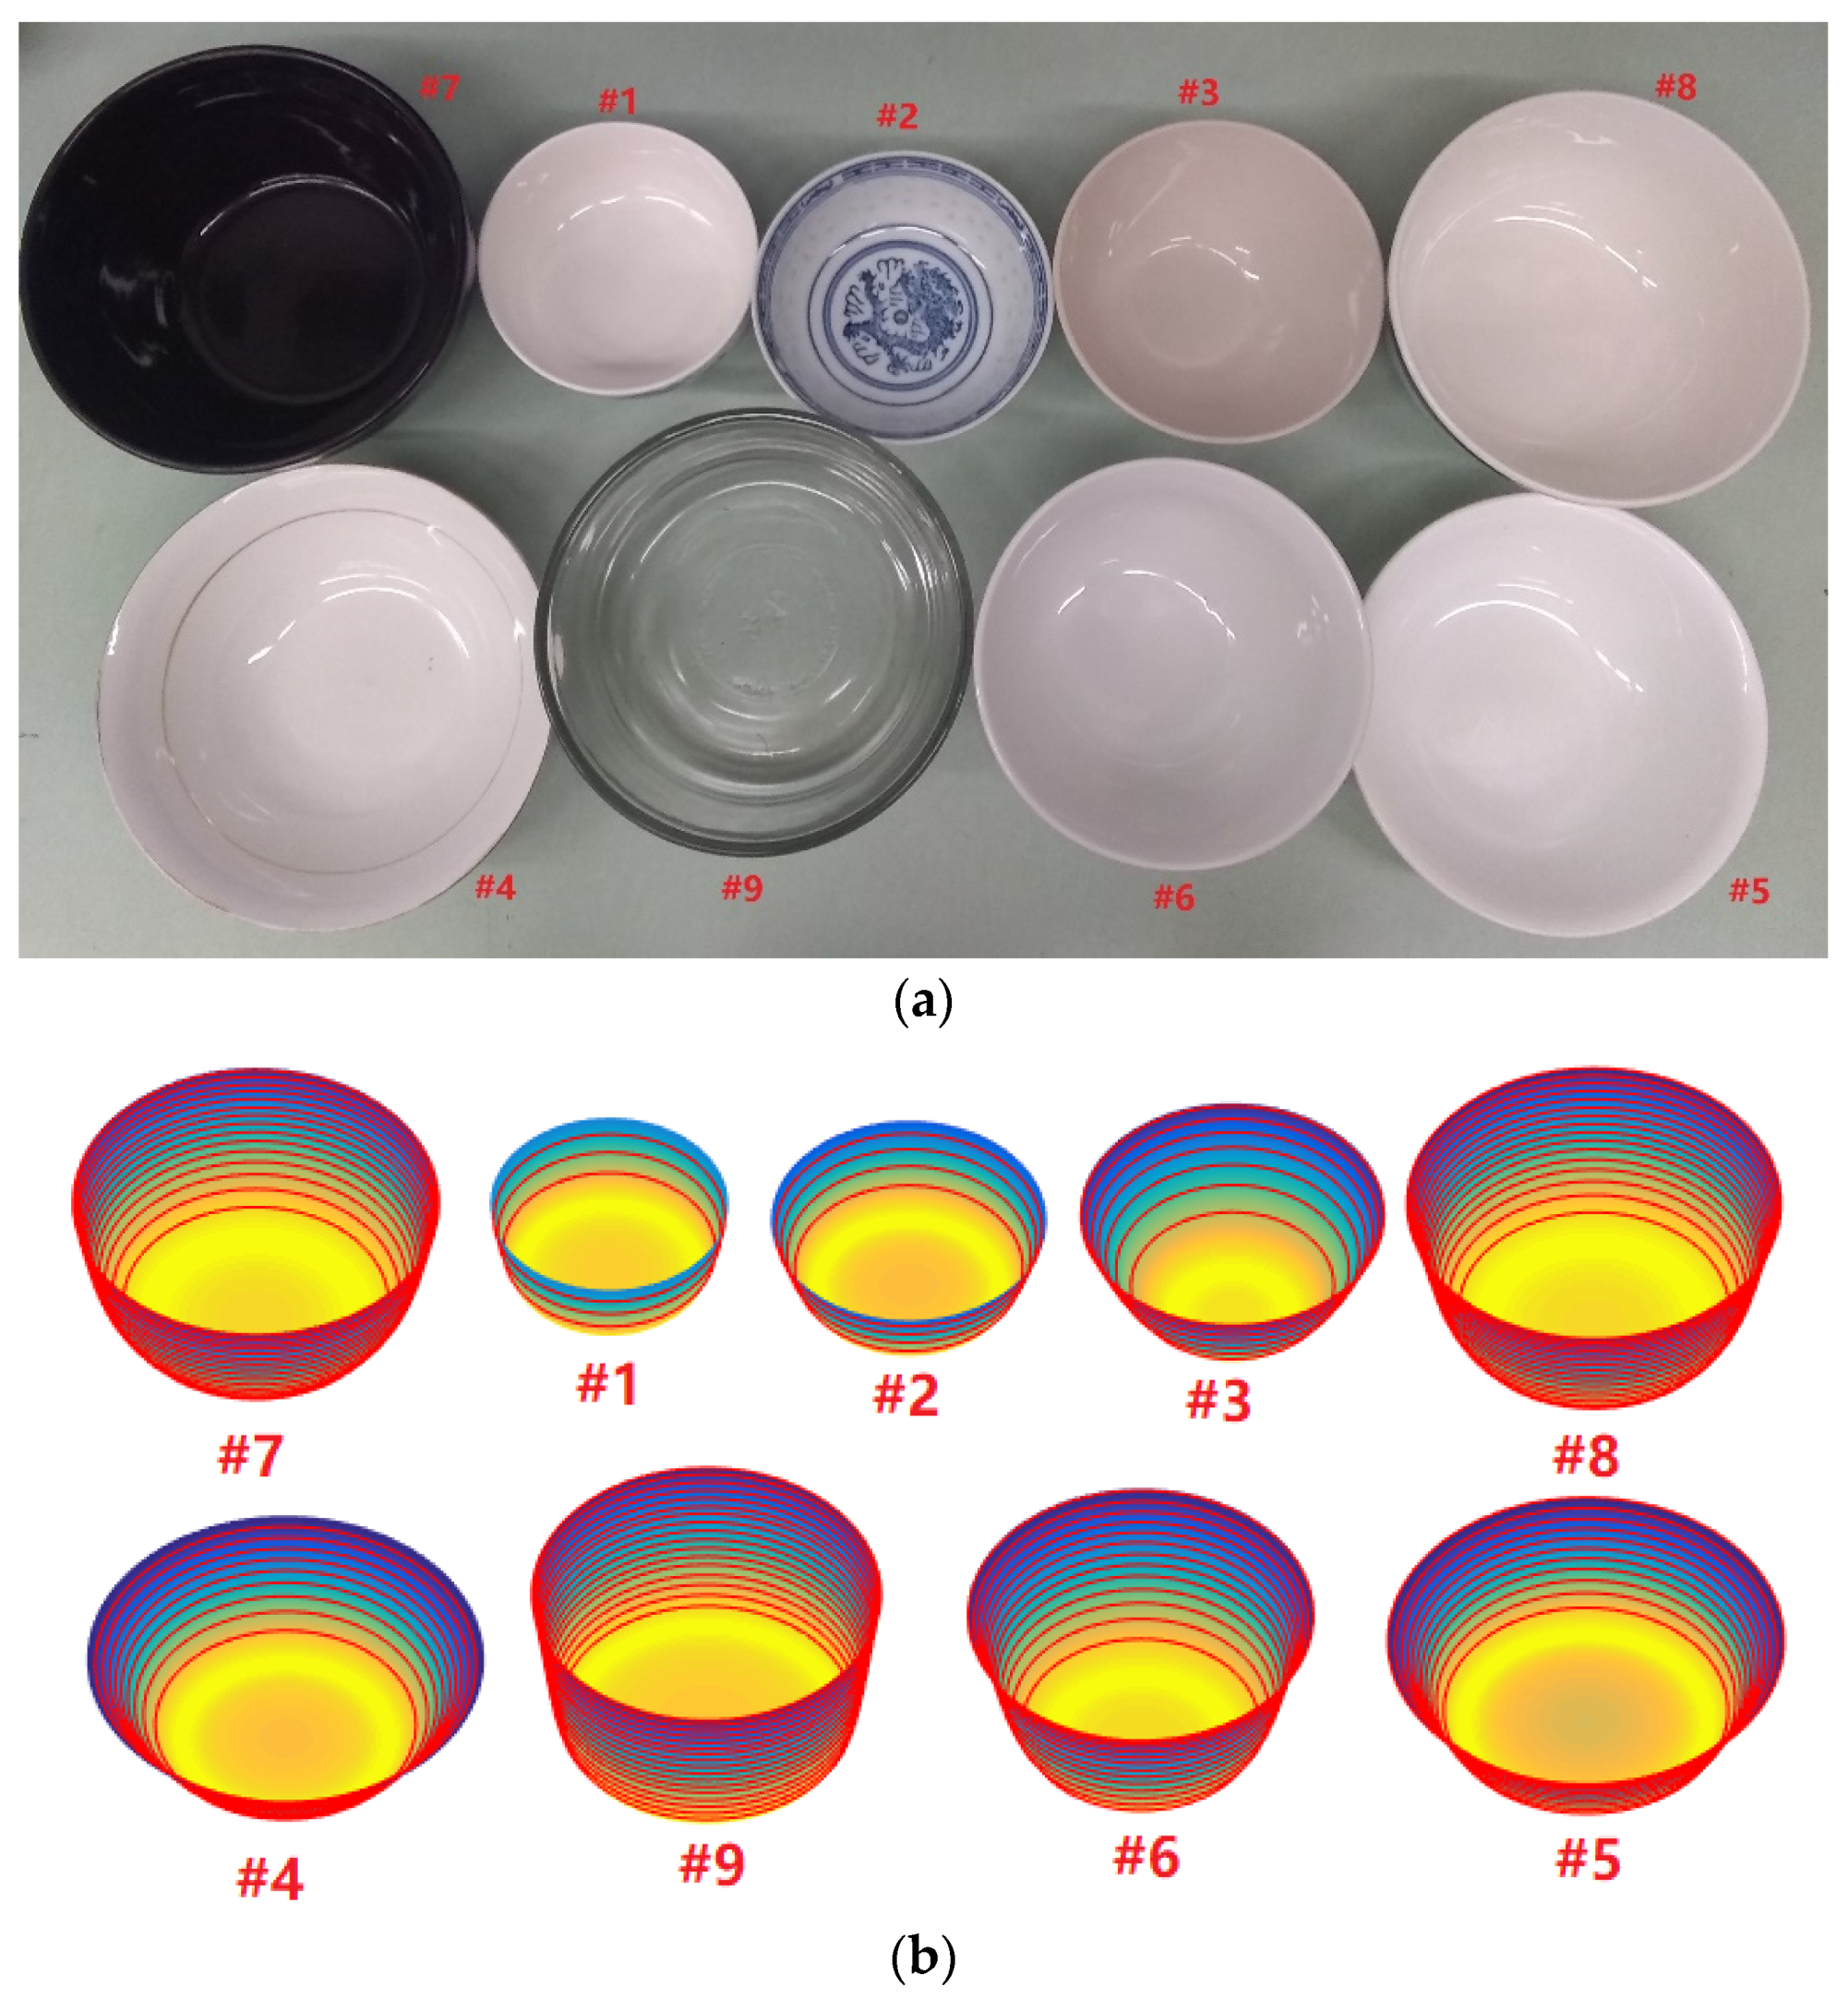
2.1. 3D Reconstruction of the Bowl
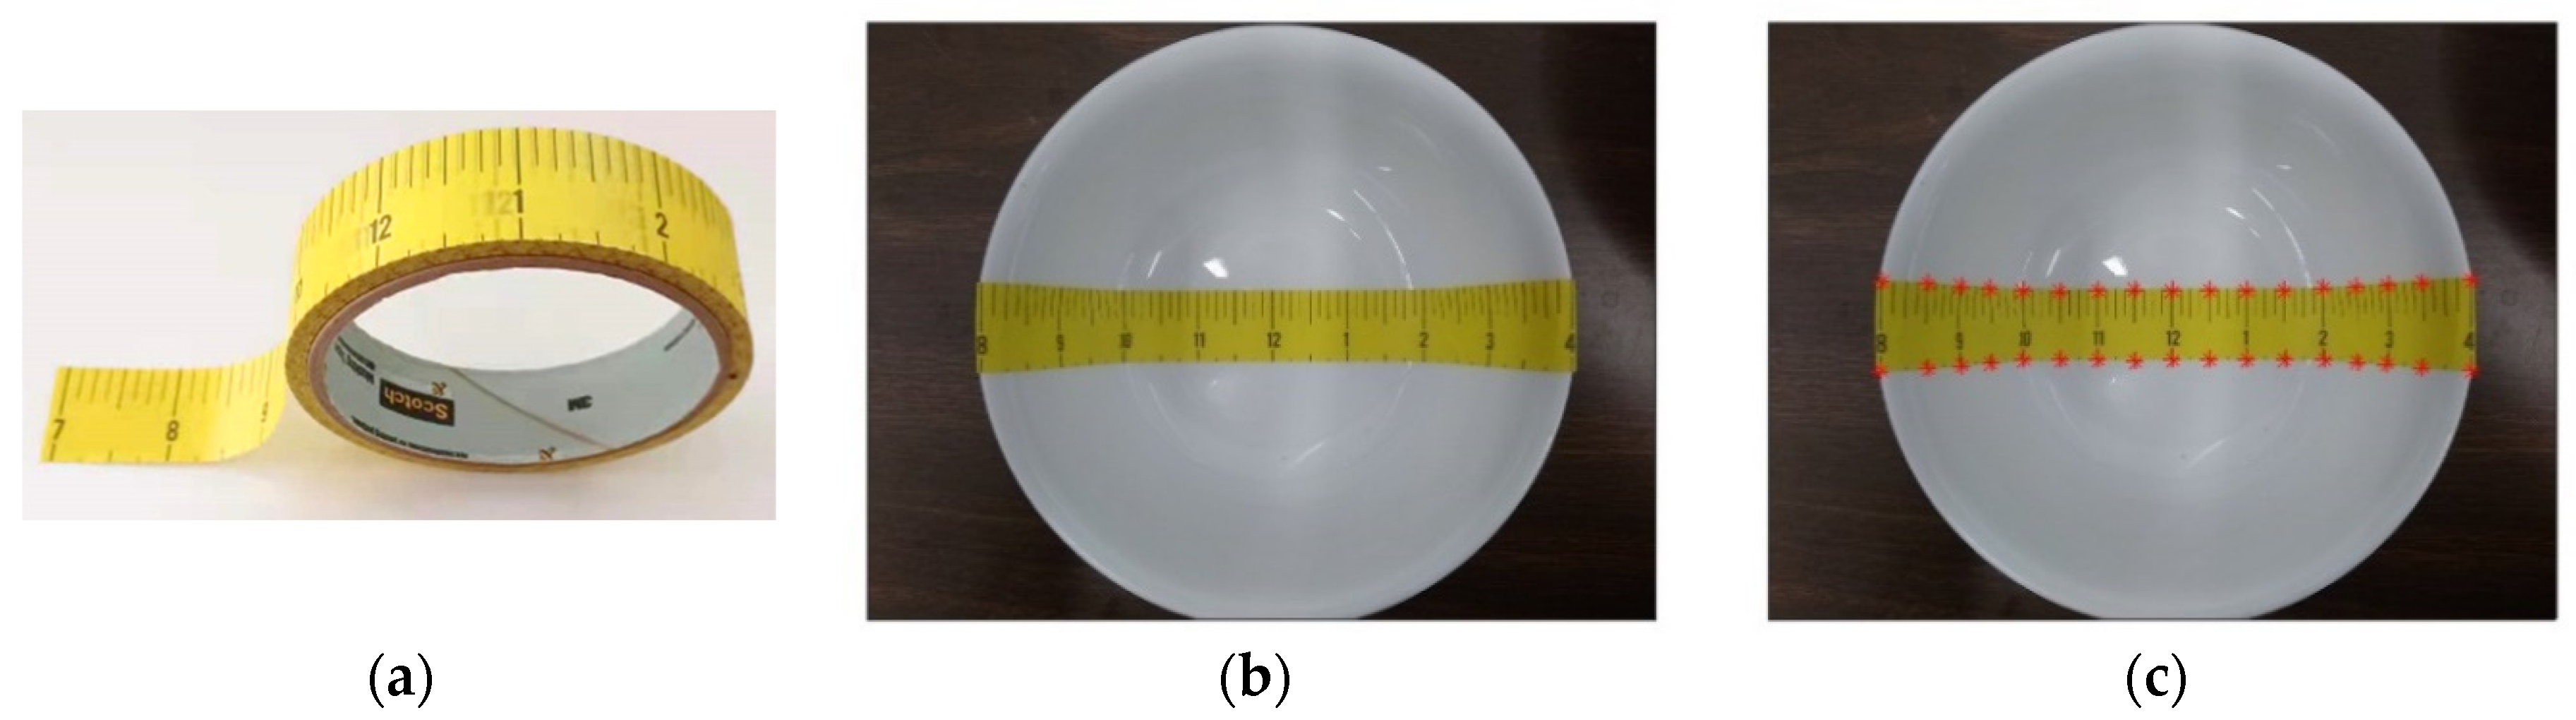
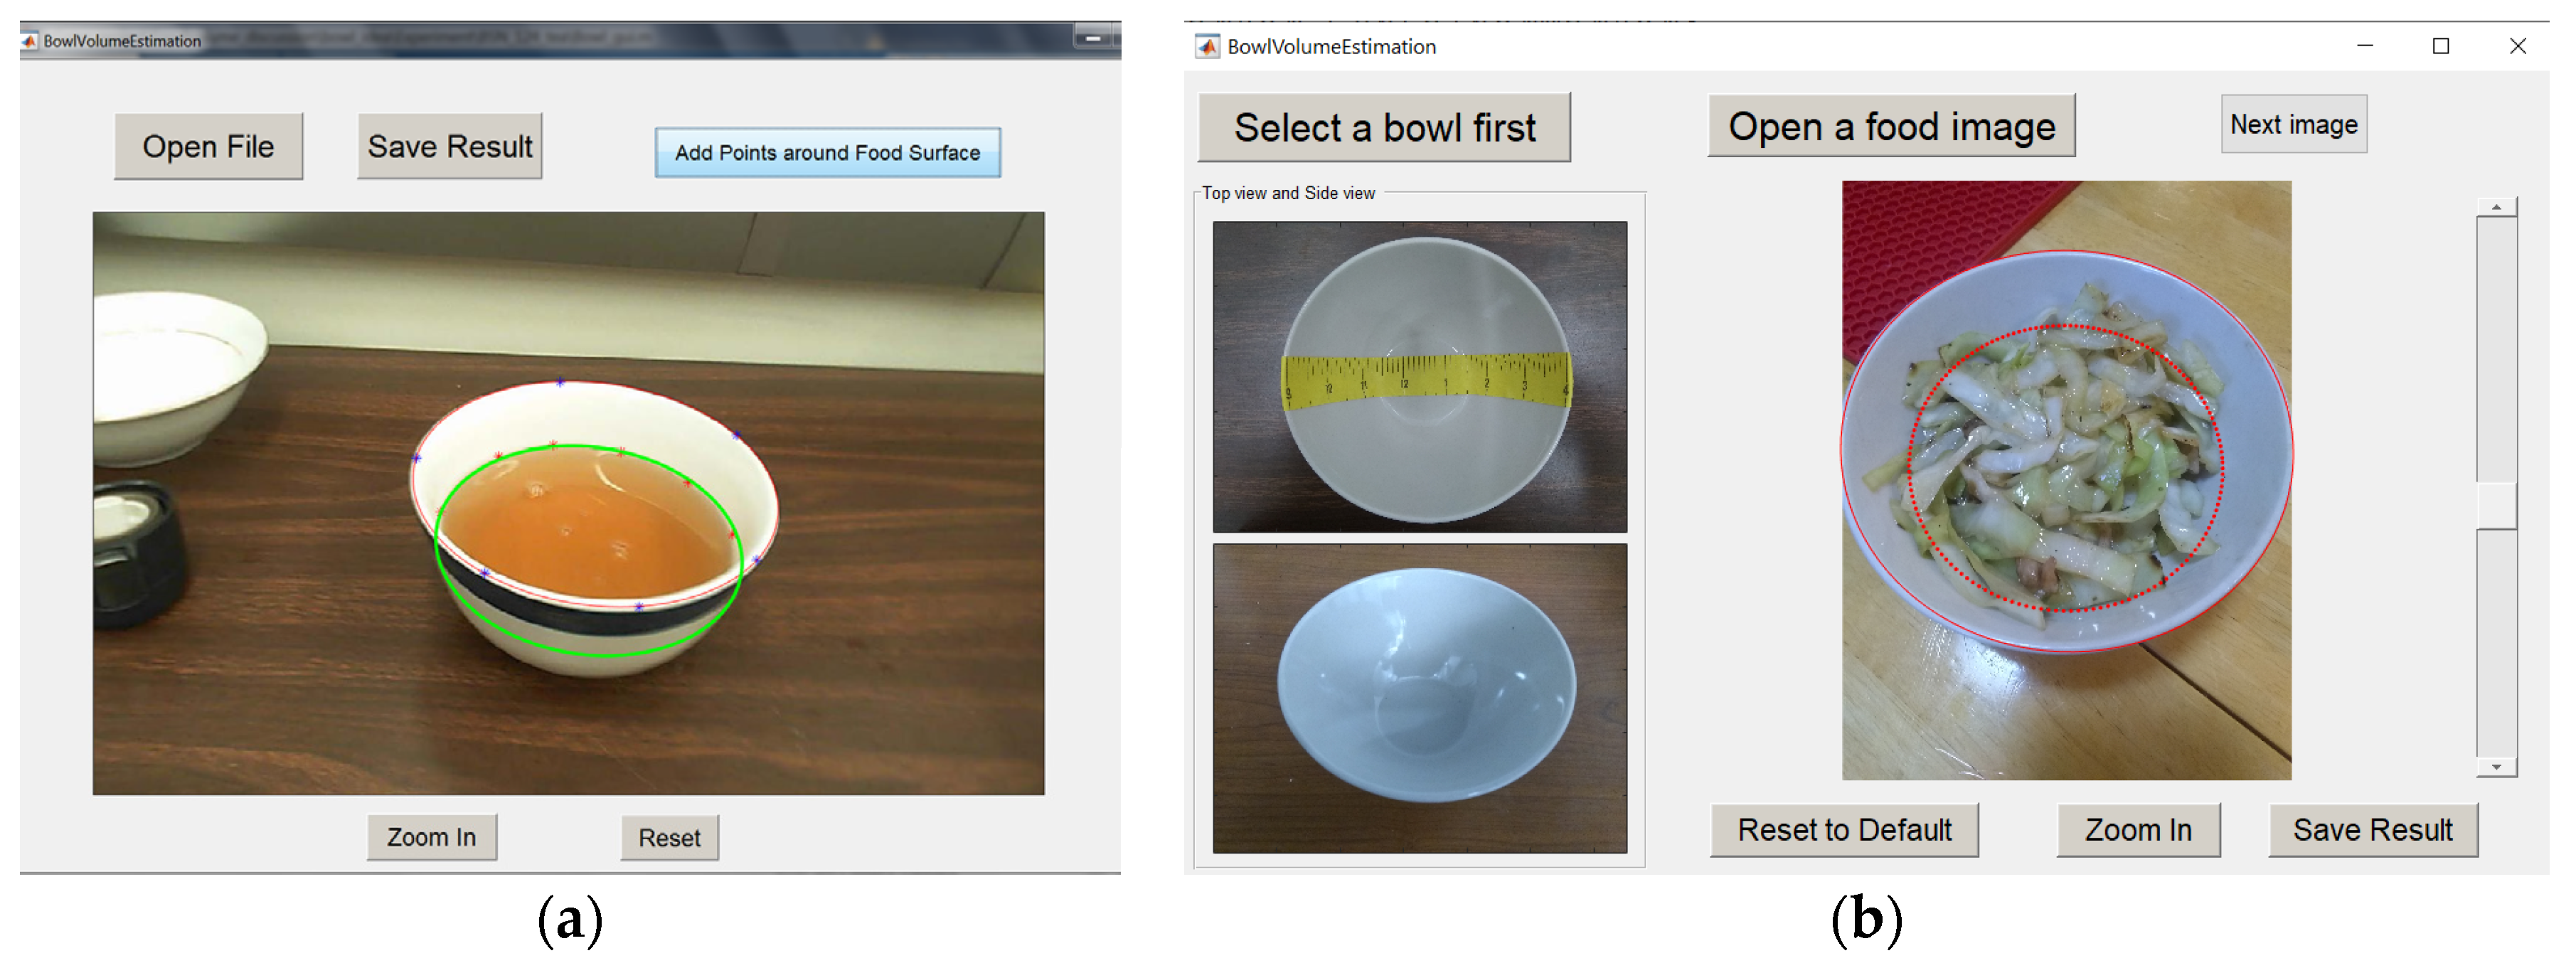
2.1.1. Landmark Labeling
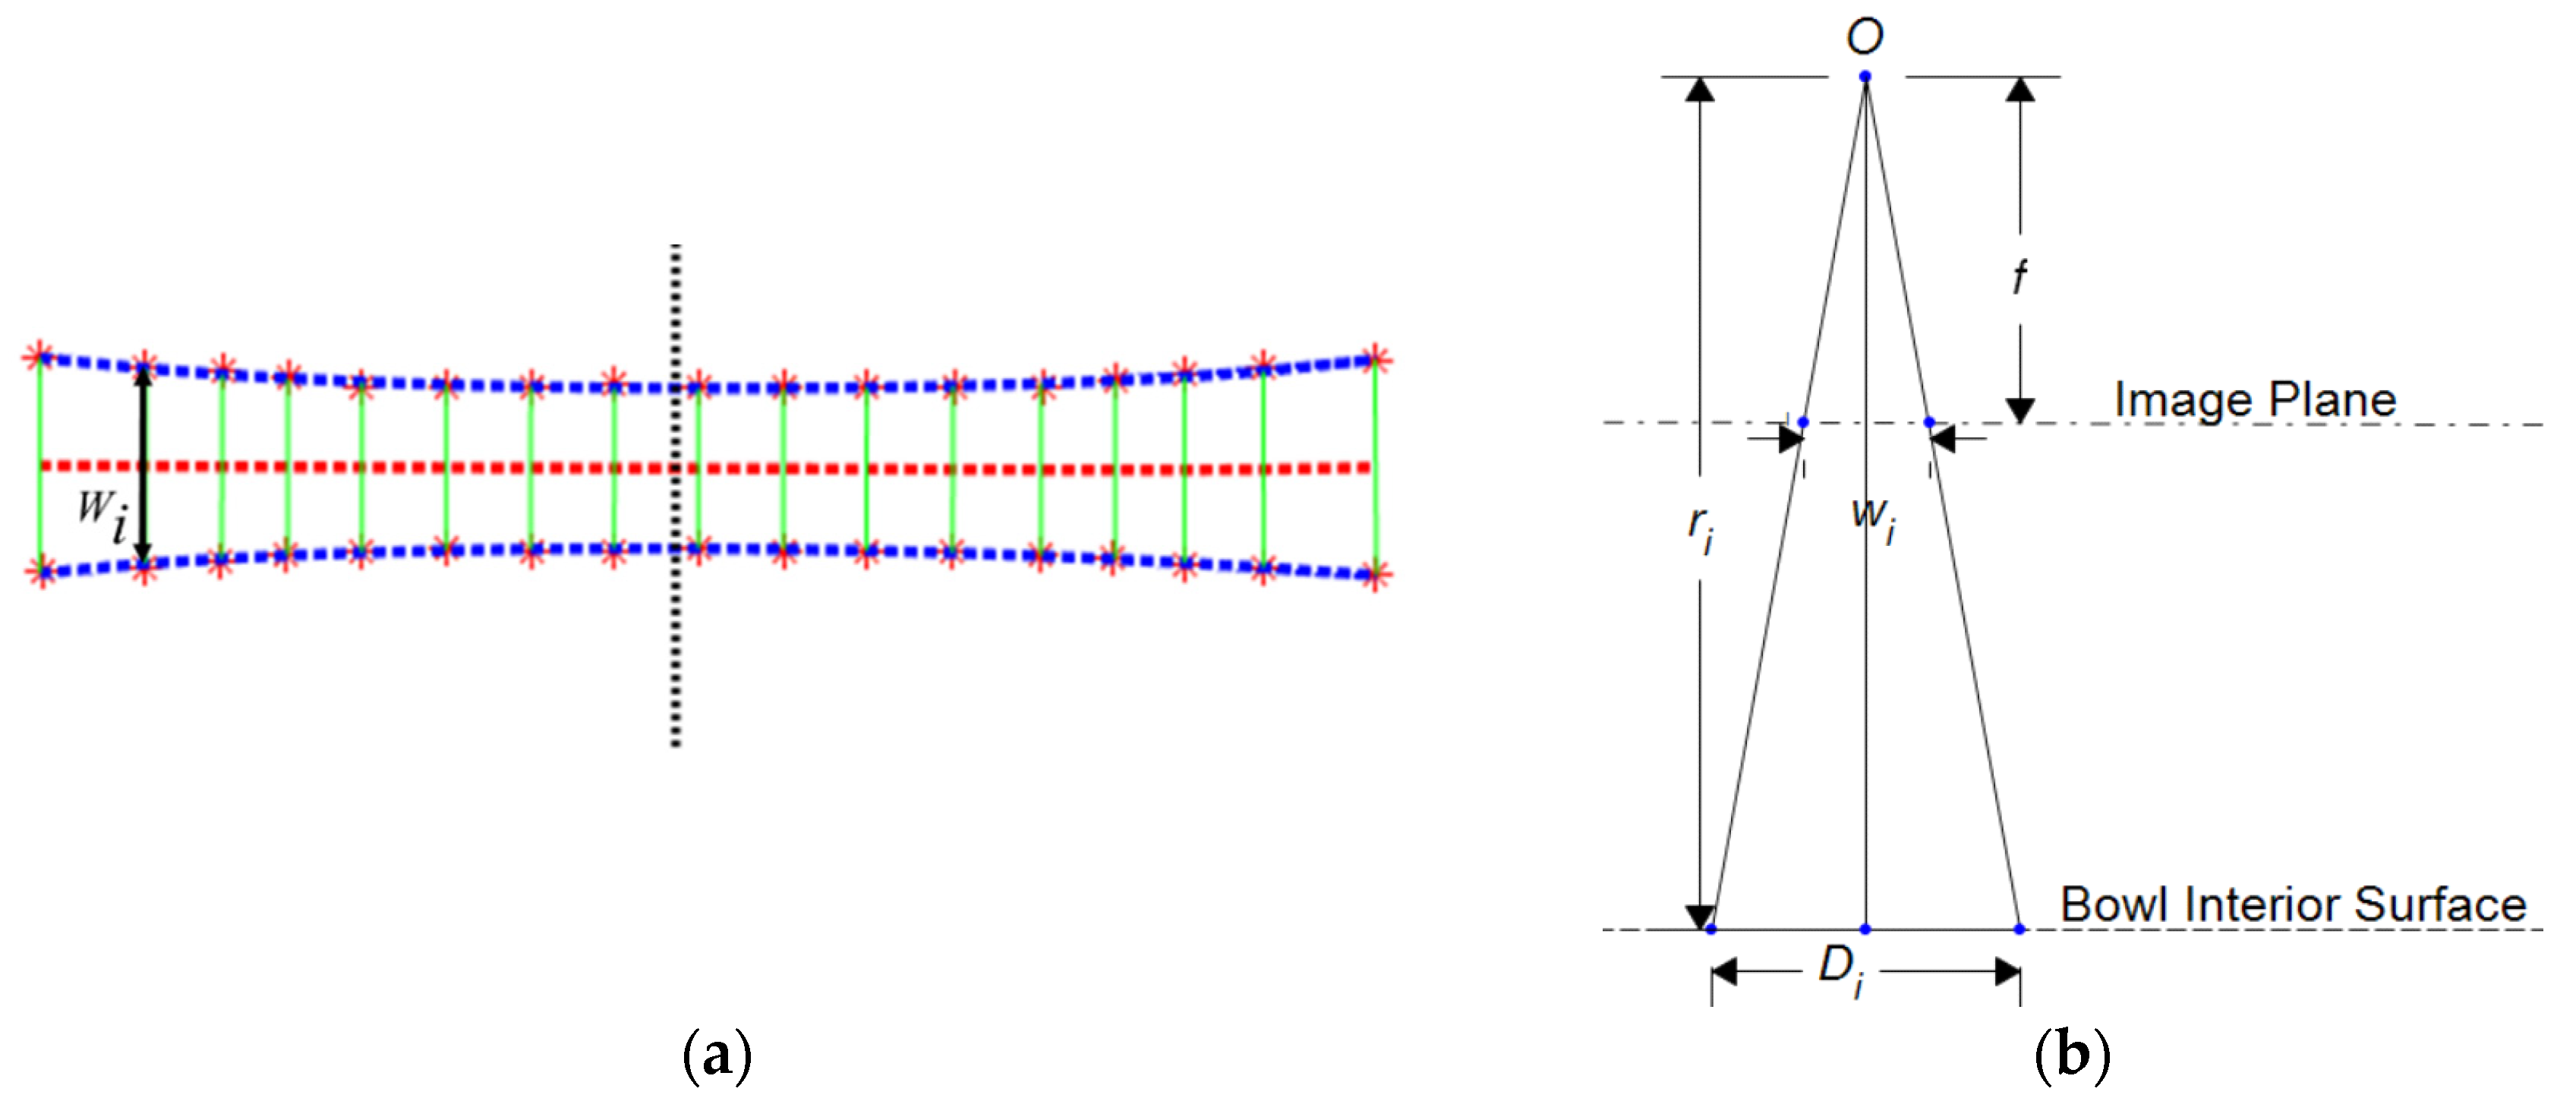
2.1.2. Landmark Pairing and Camera Modeling
2.1.3. Formulation of Parameter Estimation
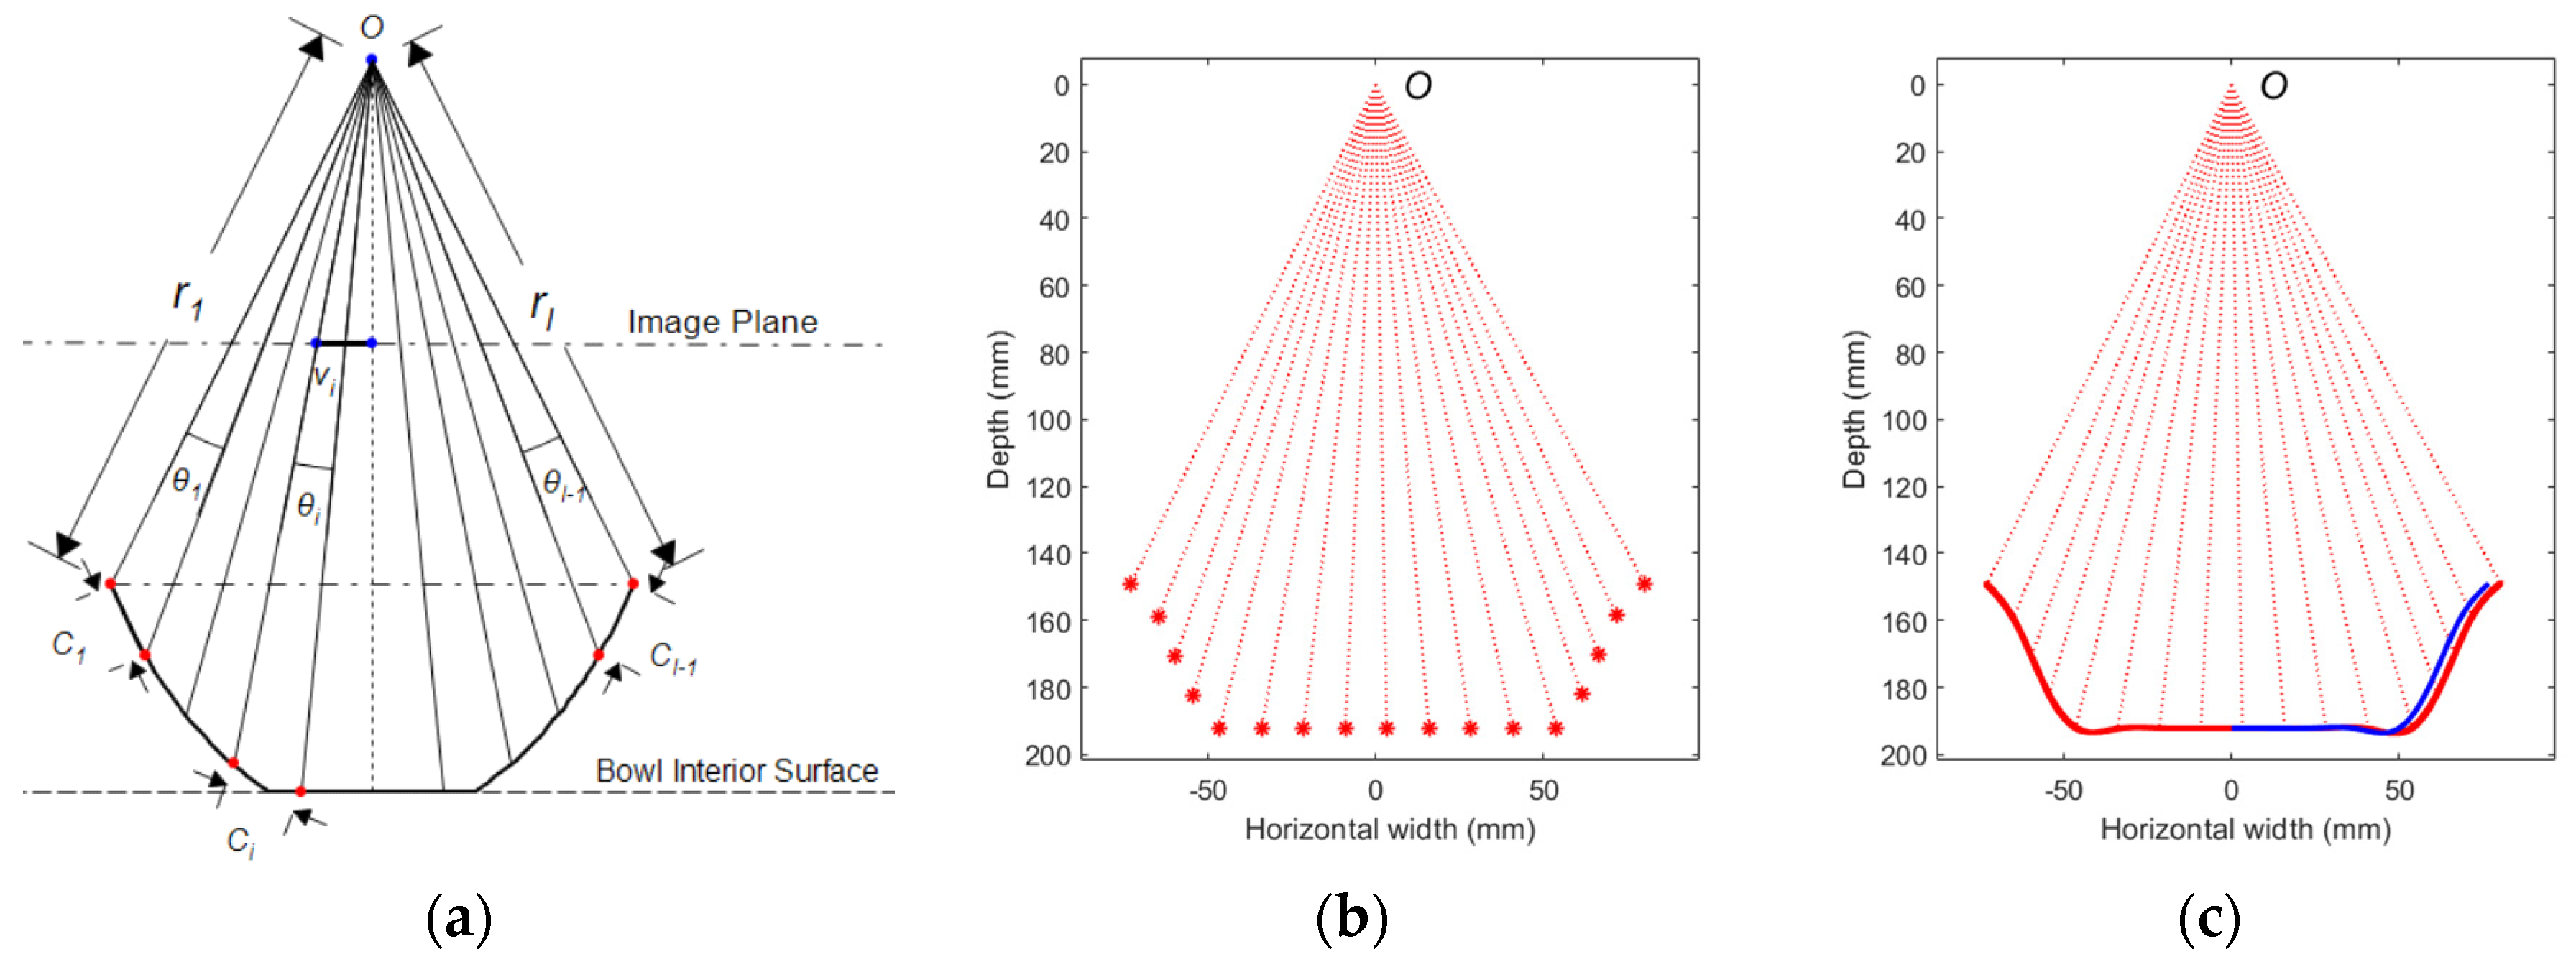
2.1.4. Reconstruction of the Cross-Section Curve
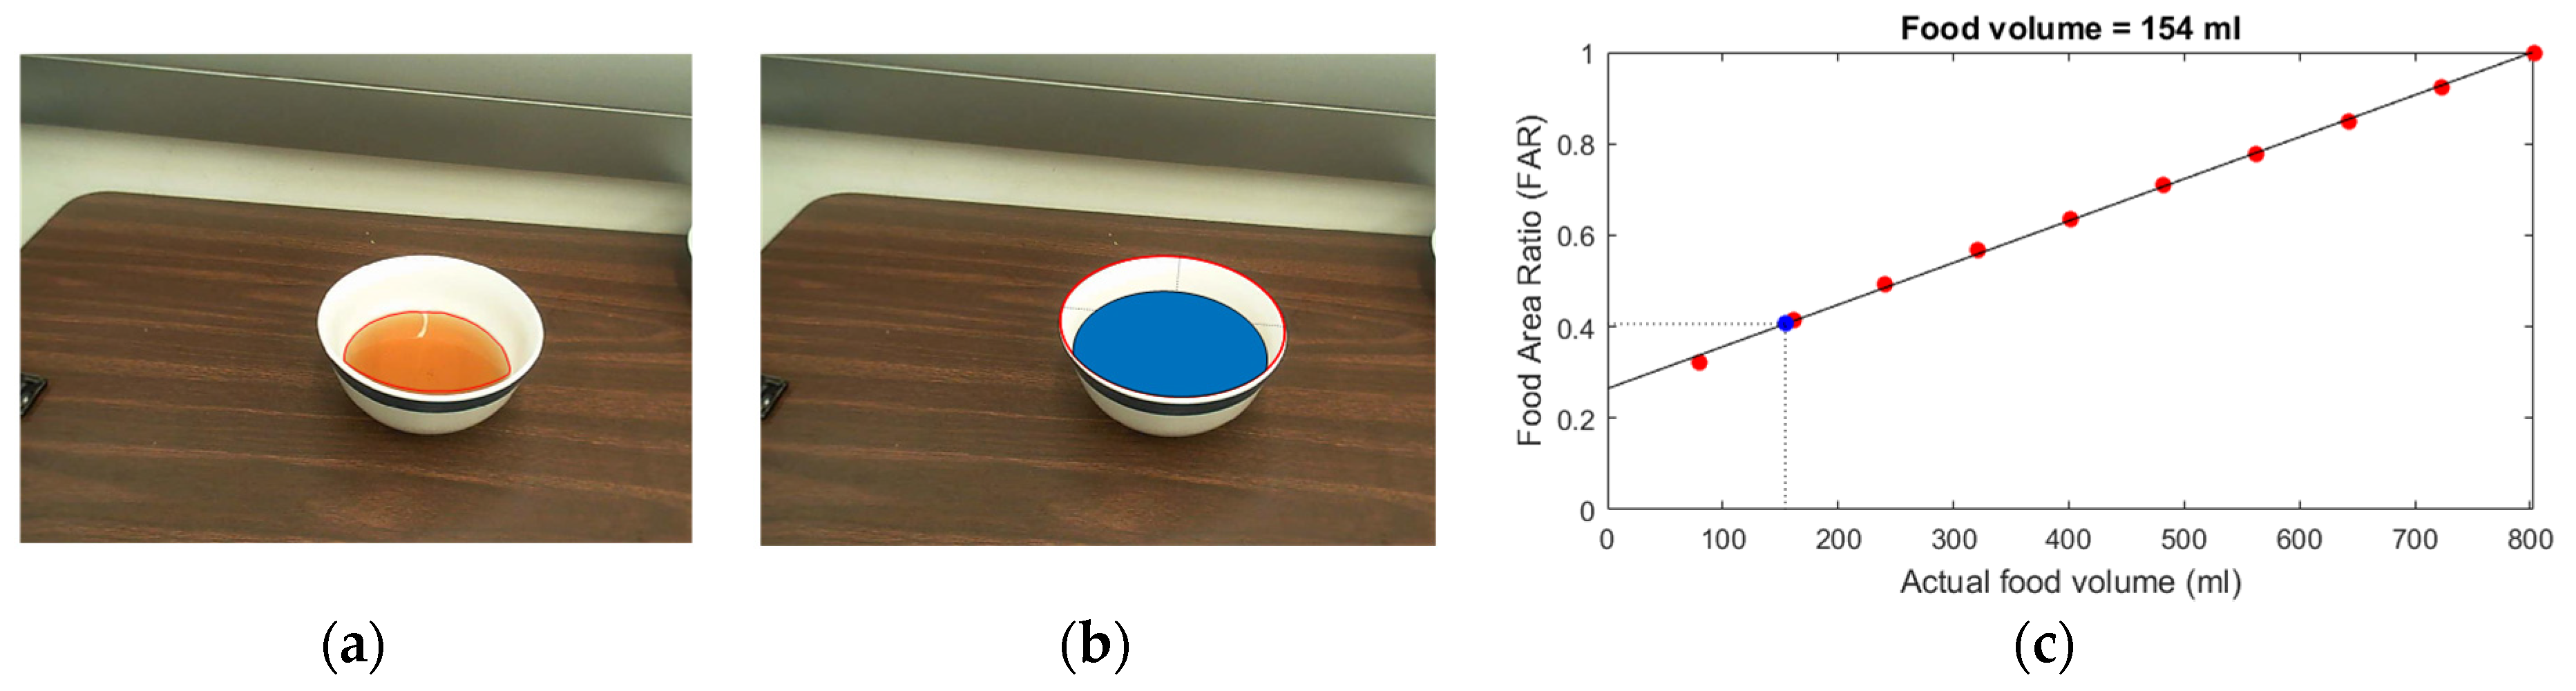
2.2. Food Volume Estimation
2.3. Alternative Method for Liquid Volume Estimation
3. Experiments
3.1. Ground Truth and Accuracy of Bowl Parameter Estimation
3.2. Volume Estimation of Liquid in a Bowl
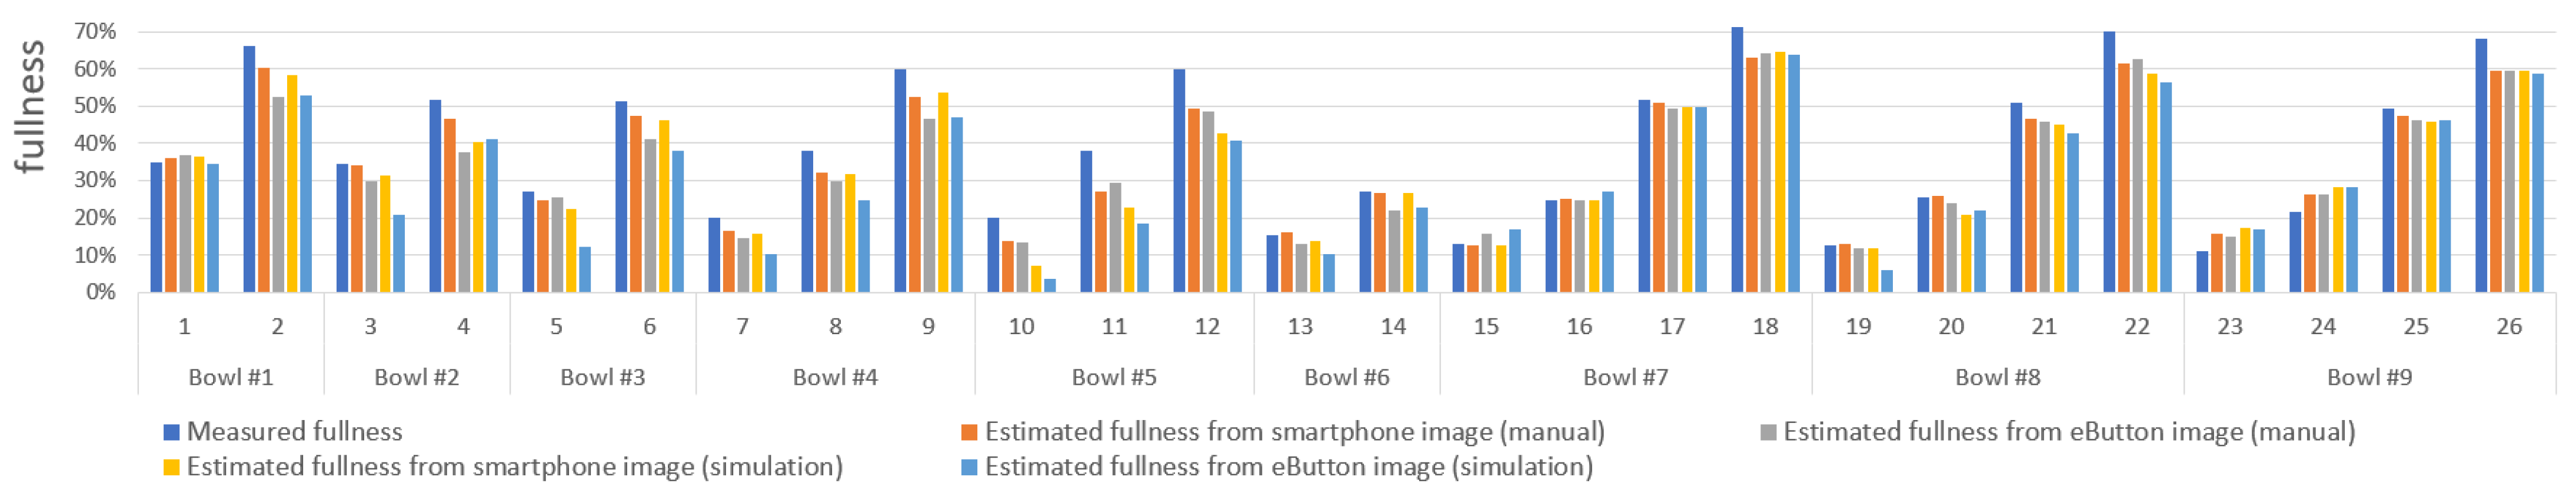
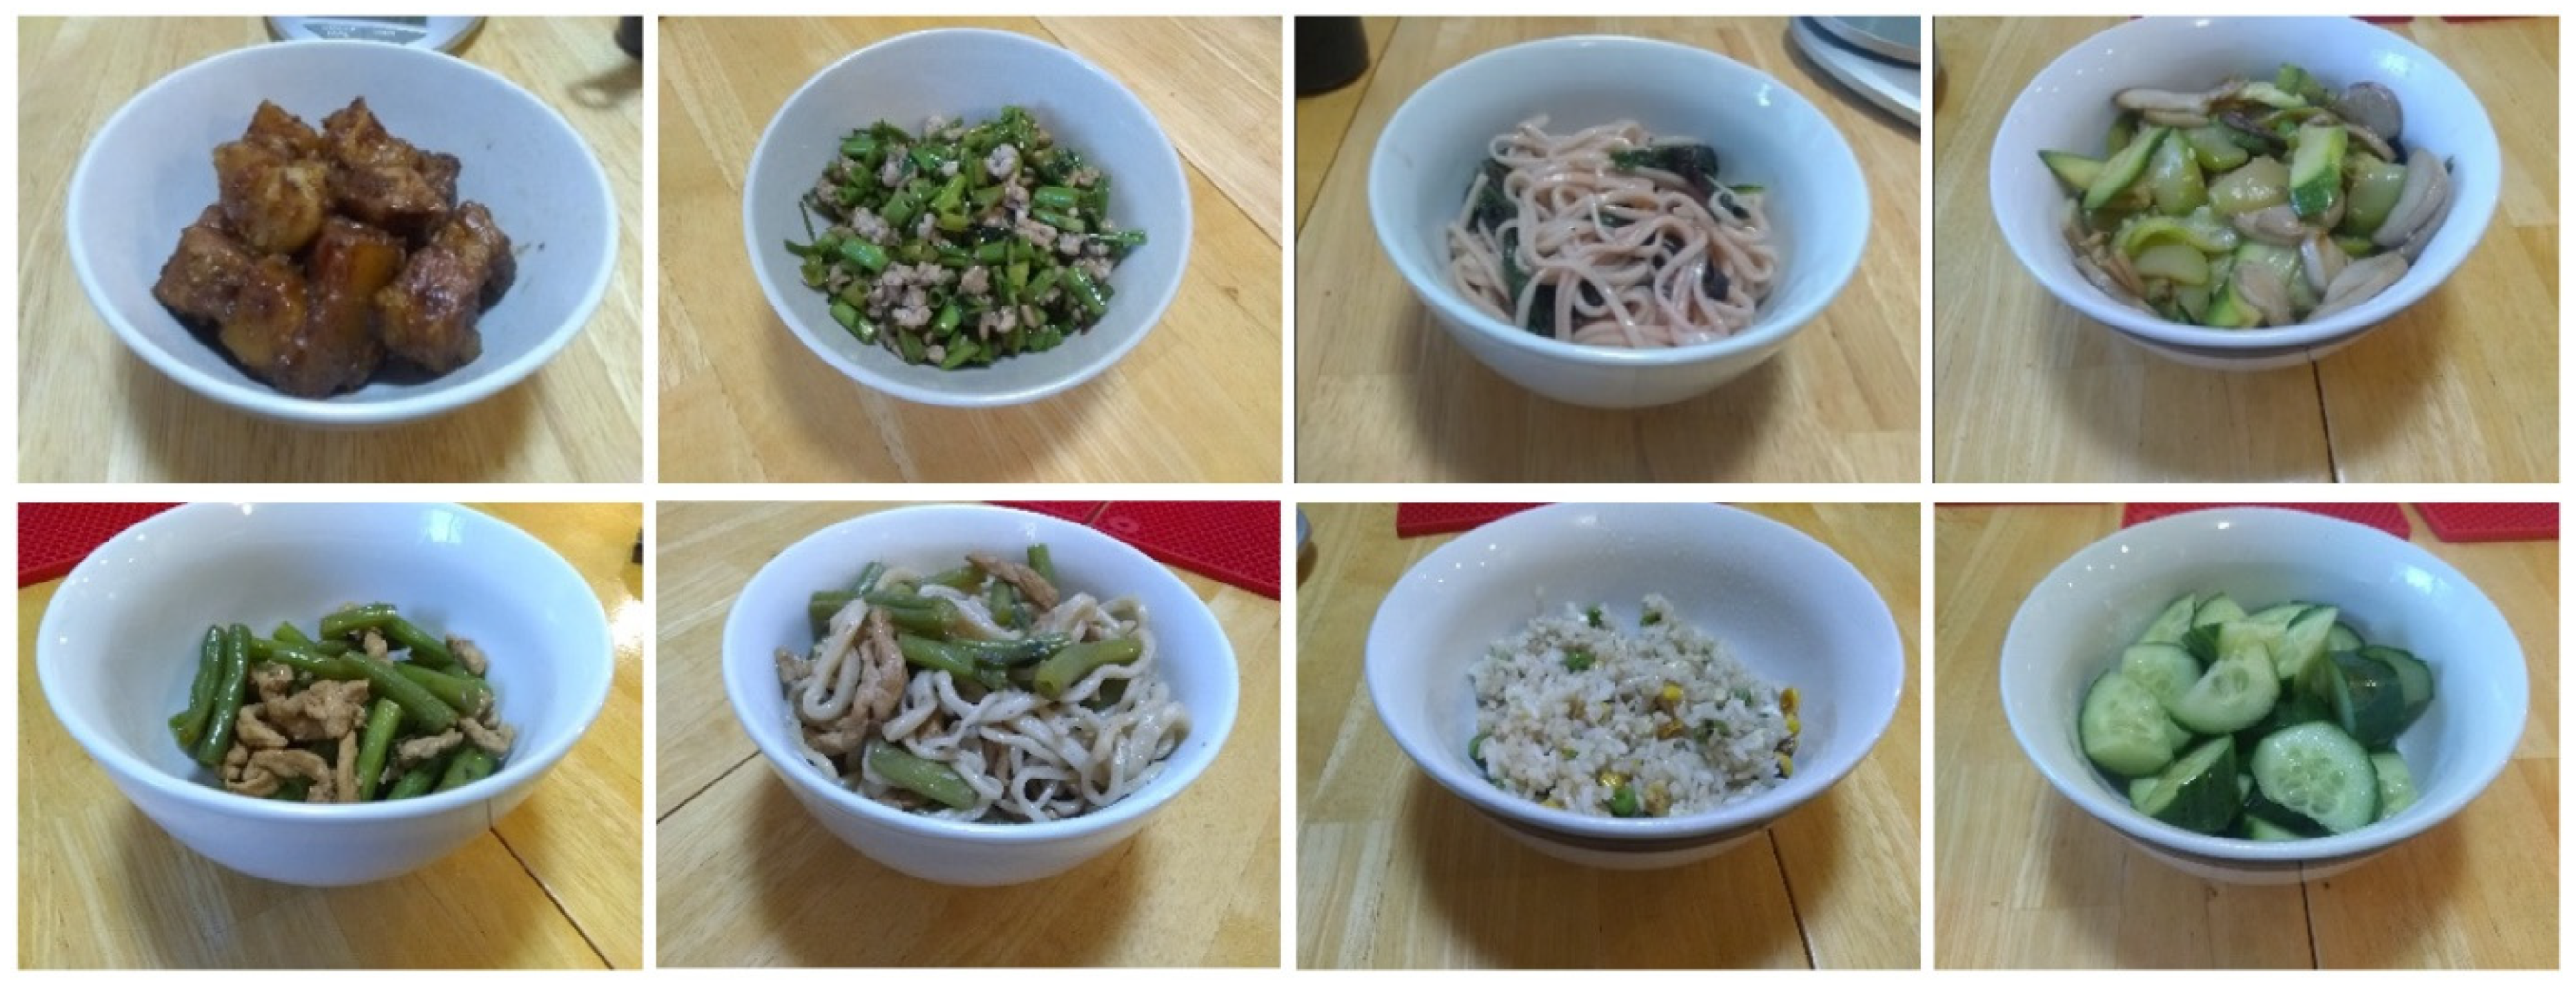
3.3. Volume Estimation of Food in a Bowl
4. Discussion
5. Conclusions
Author Contributions
Funding
Institutional Review Board Statement
Informed Consent Statement
Data Availability Statement
Conflicts of Interest
References
- Madival, S.A.; Jawaligi, S.S. A comprehensive review and open issues on food image analysis and dietary assessment. In Proceedings of the 2020 3rd International Conference on Intelligent Sustainable Systems (ICISS), Thoothukudi, India, 3–5 December 2020; pp. 414–420. [Google Scholar]
- Bell, B.M.; Alam, R.; Alshurafa, N.; Thomaz, E.; Mondol, A.S.; de la Haye, K.; Stankovic, J.A.; Lach, J.; Spruijt-Metz, D. Automatic, wearable-based, in-field eating detection approaches for public health research: A scoping review. NPJ Digit. Med. 2020, 3, 38. [Google Scholar] [CrossRef] [PubMed] [Green Version]
- Jobarteh, M.L.; McCrory, M.A.; Lo, B.; Sun, M.; Sazonov, E.; Anderson, A.K.; Jia, W.; Maitland, K.; Qiu, J.; Steiner-Asiedu, M.; et al. Development and validation of an objective, passive dietary assessment method for estimating food and nutrient intake in households in low- and middle-income countries: A study protocol. Curr. Dev. Nutr. 2020, 4, nzaa020. [Google Scholar] [CrossRef] [PubMed] [Green Version]
- Doulah, A.; McCrory, M.A.; Higgins, J.A.; Sazonov, E. A systematic review of technology-driven methodologies for estimation of energy intake. IEEE Access 2019, 7, 49653–49668. [Google Scholar] [CrossRef] [PubMed]
- Vu, T.; Lin, F.; Alshurafa, N.; Xu, W. Wearable food intake monitoring technologies: A comprehensive review. Computers 2017, 6, 4. [Google Scholar] [CrossRef]
- Boushey, C.J.; Spoden, M.; Zhu, F.M.; Delp, E.J.; Kerr, D.A. New mobile methods for dietary assessment: Review of image-assisted and image-based dietary assessment methods. Proc. Nutr. Soc. 2017, 76, 283–294. [Google Scholar] [CrossRef] [Green Version]
- Gemming, L.; Utter, J.; Ni Mhurchu, C. Image-assisted dietary assessment: A systematic review of the evidence. J. Acad. Nutr. Diet. 2015, 115, 64–77. [Google Scholar] [CrossRef]
- Bekelman, T.A.; Martin, C.K.; Johnson, S.L.; Glueck, D.H.; Sauder, K.A.; Harrall, K.K.; Steinberg, R.I.; Hsia, D.S.; Dabelea, D. A comparison of the remote food photography method and the automated self-administered 24-h dietary assessment tool for measuring full-day dietary intake among school-age children. Br. J. Nutr 2021, 1–10. [Google Scholar] [CrossRef]
- Hochsmann, C.; Martin, C.K. Review of the validity and feasibility of image-assisted methods for dietary assessment. Int. J. Obes. 2020, 44, 2358–2371. [Google Scholar] [CrossRef]
- Lo, F.P.W.; Sun, Y.; Qiu, J.; Lo, B. Image-based food classification and volume estimation for dietary assessment: A review. IEEE J. Biomed. Health Inform. 2020, 24, 1926–1939. [Google Scholar] [CrossRef]
- Subhi, M.A.; Ali, S.H.; Mohammed, M.A. Vision-based approaches for automatic food recognition and dietary assessment: A survey. IEEE Access 2019, 7, 35370–35381. [Google Scholar] [CrossRef]
- Allegra, D.; Battiato, S.; Ortis, A.; Urso, S.; Polosa, R. A review on food recognition technology for health applications. Health Psychol. Res. 2020, 8, 9297. [Google Scholar] [CrossRef] [PubMed]
- Zhou, L.; Zhang, C.; Liu, F.; Qiu, Z.; He, Y. Application of deep learning in food: A review. Compr. Rev. Food Sci. Food Saf. 2019, 18, 1793–1811. [Google Scholar] [CrossRef] [PubMed] [Green Version]
- Mezgec, S.; Barbara, K.S. Deep neural networks for image-based dietary assessment. J. Vis. Exp. 2021, 169, e61906. [Google Scholar] [CrossRef]
- Mezgec, S.; Korousic Seljak, B. NutriNet: A deep learning food and drink image recognition system for dietary assessment. Nutrients 2017, 9, 657. [Google Scholar] [CrossRef] [PubMed]
- Sahoo, D.; Hao, W.; Ke, S.; Xiongwei, W.; Le, H.; Achananuparp, P.; Lim, E.-P.; Hoi, S.C.H. FoodAI: Food image recognition via deep learning for smart food logging. In Proceedings of the 25th ACM SIGKDD International Conference on Knowledge Discovery & Data Mining, Anchorage, AK, USA, 4–8 August 2019; pp. 2260–2268. [Google Scholar]
- Tahir, G.A.; Loo, C.K. A comprehensive survey of image-based food recognition and volume estimation methods for dietary assessment. Healthcare 2021, 9, 1676. [Google Scholar] [CrossRef]
- Raju, V.B.; Sazonov, E. A systematic review of sensor-based methodologies for food portion size estimation. IEEE Sens. J. 2021, 21, 12882–12899. [Google Scholar] [CrossRef]
- Skinner, A.; Toumpakari, Z.; Stone, C.; Johnson, L. Future directions for integrative objective assessment of eating using wearable sensing technology. Front. Nutr. 2020, 7, 80. [Google Scholar] [CrossRef]
- Eldridge, A.L.; Piernas, C.; Illner, A.K.; Gibney, M.J.; Gurinovic, M.A.; de Vries, J.H.M.; Cade, J.E. Evaluation of new technology-based tools for dietary intake assessment-An ILSI Europe dietary intake and exposure task force evaluation. Nutrients 2018, 11, 55. [Google Scholar] [CrossRef] [Green Version]
- Zhao, X.; Xu, X.; Li, X.; He, X.; Yang, Y.; Zhu, S. Emerging trends of technology-based dietary assessment: A perspective study. Eur. J. Clin. Nutr. 2021, 75, 582–587. [Google Scholar] [CrossRef]
- Fang, S.; Zhu, F.; Jiang, C.; Zhang, S.; Boushey, C.J.; Delp, E.J. A comparison of food portion size estimation using geometric models and depth images. In Proceedings of the 2016 IEEE International Conference on Image Processing (ICIP), Phoenix, AZ, USA, 25–28 September 2016; pp. 26–30. [Google Scholar]
- Herzig, D.; Nakas, C.T.; Stalder, J.; Kosinski, C.; Laesser, C.; Dehais, J.; Jaeggi, R.; Leichtle, A.B.; Dahlweid, F.M.; Stettler, C.; et al. Volumetric food quantification using computer vision on a depth-sensing smartphone: Preclinical study. JMIR Mhealth Uhealth 2020, 8, e15294. [Google Scholar] [CrossRef]
- Makhsous, S.; Bharadwaj, M.; Atkinson, B.E.; Novosselov, I.V.; Mamishev, A.V. DietSensor: Automatic dietary intake measurement using mobile 3d scanning sensor for diabetic patients. Sensors 2020, 20, 3380. [Google Scholar] [CrossRef] [PubMed]
- Suzuki, T.; Futatsuishi, K.; Kobayashi, K. Food volume estimation using 3d shape approximation for medication management support. In Proceedings of the 2018 3rd Asia-Pacific Conference on Intelligent Robot Systems (ACIRS), Singapore, 21–23 July 2018; pp. 107–111. [Google Scholar]
- Lo, F.P.W.; Sun, Y.; Qiu, J.; Lo, B.P.L. Point2Volume: A vision-based dietary assessment approach using view synthesis. IEEE Trans. Industr. Inform. 2020, 16, 577–586. [Google Scholar] [CrossRef]
- Subhi, M.A.; Ali, S.H.M.; Ismail, A.G.; Othman, M. Food volume estimation based on stereo image analysis. IEEE Instrum. Meas. Mag. 2018, 21, 36–43. [Google Scholar] [CrossRef]
- Rahman, M.H.; Li, Q.; Pickering, M.; Frater, M.; Kerr, D.; Bouchey, C.; Delp, E. Food volume estimation in a mobile phone based dietary assessment system. In Proceedings of the 2012 Eighth International Conference on Signal Image Technology and Internet Based Systems, Sorrento, Italy, 25–29 November 2012; pp. 988–995. [Google Scholar]
- Ando, Y.; Ege, T.; Cho, J.; Yanai, K. DepthCalorieCam: A mobile application for volume-based foodcalorie estimation using depth cameras. In Proceedings of the 5th International Workshop on Multimedia Assisted Dietary Management—MADiMa ‘19, Nice, France, 21–25 October 2019; pp. 76–81. [Google Scholar]
- Shang, J.; Duong, M.; Pepin, E.; Xing, Z.; Sandara-Rajan, K.; Mamishev, A.; Kristal, A. A mobile structured light system for food volume estimation. In Proceedings of the 2011 IEEE International Conference on Computer Vision Workshops (ICCV Workshops), Barcelona, Spain, 6–13 November 2011; pp. 100–101. [Google Scholar]
- Makhsous, S.; Mohammad, H.M.; Schenk, J.M.; Mamishev, A.V.; Kristal, A.R. A novel mobile structured light system in food 3D reconstruction and volume estimation. Sensors 2019, 19, 564. [Google Scholar] [CrossRef] [Green Version]
- Yuan, D.; Hu, X.; Zhang, H.; Jia, W.; Mao, Z.H.; Sun, M. An automatic electronic instrument for accurate measurements of food volume and density. Public Health Nutr. 2021, 24, 1248–1255. [Google Scholar] [CrossRef]
- Konstantakopoulos, F.; Georga, E.I.; Fotiadis, D.I. 3D reconstruction and volume estimation of food using stereo vision techniques. In Proceedings of the 2021 IEEE 21st International Conference on Bioinformatics and Bioengineering (BIBE), Kragujevac, Serbia, 25–27 October 2021; pp. 1–4. [Google Scholar]
- Ma, Y.; Soatto, S.; Kosecka, J.; Sastry, S.S. An Invitation to 3-D Vision: From Images to Geometric Models; Springer: New York, NY, USA, 2003. [Google Scholar]
- Graikos, A.; Charisis, V.; Iakovakis, D.; Hadjidimitriou, S.; Hadjileontiadis, L. Single image-based food volume estimation using monocular depth-prediction networks. In Universal Access in Human-Computer Interaction. Applications and Practice. HCII 2020. Lecture Notes in Computer Science; Antona, M., Stephanidis, C., Eds.; Springer: Berlin/Heidelberg, Germany, 2020; Volume 12189, pp. 532–543. [Google Scholar]
- Fatehah, A.A.; Poh, B.K.; Shanita, S.N.; Wong, J.E. Feasibility of reviewing digital food images for dietary assessment among nutrition professionals. Nutrients 2018, 10, 984. [Google Scholar] [CrossRef] [Green Version]
- Jia, W.; Chen, H.C.; Yue, Y.; Li, Z.; Fernstrom, J.; Bai, Y.; Li, C.; Sun, M. Accuracy of food portion size estimation from digital pictures acquired by a chest-worn camera. Public Health Nutr. 2014, 17, 1671–1681. [Google Scholar] [CrossRef] [Green Version]
- Chen, H.C.; Jia, W.; Yue, Y.; Li, Z.; Sun, Y.N.; Fernstrom, J.D.; Sun, M. Model-based measurement of food portion size for image-based dietary assessment using 3D/2D registration. Meas. Sci. Technol. 2013, 24, 105701. [Google Scholar] [CrossRef] [Green Version]
- Chae, J.; Woo, I.; Kim, S.; Maciejewski, R.; Zhu, F.; Delp, E.J.; Boushey, C.J.; Ebert, D.S. Volume estimation using food specific shape templates in mobile image-based dietary assessment. In Proceedings of the IS&T/SPIE Electronic Imaging, San Francisco, CA, USA, 23–27 January 2011; p. 78730K. [Google Scholar]
- Beltran, A.; Dadabhoy, H.; Ryan, C.; Dholakia, R.; Baranowski, J.; Li, Y.; Yan, G.; Jia, W.; Sun, M.; Baranowski, T. Reliability and validity of food portion size estimation from images using manual flexible digital virtual meshes. Public Health Nutr. 2019, 22, 1153–1159. [Google Scholar] [CrossRef]
- He, Y.; Xu, C.; Khanna, N.; Boushey, C.J.; Delp, E.J. Food image analysis: Segmentation, identification and weight estimation. In Proceedings of the 2013 IEEE International Conference on Multimedia and Expo (ICME), San Jose, CA, USA, 15–19 July 2013; pp. 1–6. [Google Scholar]
- Fang, S.; Liu, C.; Zhu, F.; Delp, E.J.; Boushey, C.J. Single-view food portion estimation based on geometric models. In Proceedings of the 2015 IEEE International Symposium on Multimedia (ISM), Miami, FL, USA, 14–16 December 2015; pp. 385–390. [Google Scholar]
- Akpa, E.A.H.; Suwa, H.; Arakawa, Y.; Yasumoto, K. Smartphone-based food weight and calorie estimation method for effective food journaling. SICE J. Control Meas. Syst. Integr. 2017, 10, 360–369. [Google Scholar] [CrossRef] [Green Version]
- Bucher, T.; Weltert, M.; Rollo, M.E.; Smith, S.P.; Jia, W.; Collins, C.E.; Sun, M. The international food unit: A new measurement aid that can improve portion size estimation. Int. J. Behav. Nutr. Phys. Act. 2017, 14, 124. [Google Scholar] [CrossRef] [Green Version]
- Liu, Y.; Lai, J.; Sun, W.; Wei, Z.; Liu, A.; Gong, W.; Yang, Y. Food volume estimation based on reference. In Proceedings of the 4th International Conference on Innovation in Artificial Intelligence, Xiamen, China, 8–11 May 2020; pp. 84–89. [Google Scholar]
- Yang, Y.; Jia, W.; Bucher, T.; Zhang, H.; Sun, M. Image-based food portion size estimation using a smartphone without a fiducial marker. Public Health Nutr. 2019, 22, 1180–1192. [Google Scholar] [CrossRef] [PubMed]
- Myers, A.; Johnston, N.; Rathod, V.; Korattikara, A.; Gorban, A.; Silberman, N.; Guadarrama, S.; Papandreou, G.; Huang, J.; Murphy, K. Im2Calories: Towards an automated mobile vision food diary. In Proceedings of the 2015 IEEE International Conference on Computer Vision (ICCV), Santiago, Chile, 7–13 December 2015; pp. 1233–1241. [Google Scholar]
- Lo, F.P.; Sun, Y.; Lo, B. Depth estimation based on a single close-up image with volumetric annotations in the wild: A pilot study. In Proceedings of the 2019 IEEE/ASME International Conference on Advanced Intelligent Mechatronics (AIM), Hong Kong, China, 8–12 July 2019; pp. 513–518. [Google Scholar]
- Fang, S.; Shao, Z.; Mao, R.; Fu, C.; Delp, E.J.; Zhu, F.; Kerr, D.A.; Boushey, C.J. Single-view food portion estimation: Learning image-to-energy mappings using generative adversarial networks. In Proceedings of the 25th IEEE International Conference on Image Processing (ICIP), Athens, Greece, 7–10 October 2018; pp. 251–255. [Google Scholar]
- Hassannejad, H.; Matrella, G.; Ciampolini, P.; Munari, I.D.; Mordonini, M.; Cagnoni, S. A new approach to image-based estimation of food volume. Algorithms 2017, 10, 66. [Google Scholar] [CrossRef] [Green Version]
- Liang, Y.; Li, J. Deep Learning-Based Food Calorie Estimation Method in Dietary Assessment. Available online: https://arxiv.org/abs/1706.04062 (accessed on 25 January 2022).
- Dehais, J.; Anthimopoulos, M.; Shevchik, S.; Mougiakakou, S. Two-view 3D reconstruction for food volume estimation. IEEE Trans. Multimed. 2017, 19, 1090–1099. [Google Scholar] [CrossRef] [Green Version]
- Han, X.F.; Laga, H.; Bennamoun, M. Image-based 3d object reconstruction: State-of-the-art and trends in the deep learning era. IEEE Trans. Pattern Anal. Mach. Intell. 2021, 43, 1578–1604. [Google Scholar] [CrossRef] [PubMed] [Green Version]
- Tahir, R.; Sargano, A.B.; Habib, Z. Voxel-based 3D object reconstruction from single 2D image using variational autoencoders. Mathematics 2021, 9, 2288. [Google Scholar] [CrossRef]
- Fu, K.; Peng, J.S.; He, Q.W.; Zhang, H.X. Single image 3D object reconstruction based on deep learning: A review. Multimed. Tools Appl. 2021, 80, 463–498. [Google Scholar] [CrossRef]
- Wu, Z.; Song, S.; Khosla, A.; Yu, F.; Zhang, L.; Tang, X.; Xiao, J. 3D ShapeNets: A deep representation for volumetric shapes. In Proceedings of the 2015 IEEE Conference on Computer Vision and Pattern Recognition (CVPR), Boston, MA, USA, 7–12 June 2015; pp. 1912–1920. [Google Scholar]
- Naritomi, S.; Yanai, K. Hungry Networks. In Proceedings of the 2nd ACM International Conference on Multimedia in Asia, Singapore, 7–9 March 2021; pp. 1–7. [Google Scholar]
- Jia, W.; Yue, Y.; Fernstrom, J.D.; Yao, N.; Sclabassi, R.J.; Fernstrom, M.H.; Sun, M. Image-based estimation of food volume using circular referents in dietary assessment. J. Food Eng. 2012, 109, 76–86. [Google Scholar] [CrossRef] [Green Version]
- Bowl. Available online: https://en.wikipedia.org/wiki/Bowl (accessed on 8 December 2021).
- Ruszczyński, A. Nonlinear Optimization; Princeton University Press: Princeton, NJ, USA, 2006. [Google Scholar]
- Safaee-Rad, R.; Tchoukanov, I.; Smith, K.C.; Benhabib, B. Three-dimensional location estimation of circular features for machine vision. IEEE Trans. Rob. Autom. 1992, 8, 624–640. [Google Scholar] [CrossRef] [Green Version]
- Sun, M.; Burke, L.E.; Mao, Z.H.; Chen, Y.; Chen, H.C.; Bai, Y.; Li, Y.; Li, C.; Jia, W. eButton: A wearable computer for health monitoring and personal assistance. In Proceedings of the 51st Annual Design Automation Conference, San Francisco, CA, USA, 1–5 June 2014; pp. 1–6. [Google Scholar]
- Sun, M.; Burke, L.E.; Baranowski, T.; Fernstrom, J.D.; Zhang, H.; Chen, H.C.; Bai, Y.; Li, Y.; Li, C.; Yue, Y.; et al. An exploratory study on a chest-worn computer for evaluation of diet, physical activity and lifestyle. J. Healthc Eng. 2015, 6, 1–22. [Google Scholar] [CrossRef] [PubMed]
- Beltran, A.; Dadabhoy, H.; Chen, T.A.; Lin, C.; Jia, W.; Baranowski, J.; Yan, G.; Sun, M.; Baranowski, T. Adapting the eButton to the abilities of children for diet assessment. In Proceedings of the Measuring Behavior, Dublin, Ireland, 25–27 May 2016; pp. 72–81. [Google Scholar]
- Raber, M.; Patterson, M.; Jia, W.; Sun, M.; Baranowski, T. Utility of eButton images for identifying food preparation behaviors and meal-related tasks in adolescents. Nutr. J. 2018, 17, 32. [Google Scholar] [CrossRef] [PubMed] [Green Version]
- McCrory, M.A.; Sun, M.; Sazonov, E.; Frost, G.; Anderson, A.; Jia, W.; Jobarteh, M.L.; Maitland, K.; Steiner, M.; Ghosh, T.; et al. Methodology for objective, passive, image- and sensor-based assessment of dietary intake, meal-timing, and food-related activity in Ghana and Kenya. In Proceedings of the Annual Nutrition Conference, Baltimore, MD, USA, 8–11 June 2019. [Google Scholar]
- Zhang, Z. A flexible new technique for camera calibration. IEEE Trans. Pattern Anal. Mach. Intell. 2000, 22, 1330–1334. [Google Scholar] [CrossRef] [Green Version]
- Ho, D.K.N.; Chiu, W.C.; Lee, Y.C.; Su, H.Y.; Chang, C.C.; Yao, C.Y.; Hua, K.L.; Chu, H.K.; Hsu, C.Y.; Chang, J.S. Integration of an image-based dietary assessment paradigm into dietetic training improves food portion estimates by future dietitians. Nutrients 2021, 13, 175. [Google Scholar] [CrossRef] [PubMed]


| Bowl #1 | Bowl #2 | Bowl #3 | Bowl #4 | Bowl #5 | Bowl #6 | Bowl #7 | Bowl #8 | Bowl #9 | |
|---|---|---|---|---|---|---|---|---|---|
| Actual diameter (mm) | 101 | 110 | 121 | 157 | 153 | 135 | 151 | 152 | 143 |
| Calculated diameter(mm) | 96.9 | 110.6 | 118.7 | 154.6 | 154.3 | 135.2 | 142.7 | 145.4 | 135.6 |
| Relative error * (%) | −4.1 | 0.5 | −1.9 | −1.5 | 0.8 | 0.1 | −5.5 | −4.3 | −5.2 |
| Actual depth (mm) | 45 | 42 | 52 | 44 | 43 | 70 | 59 | 61 | 65 |
| Calculated depth (mm) | 47.3 | 39.1 | 52.5 | 42.2 | 42.9 | 67.9 | 62.3 | 64.1 | 68.7 |
| Relative error * (%) | 5.1 | −6.9 | 1 | −4.1 | −0.2 | −3 | 5.6 | 5.1 | 5.7 |
| Actual capacity (mL) | 288 | 291 | 371 | 500 | 500 | 642 | 773 | 787 | 810 |
| Calculated capacity (mL) | 288.7 | 288 | 362.9 | 496.9 | 553 | 661.4 | 769.4 | 803.4 | 851.6 |
| Relative error * (%) | 0.2 | −1 | −2.2 | −0.6 | 10.6 | 3 | −0.5 | 2.1 | 5.1 |
| Smartphone Images | eButton Images | ||||
|---|---|---|---|---|---|
| Manual | Simulation | Manual | Simulation | ||
| Fullness | Mean ± s.t.d. | −3.2% ± 4.3% | −4.8% ± 5.7% | −4.9% ± 5.2% | −7.7% ± 7.3% |
| Root mean square error (RMS) | 5.3% | 7.4% | 7.1% | 10.6% | |
| Median | −2.8% | −4.4% | −5.1% | −8.7% | |
| IQR | 6.7% | 7.0% | 7.0% | 10.0% | |
| Relative error * | Median | −7.0% | −9.9% | −9.5% | −18.6% |
| IQR | 12.8% | 13.4% | 16.0% | 31.3% | |
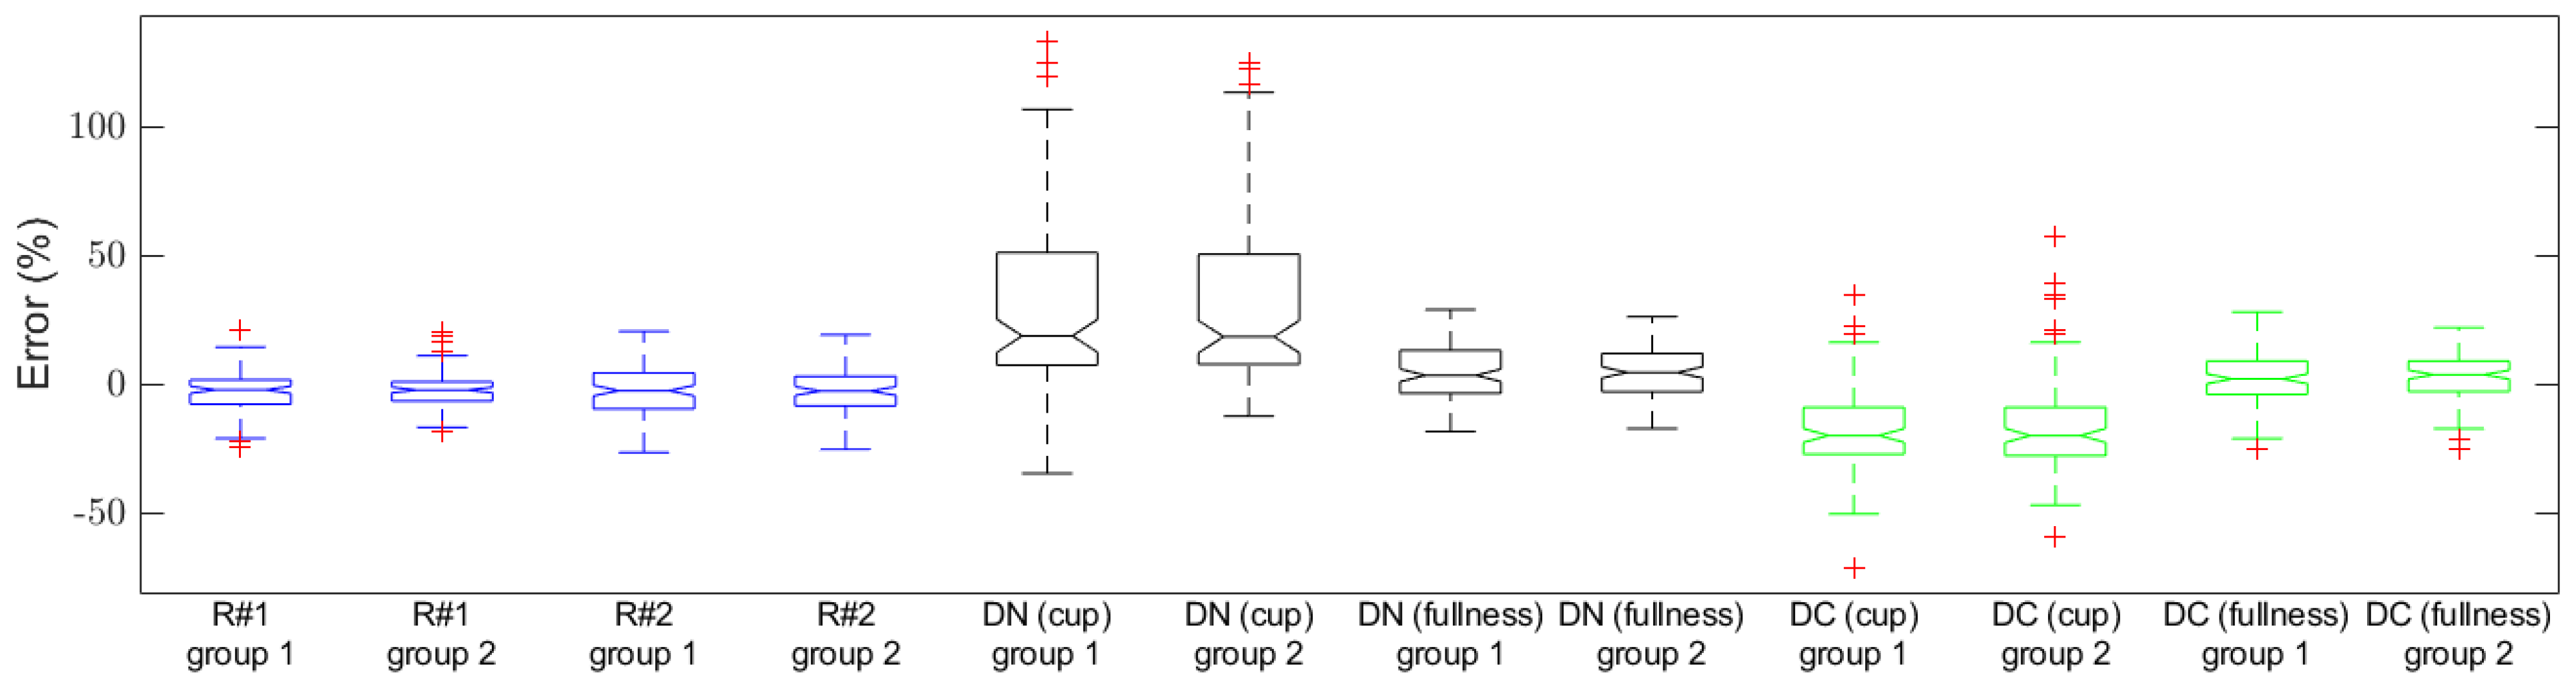
| Fullness | Relative Error * | ||||
|---|---|---|---|---|---|
| Median | IQR | Median | IQR | ||
| R#1 (Researcher #1) | Group 1 | −1.6% | 9.4% | −3.3% | 21.8% |
| Group 2 | −1.7% | 7.5% | −3.7% | 15.5% | |
| R#2 (Researcher #2) | Group 1 | −2.0% | 14.0% | −2.6% | 25.4% |
| Group 2 | −2.1% | 11.4% | −3.3% | 22.2% | |
| DN (cup) (Dietitian: cup estimation, no cue) | Group 1 | 19.3% | 43.7% | 50.0% | 79.4% |
| Group 2 | 19.0% | 42.7% | 50.0% | 75.0% | |
| DN (fullness) (Dietitian: fullness estimation, no cue) | Group 1 | 4.0% | 16.7% | 10.2% | 38.9% |
| Group 2 | 5.1% | 15.0% | 9.7% | 35.4% | |
| DC (cup) (Dietitian: cup estimation, with the cue) | Group 1 | −19.4% | 18.2% | −43.6% | 27.2% |
| Group 2 | −19.4% | 18.7% | −47.4% | 24.6% | |
| DC (fullness) (Dietitian: fullness estimation, with the cue) | Group 1 | 2.6% | 12.9% | 9.2% | 32.0% |
| Group 2 | 4.2% | 11.8% | 8.4% | 34.8% | |
Publisher’s Note: MDPI stays neutral with regard to jurisdictional claims in published maps and institutional affiliations. |
© 2022 by the authors. Licensee MDPI, Basel, Switzerland. This article is an open access article distributed under the terms and conditions of the Creative Commons Attribution (CC BY) license (https://creativecommons.org/licenses/by/4.0/).
Share and Cite
Jia, W.; Ren, Y.; Li, B.; Beatrice, B.; Que, J.; Cao, S.; Wu, Z.; Mao, Z.-H.; Lo, B.; Anderson, A.K.; et al. A Novel Approach to Dining Bowl Reconstruction for Image-Based Food Volume Estimation. Sensors 2022, 22, 1493. https://doi.org/10.3390/s22041493
Jia W, Ren Y, Li B, Beatrice B, Que J, Cao S, Wu Z, Mao Z-H, Lo B, Anderson AK, et al. A Novel Approach to Dining Bowl Reconstruction for Image-Based Food Volume Estimation. Sensors. 2022; 22(4):1493. https://doi.org/10.3390/s22041493
Chicago/Turabian StyleJia, Wenyan, Yiqiu Ren, Boyang Li, Britney Beatrice, Jingda Que, Shunxin Cao, Zekun Wu, Zhi-Hong Mao, Benny Lo, Alex K. Anderson, and et al. 2022. "A Novel Approach to Dining Bowl Reconstruction for Image-Based Food Volume Estimation" Sensors 22, no. 4: 1493. https://doi.org/10.3390/s22041493