
Radio-Frequency Biosensors for Real-Time and Continuous Glucose Detection


1
Department of Electrical and Electronic Engineering, Yonsei University, Seoul 03722, Korea
2
Department of Physics Education, College of Education, Daegu University, Gyeongsan 38453, Korea
*
Author to whom correspondence should be addressed.
†
These authors contributed equally to this work.
Sensors 2021, 21(5), 1843; https://doi.org/10.3390/s21051843
Submission received: 3 February 2021
/
Revised: 24 February 2021
/
Accepted: 4 March 2021
/
Published: 6 March 2021
(This article belongs to the Special Issue Microwave Sensors: From Sensing Principle to Application)
Abstract
:This review paper focuses on radio-frequency (RF) biosensors for real-time and continuous glucose sensing reported in the literature, including our recent research. Diverse versions of glucose biosensors based on RF devices and circuits are briefly introduced, and their performances are compared. In addition, the limitations of the developed RF glucose biosensors are discussed. Finally, we present perspectives on state-of-art RF biosensing chips for point-of-care diagnosis and describe their future challenges.
1. Introduction
Glucose is a type of sugar obtained from carbohydrates, such as bread, potatoes, and fruit, that the human body uses for energy [1]. Insulin is a hormone that moves glucose from the blood into the cells for energy and storage [2], as shown in Figure 1. In general, diabetes can be classified into two types: in type one diabetes, a person does not have sufficient insulin to move glucose through cells, causing the immune system to attack and destroy cells of the pancreas, and in type two diabetes, the cells do not respond to insulin as well as they should [3]. Thus, insulin plays a crucial role in regulating glucose homeostasis and, more specifically, in keeping the glucose concentration in the blood (glycemia) within a narrow range (0.8–1 g/L). Dysfunctions in the regulation of glucose homeostasis can lead to chronic hyperglycemia [4].
Hyperglycemia can be classified into postprandial hyperglycemia (over 180 mg/mL for 2 h after eating) and fasting hyperglycemia (over 130 mg/mL after not eating or drinking for 8 h). In the case of diabetic patients, their pancreas, where insulin is made, needs to make increasingly more insulin to move glucose into the cells. Eventually, the pancreas is damaged and cannot make sufficient insulin to meet the body’s needs. In addition, high blood glucose over a long period of time can damage the kidneys, eyes, and other organs [5,6].
For this reason, doses of insulin need to be administered, and it is vital that diabetic patients regularly monitor the level of glucose in their blood. With the currently available glucose biosensors, a patient himself or herself can extract a small drop of blood and obtain a direct digital readout of the glucose concentration within 1 min. Such glucose monitoring involves a prick test to extract the blood, which can be painful, especially for children. In severe cases, the repercussions can be fatal.
For the systematic administration of a patient’s glucose, continuous glucose monitoring (CGM) using minimally invasive sources such as sweat or tears is less demanding. CGM improves healthcare by providing a higher data collection rate with increased reliability while avoiding the discomfort of the prick test [7,8]. From this point of view, a real-time and continuous radio-frequency (RF) glucose biosensor with the great advantages of being noninvasive and noncontact and monitoring a nonionized RF spectrum can be a new alternative. With the motivation of designing such real-time and continuous glucose-diagnostic RF devices, many studies have focused on the characterization of the dielectric properties of glucose solutions. The possibility of using RF or microwave sensing for blood glucose level characterization has also been investigated. In recent years, with the development of wireless technologies, an increased interest in noninvasive, noncontact, and continuous RF glucose detection has emerged [9,10,11,12].
In this paper, we review the figures of merit of representative RF biosensors for noninvasive and continuous glucose detection, including our own sensing scheme, through case studies. In addition, we suggest improvements to robust RF biosensors and present related perspectives. This paper is organized as follows. We begin by introducing the historical landmarks of three generations of glucose sensors, the dielectric properties of glucose solutions in the RF spectrum, and the measurement of these properties using two types of RF schemes, i.e., antennas and resonators. We also briefly introduce the principles of glucose sensing using representative RF devices and circuits, such as cavity resonators, microprobes, substrate-integrated waveguides (SIWs), antennas, and planar resonators, and we evaluate the performance of the proposed glucose biosensors. We conclude with a brief discussion of possible ways to meet the sensitivity and selectivity challenges for practical application.
2. History of Glucose Sensors
2.1. Definition of a Biosensor and Its Components
A biosensor can be defined as a compact analytical device or unit incorporating biological or biologically derived sensitive recognition elements, e.g., receptors, enzymes, antibodies, nucleic acids, microorganisms, or lectins [13,14], integrated or associated with physicochemical transducers, such as those based on electrochemical, optical, thermometric, piezoelectric, or magnetic schemes [15,16]. Thus, a biosensor has three main parts: (i) a biological recognition element to detect the target biomolecules (analytes) when various substances are present, (ii) a transducer to convert the biomolecules detection phenomenon into a measurable electric signal, and (iii) a post-processing system to convert the electric signal into a legible form [17,18,19].
2.2. First-Generation (1st G) Glucose Biosensors
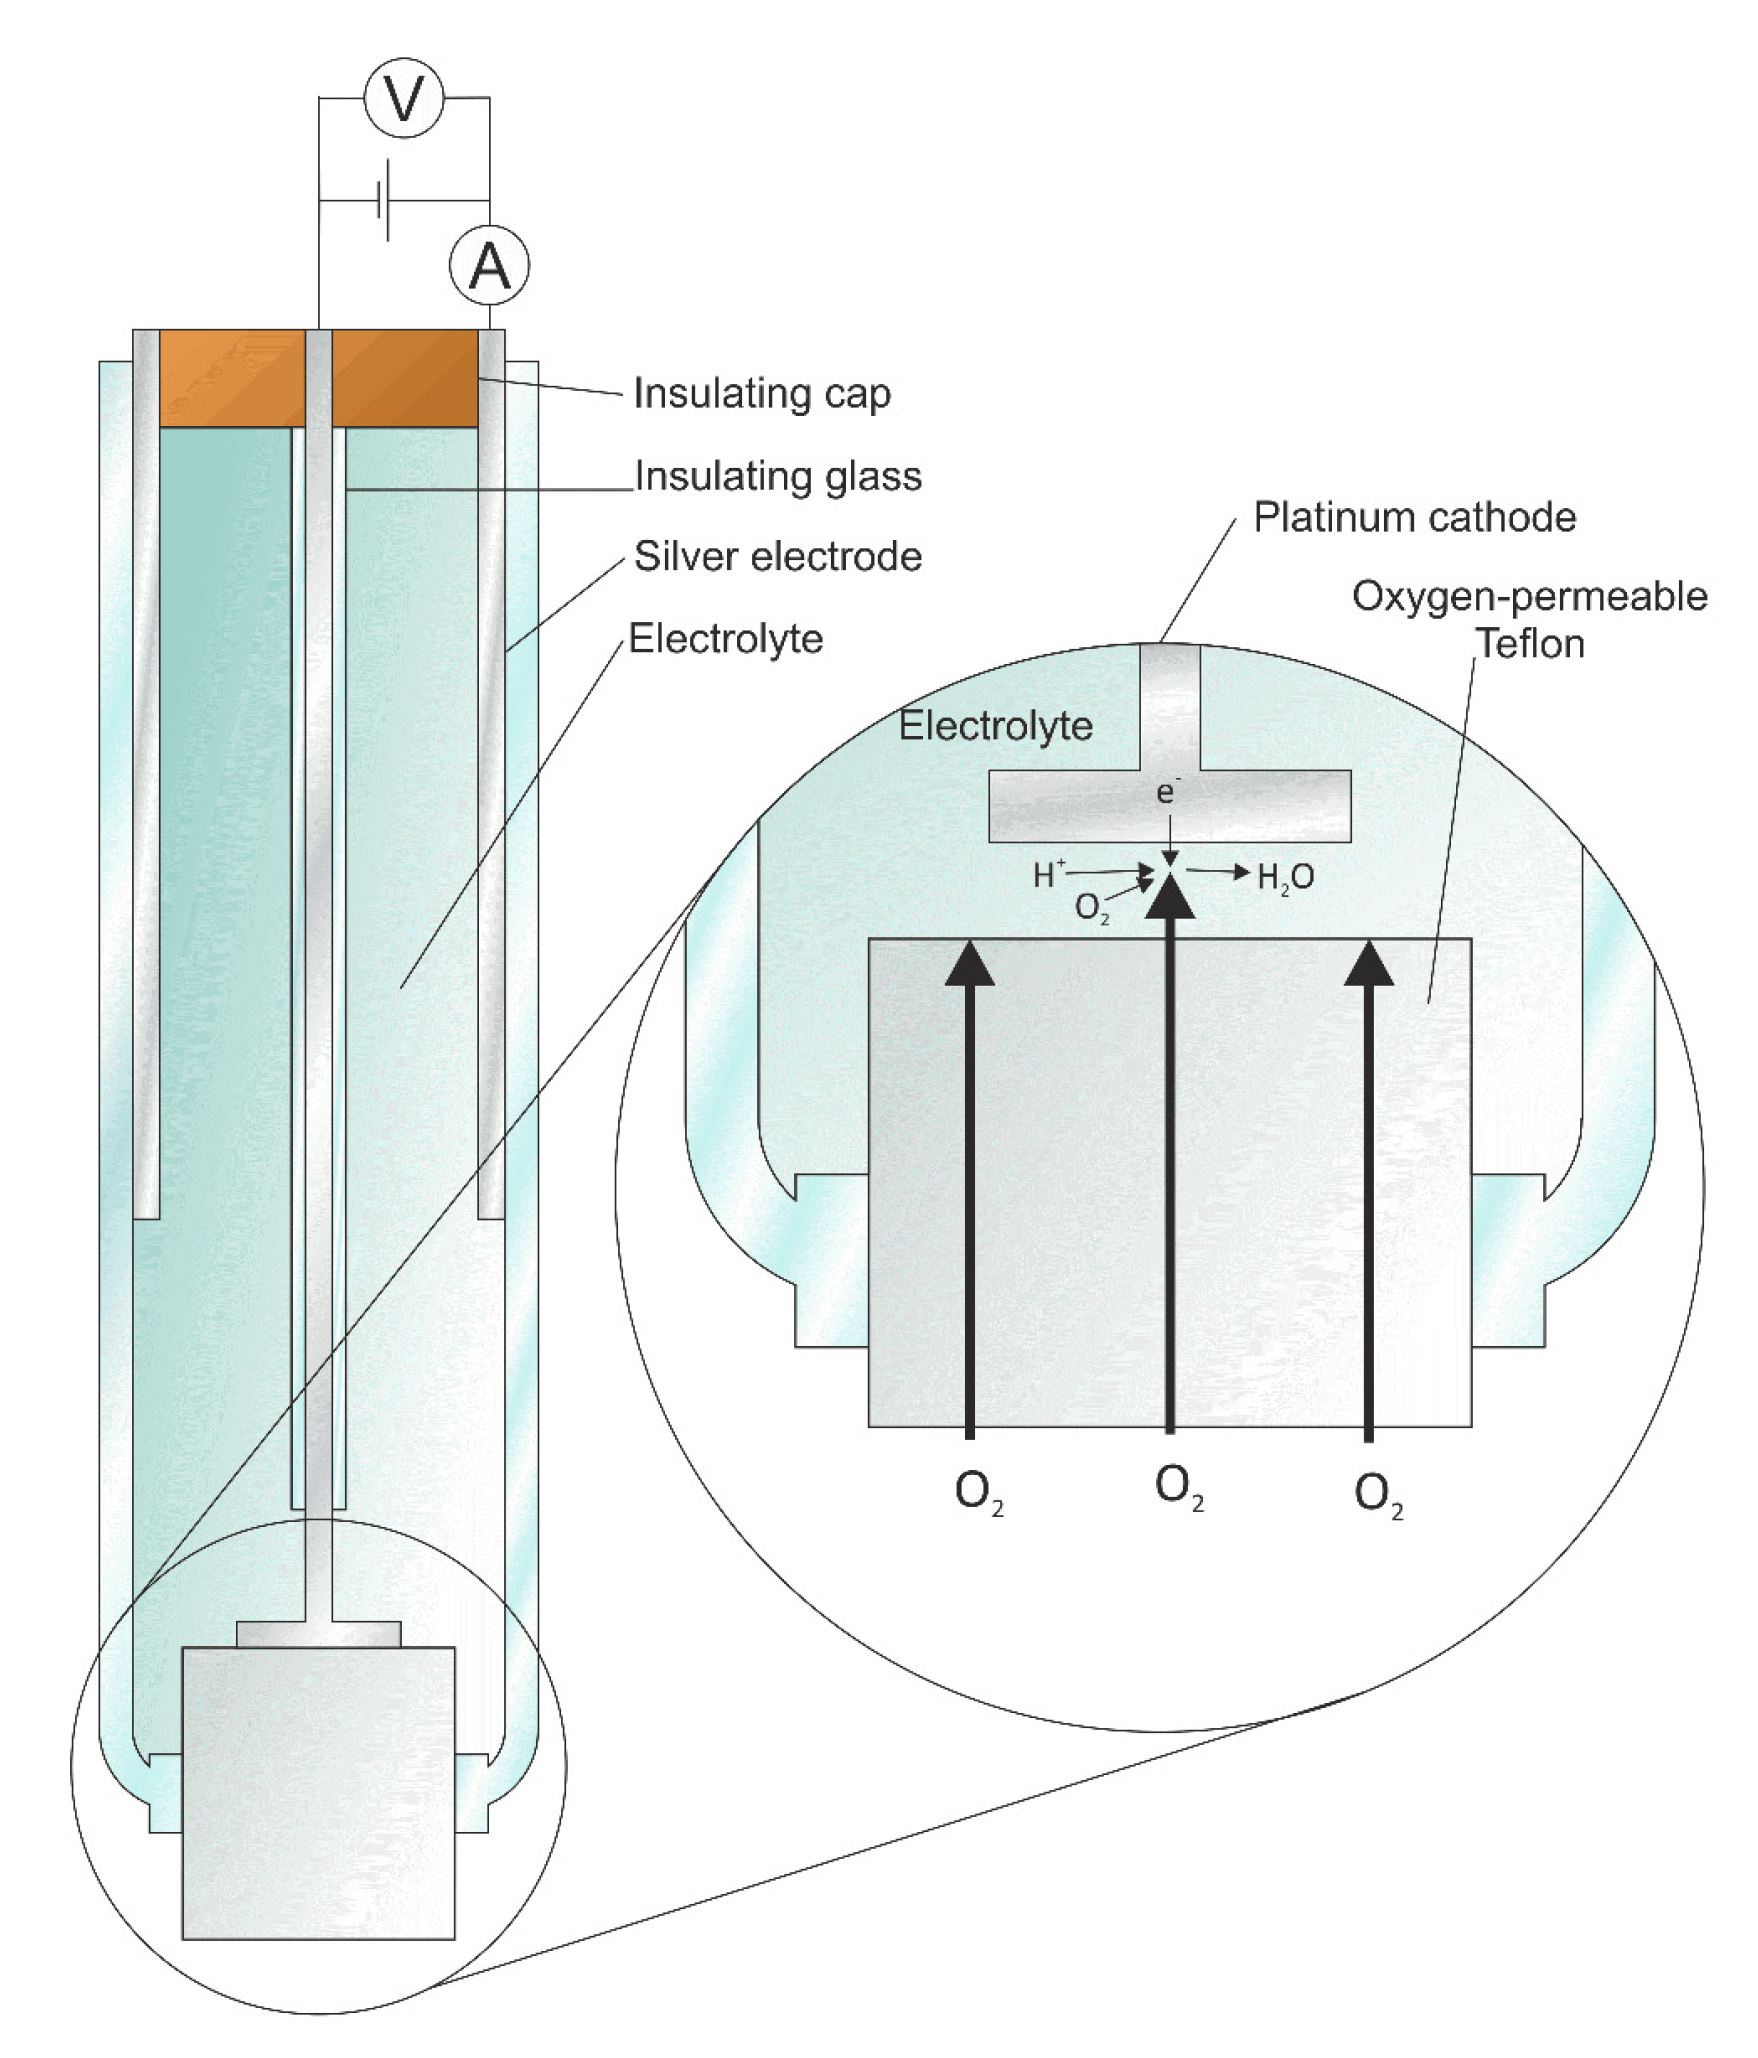
In 1962, Clark and Lyons invented the first biosensor for detecting glucose [17]. This sensor, called an oxygen electrode sensor, consisted of an oxygen electrode, an inner oxygen-semipermeable layer, a thin layer of GOx, and an outer dialysis membrane [20], as shown in Figure 2. This glucose biosensor was based on the following chemical reaction [21]:
Here, the enzyme glucose oxidase (GOD) catalyzes the oxidation of glucose into gluconic acid. At the electrode:
Updike and Hicks made a simplified glucose assay electrochemically through immobilization and stabilization of the GOx since they invented the first glucose biosensor in 1962 [18,22]. Also, they proposed the immobilization of GOx in a polyacrylamide gel on an oxygen electrode and measured the glucose concentration in a biofluid system [18]. In 1975, the first commercial glucose sensors using Clark’s method were initiated, and these sensors were based on amperometric detection of hydrogen peroxide. The peroxide formation could be easily measured in the context of miniature devices [23]. However, the main problem was that the amperometric measurement of hydrogen peroxide needs a high operation potential for enhancing selectivity [24].
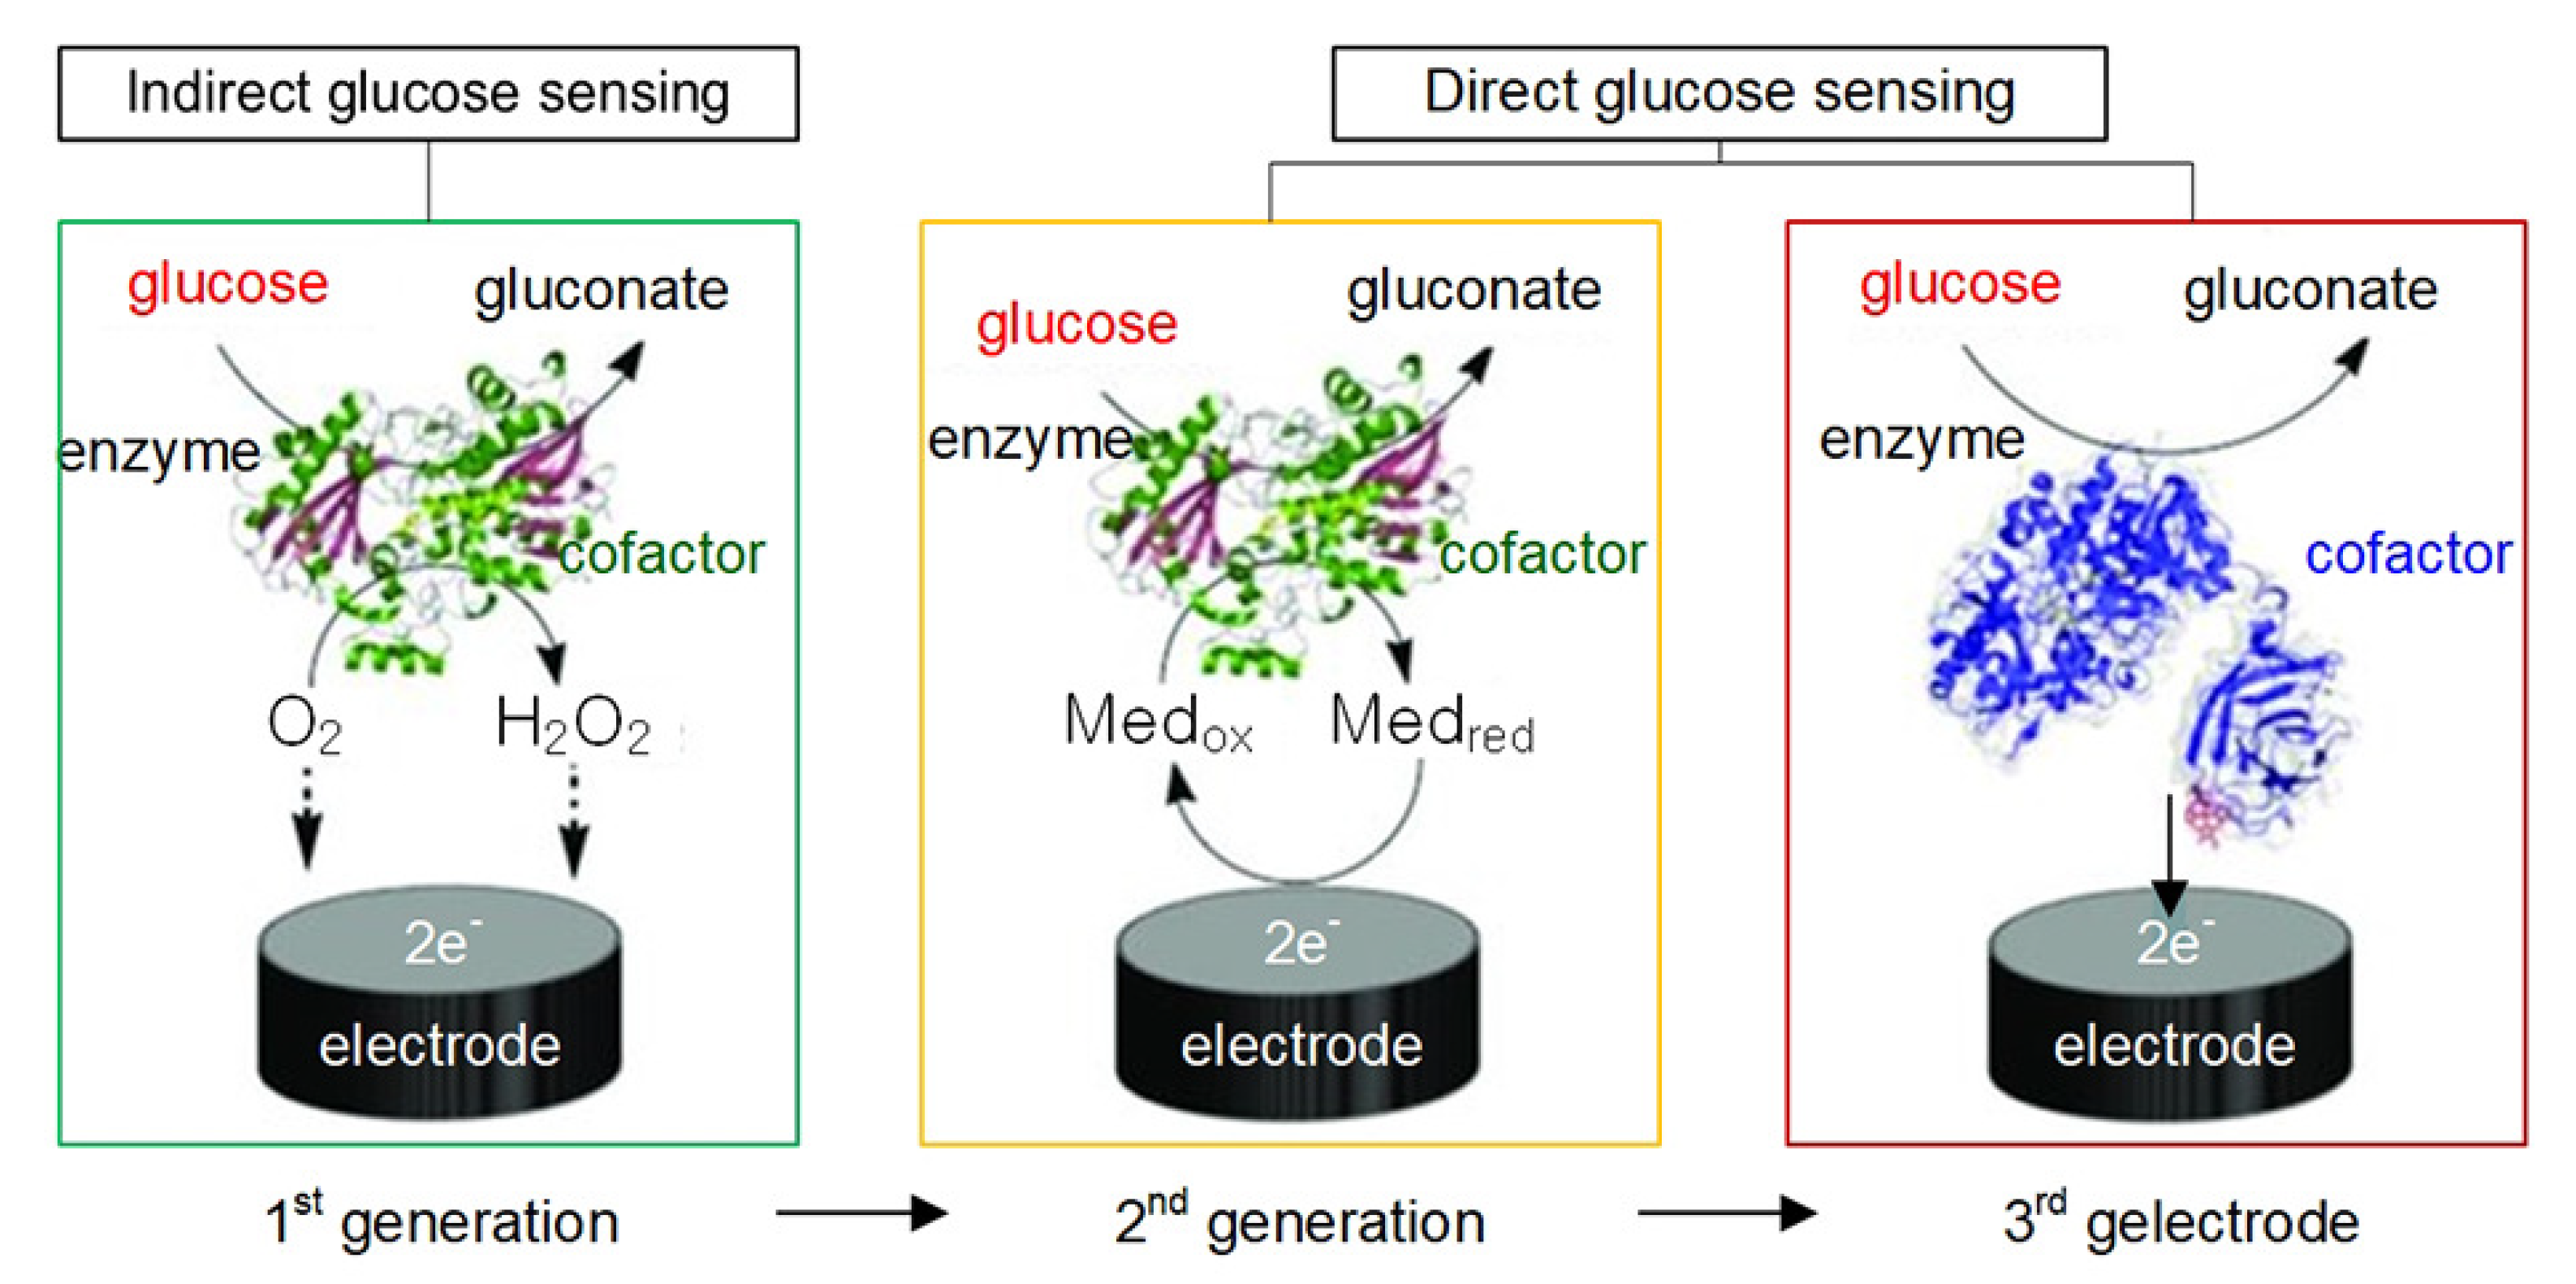
2.3. Second-Generation (2nd G) Glucose Biosensors
During the 1980s, glucose biosensors became a popular topic of research, reflecting the growing emphasis on biotechnology. To overcome the limitations of first-generation glucose biosensors, redox mediators carrying electrons from the enzyme to the surface of the working electrode [25] were introduced. During this decade, intense efforts were focused on developing redox-mediator-based glucose biosensors [26,27], called second-generation glucose biosensors. Thus, a variety of electron mediators, such as ferrocene, ferricyanide, quinine, tetrathiafulvalene (TTF), tetracyanoquinodimethane (TCNQ), thionine, methylene blue, and methyl viologen, were used to improve sensor performance [26,27,28,29]. In addition, various techniques to promote electron transfer between the GOx redox center and the electrode surface were used, such as enzyme wiring of GOx with electron-conducting redox hydrogels, the chemical modification of GOx using electron-relay groups, and the application of nanomaterials as electrical connectors [23,30,31,32].
2.4. Third-Generation (3rd G) Glucose Biosensors
In the 1990s, third-generation glucose biosensors emerged, which were reagentless and based on direct transfer between the enzyme and the electrode without mediators. To avoid the need for highly toxic mediators, the electrode can perform direct electron transfer using organic conducting materials based on charge-transfer complexes [33,34], as shown in Figure 3. As a result, third-generation glucose biosensors have led to implantable, needle-type devices for continuous in vivo monitoring of blood glucose. The absence of mediators also endows these biosensors with superior selectivity.
As described above, the majority of glucose biosensors developed over the last few decades have been of the electrochemical type because of their better sensitivity, higher reproducibility, ease of maintenance, and low cost. The major historical landmarks in the development of electrochemical glucose biosensors are summarized in Table 1.
3. Radio-Frequency Characteristics of Glucose
3.1. Dielectric Properties of Glucose
Dielectric properties are critical factors in gaining a better understanding of the interactions of microwaves with aqueous glucose solutions. The dielectric properties of a material are defined in terms of its dielectric constant () and loss factor (). is a measure of the ability of a material to couple with microwave energy, and is a measure of the ability of a material to be heated by absorbing microwave energy [37].
Cole-Cole Model of the Dielectric Constant of an Aqueous Glucose Solution
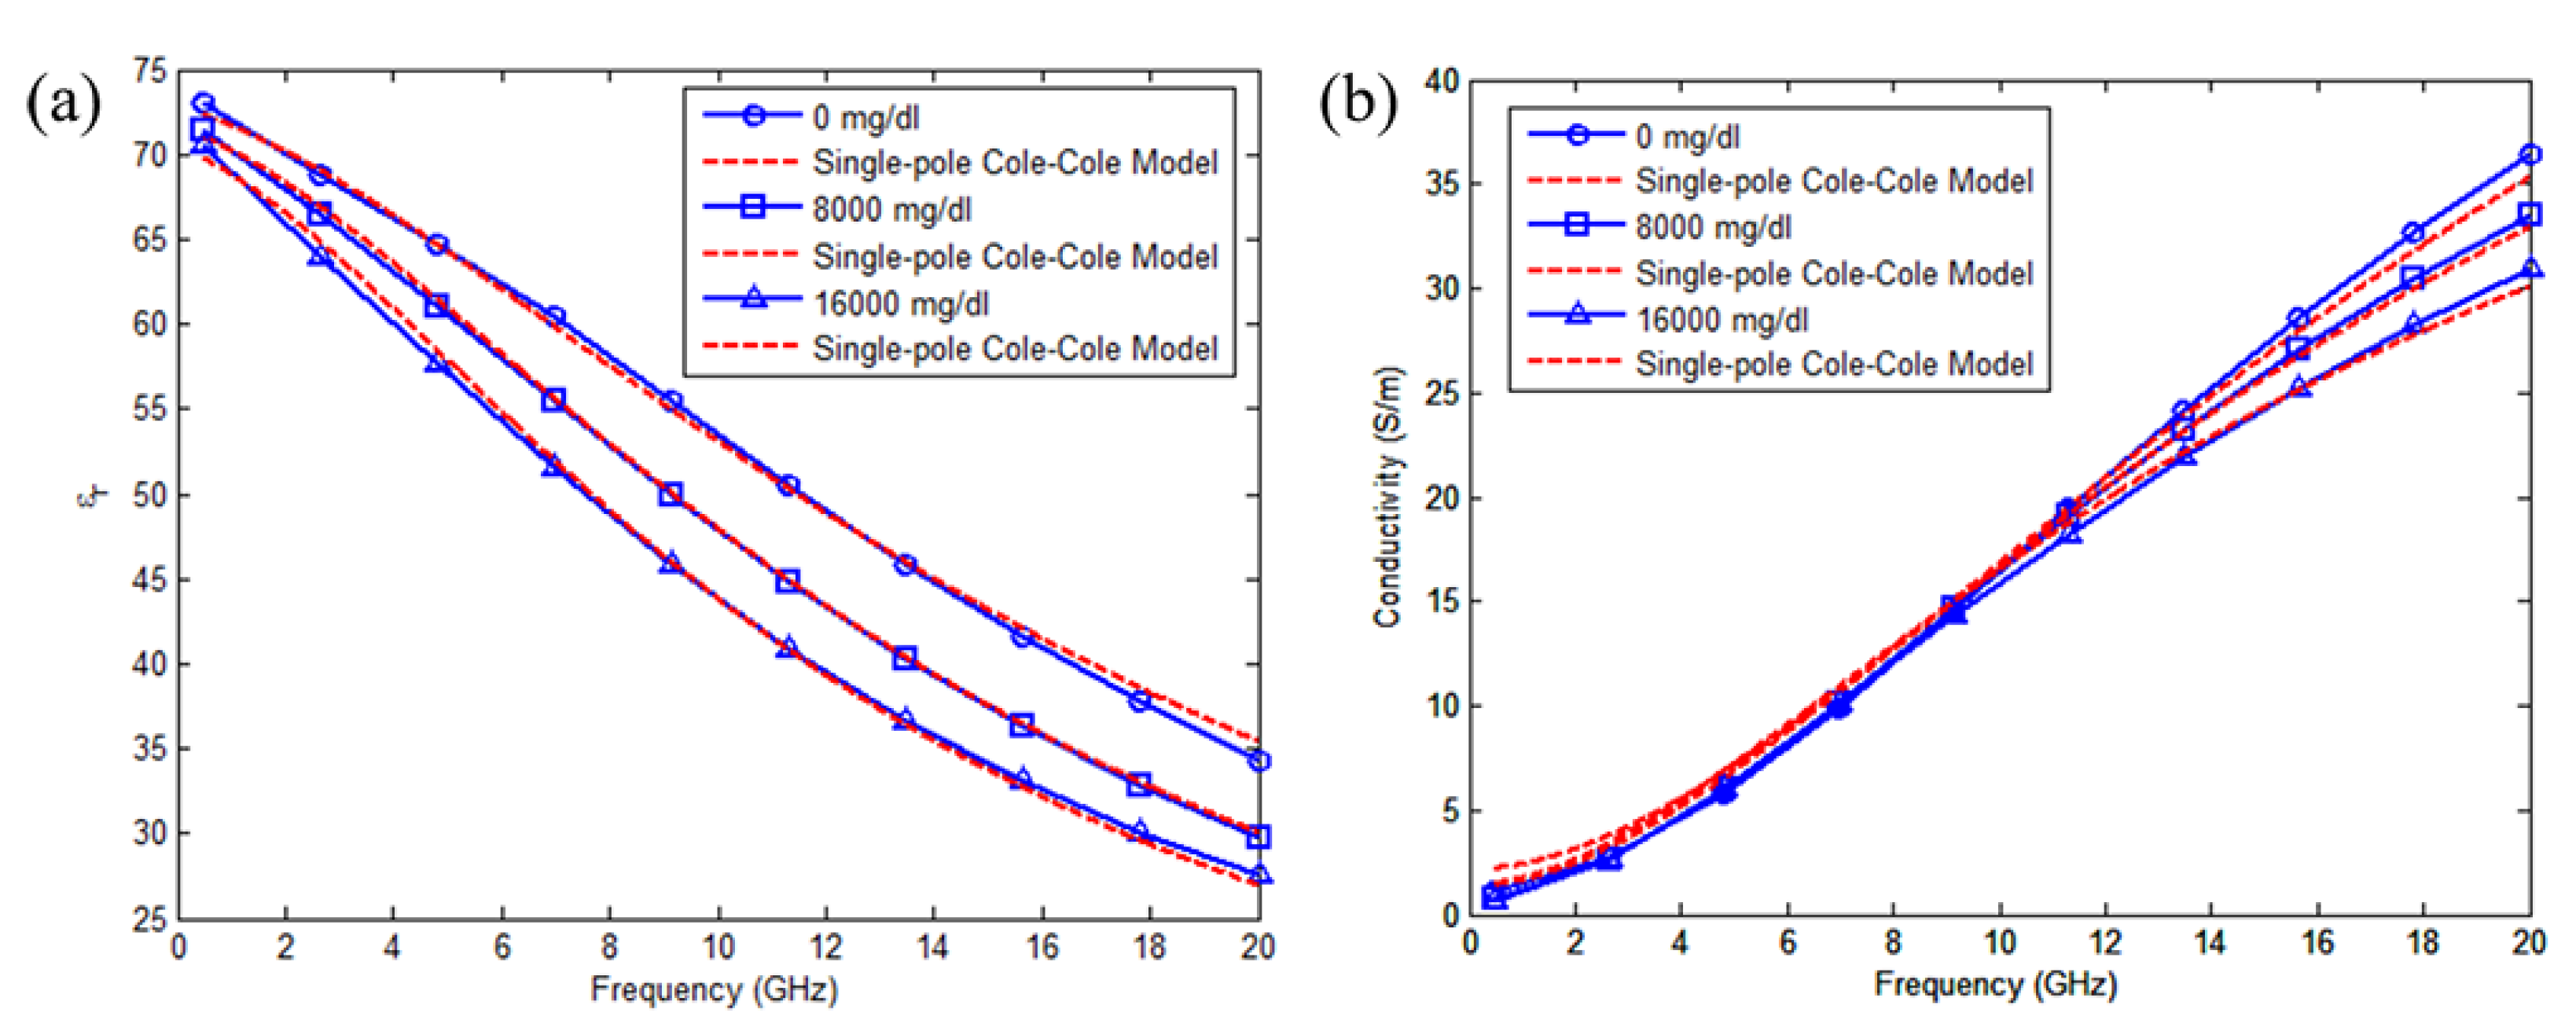
The Cole-Cole model offers an efficient and accurate representation of many types of biological tissues over a very broad frequency band and has been recently used to reduce the complexity of the experimental data obtained for various human tissues, such as brain, fat, breast, skin, bone, and liver tissues [38,39,40,41,42]. A Cole-Cole fitting model for the wideband dielectric properties of aqueous solutions of various glucose concentrations has been proposed as follows [43]:
where is the angular frequency, is the dielectric constant as a function of frequency, is the dielectric loss as a function of frequency, is the static permittivity, is the permittivity at high frequency, n is the order of the Cole-Cole fitting model, is the relaxation time, is a coefficient representing the broadness of relaxation time distribution with value of 0 ≤ ≤ 1, and is the electrical conductivity. Based on the fitting formula given in (3), the real and imaginary permittivities at different concentrations are shown in Figure 4.
3.2. Dielectric Measurements of Aqueous Glucose Solutions
Recently, the applicability of microwave for noninvasive and continuous glucose monitoring has led to the investigation of the dielectric properties of blood and other liquids as a function of glucose concentration. For this purpose, the dielectric properties of blood [45], blood plasma [43], saline solutions [46], and deionized water [47] have been presented recent decades. Additionally, samples with various glucose levels have been measured using diverse RF measurement systems, such as antennas and resonators, as summarized in Table 2.
4. Radio-Frequency/Microwave-Based Glucose Sensors
4.1. Cavity-Type Glucose Sensors
Microwave cavity perturbation theory is widely used to determine the electrical properties of materials with high accuracy [58]. If a dielectric material is located in a microwave cavity, the resonant frequency will be perturbed [59]. Because glucose solutions of different concentrations have distinct electrical properties, the glucose concentration can be estimated from the change in the cavity characteristics by using the microwave cavity perturbation method.
Based on Maxwell’s equations and microwave cavity perturbation theory [60,61], the shift in the resonant frequency of a microwave cavity due to the presence of material in the cavity is expressed as follows:
where and are the measured frequency and the initial resonant frequency, respectively; and represent the initial states of permittivity and permeability, respectively; and are the variations in permittivity and permeability, respectively; and and represent the electric field intensity and magnetic field intensity, respectively.
At the resonant frequency, the time-averaged stored electric energy and magnetic energy are equal, and under the assumption that the dielectric material is located at the maximum electric field intensity, the resonant frequency shift can be simplified as follows:
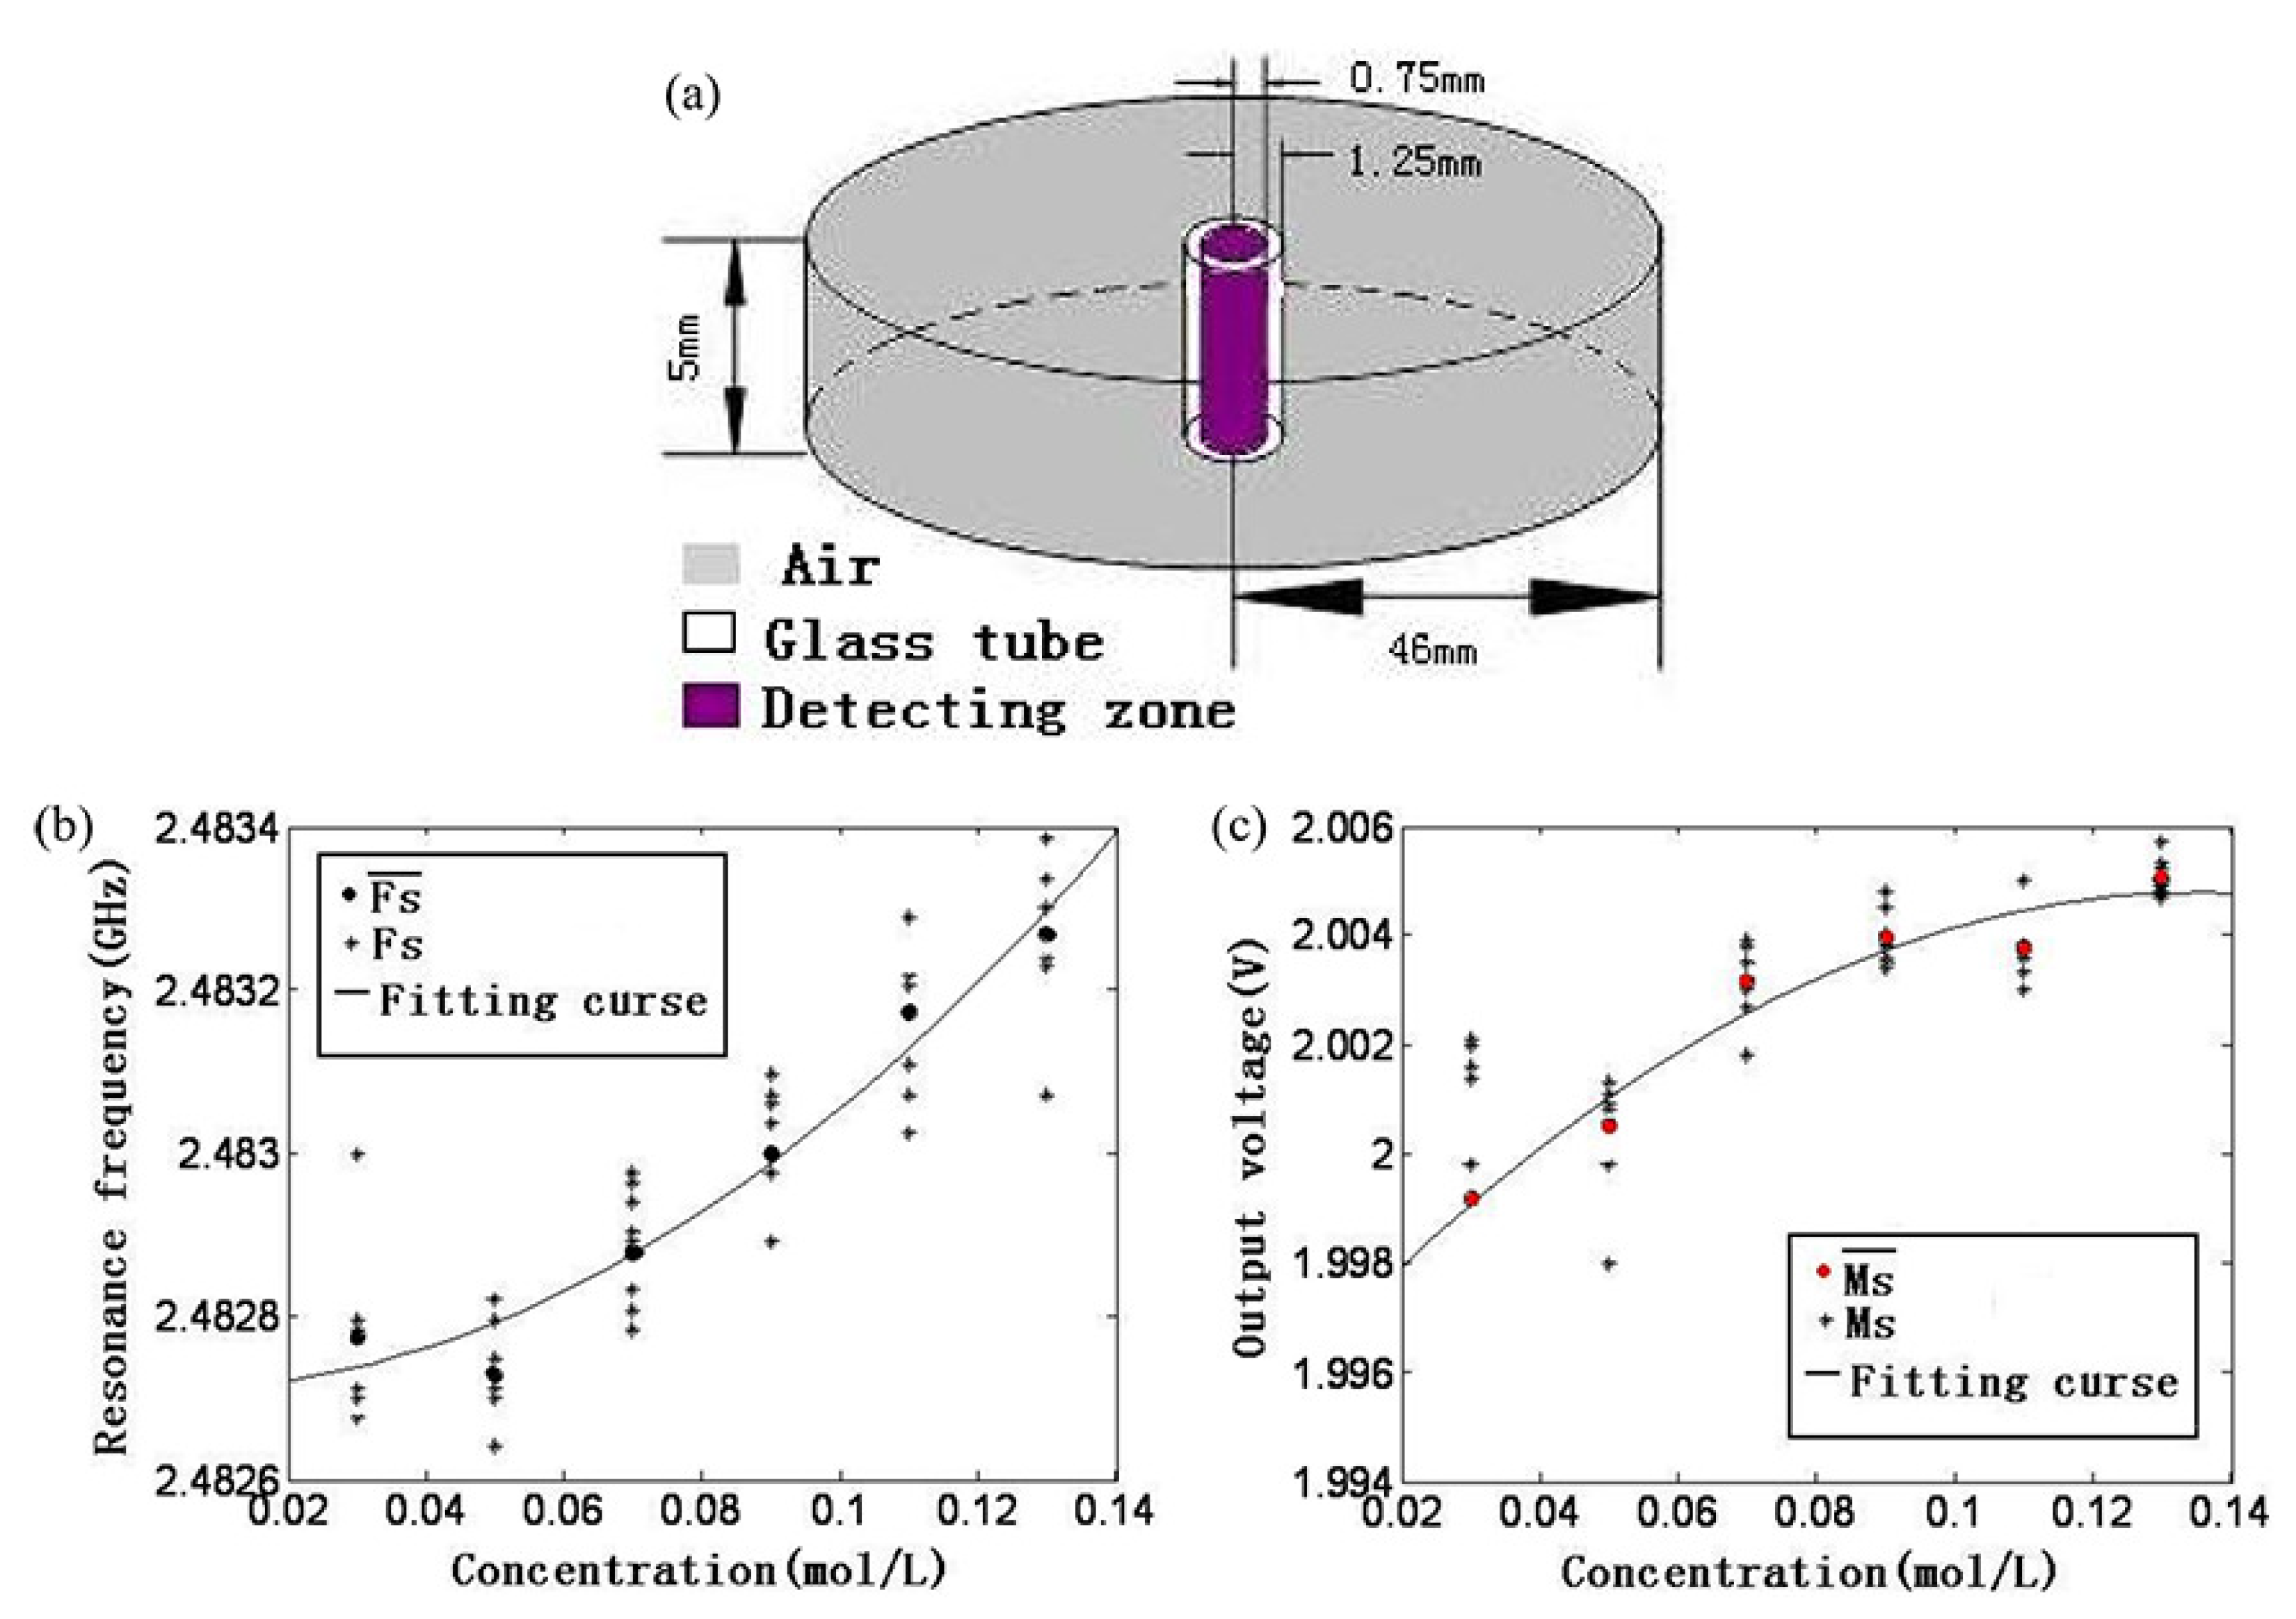
Wang et al. proposed a glucose sensor based on a mode microwave cavity with a resonant frequency of 3 GHz combined with a digital signal processing (DSP) block and a microwave power detector [62]. The DSP block generates a microwave sweep signal from DC to 3 GHz for input to the cavity as a controller. Additionally, it samples and analyzes the output signal of the cavity through the microwave power detector as a signal processor. Glucose solutions with different concentrations of 50, 90, and 120 mmol/L were placed at the location of the maximum electric field intensity, and the sensor detected them based on the variations in the frequency shift and the amplitude of the output power. Both the resonant frequency and amplitude increased as the concentration of the glucose solution increased. Fan et al. proposed a glucose sensor consisting of a mode cylindrical cavity, as shown in Figure 5a, which resonates at 3 GHz; a microwave scanning generator; a detection circuit; an A/D converter; and a D/A converter [63]. The electric field of the microwave cylindrical cavity reaches its maximum at the center of the cavity. Thus, the glass tube for loading glucose solutions with different concentrations of 30, 50, 70, 90, 110, and 130 mmol/L was also placed at the center. Both the resonant frequency of the cavity and the output voltage of the detection circuit were demonstrated to increase with an increasing glucose concentration, as shown in Figure 5b,c.
Li et al. measured glucose concentrations from 70 mg/dL to 150 mg/dL in steps of 10 mg/dL using a mode microwave cavity [64]. The mode was selected due to its low loss and high Q-factor. The cavity is coupled with a waveguide through a small aperture to assemble a measurement system. The resonant frequency of the glucose sensor is 7.542 GHz. A capillary tube containing the glucose solution penetrates the center of the cavity. The measurement results showed that the resonant frequency increases linearly as the glucose concentration increases.
4.2. Microprobe-Type Glucose Sensors
The glucose concentration of a sample can also be detected from the changes in the reflection coefficient and transmission coefficient of a microwave cavity using a near-field microwave microprobe (NFMM) [65]. Based on standard transmission line theory, the reflection coefficient is expressed as follows:
where is the complex input impedance of the sensor and is the complex impedance of the microstrip line, which is typically 50 . The value of depends on the permittivity; thus, a change in the glucose concentration causes a change in .
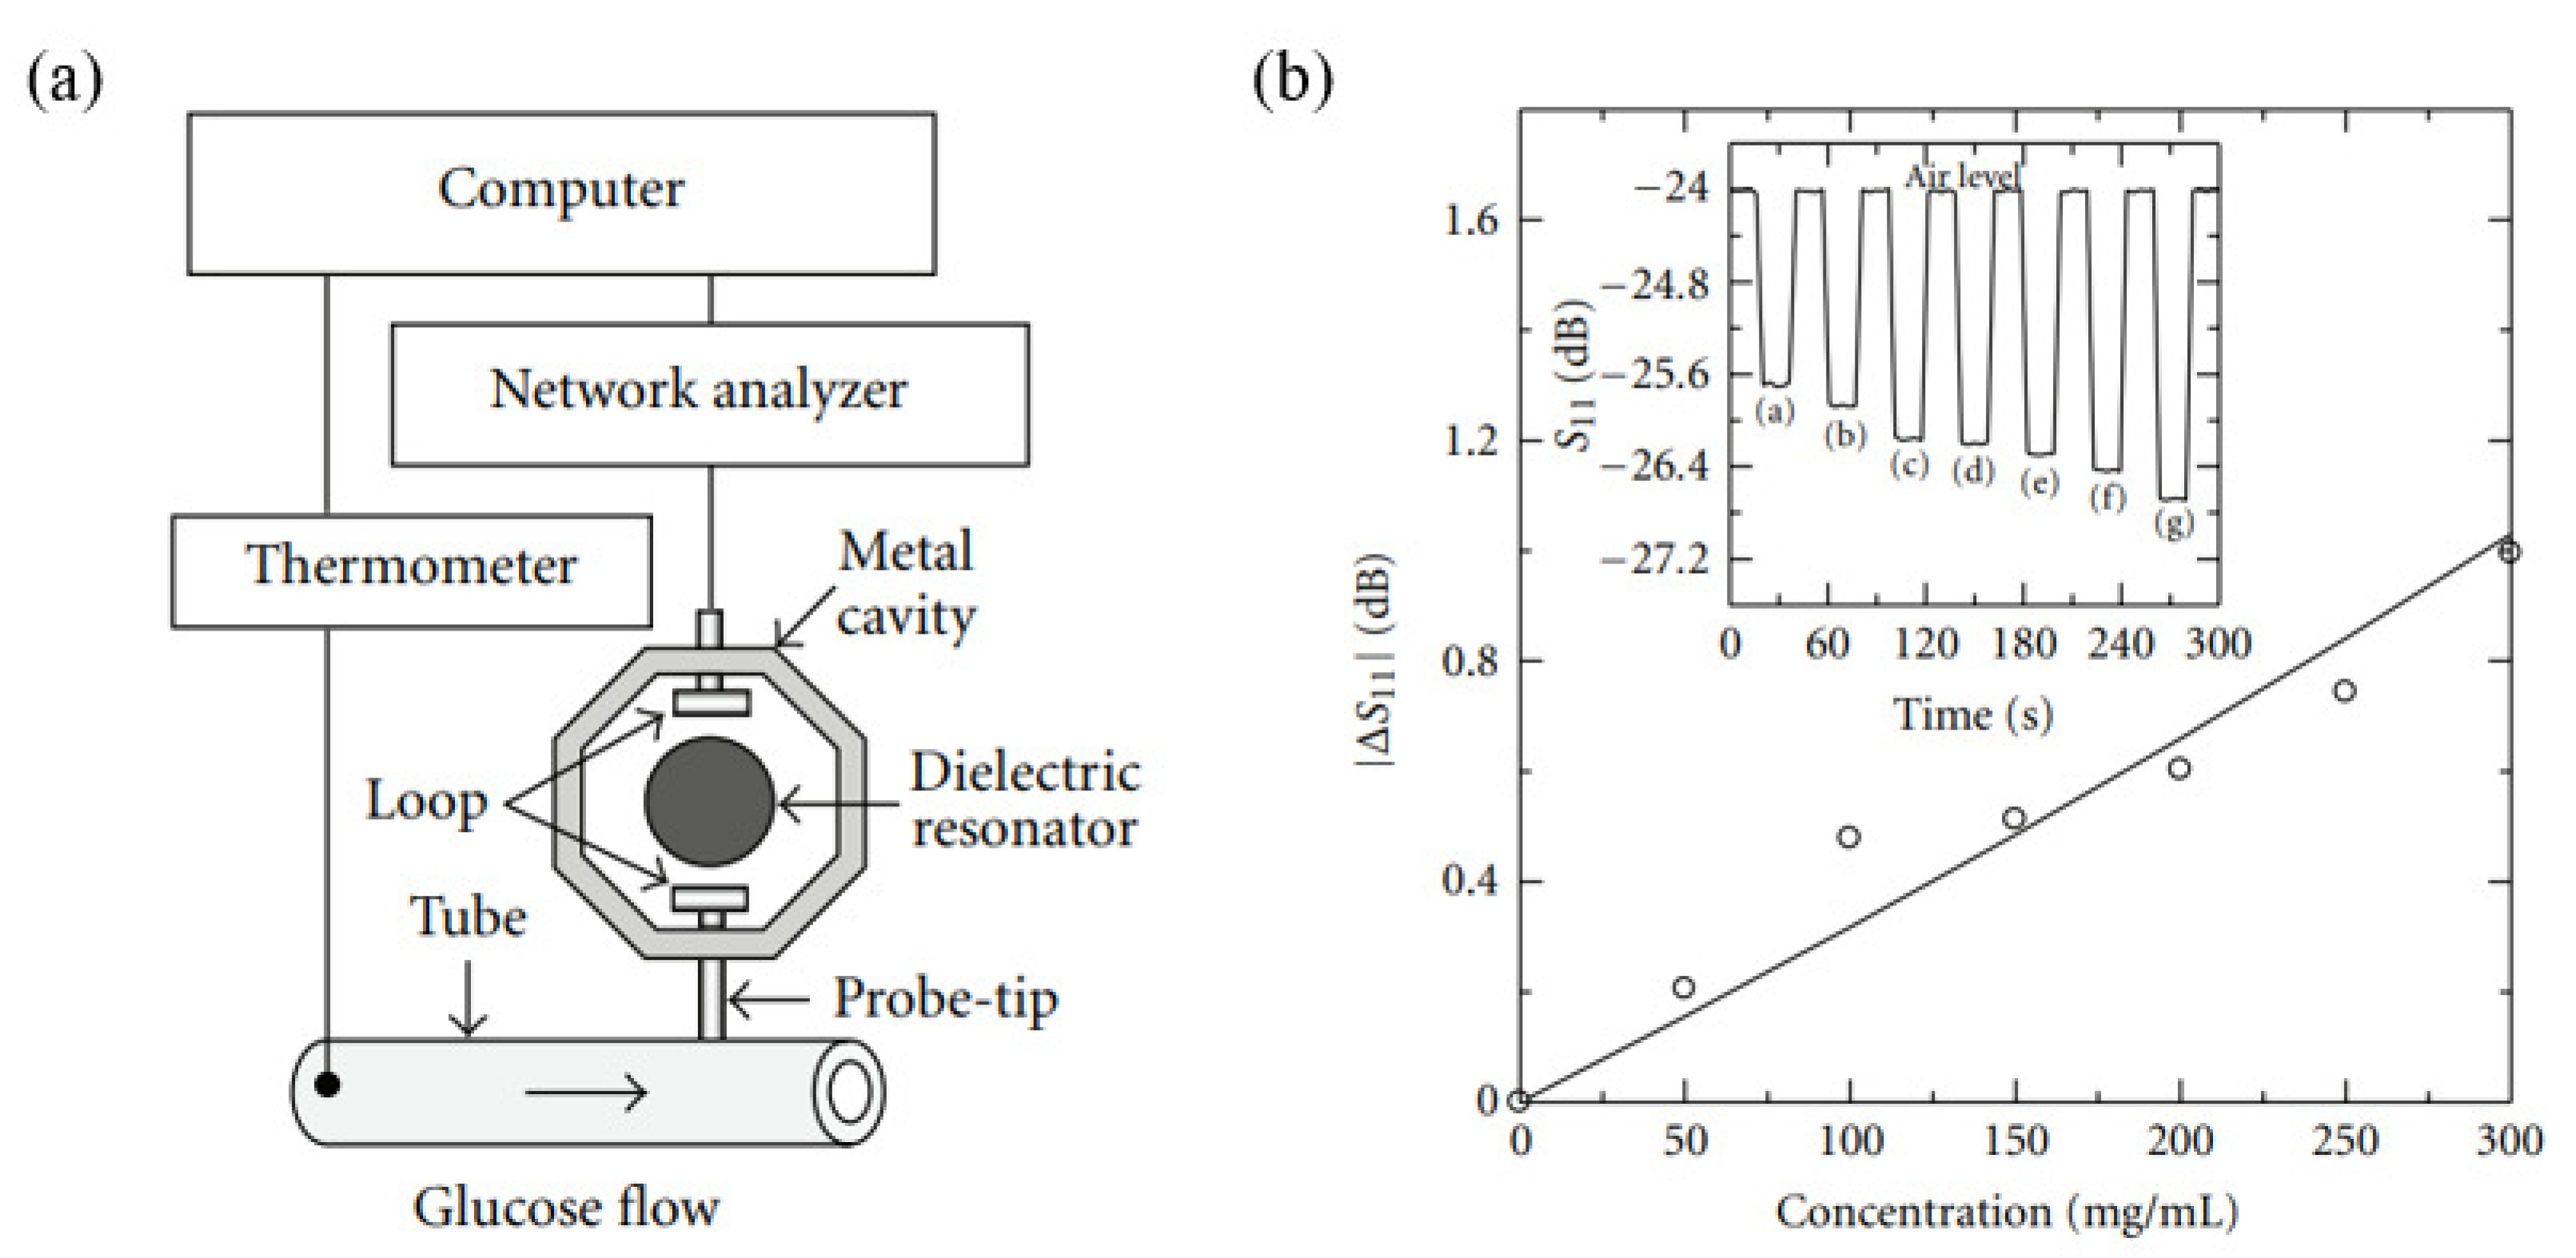
Bababjanyan et al. measured glucose concentrations in a range of 0 to 300 mg/mL from the changes in the reflection coefficient [66]. The sensor consisted of a high Q-factor dielectric resonator, a mode metal cavity with an Al probe tip, and a silicone tube containing the glucose solution, as shown in Figure 6a. The resonant frequency of the sensor was 4.6 GHz, and the unloaded Q-factor was 24,000. The sensor can be analyzed based on an equivalent impedance model of the probe-sample configuration. For this sensor, the complex input impedance is expressed as follows:
where is the complex impedance of air (377 ); is the wave vector in air; and are the wall thickness and diameter, respectively, of the cylindrical silicon tube; and and are the permittivities of the silicon tube and the glucose solution, respectively. As the glucose concentration increases, the reflection coefficient increases, as shown in Figure 6b.
Lee et al. proposed a glucose sensor based on a dielectric resonator, a mode cavity, and a microwave microprobe [67]. The resonant frequency of this sensor is 4.5 GHz. The change in the reflection coefficient was used to detect glucose solutions with different concentrations from 0 to 10 mg/mL. The complex input impedance is written as follows:
where is the complex impedance of free space, is the wave vector of free space, is the thickness of the glucose solution, and and are the relative permittivities of the glucose solution and the glass substrate, respectively. The sensor response was analyzed according to the sample volume. The reflection coefficient of the sensor increases with increasing sample volume but saturates at approximately 50 L. The measurement results showed that the reflection coefficient also increases with an increasing glucose concentration.
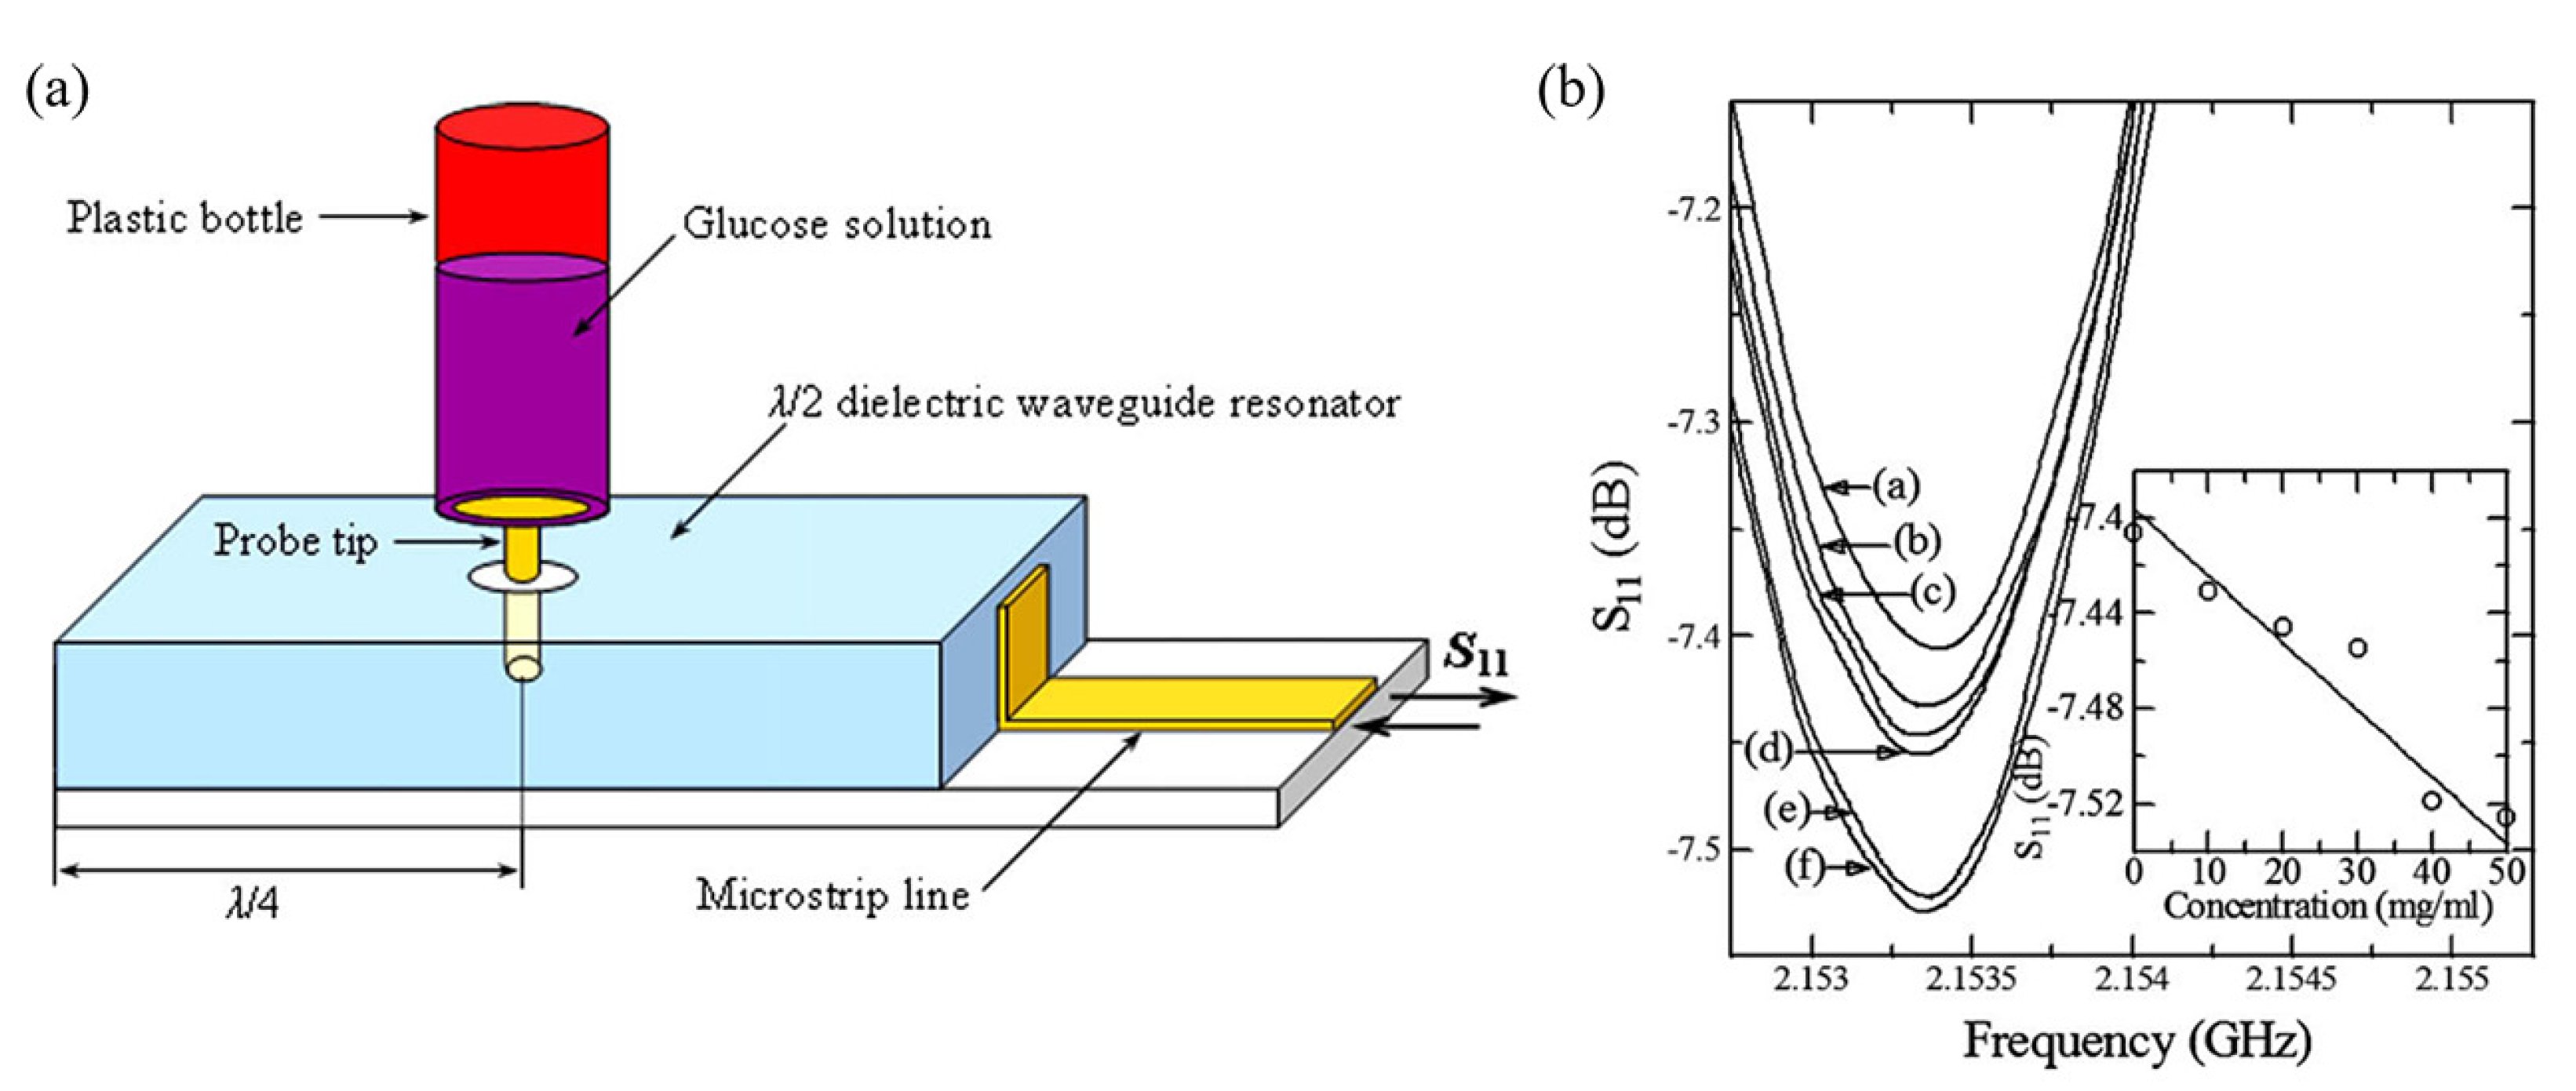
Kim et al. measured glucose solutions of 0–50 mg/mL using a microwave dielectric waveguide probe [68]. The probe-based sensor consisted of a half-wavelength dielectric resonator coupled with a microstrip line, and the resonant frequency was 2.15 GHz, as shown in Figure 7a. The complex input impedance of the sensor is expressed as follows:
where is the complex impedance of free space, is the wave vector in air, is the thickness of the substrate, is the relative permittivity of the glucose solution, and and are the volume and surface area of the glucose solution, respectively. As the glucose concentration increases, the reflection coefficient decreases, as shown in Figure 7b.
4.3. SIW-Type Glucose Sensors
Nonplanar geometrical designs present limitations in terms of the complexity of fabrication, the high manufacturing cost, and the difficulty of achieving a sufficient sample volume. The sensor is immersed in the liquid sample to permit interaction between the electromagnetic waves and the dielectric properties of the sample [69]. Substrate-integrated waveguides (SIWs) are widely used for liquid characterization because of their high Q-factor with low measurement errors, low cost and straightforward design [70,71]. The principle of the frequency shift when using an SIW is developed from the conventional cavity perturbation method. However, there is one difference in terms of the dielectric permittivity [72]. In the conventional cavity perturbation method, the permittivity of air is used, whereas in the case of an SIW, the effective permittivity of the dielectric substrate is used. Thus, the frequency shift of an SIW is given as follows:
where the left-hand side represents the fractional change in the resonant frequency due to the introduction of the sample into the cavity; and are the complex permittivities of the sample and substrate, respectively; and represent the volumes of the sample and cavity, respectively; and and E are the initial and perturbed electric fields of the cavity, respectively. Kiani et al. proposed a planar SIW-type glucose sensor [73]. A hexagonal slot is etched on the top plane of the SIW, and a modified split-ring resonator (SRR) is connected to the slot for the planar sensing region. To focus the electric field on the sensing spot, two curved slots are added to the top plane of the sensor. In terms of transmission characteristics, the sensor acts as a bandstop filter. The resonant frequency of the sensor is 5.8 GHz, and the unloaded Q-factor is 130. Glucose solutions with different concentrations of 105, 255, 400, and 500 mg/dL were detected based on the fractional change in the resonant frequency. When the glucose concentration increases, the resonant frequency also increases.
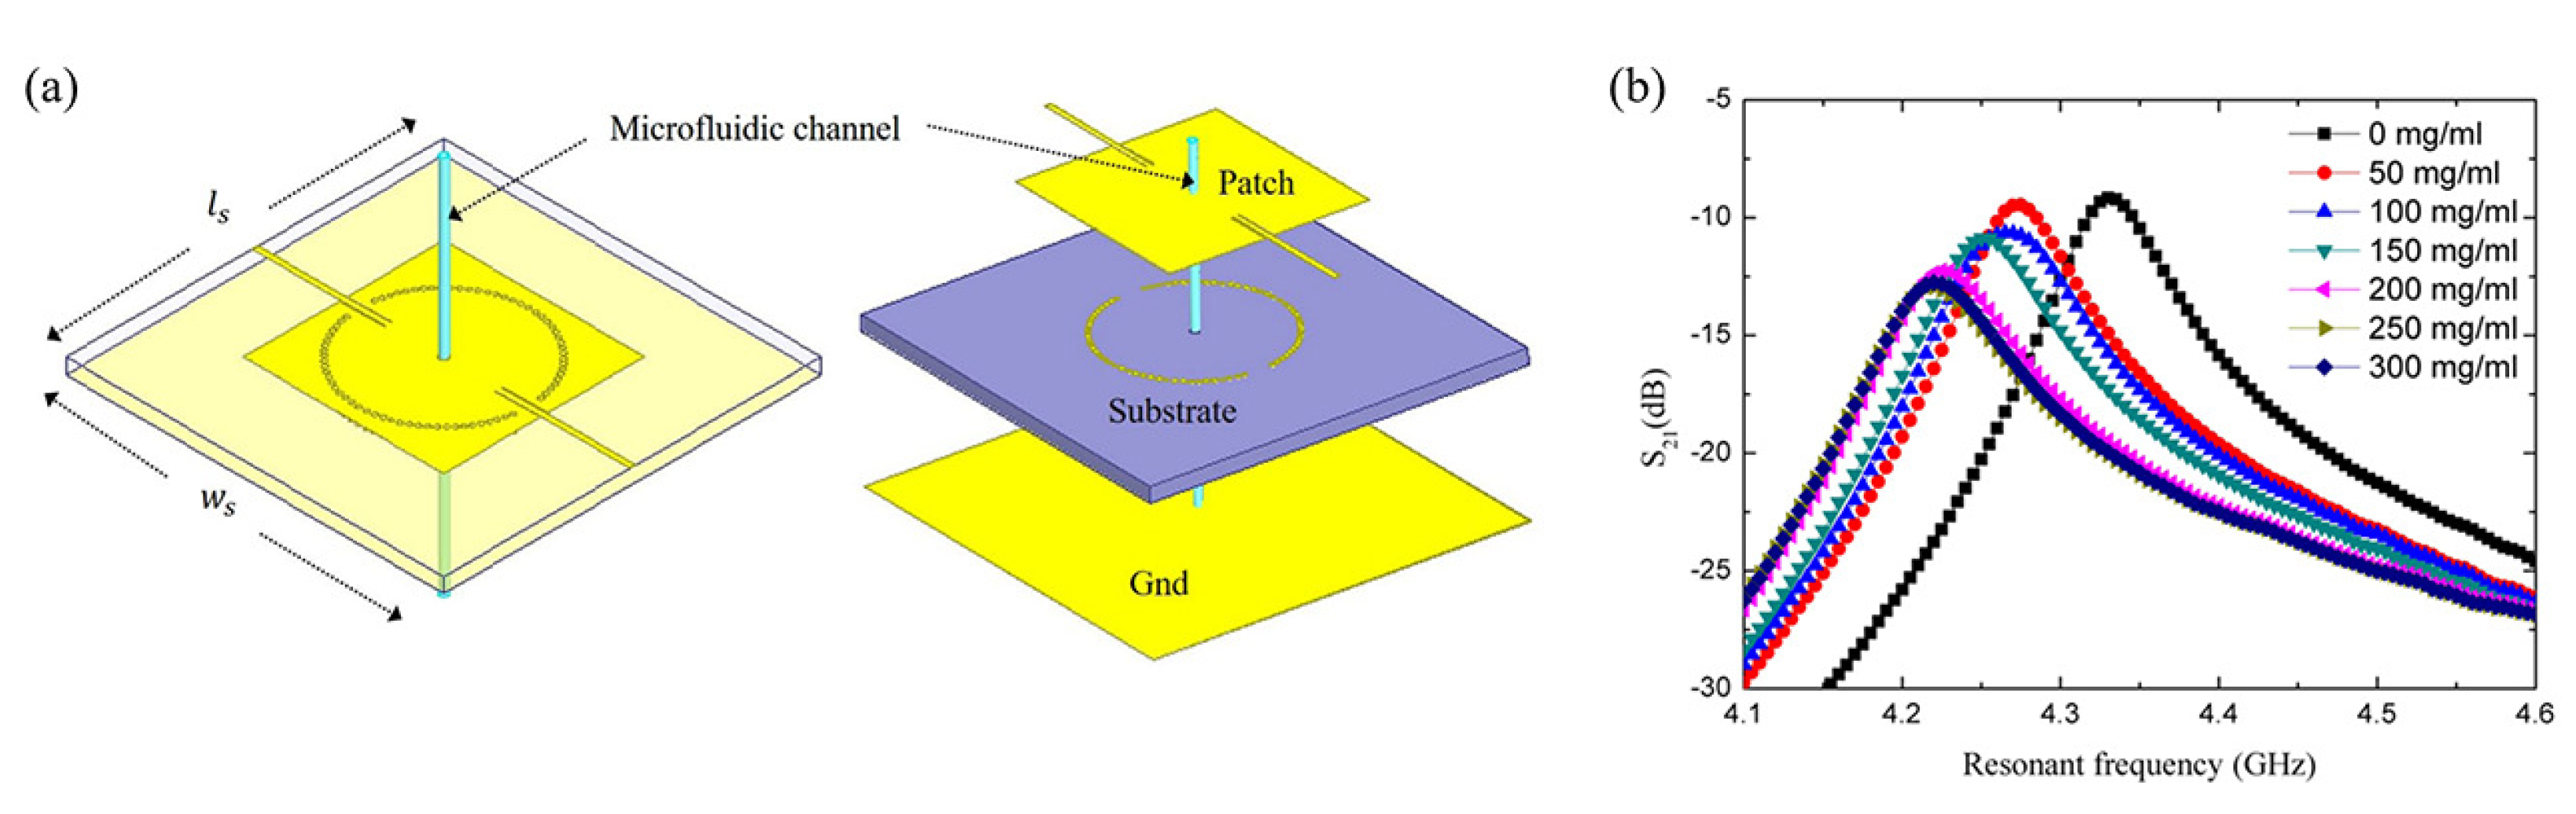
A planar SIW has advantages of a planar resonator, such as being compact, cost-effective, and more straightforward to fabricate than a cavity, but a large sample volume is still required [74]. To solve this problem, a 2-port circular SIW with a microfluidic subsystem for glucose concentration detection has been proposed [75]. The resonant frequency of the circular SIW is 4.4 GHz, and the transmission coefficient and Q-factor at the resonant frequency are −4.63 dB and 419, respectively. The electromagnetic field is strongest at the center of the circular SIW, so the sensing area is located at the center of the sensor. The microfluidic subsystem consists of a glass capillary and a channel slot, and this subsystem is transversely located at the center of the circular SIW where the electromagnetic near field is concentrated, as shown in Figure 8a. As an experimental demonstration, glucose solutions with different concentrations ranging from 0 mg/mL to 300 mg/mL in increments of 50 mg/mL were flowed through the glass capillary. The experimental results showed that both the resonant frequency and transmission coefficient decrease as the glucose concentration increases, as shown in Figure 8b.
4.4. Antenna-Type Glucose Sensors
The measurements using cavities or SIWs described in the previous subsections have limited potential for practical application to the human body because the sample needs to pass through the sensor. When using an antenna, the glucose concentration can be estimated without the need for the sample to penetrate into the sensor. Among the various candidate antenna structures, patch antennas are often used as sensors despite their narrow bandwidth because they are easy to design and fabricate [76,77,78]. For an arbitrary antenna, the boundary condition between the near field and the far field is as follows:
where D is the maximum physical dimension of the antenna and is the antenna wavelength. In the near-field region, the field impedances of the electric and magnetic dipoles differ significantly; specifically, the electric dipole has a very high field impedance, but the magnetic dipole has a low field impedance of approximately 0 [79]. Thus, the change in permittivity due to a change in glucose concentration can affect the near-field antenna coupling [80]. Based on these properties, several studies on glucose concentration detection using patch antennas operating in the near-field zone have been conducted in recent decades.
A glucose sensor based on two matched antennas has been proposed [80]. The sensor consists of a patch antenna and an SIW slot antenna. The sensor has been optimized by considering the dielectric and mounting properties of human tissues. Glucose solutions of different concentrations ranging from 50 mg/dL to 500 mg/dL in increments of 50 mg/dL were detected based on the frequency shift and transmission coefficient at 5.5 GHz. The results showed that both the frequency and the transmission coefficient linearly decrease as the glucose concentration increases. Xiao et al. presented measurements of glucose solutions from 0 mg/dL to 4000 mg/dL using a UWB microwave detection technique [81]. One pair of microstrip antennas was located on both sides of the human earlobe. To accurately estimate the glucose concentration, the short-time Fourier transform (STFT) was used. In measurements with the sensor attached to an earlobe phantom, the transmission coefficient decreased linearly for 0–4000 mg/dL glucose solutions at 6.5 GHz.
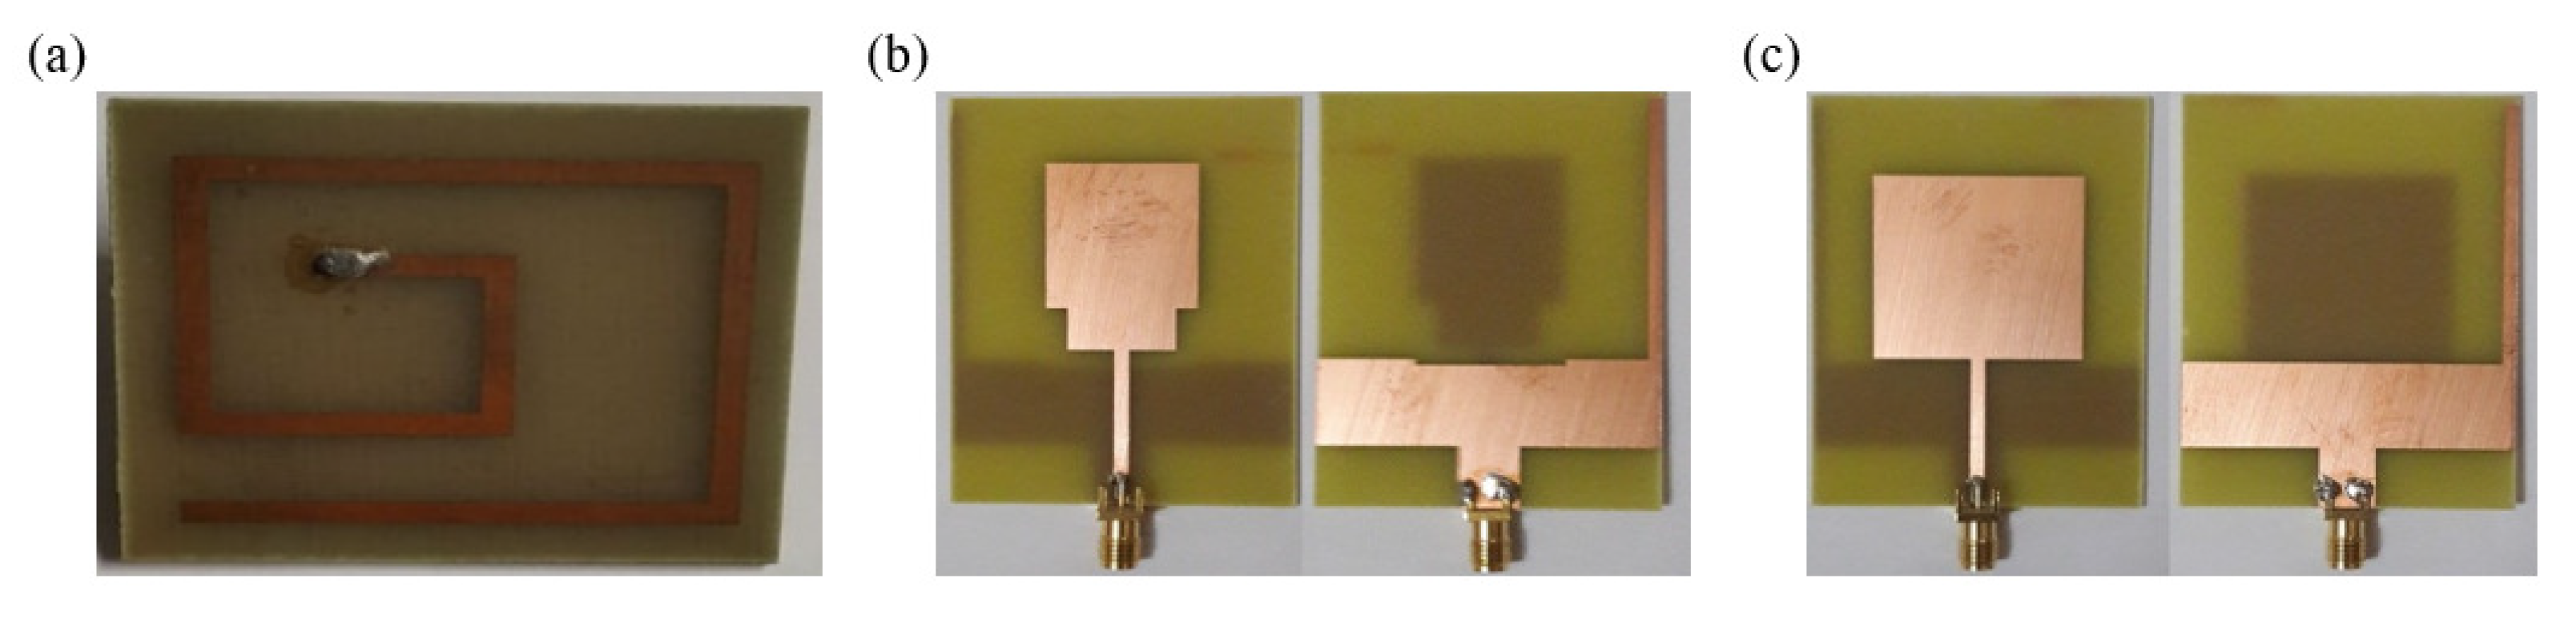
Glucose concentration detection has also been conducted based on the variation in the reflection coefficient of a U-shaped microwave antenna [82]. The minimum reflection coefficient of the unloaded U-shaped antenna was observed at 1.9 GHz. For 0–20 mg/mL glucose solutions, the electromagnetic field distribution of the antenna was analyzed. When the sensing area of the antenna was immersed in 40 mL glucose solutions of different concentrations from 0 to 40 mg/mL, the reflection coefficient decreased. Costanzo designed an inset-fed microstrip patch antenna for glucose detection [83]. The target frequency of the proposed antenna is 2.4 GHz. Dielectric data of glucose solutions from 100 mg/dL to 500 mg/dL were collected using a standard open-ended coaxial probe. Based on these data, a simulation was conducted with respect to the loss tangent variation as a function of the glucose concentration. The experimental results showed that the reflection coefficient of the inset-fed microstrip antenna decreases with an increasing glucose concentration, whereas the resonant frequency increases. Deshmukh et al. designed three microstrip antennas for glucose concentration detection [84]: the spiral antenna shown in Figure 9a, the UWB patch antenna shown in Figure 9b, and the narrowband patch antenna shown in Figure 9c. The center frequencies of the three antennas are 4.69 GHz, 3.6 GHz, and 1.357 GHz, respectively. For glucose solutions with concentrations from 100 mg/dL to 350 mg/dL, the frequency shifts of the three microstrip antennas were compared, and the narrowband patch antenna was found to be the most sensitive among the three antennas.
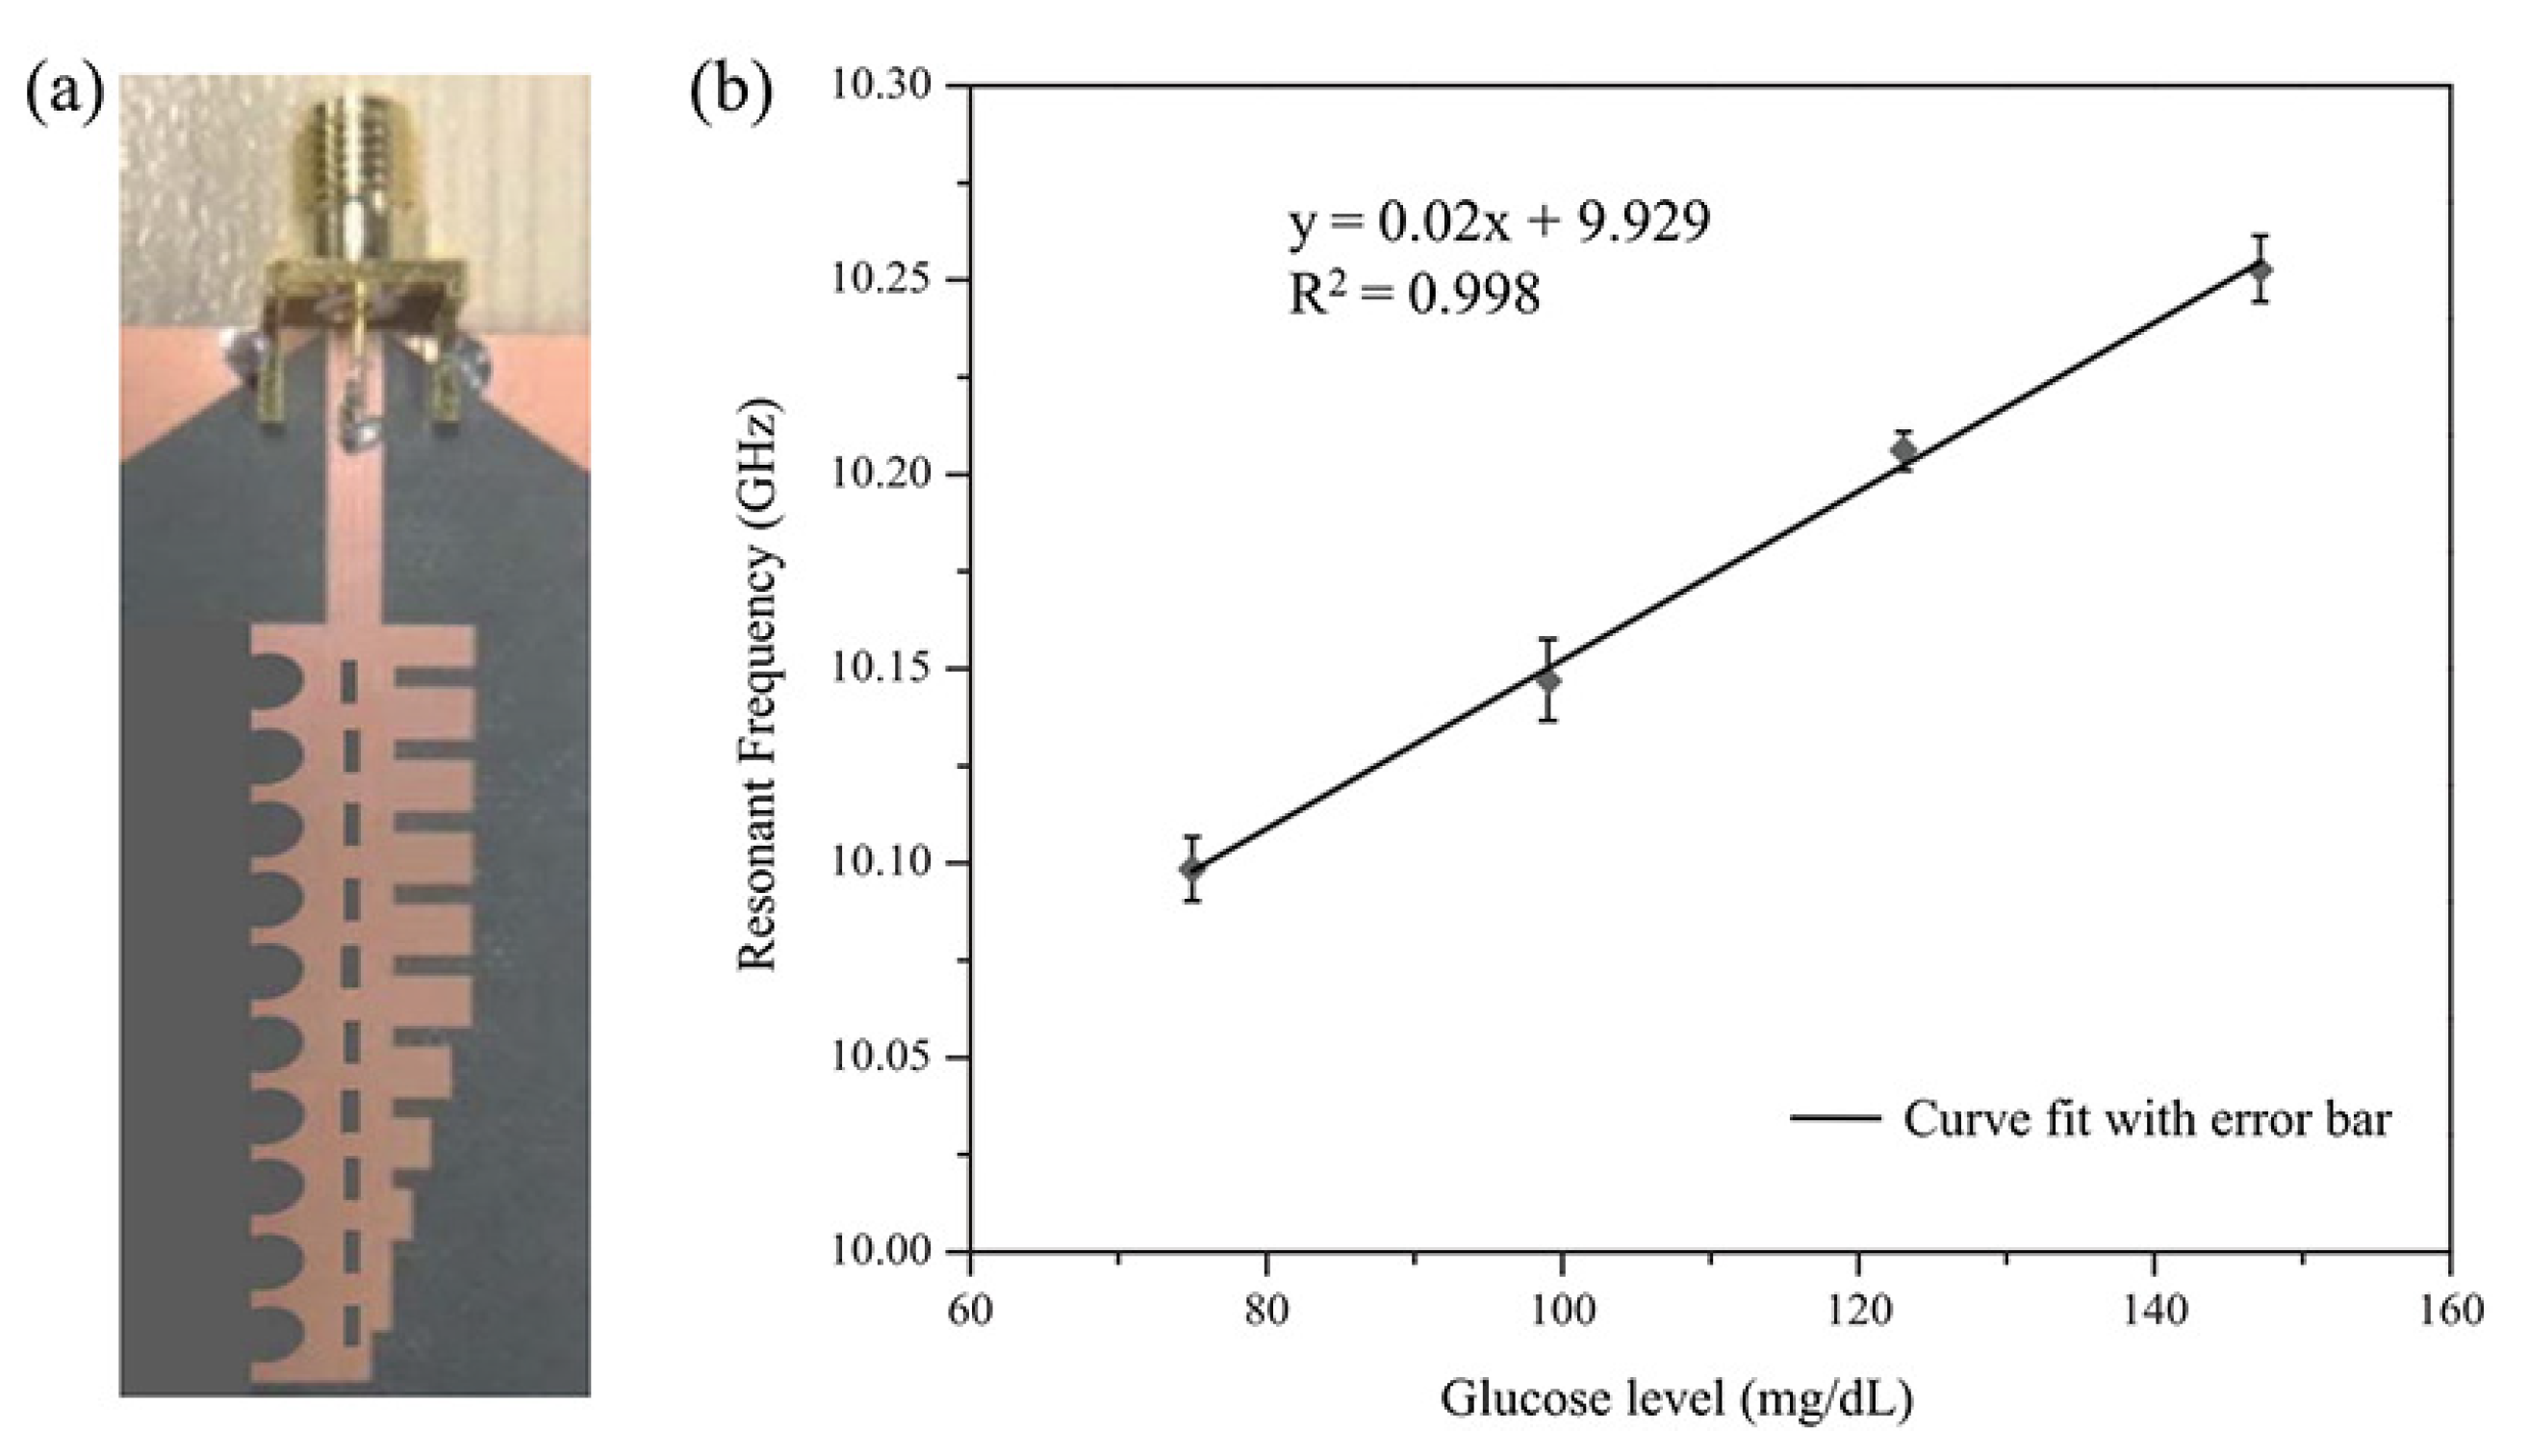
Vrba et al. designed a sensor consisting of an inset-fed microstrip patch antenna and a small rectangular container on the top surface of the antenna [51]. They prepared two different types of liquid phantoms, consisting of physiological saline-glucose solutions and pig blood-glucose solutions with concentrations ranging from 0 mg/dL to 500 mg/dL, and the frequency shifts for the two types of liquid phantoms were compared. The frequency shift for the pig blood-glucose liquid phantoms showed a linear increase, whereas that for the physiological saline-glucose liquid phantoms was nonlinear. Therefore, pig blood-glucose phantoms were deemed more suitable for experiments. Kandwal et al. proposed a spoof surface plasmon polariton (SSPP) endfire sensor for sensitive glucose detection [85]. The sensor radiates an endfire beam into the sample with a considerably reduced effective aperture. An additional pair of triangular ground planes located at the CPW port of the sensor suppress sidelobes that interfere with accurate glucose detection, and the slow wave of the SSPP endfire sensor increases the sensitivity as shown in Figure 10a. As a result, the resonant frequency of the sensor increases as the glucose concentration increases from 75 mg/dL to 150 mg/dL as shown in Figure 10b.
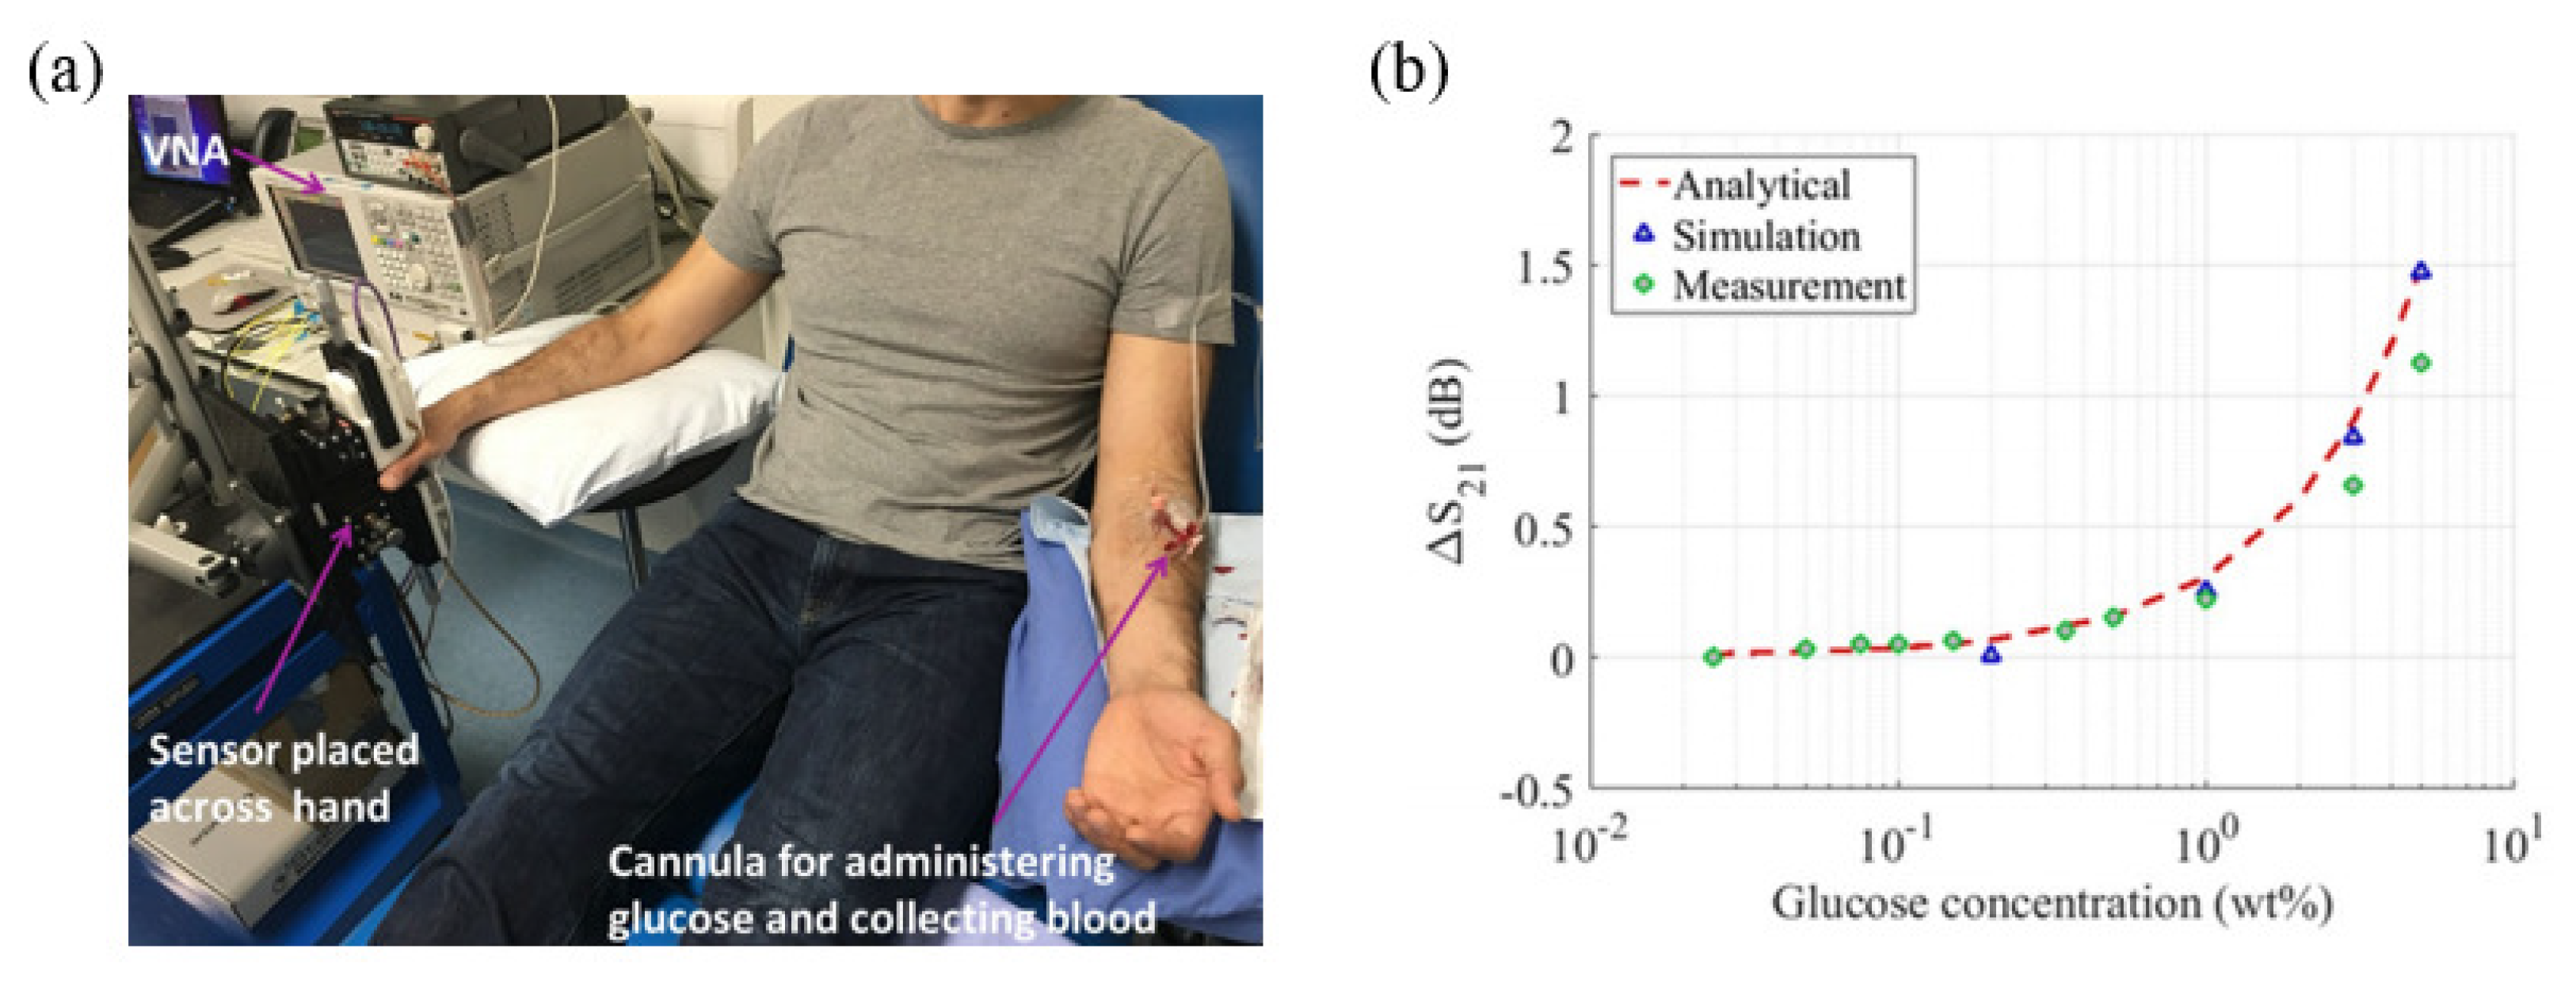
A glucose sensor based on two microstrip patch antennas operating at 60 GHz has also been proposed [86]. The proposed sensing system consists of two facing antennas placed across the sample. As the dielectric properties vary due to changes in the glucose concentration, the transmission between the two microstrip patch antennas also changes. A real-time in vivo human clinical test was conducted to investigate the sensor response as shown in Figure 11a. Thus, glucose concentrations from 0.025 wt% to 0.5 wt% can be detected based on variations in the transmission coefficient as shown in Figure 11b.
4.5. Planar Resonator-Type Glucose Sensors
Microwave resonators are lightweight, cost-effective, easy to fabricate, portable, and reusable and have low power consumption and low profiles [87]. Various microwave resonators have been the most commonly used devices as sensors in recent decades because of these advantages. For example, a temperature sensor using a surface acoustic wave (SAW) resonator [88], a nitrogen dioxide () and ethanol gas sensor based on a double split-ring resonator (DSRR) [89], a breast tumor sensor based on a dielectric resonator [90], a sensor for detecting cancer biomarkers using film bulk acoustic resonators (FBARs) [91], a sensor for biomolecule detection using a split-ring resonator (SRR) [92], a relative humidity sensor based on a DSRR and an active resonator [93,94], a pH sensor based on a hexagonal split-ring resonator (HSRR) [95], a sensor for streptavidin detection based on an open-loop resonator [96], a vital sign sensor based on a rectangular resonator [97], a sensor for cardiorespiratory sign detection using a complementary split-ring resonator (CSRR) [98] and a wrist pulse sensor based on array resonators [99] have been reported. Due to their need for only a small sample volume and their many other advantages, microwave resonators are widely used for glucose detection.
Kim et al. measured glucose solutions with different concentrations from 0 to 300 mg/mL by using a quarter-wavelength dielectric resonator with a gap for sample placement [100]. The resonant frequency of the dielectric resonator was 1.68 GHz, and the glucose concentration was detected based on the shift in the resonant frequency and the reflection coefficient. They analyzed the effect of sample volumes from 1 L to 5 L, and the results showed that the frequency shift increased with the sample volume. Additionally, both the reflection coefficient and the resonant frequency shift increased as the glucose concentration increased. Odabashyan et al. designed a resonator based on a modified first-order Hilbert curve to detect glucose concentrations of 0–250 mg/dL in steps of 50 mg/dL at a resonant frequency near 6 GHz [101]. The electromagnetic near field of the resonator was analyzed through simulation, and a glass container containing a glucose solution of 500 L was placed on the surface where the near field was the strongest. The sensing parameter was the transmission coefficient, which decreased as the glucose concentration increased. In another study, glucose solutions with different concentrations of 0–5 mg/mL were detected by means of a complementary split ring resonator (CSRR) at 2.48 GHz [102]. The glucose solutions were flowed through a microfluidic channel located in a sensing area made of polydimethylsiloxane (PDMS). When the glucose concentration changed, the capacitance between two copper metal pieces also changes, causing changes in the reflection coefficient and resonant frequency. The measured data were located in region A of the Clarke error grid, where the error is less than 20%, indicating accurate sensor performance. Choi et al. proposed a glucose sensor based on discrete double split-ring resonators with an aluminum shield that is robust against interference from temperature fluctuations [55]. They simulated the penetration depth of the electric field into an abdominal model composed of skin, fat, muscle, small intestine and bone layers. The simulated results showed that the electric field rapidly decays in the skin and muscle layers because of their high moisture content. The two discrete ring resonators have different resonant frequencies. One is affected by the glucose concentration, and temperature fluctuations cause the other to change. By considering the two resonant frequency shifts, temperature variations can be calibrated out. The performance of the sensor was demonstrated in a test of continuous monitoring over 12 h by comparison with a commercial continuous glucose meter.
Jang et al. detected glucose solutions using a CSRR with a resonant frequency of 2.42 GHz [103]. For different concentrations and temperatures, the dielectric constant and loss tangent of the glucose solutions were measured using an open-ended coaxial dielectric probe. It was verified that the dielectric properties were more significantly affected by temperature than by concentration. Thus, elimination of the temperature effect was necessary for accurate glucose detection. To this end, the variation in the transmission coefficient due to temperature change was measured, and a temperature correction function was derived. The electromagnetic near field was focused on the center of the CSRR, and the fluidic channel hosting the glucose solutions was also located in the center as shown in Figure 12a. Glucose concentrations from 0 to 400 mg/dL in increments of 100 mg/dL were continuously detected without a temperature effect by applying the derived correction function as shown in Figure 12b.
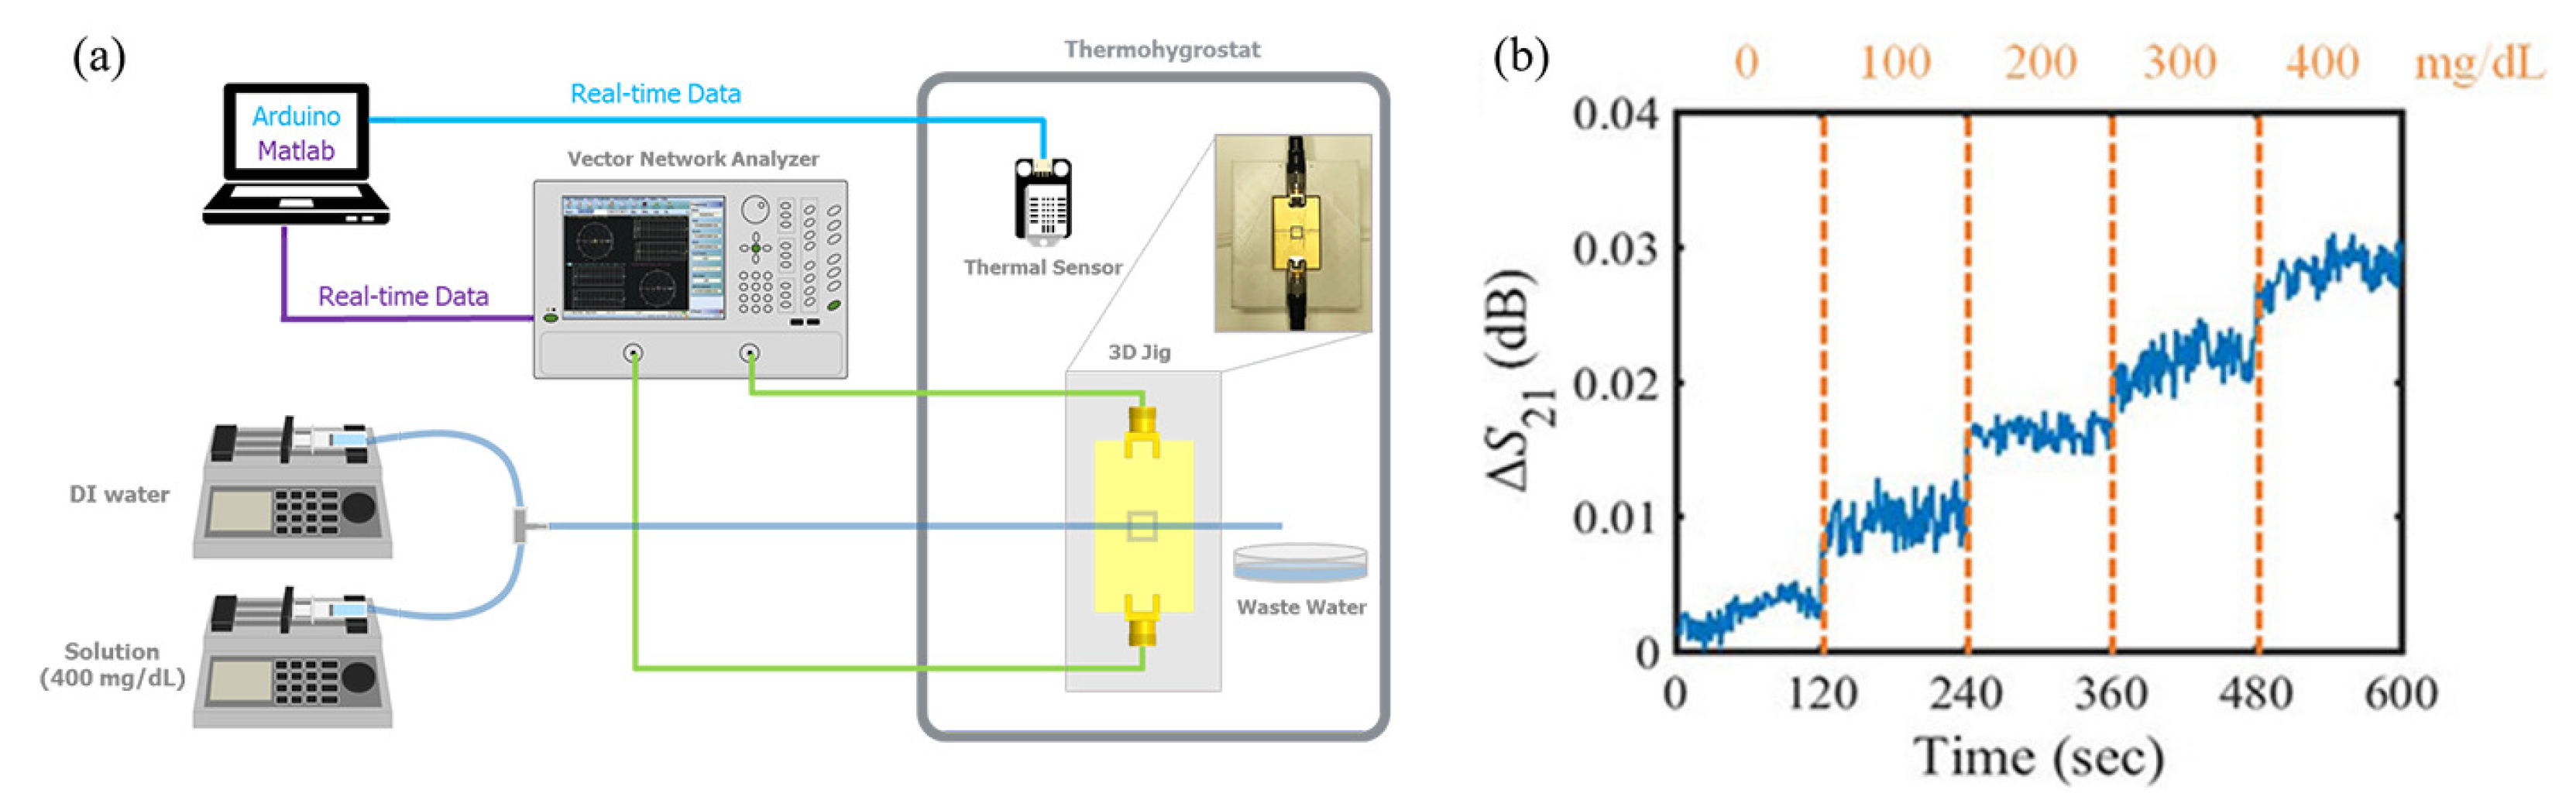
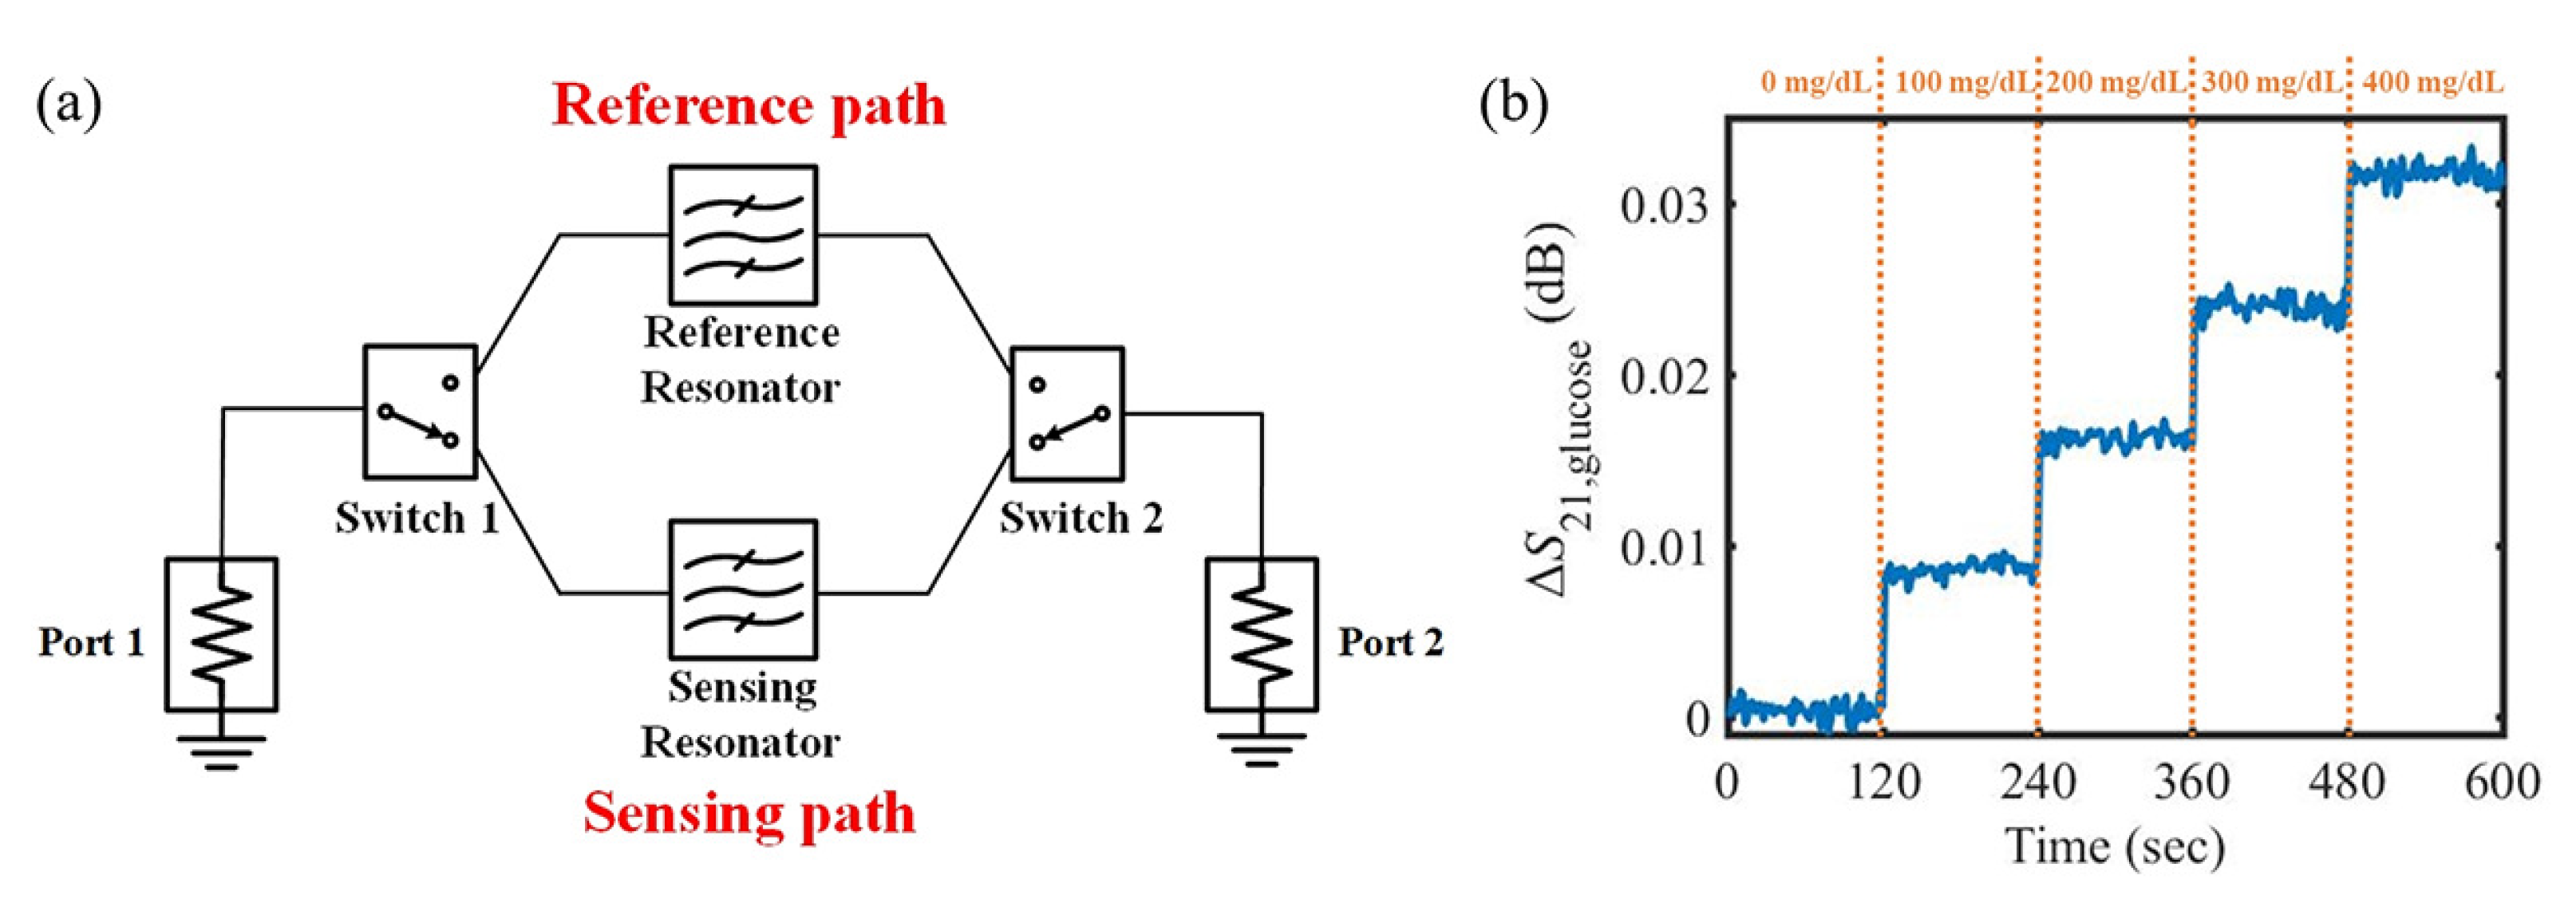
Our research group developed an improved glucose sensor with environmental effect elimination [104]. The effects of both temperature and relative humidity on the performance of the sensor were analyzed mathematically. The glucose sensor is composed of dual microwave CSRRs and a switching circuit as shown in Figure 13a. One CSRR detects environmental conditions such as temperature and relative humidity, and the other detects both environmental conditions and glucose concentration. By selecting the signal path through the switching circuit every second, the environmental effects are eliminated in real-time. We showed that as a result, glucose concentrations of 0–400 mg/dL in steps of 100 mg/dL can be continuously detected without environmental effects based on the variation in the transmission coefficient as shown in Figure 13b. Compared to the correction function method, the error is reduced considerably.
In addition, many glucose sensors have been reported for the detection of glucose concentration based on resonant frequency shifts [9,10,52,57,105,106,107,108,109,110,111,112,113], variations in the Q-factor [114,115,116], magnitude and phase variations in the reflection and/or transmission coefficient [10,108,114,117,118,119,120,121], and changes in input impedance [54]. The important parameters of various glucose sensors, such as sensor type, operating frequency, the detection range for glucose concentration, sample volume, sample type, sensing parameters, sensitivity, and continuous monitoring capability, are summarized in Table 3.
Accuracy is one of the main factors to evaluate the detection performance. According to International Organization for Standardization (ISO) 15197:2013, blood glucose meter for self-test must satisfy the error within ±15 mg/dL for concentration below 100 mg/dL or ±15% for concentration above 100 mg/dL [122]. The errors of the traditional chemical glucose sensors have a range from 0% to 20% [123]. However, the RF glucose sensors show the error of less than 10% as shown in Table 3.
5. Conclusions
In this review, we reviewed the historical landmarks of three generations of glucose sensors and the analysis and measurement of the dielectric properties of glucose solutions in the radio-frequency region. Additionally, various glucose sensors presented in recent decades for noninvasive and continuous monitoring have been reviewed.
However, further research on and development of RF glucose sensors should be conducted to achieve a wholly noninvasive and continuous monitoring scheme for practical use. First, the sensitivity of the sensors should be increased. When the blood glucose concentration changes, this causes only a subtle change in dielectric properties. Thus, it will be necessary to develop a highly sensitive glucose sensor that is robust against external noise and has high accuracy and high stability by optimizing the sensor structure and operating frequency or through integration with an appropriate active circuit system. In addition, proper signal processing techniques are essential for extracting the small signal changes due to glucose concentration variations from the large signal changes due to heartbeat, respiration, temperature variation, etc. Second, the selectivity of glucose sensors must be ensured. In the case of a sensor attached to the skin, blood glucose detection using radio-frequency components is based on the change in the effective dielectric constant, which is a single average value representing several materials with different dielectric constants. Thus, changes in the effective dielectric constant can be induced by variations in multiple tissue components as well as by the blood glucose concentration. To overcome these limitations, techniques such as multisensors using various modalities, big data analysis, and deep learning can be useful.
Microwave engineers and scientists have continuously researched for diverse radio-frequency biosensors for a long time. Unfortunately, the representative commercial RF biosensors with a robust performance have not yet appeared. This is because there are still areas to be solved for the robust RF biosensors, such as optimal frequency, integrated RF devices and circuits, improvement to the signal-to-noise ratio (SNR), discrimination to the other saliva components for RF glucose biosensing. However, since the glucose-sensing research for wireless healthcare monitoring is conducting in technology companies, such as Apple, Samsung Electronics, and Google, we predict that the commercial RF biosensors can also develop as soon as possible soon.
Author Contributions
Data searching, data analysis, formal analysis interpretation and writing—original draft preparation, C.J. and H.-J.L.; visualization and supervision, J.-G.Y. All authors have read and approved the published version of the manuscript.
Funding
This research was supported by the Basic Science Research Program through the National Research Foundation of Korea (NRF) funded by the Ministry of Science and ICT (NRF-2017R1A2B2011724).
Institutional Review Board Statement
Not applicable.
Informed Consent Statement
Not applicable.
Data Availability Statement
Not applicable.
Conflicts of Interest
The authors declare no conflict of interest.
References
- Cosnier, S.; Le Goff, A.; Holzinger, M. Towards glucose biofuel cells implanted in human body for powering artificial organs: Review. Electrochem. Commun. 2014, 38, 19–23. [Google Scholar] [CrossRef]
- Brownlee, M.; Cerami, A. A glucose-controlled insulin-delivery system: Semisynthetic insulin bound to lectin. Science 1979, 206, 1190–1191. [Google Scholar] [CrossRef]
- What Is Diabetes? 2020. Available online: https://www.idf.org/aboutdiabetes/what-is-diabetes.html (accessed on 17 January 2021).
- Sheehan, J.P. Fasting Hyperglycemia: Etiology, Diagnosis, and Treatment. Diabetes Technol. Ther. 2004, 6, 525–533. [Google Scholar] [CrossRef] [PubMed]
- Ceriello, A. Postprandial Hyperglycemia and Diabetes Complications. Diabetes 2005, 54, 1–7. [Google Scholar] [CrossRef] [PubMed] [Green Version]
- Bandodkar, A.J.; Wang, J. Non-invasive wearable electrochemical sensors: A review. Trends Biotechnol. 2014, 32, 363–371. [Google Scholar] [CrossRef]
- Strakosas, X.; Selberg, J.; Pansodtee, P.; Yonas, N.; Manapongpun, P.; Teodorescu, M.; Rolandi, M. A non-enzymatic glucose sensor enabled by bioelectronic pH control. Sci. Rep. 2019, 9, 10844. [Google Scholar] [CrossRef] [PubMed] [Green Version]
- Issad, T.; Malaterre, C. Are Dynamic Mechanistic Explanations Still Mechanistic? Springer: Berlin, Germany, 2015; Volume 11, pp. 256–292. [Google Scholar]
- Omer, A.E.; Shaker, G.; Safavi-Naeini, S.; Kokabi, H.; Alquié, G.; Deshours, F.; Shubair, R.M. Low-cost portable microwave sensor for non-invasive monitoring of blood glucose level: Novel design utilizing a four-cell CSRR hexagonal configuration. Sci. Rep. 2020, 10, 15200. [Google Scholar] [CrossRef]
- Baghelani, M.; Abbasi, Z.; Daneshmand, M.; Light, P.E. Non-invasive continuous-time glucose monitoring system using a chipless printable sensor based on split ring microwave resonators. Sci. Rep. 2020, 10, 12980. [Google Scholar] [CrossRef]
- Omer, A.E.; Shaker, G.; Safavi-Naeini, S. Portable Radar-Driven Microwave Sensor for Intermittent Glucose Levels Monitoring. IEEE Sens. Lett. 2020, 4, 1–4. [Google Scholar] [CrossRef]
- Omer, A.E.; Gigoyan, S.; Shaker, G.; Safavi-Naeini, S. WGM-Based Sensing of Characterized Glucose- Aqueous Solutions at mm-Waves. IEEE Access 2020, 8, 38809–38825. [Google Scholar] [CrossRef]
- Chambers, J.P.; Arulanandam, B.P.; Matta, L.L.; Weis, A.; Valdes, J.J. Biosensor recognition elements. Curr. Issues Mol. Biol. 2008, 10, 1–12. [Google Scholar]
- Iqbal, S.S.; Mayo, M.W.; Bruno, J.G.; Bronk, B.V.; Batt, C.A.; Chambers, J.P. A review of molecular recognition technologies for detection of biological threat agents. Biosens. Bioelectron. 2000, 15, 549–578. [Google Scholar] [CrossRef]
- Turner, A.P.F. Biosensors–Sense and Sensitivity. Science 2000, 290, 1315–1317. [Google Scholar] [CrossRef]
- Newman, J.D.; Turner, A.P.F. Biosensors: Principles and practice. Essays Biochem. 1992, 27, 147–159. [Google Scholar] [PubMed]
- Clark, L.C., Jr.; Lyons, C. Electrode systems for continuous monitoring in cardiovascular surgery. Ann. N. Y. Acad. Sci. 1962, 102, 29–45. [Google Scholar] [CrossRef]
- Updike, S.J.; Hicks, G.P. The enzyme electrode. Nature 1967, 214, 986–988. [Google Scholar] [CrossRef] [PubMed]
- Hiratsuka, A.; Fujisawa, K.; Muguruma, H. Amperometric Biosensor Based on Glucose Dehydrogenase and Plasma-polymerized Thin Films. Anal. Sci. 2008, 24, 483–486. [Google Scholar] [CrossRef] [PubMed] [Green Version]
- Clark Electrode. 2020. Available online: https://en.wikipedia.org/wiki/Clark_electrode#cite_note-4 (accessed on 17 January 2021).
- Eggins, B.R. Biosensors: An Introduction, 1st ed.; Wiley: New York, NY, USA, 1996. [Google Scholar]
- Updike, S.J.; Hicks, G.P. Reagentless Substrate Analysis with Immobilized Enzymes. Science 1967, 158, 270–272. [Google Scholar] [CrossRef]
- Wang, J. Electrochemical Glucose Biosensors. Chem. Rev. 2008, 108, 814–825. [Google Scholar] [CrossRef]
- Yoo, E.H.; Lee, S.Y. Glucose Biosensors: An Overview of Use in Clinical Practice. Sensors 2010, 10, 4558–4576. [Google Scholar] [CrossRef] [PubMed] [Green Version]
- Liu, J.; Wang, J. A novel improved design for the first-generation glucose biosensor. Food Technol. Biotech. 2001, 39, 55–58. [Google Scholar]
- Cass, A.E.G.; Davis, G.; Francis, G.D.; Hill, A.O.; Aston, W.J.; Higgins, I.J.; Plotkin, E.V.; Scott, L.D.L.; Turner, A.P.F. Ferrocene-Mediated Enzyme Electrode for Amperometric Determination of Glucose. Anal. Chem. 1987, 56, 667–671. [Google Scholar] [CrossRef] [PubMed]
- Frew, J.E.; Hill, H.A.O. Electrochemical biosensors. Anal. Chem. 1987, 59, 933A–944A. [Google Scholar] [CrossRef]
- Shichiri, M.; Yamasaki, Y.; Kawamori, R.; Hakui, N.; Abe, H. Wearable artificial endocrine pancreas with needle-type glucose sensor. Lancet 1982, 320, 1129–1131. [Google Scholar] [CrossRef]
- Chaubey, A.; Malhotra, B.D. Mediated biosensors. Biosens. Bioelectron. 2002, 17, 441–456. [Google Scholar] [CrossRef]
- Gregg, B.A.; Heller, A. Cross-linked redox gels containing glucose oxidase for amperometric biosensor applications. Anal. Chem. 1990, 62, 258–263. [Google Scholar] [CrossRef]
- Lin, Y.; Yantasee, W.; Wang, J. Carbon nanotubes (CNTs) for the development of electrochemical biosensors. Front. Biosci. 2005, 10, 492–505. [Google Scholar] [CrossRef] [PubMed] [Green Version]
- Riklln, A.; Katz, E.; Willner, L.; Stocker, A.; Biickmann, A.F. Improving enzyme–electrode contacts by redox modification of cofactors. Nature 1995, 376, 672–675. [Google Scholar] [CrossRef]
- Khan, G.F.; Ohwa, M.; Wernet, W. Design of a stable charge transfer complex electrode for a third-generation amperometric glucose sensor. Anal. Chem. 1996, 68, 2939–2945. [Google Scholar] [CrossRef] [PubMed]
- Palmisano, F.; Zambonin, P.G.; Centonze, D.; Quinto, M. A disposable, reagentless, third-generation glucose biosensor based on overoxidized poly (pyrrole)/tetrathiafulvalene- tetracyanoquinodimethane composite. Anal. Chem. 2002, 74, 5913–5918. [Google Scholar] [CrossRef]
- Wang, J. Glucose biosensors: 40 years of advances and challenges. Electroanalysis 2001, 13, 983–988. [Google Scholar] [CrossRef]
- Guilbault, G.G.; Lubrano, G.J. An enzyme electrode for the amperometric determination of glucose. Anal. Chem. 1973, 64, 439–455. [Google Scholar] [CrossRef]
- Liao, X.; Raghavan, G.S.V.; Dai, J.; Yaylayan, V.A. Dielectric properties of α-D-glucose aqueous solutions at 2450 MHz. Food Res. Int. 2003, 35, 485–490. [Google Scholar] [CrossRef]
- Gabriel, S.; Lau, R.W.; Gabriel, C. The dielectric properties of biological tissues: III. Parametric models for the dielectric spectrum of tissues. Phys. Med. Biol. 1996, 41, 2271–2293. [Google Scholar] [CrossRef] [PubMed] [Green Version]
- Mrozowski, M.; Stuchly, M.A. Parameterization of media dispersive properties for FDTD. IEEE Trans. Antennas Propag. 1997, 45, 1438–1439. [Google Scholar] [CrossRef]
- Lazebnik, M.; Converse, M.C.; Booske, J.H.; Hagness, S.C. Ultrawideband temperature-dependent dielectric properties of animal liver tissue in the microwave frequency range. Phys. Med. Biol. 2006, 51, 1941–1955. [Google Scholar] [CrossRef] [Green Version]
- Lazebnik, M.; Okoniewski, M.; Booske, J.H.; Hagness, S.C. Highly Accurate Debye Models for Normal and Malignant Breast Tissue Dielectric Properties at Microwave Frequencies. IEEE Microw. Wirel. Compon. Lett. 2007, 17, 822–824. [Google Scholar] [CrossRef]
- Lazebnik, M.; McCartney, L.; Popovic, D.; Watkins, C.B.; Lindstrom, M.J.; Harter, J.; Sewall, S.; Magliocco, A.; Booske, J.H.; Okoniewski, M.; et al. A large-scale study of the ultrawideband microwave dielectric properties of normal breast tissue obtained from reduction surgeries. Phys. Med. Biol. 2007, 52, 2637–2656. [Google Scholar] [CrossRef] [PubMed] [Green Version]
- Karacolak, T.; Moreland, E.C.; Topsakal, E. Cole–cole model for glucose-dependent dielectric properties of blood plasma for continuous glucose monitoring. Microw. Opt. Technol. Lett. 2013, 55, 1160–1164. [Google Scholar] [CrossRef]
- Topsakal, E.; Karacolak, T.; Moreland, E.C. Glucose-dependent dielectric properties of blood plasma. In Proceedings of the 2011 XXXth URSI General Assembly and Scientific Symposium, Istanbul, Turkey, 13–20 August 2011; pp. 1–4. [Google Scholar]
- Jaspard, F.; Nadi, M.; Rouane, A. Dielectric properties of blood: An investigation of haematocrit dependence. Physiol. Meas. 2003, 24, 137–147. [Google Scholar] [CrossRef]
- Gu, S.; Lin, T.; Lasri, T. Dielectric properties characterization of saline solutions by near-field microwave microscopy. Meas. Sci. Technol. 2016, 28, 014014. [Google Scholar] [CrossRef]
- Zahn, M.; Ohki, Y.; Fenneman, D.B.; Gripshover, R.J.; Gehman, V.H. Dielectric properties of water and water/ethylene glycol mixtures for use in pulsed power system design. Proc. IEEE 1986, 74, 1182–1221. [Google Scholar] [CrossRef]
- Yilmaz, T.; Foster, R.; Hao, Y. Radio-Frequency and Microwave Techniques for Non-Invasive Measurement of Blood Glucose Levels. Diagnostics 2019, 9, 6. [Google Scholar] [CrossRef] [Green Version]
- Freer, B.; Venkataraman, J. Feasibility study for non-invasive blood glucose monitoring. In Proceedings of the 2010 IEEE Antennas and Propagation Society International Symposium (APSURSI), Toronto, ON, Canada, 11–17 July 2010; pp. 1–4. [Google Scholar]
- Yilmaz, T.; Ozturk, T.; Joof, S. A Comparative Study for Development of Microwave Glucose Sensors. In Proceedings of the 32nd URSI GASS, Montreal, QC, Canada, 19–26 August 2017; pp. 19–26. [Google Scholar]
- Vrba, J.; Karch, J.; Vrba, D. Phantoms for Development of Microwave Sensors for Noninvasive Blood Glucose Monitoring. Int. J. Antennas Propag. 2015, 2015, 570870. [Google Scholar] [CrossRef]
- Turgul, V.; Kale, I. Permittivity extraction of glucose solutions through artificial neural networks and non-invasive microwave glucose sensing. Sens. Actuators A Phys. 2018, 277, 65–72. [Google Scholar] [CrossRef] [Green Version]
- Buford, R.J.; Green, E.C.; McClung, M.J. A microwave frequency sensor for non-invasive blood-glucose measurement. In Proceedings of the 2008 IEEE Sensors Applications Symposium (SAS), Atlanta, GA, USA, 12–14 February 2008; pp. 4–7. [Google Scholar]
- Yilmaz, T.; Foster, R.; Hao, Y. Broadband Tissue Mimicking Phantoms and a Patch Resonator for Evaluating Noninvasive Monitoring of Blood Glucose Levels. IEEE Trans. Antennas Propag. 2014, 62, 3064–3075. [Google Scholar] [CrossRef]
- Choi, H.; Naylon, J.; Luzio, S.; Beutler, J.; Birchall, J.; Martin, C.; Porch, A. Design and In Vitro Interference Test of Microwave Noninvasive Blood Glucose Monitoring Sensor. IEEE Trans. Microw. Theory Tech. 2015, 63, 3016–3025. [Google Scholar] [CrossRef] [Green Version]
- Kim, N.Y.; Adhikari, K.K.; Dhakal, R.; Chuluunbaatar, Z.; Wang, C.; Kim, E.S. Rapid, Sensitive and Reusable Detection of Glucose by a Robust Radiofrequency Integrated Passive Device Biosensor Chip. Sci. Rep. 2015, 5, 7807. [Google Scholar] [CrossRef] [Green Version]
- Adhikari, K.K.; Kim, N. Ultrahigh-Sensitivity Mediator-Free Biosensor Based on a Microfabricated Microwave Resonator for the Detection of Micromolar Glucose Concentrations. IEEE Trans. Microw. Theory Tech. 2016, 64, 319–327. [Google Scholar] [CrossRef]
- Carter, R.G. Accuracy of microwave cavity perturbation measurements. IEEE Trans. Microw. Theory Tech. 2001, 49, 918–923. [Google Scholar] [CrossRef]
- Kraszewski, A.W.; Nelson, S.O. Observations on resonant cavity perturbation by dielectric objects. IEEE Trans. Microw. Theory Tech. 1992, 40, 151–155. [Google Scholar] [CrossRef]
- Eldumiati, I.I.; Haddad, G.I. Cavity Perturbation Techniques for Measurement of the Microwave Conductivity and Dielectric Constant of a Bulk Semiconductor Material. IEEE Trans. Microw. Theory Tech. 1972, 20, 126–132. [Google Scholar] [CrossRef]
- Fu, H.; Xiao, X.; Li, J.; Zong, Y. Study on a Glucose Concentration Measurement System Based on Microwave Perturbation Technique. J. Microw. Power. Electromagn. Energy 2015, 49, 215–224. [Google Scholar] [CrossRef]
- Wang, Q.; Deng, X.; Yang, M.; Fan, Y.; Wang, W. Measuring glucose concentration by microwave cavity perturbation and DSP technology. In Proceedings of the 2010 3rd International Conference on Biomedical Engineering and Informatics, Yantai, China, 16–18 October 2010; pp. 943–946. [Google Scholar]
- Fan, Y.; Deng, X.; Wang, Q.; Wang, W. Testing glucose concentration in aqueous solution based on microwave cavity perturbation technique. In Proceedings of the 2010 3rd International Conference on Biomedical Engineering and Informatics, Yantai, China, 16–18 October 2010; pp. 1046–1049. [Google Scholar]
- Li, Q.; Xiao, X.; Fu, H.; Wang, L. Glucose solution concentration detection using TE011 microwave resonant cavity. J. Electromagn. Waves Appl. 2018, 32, 1824–1833. [Google Scholar] [CrossRef]
- Dobson, R.; Wu, R.; Callaghan, P. Blood glucose monitoring using microwave cavity perturbation. Electron. Lett. 2012, 48, 905–906. [Google Scholar] [CrossRef]
- Bababjanyan, A.; Melikyan, H.; Kim, S.; Kim, J.; Lee, K.; Friedman, B. Real-Time Noninvasive Measurement of Glucose Concentration Using a Microwave Biosensor. J. Sens. 2010, 2010, 452163. [Google Scholar] [CrossRef]
- Lee, K.; Babajanyan, A.; Kim, C.; Kim, S.; Friedman, B. Glucose aqueous solution sensing by a near-field microwave microprobe. Sens. Actuators A Phys. 2008, 148, 28–32. [Google Scholar] [CrossRef]
- Kim, S.; Kim, J.; Babajanyan, A.; Lee, K.; Friedman, B. Noncontact characterization of glucose by a waveguide microwave probe. Curr. Appl. Phys. 2009, 9, 856–860. [Google Scholar] [CrossRef]
- Turgul, V.; Kale, I. Characterization of the complex permittivity of glucose/water solutions for noninvasive RF/Microwave blood glucose sensing. In Proceedings of the 2016 IEEE International Instrumentation and Measurement Technology Conference Proceedings, Taipei, Taiwan, 23–26 May 2016; pp. 1–5. [Google Scholar]
- Jha, A.K.; Akhtar, M.J. SIW cavity based RF sensor for dielectric characterization of liquids. In Proceedings of the 2014 IEEE Conference on Antenna Measurements Applications (CAMA), Antibes Juan-les-Pins, France, 16–19 November 2014; pp. 1–4. [Google Scholar]
- Memon, M.U.; Lim, S. Substrate-Integrated-Waveguide Based Chemical Sensor. IEEE Microw. Wirel. Compon. Lett. 2013, 61, 972–978. [Google Scholar]
- Chen, L.F.; Ong, C.K.; Neo, C.P.; Varadan, V.V.; Varadan, V.K. Microwave Electronics: Measurement and Materials Characterization; John Wiley & Sons: New York, NY, USA, 2004. [Google Scholar]
- Kiani, S.; Rezaei, P.; Karami, M.; Sadeghzadeh, R.A. Band-stop filter sensor based on SIW cavity for the non-invasive measuring of blood glucose. IET Wirel. Sens. Syst. 2019, 9, 1–5. [Google Scholar] [CrossRef]
- Liu, C.; Tong, F. An SIW Resonator Sensor for Liquid Permittivity Measurements at C Band. IEEE Microw. Wirel. Compon. Lett. 2015, 25, 751–753. [Google Scholar]
- Bahar, A.A.M.; Zakaria, Z.; Arshad, M.K.M.; Isa, A.A.M.; Dasril, Y.; Alahnomi, R.A. Real Time Microwave Biochemical Sensor Based on Circular SIW Approach for Aqueous Dielectric Detection. Sci. Rep. 2019, 9, 5467. [Google Scholar] [CrossRef]
- Balanis, C.A. Antenna Theory: Analysis and Design, 3rd ed.; Wiley: Hoboken, NJ, USA, 2005. [Google Scholar]
- Xu, X.; Huang, H. Battery-less wireless interrogation of microstrip patch antenna for strain sensing. Smart Mater. Struct. 2012, 21, 125007. [Google Scholar] [CrossRef]
- Yi, X.; Wu, T.; Wang, Y.; Leon, R.T.; Tentzeris, M.M.; Lantz, G. Passive wireless smart-skin sensor using RFID-based folded patch antennas. Int. J. Smart Nano Mater. 2011, 2, 22–38. [Google Scholar] [CrossRef]
- Stutzman, W.L.; Thiele, G.A. Antenna Theory and Design, 3rd ed.; Wiley: Hoboken, NJ, USA, 2012. [Google Scholar]
- Hofmann, M.; Fersch, T.; Weigel, R.; Fischer, G.; Kissinger, D. A novel approach to non-invasive blood glucose measurement based on RF transmission. In Proceedings of the 2011 IEEE International Symposium on Medical Measurements and Applications, Bari, Italy, 30–31 May 2011; pp. 39–42. [Google Scholar]
- Xiao, X.; Li, Q. A Noninvasive Measurement of Blood Glucose Concentration by UWB Microwave Spectrum. IEEE Antennas Wirel. Propag. Lett. 2017, 16, 1040–1043. [Google Scholar] [CrossRef]
- Wiwatwithaya, S.; Phasukkit, P.; Tungjitkusolmun, S.; Wongtrairat, W. Real-time monitoring glucose by used microwave antenna apply to biosensor. In Proceedings of the 4th 2011 Biomedical Engineering International Conference, Chiang Mai, Thailand, 29–31 January 2012; pp. 135–137. [Google Scholar]
- Costanzo, S. Loss tangent effect on the accurate design of microwave sensors for blood glucose monitoring. In Proceedings of the 2017 11th European Conference on Antennas and Propagation (EUCAP), Paris, France, 19–24 March 2017; pp. 661–663. [Google Scholar]
- Deshmukh, V.V.; Chorage, S.S. Microstrip Antennas used for Noninvasive Determination of Blood Glucose Level. In Proceedings of the 2020 4th International Conference on Intelligent Computing and Control Systems (ICICCS), Madurai, India, 13–15 May 2020; pp. 720–725. [Google Scholar]
- Kandwal, A.; Nie, Z.; Igbe, T.; Li, J.; Liu, Y.; Liu, L.W.; Hao, Y. Surface Plasmonic Feature Microwave Sensor With Highly Confined Fields for Aqueous-Glucose and Blood-Glucose Measurements. IEEE Trans. Instrum. Meas. 2021, 70, 1–9. [Google Scholar] [CrossRef]
- Saha, S.; Cano-Garcia, H.; Sotiriou, I.; Lipscombe, O.; Gouzouasis, I.; Koutsoupidou, M.; Palikaras, G.; Mackenzie, R.; Reeve, T.; Kosmas, P.; et al. A Glucose Sensing System Based on Transmission Measurements at Millimetre Waves using Micro strip Patch Antennas. Sci. Rep. 2017, 7, 6855. [Google Scholar] [CrossRef] [Green Version]
- Plourde, J.K.; Ren, C.L. Application of Dielectric Resonators in Microwave Components. IEEE Trans. Microw. Theory Tech. 1981, 29, 754–770. [Google Scholar] [CrossRef]
- Müller, A.; Konstantinidis, G.; Buiculescu, V.; Dinescu, A.; Stavrinidis, A.; Stefanescu, A.; Stavrinidis, G.; Giangu, I.; Cismaru, A.; Modoveanu, A. GaN/Si based single SAW resonator temperature sensor operating in the GHz frequency range. Sens. Actuators A Phys. 2014, 209, 115–123. [Google Scholar] [CrossRef]
- Singh, S.K.; Azad, P.; Akhtar, M.J.; Kar, K.K. High-sensitive nitrogen dioxide and ethanol gas sensor using a reduced graphene oxide-loaded double split ring resonator. Mater. Res. Express 2017, 4, 086301. [Google Scholar] [CrossRef]
- Huang, W.; Kishk, A.A. Compact Dielectric Resonator Antenna Array for Microwave Breast Cancer Detection. In Proceedings of the 2007 IEEE Region 5 Technical Conference, Fayetteville, AR, USA, 20–22 April 2007; pp. 9–12. [Google Scholar]
- Zhao, X.; Pan, F.; Ashley, G.M.; Garcia-Gancedo, L.; Luo, J.; Flewitt, A.J.; Milne, W.I.; Lu, J.R. Label-free detection of human prostate-specific antigen (hPSA) using film bulk acoustic resonators (FBARs). Sens. Actuators B Chem. 2014, 190, 946–953. [Google Scholar] [CrossRef]
- Lee, H.J.; Lee, J.H.; Moon, H.S.; Jang, I.S.; Choi, J.S.; Yook, J.G.; Jung, H.I. A planar split-ring resonator-based microwave biosensor for label-free detection of biomolecules. Sens. Actuators B Chem. 2012, 169, 26–31. [Google Scholar] [CrossRef]
- Park, J.K.; Jang, C.; Yun, G.H.; Lee, H.J.; Choi, H.H.; Yook, J.G. Sensitive Relative Humidity Monitoring Sensor Based on Microwave Active Resonator with PEDOT:PSS. IEEE Access 2020, 8, 166283–166293. [Google Scholar] [CrossRef]
- Park, J.K.; Kang, T.G.; Kim, B.H.; Lee, H.J.; Choi, H.H.; Yook, J.G. Real-time Humidity Sensor Based on Microwave Resonator Coupled with PEDOT:PSS Conducting Polymer Film. Sci. Rep. 2018, 8, 439. [Google Scholar] [CrossRef] [PubMed] [Green Version]
- Islam, M.T.; Ashraf, F.B.; Alam, T.; Misran, N.; Mat, K.B. A Compact Ultrawideband Antenna Based on Hexagonal Split-Ring Resonator for pH Sensor Application. Sensors 2018, 18, 2959. [Google Scholar] [CrossRef] [Green Version]
- Hong, Y.; Lee, H.; Kim, S.; Kim, B.; Yun, G.; Yook, J. A Label-Free Biosensing Platform Using a PLL Circuit and Biotin-Streptavidin Binding System. IEEE Trans. Biomed. Circuits Syst. 2015, 9, 345–352. [Google Scholar] [CrossRef] [PubMed]
- Park, J.K.; Hong, Y.; Lee, H.; Jang, C.; Yun, G.H.; Lee, H.J.; Yook, J.G. Noncontact RF Vital Sign Sensor for Continuous Monitoring of Driver Status. IEEE Trans. Biomed. Circuits Syst. 2019, 13, 493–502. [Google Scholar] [CrossRef]
- Chang, T.; Hsu, C.; Chen, K.; Yang, C. Wearable sensors based on a high sensitive complementary split-ring resonator for accurate cardiorespiratory sign measurements. In Proceedings of the 2017 IEEE MTT-S International Microwave Symposium (IMS), Honololu, HI, USA, 4–9 June 2017; pp. 208–210. [Google Scholar]
- An, Y.; Yun, G.; Kim, S.W.; Yook, J. Wrist Pulse Detection System Based on Changes in the Near-Field Reflection Coefficient of a Resonator. IEEE Microw. Wirel. Compon. Lett. 2014, 24, 719–721. [Google Scholar] [CrossRef]
- Kim, J.; Babajanyan, A.; Hovsepyan, A.; Lee, K.; Friedman, B. Microwave dielectric resonator biosensor for aqueous glucose solution. Rev. Sci. Instrum. 2008, 79, 086107. [Google Scholar] [CrossRef]
- Odabashyan, L.; Babajanyan, A.; Baghdasaryan, Z.; Kim, S.; Kim, J.; Friedman, B.; Lee, J.H.; Lee, K. Real-Time Noninvasive Measurement of Glucose Concentration Using a Modified Hilbert Shaped Microwave Sensor. Sensors 2019, 19, 5525. [Google Scholar] [CrossRef] [Green Version]
- Ebrahimi, A.; Scott, J.; Ghorbani, K. Microwave reflective biosensor for glucose level detection in aqueous solutions. Sens. Actuators A Phys. 2020, 301, 111662. [Google Scholar] [CrossRef]
- Jang, C.; Park, J.K.; Lee, H.J.; Yun, G.H.; Yook, J.G. Temperature-Corrected Fluidic Glucose Sensor Based on Microwave Resonator. Sensors 2018, 18, 3850. [Google Scholar] [CrossRef] [Green Version]
- Jang, C.; Park, J.; Lee, H.; Yun, G.; Yook, J. Non-Invasive Fluidic Glucose Detection Based on Dual Microwave Complementary Split Ring Resonators with a Switching Circuit for Environmental Effect Elimination. IEEE Sens. J. 2020, 20, 8520–8527. [Google Scholar] [CrossRef]
- Govind, G.; Akhtar, M.J. Metamaterial-Inspired Microwave Microfluidic Sensor for Glucose Monitoring in Aqueous Solutions. IEEE Sens. J. 2019, 19, 11900–11907. [Google Scholar] [CrossRef]
- Kim, N.; Dhakal, R.; Adhikari, K.; Kim, E.; Wang, C. A reusable robust radio frequency biosensor using microwave resonator by integrated passive device technology for quantitative detection of glucose level. Biosens. Bioelectron. 2015, 67, 687–693. [Google Scholar] [CrossRef] [Green Version]
- Sharafadinzadeh, N.; Abdolrazzaghi, M.; Daneshmand, M. Highly sensitive microwave split ring resonator sensor using gap extension for glucose sensing. In Proceedings of the 2017 IEEE MTT-S International Microwave Workshop Series on Advanced Materials and Processes for RF and THz Applications (IMWS-AMP), Pavia, Italy, 20–22 September 2017; pp. 1–3. [Google Scholar]
- Kumar, A.; Wang, C.; Meng, F.Y.; Zhou, Z.L.; Zhao, M.; Yan, G.F.; Kim, E.S.; Kim, N.Y. High-Sensitivity, Quantified, Linear and Mediator-Free Resonator-Based Microwave Biosensor for Glucose Detection. Sensors 2020, 20, 4024. [Google Scholar] [CrossRef]
- Camli, B.; Kusakci, E.; Lafci, B.; Salman, S.; Torun, H.; Yalcinkaya, A. A Microwave Ring Resonator Based Glucose Sensor. Procedia Eng. 2016, 168, 465–468. [Google Scholar] [CrossRef]
- Camli, B.; Kusakci, E.; Lafci, B.; Salman, S.; Torun, H.; Yalcinkaya, A.D. Cost-Effective, Microstrip Antenna Driven Ring Resonator Microwave Biosensor for Biospecific Detection of Glucose. IEEE J. Sel. Top. Quantum Electron. 2017, 23, 404–409. [Google Scholar] [CrossRef]
- Ebrahimi, A.; Withayachumnankul, W.; Al-Sarawi, S.F.; Abbott, D. Microwave microfluidic sensor for determination of glucose concentration in water. In Proceedings of the 2015 IEEE 15th Mediterranean Microwave Symposium (MMS), Lecce, Italy, 30 November–2 December 2015; pp. 1–3. [Google Scholar]
- Govind, G.; Akhtar, M.J. Design of an ELC resonator-based reusable RF microfluidic sensor for blood glucose estimation. Sci. Rep. 2020, 10, 18842. [Google Scholar] [CrossRef] [PubMed]
- Mondal, D.; Tiwari, N.K.; Akhtar, M.J. Microwave Assisted Non-Invasive Microfluidic Biosensor for Monitoring Glucose Concentration. In Proceedings of the 2018 IEEE SENSORS, New Delhi, India, 28–31 October 2019; pp. 1–4. [Google Scholar]
- Juan, C.G.; Bronchalo, E.; Potelon, B.; Quendo, C.; Ávila-Navarro, E.; Sabater-Navarro, J.M. Concentration Measurement of Microliter-Volume Water—Glucose Solutions Using Q Factor of Microwave Sensors. IEEE Trans. Instrum. Meas. 2019, 68, 2621–2634. [Google Scholar] [CrossRef]
- Juan, C.G.; García, H.; Ávila Navarro, E.; Bronchalo, E.; Galiano, V.; Moreno, Ó.; Orozco, D.; Sabater-Navarro, J.M. Feasibility study of portable microwave microstrip open-loop resonator for non-invasive blood glucose level sensing: Proof of concept. Med. Biol. Eng. Comput. 2019, 57, 2389–2405. [Google Scholar] [CrossRef] [PubMed]
- García, H.; Juan, C.G.; Ávila-Navarro, E.; Bronchalo, E.; Sabater-Navarro, J.M. Portable Device Based on Microwave Resonator for Noninvasive Blood Glucose Monitoring. In Proceedings of the 2019 41st Annual International Conference of the IEEE Engineering in Medicine and Biology Society (EMBC), Berlin, Germany, 23–27 July 2019; pp. 1115–1118. [Google Scholar]
- Hofmann, M.; Fischer, G.; Weigel, R.; Kissinger, D. Microwave-Based Noninvasive Concentration Measurements for Biomedical Applications. IEEE Trans. Microw. Theory Tech. 2013, 61, 2195–2204. [Google Scholar] [CrossRef]
- Harnsoongnoen, S.; Wanthong, A. Coplanar Waveguide Transmission Line Loaded With Electric-LC Resonator for Determination of Glucose Concentration Sensing. IEEE Sens. J. 2017, 17, 1635–1640. [Google Scholar] [CrossRef]
- Chretiennot, T.; Dubuc, D.; Grenier, K. Microwave-Based Microfluidic Sensor for Non-Destructive and Quantitative Glucose Monitoring in Aqueous Solution. Sensors 2016, 16, 1733. [Google Scholar] [CrossRef] [PubMed] [Green Version]
- Schwerthoeffer, U.; Weigel, R.; Kissinger, D. A highly sensitive glucose biosensor based on a microstrip ring resonator. In Proceedings of the 2013 IEEE MTT-S International Microwave Workshop Series on RF and Wireless Technologies for Biomedical and Healthcare Applications (IMWS-BIO), Singapore, 9–11 December 2013; pp. 1–3. [Google Scholar]
- Kumari, R.; Patel, P.N.; Yadav, R. An ENG resonator-based microwave sensor for the characterization of aqueous glucose. J. Phys. D Appl. Phys. 2018, 51, 075601. [Google Scholar] [CrossRef]
- Freckmann, G.; Schmid, C.; Baumstark, A.; Rutschmann, M.; Haug, C.; Heinemann, L. Analytical Performance Requirements for Systems for Self-Monitoring of Blood Glucose With Focus on System Accuracy: Relevant Differences Among ISO 15197:2003, ISO 15197:2013, and Current FDA Recommendations. J. Diabetes Sci. Technol. 2015, 9, 885–894. [Google Scholar] [CrossRef] [PubMed]
- Pfützner, A.; Schipper, C.; Ramljak, S.; Flacke, F.; Sieber, J.; Forst, T.; Musholt, P.B. Evaluation of the Effects of Insufficient Blood Volume Samples on the Performance of Blood Glucose Self-Test Meters. J. Diabetes Sci. Technol. 2013, 7, 1522–1529. [Google Scholar] [CrossRef] [PubMed] [Green Version]
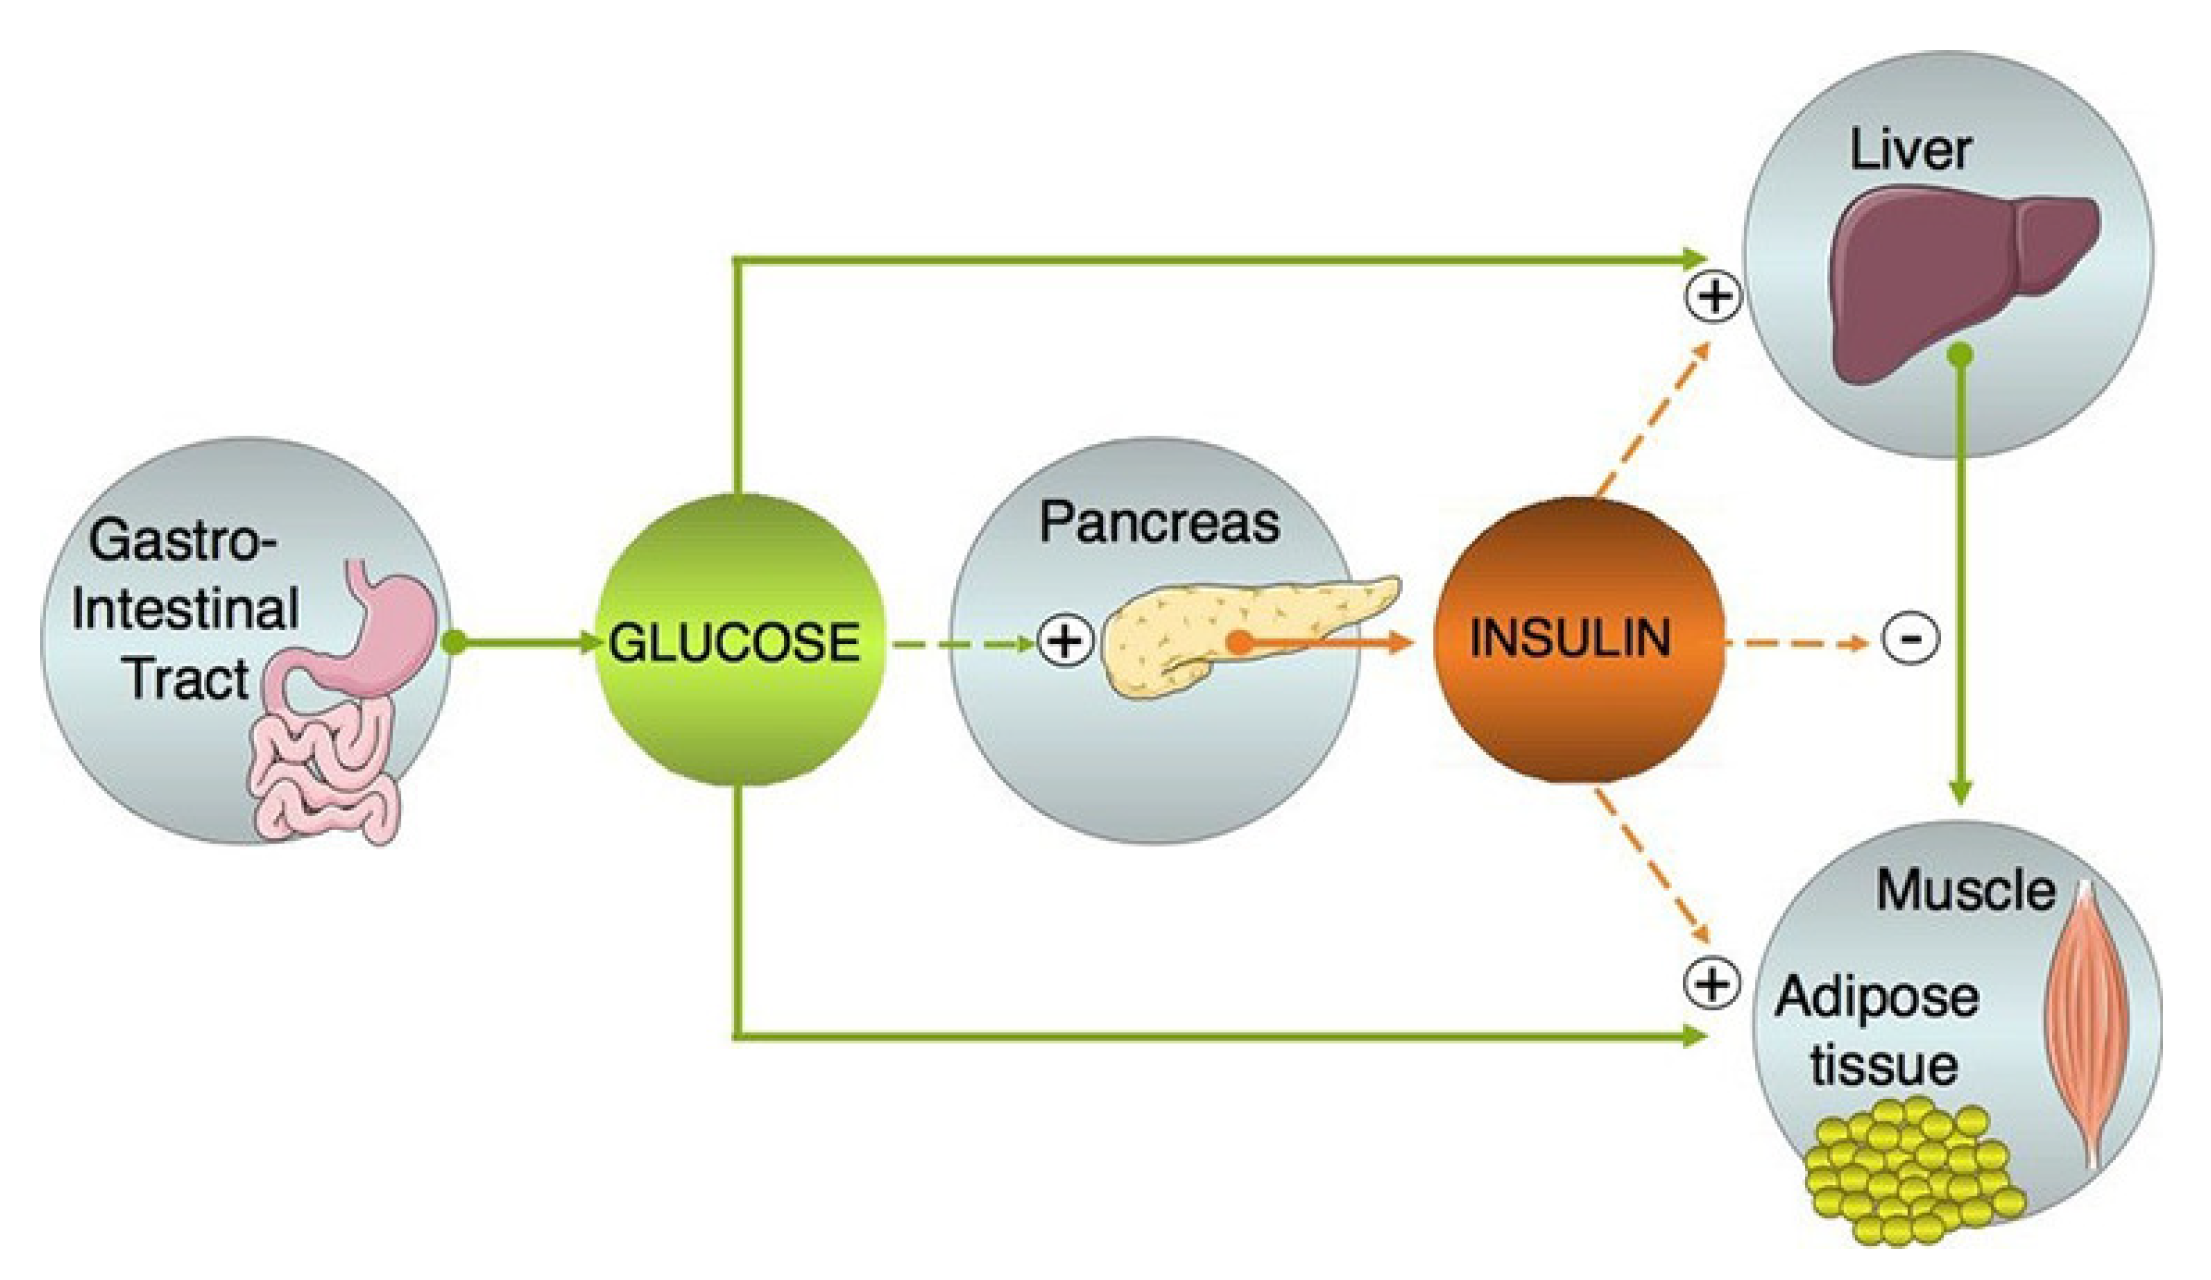
Figure 1.
High-level representation of the glucose-insulin control system (Reprinted with permission from [4]; published by Mary Ann Liebert, Inc., New Rochelle, NY, USA, 2004).
Figure 1.
High-level representation of the glucose-insulin control system (Reprinted with permission from [4]; published by Mary Ann Liebert, Inc., New Rochelle, NY, USA, 2004).

Figure 2.
Schematic representation of the glucose biosensor invented by Clark and Lyons [20].
Figure 2.
Schematic representation of the glucose biosensor invented by Clark and Lyons [20].

Figure 3.
First-, second-, and third-generation glucose biosensors.

Figure 4.
(a) Dielectric constant and (b) conductivity values obtained form measured data and corresponding fitted models at three differential glucose levels in the 0.5–20 GHz band (Reprinted with permission from [44]; published by IEEE, Toulouse, France, 2011).
Figure 4.
(a) Dielectric constant and (b) conductivity values obtained form measured data and corresponding fitted models at three differential glucose levels in the 0.5–20 GHz band (Reprinted with permission from [44]; published by IEEE, Toulouse, France, 2011).

Figure 5.
Glucose concentration detection using a mode cylindrical cavity. (a) Configuration of the sensor. (b) Frequency shift depending on the glucose concentration. (c) Variation in the output voltage depending on the glucose concentration (Reprinted with permission from [63]; © 2021 IEEE).
Figure 5.
Glucose concentration detection using a mode cylindrical cavity. (a) Configuration of the sensor. (b) Frequency shift depending on the glucose concentration. (c) Variation in the output voltage depending on the glucose concentration (Reprinted with permission from [63]; © 2021 IEEE).

Figure 6.
Glucose concentration detection using a mode metal cavity and a near-field microprobe. (a) Experimental setup for glucose concentration detection. (b) Change in reflection coefficient hias a function of the glucose concentration. The inset represents a real-time diagram of the reflection coefficient for different DI water concentrations to 300 mg/mL. ((a) DI water, (b) 50 mg/mL, (c) 100 mg/mL, (d) 150 mg/mL, (e) 200 mg/mL, (f) 250 mg/mL, and (g) 300 mg/mL) [66].

Figure 7.
Glucose concentration detection using a mode metal cavity and a near−field microprobe. (a) Configuration of the sensor. (b) Variation in the reflection coefficient as a function of the glucose concentration. ((a) DI water, (b) 10 mg/mL, (c) 20 mg/mL, (d) 30 mg/mL, (e) 40 mg/mL and (f) 50 mg/mL) (Reprinted with permission from [68]; published by Elsevier, 2009).

Figure 8.
Glucose concentration detection using a mode circular SIW with a microfluidic subsystem. (a) Configuration of the sensor. (b) Variation in the transmission coefficient with the glucose concentration [75].
Figure 8.
Glucose concentration detection using a mode circular SIW with a microfluidic subsystem. (a) Configuration of the sensor. (b) Variation in the transmission coefficient with the glucose concentration [75].

Figure 9.
Three microstrip antennas compared in terms of their sensor performance for glucose detection. (a) Spiral antenna. (b) UWB patch antenna. (c) Narrowband patch antenna (Reprinted with permission from [84]; © 2021 IEEE).
Figure 9.
Three microstrip antennas compared in terms of their sensor performance for glucose detection. (a) Spiral antenna. (b) UWB patch antenna. (c) Narrowband patch antenna (Reprinted with permission from [84]; © 2021 IEEE).

Figure 10.
Glucose concentration detection using an SSPP endfire sensor. (a) Configuration of the sensor. (b) Change in the resonant frequency with the glucose concentration from 70 mg/dL to 150 mg/dL (Reprinted with permission from [85]; © 2021 IEEE).
Figure 10.
Glucose concentration detection using an SSPP endfire sensor. (a) Configuration of the sensor. (b) Change in the resonant frequency with the glucose concentration from 70 mg/dL to 150 mg/dL (Reprinted with permission from [85]; © 2021 IEEE).

Figure 11.
Glucose concentration detection using a 60 GHz microstrip patch antenna. (a) Experimental setup for a real-time in vivo human clinical test. (b) Variation in the transmission coefficient of the sensor as a function of the glucose concentration [86].
Figure 11.
Glucose concentration detection using a 60 GHz microstrip patch antenna. (a) Experimental setup for a real-time in vivo human clinical test. (b) Variation in the transmission coefficient of the sensor as a function of the glucose concentration [86].

Figure 12.
Glucose concentration detection using a complementary split-ring resonator with temperature correction. (a) Experimental setup for continuous measurement of glucose concentration. (b) Variation in the transmission coefficient of the sensor as a function of the glucose concentration after temperature correction [103].

Figure 13.
Glucose concentration detection using dual complementary split-ring resonators with a switching circuit for environmental effect elimination. (a) Schematic of the glucose sensor. (b) Variation in the transmission coefficient of the sensor as a function of the glucose concentration after environmental effect elimination. (Reprinted with permission from [104]; published by IEEE, 2020.)


Table 1.
Historical landmarks in glucose biosensor development (Reprinted with permission from [35]; published by John Wiley and Sons, 2001).
Table 1.
Historical landmarks in glucose biosensor development (Reprinted with permission from [35]; published by John Wiley and Sons, 2001).
| Generation | Event | Reference |
|---|---|---|
| 1st G | 1962-First glucose enzyme electrode | [17] |
| 1st G | 1973-Glucose enzyme electrode based on peroxide detection | [36] |
| 1st G | 1975-Launch of the first commercial glucose-sensing system | YSI Inc. |
| 2nd G | 1982-Demonstration of in vivo glucose monitoring | [28] |
| 2nd G | 1984-Development of ferrocene mediators | [26] |
| 2nd G | 1987-Launch of the first personal glucose meter | Medisense Inc. |
| 3rd G | 1999-Launch of a commercial in vivo glucose sensor | Minimed Inc. |
| 3rd G | 2000-Introduction of a wearable noninvasive glucose monitor | Cygnus Inc. |
Table 2.
Dielectric measurements of aqueous glucose solutions via RF spectroscopy [48].
Table 2.
Dielectric measurements of aqueous glucose solutions via RF spectroscopy [48].
| Method | Configuration (Frequency ) | Reference |
|---|---|---|
| Antennas | Wideband monopole antenna (1–6 GHz) | [49] |
| Antennas | Patch antennas (2.45 GHz, 5.8 GHz) | [50] |
| Antennas | Patch antennas (5 GHz) | [51] |
| Antennas | Serpentine-shaped antenna (4.8 GHz) | [52] |
| Resonator | Open-ended spiral resonator (10 MHz–2 GHz) | [53] |
| Resonator | Patch resonator (2.45 GHz) | [54] |
| Resonator | Ring resonator sensor (1.5 GHz) | [55] |
| Resonator | Resonator combining a spiral inductor and an interdigital capacitor (5.8 GHz) | [56] |
| Resonator | Cross-coupled stepped-impedance resonator (6.53 GHz) | [57] |
1 The operating frequency in air.
Table 3.
Radio-frequency glucose sensors.
| Reference | Sensor Type | Frequency (GHz) | Concentration Range (mg/mL) | Sample Volume (L) | Sample Type | Sensing Parameter | Sensitivity (per mg/mL) | Error (%) | Continuous Measurement |
|---|---|---|---|---|---|---|---|---|---|
| [62] | cavity | 3 | 9–23.4 | - | Solution | Frequency | 250 kHz | - | X |
| Power | 9.31 W | ||||||||
| [63] | cavity | 3 | 3.6–25.2 | 8.8 | Solution | Frequency | 30 kHz | - | X |
| Voltage | 0.32 mV | ||||||||
| [64] | cavity | 7.542 | 0.7–1.5 | 1200 | Solution | Frequency | 42.875 kHz | - | X |
| [65] | cavity | 2.05 | 0–36 | 8000 | Solution | 0.02 dB | - | X | |
| [66] | cavity | 4.6 | 0–3000 | - | Solution | 0.00312 dB | - | X | |
| +microprobe | |||||||||
| [67] | cavity | 4.5 | 0–10 | 50 | Solution | 0.004 dB | - | X | |
| +microprobe | |||||||||
| [68] | Dielectric waveguide | 2.15 | 0–50 | 1000 | Solution | 0.0028 dB | - | X | |
| +microprobe | |||||||||
| [73] | SIW | 5.8 | 1–5 | - | Solution | Frequency | 24.05 MHz | - | X |
| [75] | circular SIW | 4.4 | 0–300 | 2.5 | Solution | Frequency | 383 kHz | ±0.44 | X |
| 0.013 dB | |||||||||
| [80] | Patch antenna | 5.5 | 0.5–5 | - | Solution | Frequency | 39.25 MHz | - | X |
| +SIW slot antenna | |||||||||
| [81] | Two planar | 3–10 | 0–40 | - | Phantom | 0.14 dB | - | X | |
| UWB slot antennas | |||||||||
| [82] | U-shaped antenna | 1.9 | 0–40 | 40,000 | Solution | Frequency | 1.25 MHz | - | X |
| 0.5 dB | |||||||||
| [83] | Inset-fed | 2.4 | 1–5 | - | Solution | Frequency | 7.5 MHz | - | X |
| patch antenna | |||||||||
| [84] | Patch antenna | 1.36 | 1–3.5 | - | Blood | Frequency | 500 MHz | - | X |
| [51] | Inset-fed | 5 | 0–5 | 25,000 | Blood | Frequency | 17.2 MHz | - | X |
| patch antenna | |||||||||
| [85] | SSPP endfire antenna | 8.9 | 0.75–1.5 | - | Blood | Frequency | 150 MHz | - | X |
| [86] | Patch antenna | 60 | 0–5 | - | Blood | 0.025 dB | 10 | O | |
| [100] | Dielectric resonator | 1.68 | 0–300 | 4 | Solution | Frequency | 16.8 kHz | - | X |
| 0.003 dB | |||||||||
| [101] | Hilbert-shaped | 6 | 0–2.5 | 500 | Solution | 1.56 dB | ±2 | X | |
| resonator | |||||||||
| [102] | CSRR | 2.48 | 0–5 | - | Solution | Frequency | 500 kHz | 3.3 | X |
| 0.6 dB | |||||||||
| [55] | Discrete DSRR | 4 | 0–7.2 | 21,000 | Blood | Frequency | 18.24 kHz | 0.5 | O |
| [103] | CSRR | 2.42 | 0–4 | 3.9 | Solution | 0.0075 dB | - | O | |
| [104] | CSRR | 2.42 | 0–4 | 3.9 | Solution | 0.008 dB | - | O | |
| [105] | SRR | 4.2 | 0–50 | - | Solution | Frequency | 2.6 MHz | - | X |
| [52] | Resonator | 4.8 | 0–20 | 120 | Solution | Frequency | 1.6 MHz | 3 | X |
| [106] | Rectangular meander | 9.2 | 0–5 | 1 | Blood serum | Frequency | 92.6 MHz | 1 | X |
| line resonator | |||||||||
| [57] | Stepped-impedance | 6.53 | 0–5 | 2 | Blood serum | Frequency | 978.7 MHz | 2.4 | X |
| resonator | |||||||||
| [107] | SRR | 2 | 10–150 | - | Solution | Frequency | 10.5 kHz | - | X |
| Amplitude | 0.0017 dB | ||||||||
| [108] | Air-bridge-type | 1.5 | 0.3–5 | 0.1 | Solution | Frequency | 117.5 kHz | 1.1 | X |
| LC resonator | 0.49 dB | ||||||||
| [109] | SRR | 1.61 | 0–400 | 90 | Solution | Frequency | 174 kHz | 7.3 | O |
| [110] | SRR | 1.61 | 0–500 | 90 | Solution | Frequency | 107 kHz | 7.3 | O |
| [10] | Chipless tag | 4 | 0–7.2 | 200 | Phantom | Frequency | 210.92 kHz | - | O |
| SRR | 0.0084 dB | ||||||||
| [111] | Complementary | 1.16 | 0–100 | - | Solution | Frequency | 2.11 MHz | - | X |
| electric-LC resonator | |||||||||
| [112] | Complementary | 1.71 | 0–500 | 95 | Blood | Frequency | 1.85 MHz | - | X |
| electric-LC resonator | |||||||||
| [9] | Four-cell | 2 | 0.4–1.4 | 600 | Solution | Frequency | 95 MHz | - | O |
| hexagonal CSRR | |||||||||
| [113] | CSRR | 5.41 | 0–80 | 100 | Solution | Frequency | 6.25 MHz | - | X |
| [114] | Open-loop | 5.16 | 0–100 | 25 | Solution | Q-factor | 0.0658 | 2 | X |
| microstrip resonator | 0.0084 dB | ||||||||
| [118] | LC resonator | 3.41 | 40–200 | 20 | Solution | 0.053 dB | - | X | |
| [119] | Interdigitated | 7.5 | 0–80 | - | Solution | 0.0076 dB | - | X | |
| capacitor | |||||||||
| [120] | Ring resonator | 4.01 | 0–2.5 | - | Solution | Phase() | 0.2 deg | - | X |
| Phase() | 0.48 deg | ||||||||
| [121] | Epsilon-negative | 2.074 | 0–100 | - | Solution | Voltage | 1.4 mV | 1.41 | X |
| resonator |
Publisher’s Note: MDPI stays neutral with regard to jurisdictional claims in published maps and institutional affiliations. |
© 2021 by the authors. Licensee MDPI, Basel, Switzerland. This article is an open access article distributed under the terms and conditions of the Creative Commons Attribution (CC BY) license (http://creativecommons.org/licenses/by/4.0/).
Share and Cite
MDPI and ACS Style
Jang, C.; Lee, H.-J.; Yook, J.-G. Radio-Frequency Biosensors for Real-Time and Continuous Glucose Detection. Sensors 2021, 21, 1843. https://doi.org/10.3390/s21051843
AMA Style
Jang C, Lee H-J, Yook J-G. Radio-Frequency Biosensors for Real-Time and Continuous Glucose Detection. Sensors. 2021; 21(5):1843. https://doi.org/10.3390/s21051843
Chicago/Turabian StyleJang, Chorom, Hee-Jo Lee, and Jong-Gwan Yook. 2021. "Radio-Frequency Biosensors for Real-Time and Continuous Glucose Detection" Sensors 21, no. 5: 1843. https://doi.org/10.3390/s21051843
Note that from the first issue of 2016, this journal uses article numbers instead of page numbers. See further details here.