
Convolutional Neural Network for Drowsiness Detection Using EEG Signals
by
 , , , and
Siwar Chaabene
1,2,† ,
,
Bassem Bouaziz
1,2,†,
Amal Boudaya
1,2,
Anita Hökelmann
3,
Achraf Ammar
3,4,*,‡ and
Lotfi Chaari
5,‡
1
Multimedia InfoRmation Systems and Advanced Computing Laboratory (MIRACL), University of Sfax, Sfax 3021, Tunisia
2
Digital Research Center of Sfax, B.P. 275, Sakiet Ezzit, Sfax 3021, Tunisia
3
Institute of Sport Science, Otto-von-Guericke University Magdeburg, 39104 Magdeburg, Germany
4
Interdisciplinary Laboratory in Neurosciences, Physiology and Psychology: Physical Activity, Health and Learning (LINP2), UFR STAPS, UPL, Paris Nanterre University, 92000 Nanterre, France
5
IRIT-ENSEEIHT, University of Toulouse, 31013 Toulouse, France
*
Author to whom correspondence should be addressed.
†
These authors contributed equally to this work as first author.
‡
These authors contributed equally to this work as last author.
Sensors 2021, 21(5), 1734; https://doi.org/10.3390/s21051734
Submission received: 5 December 2020
/
Revised: 4 February 2021
/
Accepted: 24 February 2021
/
Published: 3 March 2021
(This article belongs to the Special Issue Selected Papers from International Conference on Smart Living and Public Health (ICOST 2020))
Abstract
:Drowsiness detection (DD) has become a relevant area of active research in biomedical signal processing. Recently, various deep learning (DL) researches based on the EEG signals have been proposed to detect fatigue conditions. The research presented in this paper proposes an EEG classification system for DD based on DL networks. However, the proposed DD system is mainly realized into two procedures; (i) data acquisition and (ii) model analysis. For the data acquisition procedure, two key steps are considered, which are the signal collection using a wearable Emotiv EPOC headset to record 14 channels of EEG, and the signal annotation. Furthermore, a data augmentation (DA) step has been added to the proposed system to overcome the problem of over-fitting and to improve accuracy. As regards the model analysis, a comparative study is also introduced in this paper to argue the choice of DL architecture and frameworks used in our DD system. In this sense, The proposed DD protocol makes use of a convolutional neural network (CNN) architecture implemented using the Keras library. The results showed a high accuracy value (90.42%) in drowsy/awake discrimination and revealed the efficiency of the proposed DD system compared to other research works.
1. Introduction
Over the past three decades, we have seen changes in driving conditions and driver safety due to the vast efforts of research studies and government agencies. According to available estimates [1], more than 1.3 million people die per year, and about 20 to 50 million people suffer non-fatal injuries due to road accidents. Drowsiness and fatigue, immediately after high speed and alcoholism [2], are the main causes of traffic injuries in many areas such as aviation [3], the military sector [4] and driving [5]. However, drowsiness detection (DD) researches [6,7] have been a subject of interest in recent years. This is now a real up to date problem in the current Covid-19 pandemic [8] where medical equipment is commonly overbooked.
Drowsiness [9] is an intermediate state between wakefulness and sleep. This state is mainly defined by heaviness in terms of reaction, changes in behavior, reflex reduction, and the difficulty of keeping the head in the frontal position of the vision field. In this regard, several means such as videos [7,10] and biomedical signals [11,12] have been targeted for DD. On the one side, the video-based applications for DD are efficient and robust against noise and lighting variations [13]. Nevertheless, the biomedical signals are the best indicators of drowsiness relative to video features, according to [14]. In this context, several biomedical signals, such as electroencephalogram (EEG) [15], electrocardiogram (ECG) [16], electromyogram (EMG) [17] and electrooculogram (EOG), have been used for various DD studies [18,19,20,21]. Among them, EEG is probably the most efficient and promising modality of DD [22,23] thanks to various existing EEG-based technologies [24]. Furthermore, this modality provides a good state of DD accuracy rate and also is more appropriate than percentage-of-eye-closure (PERCLOS) [25] indicator in the evaluation of driver drowsiness. Thanks to its high temporal resolution, portability, and inexpensive cost, the Emotiv EPOC (https://www.emotiv.com/epoc/ (accessed on 1 June 2020) headset [26] is considered one of the most commonly used among the EEG-based technologies. The neurotechnology headset is a brain measuring data hardware that enables to record brain activity using fourteen electrodes placed on the participant’s scalp. In this paper, we focus on an EEG-based DD system using the Emotiv EPOC headset to record brain activity by analyzing the drowsy or awake states.
Over this decade, many EEG-based research works related to machine learning (ML) [27,28,29,30] have been suggested in medical diagnosis, in particular for classification-based drowsiness detection tasks. Nevertheless, some limitations appear in ML applications such as the need for a massive dataset to train, limitation predictions in return, the need of an intermediary step for feature representation and drawing conclusions to detect anomalies.
In addition, deep learning (DL) researches [31,32] have recently shown notable progress in biomedical signal analysis especially classification-based anomaly detection. However, DL [33] is now the fastest sub-field of ML technology [34] based on the artificial neural networks (ANNs) [35]. Interestingly, DL networks offer great potential for biomedical signals analysis through the simplification of raw input signals (i.e., through various steps including feature extraction, denoising, and feature selection) and the improvement of the classification results. Various DL models have been applied to biomedical signal analysis [36] particularly for recurrent neural networks (RNNs) [37], long short-term memory (LSTM) [38], auto-encoder (AE) [39], convolutional neural networks (CNNs) [40], deep stacking networks (DSNs) [41], etc. Among them, CNNs models [42] are the most frequently used in biomedical signals classification for anomaly detection due to its high classification accuracy. In this sense, several biomedical signals-based CNNs studies [43,44,45] have been suggested for anomaly detection tasks using various architectures such as CNN, visual geometry group network (VGGNet), Residual Network (ResNet), Dense Net, Inception Net, etc. In the present study, a CNN architecture is developed to classify the drowsy or awakeness states of each participant using an Emotiv EPOC headset.
Along with the growing success of CNNs, the interest in data augmentation (DA) quickly increased. Numerous DL research works have integrated the DA technique [46,47] in the training step in order to avoid over-fitting and improve the performance of the networks by increasing accuracy. In our work, we integrated the DA technique to improve the performance of the proposed system.
According to [48], the authors proposed an algorithm that uses features learned applying a CNN to capture various latent facial characteristics and various complex nonlinear characteristics. This system is used to warn the driver of drowsiness and to prevent traffic accidents. The trained classifier results give a classification accuracy equal to 92.33%. Likewise, in [49], the authors used an RNNs architecture to detect driver fatigue in real-time. The experimental part presents good results (92.19%). In [50], the authors propose a Complex Network-Based Broad Learning System (CNBLS) to differentiate between the fatigue and alert state using EEG signals. The experimental results showed an average accuracy of around 100%. In [51], the authors suggest the detection of driver fatigue using a single EEG signal with the AlexNet CNN model. The achieved accuracy is respectively equal to 90% and 91%. According to [52], a system composed of deep CNNs and deep residual learning with EEG signals is proposed to detect mental driver fatigue. The results showed an average accuracy reaching, respectively, to 91.788% and 92.682%. In [53], the authors proposed a system to detect driver drowsiness based on differential entropy (DE) with a novel deep convolutional neural network. The experimental results showed an accuracy equal to 96%. In [54], an EEG based prediction has been developed to transform the recorded EEG into an image liked feature map applying a CNN architecture. This approach offers a 40% detection score in the drowsy class.
The aim of our paper is to develop a new EEG-based DD system based on a CNN model. Our system is validated through individual performance assessment and comparison with other CNNs architectures used in biomedical signals analysis.
The rest of this paper is divided into four sections. In Section 2, we introduce the suggested system using the Emotiv EPOC headset. Moreover, we introduce the methodology used for EEG data acquisition as well as the architectures used for drowsiness analysis. In Section 3, the experimental results of the proposed system are listed. A discussion is given in Section 4. Finally, conclusions and future work are drawn in Section 5.
2. Materials and Methods
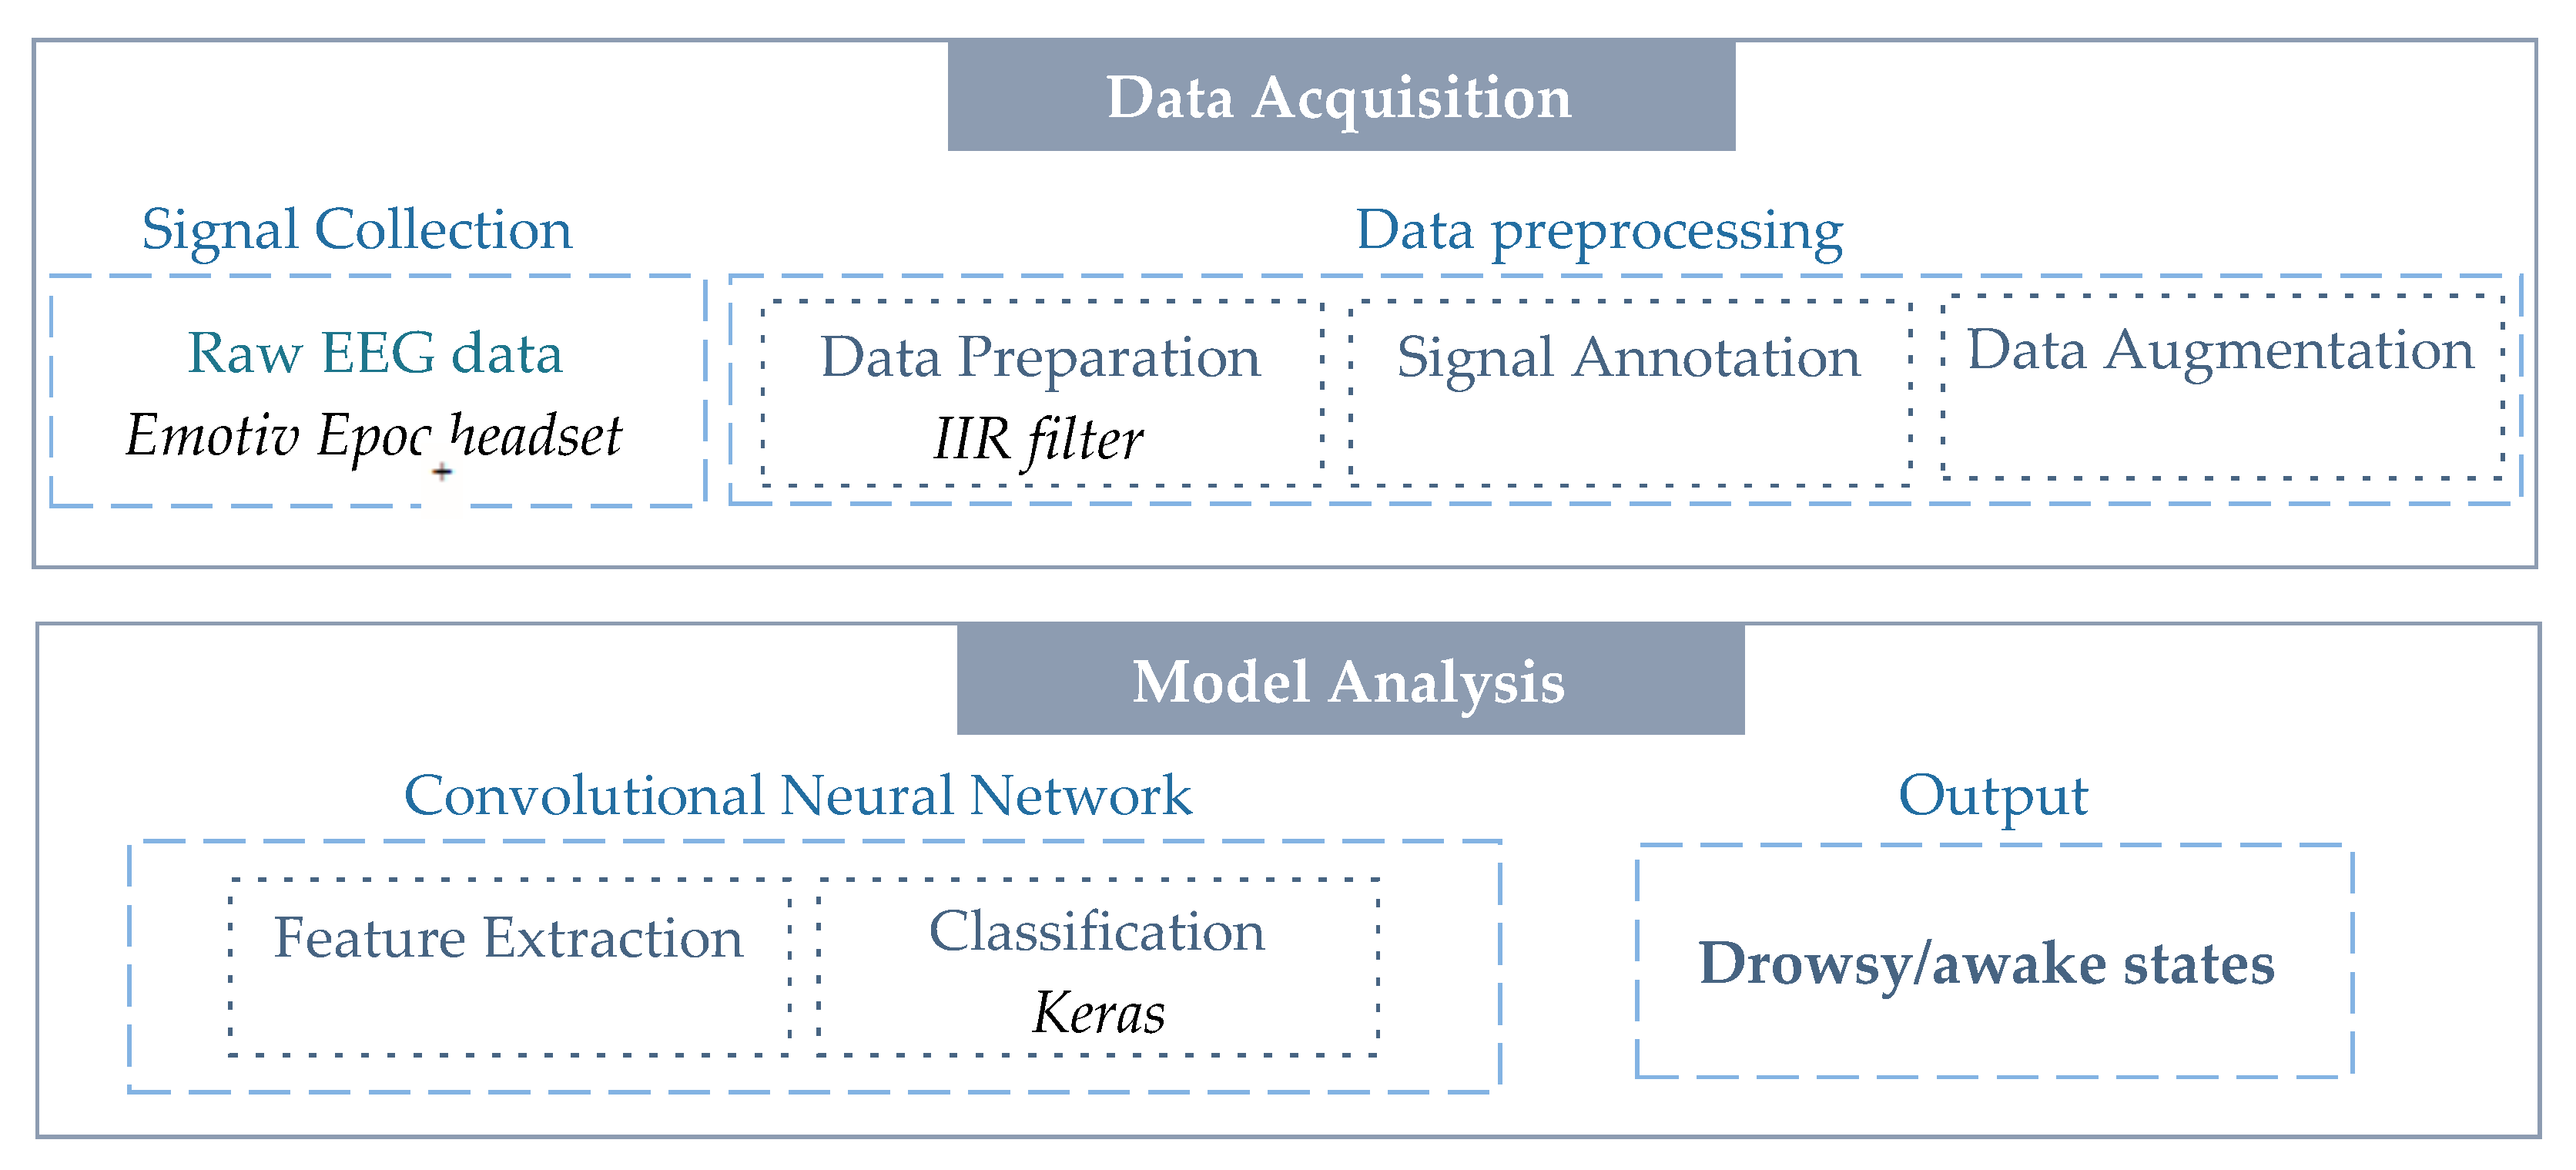
Our protocol introduces a new classification system between drowsiness or awakeness states using the Emotiv EPOC headset to record 14 channels of EEG signals. The pipeline of the proposed system is represented in Figure 1. Data acquisition and model analysis are the two main procedures of our system. A detailed description of each procedure is given in the following subsections.
2.1. Data Acquisition
The EEG data acquisition procedure consists of two main steps that are signal collection using the Emotiv EPOC headset and data preprocessing. A description of each step is provided as follows.
Signal Collection
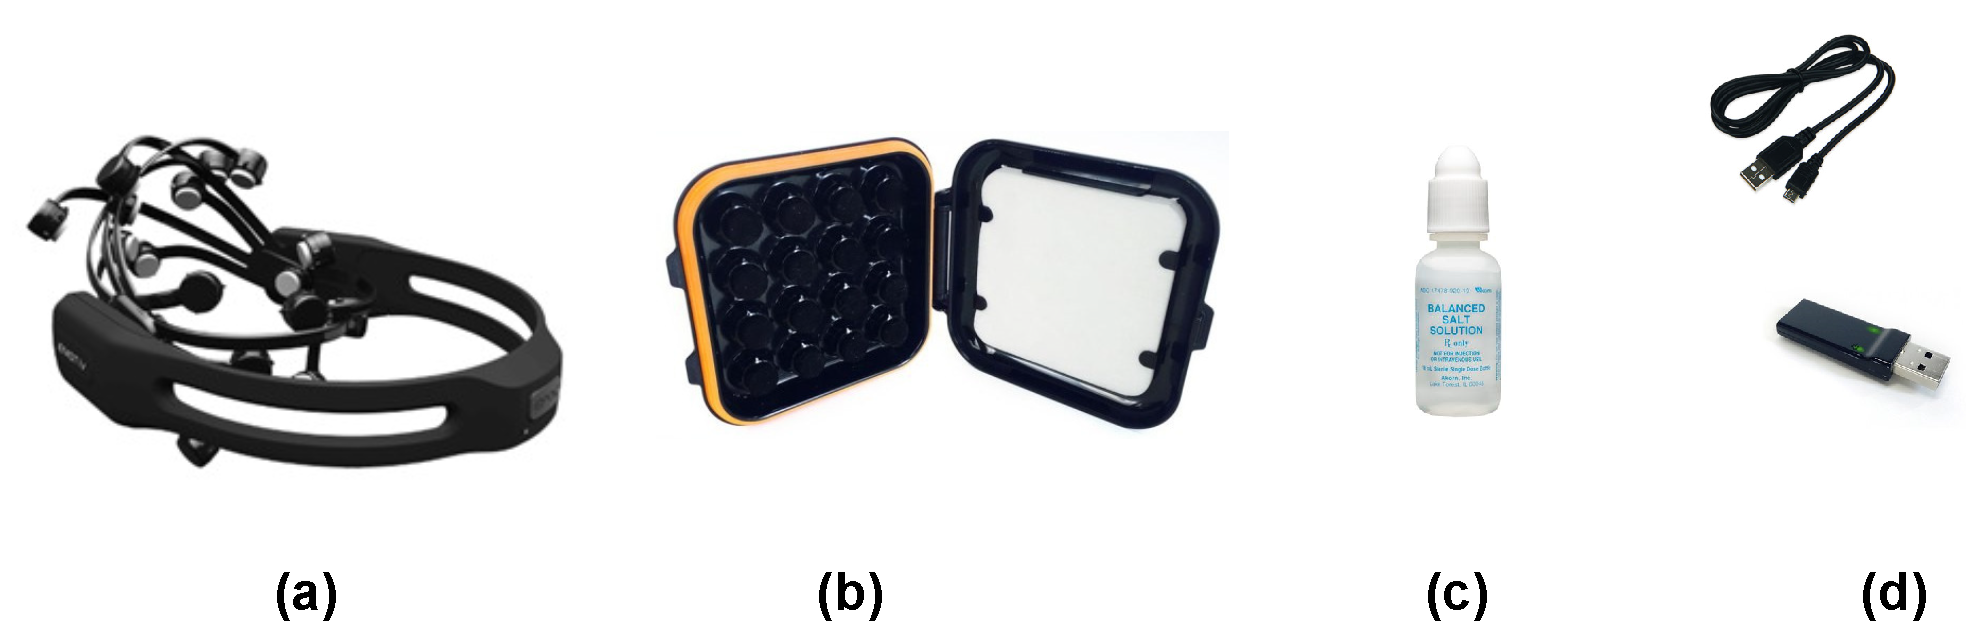
The signal collection step is developed by two processes, which are the hardware and the software parts [55]. The Emotiv EPOC hardware is a non-invasive brain-computer interface (BCI) used for the development of the human brain and contextual research. Figure 2 illustrates the various Emotiv EPOC helmet components used in the experimental step consisting of a headset, a fourteen-sensors box, a USB key with cable for battery recharging that ensures the connection between the headset and the Emotiv Pro software, and a saline solution [56] that ensures impedance and contact with the cortex. Compared to medical gel [57], the saline solution is easy to use and maintains effective contact with the scalp of men and women.
The Emotiv EPOC headset provides excellent access to professional-level brain data. As shown in Figure 3, this helmet contains fourteen active electrodes with two reference electrodes, which are Driven Right Leg (DRL) and Common Mode Sense (CMS). The electrodes are mounted around the participant’s scalp in the structures of the following zones: frontal and anterior parietal (AF3, AF4, F3, F4, F7, F8, FC5, FC6), temporal (T7, T8), and occipital-parietal (O1, O2, P7, P8). Table 1 presents some of the main characteristics of the Emotiv EPOC helmet.
The EmotivPRO software allows visualizing the data streams in real-time including all data sources. This program configures the vertical scaling of the EEG Graphics with the multi-channel and single-channel display mode. Subsequently, the raw EEG data are exported in European Data Format (EDF) or Comma-Separated Values (CSV) formats that are considered as the input of the data preprocessing step.
2.2. Data Preprocessing
The specific preprocessing steps of the EEG data revolve around the following points that are data preparation, signals annotation, and data augmentation.
2.2.1. Data Preparation
Various noise sources are targeted in the portion of the raw signal including eye blinks [59,60], dipolar size variance, muscle switches, inherent electrical properties and physical arrangement of various tissues [61]. Data preprocessing is a preliminary step to EEG data denoising. In this context, various filters based on EEG denoising methods have been suggested as infinite impulse response (IIR) and finite impulse response (FIR) filters. Other sophisticated denoising approaches could be considered at the expense of higher computational complexity [62,63]. In our work, we propose to use an IIR filter that manages an impulsive signal within time and frequency domains. The IIR filter function can be expressed as the following discrete difference:
where y(n) refers to the filtered signal, x(n) represents the input signal, and refer to the coefficients of the filter, and N represents the order of the filter. Subsequently, we convert the EEG signal from the time domain to the frequency domain using the fast Fourier transform (FFT) [64]. The key task of the FFT is to take to 1024 samples from the input signal in the time domain and generate the output frequency of 128 Hz in the spectrum domain. In this work, alpha and theta waves analysis are accomplished using the FFT by adopting standardized EEG data.
2.2.2. Signals Annotation
The central nervous system (CNS) [65] consists of the spinal cord, the cerebellum, and the brain. The latter is divided into two parts: the right and left hemispheres. There are four lobes in each hemisphere, which are frontal, parietal, occipital, and temporal. Predominantly, the EEG signal is split into large spectral frequency bands related to EEG processors and rhythms of various frequency waves [66,67]. Brainwaves are usually classified into five frequency and amplitude bands [66] including Gamma, Beta, Alpha, Theta, and Delta where each band wave refers to identifying states of participants. Other mixed bands, such as Alpha-Theta (5–9 Hz) [68], have also appeared, which refers to waking and relaxation states. Table 2 presents a brief description of each brainwave from EEG signals.
The main functions associated with the six brainwave frequencies are described in the following in order to identify the electrodes that allow the detection of drowsy/awake states.
- Gamma bands have a frequency ranging from 30 to 70 Hz and an amplitude value between 3 µV to 5 µV. These waves are used to detect Alzheimer’s disease [69].
- Beta wave is generated from the cortex region with frequency values from 13 to 30 Hz and a low amplitude ranging from 2 to 20 µV. These waves are related to awake states and various pathologies and symptoms of drugs.
- Alpha band is produced from the thalamus area with a frequency ranging between 8 to 13 Hz and amplitude values between 20 to 60 µV. This band is detected with eyes closed to generating relaxation and awake states with attenuating drowsiness.
- Theta wave is produced from the neocortex and hippocampus areas of the brain with frequency values from 4 to 7 Hz and an amplitude ranging from 20 to 100 µV. This band is correlated with a drowsiness state.
- Delta wave is produced from the thalamus with a spectrum range of 4 Hz and an amplitude ranging from 20 to 200 µV. The wave is shown in the deep stage of sleep.
- Alpha-Theta waves have a frequency ranging from 5 to 9 Hz and amplitude values between 20 to 100 µV. These bands refer to awake and drowsy states.
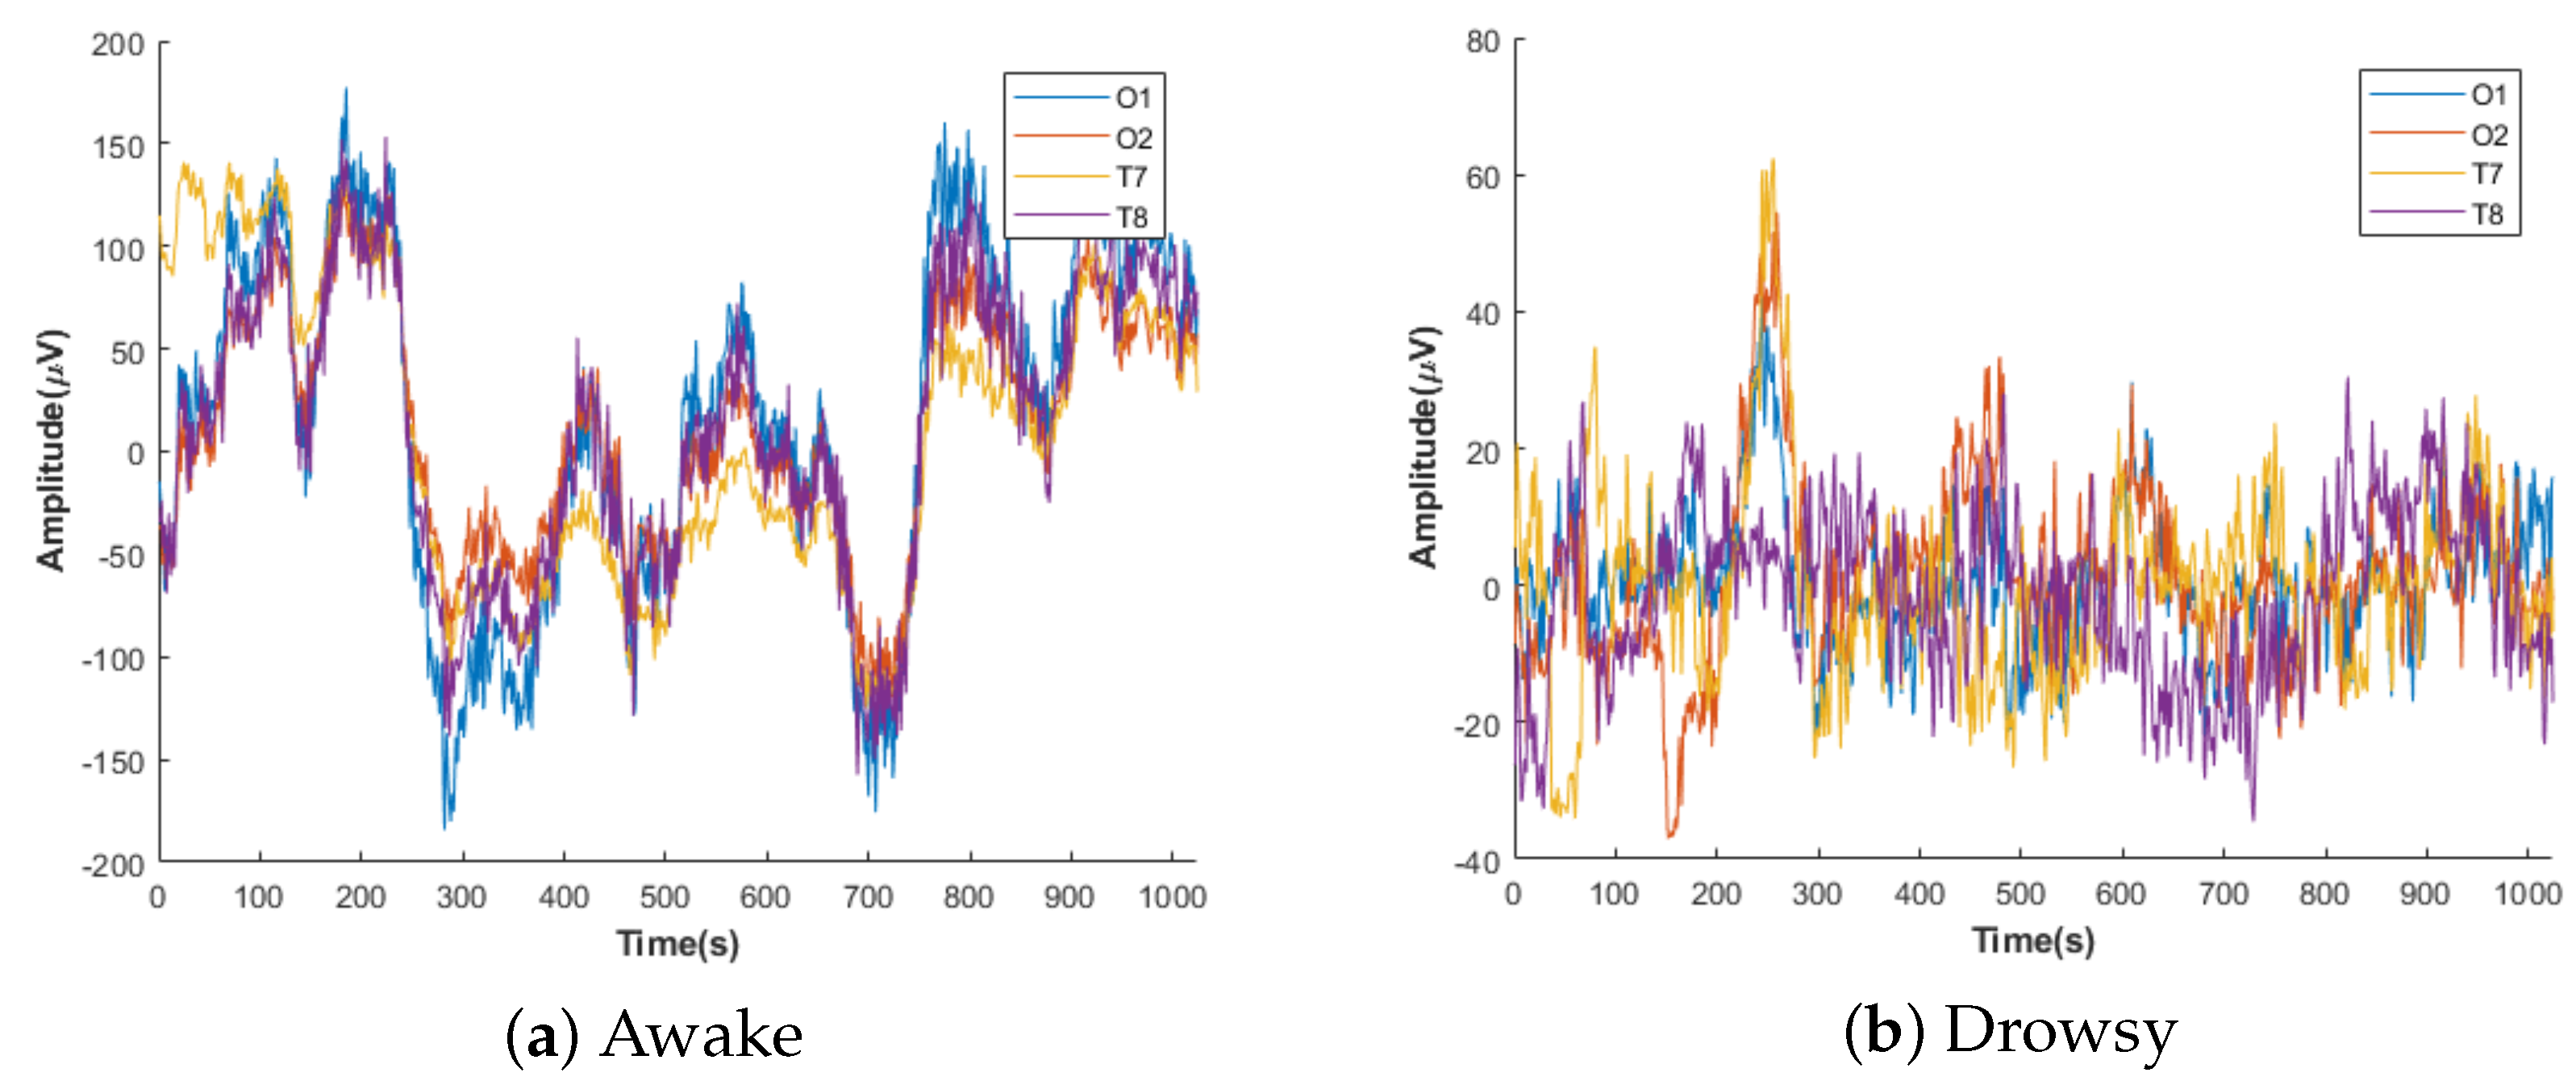
Furthermore, drowsiness is an intermediate state between awakeness (i.e., wakefulness) to sleep. During awakeness, beta waves are analyzed in the human brain [70]. The drowsy stage is called stage 1 of sleep, the correlation is assured by alpha and theta bands [71,72,73,74]. The decrease in the alpha band and the rise in the theta frequency band expresses drowsiness [75]. The drowsy state is a transitional phase between wakefulness and sleep, which is experienced in theta brain waves. This step is characterized by a decrease in the EEG waves frequency with an increase in their amplitude. The third and fourth steps are related to deep sleep, which is characterized by a low frequency and high amplitude fluctuation of the delta waves [76]. According to this analysis, we support that the alpha-theta waves are the best bands for detecting the drowsy state. Our annotation is based on the study of Alpha-Theta waves for drowsiness/awakeness detection from, respectively, the occipital and temporal regions. The illustration of our annotation for the awake and drowsy states mentioned by O1, O2, T7, and T8 is shown in Figure 4. During the awakeness state, the amplitude is characterized by the lowest value while the drowsiness state is characterized by the highest value.
2.2.3. Data Augmentation
In the recent year, DA [77] has been shown to achieve significant performance for DL with increasing accuracy and stability and reducing over-fitting. As developed in [46], DA is a process in which new data are artificially created from the current data on the training phase. In [78], the need for developing a DA technique contributes to avoiding over-fitting, improves classification accuracy and stability [47,79] then better generalizes on new data and enhances performance in imbalanced class issues [80]. Furthermore, DA allows improving the efficiency of CNN in the BCI field by overcoming the problems of small datasets. DA effectiveness varied considerably across techniques. However, sampling methods, noise addition, windows sliding, and Fourier transform are considered as the classic examples in signal classification tasks. Growingly, the DA techniques are used with DL networks on EEG signals works to generate new samples based on existing training data [46]. This technique presents various advantages as it increases the model robustness against the variability of the input without decreasing the efficient capacity [81]. In our work, DA steps are applied only to the training set in order to prevent over-fitting. The main idea of this procedure is to generate new samples by labeling retraining data transformations. The proposed DA method is considered as the opposite operation to dropout [82] where a small volume of training data are duplicated randomly and appended to the training set. For instance, each EEG segment of the training set added a form of opposite operation to the dropout where the segments were extended by duplicating the vectors at random time points to a fixed length in the time dimension.
2.3. Model Analysis
Choices of the different architectures and frameworks of DL used in the proposed DD system are argued by a comparative study. This section introduces our DD system based on comparative analysis.
2.3.1. Comparative Study
Simple CNN, ResNet, WaveNet, and Inception are among the best CNNs networks widely used in biomedical signals analysis studies. Based on recent works [42,83,84,85,86,87,88,89,90,91,92,93,94,95,96,97], a comparative analysis is provided in the following using various performance criteria as complexity, 1D-dimension, performance and time-consumption. In this regard, specific three tests (2, 3 and 4 states) with various values are given for each criterion as following.
- 2 states (0, 1),
- 3 states (0, 0.5, 1),
- 4 states (0, 0.33, 0.66, 1),
where 0 value is the low level, 1 value represents the high level, 0.33, 0.5, and 0.66 are intermediate levels. Table 3 indicates the score of the architectures with 2, 3, and 4 states.
For instance, 0 value indicates more complexity and time-consumption, low performance and unused for 1D-dimension, while a value of 1 indicates less complexity and time-consumption, high performance and widely used for 1D-dimension. The highest score is identified by the best architecture used in biomedical signals classification. According to the reported results, the high total value is presented by the Simple CNN architecture.
As regards the choice of the DL framework, there are numerous open-source frameworks [98,99], such as keras [100], tensorflow [101], and pytorch [102]. In the developing of DL models, the Keras framework offers a high level in build blocks by using particular libraries, such as TensorFlow, dedicated for operations characterized by a low level [103]. In this context, we have used the Keras DL library with a sequential model applied to the binary classification. Keras is used to build the architectures with TensorFlow backend [104]. This framework presents high-level application programming interfaces (APIs) developed on top of TensorFlow. This model is characterized by its easy use and its simplicity.
Regarding the choice of the optimization algorithm, many optimizers exist in the literature such as Adam [105], Stochastic Gradient Descent Optimizer (SGD) [106] and Root Mean Square Propagation (RMS prop) [107]. In this context, SGD is the most popular optimizer, which is simple and effective for finding optimal values in a neural network. In this work, we have used an SGD optimizer.
2.3.2. Proposed Simple CNN Model
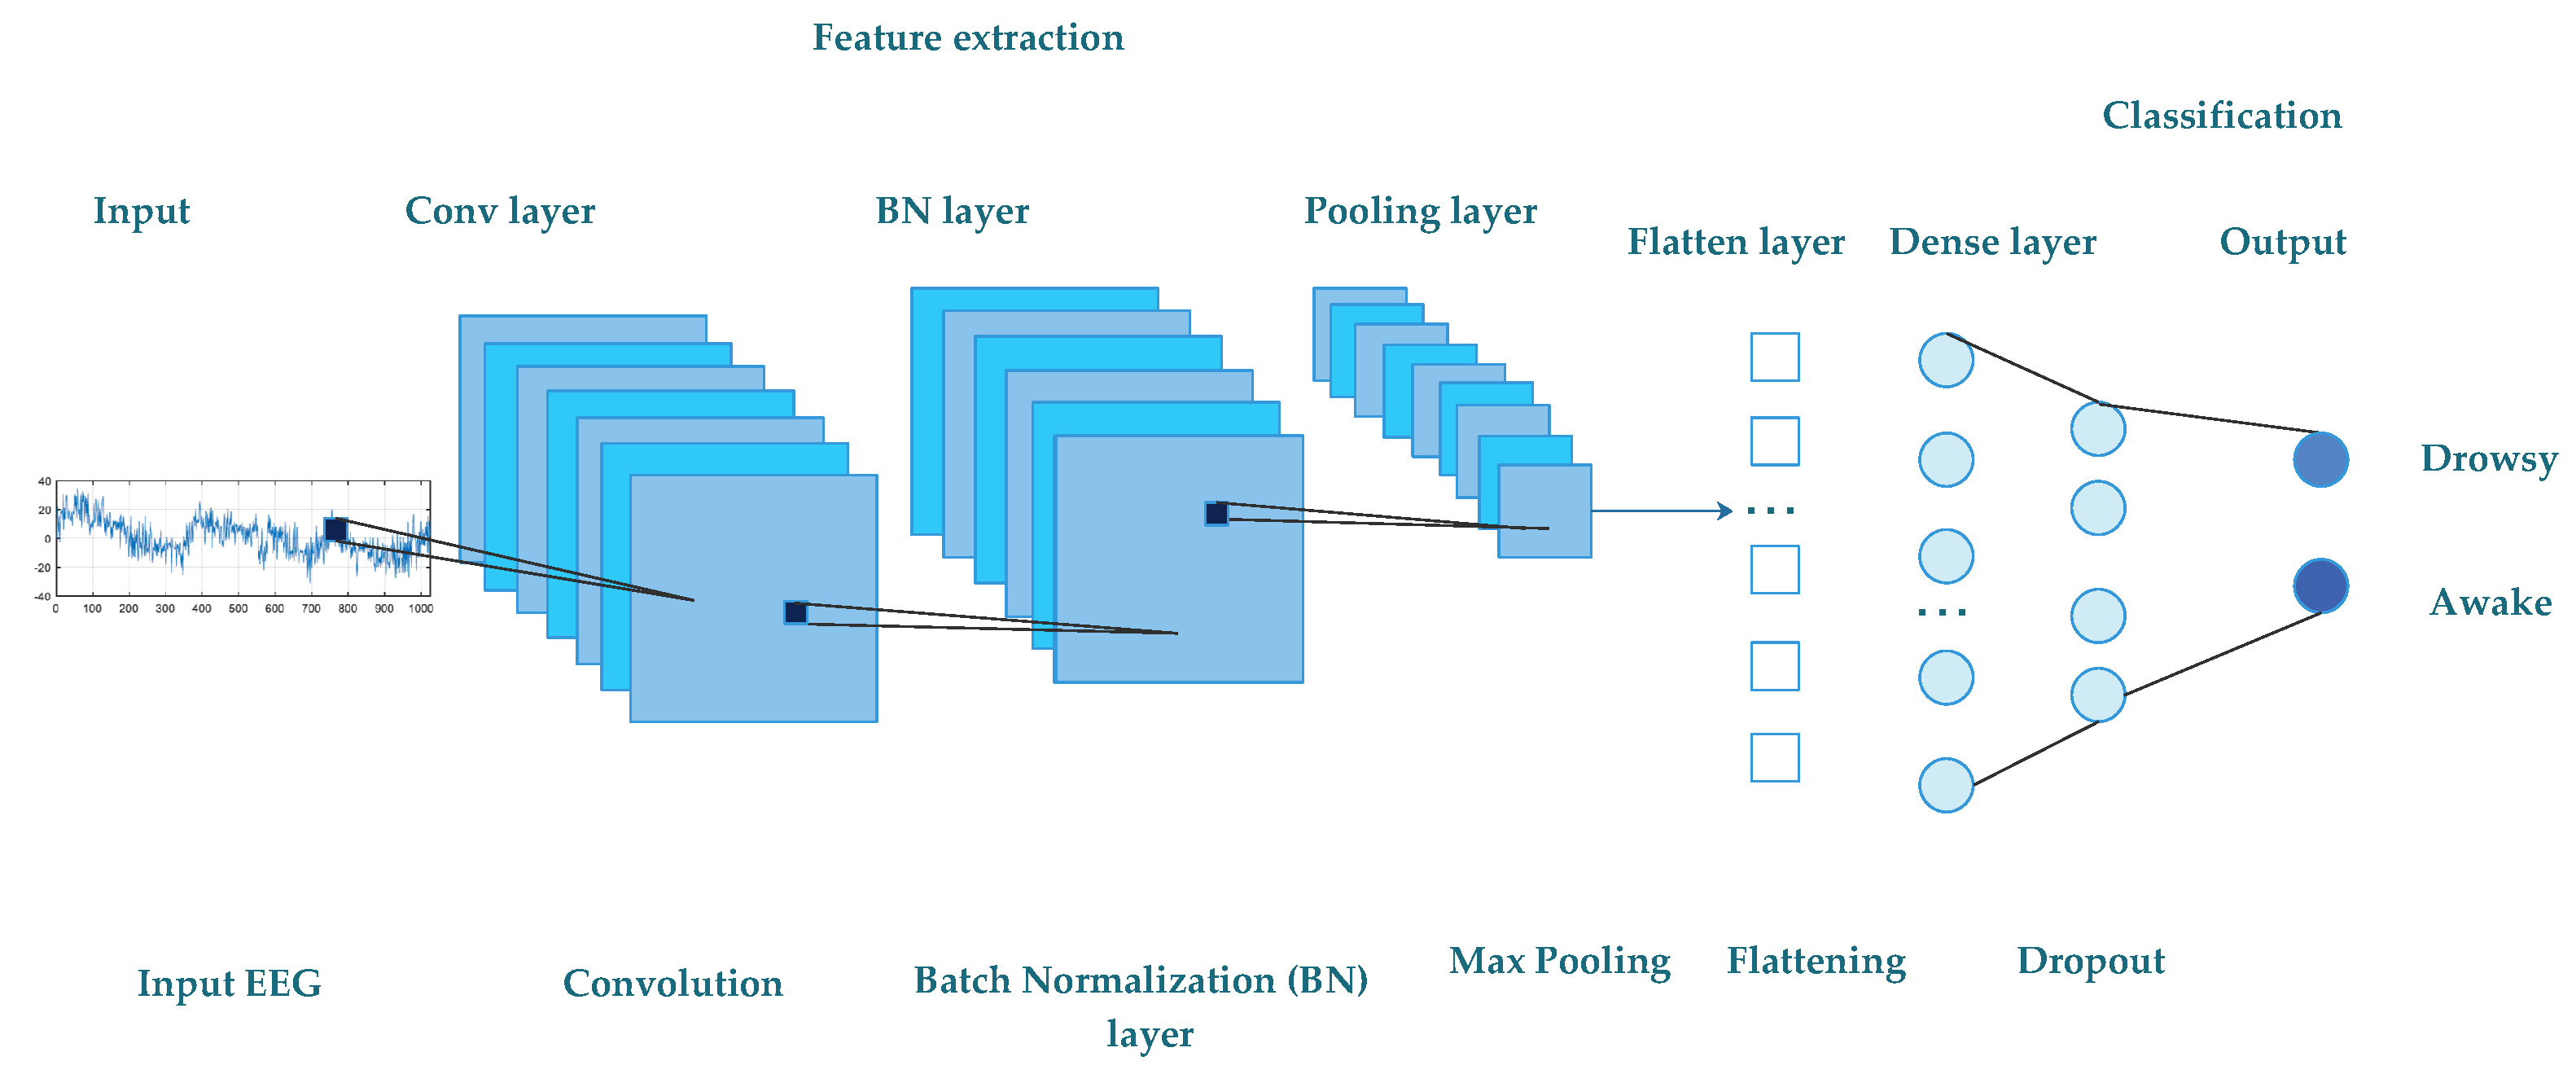
The diagram of the proposed CNN used in our DD system is presented in Figure 5. All the EEG windows with 3.75 s are the input of our proposed model. Via four convolutional and one max-pooling layers, EEG signals move followed by seven batch-normalization and one fully connected layer. All layers are equipped with the activation function of the rectified linear unit (ReLU). The pooling process chooses the maximum pooling procedure that can accomplish both reduction of dimensionality and invariance. In addition, dropout processing [82] is used to reduce the risk of over-fitting. Throughout the structure of our network, the fully connected layer serves as a classifier when mapping between high and low dimensions. The different layers of the proposed CNN model used in our DD system are detailed in the following.
- Convolutional layersThe layers allow filter application and features extraction [108] based on the input EEG signals. The equation below presents the convolution operation.where ∗ is the convolution operation, presents the feature map, is the bias term, is the sub-kernel of channel and is the input signal. Table 4 presents a description of the four convolutional layers purpose.
- BatchNormalization layersAs known in DL, there are two fundamental problems [109], which are the over-fitting and the long training duration. The Batch Normalization (BN) layers are used to scale and speed up the learning process. Accordingly, each BN stratum normalizes the previous activation layer by subtracting the average batches, as well as divides it by the standard deviation.
- Dropout layerEach dropout layer is considered as a regularization technique and allows to improve over-adjustment on neural networks in which it decreases the error rate in the classification process. In the proposed model, the value of dropout is equal to 0.2. To avoid over-fitting, we have inactivated 20% of the neurons. We have used three dropout layers in our model.
- Max-Pooling1D layerThe sample-based discretization max-pooling-1D blocks is used to sub-sample each input layer by reducing its dimensionality and decreasing the number of the parameters to learn, thereby reducing calculation costs.
- Flatten layerA multidimensional data output is given in the previous step, which cannot be read directly from this neural network, and the model is therefore flattened.
- Dense layersThe dense layer has the role of describing the connectivity with the next and intermediate layers of neurons. We have used two fully connected layers in our architecture. In the first dense of our model, we used a hidden layer of 128 neurons to have better classification results. For the second dense, the value of the final neuron is equal to 1. Binary classification is applied in this work, so a single neuron is sufficient to denote class “1” or “0”.
3. Experimental Validation
A description of our dataset and experiments without and with DA were provided in the following subsections for the efficiency assessment of the proposed DD scheme. Our experiments have been performed using the power of GPU (Graphical Processing Unit) provided by the Google AI (Artificial Intelligence) platform and Colab [110].
3.1. Dataset
Our EEG signal collection contains forty-two records of six men and eight women aged between fourteen and sixty-four with normal mental health. For each person, we made three recordings lasting sixteen minutes over the day: in the morning, afternoon, and evening. For each recording, the total number of rows of data is equal to 123,648. In order to identify the state of each participant, we divided the EEG signal into windows of 3.75 s. In this sense, we split each EEG recording into 256 different sets (segments) and the length of each segment is equal to 483. Based on the proposed data annotation step in our method, a deeper analysis of the brain is the preliminary phase in the detection of each participant’s state. In this regard, we categorized the different participants according to drowsy and awake states. Table 5 presents the detailed results for each participating state.
Our data are divided into two parts, with 80% and 20%, respectively, as training for the train model and testing for the predict model. There were (20,286, 256) recordings in total in which (16,422, 256) were used for training and (3864, 256) for testing. Therefore, the training set data is divided into two parts, with 80% and 20% as training and validation. There were (16,422, 256) recording in total in which (13,137, 256) were used for training and (3285, 256) for validation.
3.2. Experimental Details
The different parameters as filters, kernel-size, padding, kernel-initializer, and activation of the four convolutional layers have the same values, respectively, 512, 32, same, normal, and relu. The parameter values of the remaining layers are detailed in Table 6.
We aim to reach the best accuracy rate by using a minimum number of electrodes that provide information about the drowsiness state. In [111,112,113], the authors discover that the pre-frontal and occipital cortex are the most important channel to better diagnose the drowsiness state. Furthermore, previous work [114] indicates that occipital, parietal, central and frontal regions are useful for drowsiness detection. According to the recent related work [115], the authors provide that the frontal, occipital and parietal are the best selected areas for DD. To select the relevant channels that enable the best accuracy in the proposed DD system, we suggest comparing the different results recorded by various numbers of electrodes. To reach the converge of our model, we used 15 epochs for all experiments. To this regard, we choose the following recorded data:
- Recording by 14 electrodes including the frontal and the anterior parietal (AF3, AF4, F3, F4, F7, F8, FC5, FC6), the temporal (T7, T8), and the occipital-parietal (O1, O2, P7, P8).
- Recording by 7 (AF3, F7, F3, T7, O2, P8, F8) electrodes from parietal, occipital, pre-frontal and temporal areas.
- Recording by 4 (T7,T8, O1 and O2) electrodes from the temporal and occipital areas.
- Recording by 2 (O1 and O2) electrodes from the occipital area.
3.2.1. Experiments without DA
Table 7 presents the reported testing and training accuracies, respectively, with two, four, seven, and fourteen electrodes. From the reported results, the different accuracy values related to the training and validation sets as well as testing sets are low. One can notice that the training accuracy is quite stable over different electrode configurations, while test accuracy presents more disparity and lower values. These high classification error rates on the testing set indicate low generalization capacity of the proposed model when used without DA.
In the next experiments, a DA step is added to the training set to improve the classification performance (accuracy) of the proposed DD system, thereafter to select the most efficient number of electrodes associated with the best results.
3.2.2. Experiments with DA
In the present work, we solve the data limitation problem by adding the DA step to increase the performance of the proposed CNN model. The DA step is only processed for the training set by using 20 duplicates. In this regard, the vector value of the training set is doubling from (13,524, 256) to (132,058, 256). The reported training, validation and testing accuracies, respectively, with two, four, seven, and fourteen electrodes are presented in Table 8. We can notice that DA allows to drastically improve the performance of the proposed model while used with seven electrodes, especially for the testing set. As regards training, the four configurations perform similarly with very good accuracies.
After evaluating our model with the use of the DA technique, we can select the best acquisition configuration, i.e., seven electrodes. To this regard, we use AF3, F7, F3 and F8 electrodes from the frontal, T7 the temporal, O2 the occipital and P8 the parietal areas. The values mentioned in Table 8 present the average accuracies of three runs for each experiment. Table 9 gives an example of the average accuracy of seven electrodes with DA.
Using the selected electrodes, Figure 6 displays the training and validation accuracy and loss. Using 15 epochs, we find that the train and validation accuracy improves, and the training and validation loss decreases. This shows that the proposed CNN-based DD system has been trained to achieve up to 98.81% highest training accuracy with 90.42% highest testing accuracy for the prediction in order to automatically classify the EEG signals in drowsy/awake states.
To further quantitatively evaluate the performance of the proposed model, True Positive (TP), True Negative (TN), False Positive (FP), and False Negative (FN) rates are used to evaluate metrics [116] such as accuracy, precision, recall, and F1 score calculated as follows:
In the experimental configuration with DA, the highest accuracy value is equal to 90.42%, the precision is equal to 86.51%, the recall value is equal to 89%, while the F1-score value is equal to 88%. This high precision rate indicates the capacity of the model to not miss drowsy alarms.
To visualize the performance of the proposed model, we used the confusion matrix that is represented in Figure 7, where 2667 presents the TP, 231 presents the FP, 139 presents the FN and 827 presents the TN.
Additionally, the cross validation method is used in order to evaluate our model with seven electrodes. Table 10 presents all the experimental results with different folds.
3.3. Comparison
In order to evaluate the effectiveness of the proposed CNN model, we compared the performance measures of our model with that of several different CNNs architectures, as mentioned in Table 11, such as Inception (Conv1d_3, Conv1d_4, Conv1d_5, Max_Pooling1d_1, Concatenate_1, Batch_Normalization, Dropout, Flatten, Dense, Batch_Normalization and Dense_), WaveNet (import WaveNet) and ResNet (Conv1d_46, Conv1d_47, Conv1d_45, Add_14, Activation_14, Batchnormalization_14, Dropout_7, Flatten_5, Dense_17, Batchnormalization_15 and Dense_18).
Additionally, we compare our work with recent DD systems in the literature. In [54], the authors propose a system based on the EEG signal processing image, which converts the EEG signal into an image-like signal 2-D function map and then transfers them to the CNN model for DD. This architecture is composed of two convolutional and pooling layers with one fully connected layer. The total accuracy in the prediction imbalanced dataset result is equal to 71.15%. In [40], the authors suggest a DD system based on a DL model. Using spectrograms from the channels of EEG signals, the proposed system is developed to the ULg Multimodality Drowsiness Database. The used ConVNets model is composed of three convolutional and max-pooling layers with one fully connected layer. An accuracy of 86% is achieved in this work. We implement these two DL architectures using our EEG data. Table 12 indicates the accuracy values of the testing set using the competing DD systems. It is noteworthy that the proposed DD system gives the best accuracy classification of drowsy/awake states.
4. Discussion
EEG data are being increasingly used to analyze drowsiness through the control of mental states, fatigue progression, and tiredness over time [117]. Interestingly, reported studies in the literature indicate a specific trend to reduce the number of used electrodes [118,119]. From a practical point of view, reducing the number of electrodes ensures better comfort for the driver. In this paper, we started by using fourteen electrodes and we reduced the number to seven, four, and two electrodes. However, brain regions, such as the parietal, frontal, and occipital lobes, tend to be more vulnerable than other areas for DD. To this regard, alpha and theta waves from the occipital and the temporal area reveal a high indicator for DD. During drowsiness, exhaustion, and insufficient attention, the alpha band demonstrates an increase in-band power, while the theta band indicates the state of deep relaxation during the first phase of slow sleep. In fact, these waves reflect the state between sleep and wholeness. Therefore, comparative behavioral testing of alpha and theta waves can be beneficial for effective DD. The proposed DD system is divided into two steps as data acquisition and model analysis. The first step contains three steps, signal collection, data annotation, and data augmentation (DA). An Emotiv EPOC headset is used for signal collection. Subsequently, we have annotated our dataset according to the amplitudes of alpha and theta waves. By incorporating the DA step to improve performance, we have done two experimental tests: with and without DA. For model analysis, we have built a CNN model in which implementation is done using the Keras framework. The average values of the accuracy, F1-score, precision, and recall showed a high classification rate using seven electrodes, in comparison to other competing methods.
5. Conclusions and Future Work
This paper proposes a new DD system based on EEG signals using a CNN architecture. An Emotiv EPOC headset is used for signal collection. Furthermore, our EEG data has been annotated to detect drowsiness based on the analysis of alpha and theta waves from the occipital and temporal area. A study has been conducted to select the most suitable number of electrodes. Obtained results are coherent with the state-of-the-art. In this context, we proposed a system for DD using only seven electrodes. The proposed system achieves an average classification accuracy of 90.14%. In future work, EEG can be considered with other physiological assessment tools, such as EOG, ECG and Near-Infrared Spectroscopy (NIRS) [120,121], which help to improve accuracy rate. We will also consider validating our system on larger datasets, especially collected under real driving conditions.
Author Contributions
Conceptualization, S.C., B.B., A.B., A.H., A.A. and L.C.; data curation, B.B.; formal analysis, B.B.; funding acquisition, A.H. and A.A.; investigation, S.C., B.B., A.B., A.A. and L.C.; methodology, S.C., B.B., A.B. and L.C.; project administration, B.B. and L.C.; software, S.C., B.B. and A.B.; supervision, B.B., A.A. and L.C.; validation, B.B. and L.C.; writing—original draft, S.C., B.B. and A.B.; writing—review and editing, A.H., A.A. and L.C. All authors have read and agreed to the published version of the manuscript.
Funding
This research received no external funding.
Institutional Review Board Statement
The study was conducted according to the guidelines of the Declaration of Helsinki, and approved by the local Institutional Review Board.
Informed Consent Statement
Informed consent was obtained from all subjects involved in the study.
Data Availability Statement
Data are available from the authors (S.C., B.B., or A.B.) upon reasonable request. Dataset: https://github.com/bassem-bouaziz/Drowsiness_Detection (accessed on 1 June 2020).
Conflicts of Interest
The authors declare no conflict of interest.
Abbreviations
The following abbreviations are used in this manuscript:
| ANNs | Artificial Neural Networks |
| AE | Auto-encoder |
| APIs | Application Programming Interfaces |
| AI | Artificial Intelligence |
| BCI | Brain Computer Interface |
| BN | BatchNormalization |
| CNN | Convolutional Neural Network |
| CNBLS | Complex Network-based Broad Learning System |
| CMS | Common Mode Sense |
| CSV | Comma Separated Values |
| CNS | Central Nervous System |
| DD | Drowsiness Detection |
| DL | Deep Learning |
| DA | Data Augmentation |
| DSNs | Deep Stacking Networks |
| DE | Differential Entropy |
| DRL | Driven Right Leg |
| EEG | Electroencephalogram |
| ECG | Electrocardiogram |
| EMG | Electromyogram |
| EOG | Electrooculogram |
| EDF | European Data Interface |
| FIR | Finite Impulse Response |
| FFT | Fast Fourier Transformation |
| FP | False Positive |
| FN | False Negative |
| GPU | Graphics Processing Unit |
| IIR | Infinite Impulse Response |
| LSTM | Long Short Term Memory |
| ML | Machine Learning |
| NIRS | Near Infrared Spectroscopy |
| PERCLOS | Percentage of eye closure |
| RNNs | Recurrent Neural Networks |
| ResNet | Residual Network |
| RMSprop | Root Mean Squence Propagation |
| ReLU | Rectified Linear Unit |
| SGD | Stochastic Gradient Descent Optimizer |
| TP | True Positive |
| TN | True Negative |
| VGGNet | Visual Geometry Group Network |
References
- Sahayadhas, A.; Sundaraj, K.; Murugappan, M.; Palaniappan, R. Physiological Signal based Detection of Driver Hypovigilance using Higher Order Spectra. Expert Syst. Appl. 2015, 42, 8669–8677. [Google Scholar] [CrossRef]
- Ghandour, A.; Hammoud, H.; Al-Hajj, S. Analyzing Factors Associated with Fatal Road Crashes: A Machine Learning Approach. Int. J. Environ. Res. Public Health 2020, 17, 4111. [Google Scholar] [CrossRef] [PubMed]
- Thomas, L.; Gast, C.; Grube, R.; Craig, K. Fatigue Detection in Commercial Flight Operations: Results Using Physiological Measures. Procedia Manuf. 2015, 3, 2357–2364. [Google Scholar] [CrossRef] [Green Version]
- Neri, D.; Shappell, S.; DeJohn, C. Simulated Sustained Flight Operations and Performance, Part 1: Effects of Fatigue. Mil. Psychol. 1992, 4, 137–155. [Google Scholar] [CrossRef]
- Hu, J.; Wang, P. Noise Robustness Analysis of Performance for EEG-Based Driver Fatigue Detection Using Different Entropy Feature Sets. Entropy 2017, 19, 385. [Google Scholar]
- Choi, Y.; Kwon, N.; Lee, S.; Shin, Y.; Ryo, C.; Park, J.; Shin, D. Hypovigilance Detection for UCAV Operators Based on a Hidden Markov Model. Comput. Math. Methods Med. 2014, 2014, 567–645. [Google Scholar] [CrossRef]
- Murugan, S.; Selvaraj, J.; Sahayadhas, A. Driver Hypovigilance Detection for Safe Driving using Infrared Camera. In Proceedings of the Fifth International Conference on Inventive Computation Technologies (ICICT), Tamilnadu, India, 26–28 February 2020; pp. 413–418. [Google Scholar]
- Chaari, L.; Golubnitschaja, O. Covid-19 pandemic by the “real-time” monitoring: The Tunisian case and lessons for global epidemics in the context of 3PM strategies. EPMA J. 2020, 11, 133–138. [Google Scholar] [CrossRef] [Green Version]
- Gwak, J.; Hirao, A.; Shino, M. An Investigation of Early Detection of Driver Drowsiness Using Ensemble Machine Learning Based on Hybrid Sensing. Appl. Sci. 2020, 10, 2890. [Google Scholar] [CrossRef]
- Houssaini, A.; Sabri, A.; Qjidaa, H.; Aarab, A. Real-Time Driver’s Hypovigilance Detection using Facial Landmarks. In Proceedings of the International Conference on Wireless Technologies, Embedded and Intelligent Systems (WITS), Fez, Morocco, 30 May 2019; pp. 1–4. [Google Scholar]
- Boudaya, A.; Bouaziz, B.; Chaabene, S.; Chaari, L.; Ammar, A.; Hökelmann, A. EEG-Based Hypo-vigilance Detection Using Convolutional Neural Network. In Proceedings of the International Conference on Smart Living and Public Health (ICOST), Hammamet, Tunisia, 24–26 June 2020; pp. 69–78. [Google Scholar]
- Murugan, S.; Selvaraj, J.; Sahayadhas, A. Detection and analysis: Driver state with electrocardiogram (ECG). Phys. Eng. Sci. Med. 2020, 43, 525–537. [Google Scholar] [CrossRef]
- Zhang, L.; Liu, F.; Tang, J. Real-Time System for Driver Fatigue Detection by RGB-D Camera. Assoc. Comput. Mach. 2015, 6. [Google Scholar] [CrossRef]
- Dinges, D. An overview of sleepiness and accidents. J. Sleep Res. 1995, 4, 4–14. [Google Scholar] [CrossRef]
- Stanley, P.; Prahash, T.; Lal, S.; Daniel, P. Embedded based drowsiness detection using EEG signals. In Proceedings of the IEEE International Conference on Power, Control, Signals and Instrumentation Engineering (ICPCSI), Chennai, India, 21–22 September 2017; pp. 2596–2600. [Google Scholar]
- Gromer, M.; Salb, D.; Walzer, T.; Madrid, N.; Seepold, R. ECG sensor for detection of driver’s drowsiness. Procedia Comput. Sci. 2019, 159, 1938–1946. [Google Scholar] [CrossRef]
- Choi, H. EMG Feature Extraction for Driver’s Drowsiness Using RF Wireless Power Transmission Method. Int. J. Eng. Adv. Technol. IJEAT 2019, 8, 494–497. [Google Scholar]
- Ahn, S.; Nguyen, T.; Jang, H.; Kim, J.; Jun, S. Exploring neuro-physiological correlates of drivers’ mental fatigue caused by sleep deprivation using simultaneous EEG, ECG, and fNIRS data. Front. Hum. Neurosci. 2016, 10, 219. [Google Scholar] [CrossRef]
- Wang, F.; Wang, H.; Fu, R. Real-Time ECG-Based Detection of Fatigue Driving Using Sample Entropy. Entropy 2018, 20, 196. [Google Scholar] [CrossRef] [PubMed] [Green Version]
- Sahayadhas, A.; Sundaraj, K.; Murugappan, M. Electromyogram signal based hypovigilance detection. Biomed. Res. 2014, 25, 281–288. [Google Scholar]
- Chen, D.; Ma, Z.; Li, B.; Yan, Z.; Li, W. Drowsiness Detection with Electrooculography Signal Using a System Dynamics Approach. J. Dyn. Syst. Meas. Control 2017, 139, 081003. [Google Scholar] [CrossRef]
- Ma, Y.; Chen, B.; Li, R.; Wang, C.; Wang, J.; She, Q.; Luo, Z.; Zhang, Y. Driving Fatigue Detection from EEG Using a Modified PCANet Method. Comput. Intell. Neurosci. 2019, 2019, 4721863. [Google Scholar] [CrossRef] [Green Version]
- Papadelis, C.; Chen, Z.; Papadeli, C.K.; Bamidis, P.; Chouvarda, I.; Bekiaris, E.; Maglaveras, N. Monitoring sleepiness with on-board electrophysiological recordings for preventing sleep-deprived traffic accidents. Clin. Neurophysiol. Off. J. Int. Fed. Clin. Neurophysiol. 2007, 118, 1906–1922. [Google Scholar] [CrossRef] [PubMed]
- LaRocco, J.; Le, M.; Paeng, D. A Systemic Review of Available Low-Cost EEG Headsets Used for Drowsiness Detection. Front. Neuroinform. 2020, 14, 42. [Google Scholar] [CrossRef] [PubMed]
- Trutschel, U.; Sirois, B.; Sommer, D.; Golz, M.; Edwards, D. PERCLOS: An Alertness Measure of the Past. In Proceedings of the 6th International Driving Symposium on Human Factors in Driver Assessment, Training, and Vehicle Design: Driving Assessment 2011, Lake Tahoe, CA, USA, 27–30 June 2011; pp. 172–179. [Google Scholar] [CrossRef]
- Duvinage, M.; Castermans, T.; Petieau, M.; Hoellinger, T.; Cheron, G.; Dutoit, T. Performance of the Emotiv Epoc headset for P300-based applications. BioMed. Eng. Online 2013, 12, 56. [Google Scholar] [CrossRef] [Green Version]
- Abichou, Y.; Chaabene, S.; Chaari, L. A sleep monitoring method with EEG signals. In Proceedings of the International Conference on Digital Health Technologies (ICDHT), Hammamet, Tunisia, 9–11 December 2019; pp. 1–8. [Google Scholar]
- Aboalayon, K.; Faezipour, M.; Almuhammadi, W.; Moslehpour, S. Sleep Stage Classification Using EEG Signal Analysis: A Comprehensive Survey and New Investigation. Entropy 2016, 18, 272. [Google Scholar] [CrossRef]
- Ngxande, M.; Tapamo, J.; Burke, M. Driver drowsiness detection using behavioral measures and machine learning techniques: A review of state-of-art techniques. In Proceedings of the Pattern Recognition Association of South Africa and Robotics and Mechatronics (PRASA-RobMech), Bloemfontein, South Africa, 30 November–1 December 2017; pp. 156–161. [Google Scholar]
- Patil, B. Experimental Study on Assessment on Impact of Biometric Parameters on Drowsiness based on Yawning & head movement using Support Vector Machine. Int. J. Comput. Sci. Manag. Res. 2013, 2. [Google Scholar] [CrossRef]
- Zorgui, S.; Chaabene, S.; Bouaziz, B.; Batatia, H.; Chaari, L. A Convolutional Neural Network for Lentigo Diagnosis. In Proceedings of the International Conference on Smart Living and Public Health (ICOST), Hammamet, Tunisia, 24–26 June 2020; pp. 89–99. [Google Scholar]
- Zhu, X.; Zheng, W.; Lu, B.; Chen, X.; Chen, S.; Wang, C. EOG-based drowsiness detection using convolutional neural networks. In Proceedings of the International Joint Conference on Neural Networks, Beijing, China, 6–11 July 2014; pp. 128–134. [Google Scholar]
- Wang, X.; Zhao, Y.; Pourpanah, F. Recent advances in deep learning. Int. J. Mach. Learn. Cybern. 2020, 11, 747–750. [Google Scholar] [CrossRef] [Green Version]
- Gragnaniello, D.; Bottino, A.; Cumani, S.; Kim, W. Special Issue on Advances in Deep Learning. Appl. Sci. 2020, 10, 3172. [Google Scholar] [CrossRef]
- Abiodun, O.I.; Jantan, A.; Omolara, A.E.; Dada, K.V.; Mohamed, N.A.; Arshad, H. State-of-the-art in artificial neural network applications: A survey. Heliyon 2018, 4, e00938. [Google Scholar] [CrossRef] [Green Version]
- Alom, M.; Taha, T.; Yakopcic, C.; Westberg, S.; Sidike, P.; Nasrin, M.; Hasan, M.; Essen, B.V.; Awwal, A.; Asari, V. A State-of-the-Art Survey on Deep Learning Theory and Architectures. Electronics 2019, 8, 292. [Google Scholar] [CrossRef] [Green Version]
- Ed-doughmi, Y.; Idrissi, N. Driver Fatigue Detection using Recurrent Neural Networks. In Proceedings of the 2nd International Conference on Networking, Information Systems & Security, Rabat, Morocco, 27–28 March 2019; 2019; pp. 1–6. [Google Scholar] [CrossRef]
- Jeong, J.; Yu, B.; Lee, D.; Lee, S. Classification of Drowsiness Levels Based on a Deep Spatio-Temporal Convolutional Bidirectional LSTM Network Using Electroencephalography Signals. Brain Sci. 2019, 9, 348. [Google Scholar] [CrossRef] [Green Version]
- Vesselenyi, T.; Moca, S.; Rus, A.; Mitran, T.; Tătaru, B. Driver drowsiness detection using ANN image processing. IOP Conf. Ser. Mater. Sci. Eng. 2017, 252, 012097. [Google Scholar] [CrossRef]
- Guarda, L.; Astorga, N.; Droguett, E.; Moura, M.; Ramos, M. Drowsiness Detection Using Electroencephalography Signals: A Deep Learning Based Model. In Proceedings of the Probabilistic Safety Assessment and Management PSAM, Los Angeles, CA, USA, 16 September 2018. [Google Scholar]
- Deng, L.; He, X.; Gao, J. Deep stacking networks for information retrieval. In Proceedings of the 2013 IEEE International Conference on Acoustics, Speech and Signal Processing, Vancouver, BC, Canada, 26–31 May 2013; pp. 3153–3157. [Google Scholar]
- Alaskar, H. Convolutional Neural Network Application in Biomedical Signals. J. Comput. Sci. Inf. Technol. 2018, 6, 45–59. [Google Scholar] [CrossRef]
- Wang, K.; Zhao, Y.; Xiong, Q.; Fan, M.; Sun, G.; Ma, L.; Liu, T. Research on Healthy Anomaly Detection Model Based on Deep Learning from Multiple Time-Series Physiological Signals. Sci. Program. 2016, 2016, 5642856. [Google Scholar] [CrossRef] [Green Version]
- Piekarski, M.; Korjakowska, J.; Wawrzyniak, A.; Gorgon, M. Convolutional neural network architecture for beam instabilities identification in Synchrotron Radiation Systems as an anomaly detection problem. Measurement 2020, 165, 108116. [Google Scholar] [CrossRef]
- Chakraborty, S.; Aich, S.; Joo, M.; Sain, M.; Kim, H. A Multichannel Convolutional Neural Network Architecture for the Detection of the State of Mind Using Physiological Signals from Wearable Devices. J. Healthc. Eng. 2019, 2019, 5397814. [Google Scholar] [CrossRef] [PubMed] [Green Version]
- Roy, Y.; Banville, H.; Albuquerque, I.; Gramfort, A.; Falk, T.; Faubert, J. Deep learning-based electroencephalography analysis: A systematic review. arXiv 2019, arXiv:1901.05498. [Google Scholar] [CrossRef]
- Salamon, J.; Bello, J. Deep Convolutional Neural Networks and Data Augmentation for Environmental Sound Classification. arXiv 2016, arXiv:1608.04363. [Google Scholar] [CrossRef]
- Dwivedi, K.; Biswaranjan, K.; Sethi, A. Drowsy driver detection using representation learning. In Proceedings of the IEEE International Advance Computing Conference (IACC), Gurgaon, India, 21–22 February 2014; pp. 995–999. [Google Scholar]
- Doughmi, Y.; Idrissi, N.; Hbali, Y. Real-Time System for Driver Fatigue Detection Based on a Recurrent Neuronal Network. J. Imaging 2020, 6, 8. [Google Scholar] [CrossRef] [Green Version]
- Yang, Y.; Gao, Z.; Li, Y.; Cai, Q.; Marwan, N.; Kurths, J. A Complex Network-Based Broad Learning System for Detecting Driver Fatigue From EEG Signals. IEEE Trans. Syst. Man Cybernet. Syst. 2019, 1–9. [Google Scholar] [CrossRef]
- Shalash, W. Driver Fatigue Detection with Single EEG Channel Using Transfer Learning. In Proceedings of the IEEE International Conference on Imaging System and Techniques, Abu Dabi, United Arab Emirates, 9–10 December 2019. [Google Scholar]
- Zeng, H.; Yang, C.; Dai, G.; Qin, F.; Zhang, J.; Kong, W. EEG classification of driver mental states by deep learning. Cogn. Neurodyn. 2018, 12, 597–606. [Google Scholar] [CrossRef]
- Ko, W.; Oh, K.; Jeon, E.; Suk, H. VIGNet: A Deep Convolutional Neural Network for EEG-based Driver Vigilance Estimation. In Proceedings of the 8th International Winter Conference on Brain-Computer Interface (BCI), Gangwon, Korea, 26–28 February 2020; pp. 1–3. [Google Scholar]
- Cheng, E.; Young, K.; Lin, C. Image-based EEG signal processing for driving fatigue prediction. In Proceedings of the 2018 International Automatic Control Conference (CACS), Taoyuan, Taiwan, 4–7 November 2018; pp. 1–5. [Google Scholar]
- Rahman, K.; Mustaffa, M.; Fuad, N.; Ahmad, M.; Ahad, R. Body Motion Control via Brain Signal Response. In Proceedings of the IEEE-EMBS Conference on Biomedical Engineering and Sciences (IECBES), Sarawak, Malaysia, 3–6 December 2018; pp. 696–700. [Google Scholar]
- Sánchez-Reolid, R.; García, A.; Vicente-Querol, M.; Fernández-Aguilar, L.; López, M.; Fernández-Caballero, A.; González, P. Artificial Neural Networks to Assess Emotional States from Brain-Computer Interface. Electronics 2018, 7, 384. [Google Scholar] [CrossRef] [Green Version]
- Pedrosa, P.; Fiedler, P.; Schinaia, L.; Vasconcelos, B.; Martins, A.; Amaral, M.; Comani, S.; Haueisen, J.; Fonseca, C. Alginate-based hydrogels as an alternative to electrolytic gels for rapid EEG monitoring and easy cleaning procedures. Sens. Actuators B Chem. 2017, 247, 231–237. [Google Scholar] [CrossRef]
- Towle, V.; Bolafios, J.; Suarez, D.; Tan, K.; Grzeszczuk, R.; Levin, D.; Cakmur, R.; Frank, S.; Spire, J. The spatial location of EEG electrodes: Locating the best-fitting sphere relative to cortical anatomy. Electroencephalogr. Clin. Neurophysiol. 1993, 86, 1–6. [Google Scholar] [CrossRef]
- Hu, S.; Zheng, G.; Peters, B. Driver fatigue detection from electroencephalogram spectrum after electrooculography artefact removal. Intell. Transp. Syst. IET 2013, 7, 105–113. [Google Scholar] [CrossRef]
- Mohammedi, M.; Omar, M.; Bouabdallah, A. Automatic removal of ocular artifacts in EEG signals for driver’s drowsiness detection: A survey. In Proceedings of the 2018 International Conference on Smart Communications in Network Technologies (SaCoNeT), El Oued, Algeria, 27–31 October 2018; pp. 188–193. [Google Scholar]
- Gebodh, N.; Esmaeilpour, Z.; Adair, D.; Chelette, K.; Dmochowski, J.; Woods, A.; Kappenman, E.; Parra, L.; Bikson, M. Inherent physiological artifacts in EEG during tDCS. Neuroimage 2018, 185, 408–424. [Google Scholar] [CrossRef]
- Laruelo, A.; Chaari, L.; Batatia, H.; Ken, S.; Rowland, B.; Tourneret, J.Y.; Laprie, A. Hybrid Sparse Regularization for Magnetic Resonance Spectroscopy. In Proceedings of the IEEE International Conference of Engineering in Medicine and Biology Society (EMBC), Osaka, Japan, 3–7 July 2013; pp. 3–7. [Google Scholar]
- Chaari, L.; Tourneret, J.Y.; Chaux, C. Sparse signal recovery using a Bernouilli generalized Gaussian prior. In Proceedings of the European Signal Processing Conference (EUSIPCO), Nice, France, 31 August–4 September 2015. [Google Scholar]
- Sevgi, L. Numerical Fourier Transforms: DFT and FFT. IEEE Antennas Propag. Mag. 2007, 49, 238–243. [Google Scholar] [CrossRef]
- Ludwig, P.; Varacallo, M. Neuroanatomy, Central Nervous System (CNS). Available online: https://www.researchgate.net/publication/329717386_Neuroanatomy_Central_Nervous_System_CNS (accessed on 15 January 2021).
- Teplan, M. Fundamental of EEG Measurement. Meas. Sci. Rev. 2002, 2, 1–11. [Google Scholar]
- Al-Kadi, M.I.; Reaz, M.B.I.; Ali, M.A. Evolution of Electroencephalogram Signal Analysis Techniques during Anesthesia. Sensors 2013, 13, 6605–6635. [Google Scholar] [CrossRef] [PubMed] [Green Version]
- Schütze, M.D.; Junghanns, K. The Difficulty of Staying Awake During Alpha/Theta Neurofeedback Training. Appl. Psychophysiol. Biofeedback 2015, 40, 85–94. [Google Scholar] [CrossRef]
- Amo, C.; de Santiago, L.; Barea, R.; López-Dorado, A.; Boquete, L. Analysis of Gamma-Band Activity from Human EEG Using Empirical Mode Decomposition. Sensors 2017, 17, 989. [Google Scholar]
- Dkhil, M.B.; Wali, A.; Alimi, A.M. Drowsy Driver Detection by EEG Analysis Using Fast Fourier Transform. arXiv 2018, arXiv:1806.07286v1. [Google Scholar]
- Ogino, M.; Mitsukura, Y. Portable Drowsiness Detection through Use of a Prefrontal Single-Channel Electroencephalogram. Sensors 2018, 18, 4477. [Google Scholar] [CrossRef] [PubMed] [Green Version]
- Lin, C.T.; Wu, R.C.; Liang, S.; Chao, W.H.; Chen, Y.J.; Jung, T.P. EEG-based drowsiness estimation for safety driving using independent component analysis. IEEE Trans. Circuits Syst. I Regul. Pap. 2005, 52, 2726–2738. [Google Scholar]
- Makeig, S.; Jung, T.; Sejnowski, T. Awareness during drowsiness: Dynamics and electrophysiological correlates. Can. J. Exp. Psychol. 2000, 54, 266–273. [Google Scholar] [CrossRef] [PubMed] [Green Version]
- Subasi, A. Automatic recognition of alertness level from EEG by using neural network and wavelet coefficients. Expert Syst. Appl. 2005, 28, 701–711. [Google Scholar] [CrossRef]
- Kar, S.; Bhagat, M.; Routray, A. EEG signal analysis for the assessment and quantification of driver’s fatigue. Transp. Res. Part F Traffic Psychol. Behav. 2010, 13, 297–306. [Google Scholar] [CrossRef]
- Bernardi, G.; Betta, M.; Ricciardi, E.; Pietrini, P.; Tononi, G.; Siclari, F. Regional Delta Waves In Human Rapid Eye Movement Sleep. J. Neurosci. 2019, 39, 2686–2697. [Google Scholar] [CrossRef] [Green Version]
- Lashgari, E.; Liang, D.; Maoz, U. Data Augmentation for Deep-Learning-Based Electroencephalography. J. Neurosci. Methods 2020, 346, 108885. [Google Scholar] [CrossRef]
- Zhang, Z.; Casals, J.; Cichocki, A. A Novel Deep Learning Approach with Data Augmentation to Classify Motor Imagery Signals. IEEE Access 2019, 7, 5945–15954. [Google Scholar] [CrossRef]
- Zhang, Y.; Yang, S.; Liu, Y.; Zhang, Y.; Han, B.; Zhou, F. Integration of 24 Feature Types to Accurately Detect and Predict Seizures Using Scalp EEG Signals. Sensors 2018, 18, 1372. [Google Scholar] [CrossRef] [Green Version]
- Chawla, N.V.; Bowyer, K.W.; Hall, L.O.; Kegelmeyer, W.P. SMOTE: Synthetic Minority Over-sampling Technique. J. Artif. Intell. Res. 2002, 16, 321–357. [Google Scholar] [CrossRef]
- Garcia, A.; Peter, K. Further advantages of data augmentation on convolutional neural networks. In Proceedings of the 27th International Conference on Artificial Neural Networks, Rhodes, Greece, 27 September 2018; pp. 95–103. [Google Scholar]
- Srivastava, N.; Hinton, G.; Krizhevsky, A.; Sutskever, I.; Salakhutdinov, R. Dropout: A Simple Way to Prevent Neural Networks from Overfitting. J. Mach. Learn. Res. 2014, 15, 1929–1958. [Google Scholar]
- Hammad, M.; Pławiak, P.; Wang, K.; Acharya, U.R. ResNet-Attention model for human authentication using ECG signals. Expert Syst. 2020, 1, e12547. [Google Scholar] [CrossRef]
- Oh, S.; Jahmunah, V.; Ooi, C.; Tan, R.; Ciaccio, E.; Yamakawa, T.; Tanabe, M.; Kobayashi, M.; Acharya, U. Classification of heart sound signals using a novel deep WaveNet model. Comput. Methods Programs Biomed. 2020, 196, 105604. [Google Scholar] [CrossRef]
- Kim, J.; Seo, S.; Song, C.; Kim, K. Assessment of Electrocardiogram Rhythms by GoogLeNet Deep Neural Network Architecture. J. Healthc. Eng. 2019, 2019, 2826901. [Google Scholar] [CrossRef] [Green Version]
- Park, J.; Kim, J.; Jung, S.; Gil, Y.; Choi, J.; Son, H. ECG-Signal Multi-Classification Model Based on Squeeze-and-Excitation Residual Neural Networks. Appl. Sci. 2020, 10, 6495. [Google Scholar] [CrossRef]
- Wang, S.; Wang, S.; Wang, Y.; Wang, S. Time-ResNeXt for epilepsy recognition based on EEG signals in wireless networks. EURASIP J. Wireless Commun. Netw. 2020, 2020, 195. [Google Scholar] [CrossRef]
- Uyulan, C.; Ergüzel, T.; Unubol, H.; Cebi, M.; Sayar, G.; Asad, M.; Tarhan, N. Major Depressive Disorder Classification Based on Different Convolutional Neural Network Models: Deep Learning Approach. Clin. EEG Neurosci. 2020. [Google Scholar] [CrossRef] [PubMed]
- Hasan, M.; Shon, D.; Im, K.; Choi, H.; Yoo, D.; Kim, J. Sleep State Classification Using Power Spectral Density and Residual Neural Network with Multichannel EEG Signals. Appl. Sci. 2020, 10, 7639. [Google Scholar] [CrossRef]
- Nahid, N.; Rahman, A.; Ahad, M.A.R. Deep Learning Based Surface EMG Hand Gesture Classification for Low-Cost Myoelectric Prosthetic Hand. In Proceedings of the 9th International Conference on Informatics, Electronics & Vision (ICIEV) and 2020 4th International Conference on Imaging, Vision & Pattern Recognition (icIVPR), Kitakyushu, Japan, 26–29 August 2020. [Google Scholar]
- Wulan, N.; Wang, W.; Sun, P.; Wang, K.; Xia, Y.; Zhang, H. Generating electrocardiogram signals by deep learning. Neurocomputing 2020, 404, 122–136. [Google Scholar] [CrossRef]
- Zhu, T.; Luo, W.; Yu, F. Convolution- and Attention-Based Neural Network for Automated Sleep Stage Classification. Int. J. Environ. Res. Public Health 2020, 17, 4152. [Google Scholar] [CrossRef] [PubMed]
- Cao, C.; Liu, F.; Tan, H.; Song, D.; Shu, W.; Li, W.; Zhou, Y.; Bo, X.; Xie, Z. Deep Learning and Its Applications in Biomedicine. Genom. Proteom. Bioinform. 2018, 16, 17–32. [Google Scholar] [CrossRef] [PubMed]
- Rehman, M.; Waris, A.; Gilani, S.; Jochumsen, M.; Niazi, I.K.; Jamil, M.; Farina, D.; Kamavuako, E. Multiday EMG-Based Classification of Hand Motions with Deep Learning Techniques. Sensors 2018, 18, 2497. [Google Scholar] [CrossRef] [PubMed] [Green Version]
- Hu, J. Comparison of Different Features and Classifiers for Driver Fatigue Detection Based on a Single EEG Channel. Comput. Math. Methods Med. 2017, 2017, 5109530. [Google Scholar] [CrossRef]
- Morales, J.; Saldaña, R.; Castolo, M.; Borrayo, C.C.E.; Ruiz, A.; Perez, H.; Ruiz, G. Deep Learning for the Classification of Genomic Signals. Comput. Intell. Image Process. 2020, 2020, 7698590. [Google Scholar]
- Srinivasan, V.; Islam, M.; Zhang, W.; Ren, H. Finger Movement Classification from Myoelectric Signals Using Convolutional Neural Networks. In Proceedings of the IEEE International Conference on Robotics and Biomimetics (ROBIO), Kuala Lumpur, Malaysia, 12–15 December 2018; pp. 1070–1075. [Google Scholar]
- Choi, I.; Kim, H. An On-Device Deep Learning Approach to Battery Saving on Industrial Mobile Terminals. Sensors 2020, 20, 4044. [Google Scholar] [CrossRef]
- Buslaev, A.; Iglovikov, V.; Khvedchenya, E.; Parinov, A.; Druzhinin, M.; Kalinin, A. Albumentations: Fast and flexible image augmentations. Information 2020, 11, 125. [Google Scholar] [CrossRef] [Green Version]
- Somrak, M.; Džeroski, S.; Kokalj, T. Learning to Classify Structures in ALS-Derived Visualizations of Ancient Maya Settlements with CNN. Remote Sens. 2020, 12, 2215. [Google Scholar] [CrossRef]
- Abadi, M.; Barham, P.; Chen, J.; Chen, Z.; Davis, A.; Dean, J.; Devin, M.; Ghemawat, S.; Irving, G.; Isard, M.; et al. TensorFlow: A System for Large-Scale Machine Learning. In Proceedings of the 12th USENIX Conference on Operating Systems Design and Implementation, Savannah, GA, USA, 2–4 November 2016; pp. 265–283. [Google Scholar]
- Paszke, A.; Gross, S.; Massa, F.; Lerer, A.; Bradbury, J.; Chanan, G.; Killeen, T.; Lin, Z.; Gimelshein, N.; Antiga, L.; et al. PyTorch: An Imperative Style, High-Performance Deep Learning Library. Adv. Neural Inf. Process. Syst. 2019, 32, 8026–8037. [Google Scholar]
- Predescu, A.; Truica, C.; Apostol, E.; Mocanu, M.; Lupu, C. An Advanced Learning-Based Multiple Model Control Supervisor for Pumping Stations in a Smart Water Distribution System. Mathematics 2020, 8, 887. [Google Scholar] [CrossRef]
- Saleem, M.H.; Potgieter, J.; Arif, K. Plant Disease Classification: A Comparative Evaluation of Convolutional Neural Networks and Deep Learning Optimizers. Plants 2020, 9, 1319. [Google Scholar] [CrossRef]
- Li, G.; Lee, C.; Jung, J.; Youn, Y.; Camacho, D. Deep learning for EEG data analytics: A survey. Concurr. Comput. Pract. Exp. 2019, 32, e5199. [Google Scholar] [CrossRef]
- Shaf, A.; Ali, T.; Farooq, W.; Javaid, S.; Draz, U.; Yasin, S. Two Classes Classification Using Different Optimizers in Convolutional Neural Network. In Proceedings of the 2018 IEEE 21st International Multi-Topic Conference (INMIC), Karachi, Pakistan, 1–2 November 2018; pp. 1–6. [Google Scholar]
- Tafsast, A.; Ferroudji, K.; Hadjili, M.; Bouakaz, A.; Benoudjit, N. Automatic Microemboli Characterization Using Convolutional Neural Networks and Radio Frequency Signals. In Proceedings of the International Conference on Communications and Electrical Engineering (ICCEE), El Oued, Algeria, 17–18 December 2018; pp. 1–4. [Google Scholar]
- Jogin, M.; Madhulika, M.S.; Divya, G.D.; Meghana, R.K.; Apoorva, S. Feature Extraction using Convolution Neural Networks (CNN) and Deep Learning. In Proceedings of the 2018 3rd IEEE International Conference on Recent Trends in Electronics, Information Communication Technology (RTEICT), Bangalore, India, 18–19 May 2018; pp. 2319–2323. [Google Scholar]
- Garbin, C.; Zhu, X.; Marques, O. Dropout vs. batch normalization: An empirical study of their impact to deep learning. Multimed. Tools Appl. 2020, 79, 1–39. [Google Scholar] [CrossRef]
- Bisong, E. Building Machine Learning and Deep Learning Models on Google Cloud Platform; Springer: Berlin/Heidelberg, Germany, 2019; pp. 59–64. [Google Scholar]
- Sarno, R.; Nugraha, B.; Munawar, M. Real Time Fatigue-Driver Detection from Electroencephalography Using Emotiv EPOC+. Int. Rev. Comput. Softw. IRECOS 2016, 11, 214. [Google Scholar] [CrossRef]
- Blaiech, H.; Neji, M.; Wali, A.; Alimi, A. Emotion recognition by analysis of EEG signals. In Proceedings of the 13th International Conference on Hybrid Intelligent Systems, Arlington, VA, USA, 6–10 November 2013; pp. 312–318. [Google Scholar]
- Nugraha, B.; Sarno, R.; Asfani, D.; Igasaki, T.; Munawar, M. Classification of driver fatigue state based on EEG using Emotiv EPOC+. J. Theor. Appl. Inf. Technol. 2016, 86, 347–359. [Google Scholar]
- Huang, R.S.; Jung, T.P.; Makeig, S. Tonic Changes in EEG Power Spectra during Simulated Driving. In International Conference on Foundations of Augmented Cognition; Springer: Berlin, Germany, 2009; pp. 394–403. [Google Scholar]
- Majumder, S.; Guragain, B.; Wang, C.; Wilson, N. On-board Drowsiness Detection using EEG: Current Status and Future Prospects. In Proceedings of the IEEE International Conference on Electro Information Technology (EIT), Brookings, SD, USA, 20–22 May 2019; pp. 483–490. [Google Scholar]
- Zhang, H.; Silva, F.; Ohata, E.; Medeiros, A.; Filho, P. Bi-Dimensional Approach Based on Transfer Learning for Alcoholism Pre-disposition Classification via EEG Signals. Front. Hum. Neurosci. 2020, 14, 365. [Google Scholar] [CrossRef]
- Trejo, L.; Kubitz, K.; Rosipal, R.; Kochavi, R.; Montgomery, L. EEG-Based Estimation and Classification of Mental Fatigue. Psychology 2015, 6, 572–589. [Google Scholar] [CrossRef] [Green Version]
- Wang, R.; Wang, Y.; Luo, C. EEG-Based Real-Time Drowsiness Detection Using Hilbert-Huang Transform. In Proceedings of the 7th International Conference on Intelligent Human-Machine Systems and Cybernetics, Hangzhou, China, 26–27 August 2015; pp. 195–198. [Google Scholar]
- Awais, M.; Badruddin, N.; Drieberg, M. A Hybrid Approach to Detect Driver Drowsiness Utilizing Physiological Signals to Improve System Performance and Wearability. Sensors 2017, 17, 1991. [Google Scholar] [CrossRef] [Green Version]
- Nguyen, T.; Ahn, S.; Jang, H.; Jun, S.C.; Kim, J.G. Utilization of a combined EEG/NIRS system to predict driver drowsiness. Sci. Rep. 2017, 7, 43933. [Google Scholar]
- Noori, S.; Mikaeili, M. Driving Drowsiness Detection Using Fusion of Electroencephalography, Electrooculography, and Driving Quality Signals. J. Med. Signal. Sens. 2016, 6, 39–46. [Google Scholar]
Figure 1.
Pipeline of the proposed drowsiness detection (DD) system.

Figure 2.
The different components of the Emotiv EPOC headset: (a) helmet, (b) fourteen-sensors box, (c) saline solution and (d) USB Key with cable.
Figure 2.
The different components of the Emotiv EPOC headset: (a) helmet, (b) fourteen-sensors box, (c) saline solution and (d) USB Key with cable.

Figure 3.
Location of the Emotiv EPOC helmet of the International System (10–20) [58].
Figure 3.
Location of the Emotiv EPOC helmet of the International System (10–20) [58].

Figure 4.
Example annotation of drowsy (a) and awake (b) of our electroencephalogram (EEG) signal collection.
Figure 4.
Example annotation of drowsy (a) and awake (b) of our electroencephalogram (EEG) signal collection.

Figure 5.
Diagram of the proposed convolutional neural network (CNN) model.

Figure 6.
(a) Accuracy graph, (b) loss graph.

Figure 7.
The highest results of the confusion matrix of 7 electrodes with DA.


Table 1.
The characteristics of the Emotiv EPOC helmet.
| Characteristics | EEG Headset |
|---|---|
| Number of channels | 14 (plus 2 references CMS and DRL) |
| Channel names | AF3, F7, F3, FC5, T7, P7, O1, O2, P8, T8, FC6, F4, F8, AF4 |
| Sampling rate | 128 SPS (2048 Hz internal) |
| Sampling method | Sequential sampling |
| Bandwidth | 0.2–45 Hz, Digital notch filters at 50 Hz and 60 Hz |
| Resolution | 14 bits |
| Filtration | Sinc filter |
| Dynamic range | 8400 µV (microvolts) |
Table 2.
Characteristics of brain waves.
| Brainwaves | Description | Frequency Interval | Location |
|---|---|---|---|
| Gamma | Refers to hyper-vigilance state | >30 Hz | — |
| Beta | Refers to alert state | 13 to 30 Hz | Frontal and Central |
| Alpha | Refers to waking state | 8 to 13 Hz | Frontal and Occipital |
| Theta | Refers to the half-sleep | 4 to 7 Hz | Temporal and Median |
| Alpha-Theta | Refers to waking and relaxation states | 5 to 9 Hz | Temporal and Occipital |
| Delta | Refers to consciousness and sleep states | 0.5 to 4 Hz | Frontal lobe |
Table 3.
The architectures scores with 2, 3, and 4 states.
| CNNs Architectures | ResNet | Inception | WaveNet | Simple CNN | ||||||||
|---|---|---|---|---|---|---|---|---|---|---|---|---|
| References | [86,87,88,89,90] | [96,97] | [84,91] | [42,92,93,94,95] | ||||||||
| States number | 2 | 3 | 4 | 2 | 3 | 4 | 2 | 3 | 4 | 2 | 3 | 4 |
| Complexity | 0 | 0 | 0.33 | 0 | 0 | 0.33 | 0 | 0 | 0.33 | 1 | 1 | 1 |
| Performance | 1 | 1 | 0.66 | 0 | 0.33 | 0.5 | 1 | 0.5 | 0.66 | 1 | 1 | 1 |
| Time-consumption | 0 | 0.5 | 0.66 | 0 | 0.5 | 0.66 | 1 | 0.5 | 0.66 | 1 | 0.5 | 0.66 |
| 1D-dimension | 1 | 1 | 0.66 | 0 | 0.5 | 0.66 | 1 | 1 | 1 | 1 | 1 | 1 |
| Total | 2 | 2.5 | 2.31 | 0 | 1.33 | 2.15 | 3 | 2 | 2.65 | 4 | 3.5 | 3.66 |
Table 4.
Convolutional layers parameters.
| Parameters | Role |
|---|---|
| Filters | Feature extraction |
| Kernel size | Convolutional window specification |
| Kernel initializer | Initialization of all values |
| Activation | Applied after performing the convolution |
Table 5.
Detailed table of each participant’s status.
| Participants | Morning | Afternoon | Evening |
|---|---|---|---|
| P1 (26 years) | Drowsy | Drowsy | Drowsy |
| P2 (46 years) | Awake | Drowsy | Awake |
| P3 (37 years) | Drowsy | Drowsy | Drowsy |
| P4 (35 years) | Drowsy | Drowsy | Drowsy |
| P5 (64 years) | Drowsy | Drowsy | Awake |
| P6 (62 years) | Awake | Drowsy | Drowsy |
| P7 (53 years) | Drowsy | Drowsy | Drowsy |
| P8 (63 years) | Awake | Awake | Awake |
| P9 (59 years) | Drowsy | Awake | Awake |
| P10 (24 years) | Drowsy | Drowsy | Awake |
| P11 (17 years) | Drowsy | Awake | Drowsy |
| P12 (22 years) | Drowsy | Drowsy | Drowsy |
| P13 (14 years) | Drowsy | Drowsy | Drowsy |
| P14 (43 years) | Awake | Awake | Drowsy |
Table 6.
Summary of our model.
| Participants | Morning | Afternoon | Evening |
|---|---|---|---|
| Layer Num | Type | Output Shape | Parameters |
| Layer 1 | Batch Normalization | (None, 256, 2) | 1024 |
| Layer 2 | Conv 1D | (None, 256, 512) | 33,280 |
| Layer 3 | Conv 1D | (None, 256, 512) | 8,389,120 |
| Layer 4 | Batch Normalization | (None, 256, 512) | 2048 |
| Layer 5 | Dropout | (None, 256, 512) | 0 |
| Layer 6 | Conv 1DN | (None, 256, 256) | 4,194,560 |
| Layer 7 | Batch Normalization | (None, 256, 256) | 1024 |
| Layer 8 | Dropout | (None, 256, 256) | 0 |
| Layer 9 | Batch Normalization | (None, 256, 256) | 1024 |
| Layer 10 | Conv 1D | (None, 256, 256) | 2,097,408 |
| Layer 11 | Batch Normalization | (None, 256, 256) | 1024 |
| Layer 12 | Maxpool 1D | (None, 2, 256) | 0 |
| Layer 13 | Dropout | (None, 2, 256) | 0 |
| Layer 14 | Flatten | (None, 512) | 0 |
| Layer 15 | Dense | (None, 128) | 65,664 |
| Layer 16 | Batch Normalization | (None,128) | 512 |
| Layer 17 | Dropout | (None, 128) | 0 |
| Layer 18 | Batch Normalization | (None, 128) | 512 |
| Layer 19 | Dense | (None, 1) | 129 |
Table 7.
Training, validation and testing accuracy of the various numbers of electrodes without data augmentation (DA).
Table 7.
Training, validation and testing accuracy of the various numbers of electrodes without data augmentation (DA).
| Number of Electrods | 2 | 4 | 7 | 14 |
|---|---|---|---|---|
| Accuracy train | 78.20% | 85.82% | 88.22% | 90.46% |
| Accuracy Validation | 74.33% | 80.09% | 86.30% | 87.95% |
| Accuracy test | 68.79% | 54.14% | 72.41% | 79.43% |
Table 8.
Training, validation and testing accuracy of the various numbers of electrodes with DA.
| Number of Electrods | 2 | 4 | 7 | 14 |
|---|---|---|---|---|
| Accuracy train | 94.30% | 97.25% | 98.88% | 93.69% |
| Accuracy Validation | 78.14% | 86.06% | 93.27% | 89.22% |
| Accuracy test | 77.41% | 78.49% | 90.14% | 82.07% |
Table 9.
Average accuracies of training, validation and testing of 7 electrodes with DA.
| Run | 1 | 2 | 3 | Average Accuracy |
|---|---|---|---|---|
| Accuracy train | 98.94% | 98.90% | 98.81 % | 98.88% |
| Accuracy Validation | 92.15% | 93.88% | 93.79% | 93.27% |
| Accuracy test | 90.01% | 90% | 90.42% | 90.14% |
Table 10.
The experimental results of cross-validation for 7 electrodes with DA.
| Train and Validation Sets | 80%, 20% | 60%, 40% | 40%, 60% | 20%, 80% |
|---|---|---|---|---|
| Accuracy train | 98.94% | 98.81 % | 98.66% | 98.83% |
| Accuracy Validation | 92.15% | 89.82% | 88.32% | 89.48% |
| Accuracy test | 90.01% | 88.20% | 84.94% | 84.96% |
Table 11.
Accuracy comparison of the proposed CNN model with ResNet, Inception and WaveNet models.
| Models | Proposed CNN | Inception | Resnet | Wavenet |
|---|---|---|---|---|
| Accuracy train | 98.88% | 88.91% | 79.03% | 71.54% |
| Accuracy Validation | 93.27% | 67.70% | 69.86% | 67.40% |
| Accuracy test | 90.14% | 74.87% | 72.80% | 75% |
Publisher’s Note: MDPI stays neutral with regard to jurisdictional claims in published maps and institutional affiliations. |
© 2021 by the authors. Licensee MDPI, Basel, Switzerland. This article is an open access article distributed under the terms and conditions of the Creative Commons Attribution (CC BY) license (http://creativecommons.org/licenses/by/4.0/).
Share and Cite
MDPI and ACS Style
Chaabene, S.; Bouaziz, B.; Boudaya, A.; Hökelmann, A.; Ammar, A.; Chaari, L. Convolutional Neural Network for Drowsiness Detection Using EEG Signals. Sensors 2021, 21, 1734. https://doi.org/10.3390/s21051734
AMA Style
Chaabene S, Bouaziz B, Boudaya A, Hökelmann A, Ammar A, Chaari L. Convolutional Neural Network for Drowsiness Detection Using EEG Signals. Sensors. 2021; 21(5):1734. https://doi.org/10.3390/s21051734
Chicago/Turabian StyleChaabene, Siwar, Bassem Bouaziz, Amal Boudaya, Anita Hökelmann, Achraf Ammar, and Lotfi Chaari. 2021. "Convolutional Neural Network for Drowsiness Detection Using EEG Signals" Sensors 21, no. 5: 1734. https://doi.org/10.3390/s21051734
Note that from the first issue of 2016, this journal uses article numbers instead of page numbers. See further details here.