Figure 1.
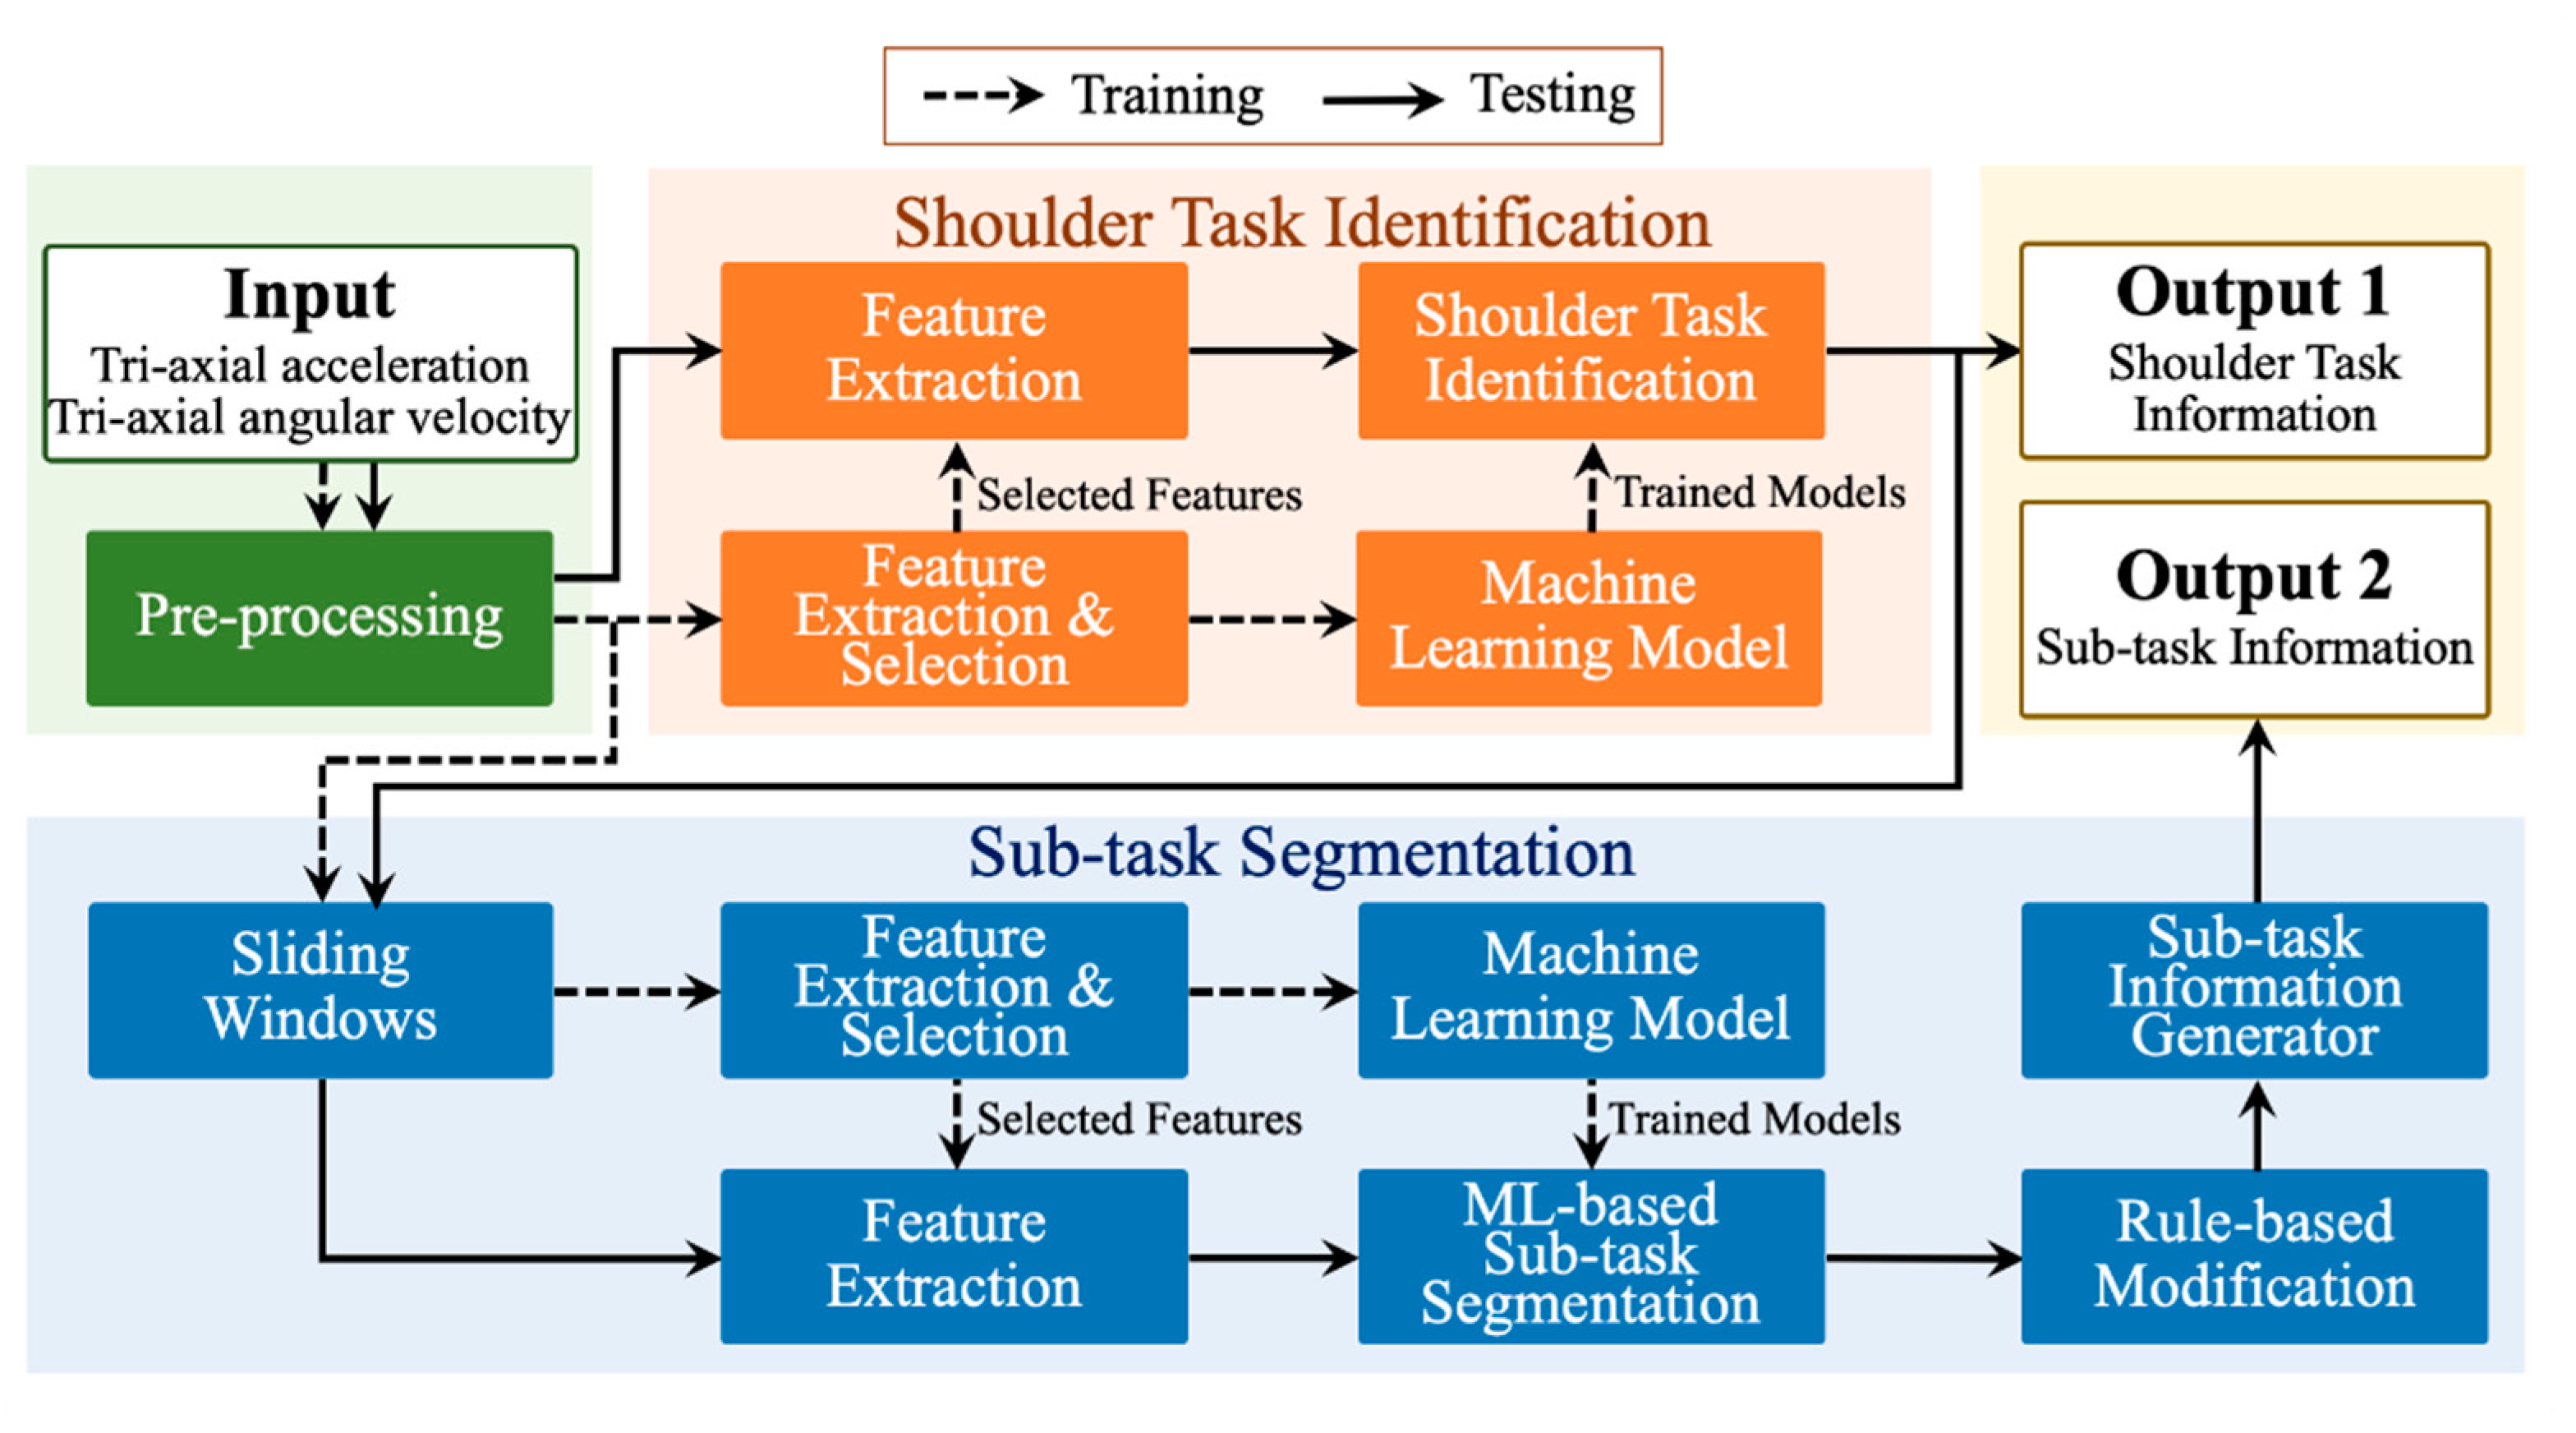
The framework of the automatic shoulder task identification and sub-task segmentation.
Figure 1.
The framework of the automatic shoulder task identification and sub-task segmentation.
Figure 2.
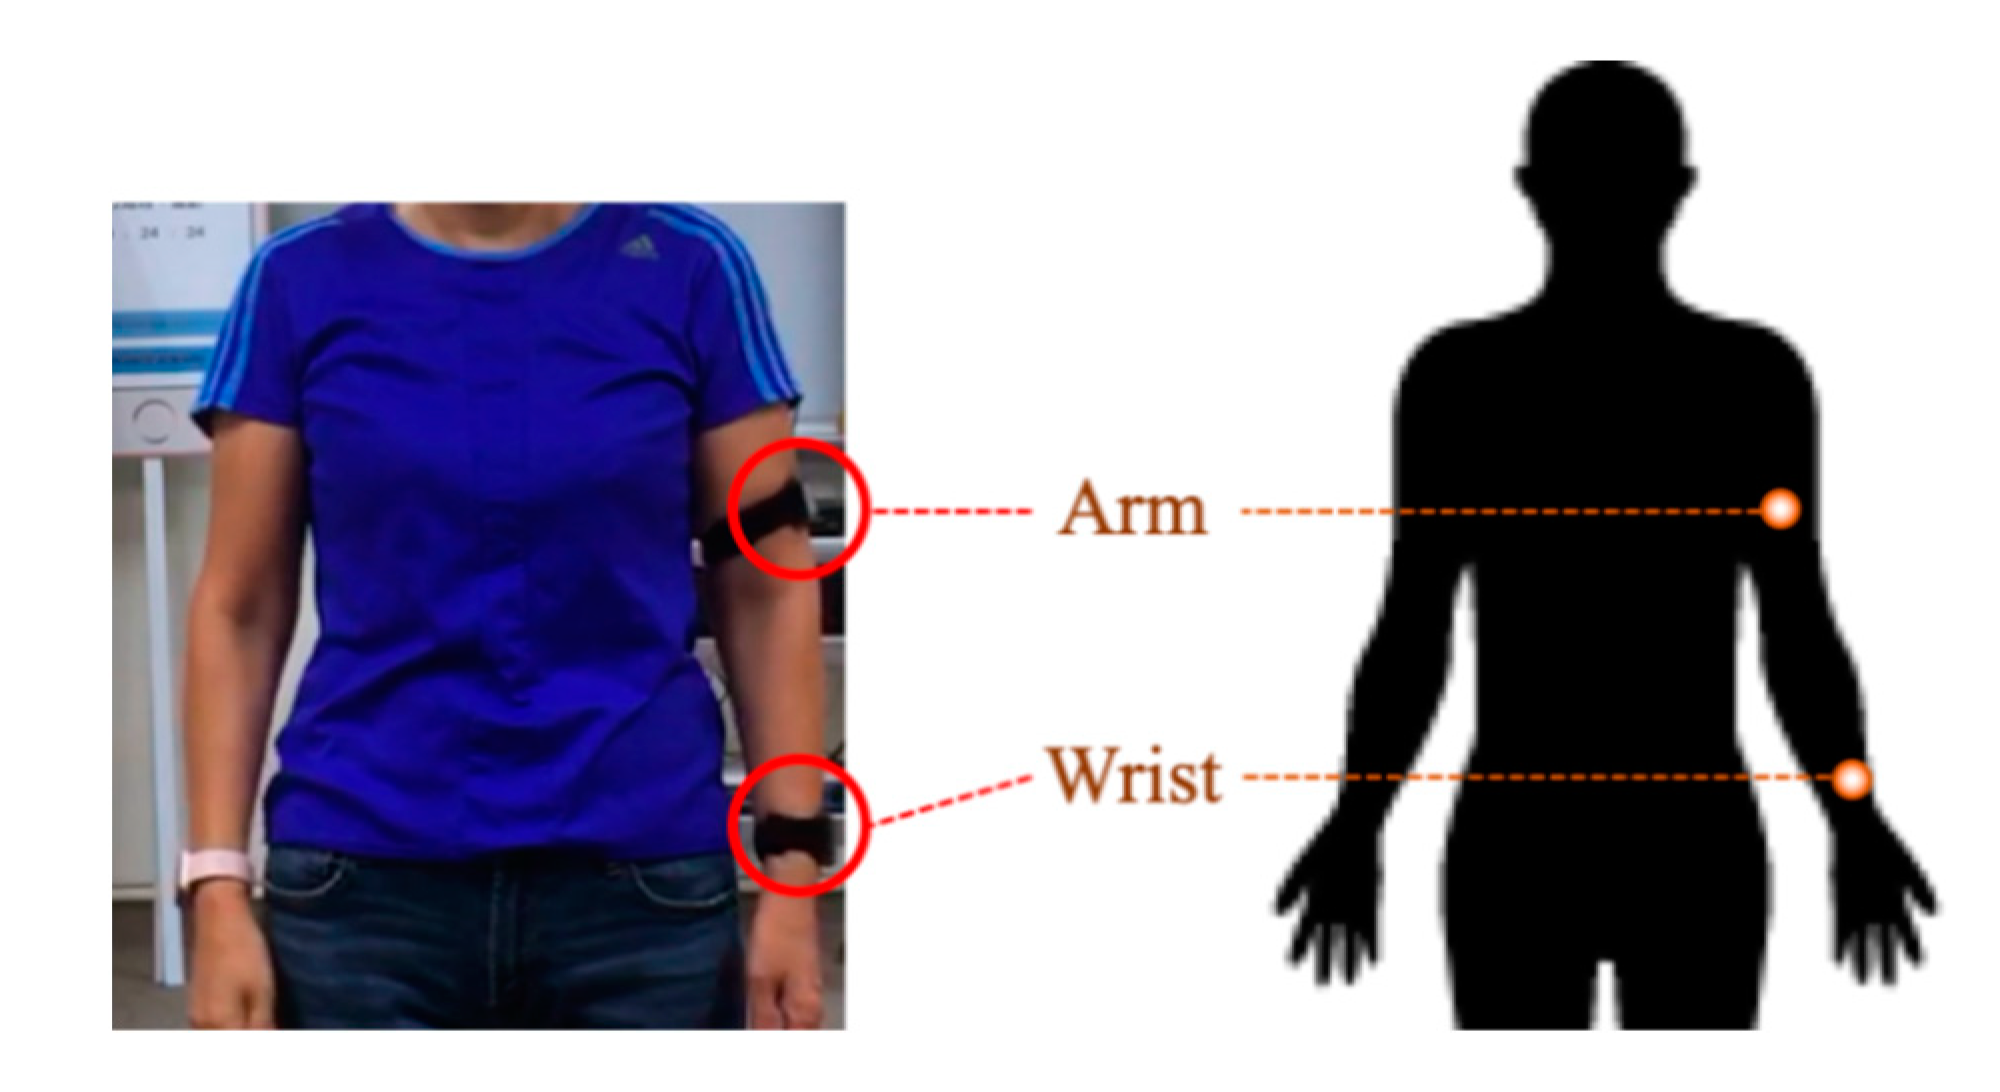
An illustration of the sensor placements.
Figure 2.
An illustration of the sensor placements.
Figure 3.
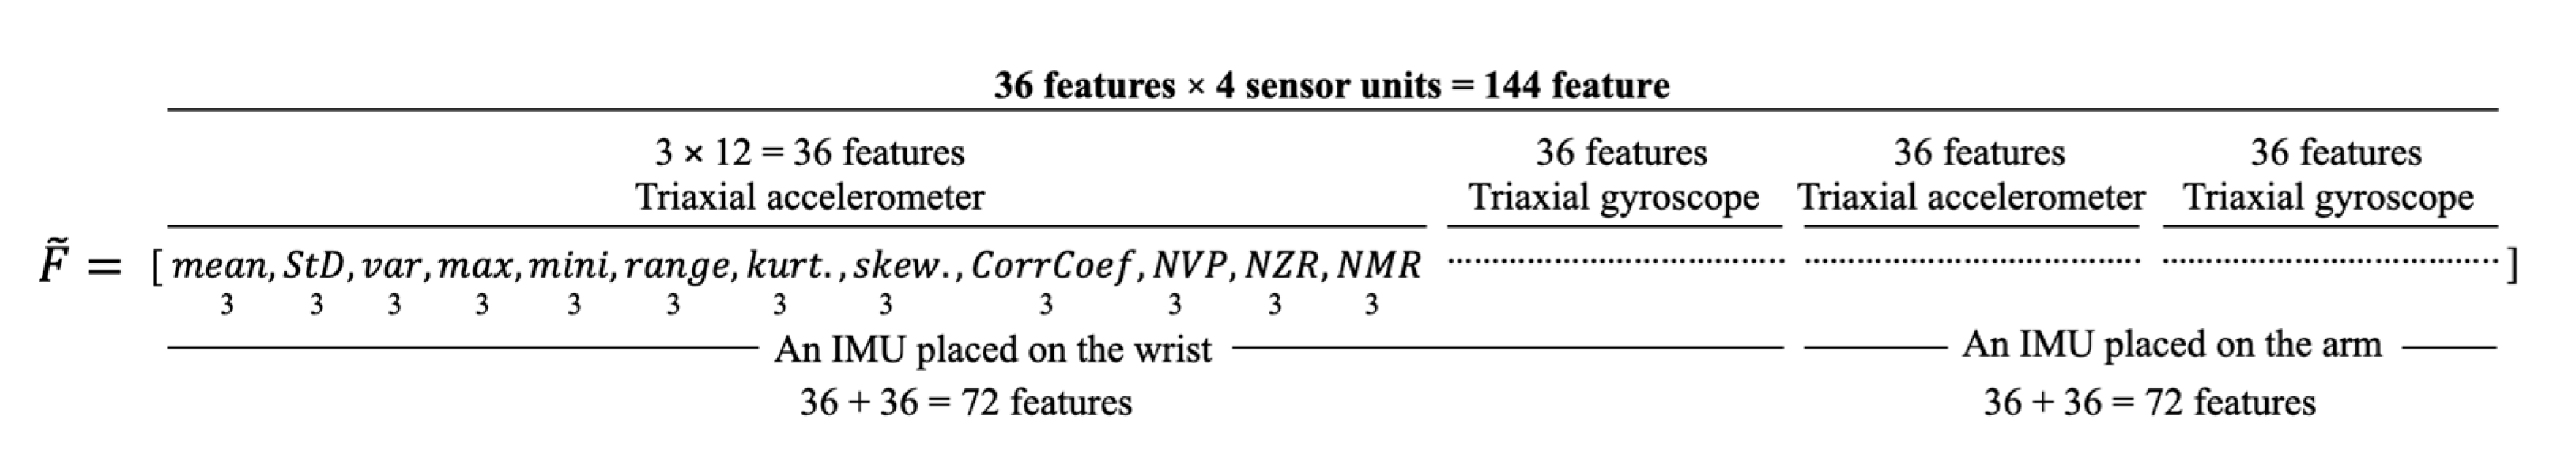
A formation of the extracted features from the IMUs.
Figure 3.
A formation of the extracted features from the IMUs.
Figure 4.
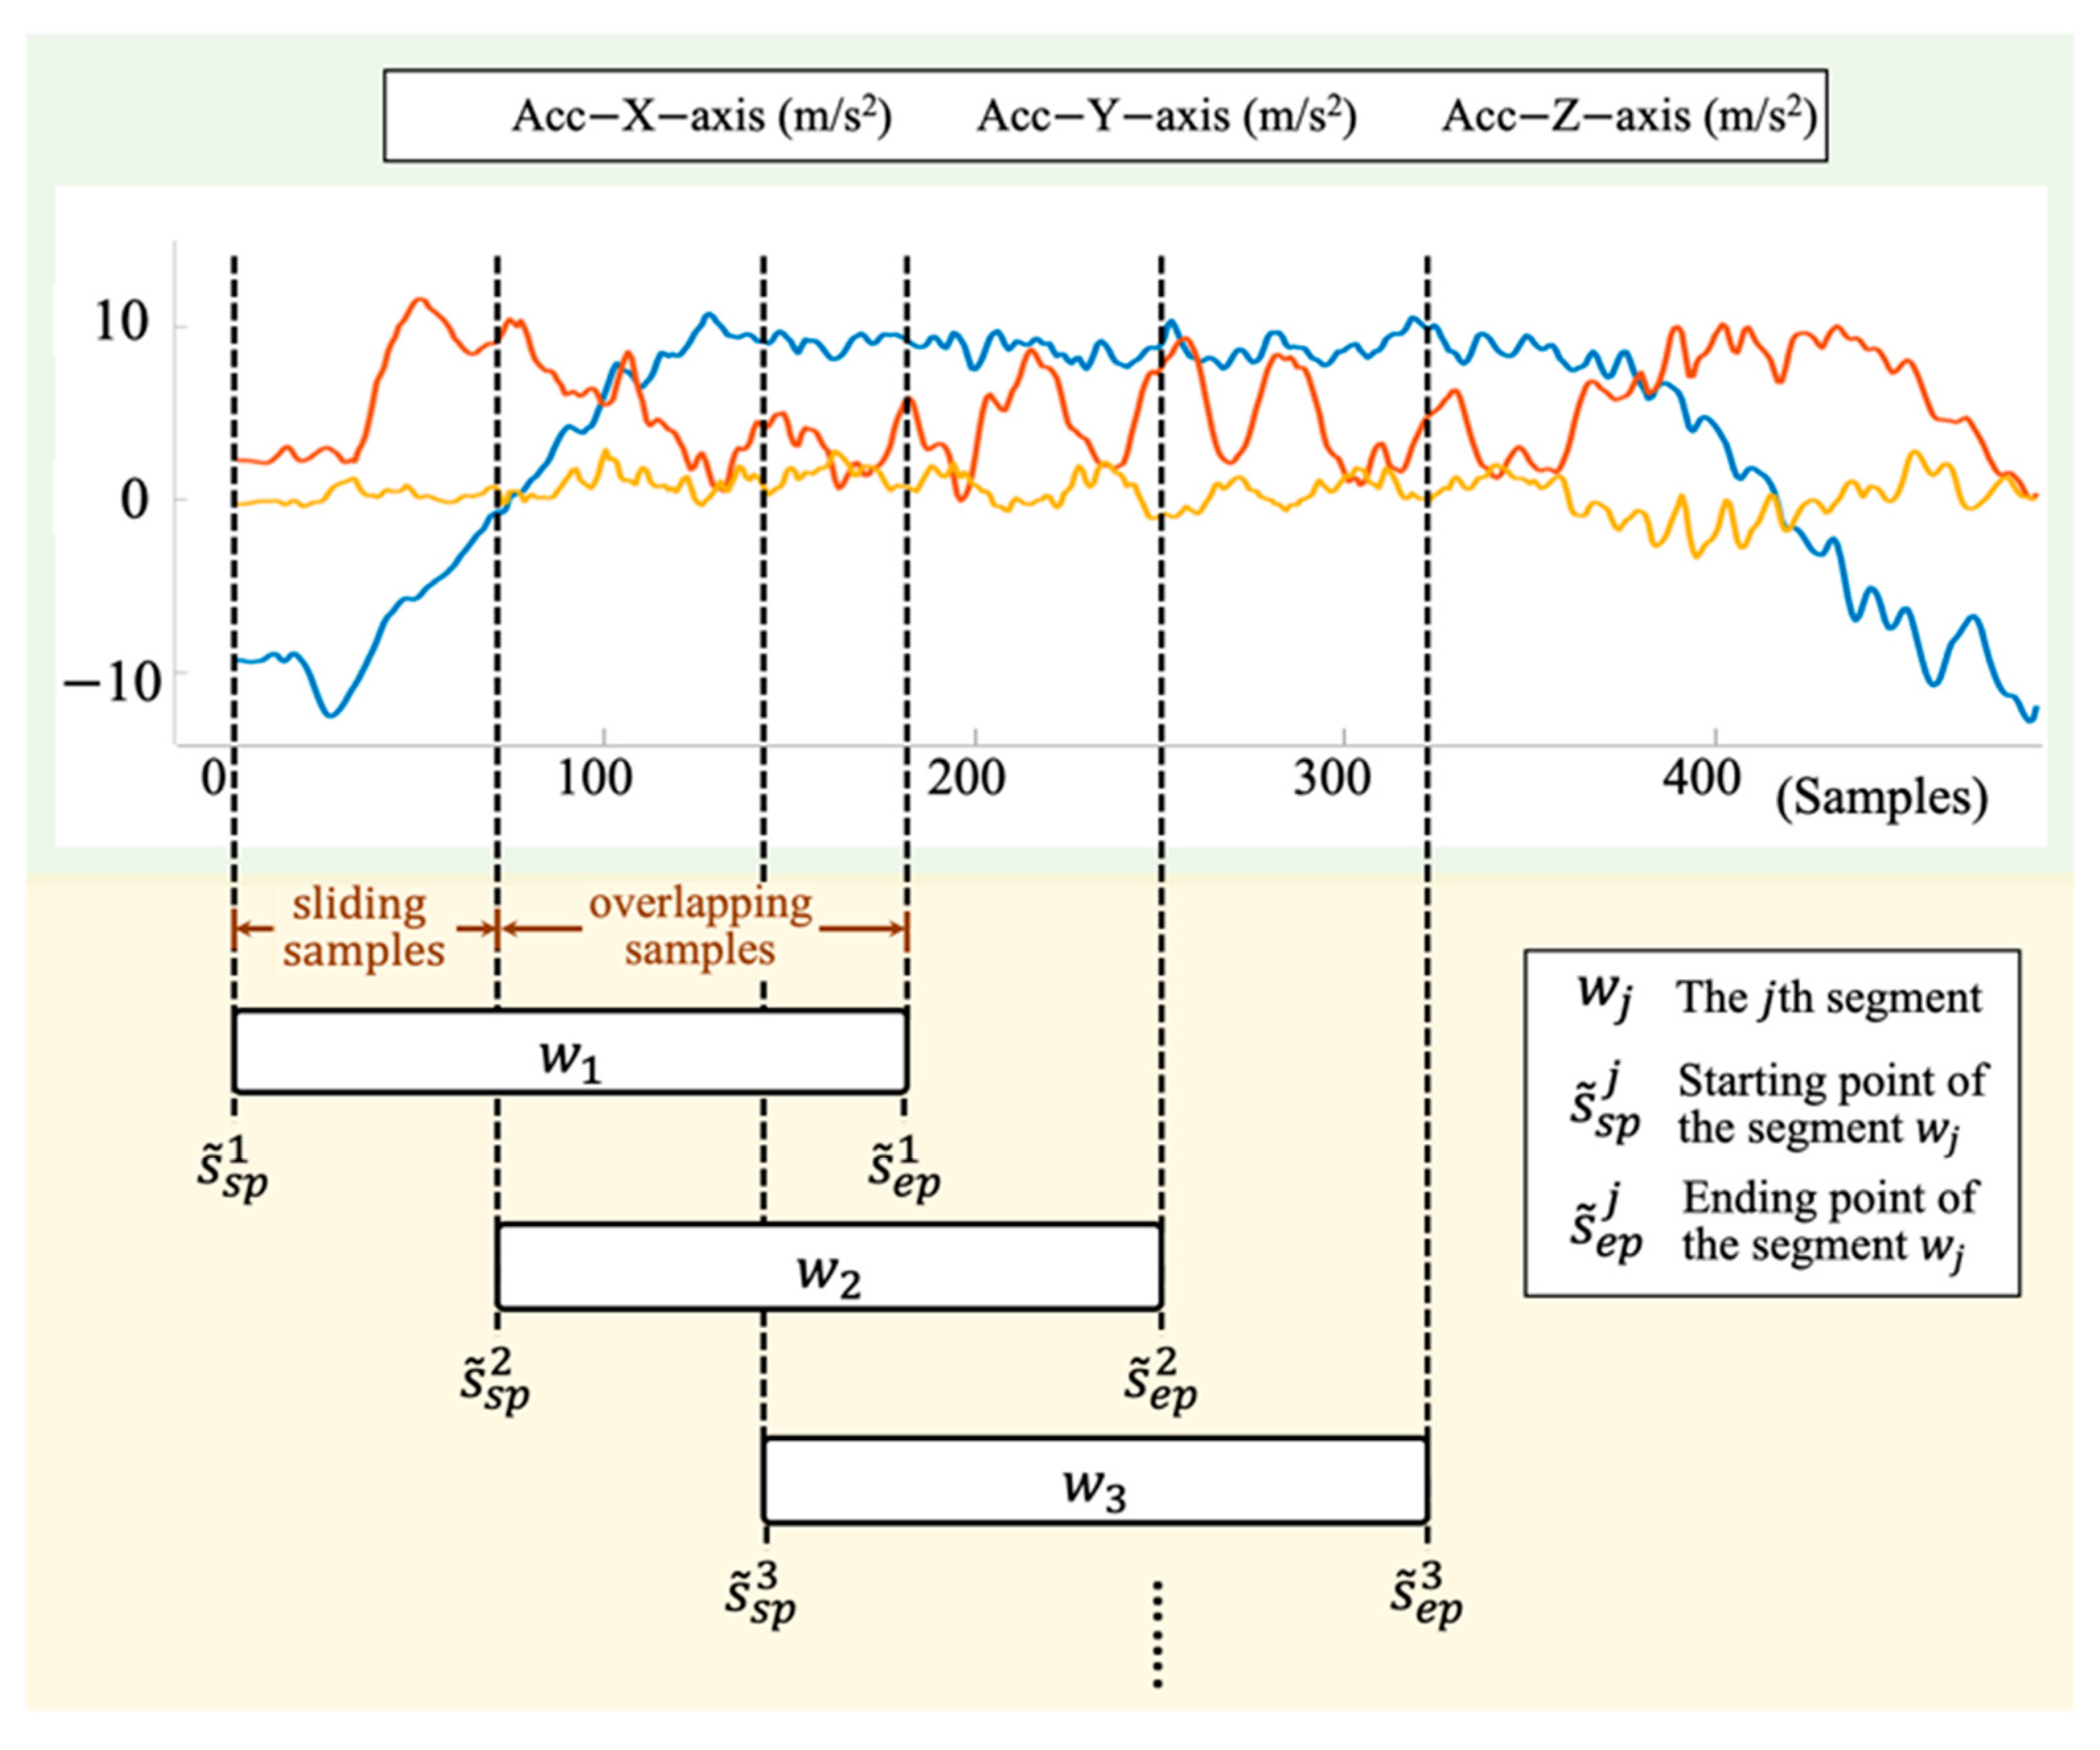
An illustration of the sliding window on the sensing signals. and are the starting and ending points of the segment , where The sliding samples is the distances from to . The overlapping samples is the number of the overlapping data samples between segments and .
Figure 4.
An illustration of the sliding window on the sensing signals. and are the starting and ending points of the segment , where The sliding samples is the distances from to . The overlapping samples is the number of the overlapping data samples between segments and .
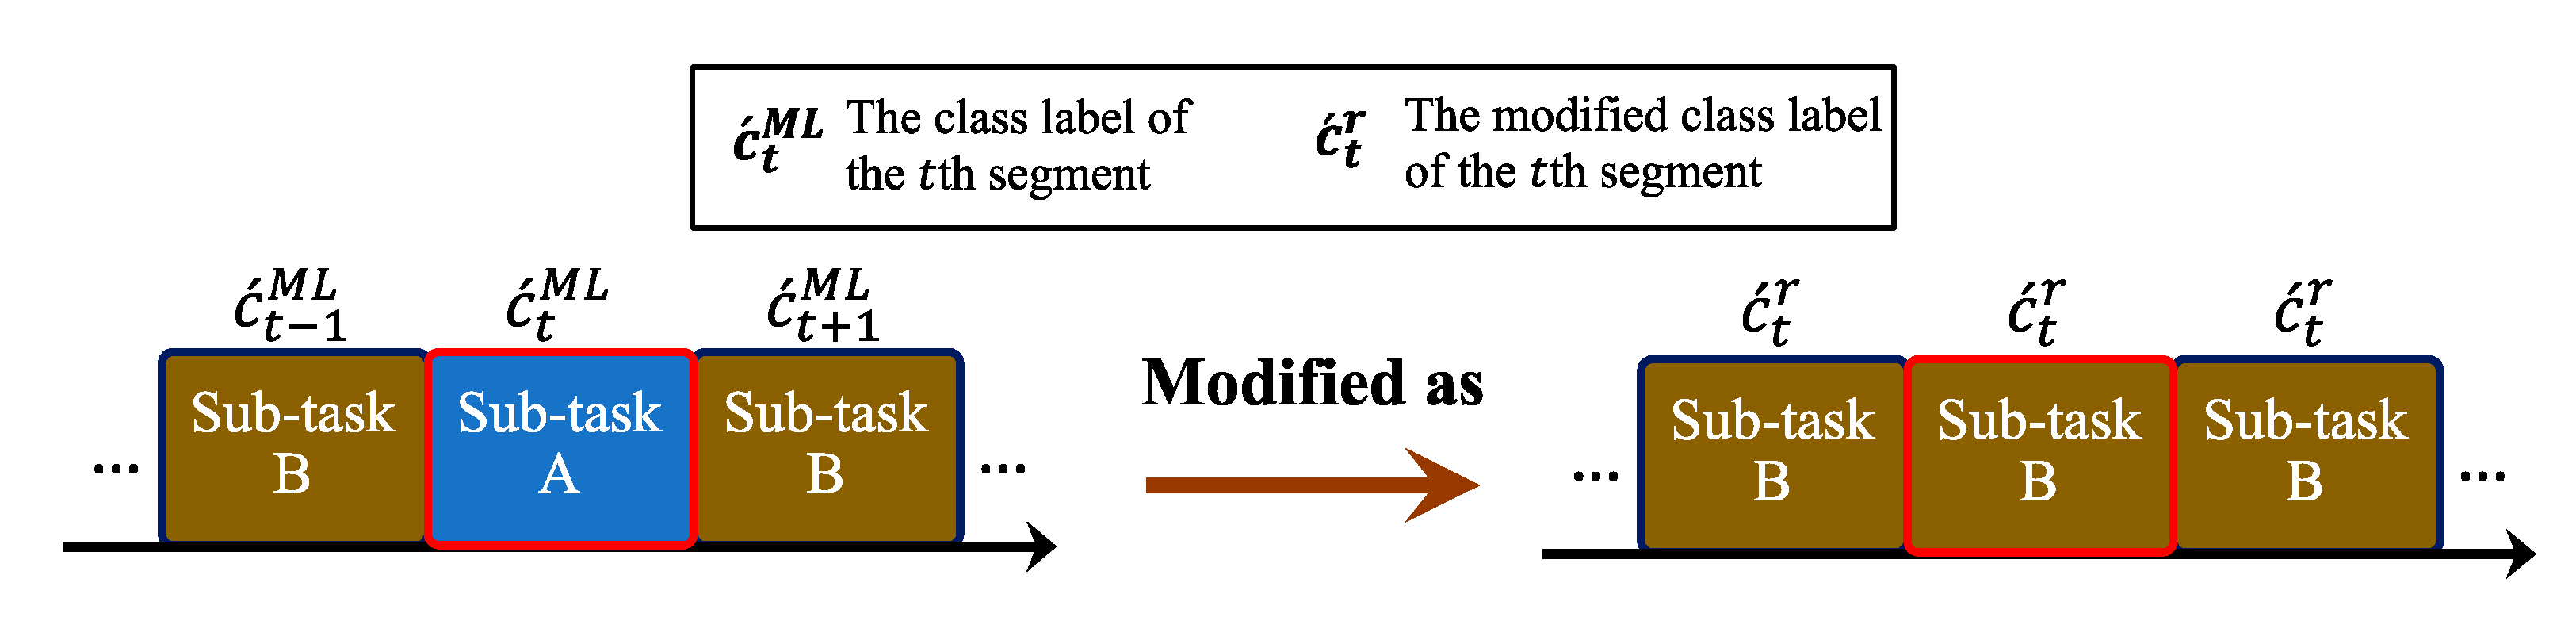
Figure 5.
An illustration of the modification process to the fragmentation errors. The “sub-task A” of is the misidentified result that is modified as “sub-task B” according to the proposed rule-based modification.
Figure 5.
An illustration of the modification process to the fragmentation errors. The “sub-task A” of is the misidentified result that is modified as “sub-task B” according to the proposed rule-based modification.
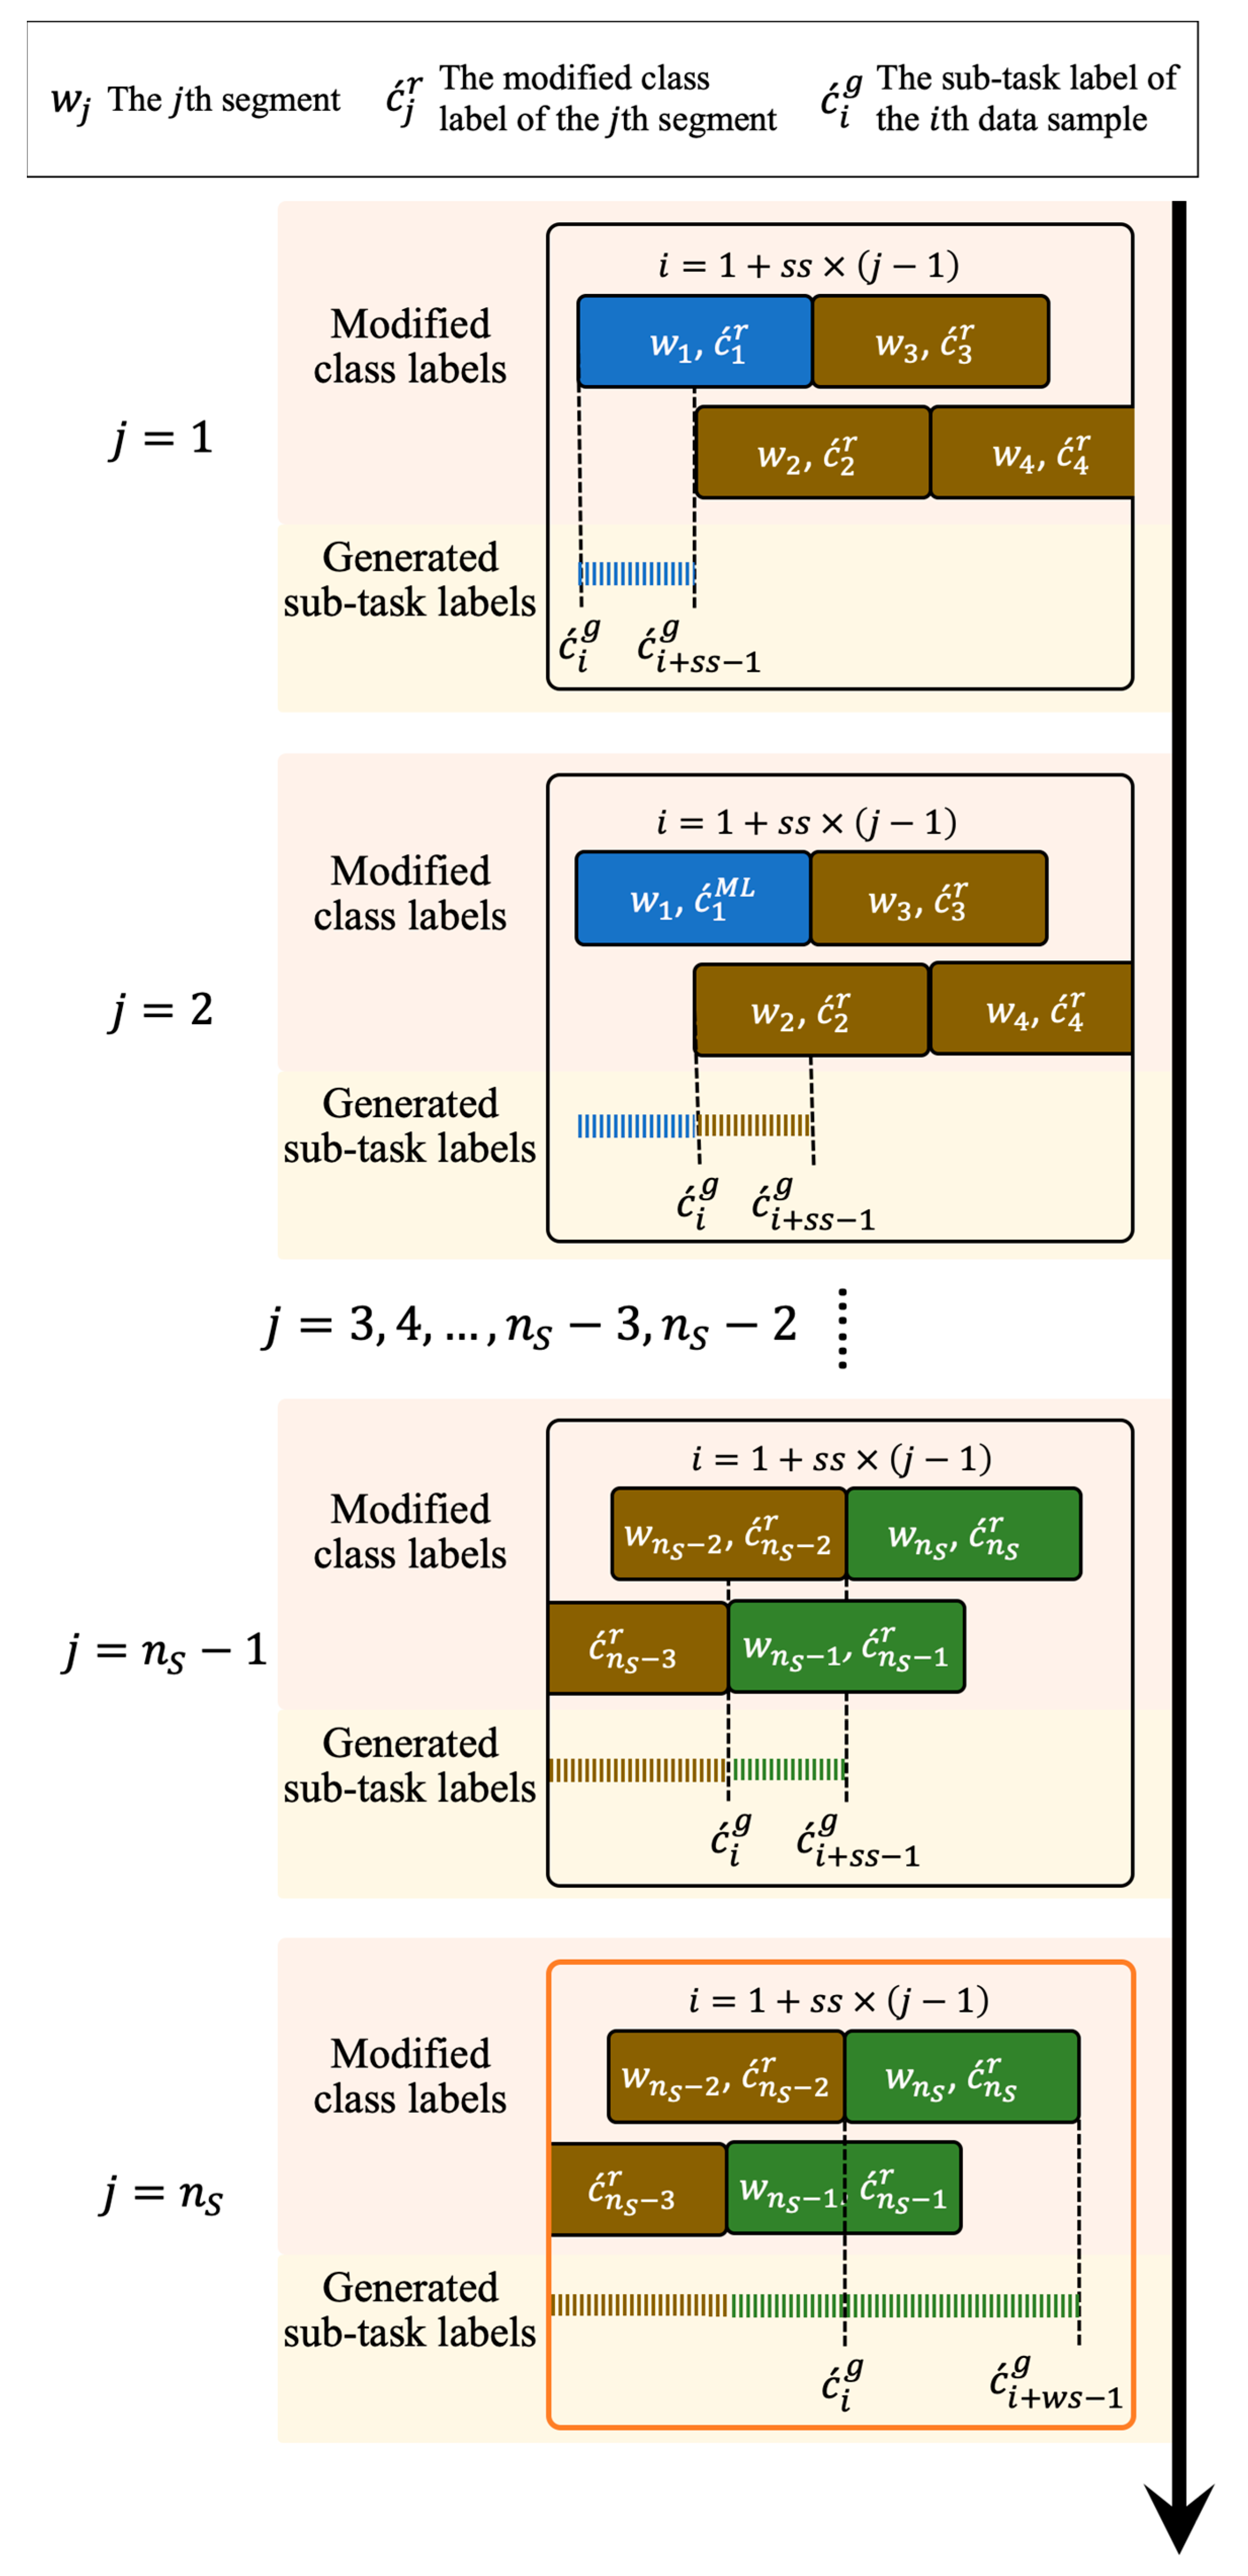
Figure 6.
An illustration of the sub-task information generator. A sequence of sub-task labels is obtained based on a sequence of modified class labels . For the first modified class labels, each maps to a sequence of sub-task labels {,,…, }, where . Finally, a sequence of sub-task labels {,,…, } is obtained from the last modified class label .
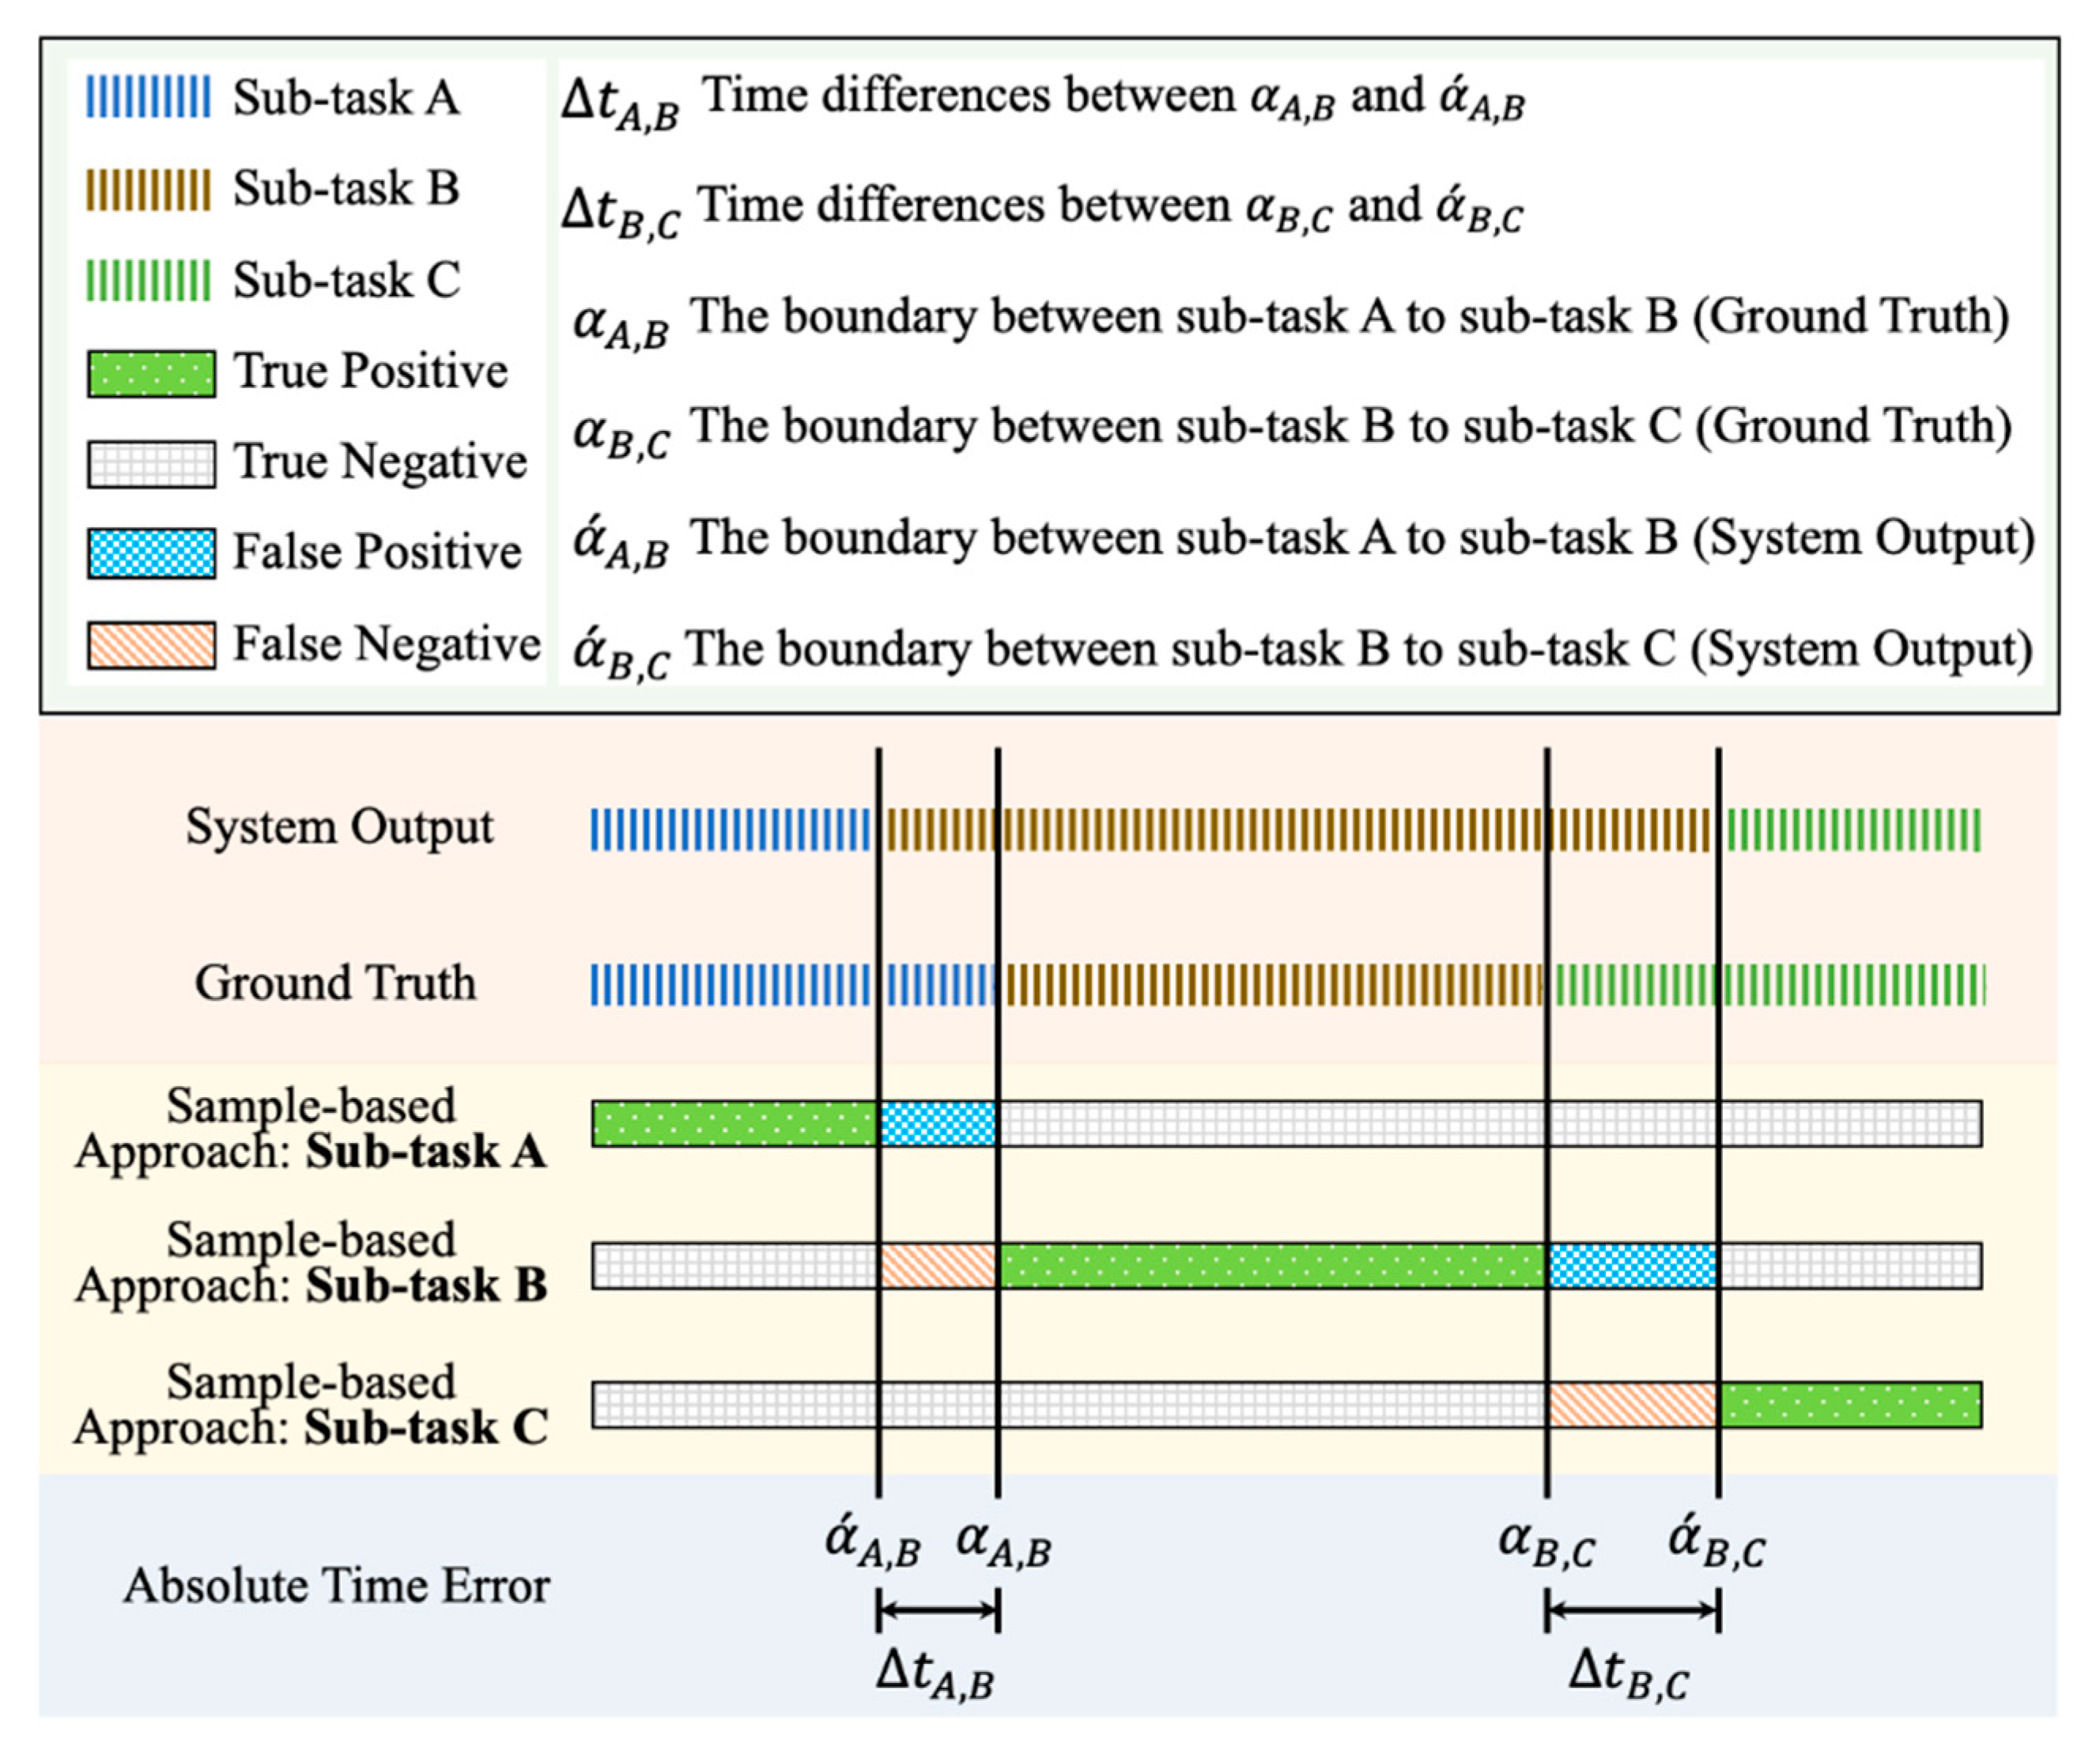
Figure 7.
An illustration of the annotation for the performance evaluation of sub-task segmentation, including true positive, true negative, false positive, false negative, and absolute time error.
Figure 7.
An illustration of the annotation for the performance evaluation of sub-task segmentation, including true positive, true negative, false positive, false negative, and absolute time error.
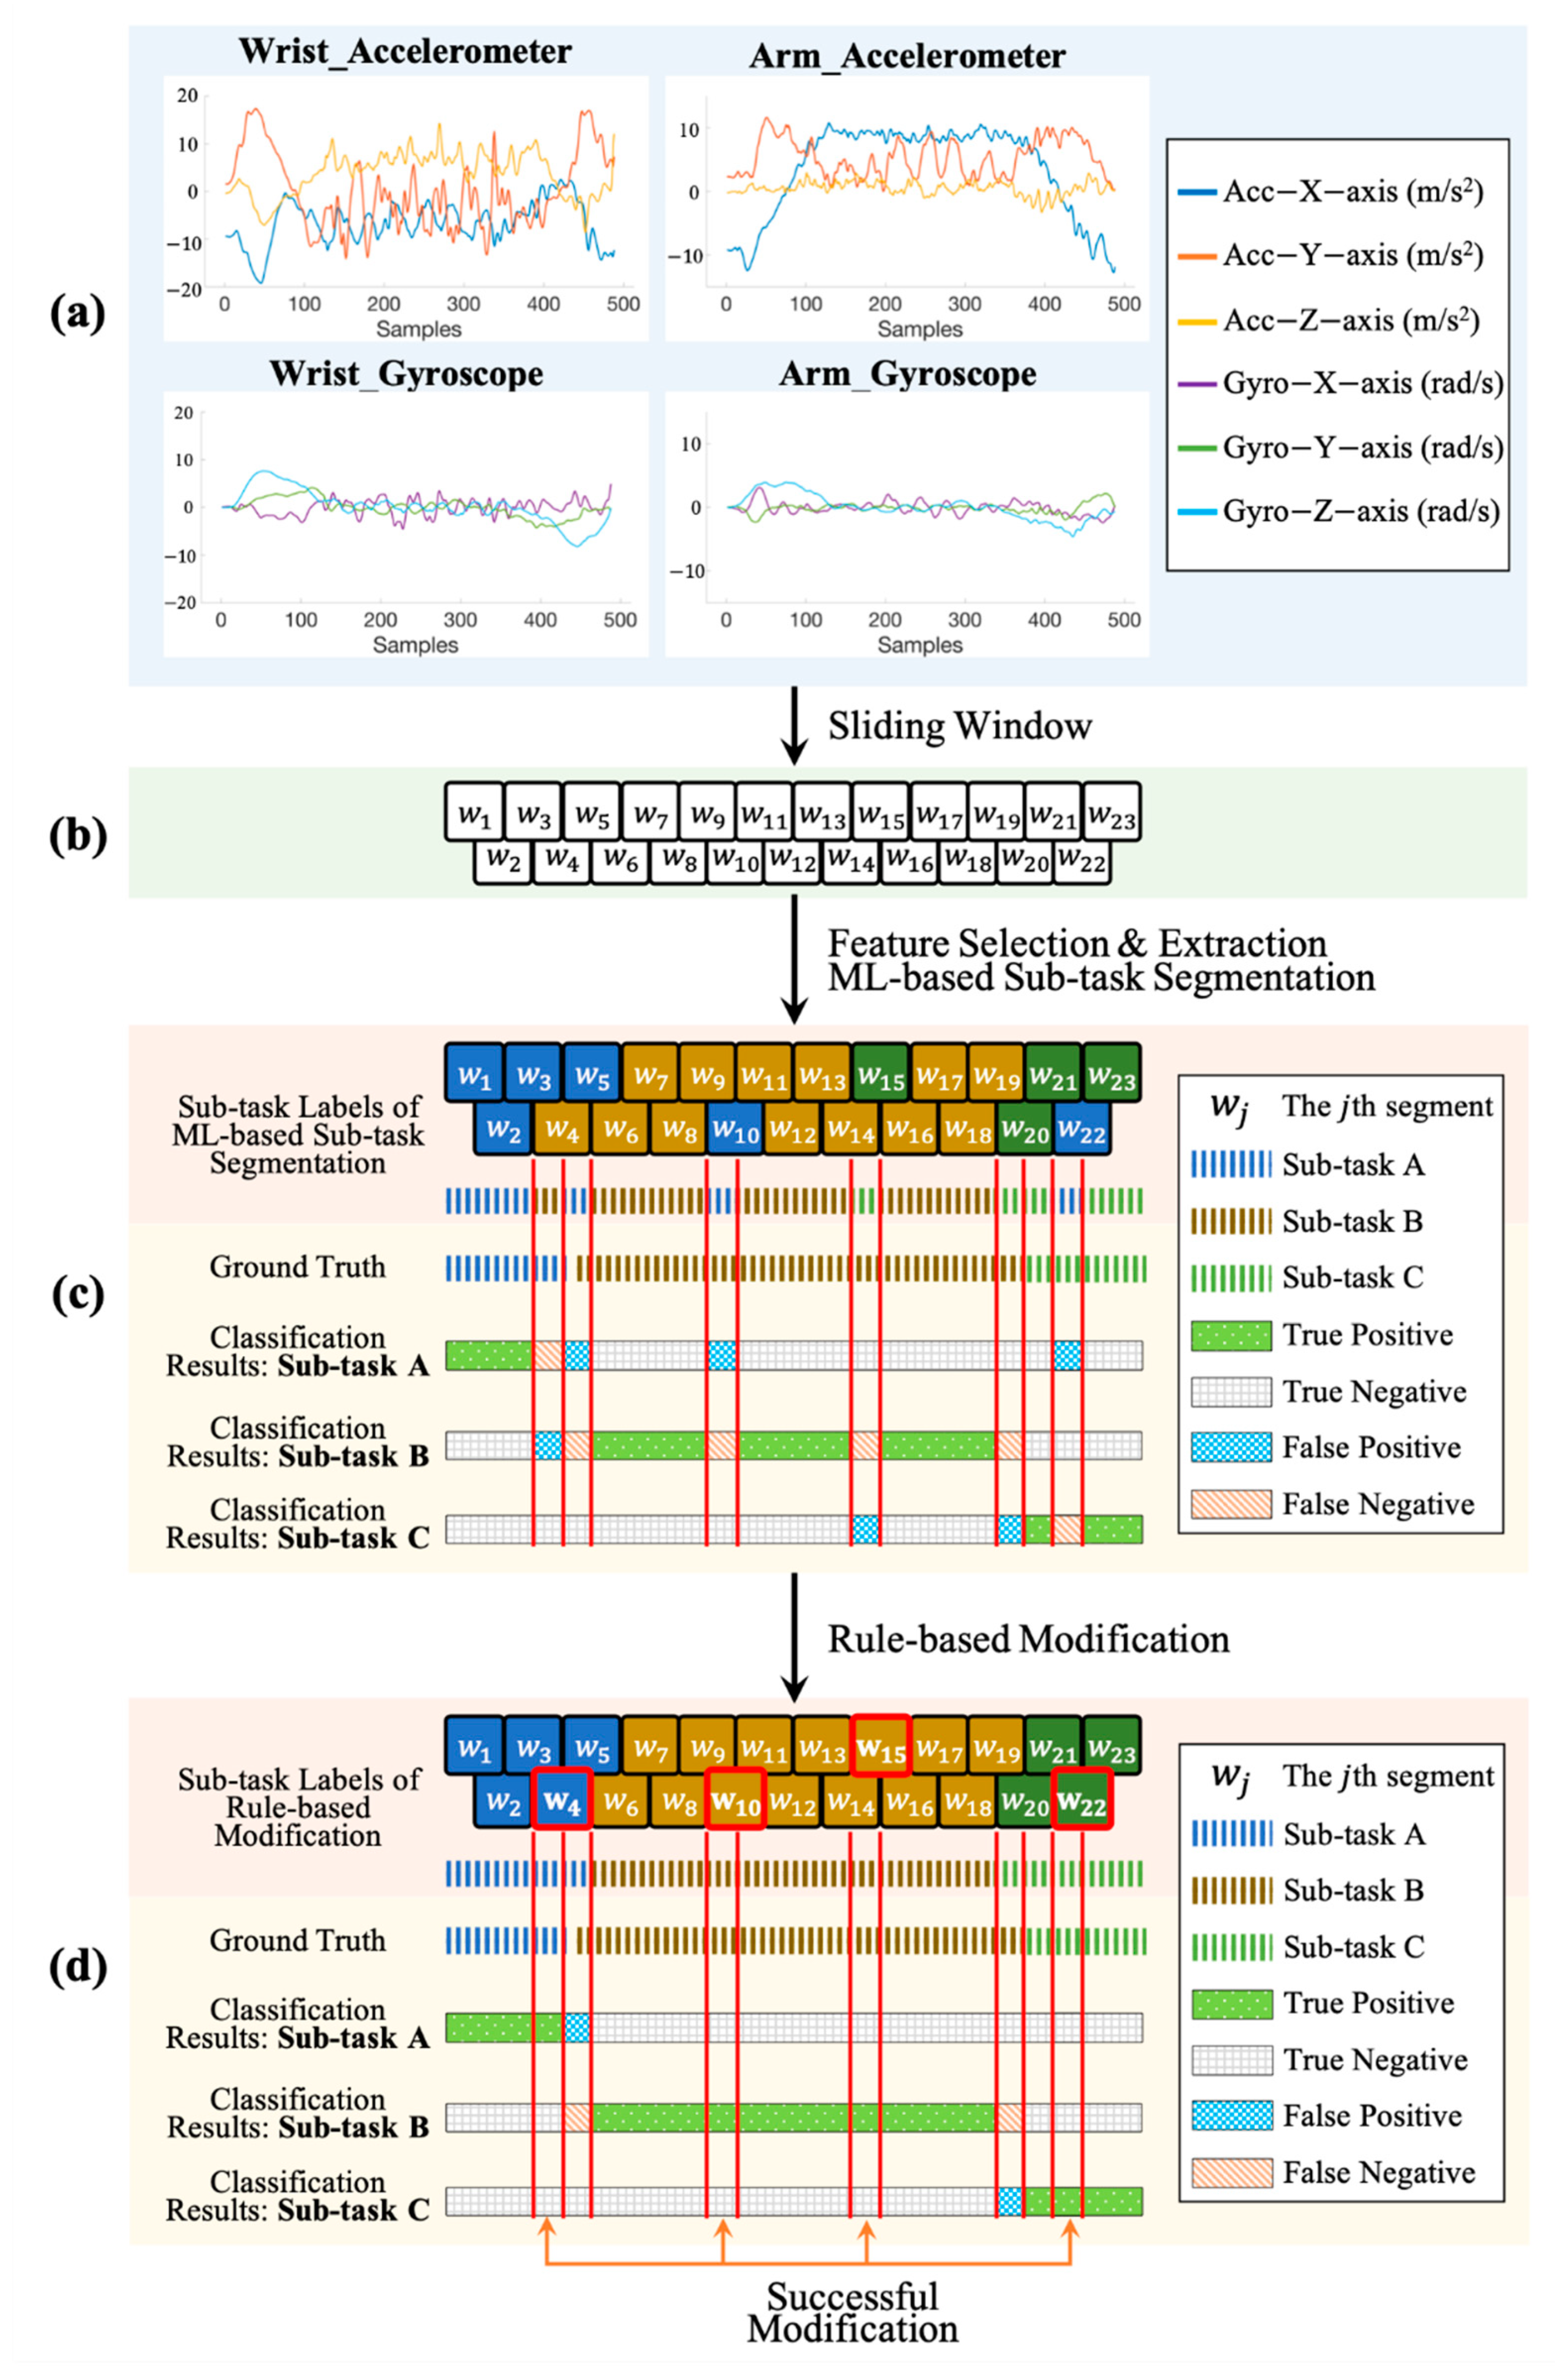
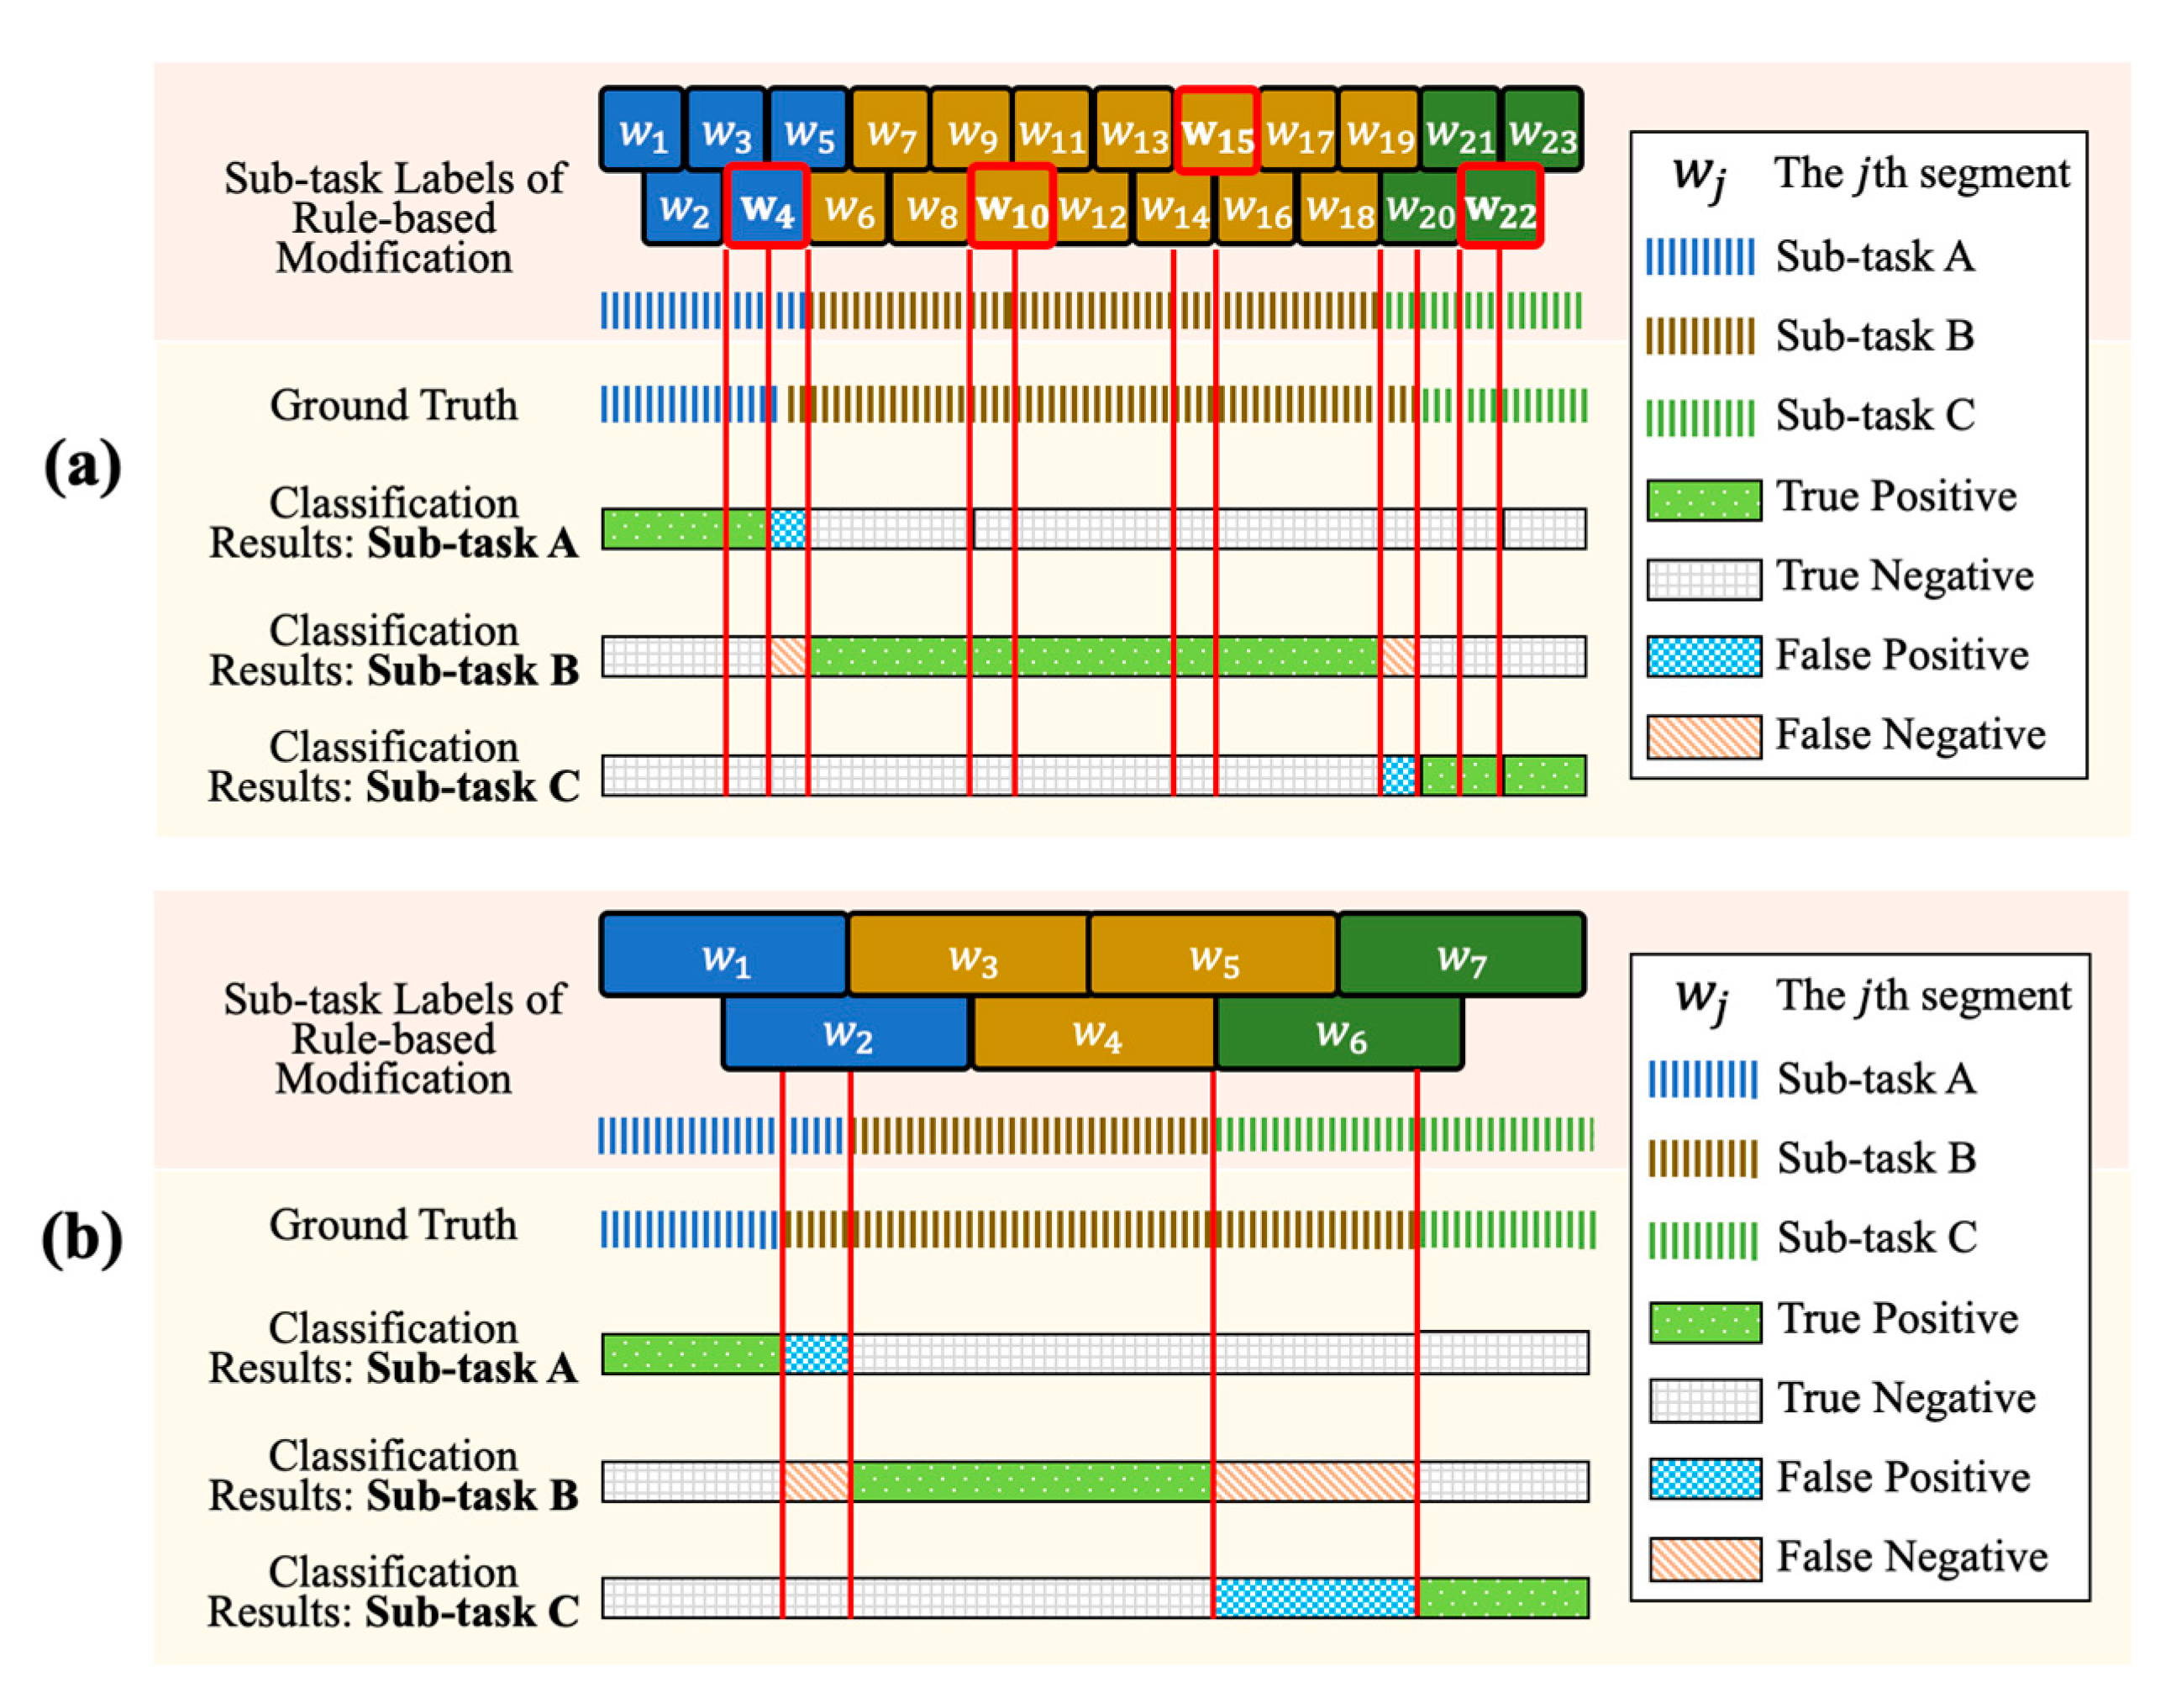
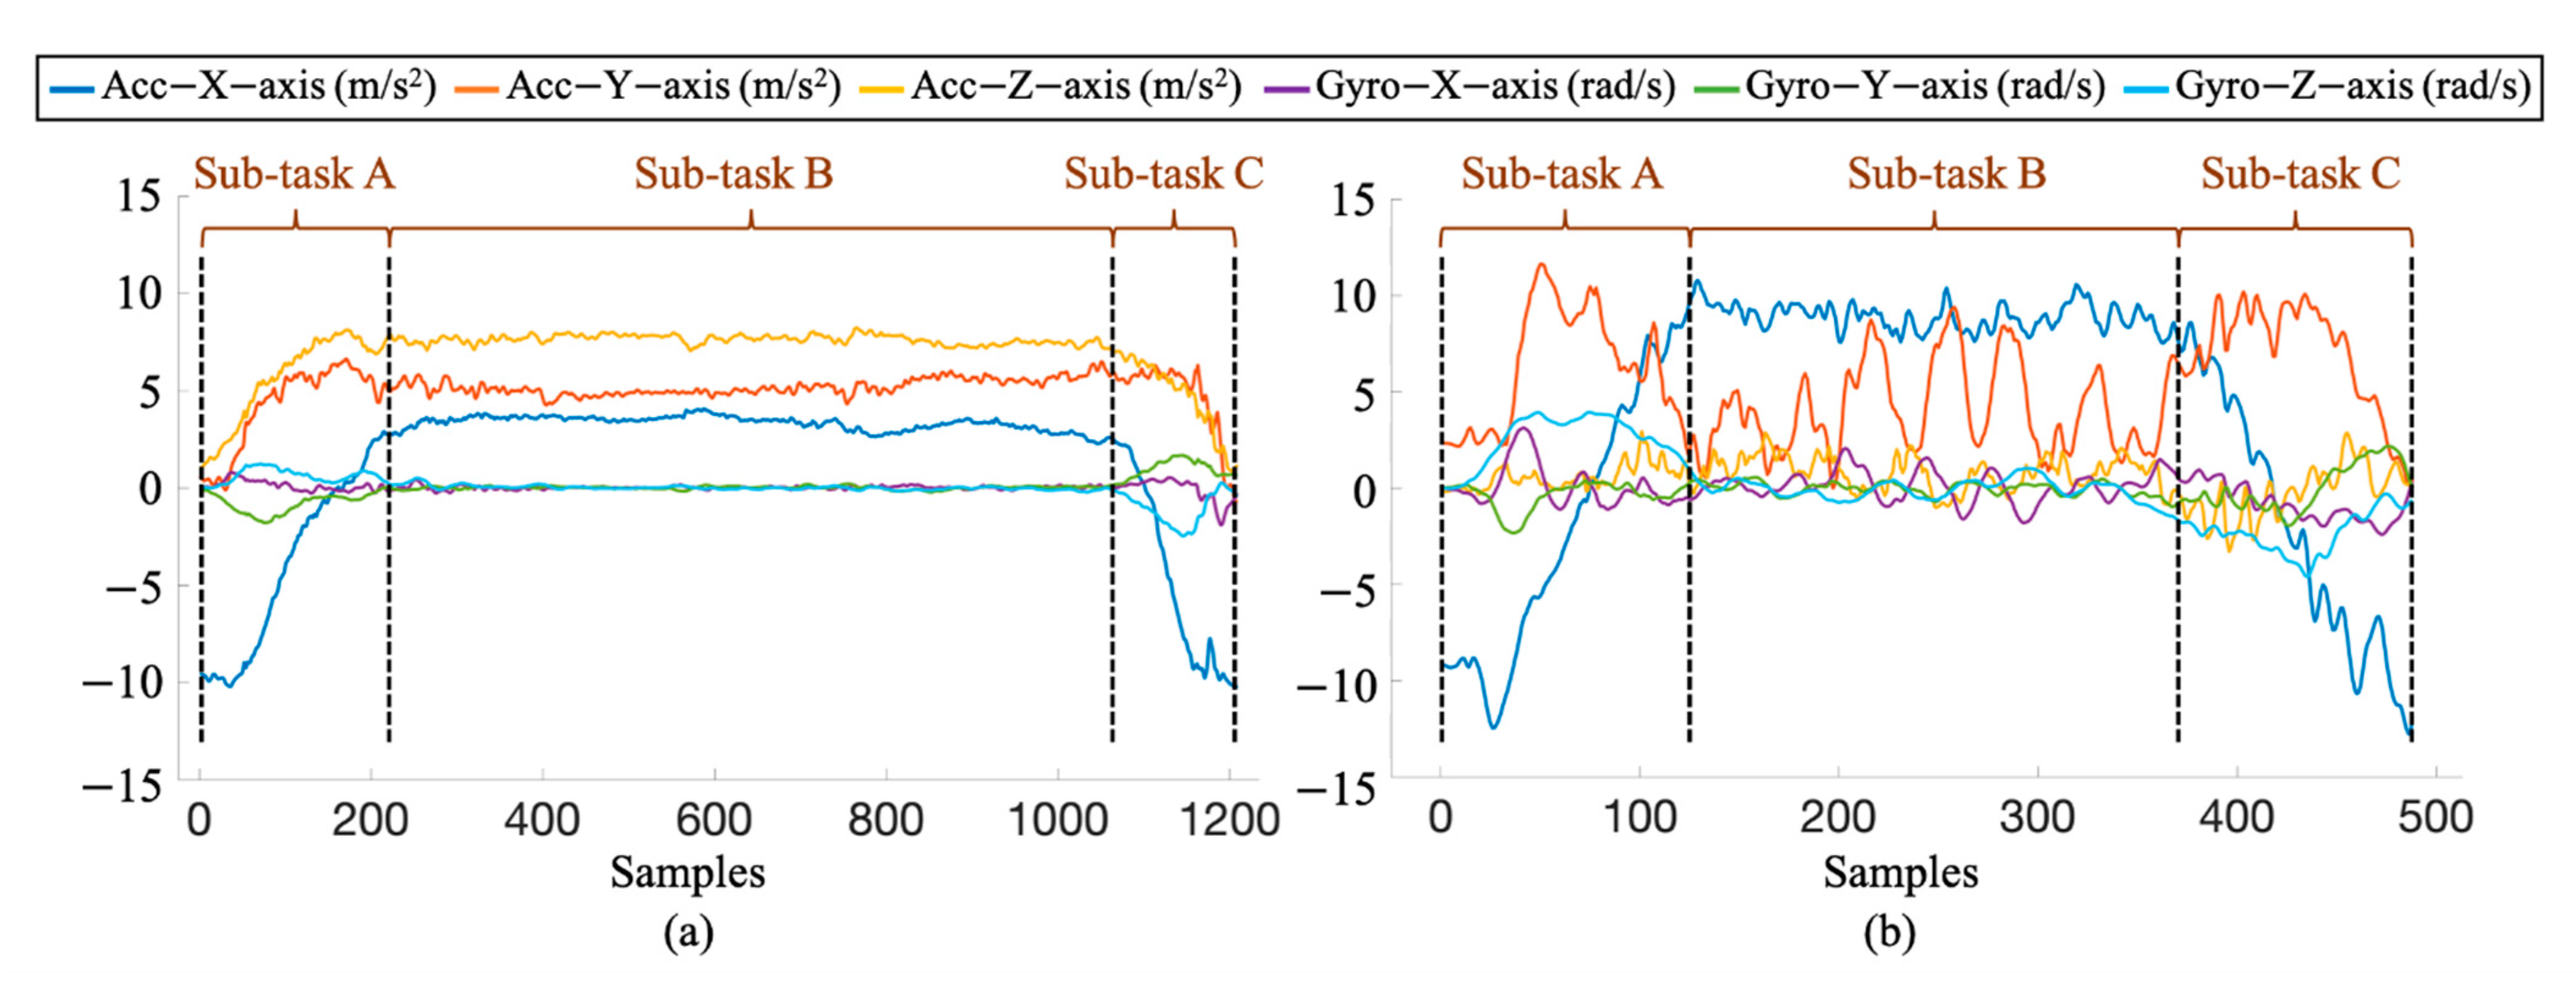
Figure 8.
An example of the signal performed by the health subject and the processes of the proposed sub-task segmentation. (a) The accelerometer and gyroscope signals collected from the IMUs placed on the wrist and arm. (b) The divided segments obtained from the process of sliding window. In this example, there are 23 segments (c) The classification results for sub-task A, B and C after the processes of feature extraction and ML-based sub-task segmentation, where the TP, TN, FP, and FN are annotated. (d) The classification results after the processes of rule-based modification, where the modified sliding segments are highlighted in red square (e.g., , , , ) and the successful modification results are annotated.
Figure 9.
An illustration of the segmentation performance using smaller and larger window sizes. (a) The classification results using smaller window size, where the window size is 0.5 s. (b) The classification results using larger window size, where the window size is 1.5 s.
Figure 9.
An illustration of the segmentation performance using smaller and larger window sizes. (a) The classification results using smaller window size, where the window size is 0.5 s. (b) The classification results using larger window size, where the window size is 1.5 s.
Figure 10.
An example of the data of the T2 task “cleaning upper back and shoulder” collected from the wrist-worn sensor, which are performed by (a) the FS patient and (b)the healthy subject.
Figure 10.
An example of the data of the T2 task “cleaning upper back and shoulder” collected from the wrist-worn sensor, which are performed by (a) the FS patient and (b)the healthy subject.
Table 1.
A list of shoulder task and sub-task.
Table 1.
A list of shoulder task and sub-task.
| Task ID | Shoulder Task | Sub-Task A | Sub-Task B | Sub-Task C |
|---|
| T1 | Cleaning head | Lifting hands toward head | Washing head | Putting hands down |
| T2 | Cleaning upper back and shoulder | Lifting hands toward upper back and shoulder | Washing upper back and shoulder | Putting hands down |
| T3 | Cleaning lower back | Lifting hands towards lower back | Washing lower back | Putting hands down |
| T4 | Placing an object on a high shelf | Lifting the object toward the shelf | Holding the hands on the shelf for few seconds | Putting hands down |
| T5 | Putting/Removing an object into/from the back pocket | Putting an object into the back pocket | Holding the hands in the back pocket for few seconds | Removing an object from the back pocket |
Table 2.
Mean sub-task time performed by healthy and FS patients (s).
Table 2.
Mean sub-task time performed by healthy and FS patients (s).
| | | Healthy Subjects | FS Patients | All Subjects |
|---|
| | Sub-task A | 0.86 ± 0.15 | 1.6 ± 0.73 | 1.22 ± 0.62 |
| T1 | Sub-task B | 3.13 ± 1.18 | 5.66 ± 2 | 4.46 ± 2.08 |
| | Sub-task C | 0.9 ± 0.2 | 1.18 ± 0.16 | 1.04 ± 0.22 |
| | Sub-task A | 1.16 ± 0.25 | 1.82 ± 0.85 | 1.45 ± 0.68 |
| T2 | Sub-task B | 2.58 ± 0.75 | 7.81 ± 3.75 | 4.93 ± 3.63 |
| | Sub-task C | 1.18 ± 0.2 | 1.35 ± 0.21 | 1.29 ± 0.24 |
| | Sub-task A | 0.78 ± 0.12 | 1.1 ± 0.44 | 0.92 ± 0.35 |
| T3 | Sub-task B | 3.09 ± 1.15 | 6.32 ± 4.19 | 4.94 ± 3.57 |
| | Sub-task C | 0.99 ± 0.21 | 0.94 ± 0.25 | 0.95 ± 0.24 |
| | Sub-task A | 1.53 ± 0.35 | 2.02 ± 0.65 | 1.81 ± 0.59 |
| T4 | Sub-task B | 0.97 ± 0.49 | 1.98 ± 0.53 | 1.45 ± 0.7 |
| | Sub-task C | 1.52 ± 0.41 | 1.25 ± 0.45 | 1.45 ± 0.49 |
| | Sub-task A | 1.47 ± 0.46 | 1.79 ± 0.75 | 1.61 ± 0.62 |
| T5 | Sub-task B | 0.9 ± 0.65 | 0.89 ± 0.68 | 0.93 ± 0.66 |
| | Sub-task C | 2.42 ± 2.44 | 1.37 ± 0.35 | 1.88 ± 1.82 |
Table 3.
A list of statistical and kinematic feature types from a single sensor.
Table 3.
A list of statistical and kinematic feature types from a single sensor.
| No. | Description |
|---|
| − | Mean of |
| Standard Deviation of |
| Variance of |
| Maximum of |
| Minimum of |
| Range of |
| Kurtosis of |
| Skewness of |
| Correlation coefficient between each pair of |
| Number of velocity peaks of |
| Number of zero crossing of |
| Number of mean crossing of |
Table 4.
The results of the shoulder task identification using machine learning approaches (%).
Table 4.
The results of the shoulder task identification using machine learning approaches (%).
| Shoulder Task | Sensitivity | Precision | F-Score |
|---|
| SVM | kNN | CART | SVM | kNN | CART | SVM | kNN | CART |
|---|
| T1 | 94.12 | 82.35 | 70.59 | 100.00 | 60.87 | 66.67 | 96.97 | 70.00 | 68.57 |
| T2 | 100.00 | 64.71 | 64.71 | 85.00 | 91.67 | 78.57 | 91.89 | 75.86 | 70.97 |
| T3 | 88.24 | 76.47 | 82.35 | 71.43 | 86.67 | 77.78 | 78.95 | 81.25 | 80.00 |
| T4 | 82.35 | 82.35 | 76.47 | 100.00 | 82.35 | 68.42 | 90.32 | 82.35 | 72.22 |
| T5 | 70.59 | 88.24 | 76.47 | 85.71 | 83.33 | 81.25 | 77.42 | 85.71 | 78.79 |
| Overall | 87.06 | 78.82 | 74.12 | 88.43 | 80.98 | 74.54 | 87.11 | 79.04 | 74.11 |
Table 5.
The sensitivity of the sub-task segmentation using machine learning approaches (%) vs. different window sizes (s).
Table 5.
The sensitivity of the sub-task segmentation using machine learning approaches (%) vs. different window sizes (s).
| Window Size (s) | Sub-Task A | Sub-Task B | Sub-Task C | Overall |
|---|
| SVM | kNN | CART | SVM | kNN | CART | SVM | kNN | CART | SVM | kNN | CART |
|---|
| 0.1 | 77.94 | 83.88 | 94.39 | 90.15 | 87.43 | 64.05 | 78.71 | 61.40 | 48.32 | 82.27 a | 77.57 | 68.92 |
| 0.2 | 83.02 | 81.46 | 88.80 | 88.81 | 87.12 | 59.81 | 74.86 | 71.39 | 70.81 | 82.23 | 79.99 | 73.14 |
| 0.3 | 75.91 | 82.31 | 83.56 | 87.80 | 83.98 | 63.09 | 79.43 | 76.27 | 75.28 | 81.05 | 80.85 | 73.98 |
| 0.4 | 73.20 | 78.04 | 81.73 | 83.38 | 76.33 | 50.92 | 83.28 | 80.60 | 78.64 | 79.96 | 78.32 | 70.43 |
| 0.5 | 74.06 | 79.61 | 80.57 | 87.45 | 80.94 | 56.92 | 82.46 | 79.50 | 80.61 | 81.32 | 80.02 | 72.70 |
| 0.6 | 71.50 | 76.34 | 73.70 | 86.27 | 79.30 | 56.13 | 82.21 | 80.63 | 81.91 | 79.99 | 78.76 | 70.58 |
| 0.7 | 73.73 | 74.64 | 80.16 | 89.66 | 84.46 | 68.15 | 81.91 | 77.65 | 72.33 | 81.77 | 78.92 | 73.55 |
| 0.8 | 67.50 | 69.98 | 70.97 | 86.13 | 84.87 | 66.27 | 80.80 | 78.07 | 80.48 | 78.14 | 77.64 | 72.57 |
| 0.9 | 65.00 | 71.34 | 76.22 | 90.39 | 79.71 | 68.87 | 75.12 | 74.79 | 74.00 | 76.84 | 75.28 | 73.03 |
| 1 | 66.06 | 70.52 | 71.26 | 87.87 | 80.20 | 75.29 | 80.28 | 72.54 | 75.70 | 78.07 | 74.42 | 74.08 |
| 1.1 | 66.61 | 68.77 | 77.65 | 89.71 | 84.96 | 69.35 | 70.61 | 65.60 | 67.97 | 75.64 | 73.11 | 71.66 |
| 1.2 | 66.60 | 68.41 | 78.80 | 86.41 | 77.80 | 75.31 | 75.00 | 67.45 | 61.82 | 76.00 | 71.22 | 71.98 |
| 1.3 | 66.55 | 66.70 | 73.10 | 90.06 | 83.40 | 73.81 | 71.30 | 65.82 | 60.81 | 75.97 | 71.97 | 69.24 |
| 1.4 | 67.85 | 65.25 | 67.34 | 94.35 | 91.58 | 83.01 | 56.94 | 54.26 | 56.01 | 73.05 | 70.36 | 68.79 |
| 1.5 | 69.86 | 66.66 | 72.79 | 92.04 | 90.40 | 79.48 | 60.41 | 55.80 | 54.91 | 74.10 | 70.95 | 69.06 |
Table 6.
The precision of the sub-task segmentation using machine learning approaches (%) vs. different window sizes (s).
Table 6.
The precision of the sub-task segmentation using machine learning approaches (%) vs. different window sizes (s).
| Window Size (s) | Sub-Task A | Sub-Task B | Sub-Task C | Overall |
|---|
| SVM | kNN | CART | SVM | kNN | CART | SVM | kNN | CART | SVM | kNN | CART |
|---|
| 0.1 | 93.73 | 81.36 | 57.94 | 77.67 | 73.22 | 76.97 | 82.96 | 93.72 | 76.26 | 84.79 | 82.77 | 70.39 |
| 0.2 | 90.46 | 85.71 | 71.35 | 78.57 | 76.26 | 77.50 | 86.20 | 90.94 | 56.59 | 85.07 a | 84.30 | 68.48 |
| 0.3 | 91.06 | 89.23 | 78.28 | 76.19 | 76.15 | 74.43 | 80.97 | 82.08 | 54.42 | 82.74 | 82.49 | 69.04 |
| 0.4 | 90.48 | 89.31 | 78.94 | 75.40 | 76.31 | 75.85 | 76.56 | 69.19 | 49.65 | 80.81 | 78.27 | 68.14 |
| 0.5 | 90.84 | 88.66 | 78.10 | 76.26 | 76.28 | 75.07 | 79.80 | 77.83 | 53.19 | 82.30 | 80.92 | 68.78 |
| 0.6 | 89.38 | 85.14 | 81.02 | 75.25 | 76.38 | 72.54 | 76.72 | 74.21 | 49.97 | 80.45 | 78.58 | 67.85 |
| 0.7 | 91.47 | 87.51 | 69.72 | 76.86 | 74.81 | 77.99 | 83.53 | 86.00 | 63.00 | 83.96 | 82.77 | 70.24 |
| 0.8 | 93.06 | 87.90 | 81.66 | 73.02 | 74.23 | 73.87 | 78.08 | 84.29 | 55.61 | 81.38 | 82.14 | 70.38 |
| 0.9 | 94.73 | 86.09 | 78.86 | 71.55 | 72.70 | 71.50 | 86.60 | 77.96 | 61.21 | 84.29 | 78.92 | 70.52 |
| 1 | 92.49 | 86.30 | 83.49 | 73.85 | 70.40 | 72.37 | 80.43 | 81.05 | 65.88 | 82.26 | 79.25 | 73.91 |
| 1.1 | 93.86 | 88.22 | 73.83 | 70.83 | 69.17 | 71.31 | 79.98 | 81.50 | 63.31 | 81.55 | 79.63 | 69.49 |
| 1.2 | 92.25 | 78.63 | 76.47 | 71.40 | 69.19 | 74.57 | 79.12 | 79.68 | 73.10 | 80.92 | 75.83 | 74.71 |
| 1.3 | 96.16 | 83.56 | 72.32 | 70.93 | 68.92 | 70.42 | 83.35 | 79.85 | 65.18 | 83.48 | 77.44 | 69.31 |
| 1.4 | 96.93 | 91.79 | 75.98 | 68.75 | 67.01 | 67.34 | 89.40 | 89.02 | 84.14 | 85.03 | 82.61 | 75.82 |
| 1.5 | 96.29 | 87.87 | 75.82 | 69.34 | 67.43 | 68.91 | 86.31 | 88.45 | 80.72 | 83.98 | 81.25 | 75.15 |
Table 7.
The F-score of the sub-task segmentation using machine learning approaches (%) vs. different window sizes (s).
Table 7.
The F-score of the sub-task segmentation using machine learning approaches (%) vs. different window sizes (s).
| Window Size (s) | Sub-Task A | Sub-Task B | Sub-Task C | Overall |
|---|
| SVM | kNN | CART | SVM | kNN | CART | SVM | kNN | CART | SVM | kNN | CART |
|---|
| 0.1 | 84.79 | 82.29 | 81.18 | 82.75 | 78.81 | 74.03 | 80.30 | 73.45 | 71.20 | 82.61 | 78.18 | 75.47 |
| 0.2 | 86.53 | 83.08 | 79.54 | 82.42 | 81.06 | 68.96 | 80.74 | 79.86 | 65.33 | 83.23a | 81.33 | 71.27 |
| 0.3 | 82.68 | 85.54 | 83.23 | 80.77 | 79.56 | 73.23 | 79.20 | 78.90 | 70.14 | 80.88 | 81.33 | 75.53 |
| 0.4 | 80.68 | 83.19 | 80.65 | 78.51 | 75.92 | 59.56 | 78.68 | 73.00 | 62.32 | 79.29 | 77.37 | 67.51 |
| 0.5 | 81.06 | 83.84 | 81.93 | 80.73 | 78.22 | 65.73 | 80.13 | 77.74 | 64.57 | 80.64 | 79.93 | 70.74 |
| 0.6 | 78.96 | 80.42 | 83.87 | 79.11 | 77.38 | 67.14 | 78.59 | 76.27 | 64.64 | 78.89 | 78.02 | 71.89 |
| 0.7 | 81.34 | 80.45 | 82.24 | 82.14 | 78.99 | 73.95 | 82.42 | 80.83 | 69.49 | 81.97 | 80.09 | 75.23 |
| 0.8 | 78.32 | 77.83 | 81.38 | 78.46 | 78.96 | 73.85 | 78.69 | 80.44 | 69.54 | 78.49 | 79.08 | 74.92 |
| 0.9 | 77.06 | 77.57 | 79.20 | 78.83 | 75.84 | 68.40 | 79.93 | 74.87 | 60.36 | 78.61 | 76.09 | 69.32 |
| 1 | 76.84 | 77.51 | 78.47 | 79.64 | 74.79 | 73.31 | 80.10 | 76.34 | 70.03 | 78.86 | 76.21 | 73.94 |
| 1.1 | 77.96 | 77.02 | 77.03 | 77.81 | 75.45 | 70.92 | 74.53 | 72.05 | 69.66 | 76.77 | 74.84 | 72.53 |
| 1.2 | 77.25 | 72.54 | 76.57 | 77.33 | 73.00 | 75.76 | 76.48 | 71.92 | 72.43 | 77.02 | 72.49 | 74.92 |
| 1.3 | 78.60 | 74.11 | 74.79 | 78.38 | 74.47 | 74.32 | 76.62 | 70.94 | 71.03 | 77.87 | 73.17 | 73.38 |
| 1.4 | 78.87 | 75.94 | 75.05 | 77.78 | 75.85 | 74.10 | 69.26 | 65.57 | 68.55 | 75.30 | 72.45 | 72.57 |
| 1.5 | 80.40 | 75.39 | 78.28 | 77.11 | 75.46 | 76.67 | 69.18 | 64.63 | 71.73 | 75.57 | 71.83 | 75.56 |
Table 8.
The , and of all subject using different machine learning models vs. difference window sizes (s).
Table 8.
The , and of all subject using different machine learning models vs. difference window sizes (s).
| Window Size (sec) | | | |
|---|
| SVM | kNN | CART | SVM | kNN | CART | SVM | kNN | CART |
|---|
| 0.1 | 393 | 387a | 569 | 496 | 466 | 819 | 445 | 427c | 694 |
| 0.2 | 392 | 438 | 590 | 472 | 473 | 1238 | 433 | 456 | 914 |
| 0.3 | 468 | 502 | 481 | 522 | 422 | 959 | 495 | 462 | 720 |
| 0.4 | 505 | 525 | 538 | 567 | 577 | 1549 | 536 | 551 | 1044 |
| 0.5 | 489 | 559 | 488 | 514 | 447 | 1419 | 502 | 503 | 954 |
| 0.6 | 536 | 554 | 439 | 555 | 404 | 1379 | 546 | 479 | 909 |
| 0.7 | 478 | 586 | 496 | 430 | 406 | 1017 | 454 | 496 | 757 |
| 0.8 | 543 | 551 | 495 | 554 | 403 | 1024 | 549 | 477 | 760 |
| 0.9 | 560 | 555 | 544 | 499 | 411 | 1425 | 530 | 483 | 985 |
| 1.0 | 556 | 527 | 558 | 500 | 403b | 909 | 528 | 465 | 734 |
| 1.1 | 537 | 579 | 612 | 624 | 515 | 916 | 581 | 547 | 764 |
| 1.2 | 561 | 581 | 616 | 591 | 541 | 739 | 576 | 561 | 678 |
| 1.3 | 533 | 494 | 691 | 564 | 550 | 723 | 549 | 522 | 707 |
| 1.4 | 523 | 490 | 676 | 679 | 560 | 816 | 601 | 525 | 746 |
| 1.5 | 498 | 497 | 594 | 698 | 599 | 665 | 598 | 548 | 630 |
Table 9.
The , and of healthy subject using different machine learning models vs. difference window sizes (s).
Table 9.
The , and of healthy subject using different machine learning models vs. difference window sizes (s).
| Window Size (sec) | | | |
|---|
| SVM | kNN | CART | SVM | kNN | CART | SVM | kNN | CART |
|---|
| 0.1 | 250 | 223a | 458 | 328 | 397 | 389 | 289 | 310 | 424 |
| 0.2 | 314 | 282 | 450 | 431 | 301 | 501 | 373 | 292 | 476 |
| 0.3 | 304 | 274 | 442 | 365 | 271 | 514 | 335 | 273c | 478 |
| 0.4 | 384 | 311 | 438 | 470 | 388 | 796 | 427 | 350 | 617 |
| 0.5 | 325 | 301 | 426 | 342 | 316 | 1026 | 334 | 309 | 726 |
| 0.6 | 359 | 321 | 359 | 281 | 267b | 544 | 320 | 294 | 452 |
| 0.7 | 371 | 355 | 486 | 353 | 341 | 481 | 362 | 348 | 484 |
| 0.8 | 436 | 343 | 427 | 490 | 313 | 655 | 463 | 328 | 541 |
| 0.9 | 474 | 361 | 415 | 410 | 332 | 756 | 442 | 347 | 586 |
| 1.0 | 458 | 381 | 398 | 357 | 353 | 635 | 408 | 367 | 517 |
| 1.1 | 427 | 409 | 592 | 573 | 474 | 653 | 500 | 442 | 623 |
| 1.2 | 433 | 380 | 568 | 586 | 574 | 608 | 510 | 477 | 588 |
| 1.3 | 424 | 299 | 695 | 538 | 562 | 786 | 481 | 431 | 741 |
| 1.4 | 411 | 328 | 676 | 778 | 609 | 703 | 595 | 469 | 690 |
| 1.5 | 423 | 357 | 556 | 812 | 633 | 804 | 618 | 495 | 680 |
Table 10.
The , and of FS patients using different machine learning models vs. difference window sizes (s).
Table 10.
The , and of FS patients using different machine learning models vs. difference window sizes (s).
| Window Size (s) | | | |
|---|
| SVM | kNN | CART | SVM | kNN | CART | SVM | kNN | CART |
|---|
| 0.1 | 535 | 551a | 680 | 617 | 536 | 1250 | 576 | 544 | 965 |
| 0.2 | 472 | 594 | 729 | 562 | 646 | 1975 | 517c | 620 | 1352 |
| 0.3 | 631 | 730 | 520 | 679 | 574 | 1404 | 655 | 652 | 962 |
| 0.4 | 626 | 739 | 638 | 664 | 767 | 2302 | 645 | 753 | 1470 |
| 0.5 | 653 | 817 | 549 | 686 | 578 | 1812 | 670 | 698 | 1181 |
| 0.6 | 714 | 788 | 520 | 830 | 541 | 2215 | 772 | 665 | 1368 |
| 0.7 | 585 | 817 | 505 | 506 | 470 | 1554 | 546 | 644 | 1030 |
| 0.8 | 650 | 759 | 563 | 618 | 494 | 1394 | 634 | 627 | 979 |
| 0.9 | 646 | 748 | 673 | 588 | 491 | 2094 | 617 | 620 | 1384 |
| 1.0 | 654 | 673 | 718 | 643 | 453b | 1184 | 649 | 563 | 951 |
| 1.1 | 646 | 749 | 631 | 675 | 557 | 1178 | 661 | 653 | 905 |
| 1.2 | 689 | 783 | 665 | 596 | 507 | 870 | 643 | 645 | 768 |
| 1.3 | 642 | 690 | 687 | 589 | 538 | 660 | 616 | 614 | 674 |
| 1.4 | 635 | 652 | 675 | 580 | 510 | 929 | 608 | 581 | 802 |
| 1.5 | 573 | 637 | 632 | 584 | 566 | 526 | 579 | 602 | 579 |

 ,
, 


