Article

Prediction of Sensory Parameters of Cured Ham: A Study of the Viability of the Use of NIR Spectroscopy and Artificial Neural Networks

by
Pedro Hernández-Ramos
1,
Ana María Vivar-Quintana
2,*,
Isabel Revilla
2,
María Inmaculada González-Martín
3,
Miriam Hernández-Jiménez
2 and
Iván Martínez-Martín
2
1
Graphic Expression in Engineering, University of Salamanca, Escuela Politécnica Superior de Zamora, Avenida Requejo 33, 49022 Zamora, Spain
2
Food Technology, University of Salamanca, Escuela Politécnica Superior de Zamora, Avenida Requejo 33, 49022 Zamora, Spain
3
Analytical Chemistry, Nutrition and Bromatology, University of Salamanca, Calle Plaza de los Caidos s/n, 37008 Salamanca, Spain
*
Author to whom correspondence should be addressed.
Sensors 2020, 20(19), 5624; https://doi.org/10.3390/s20195624
Submission received: 9 September 2020 / Revised: 20 September 2020 / Accepted: 28 September 2020 / Published: 1 October 2020
(This article belongs to the Section Optical Sensors)

Abstract

:
Dry-cured ham is a high-quality product owing to its organoleptic characteristics. Sensory analysis is an essential part of assessing its quality. However, sensory assessment is a laborious process which implies the availability of a trained tasting panel. The aim of this study was the prediction of dry-ham sensory characteristics by means of an instrumental technique. To do so, an artificial neural network (ANN) model for the prediction of sensory parameters of dry-cured hams based on NIR spectral information was developed and optimized. The NIR spectra were obtained with a fiber-optic probe applied directly to the ham sample. In order to achieve this objective, the neural network was designed using 28 sensory parameters analyzed by a trained panel for sensory profile analysis as output data. A total of 91 samples of dry-cured ham matured for 24 months were analyzed. The hams corresponded to two different breeds (Iberian and Iberian x Duroc) and two different feeding systems (feeding outdoors with acorns or feeding with concentrates). The training algorithm and ANN architecture (the number of neurons in the hidden layer) used for the training were optimized. The parameters of ANN architecture analyzed have been shown to have an effect on the prediction capacity of the network. The Levenberg–Marquardt training algorithm has been shown to be the most suitable for the application of an ANN to sensory parameters

1. Introduction

Spanish Iberian dry-cured ham is defined by Spanish regulations in Royal Decree 4/2014 (BOE, 2014) as a product produced from the rear limbs of adult pigs with leg and bone subject to the corresponding process of salting and curing-maturation. This product is designated according to its type of genetic purity as “100% Iberian ham” in the case of products from animals with 100% genetic purity of the Iberian breed, and “Iberian ham” in the case of products from animals with at least 50% of their genetic makeup corresponding to the Iberian breed of pig as a result of crossing Iberian mothers with Duroc fathers. As far as the food of the pigs is concerned, hams may be denominated: “acorn-fed” for products from animals slaughtered immediately after feeding exclusively on acorns, grass, and other natural resources of the dehesa pastureland (this feeding system is known as “montanera”), or “fodder-fed” in the case of animals fed on fodder consisting essentially of cereals and leguminous plants, which is handled in intensive exploitation systems.
The organoleptic and nutritional characteristics of Spanish Iberian ham make it a high-quality product which is considered a delicatessen food. There is extensive literature describing the sensory properties of dry-cured ham [1,2,3,4] and more recently even the emotions evoked during the consumption of dry-cured ham have been identified [5]. In order to carry out the sensory analysis of a cured ham, the presence of a trained panel is necessary owing to the number and complexity of the parameters that must be assessed. If the panel is to be suitable, it is necessary to select and train the assessors [4] and to validate the panel regularly to ensure that its members produce trustworthy results [6,7,8]. The validation of a panel requires the holding of controlled sampling sessions which allow the calculation of various indexes of repeatability, precision, and deviation by the assessors [4]. In the food industry, the sensory information of a product is essential, but it is very difficult and time-consuming to implement a suitably trained and validated sampling panel [9,10]. A system allowing the measuring of the sensory quality of a food in an objective manner, without the need for a sampling panel, would reduce the variability associated with human perception and the time needed for carrying out this kind of analysis [11].
It would be of great interest to be able to replace sensory evaluation with faster and simpler instrumental analysis. In this way, near-infrared spectroscopy (NIRS) is an objective and non-destructive method that has been used to predict the quality parameters of different foodstuffs and it had been evaluated for being implemented in dry-cured ham manufacture [12]. This method can be very useful for testing bulk material with little or no sample preparation. The chemical profile obtained by NIR can be successfully linked to specific sensory attributes for expanded snacks [13], for the evaluation and classification of cooked ham [14], for the prediction of lamb meat tenderness assessed by sensory analysis [15], and for the prediction of some quality defects of dry-cured ham samples [16].
However, as NIRS data requires complex statistical treatment, chemometrics has become an established technique for handling this type of data. Among chemometric methods, artificial neural networks (ANNs) are a well-known mathematical tool which is widely used together with the NIR technique in the case of many problems in meat production and technology such as the quality control of raw material, meat processing, shelf-life evaluation, detecting off-flavors, or authenticity assessment [17]. Artificial intelligence methods were mainly investigated for the assessment of meat sensory qualities such as the tenderness, color, or marbling score/level [18]. In relation to dry-cured ham, ANNs have been used for the classification of hams according to the maturation time [19], the identification of feeding and the ripening time of ham [20], and for the assessment of the curing of hams [21]. To our knowledge, there is no data in the literature on the prediction of sensory attributes in dry-cured ham based on NIR information by ANNs.
Taking into account the economic importance of dry-cured ham, the prediction of its sensory characteristics by means of a rapid instrumental technique is an interesting challenge. The aim of this study was to examine the feasibility of using artificial neural networks for predicting ham sensory parameters. Several algorithms, the number of neurons in the hidden layer, and the initial configuration have been tested in order to ascertain the best ANN architecture for predicting the sensory parameters.

2. Materials and Methods

2.1. Samples

A total of 91 samples of cured ham were analyzed. All the samples were of the fat-marbled part known as “la maza” which is the largest and tastiest part of the ham. The samples were obtained by cutting with a knife along a line passing through the thickest part of dry-cured hams as described by González-Casado et al. [4]. The production and maturation of the samples was carried out in Guijuelo in the province of Salamanca in the traditional manner over 24 months. The ham samples were selected to represent the greatest possible variability within products denominated Spanish Iberian dry-cured ham. Hams were therefore analyzed from pigs with “100% Iberian” genetics together with hams denominated “Iberian” from animals with at least 50% of their genetic makeup corresponding to the Iberian breed of pig, obtained from crossing Iberian mothers with Duroc fathers The samples analyzed included hams from the montanera, from animals fattened extensively with acorns and pasture for 90 days prior to slaughter, and fodder-fed ham from animals fed on commercial feed and pasture in an extensive system. In keeping with these parameters the distribution of the samples analyzed was as follows: 13 samples from 100% Iberian animals fed in montanera (IM), 53 samples of Iberian animals fed in montanera (CM), and 25 samples of fodder-fed Iberian animals (CC).
Once they have been cut the samples are vacuum-packed until they come to be analyzed. The packages were opened 1 h before being tested by the panel.

2.2. Sensory Evaluation

Ten assessors (aged from 20 to 50) participated in the study. All of them had previous experience in quantitative descriptive analysis (QDA) of dry-cured hams and were staff at the University of Salamanca. The training was carried out by using products of reference so as to stimulate the generation of terminology during 5 sessions. The assessors did not discuss data, terminology, or samples after each taste session; feedback was provided by the facilitator based on the statistical analysis of the taste session data [22]. The attributes selected for visual appearance, flavor, and texture description of the sample are shown in Table 1. A structured scoring scale was used in which 0 indicated the absence and 9 the high intensity of the attribute. The accuracy of the panel was assessed by studying its reproducibility and repeatability as a whole according to the methodology described by Pérez-Elortondo et al. [23]. To do this, the same ham is analyzed twice in the same session and again in a later session.
Four samples per session were analyzed and a total of 25 sessions were held. Samples were coded with three-digit random numbers and individually presented to the assessor. The average score of the ten assessors for each sample was recorded and used in the statistical analysis. In order to analyze the data, a two-way ANOVA and a post-hoc test (Tukey) were carried out to check for significant differences between samples. In order to investigate the relationship between the two attributes, the Pearson correlation coefficients have been calculated.

2.3. NIR-Chemometric Methods

The near-infrared spectra of the samples were obtained using a Foss NIRSystem 500 (Hillerod, Denmark). This equipment was coupled with a fiber-optic probe (1.5 m 210/210, Ref. No. R6539-A) and a 5 cm × 5 cm window quartz. The window was applied to the surface of ham directly without any preparation. The Foss NIRSystem 500 is equipped with four reflectance detectors (PBs elements) that, in order to minimize the specular reflectance, are placed at a 45° angle to the sample surface. The reference of the probe is a ceramic plate. The spectra of the sample were recorded in the 1100–2000 nm range at intervals of 2 nm, which means that a total of 451 pieces of reflectance data were obtained for each sample. The spectra above 2000 nm were not recorded as the OH groups that may be present in the optical fiber produce a significant attenuation of the signal. For each recording, 32 scans were performed for both the reference and sample. Indeed, all the samples were analyzed in triplicate to minimize sampling errors. The spectra of each sample were averaged and the logarithm of the reciprocal of the reflectance values was calculated to transform it into absorbance (A = log 1/R).

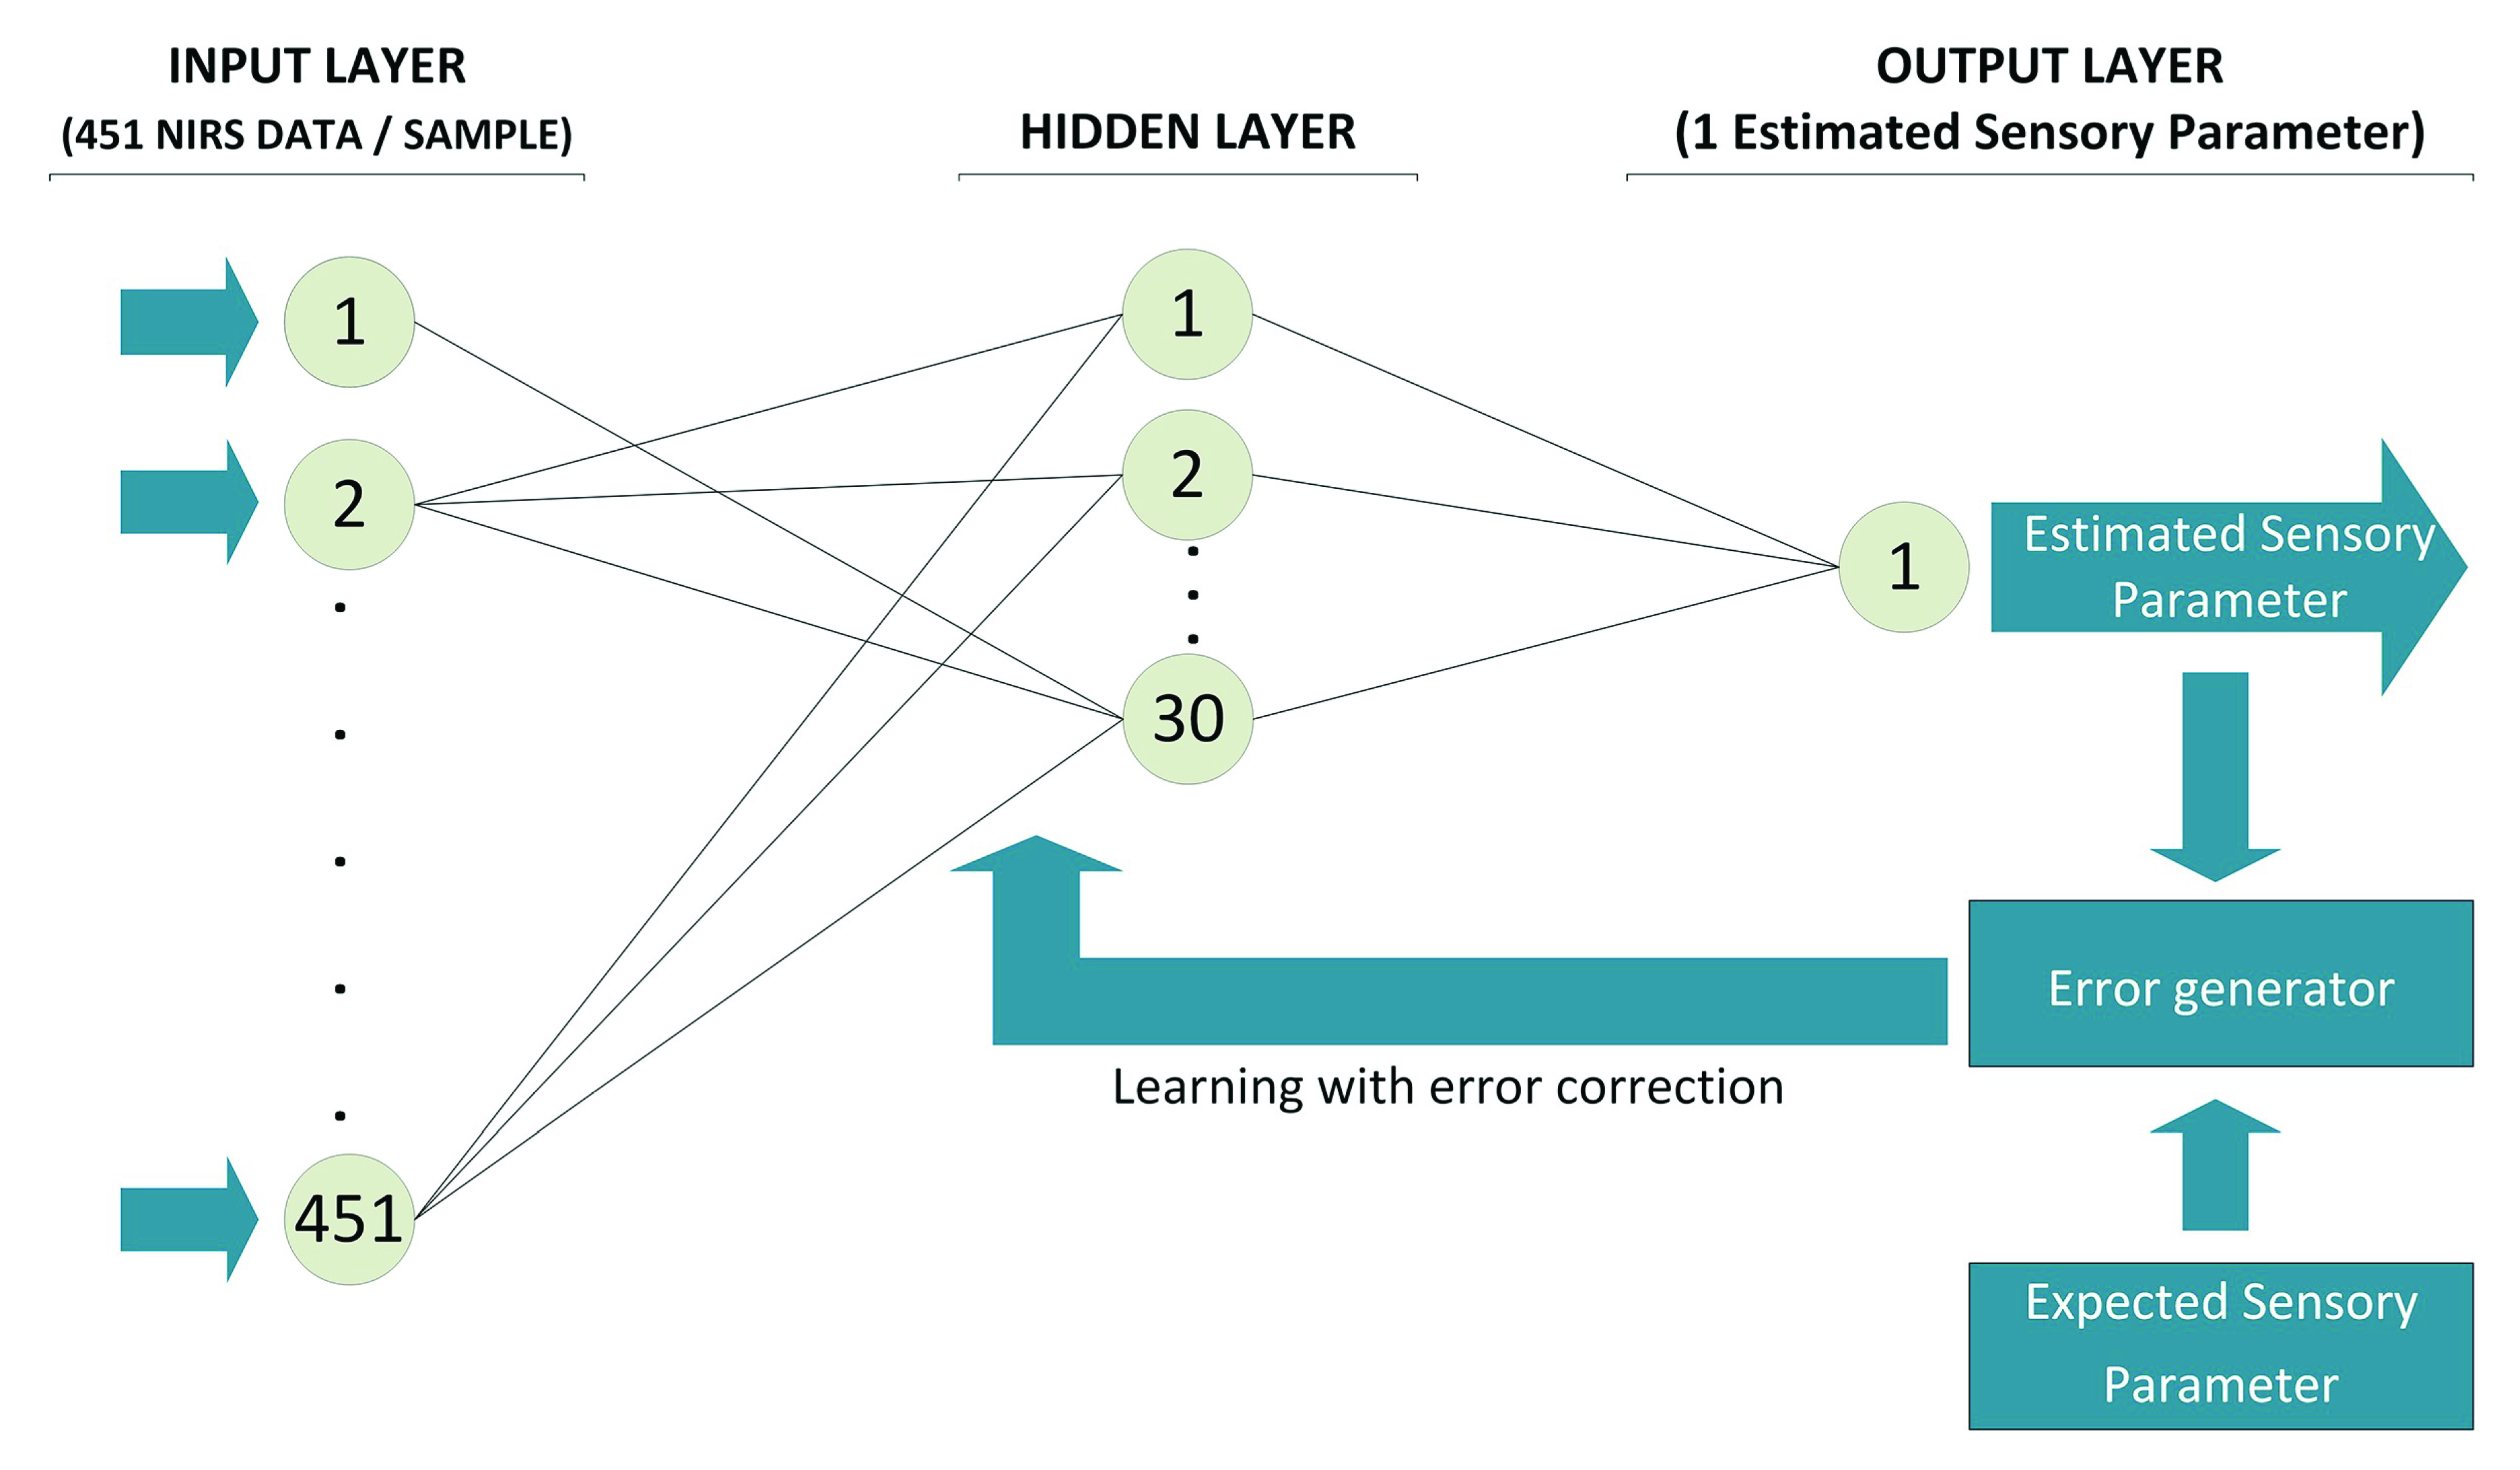
2.4. Artificial Neural Network

The multilayer perceptron (MLP) feedforward artificial neural network (ANN) was used for processing the absorbance values obtained. The 451 values of NIR absorbance feed the input layer which had 451 neurons. The hidden layer has a variable number of neurons between 1 and 30 depending on the sensory parameter predicted and used the hyperbolic tangent sigmoid function. The output layer used the pure linear transfer function and has only one neuron. This neuron shows the estimated value of one of the sensory parameters. The use of a known seed value number to randomly initialize the weight and bias matrix allows us the reproducibility of data [24]. The pairs of NIRS-sensory data, i.e., input-output data, were randomly divided for all ANNs into three sets as follows: training, validation, and test set that accounts for the 70%, 15%, and 15% of the data respectively. Then, 28 ANN architectures, one for each of the sensory parameters, were optimized. Tests were carried out with the Scaled Conjugate Gradient Backpropagation and Levenberg–Marquardt Backpropagation training algorithms. The Deep Learning Toolbox of MatLab (MathWorks®) in its R2018 version was the software used for all the tests.

3. Results

3.1. Sensory Analysis

Sensory analysis is referred to as the evaluating of perceptible characteristics or organoleptic properties of ham termed as “attributes”. The technique used for the sensory characterization of ham was the quantitative descriptive analysis (QDA), which is the technique most frequently used with training panels to describe the sensory properties of different types of dry-cured ham [25,26,27]. In the case of dry-cured ham, the sensory attributes are the result of the interaction between the quality of the fresh material and the biological changes which occur during the processing [28,29], which are influenced by both the technological process and the duration of the maturation [30]. The results obtained in the tasting sessions for each of the attributes described in this study can be seen in Table 2.
As far as the appearance profile is concerned, the attributes of veined, fat color, color intensity, exudate, and white dots present statistically significant differences (p < 0.05) which depend on the type of ham analyzed. Hams from IM pigs therefore gave lower scores for the attributes of veineds, fat color, exudate, and white dots. For the first two attributes, the maximum scores corresponded to CC hams while for the exudate and white dots CM hams obtained the highest scores. For all these parameters both the feeding and genetics of the animals had a significant influence on the scores awarded by the samplers. All the samples analyzed in this study are from Iberian pigs, either 100% pure or crossed at 75 or 50%; a characteristic of this breed is a high intramuscular fat (IMF) content owing to both the rearing system and the genetic features of the pig breed [31]. The high content in muscular fat has been related to the veined and exudate parameters [32,33]. In this study, higher values of these parameters were found for crossbred samples (CM and CC). A higher color intensity was found in animals fed in montanera (IM and CM) related to greater exercise and to yellower fat which was probably due to the higher unsaturation of the fat. Color homogeneity is the only visual attribute which presents no significant differences between the groups. This attribute is more closely related to the dry-curing process, which includes the origin of the formation of compounds associated with the characteristic color of dry-cured meat products [34].
In relation to flavor, all parameters have shown statistically significant differences between the three groups of hams analyzed except for the parameters of atypical aroma, sourness, and saltiness. These parameters are associated with defects present in cured hams and appear to be related to the technological processes and maturation conditions of the product. CM hams showed the highest values of odor, flavor intensity, fat flavor intensity, cured flavor, sweetness, and aftertaste, while CC hams showed in general the lowest values of the same parameters with the exception of fat flavor intensity which was lower in IM hams.
The factors of feeding and genetics of the animal have a different influence according to the attributes; only odor, flavor intensity, cured flavor, and aftertaste presented significant differences for both factors. Therefore, feeding had a significant influence on the parameters of cured aroma, pig aroma, sweetness, and aftertaste while genetics had a significant influence regarding rancidity, aroma and flavor, fat flavor, and atypical flavor. Lipolysis and proteolysis are the main biochemical reactions involved in the generation of a wide range of volatile compounds [35,36]. The fat present in both the muscles and the subcutaneous tissue appears to be of great importance in the entire flavor of Iberian hams and means that the flavor of this type of product is highly complex. The volatile compounds which contribute towards the odor and flavor of dry-cured ham are mainly generated during the maturation process from the oxidation of the fatty acids and Maillard reactions [37]. To a lesser extent, volatile compounds are formed from mold and yeast and Iberian ham has a particularly high concentration [38]. There are also a small number of compounds which are directly accumulated in pig fat deposits from feeding [39], which would justify the low number of parameters with significant differences which can be directly attributed either to the different genetic purity or to the feeding system of the pigs.
The results obtained in the texture parameters show that chewiness, gumminess, and heterogeneity are the only attributes which do not present significant differences in the scores awarded by the assessors for the three groups of hams analyzed. IM hams have the lowest scores in the attributes of juiciness and fatness and the highest in the attributes of hardness and chewing residue. High intramuscular fat (IMF) content thus appears to have a very remarkable effect on the texture of dry-cured ham [32], increasing the juiciness and decreasing the hardness and fibrousness [32,39]. In our study, we found a correlation between the veined and texture parameters. The lower the veined value the lower the juiciness and fatness and the higher the hardness. During the processing of dry-cured ham proteolysis, that is affected by an important number of factors such as pH of fresh ham, anatomic location, temperature, water, or salt content [40,41,42], is one of the main biochemical reactions. In fact, proteolysis is considered to be the major contributor to texture changes [43,44].
Previous studies suggest that the color of Spanish dry-cured hams has a strong correlation with their texture [45]. From our results, a negative correlation (at the 0.01 level) can be observed between the attributes of color fat and color homogeneity and the parameters of texture: hardness, chewiness, gumminess, heterogeneity and chewing residue. Likewise, they show a positive correlation with the fatness attribute. For its part, the color intensity attribute presents no correlations with any of the texture parameters analyzed.

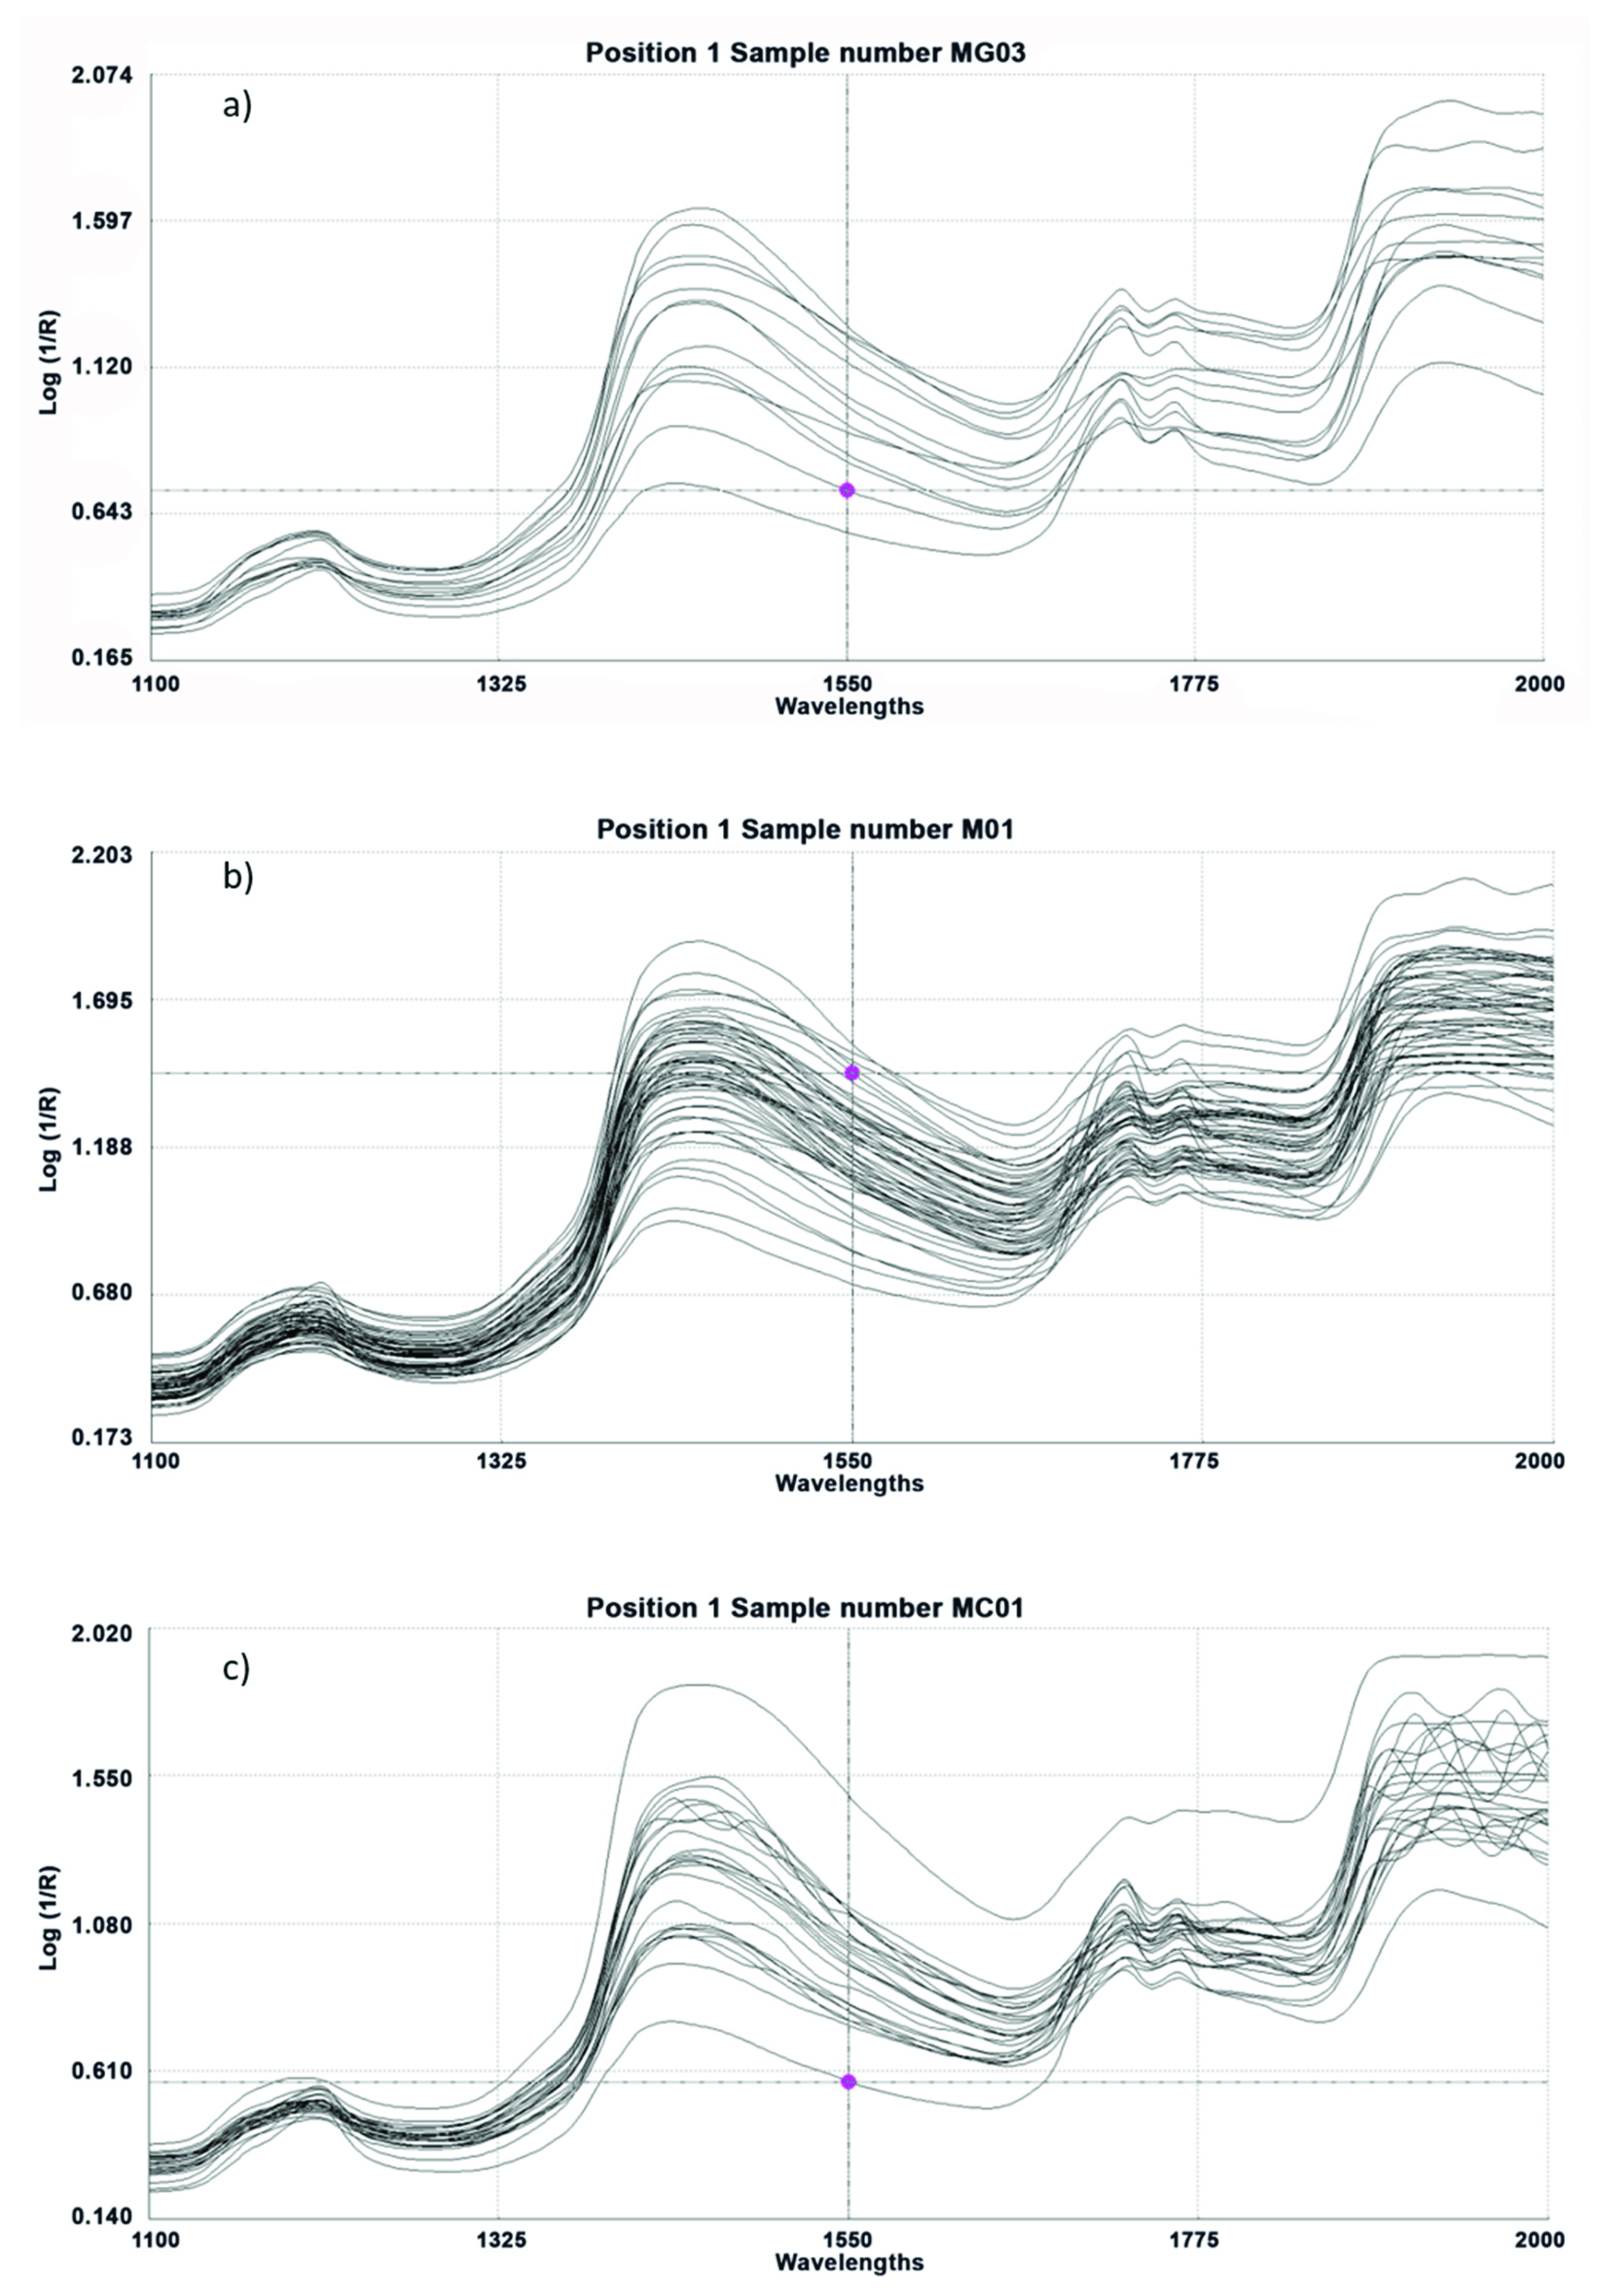
3.2. Spectral Characteristics

In the ham samples analyzed by the assessors, the register of their spectra was carried out by using NIRS technology and a remote reflectance fiber-optic probe. The mean spectral curves of the registered samples are shown in Figure 1.
The wavelengths responsible for the NIR are due to C-H stretching combinations with other vibrational modes, in addition to the strong absorptions shown by the molecules containing N-H, S-H, and P-H. In this way, the NIR spectra obtained allow us to establish a relationship between different chemical molecules and functional groups and the sensory parameters analyzed in the ham. Group C-oil is therefore strongly related to the perception of the saltiness and fatness of the ham and group C-Cl is related to saltiness and rancidity. Group C-O-oil is related to the fibrousness of the product and group SH-SH is strongly related to texture parameters such as fibrousness, chewiness, and gumminess. In addition to these chemical groups which provide greater weight and higher correlation coefficients in the NIR predictive models, we have been able to relate other groups with some of the sensory attributes analyzed as is shown in Table 3.

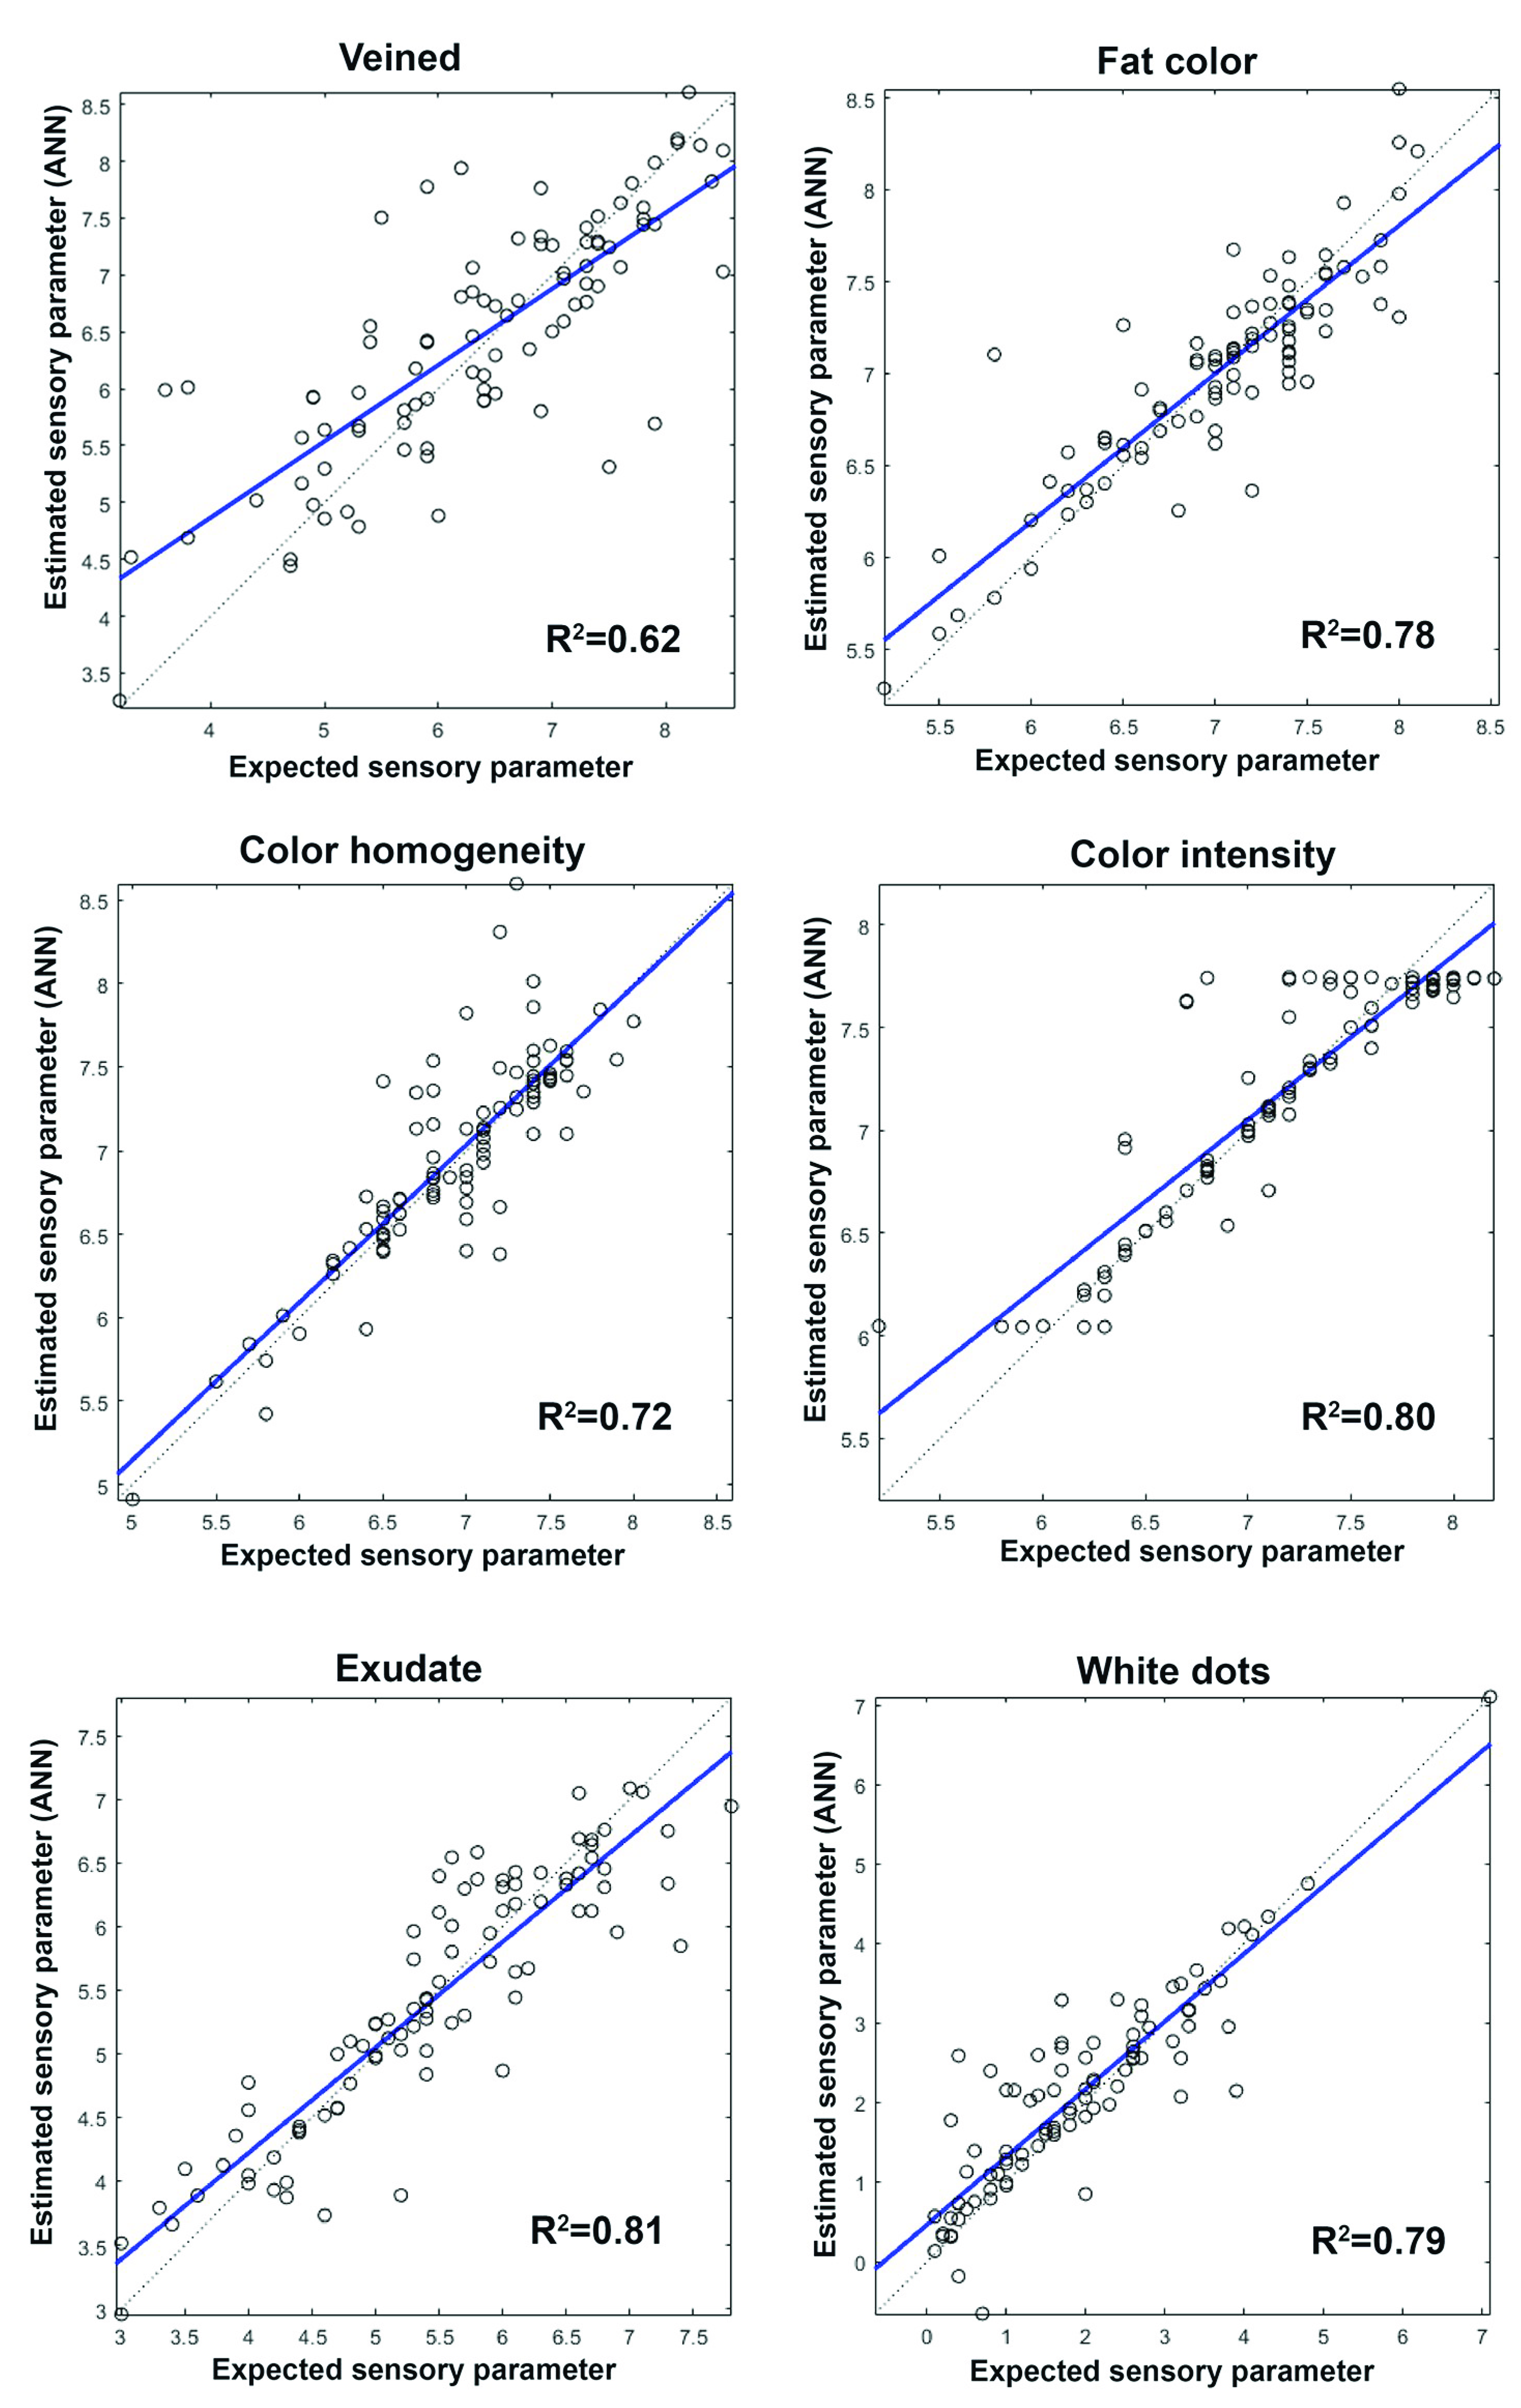
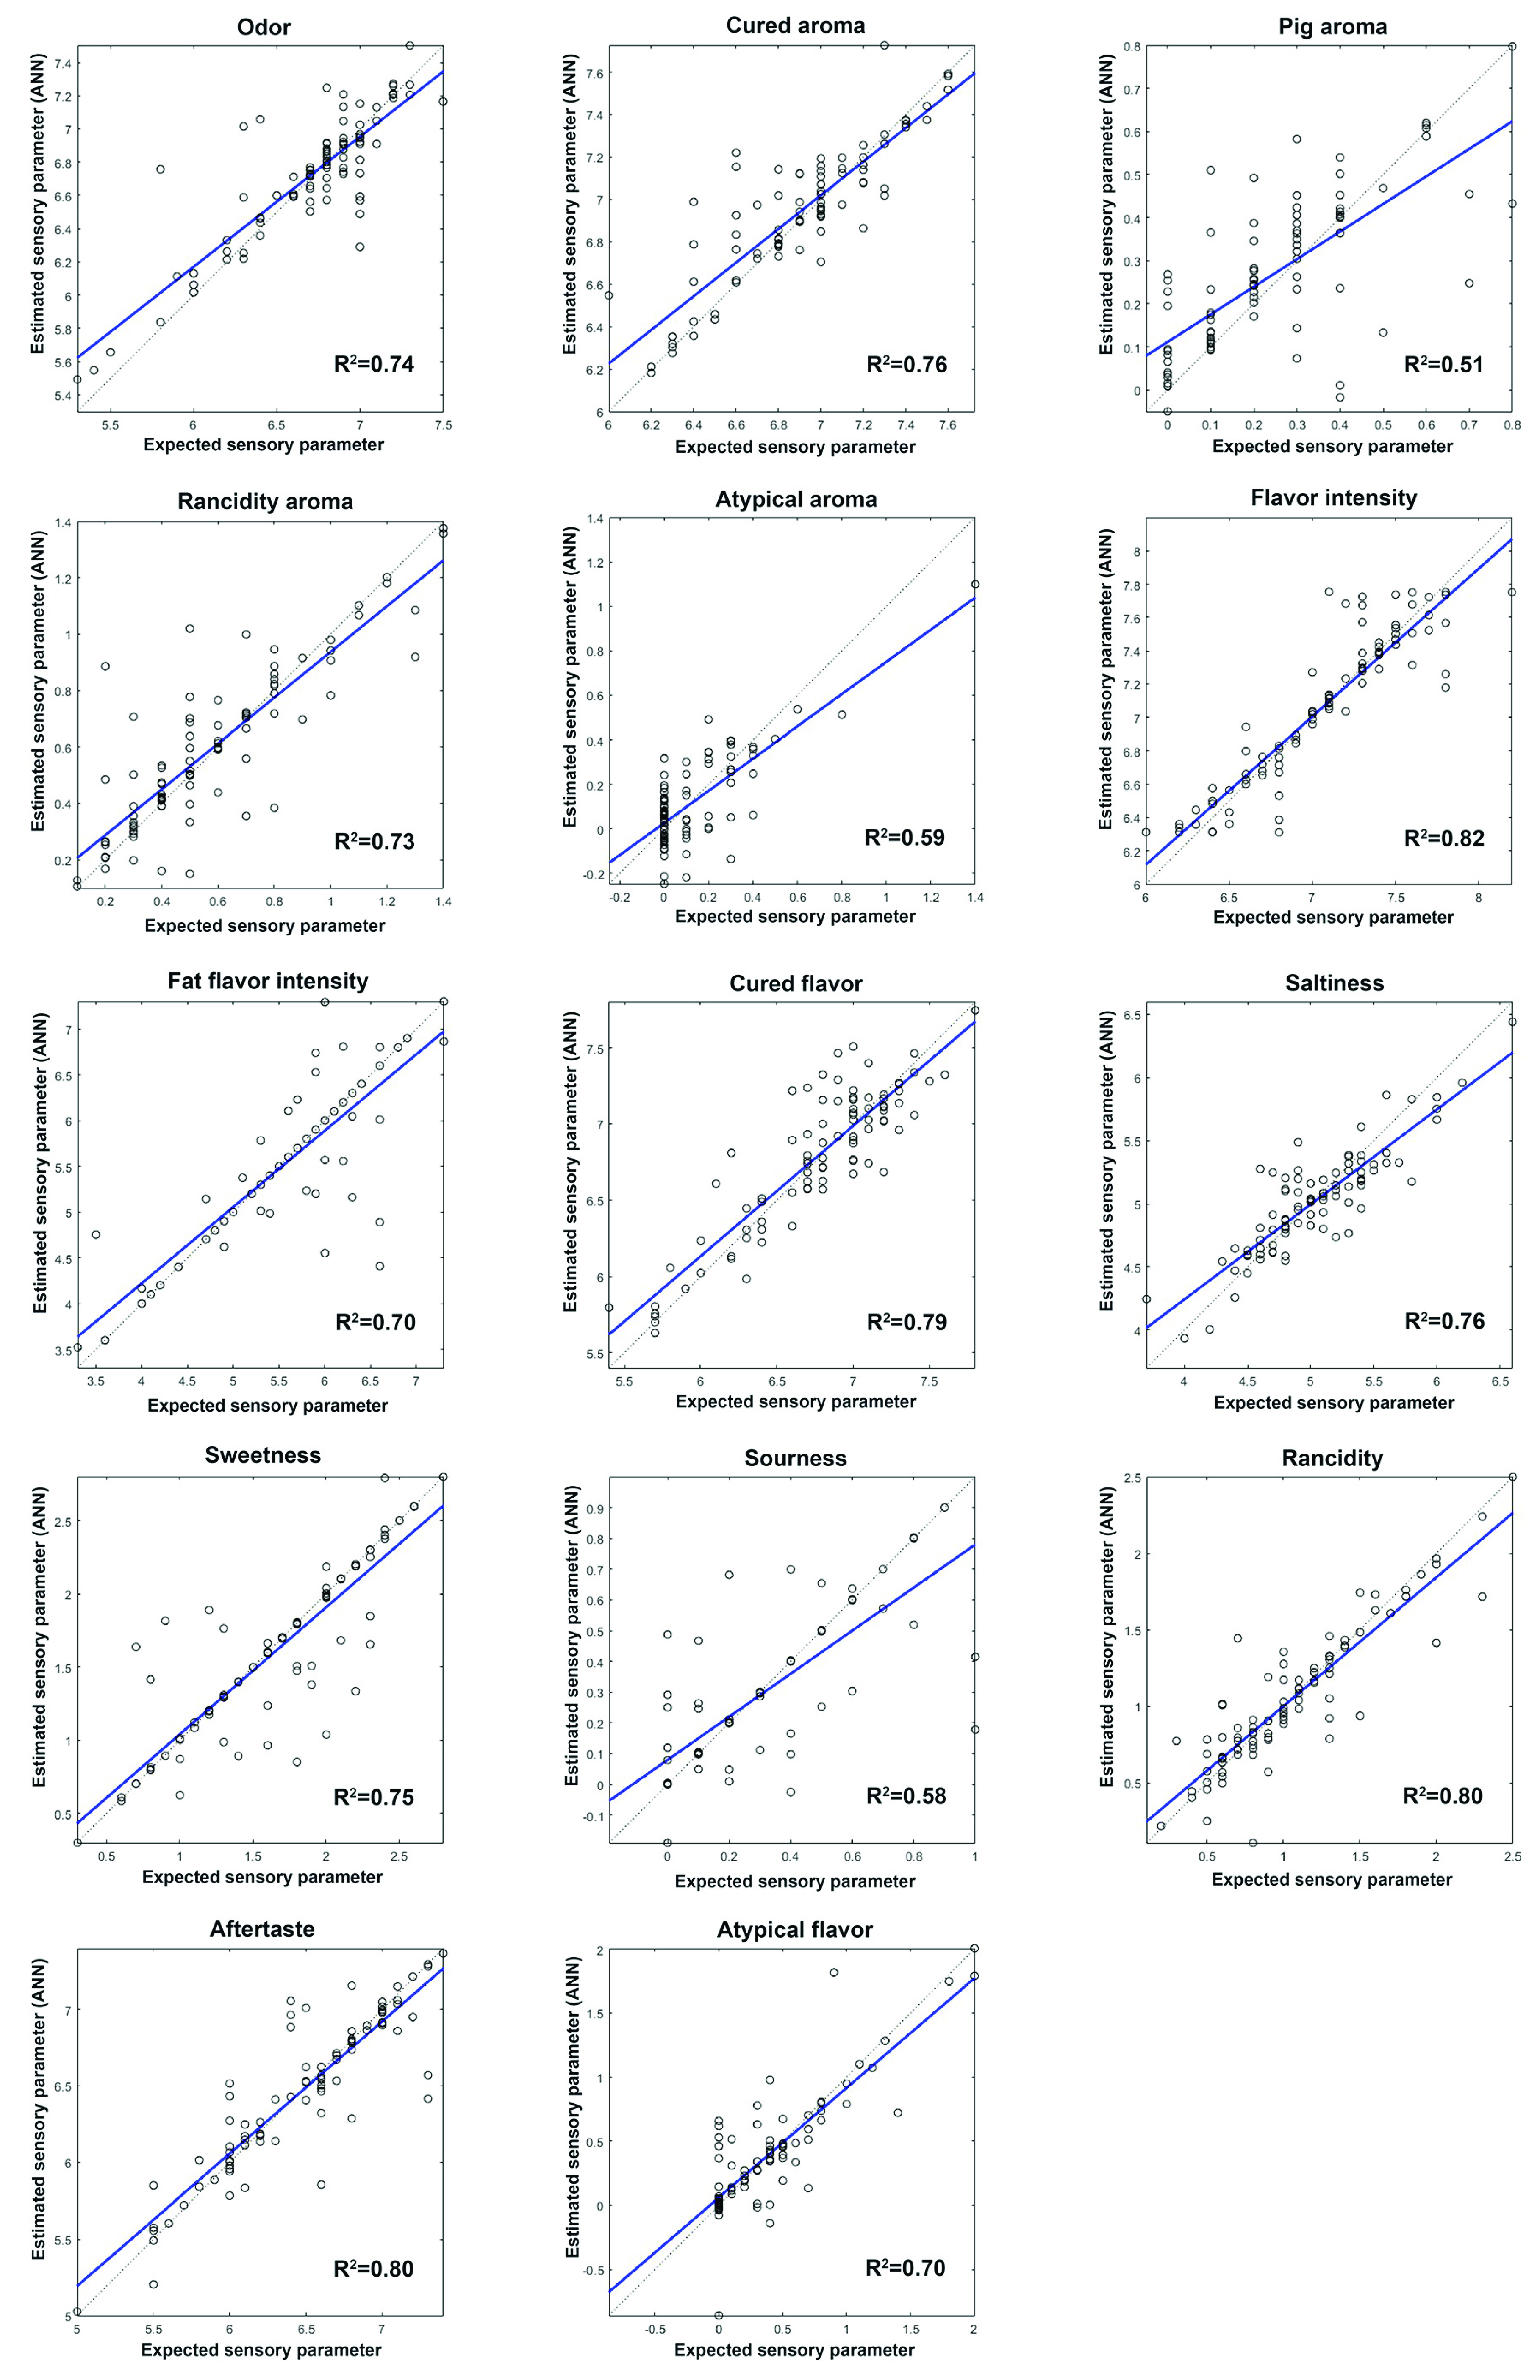
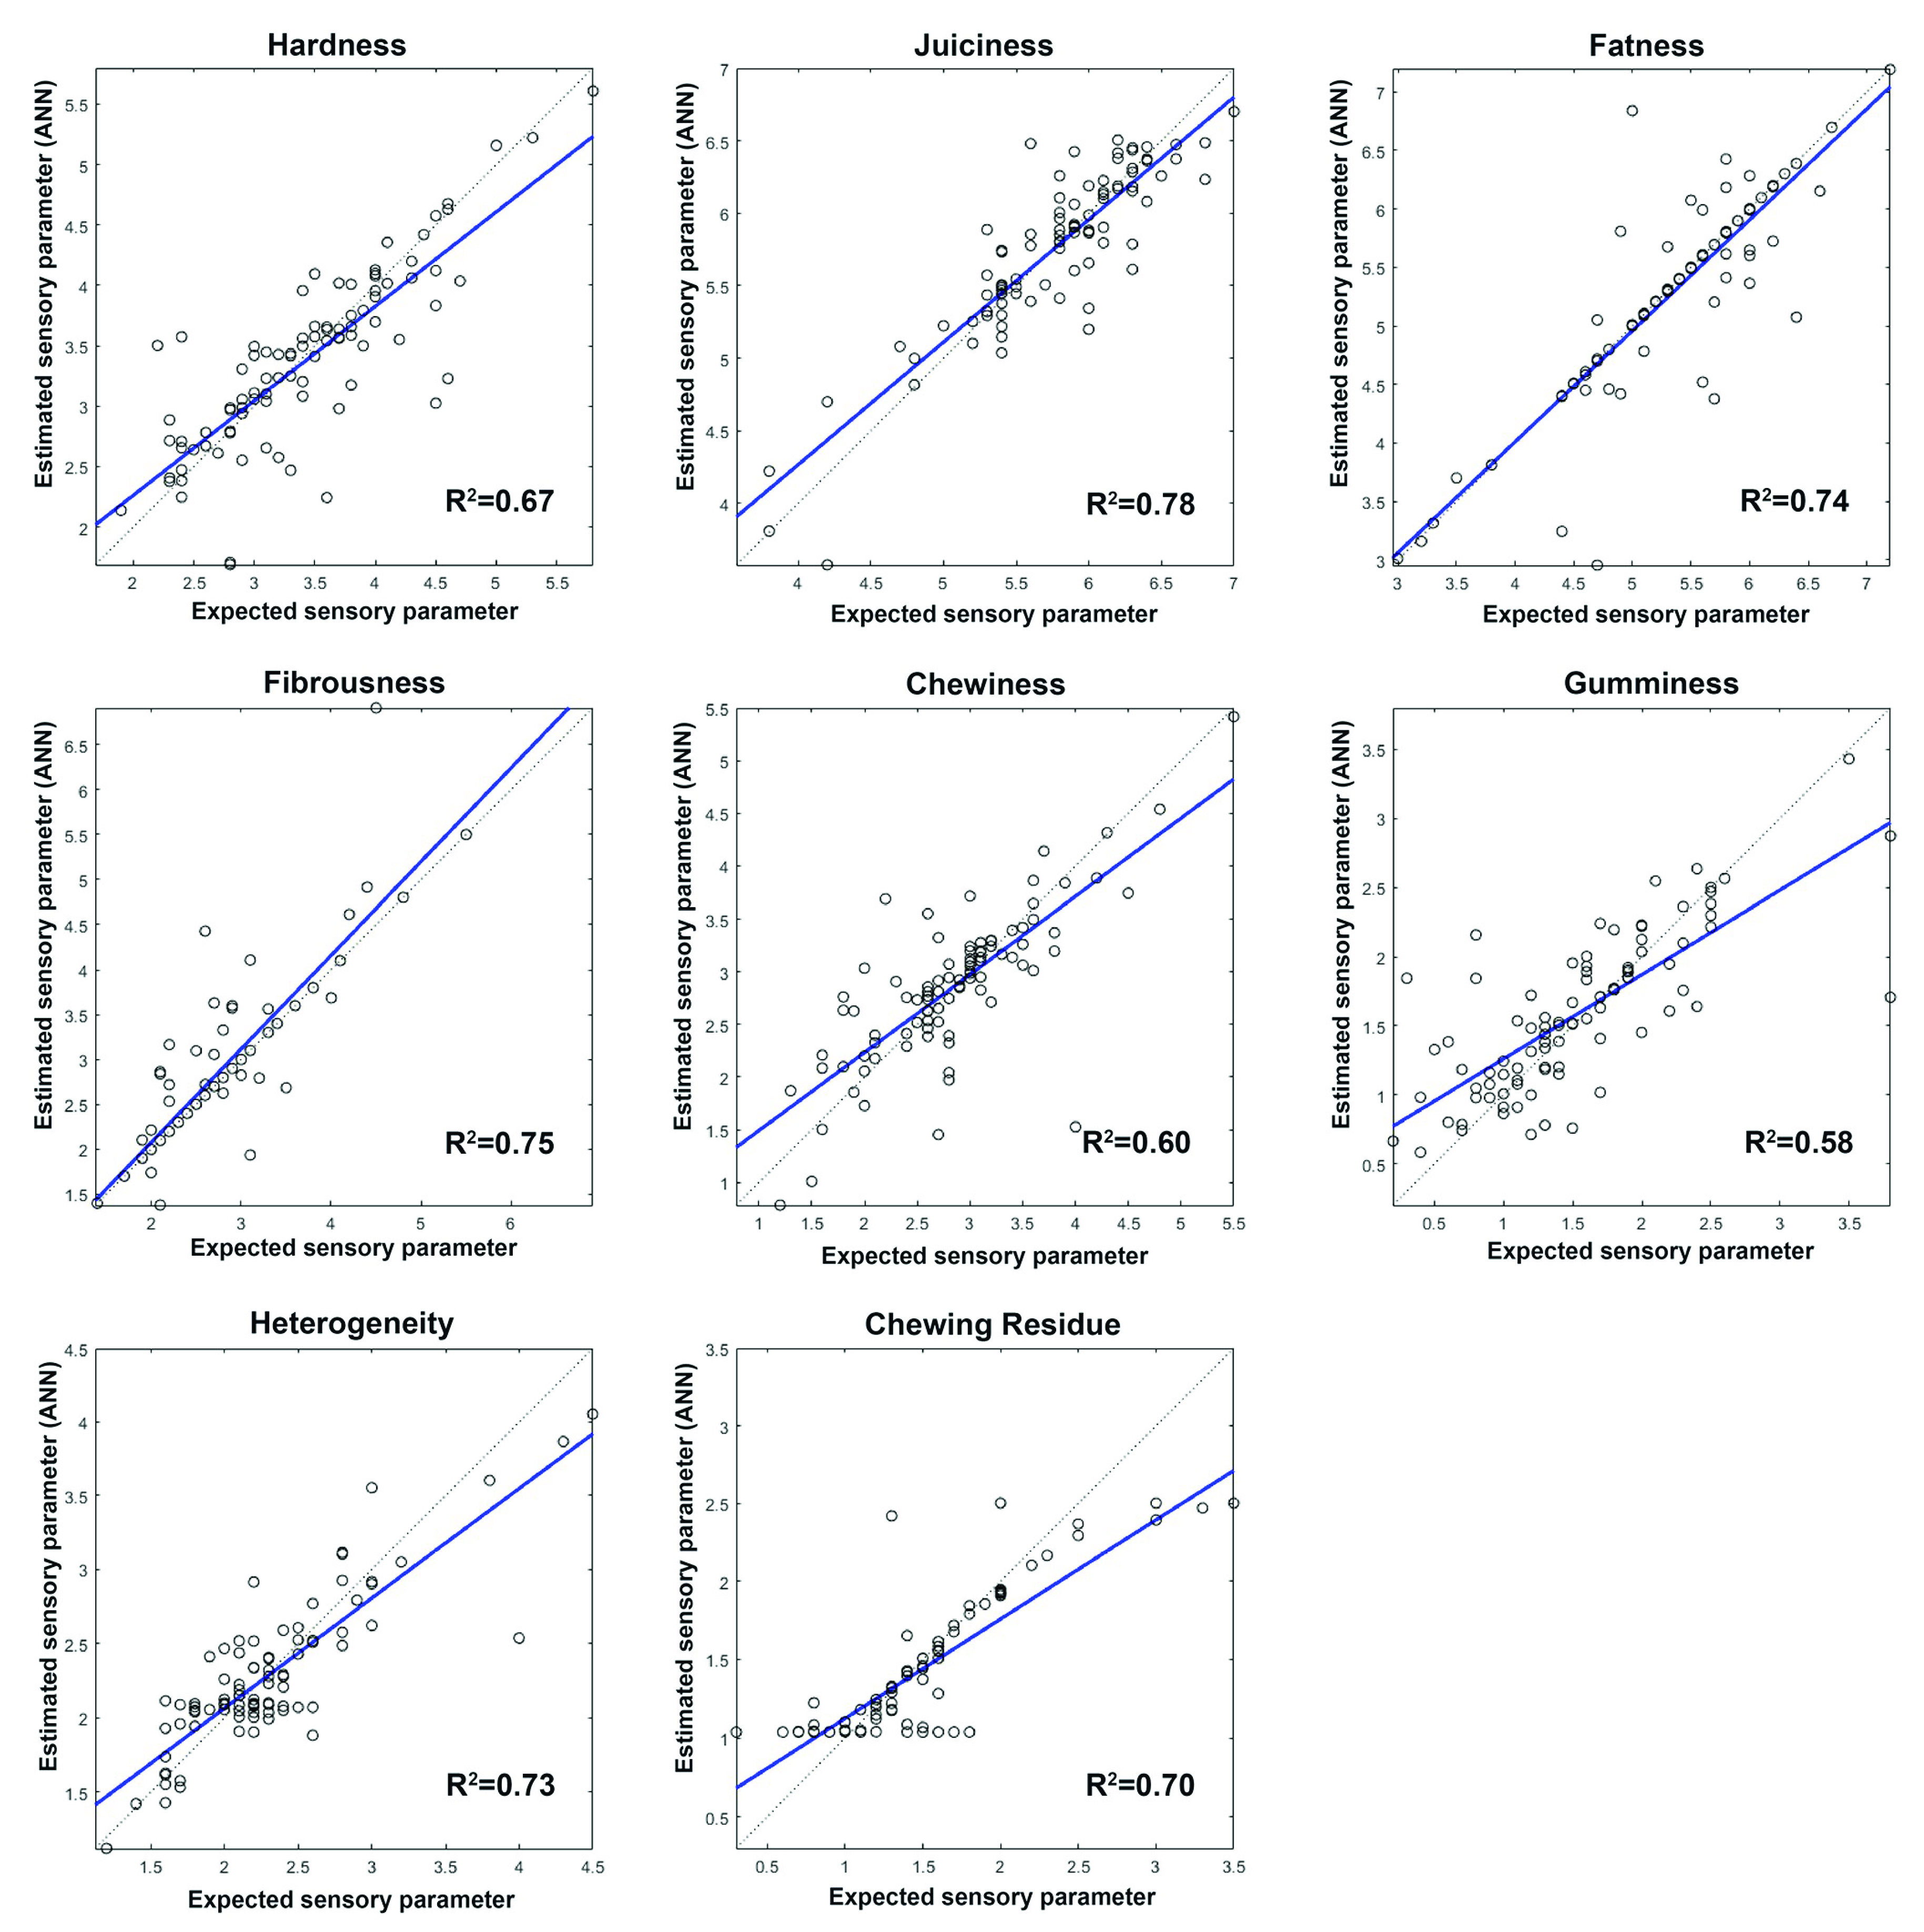
3.3. Artificial Neural Network (ANN)

The results obtained in the sensory analysis of the hams presented in this study allow the availability of sufficiently heterogeneous products, owing to which we have a satisfactory sample for assessing the application of neuronal networks in the prediction of the same. ANNs become useful in those cases in which the rules underlying the data are unknown or only partially known [17].
The neural networks tested were constructed by using the NIR spectra and the sensory parameters such as input and output data respectively. The diagram of the network structure used is shown in Figure 2.
The input data were the values obtained from NIR spectra. A total of 451 reflectance data for each sample, corresponding to the 451 log 1/R values obtained between 1100 and 2000 nm were measured every 2 nm. In turn, each register is the result of the measurement of the NIR spectrum at 32 different points of that sample. As output data, we used the average values of the sensory parameters provided by the assessors for each of the sensory parameters analyzed.
Although the ANN technique has many advantages, model users always spend a great deal of time and effort in the process of parameter training. Identifying the optimum parameters of ANNs can help us avoid an unnecessary waste of time and effort [46]. For this reason, an attempt was made to assess the training algorithm and the network architecture in order to predict dry-cured ham sensory analysis. The ANN training algorithms Scaled Conjugate Gradient (SGC) and Levenberg-Marquardt (LM) were examined. For each of them between 1 and 30 neurons were tested in the hidden layer. In total 1500 networks were analyzed, 30 different values of neurons in the hidden layer with 50 different initial states for each of them. The suitability of the networks obtained was established from the value R2 (the R-square between the target and the estimated parameter). For each sensory parameter, the networks with a value exceeding R2 > 0.72 in the test set were taken into account, which gives an idea of the number of networks generated with the capacity for predicting this parameter. The results obtained reveal that the parameter with the largest number of networks capable of predicting it were heterogeneity (26.4% of the networks) followed by the parameters of sourness (13.4%), atypical flavor (9.5%), and odor (7.0%). The LM training algorithm allowed the finding of networks for the prediction of all the sensory parameters and was the one providing the largest number of networks with R2 > 0.72.
The number of neurons in the hidden layer should be between the input and the output layer size and be determined empirically [47,48]. Networks with from 1 to 30 neurons and three different number of training times (30, 100, and 500) were tested. Table 4 shows the number of neurons providing the best ANN architecture (in terms of obtaining the highest R2) for each number of training times assessed. The results show that when the training times increase the number of neurons in the hidden layer necessary for obtaining the network with the highest R2 falls, in such a way that in the case of 100 and 500 training times it will not be necessary to test a number of neurons higher than 10 in the hidden layer. The optimum number of neurons in the hidden layer and training times was different for each of the sensory parameters analyzed in the ham. Owing to the variability of the results it was decided to assess the sensitivity of the parameters of ANN architecture. Following the model proposed by [46] to identify the sensitivity of parameters of ANN architecture, the sensitivity index (S) was calculated.
Our results show that there is a direct relationship between the number of neurons in the hidden layer and the number of training times and the R2 for all the parameters analyzed with the exception of the “rancidity aroma.” According to our results, 23 of the 28 estimated sensory parameters in dry-cured ham are more sensitive to the number of neurons in the hidden layer than the number of training times in ANN architecture. Only the visual color intensity parameter, the flavor intensity and atypical flavor parameters, and the juiciness and chewing residue texture parameters show more sensitivity to the training times.
Once the best network architecture had been established, the sensory parameters of dry ham were predicted. Figure 3, Figure 4 and Figure 5 show the prediction graphs and the R2 values and the adjustment lines obtained. The R2 values obtained vary between 0.51 for the pig aroma parameter to 0.82 for the flavor intensity parameter.
As far as the appearance profiles (Figure 3) are concerned, all of them show a satisfactory correlation between the target and the values predicted by the network. In relation to the odor and flavor of dry-cured hams (Figure 4), the values with the highest correlation were aftertaste, rancidity, and flavor intensity. The results obtained for the texture parameters (Figure 5) show that juiciness, fatness, and fibrousness provide the networks with the best adjustments. Of the 28 sensory parameters analyzed no relation was found between the prediction capacity of the network and the significant differences in the values given by the assessors, whether owing to the purity effect of the breed or to the feeding effect.
The prediction network generated was further tested with 14 samples of ham (a set test) which were neither part of the training nor the validation set. The mean squared errors (MSEs) between the targets and the ANN outputs were assessed (Table 5). The MSEs found varied between 0.0196 and 0.5878; the highest errors occurred in the prediction of the texture and visual parameters. The best results in the prediction of sensory parameters were obtained for the parameters related to flavor. The lower prediction capacity of the network could be seen in the attributes of pig aroma, atypical aroma, sourness, and gumminess with an R2 between 0.51 and 0.59 (Figure 4 and Figure 5). However, when the network generated was checked against the set test the number of errors made by the network in the prediction of these parameters is low. The values obtained in all the sensory parameters analyzed suggest that the network generated can be applied satisfactorily to unknown samples.

4. Conclusions

The results obtained in this study allow us to conclude that NIR spectral information and the application of ANNs could be an interesting tool for predicting the sensory parameters of dry-cured hams. The sensory analysis of ham requires a great investment of time and a trained panel to carry it out. With the methodology proposed it would be possible to predict the sensory parameters of the ham at the same time as it is sliced. The results showed that these models have the ability to predict the most important sensory parameters for dry-cured ham with relatively high accuracy. Future studies with greater heterogeneity of samples will be necessary to improve the results obtained for some sensory parameters.

Author Contributions

Conceptualization, I.R. and A.M.V.-Q.; methodology, M.I.G.-M.; validation, M.H.-J. and P.H.-R.; writing—original draft preparation, M.I.G.-M.; writing—review and editing, I.R. and A.M.V.-Q.; visualization, I.M.-M.; supervision project administration, I.R. All authors have read and agreed to the published version of the manuscript.

Funding

This study was made possible by the funds jointly provided for the research project by the Junta de Castilla and León and the European Regional Development Fund (SA039P17).

Conflicts of Interest

The authors declare no conflict of interest.

References

  1. Ventanas, S.; Ventanas, J.; Ruiz, J. Sensory characteristics of Iberian dry-cured loins: Influence of crossbreeding and rearing system. Meat Sci. 2007, 75, 211–219. [Google Scholar] [CrossRef]
  2. Guàrdia, M.D.; Aguiar, A.P.S.; Claret, A.; Arnau, J.; Guerrero, L. Sensory characterization of dry-cured ham using free-choice profiling. Food Qual. Prefer. 2010, 21, 148–155. [Google Scholar] [CrossRef]
  3. Lorido, L.; Hort, J.; Estévez, M.; Ventanas, S. Reporting the sensory properties of dry-cured ham using a new language: Time intensity (TI) and temporal dominance of sensations (TDS). Meat Sci. 2016, 121, 166–174. [Google Scholar] [CrossRef] [PubMed]
  4. González-Casado, A.; Jiménez-Carvelo, A.M.; Cuadros-Rodríguez, L. Sensory quality control of dry-cured ham: A comprehensive methodology for sensory panel qualification and method validation. Meat Sci. 2019, 149, 149–155. [Google Scholar] [CrossRef] [PubMed]
  5. Lorido, L.; Pizarro, E.; Estévez, M.; Ventanas, S. Emotional responses to the consumption of dry-cured hams by Spanish consumers: A temporal approach. Meat Sci. 2019, 149, 126–133. [Google Scholar] [CrossRef]
  6. Dos Santos Navarro da Silva, R.C.; Rodrigues Minim, V.P.; Navarro da Silva, A.; Arruda Gonçalves, A.C.; Souza Carneiro, J.d.D.; Iamim Gomide, A.; Della Lucia, S.M.; Minim, L.A. Validation of Optimized Descriptive Profile (ODP) technique: Accuracy, precision and robustness. Food Res. Int. 2014, 66, 445–453. [Google Scholar] [CrossRef]
  7. Elía, M. A Procedure for Sensory Evaluation of Bread: Protocol Developed by a Trained Panel. J. Sens. Stud. 2011, 26, 269–277. [Google Scholar] [CrossRef]
  8. Carlucci, A.; Monteleone, E. Statistical validation of sensory data: A study on wine. J. Sci. Food Agric. 2001, 81, 751–758. [Google Scholar] [CrossRef]
  9. Martens, H.; Martens, M. Multivariate Analysis of Quality. An Introduction; John Wiley & Sons Ltd.: Chichester, UK, 2001. [Google Scholar]
  10. Thybo, A.; Bechmann, I.; Martens, M.; Engelsen, S. Prediction of sensory texture quality of cooked potatoes from the raw material using uniaxial compression, near infrared (NIR) spectroscopy and low field 1H NMR spectroscopy using chemometrics. Food Sci. Technol. 2000, 33, 103–111. [Google Scholar] [CrossRef]
  11. Iqbal, A.; Sun, D.-W.; Allen, P. An overview on principle, techniques and application of hyperspectral imaging with special reference to ham quality evaluation and control. Food Control. 2014, 46, 242–254. [Google Scholar] [CrossRef]
  12. Pérez-Santaescolástica, C.; Fraeye, I.; Barba, F.J.; Gómez, B.; Tomasevic, I.; Romero, A.; Moreno, A.; Toldrá, F.; Lorenzo, J.M. Application of non-invasive technologies in dry-cured ham: An overview. Trends Food Sci. Technol. 2019, 86, 360–374. [Google Scholar] [CrossRef]
  13. Ramos-Diaz, J.M.; Rinnan, Â.; Jouppila, K. Application of NIR imaging to the study of expanded snacks containing amaranth, quinoa and kañiwa. LWT 2019, 102, 8–14. [Google Scholar] [CrossRef] [Green Version]
  14. Talens, P.; Mora, L.; Morsy, N.; Barbin, D.F.; ElMasry, G.; Sun, D.-W. Prediction of water and protein contents and quality classification of Spanish cooked ham using NIR hyperspectral imaging. J. Food Eng. 2013, 117, 272–280. [Google Scholar] [CrossRef]
  15. Kamruzzaman, M.; ElMasry, G.; Sun, D.-W.; Allen, P. Non-destructive assessment of instrumental and sensory tenderness of lamb meat using NIR hyperspectral imaging. Food Chem. 2013, 141, 389–396. [Google Scholar] [CrossRef] [PubMed]
  16. Ortiz, M.C.; Sarabia, L.; García-Rey, R.; Luque de Castro, M.D. Sensitivity and specificity of PLS-class modelling for five sensory characteristics of dry-cured ham using visible and near infrared spectroscopy. Anal. Chim. Acta 2006, 558, 125–131. [Google Scholar] [CrossRef]
  17. Prevolnik, M.; Čandek-Potokar, M.; Novič, M.; Škorjanc, D. An attempt to predict pork drip loss from pH and colour measurements or near infrared spectra using artificial neural networks. Meat Sci. 2009, 83, 405–411. [Google Scholar] [CrossRef]
  18. Prevolnik, M.; Škorjan, D.; Čandek-Potokar, M.; Novič, M. Application of Artificial Neural Networks in Meat Production and Technology. In Artificial Neural Networks-Industrial and Control Engineering Applications; Suzuki, K., Ed.; InTech: Rijeka, Croatia, 2011; pp. 223–240. [Google Scholar]
  19. Prevolnik, M.; Andronikov, D.; Žlender, B.; Font-i-Furnols, M.; Novič, M.; Škorjanc, D.; Čandek-Potokar, M. Classification of dry-cured hams according to the maturation time using near infrared spectra and artificial neural networks. Meat Sci. 2014, 96, 14–20. [Google Scholar] [CrossRef]
  20. Santos, J.P.; Garcia, M.; Aleixandre, M.; Horrillo, M.C.; Gutierrez, J.; Sayago, I.; Fernandez, M.J.; Ares, L. Electronic nose for the identification of pig feeding and ripening time in Iberian hams. Meat Sci. 2004, 66, 727–732. [Google Scholar] [CrossRef]
  21. Gil-Sánchez, L.; Garrigues, J.; Garcia-Breijo, E.; Grau, R.; Aliño, M.; Baigts, D.; Barat, J.M. Artificial neural networks (Fuzzy ARTMAP) analysis of the data obtained with an electronic tongue applied to a ham-curing process with different salt formulations. Appl. Soft Comput. 2015, 30, 421–429. [Google Scholar] [CrossRef]
  22. O’Sullivan, M.G.; Kerry, J.P. Improving the Sensory and Nutritional Quality of Fresh Meat; Woodhead Publishing Limited: Cambridge, UK, 2009; pp. 178–196. [Google Scholar]
  23. Pérez Elortondo, F.J.; Ojeda, M.; Albisu, M.; Salmerón, J.; Etayo, I.; Molina, M. Food quality certification: An approach for the development of accredited sensory evaluation methods. Food Qual. Prefer. 2007, 18, 425–439. [Google Scholar] [CrossRef]
  24. Pillonel, L.; Badertscher, R.; Casey, M.; Meyer, J.; Rossmann, A.; Schlichtherle-Cerny, H.; Tabacchi, R.; Bosset, J.O. Geographic origin of European Emmental cheese: Characterisation and descriptive statistics. Int. Dairy J. 2005, 15, 547–556. [Google Scholar] [CrossRef] [Green Version]
  25. Cilla, I.; Martínez, L.; Beltrán, J.A.; Roncalés, P. Dry-cured ham quality and acceptability as affected by the preservation system used for retail sale. Meat Sci. 2006, 73, 581–589. [Google Scholar] [CrossRef] [PubMed]
  26. García-González, D.L.; Roncales, P.; Cilla, I.; del Río, S.; Poma, J.P.; Aparicio, R. Interlaboratory evaluation of dry-cured hams (from France and Spain) by assessors from two different nationalities. Meat Sci. 2006, 73, 521–528. [Google Scholar] [CrossRef] [PubMed]
  27. Rousset, S.; Martin, J.-F. An Effective Hedonic Analysis Tool: Weak/Strong Points. J. Sens. Stud. 2001, 16, 643–661. [Google Scholar] [CrossRef]
  28. Arnau, J. Tecnología del jamón curado en distintos países. In El Jamón Curado: Tecnología y Análisis de Consumo: Simposio Especial, 44th ed.; Arnau, J.Y., Monfort, J.M., Eds.; Centro de Tecnología de la Carne (IRTA). Editorial Estrategias Alimentarias S.L.- EUROCARNE: Madrid, España, 1998; pp. 10–21. [Google Scholar]
  29. Vestergaard, C.S.; Schivazappa, C.; Virgili, R. Lipolysis in dry-cured ham maturation. Meat Sci. 2000, 55, 1–5. [Google Scholar] [CrossRef]
  30. Buscailhon, S.; Berdagué, J.L.; Bousset, J.; Cornet, M.; Gandemer, G.; Touraille, C.; Monin, G. Relations between compositional traits and sensory qualities of French dry-cured ham. Meat Sci. 1994, 37, 229–243. [Google Scholar] [CrossRef]
  31. Mayoral, A.I.; Dorado, M.; Guillén, M.T.; Robina, A.; Vivo, J.M.; Vázquez, C.; Ruiz, J. Development of meat and carcass quality characteristics in Iberian pigs reared outdoors. Meat Sci. 1999, 52, 315–324. [Google Scholar] [CrossRef]
  32. Ruiz-Carrascal, J.; Ventanas, J.; Cava, R.; Andrés, A.I.; García, C. Texture and appearance of dry cured ham as affected by fat content and fatty acid composition. Food Res. Int. 2000, 33, 91–95. [Google Scholar] [CrossRef]
  33. Fuentes, V.; Ventanas, J.; Morcuende, D.; Ventanas, S. Effect of intramuscular fat content and serving temperature on temporal sensory perception of sliced and vacuum packaged dry-cured ham. Meat Sci. 2013, 93, 621–629. [Google Scholar] [CrossRef]
  34. Pérez-Alvarez, J.A.; Sayas-Barberá, M.E.; Fernández-López, J.; Aranda-Catalá, V. Physicochemical characteristics of Spanish-type dry-cured sausage. Food Res. Int. 1999, 32, 599–607. [Google Scholar] [CrossRef]
  35. Bermúdez, R.; Franco, D.; Carballo, J.; Lorenzo, J.M. Influence of type of muscle on volatile compounds throughout the manufacture of Celta dry-cured ham. Food Sci. Technol. Int. 2015, 21, 581–592. [Google Scholar] [CrossRef] [PubMed]
  36. Fulladosa, E.; Garriga, M.; Martín, B.; Guàrdia, M.D.; García-Regueiro, J.A.; Arnau, J. Volatile profile and microbiological characterization of hollow defect in dry-cured ham. Meat Sci. 2010, 86, 801–807. [Google Scholar] [CrossRef] [PubMed]
  37. Ruiz, J.; Muriel, E.; Ventanas, J. The Flavour of Iberian Ham. In Research Advances in the Quality of Meat and Meat Products; F. Toldra, Ed.; Research Signpost: Trivandrum, India, 2002; pp. 289–309. [Google Scholar]
  38. Toldrá, F.; Flores, M. The Role of Muscle Proteases and Lipases in Flavor Development During the Processing of Dry-Cured Ham. Crit. Rev. Food Sci. Nutr. 1998, 38, 331–352. [Google Scholar] [CrossRef]
  39. Lorido, L.; Estévez, M.; Ventanas, J.; Ventanas, S. Comparative study between Serrano and Iberian dry-cured hams in relation to the application of high hydrostatic pressure and temporal sensory perceptions. Lwt Food Sci. Technol. 2015, 64, 1234–1242. [Google Scholar] [CrossRef]
  40. Ruiz-Ramírez, J.; Arnau, J.; Serra, X.; Gou, P. Effect of pH24, NaCl content and proteolysis index on the relationship between water content and texture parameters in biceps femoris and semimembranosus muscles in dry-cured ham. Meat Sci. 2006, 72, 185–194. [Google Scholar] [CrossRef]
  41. Bermúdez, R.; Franco, D.; Carballo, J.; Sentandreu, M.Á.; Lorenzo, J.M. Influence of muscle type on the evolution of free amino acids and sarcoplasmic and myofibrillar proteins through the manufacturing process of Celta dry-cured ham. Food Res. Int. 2014, 56, 226–235. [Google Scholar] [CrossRef]
  42. Ruiz-Ramírez, J.; Arnau, J.; Serra, X.; Gou, P. Relationship between water content, NaCl content, pH and texture parameters in dry-cured muscles. Meat Sci. 2005, 70, 579–587. [Google Scholar] [CrossRef]
  43. Virgili, R.; Parolari, G.; Schivazappa, C.; Soresi Bordini, C.; Borri, M. Sensory and Texture Quality of Dry-Cured Ham as Affected by Endogenous Cathepsin B Activity and Muscle Composition. J. Food Sci. 1995, 60, 1183–1186. [Google Scholar] [CrossRef]
  44. Jurado, Á.; García, C.; Timón, M.L.; Carrapiso, A.I. Effect of ripening time and rearing system on amino acid-related flavour compounds of Iberian ham. Meat Sci. 2007, 75, 585–594. [Google Scholar] [CrossRef]
  45. García-Garrido, J.A.; Quiles-Zafra, R.; Tapiador, J.; Luque de Castro, M.D. Sensory and analytical properties of Spanish dry-cured ham of normal and defective texture. Food Chem. 1999, 67, 423–427. [Google Scholar] [CrossRef]
  46. Chang, C.-L.; Liao, C.-S. Parameter Sensitivity Analysis of Artificial Neural Network for Predicting Water Turbidity. Int. J. Geol. Environ. Eng. 2012, 6, 657–660. [Google Scholar] [CrossRef]
  47. Berry, M.J.A.; Linoff, G.S. Data Mining Techniques: For Marketing, Sales, and Customer Relationship Management; John Wiley & Sons: New York, NY, USA, 1997. [Google Scholar]
  48. Boger, Z.; Guterman, H. Knowledge extraction from artificial neural network models. In Proceedings of the Computational Cybernetics and Simulation, IEEE Systems, Man and Cybernetics Conference, Orlando, FL, USA, 12–15 October 1997; Volume 4, pp. 3030–3035. [Google Scholar]
Figure 1. Near Infrared Spectroscopy (NIR) spectra obtained from a remote reflectance fiber-optic probe applied directly to samples of ham. (a) 100% Iberian animals fed in “montanera2 (IM), (b) Iberian animals fed in “montanera” (CM) and (c) fodder-fed Iberian animals (CC).
Sensors 20 05624 g001
Figure 2. Structure of feedforward multi-layer Artificial Neuronal Network (ANN) for calculating sensory parameters of cured ham; this diagram is repeated for each of the 28 sensory parameters studied.
Sensors 20 05624 g002
Figure 3. Comparison of the reference values (target) with the values predicted by ANNs for visual parameters and R2.
Sensors 20 05624 g003
Figure 4. Comparison of the reference values (target) with the values predicted by ANNs for flavor parameters and R2.
Sensors 20 05624 g004
Figure 5. Comparison of the reference values (target) with the values predicted by ANNs for texture parameters and R2.
Sensors 20 05624 g005
Table 1. Sensory parameters selected by the assessors and the definition of sensory parameters.
ParameterDescriptionScore Criteria
Visual 09
VeinedAmount of intramuscular fatAbsence of intramuscular fatLarge amount of intramuscular fat
Fat colorColor shade of the intramuscular fatYellowWhite
Color homogeneityPresence or absence of the various shadesInhomogeneousHomogeneous
Color intensityColor intensity of the itemPinkRed
ExudateShine from the separation of fat on the surfaceAbsence of exudateHigh intensity of exudate
White dotsPresence of white dots owing to the precipitation of tyrosineAbsence of white dotsLarge number of white dots
Flavor
OdorIntensity of odor before eatingLow intensity of odorHigh intensity of odor
Cured aromaOdor of cured meatLow intensity of cured aromaHigh intensity of cured aroma
Pig aromaOdor of abattoir or recently slaughtered pigAbsence of pig aromaHigh intensity of pig aroma
Rancidity aromaIntensity of rancid odorLow intensity of rancid odorHigh intensity of rancid odor
Atypical aromaPresence of strange odors uncharacteristic of hamAbsence of atypical aromaHigh intensity of atypical aroma
Flavor intensitySensation of flavors once the product has been placed in the mouthLow intensity of flavorHigh intensity of flavor
Fat flavor intensityFlavor intensity of the fat fractionLow intensity of fat flavorHigh intensity of fat flavor
Cured flavorIntensity of cured flavorLow intensity of cured flavorHigh intensity of cured flavor
SaltinessIntensity of salty tasteLow intensity of saltinessHigh intensity of saltiness
SweetnessIntensity of sweet tasteLow intensity of sweetnessHigh intensity of sweetness
SournessIntensity of acid tasteLow intensity of sournessHigh intensity of sourness
RancidityIntensity of rancid flavorLow intensity of rancid flavorHigh intensity of rancid flavor
AftertastePersistence of the taste after having eaten the productLow intensity of aftertasteHigh intensity of aftertaste
Atypical flavorPresence of strange odors uncharacteristic of hamAbsence of atypical flavorHigh intensity of atypical flavor
Texture
HardnessFirmness perception during chewingLow intensity of firmnessHigh intensity of firmness
JuicinessImpression of juiciness during chewingLow intensity of juicinessHigh intensity of rancid odor
FatnessAppearance of a fatty sensation when chewing the productLow intensity of fatnessHigh intensity of fatness
FibrousnessPerception of fibers during chewingLow number of fibersHigh number of fibers
ChewinessNo. of bites necessary before the item is swallowedFew bitesMany bites
GumminessTendency to form a ball when the product is chewedLow intensity of gumminessHigh intensity of gumminess
HeterogeneityPresence or absence of different textures in the item on chewing itHomogeneityLack of homogeneity
Chewing ResidueIf remains of the product stay in the mouth once we have swallowed itLittle or no residueLarge amount of residue
Table 2. Scores for each sensory attribute of dry-cured ham determined by the sensory panel and results of the statistical analysis of the influence of the feeding and the genetics of the animals.
Sensory AttributeMeanp-Value
IM *CM **CC ***FeedingGenetics
Visual parametersVeined5.37 a6.20 b7.22 c0.0000.002
Fat color 6.20 a7.05 b7.37 c0.0010.000
Color homogeneity6.78 a7.00 a6.82 a0.3080.313
Color intensity7.50 b7.39 b6.42 a0.0000.034
Exudate4.42 a6.00 b4.78 a0.0000.000
White dots1.13 a2.56 b0.85 a0.0000.017
Flavor parametersOdor6.34 a6.88 b6.50 a0.0190.001
Cured aroma6.82 b7.04 c6.61 a0.0000.414
Pig aroma 0.25 a0.20 a,b0.33 b0.0070.871
Rancidity aroma0.79 b0.49 a0.63 a,b0.2350.004
Atypical aroma0.16 a0.09 a0.15 a0.3640.414
Flavor intensity6.60 a7.34 b6.69 a0.0000.000
Fat flavor intensity4.77 a5.79 c5.31 b0.1350.000
Cured flavor 6.47 a7.00 b6.35 a0.0000.026
Saltiness5.03 a4.98 a5.16 a0.1390.963
Sweetness1.49 a1.83 b1.24 a0.0000.346
Sourness0.36 a0.27 a0.36 a0.2550.381
Rancidity 1.48 b0.94 a1.01 a0.7110.000
Aftertaste6.23 a6.73 b6.02 a0.0000.074
Atypical flavor0.75 b0.32 a0.29 a0.2760.001
Texture parametersHardness4.00 b3.24 a3.47 a0.6940.002
Juiciness5.16 a5.47 b6.02 c0.0070.000
Fatness4.78 a5.50 b5.15 a,b0.2290.004
Fibrousness2.93 a,b2.53 a3.30 b0.0000.474
Chewiness2.93 a2.70 a3.03 a0.1020.581
Gumminess1.70 a1.48 a1.55 a0.8550.366
Heterogeneity2.19 a2.28 a2.32 a0.6400.541
Chewing Residue1.80 b1.24 a1.61 b0.0680.013
* IM: 100% Iberian animals fed in “montanera”; ** CM: Iberian animals fed in “montanera”; *** CC: fodder-fed Iberian animals; a,b,c—Different letters in the same line indicate statistically significant differences (p < 0.05) between the three groups of ham samples.
Table 3. Sensory attributes for which it has been possible to establish a relationship with the spectral wavelengths and the chemical groups responsible for the perception of this attribute.
Sensory AttributeWavelength (nm)Chemical Structure and Functional Groups
Fat color1362CH3
1460Urea, Starch, Amides
1536Amides
1772Cellulose
Cured aroma1510Protein
1620=CH2
1770Cellulose
1954Aromatic ester
Rancidity aroma1450Water, Ketone, Starch
1512Protein
1922Cellulose, Starch
Atypical aroma1458Amides
1482Amides, Aromatic amides, Cellulose, Urea, Aromatic amines
1622=CH2
Cured flavor 1416CH-aromatic compounds
1512Protein
1882Cellulose
1982Amides
Saltiness1406H2O
1416C-Oil *, ROH-H2O
1446CH2, aromatic compounds, starch
1488Cellulose, Amines, Aromatic amines
1520Urea
1686Aromatic compounds
1866C-Cl *
1950Aromatic amides
Sourness122CH2
1538Starch
Rancidity1390CH2
1454Starch
1506-NH, Protein
1528Aromatic amines
1682C-Cl *
Hardness1416OH-H2O, Alcohol/aromatic compounds
1502Amines
1518Urea
1530Aromatic amines
Juiciness1162C=O
1452Starch
1772Cellulose
Fatness1162C=O
1488CONHR, Amides, Aromatic amines
1520Urea
1720CO-Oil *
Fibrousness1148CH2 aromatic compounds
1518Urea
1528R-NH2
1722C-O-Oil *
1736SH- SH- *
1928Cellulose, Starch
1956Second overtone of CO2R
Chewiness1218-CH2
1458Starch
1490Amides, Urea, Aromatic amines, Starch, Cellulose
1514Protein
1736SH- SH- *
Gumminess1488CONR, Cellulose, Urea
1504Amines
1526Aromatic amines
1736SH- SH- *
1746SH- *
1928Cellulose, Starch
Heterogeneity1510Protein
1534R-N H2
1922Cellulose
Chewing Residue1218CH-CH2
1514Protein
1530Aromatic amines
1618=CH2
* Chemical structure and functional groups which have greater weight in the NIR models for predicting sensory attributes
Table 4. ANN architecture (training times and the number of neurons in the hidden layer) for each of the sensory parameters analyzed.
Sensory AttributeThe Best ANN Architecture (Higher R2 Value)
No. of Neurons in the Hidden LayerNo. of Training Times
Veined6500
Fat color 1730
Color homogeneity8100
Color intensity1500
Exudate6500
White dots3500
Odor10500
Cured aroma10500
Pig aroma 2730
Rancidity aroma2530
Atypical aroma6500
Flavor intensity1500
Fat flavor intensity9500
Cured flavor 6500
Saltiness7500
Sweetness2330
Sourness10500
Rancidity 8500
Aftertaste2730
Atypical flavor3100
Hardness9500
Juiciness4100
Fatness7500
Fibrousness7100
Chewiness6100
Gumminess9500
Heterogeneity3500
Chewing Residue1500
Table 5. The best ANN architecture and the mean square error of prediction (MSE) for each of the sensory parameters, obtained in the test set.
Sensory AttributeNo. of Neurons in the Hidden LayerNo. of Training TimesMSE
Veined65000.587
Fat color17300.088
Color homogeneity81000.110
Color intensity15000.081
Exudate65000.216
White dots35000.374
Odor105000.047
Cured aroma105000.031
Pig aroma 27300.020
Rancidity aroma25300.025
Atypical aroma65000.019
Flavor intensity15000.039
Fat flavor intensity95000.216
Cured flavor 65000.053
Saltiness75000.054
Sweetness23300.078
Sourness105000.029
Rancidity 85000.044
Aftertaste27300.053
Atypical flavor31000.066
Hardness95000.204
Juiciness41000.077
Fatness75000.183
Fibrousness71000.205
Chewiness61000.242
Gumminess95000.207
Heterogeneity35000.086
Chewing Residue15000.107

