Sensor Location Optimization of Wireless Wearable fNIRS System for Cognitive Workload Monitoring Using a Data-Driven Approach for Improved Wearability

 , ,
, ,  , ,
, ,
Abstract
:1. Introduction
2. Materials and Methods
2.1. Participants
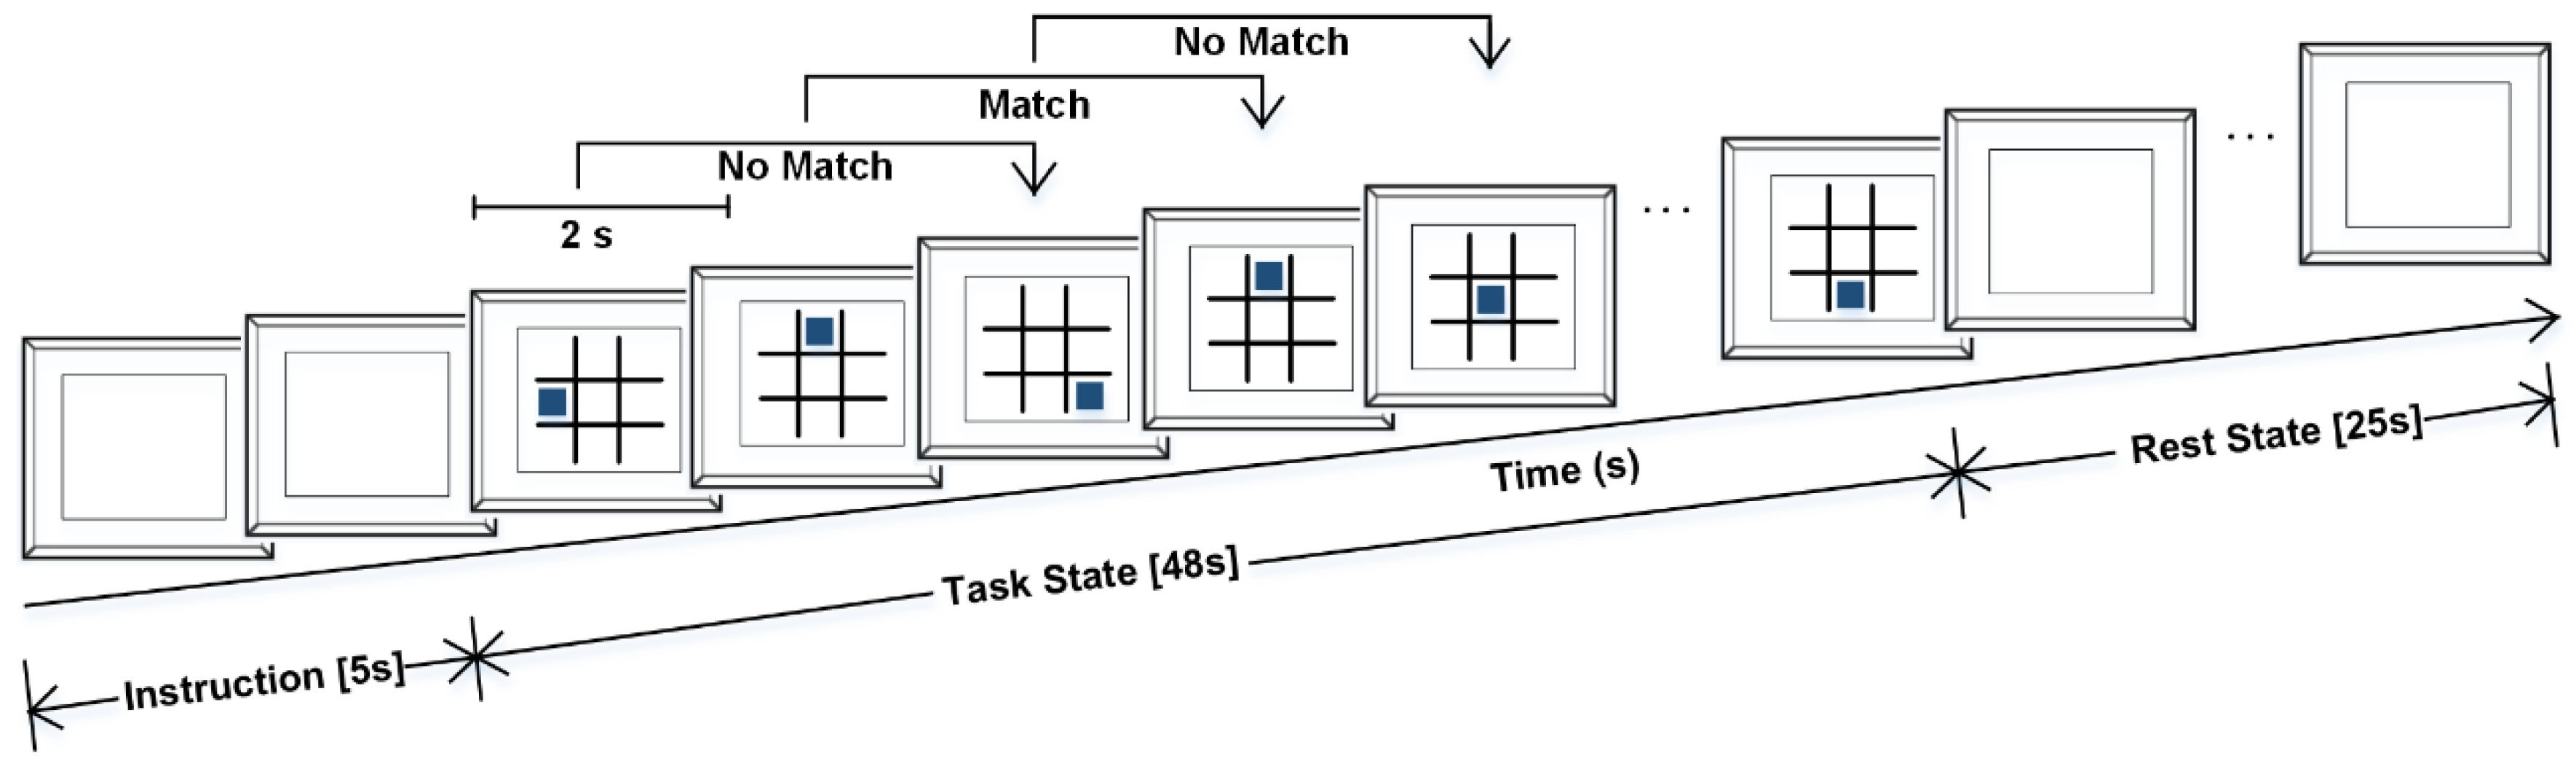
2.2. Experimental Design
2.3. Data Acquisition and Signal Processing
2.4. Feature Extraction
2.5. Feature Selection and Classification
2.6. Statistical Analysis
3. Results and Discussion
4. Conclusions
Supplementary Materials
Author Contributions
Funding
Conflicts of Interest
Appendix A

| Subject 1 | Subject 2 | Subject 3 | Subject 4 | ||||||||||||||||||
|---|---|---|---|---|---|---|---|---|---|---|---|---|---|---|---|---|---|---|---|---|---|
| Accuracy | F1 Score | Sensitivity | Specificity | Precision | Accuracy | F1 Score | Sensitivity | Specificity | Precision | Accuracy | F1 Score | Sensitivity | Specificity | Precision | Accuracy | F1 Score | Sensitivity | Specificity | Precision | ||
| 05 second window | Left | 82.4 | 86 | 89 | 72 | 84 | 87.2 | 90 | 94 | 75 | 86 | 80 | 89.8 | 87 | 87 | 93 | 84.1 | 88 | 89 | 75 | 86 |
| Mid | 88.3 | 90 | 91 | 80 | 89 | 95.5 | 99 | 99 | 96 | 98 | 87 | 89.8 | 87 | 87 | 93 | 76.9 | 88 | 89 | 75 | 86 | |
| Right | 84.5 | 90 | 91 | 80 | 89 | 80.0 | 99 | 99 | 96 | 98 | 72 | 80.1 | 89 | 44 | 73 | 85.2 | 88 | 89 | 75 | 86 | |
| Left-Mid | 89.3 | 92 | 94 | 81 | 89 | 98.3 | 99 | 99 | 96 | 98 | 87 | 89.8 | 87 | 87 | 93 | 83.8 | 88 | 89 | 75 | 86 | |
| Right-Mid | 89.0 | 91 | 93 | 82 | 90 | 97.6 | 99 | 99 | 96 | 98 | 90 | 89.8 | 87 | 87 | 93 | 85.2 | 88 | 89 | 75 | 86 | |
| ALL | 92.1 | 90 | 91 | 80 | 89 | 98.6 | 99 | 99 | 96 | 98 | 91 | 89.8 | 87 | 87 | 93 | 89.3 | 92 | 94 | 82 | 90 | |
| 10 second window | Left | 82.9 | 94 | 97 | 82 | 91 | 88.6 | 99 | 100 | 96 | 98 | 79 | 89.0 | 83 | 92 | 95 | 89.3 | 90 | 92 | 76 | 88 |
| Mid | 92.1 | 94 | 97 | 82 | 91 | 94.3 | 99 | 100 | 96 | 98 | 71 | 79.9 | 89 | 38 | 73 | 75.0 | 90 | 92 | 76 | 88 | |
| Right | 85.0 | 94 | 97 | 82 | 91 | 90.7 | 99 | 100 | 96 | 98 | 72 | 89.0 | 83 | 92 | 95 | 80.0 | 86 | 92 | 58 | 80 | |
| Left-Mid | 91.4 | 94 | 97 | 82 | 91 | 98.6 | 99 | 100 | 96 | 98 | 86 | 89.0 | 83 | 92 | 95 | 86.4 | 90 | 92 | 76 | 88 | |
| Right-Mid | 89.3 | 94 | 97 | 82 | 91 | 93.6 | 99 | 100 | 96 | 98 | 89 | 89.0 | 83 | 92 | 95 | 90.7 | 90 | 92 | 76 | 88 | |
| ALL | 91.4 | 94 | 97 | 82 | 91 | 99.3 | 99 | 100 | 96 | 98 | 81 | 89.0 | 83 | 92 | 95 | 85.7 | 90 | 92 | 76 | 88 | |
| 20 second window | Left | 86.7 | 92 | 93 | 75 | 91 | 93.3 | 99 | 100 | 95 | 98 | 83 | 92.1 | 100 | 60 | 85 | 93.3 | 94 | 95 | 85 | 94 |
| Mid | 95.0 | 92 | 93 | 75 | 91 | 100.0 | 99 | 100 | 95 | 98 | 82 | 92.1 | 100 | 60 | 85 | 70.0 | 94 | 95 | 85 | 94 | |
| Right | 83.3 | 92 | 93 | 75 | 91 | 93.3 | 99 | 100 | 95 | 98 | 70 | 80.4 | 85 | 40 | 76 | 86.7 | 94 | 95 | 85 | 94 | |
| Left-Mid | 88.3 | 93 | 95 | 75 | 91 | 98.3 | 99 | 100 | 95 | 98 | 87 | 92.1 | 100 | 60 | 85 | 91.7 | 94 | 95 | 85 | 94 | |
| Right-Mid | 90.0 | 92 | 93 | 75 | 91 | 95.0 | 99 | 100 | 95 | 98 | 85 | 92.1 | 100 | 60 | 85 | 93.3 | 94 | 95 | 85 | 94 | |
| ALL | 93.3 | 92 | 93 | 75 | 91 | 95.0 | 99 | 100 | 95 | 98 | 85 | 92.1 | 100 | 60 | 85 | 90.0 | 94 | 95 | 85 | 94 | |
| 25 second window | Left | 100.0 | 97 | 95 | 100 | 100 | 96.7 | 100 | 100 | 100 | 100 | 90 | 90.6 | 95 | 60 | 87 | 93.3 | 97 | 100 | 80 | 93 |
| Mid | 93.3 | 97 | 95 | 100 | 100 | 100.0 | 100 | 100 | 100 | 100 | 83 | 90.6 | 95 | 60 | 87 | 86.7 | 97 | 100 | 80 | 93 | |
| Right | 83.3 | 97 | 95 | 100 | 100 | 96.7 | 100 | 100 | 100 | 100 | 77 | 90.6 | 95 | 60 | 87 | 90.0 | 97 | 100 | 80 | 93 | |
| Left-Mid | 96.7 | 97 | 95 | 100 | 100 | 100.0 | 100 | 100 | 100 | 100 | 83 | 90.6 | 95 | 60 | 87 | 93.3 | 97 | 100 | 80 | 93 | |
| Right-Mid | 100.0 | 97 | 95 | 100 | 100 | 100.0 | 100 | 100 | 100 | 100 | 80 | 90.6 | 95 | 60 | 87 | 93.3 | 97 | 100 | 80 | 93 | |
| ALL | 100.0 | 97 | 95 | 100 | 100 | 100.0 | 100 | 100 | 100 | 100 | 83 | 90.6 | 95 | 60 | 87 | 90.0 | 97 | 100 | 80 | 93 | |
| 48 second window | Left | 100.0 | 100 | 100 | 100 | 100 | 95.0 | 100 | 100 | 100 | 100 | 85 | 97.4 | 100 | 90 | 95 | 100.0 | 100 | 100 | 100 | 100 |
| Mid | 100.0 | 100 | 100 | 100 | 100 | 100.0 | 100 | 100 | 100 | 100 | 90 | 97.4 | 100 | 90 | 95 | 90.0 | 100 | 100 | 100 | 100 | |
| Right | 90.0 | 100 | 100 | 100 | 100 | 95.0 | 100 | 100 | 100 | 100 | 90 | 97.4 | 100 | 90 | 95 | 95.0 | 100 | 100 | 100 | 100 | |
| Left-Mid | 100.0 | 100 | 100 | 100 | 100 | 100.0 | 100 | 100 | 100 | 100 | 95 | 97.4 | 100 | 90 | 95 | 100.0 | 100 | 100 | 100 | 100 | |
| Right-Mid | 100.0 | 100 | 100 | 100 | 100 | 100.0 | 100 | 100 | 100 | 100 | 90 | 97.4 | 100 | 90 | 95 | 95.0 | 100 | 100 | 100 | 100 | |
| ALL | 100.0 | 100 | 100 | 100 | 100 | 100.0 | 100 | 100 | 100 | 100 | 90 | 97.4 | 100 | 90 | 95 | 100.0 | 100 | 100 | 100 | 100 | |
| Subject 5 | Subject 6 | Subject 7 | Subject 8 | ||||||||||||||||||
|---|---|---|---|---|---|---|---|---|---|---|---|---|---|---|---|---|---|---|---|---|---|
| Accuracy | F1 Score | Sensitivity | Specificity | Precision | Accuracy | F1 Score | Sensitivity | Specificity | Precision | Accuracy | F1 Score | Sensitivity | Specificity | Precision | Accuracy | F1 Score | Sensitivity | Specificity | Precision | ||
| 05 second window | Left | 94.1 | 98 | 97 | 96 | 98 | 91.4 | 97 | 97 | 95 | 97 | 90.0 | 94 | 94 | 90 | 95 | 78.3 | 83 | 83 | 70 | 82 |
| Mid | 92.1 | 98 | 97 | 96 | 98 | 97.9 | 97 | 97 | 95 | 97 | 88.9 | 94 | 94 | 90 | 95 | 84.1 | 88 | 92 | 71 | 84 | |
| Right | 93.1 | 98 | 97 | 96 | 98 | 87.6 | 97 | 97 | 95 | 97 | 87.9 | 94 | 94 | 90 | 95 | 77.2 | 82 | 85 | 65 | 80 | |
| Left-Mid | 96.9 | 98 | 97 | 96 | 98 | 96.2 | 97 | 97 | 95 | 97 | 92.4 | 94 | 94 | 90 | 95 | 90.7 | 93 | 94 | 85 | 91 | |
| Right-Mid | 99.3 | 98 | 97 | 96 | 98 | 96.9 | 97 | 97 | 95 | 97 | 93.4 | 94 | 94 | 90 | 95 | 88.3 | 91 | 95 | 77 | 88 | |
| ALL | 98.6 | 98 | 97 | 96 | 98 | 98.3 | 97 | 97 | 95 | 97 | 93.1 | 94 | 94 | 90 | 95 | 90.3 | 93 | 96 | 81 | 89 | |
| 10 second window | Left | 94.3 | 96 | 96 | 92 | 96 | 91.4 | 94 | 94 | 86 | 93 | 90.7 | 96 | 97 | 87 | 94 | 84.3 | 87 | 91 | 66 | 84 |
| Mid | 91.4 | 94 | 93 | 88 | 94 | 97.9 | 98 | 99 | 94 | 97 | 92.2 | 96 | 97 | 87 | 94 | 87.1 | 87 | 91 | 66 | 84 | |
| Right | 96.4 | 97 | 96 | 96 | 98 | 85.0 | 89 | 89 | 78 | 88 | 82.2 | 96 | 97 | 87 | 94 | 80.7 | 87 | 91 | 66 | 84 | |
| Left-Mid | 97.1 | 98 | 98 | 96 | 98 | 97.1 | 98 | 99 | 94 | 97 | 93.6 | 96 | 97 | 87 | 94 | 87.9 | 92 | 93 | 78 | 90 | |
| Right-Mid | 99.3 | 97 | 96 | 96 | 98 | 97.9 | 98 | 99 | 94 | 97 | 94.4 | 96 | 97 | 87 | 94 | 90.0 | 87 | 91 | 66 | 84 | |
| ALL | 97.9 | 97 | 96 | 96 | 98 | 98.6 | 98 | 99 | 94 | 97 | 92.7 | 96 | 97 | 87 | 94 | 91.4 | 87 | 91 | 66 | 84 | |
| 20 second window | Left | 98.3 | 99 | 98 | 100 | 100 | 96.7 | 98 | 98 | 95 | 98 | 86.6 | 97 | 95 | 95 | 98 | 88.3 | 96 | 98 | 85 | 94 |
| Mid | 98.3 | 99 | 98 | 100 | 100 | 100.0 | 98 | 98 | 95 | 98 | 94.7 | 97 | 95 | 95 | 98 | 93.3 | 96 | 98 | 85 | 94 | |
| Right | 93.3 | 99 | 98 | 100 | 100 | 90.0 | 98 | 98 | 95 | 98 | 85.2 | 97 | 95 | 95 | 98 | 90.0 | 96 | 98 | 85 | 94 | |
| Left-Mid | 98.3 | 99 | 98 | 100 | 100 | 96.7 | 98 | 98 | 95 | 98 | 95.2 | 97 | 95 | 95 | 98 | 93.3 | 96 | 98 | 85 | 94 | |
| Right-Mid | 100.0 | 99 | 98 | 100 | 100 | 96.7 | 98 | 98 | 95 | 98 | 94.7 | 97 | 95 | 95 | 98 | 88.3 | 96 | 98 | 85 | 94 | |
| ALL | 100.0 | 99 | 98 | 100 | 100 | 93.3 | 98 | 98 | 95 | 98 | 95.2 | 97 | 96 | 95 | 98 | 93.3 | 96 | 98 | 85 | 94 | |
| 25 second window | Left | 100.0 | 100 | 100 | 100 | 100 | 86.7 | 92 | 95 | 70 | 90 | 96.7 | 98 | 97 | 90 | 100 | 93.3 | 98 | 100 | 90 | 97 |
| Mid | 100.0 | 100 | 100 | 100 | 100 | 100.0 | 100 | 100 | 100 | 100 | 96.7 | 98 | 97 | 90 | 100 | 90.0 | 98 | 100 | 90 | 97 | |
| Right | 100.0 | 100 | 100 | 100 | 100 | 93.3 | 100 | 100 | 100 | 100 | 96.7 | 98 | 97 | 90 | 100 | 90.0 | 98 | 100 | 90 | 97 | |
| Left-Mid | 100.0 | 100 | 100 | 100 | 100 | 100.0 | 100 | 100 | 100 | 100 | 97.5 | 98 | 97 | 90 | 100 | 96.7 | 98 | 100 | 90 | 97 | |
| Right-Mid | 100.0 | 100 | 100 | 100 | 100 | 100.0 | 100 | 100 | 100 | 100 | 96.7 | 98 | 97 | 90 | 100 | 93.3 | 98 | 100 | 90 | 97 | |
| ALL | 96.7 | 100 | 100 | 100 | 100 | 100.0 | 100 | 100 | 100 | 100 | 93.3 | 98 | 97 | 90 | 100 | 90.0 | 95 | 100 | 70 | 90 | |
| 48 second window | Left | 100.0 | 100 | 100 | 100 | 100 | 85.0 | 100 | 100 | 100 | 100 | 95.0 | 97 | 95 | 90 | 100 | 100.0 | 90 | 90 | 100 | 90 |
| Mid | 100.0 | 100 | 100 | 100 | 100 | 100.0 | 100 | 100 | 100 | 100 | 90.0 | 97 | 95 | 90 | 100 | 95.0 | 90 | 90 | 100 | 90 | |
| Right | 100.0 | 100 | 100 | 100 | 100 | 95.0 | 100 | 100 | 100 | 100 | 100.0 | 100 | 100 | 90 | 100 | 95.0 | 90 | 90 | 100 | 90 | |
| Left-Mid | 100.0 | 100 | 100 | 100 | 100 | 100.0 | 100 | 100 | 100 | 100 | 96.7 | 97 | 95 | 90 | 100 | 95.0 | 90 | 90 | 100 | 90 | |
| Right-Mid | 100.0 | 100 | 100 | 100 | 100 | 100.0 | 100 | 100 | 100 | 100 | 95.0 | 97 | 95 | 90 | 100 | 100.0 | 90 | 90 | 100 | 90 | |
| ALL | 100.0 | 100 | 100 | 100 | 100 | 100.0 | 100 | 100 | 100 | 100 | 95.0 | 97 | 95 | 90 | 100 | 100.0 | 90 | 90 | 100 | 90 | |
References
- Li, G.; Baker, S.P.; Grabowski, J.G.; Rebok, G.W. Factors Associated with Pilot Error in Aviation Crashes. Aviat. Space Environ. Med. 2001, 72, 52–58. [Google Scholar]
- Hart, S.G.; Staveland, L.E. Development of NASA-TLX (Task Load Index): Results of empirical and theoretical research. Adv. Psychol. 1988, 52, 139–183. [Google Scholar] [CrossRef]
- Cohen, J.D.; Perlstein, W.M.; Braver, T.S.; Nystrom, L.E.; Noll, D.C.; Jonides, J.; Smith, E.E. Temporal dynamics of Brain activation during a working memory task. Nature 1997, 386, 604–608. [Google Scholar] [CrossRef] [PubMed] [Green Version]
- Heekeren, H.R.; Marrett, S.; Bandettini, P.A.; Ungerleider, L.G. A general mechanism for perceptual decision-making in the human brain. Nature 2004, 431, 859–862. [Google Scholar] [CrossRef] [PubMed]
- Berka, C.; Levendowski, D.J.; Lumicao, M.N.; Yau, A.; Davis, G.; Zivkovic, V.T.; Olmstead, R.E.; Tremoulet, P.D.; Craven, P.L. EEG Correlates of Task Engagement and Mental Workload in Vigilance, Learning, and Memory Tasks. Aviat. Space Environ. Med. 2007, 78, B231–B244. [Google Scholar]
- Herff, C.; Heger, D.; Fortmann, O.; Hennrich, J.; Putze, F.; Schultz, T. Mental workload during n-back task—quantified in the prefrontal cortex using fNIRS. Front. Hum. Neurosci. 2014, 7, 935. [Google Scholar] [CrossRef] [PubMed] [Green Version]
- Aghajani, H.; Garbey, M.; Omurtag, A. Measuring Mental Workload with EEG+fNIRS. Front. Hum. Neurosci. 2017, 11, 1–20. [Google Scholar] [CrossRef] [Green Version]
- Coffey, E.B.J.; Brouwer, A.-M.; Van Erp, J.B.F. Measuring workload using a combination of electroencephalography and near infrared spectroscopy. Proc. Hum. Factors Ergon. Soc. Annu. Meet. 2012, 56, 1822–1826. [Google Scholar] [CrossRef] [Green Version]
- Rypma, B.; D’Esposito, M. The roles of prefrontal brain regions in components of working memory: Effects of memory load and individual differences. Proc. Natl. Acad. Sci. USA 1999, 96, 6558–6563. [Google Scholar] [CrossRef] [Green Version]
- Iadecola, C.; Nedergaard, M. Glial regulation of the cerebral microvasculature. Nat. Neurosci. 2007, 10, 1369–1376. [Google Scholar] [CrossRef]
- Ogawa, S.; Lee, T.M.; Kay, A.R.; Tank, D.W. Brain magnetic resonance imaging with contrast dependent on blood oxygenation. Proc. Natl. Acad. Sci. USA 1990, 87, 9868–9872. [Google Scholar] [CrossRef] [PubMed] [Green Version]
- Cui, X.; Bray, S.; Bryant, D.M.; Glover, G.H.; Reiss, A.L. A quantitative comparison of NIRS and fMRI across multiple cognitive tasks. Neuroimage 2011, 54, 2808–2821. [Google Scholar] [CrossRef] [PubMed] [Green Version]
- Erdoğan, S.B.; Yücel, M.A.; Akın, A. Analysis of task-evoked systemic interference in fNIRS measurements: Insights from fMRI. Neuroimage 2014, 87, 490–504. [Google Scholar] [CrossRef]
- Fishburn, F.A.; Norr, M.E.; Medvedev, A.V.; Vaidya, C.J. Sensitivity of fNIRS to cognitive state and load. Front. Hum. Neurosci. 2014, 8, 76. [Google Scholar] [CrossRef] [PubMed]
- Barker, J.W.; Aarabi, A.; Huppert, T.J. Autoregressive model based algorithm for correcting motion and serially correlated errors in fNIRS. Biomed. Opt. Express 2013, 4, 1366–1379. Available online: https://www.osapublishing.org/boe/abstract.cfm?uri=boe-4-8-1366 (accessed on 15 July 2020). [CrossRef] [Green Version]
- Gagnon, L.; Yücel, M.A.; Dehaes, M.; Cooper, R.J.; Perdue, K.L.; Selb, J.; Huppert, T.J.; Hoge, R.d.; Boas, D.A. Quantification of the cortical contribution to the NIRS signal over the motor cortex using concurrent NIRS-fMRI measurements. Neuroimage 2012, 59, 3933–3940. [Google Scholar] [CrossRef] [Green Version]
- Gevins, A.; Smith, M.E.; McEvoy, L.; Yu, D. High-resolution EEG mapping of cortical activation related to working memory: Effects of task difficulty, type of processing, and practice. Cereb. Cortex 1997, 7, 374–385. [Google Scholar] [CrossRef] [Green Version]
- Gevins, A.; Smith, M.E.; Leong, H.; McEvoy, L.; Whitfield, S.; Du, R.; Rush, G. Monitoring working memory load during computer-based tasks with EEG pattern recognition methods. Hum. Factors 1998, 40, 79–91. [Google Scholar] [CrossRef]
- Yamamoto, K.; Takahashi, H.; Kato, T.; Oka, N.; Yoshino, K. Functional brain imaging using near-infrared spectroscopy during actual driving on an expressway. Front. Hum. Neurosci. 2013, 7, 882. [Google Scholar]
- Tsunashima, H.; Yanagisawa, K. Measurement of Brain Function of Car Driver Using Functional Near-Infrared Spectroscopy (fNIRS). Comput. Intell. Neurosci. 2009, 2009, 164958. [Google Scholar] [CrossRef]
- Kojima, T.; Tsunashima, H.; Shiozawa, T.Y. Measurement of train driver’s brain activity by functional near-infrared spectroscopy (fNIRS). Opt. Quantum Electron. 2005, 37, 13–15. [Google Scholar] [CrossRef]
- Causse, M.; Chua, Z.; Peysakhovich, V.; Del Campo, N.; Matton, N. Mental workload and neural efficiency quantified in the prefrontal cortex using fNIRS. Sci. Rep. 2017, 7, 1–15. [Google Scholar] [CrossRef] [PubMed]
- Paczynski, M.; Formwalt, A.; Parasuraman, R.; Baccus, W.; Murtza, R.; Ayaz, H.; McKendrick, R. Into the Wild: Neuroergonomic Differentiation of Hand-Held and Augmented Reality Wearable Displays during Outdoor Navigation with Functional Near Infrared Spectroscopy. Front. Hum. Neurosci. 2016, 10, 216. [Google Scholar]
- Pinti, P.; Aichelburg, C.; Lind, F.; Power, S.; Swingler, E.; Merla, A.; Hamilton, A.; Gilbert, S.; Burgess, P. Ilias Tachtsidis1Using Fiberless, Wearable fNIRS to Monitor Brain Activity in Real-world Cognitive Tasks. J. Vis. Exp. 2015, 53336. [Google Scholar]
- Atsumori, H. Noninvasive imaging of prefrontal activation during attention-demanding tasks performed while walking using a wearable optical topography system. J. Biomed. Opt. 2010, 15, 046002. [Google Scholar] [CrossRef] [PubMed] [Green Version]
- Siddiquee, M.R.; Hasan, S.M.S.; Marquez, J.S.; Ramon, R.N.; Bai, O. Accurate Vigilance Detection During Gait by Using Movement Artifact Removal. IEEE Access 2020, 8, 51179–51188. [Google Scholar] [CrossRef]
- Baddeley, A. Working memory: Looking back and looking forward. Nat. Rev. Neurosci. 2003, 4, 829–839. [Google Scholar] [CrossRef]
- Owen, A.M.; McMillan, K.M.; Laird, A.R.; Bullmore, E. N-back working memory paradigm: A meta-analysis of normative functional neuroimaging studies. Hum. Brain Mapp. 2005, 25, 46–59. [Google Scholar] [CrossRef] [Green Version]
- Sato, H.; Yahata, N.; Funane, T.; Takizawa, R.; Katura, T.; Atsumori, H.; Nishimura, Y.; Kinoshita, A.; Kiguchi, M.; Koizumi, H.; et al. A NIRS–fMRI investigation of prefrontal cortex activity during a working memory task. Neuroimage 2013, 83, 158–173. [Google Scholar] [CrossRef]
- Mandrick, K.; Derosiere, G.; Dray, G.; Coulon, D.; Micallef, J.-P.; Perrey, S. Prefrontal cortex activity during motor tasks with additional mental load requiring attentional demand: A near-infrared spectroscopy study. Neurosci. Res. 2013, 76, 156–162. [Google Scholar] [CrossRef]
- Ayaz, H.; Shewokis, P.A.; Bunce, S.; Izzetoglu, K.; Willems, B.; Onaral, B. Optical brain monitoring for operator training and mental workload assessment. Neuroimage 2012, 59, 36–47. [Google Scholar] [CrossRef] [PubMed]
- De Joux, N.R.; Wilson, K.M.; Russell, P.N.; Finkbeiner, K.M.; Helton, W.S. A functional near-infrared spectroscopy study of the effects of configural properties on sustained attention. Neuropsychologia 2017, 94, 106–117. Available online: https://linkinghub.elsevier.com/retrieve/pii/S0028393216304390 (accessed on 15 July 2020). [CrossRef] [PubMed] [Green Version]
- Kirchner, W.K. Age differences in short-term retention of rapidly changing information. J. Exp. Psychol. 1958, 55, 352. [Google Scholar] [CrossRef] [PubMed]
- Curtin, A.; Ayaz, H. Neural efficiency metrics in neuroergonomics: Theory and applications. In Neuroergonomics; Academic Press: Cambridge, MA, USA, 2019; pp. 133–140. [Google Scholar]
- Hoskinson, P.; Toomim, J. Brain Workshop—A Dual N-Back Game. 2009. Available online: http://brainworkshop.sourceforge.net/ (accessed on 15 July 2020).
- Wang, Y.; Zheng, Y.; Bai, O.; Wang, Q.; Liu, D.; Liu, X.; Sun, J. A multifunctional wireless body area sensors network with real time embedded data analysis. In Proceedings of the 2016 IEEE Biomedical Circuits and Systems Conference (BioCAS), Shanghai, China, 17–19 October 2016; pp. 508–511. [Google Scholar]
- Siddiquee, M.R.; Marquez, J.S.; Atri, R.; Ramon, R.; Mayrand, R.P.; Bai, O. Movement artefact removal from NIRS signal using multi-channel IMU data. Biomed. Eng. Online 2018, 17, 120. [Google Scholar] [CrossRef] [PubMed] [Green Version]
- Siddiquee, M.R.; Xue, T.; Marquez, J.S.; Atri, R.; Ramon, R.; Mayrand, R.; PLeung, C.; Bai, O. Sensor Fusion in Human Cyber Sensor System for Motion Artifact Removal from NIRS Signal. In Proceedings of the 2019 12th International Conference on Human System Interaction (HSI), Richmond, VA, USA, 25–27 June 2019; pp. 192–196. [Google Scholar]
- Scholkmann, F.; Wolf, M. General equation for the differential pathlength factor of the frontal human head depending on wavelength and age. J. Biomed. Opt. 2013, 18, 105004. Available online: www.zora.uzh.ch (accessed on 15 July 2020). [CrossRef] [PubMed] [Green Version]
- Aasted, C.M.; Yücel, M.A.; Cooper, R.J.; Dubb, J.; Tsuzuki, D.; Becerra, L.; Petkov, M.P.; Borsook, D.; Dan, I.; Boas, D.A. Anatomical guidance for functional near-infrared spectroscopy: AtlasViewer tutorial. Neurophotonics 2015, 2, 020801. [Google Scholar] [CrossRef]
- Huppert, T.J.; Diamond, S.G. HomER: A review of time-series analysis methods for near-infrared spectroscopy of the brain. Appl. Opt. 2009, 48, 280–298. [Google Scholar] [CrossRef] [Green Version]
- Tomita, Y.; Vialatte, F.B.; Dreyfus, G.; Mitsukura, Y.; Bakardjian, H.; Cichocki, A. Bimodal BCI using simultaneously NIRS and EEG. IEEE Trans. Biomed. Eng. 2014, 61, 1274–1284. [Google Scholar] [CrossRef]
- Elwell, C.E.; Springett, R.; Hillman, E.; Delpy, D.T. Oscillations in cerebral haemodynamics. In Oxygen Transport to Tissue XXI; Springer: New York, NY, USA, 1999; pp. 57–65. [Google Scholar]
- Rahman, M.A.; Rashid, M.A.; Ahmad, M. Selecting the optimal conditions of Savitzky—Golay filter for fNIRS signal. Biocybern. Biomed. Eng. 2019, 39, 624–637. [Google Scholar] [CrossRef]
- Cope, M. The Development of a Near Infrared Spectroscopy System and Its Application for Non Invasive Monitory of Cerebral Blood and Tissue Oxygenation in the Newborn Infants. Ph.D. Thesis, University of London, London, UK, 1991. Available online: http://discovery.ucl.ac.uk/1317956/ (accessed on 15 July 2020).
- Power, S.D.; Kushki, A.; Chau, T. Intersession Consistency of Single-Trial Classification of the Prefrontal Response to Mental Arithmetic and the No-Control State by NIRS. PLoS ONE 2012, 7, e37791. [Google Scholar] [CrossRef]
- Faress, A.; Chau, T. Towards a multimodal brain-computer interface: Combining fNIRS and fTCD measurements to enable higher classification accuracy. Neuroimage 2013, 77, 186–194. [Google Scholar] [CrossRef]
- Moghimi, S.; Kushki, A.; Power, S.; Guerguerian, A.M.; Chau, T. Automatic detection of a prefrontal cortical response to emotionally rated music using multi-channel near-infrared spectroscopy. J. Neural Eng. 2012, 9, 026022. [Google Scholar] [CrossRef] [Green Version]
- Holper, L.; Wolf, M. Single-trial classification of motor imagery differing in task complexity: A functional near-infrared spectroscopy study. J. Neuroeng. Rehabil. 2011, 8, 34. [Google Scholar] [CrossRef] [Green Version]
- Khan, M.J.; Hong, K.-S. Passive BCI based on drowsiness detection: An fNIRS study. Biomed. Opt. Express 2015, 6, 4063–4078. [Google Scholar] [CrossRef] [Green Version]
- Hong, K.S.; Naseer, N.; Kim, Y.H. Classification of prefrontal and motor cortex signals for three-class fNIRS-BCI. Neurosci. Lett. 2015, 587, 87–92. [Google Scholar] [CrossRef]
- Cui, X.; Bray, S.; Reiss, A.L. Speeded Near Infrared Spectroscopy (NIRS) Response Detection. PLoS ONE 2010, 5, e15474. Available online: www.plosone.org (accessed on 15 July 2020). [CrossRef] [Green Version]
- Newaz, A.I.; Sikder, A.K.; Rahman, M.A.; Uluagac, A.S. HealthGuard: A Machine Learning-Based Security Framework for Smart Healthcare Systems. In Proceedings of the 2019 6th International Conference on Social Networks Analysis, Management and Security, SNAMS 2019, Granada, Spain, 22–25 October 2019; pp. 389–396. [Google Scholar]
- Sitaram, R.; Zhang, H.; Guan, C.; Thulasidas, M.; Hoshi, Y.; Ishikawa, A.; Shimizu, K.; Birbaumer, N. Temporal classification of multichannel near-infrared spectroscopy signals of motor imagery for developing a brain-computer interface. NeuroImage 2007, 34, 1416–1427. Available online: http://www.nmr.mgh (accessed on 15 July 2020). [CrossRef]
- Nguyen, H.T.; Ngo, C.Q.; Truong, D.K.Q.; Vo, T.V. Temporal hemodynamic classification of two hands tapping using functional near-infrared spectroscopy. Front. Hum. Neurosci. 2013, 7, 1–12. [Google Scholar]
- Abibullaev, B.; An, J.; Moon, J.-I. Neural Network Classification of Brain Hemodynamic Responses from Four Mental Tasks. Int. J. Optomechatron. 2011, 5, 340–359. Available online: http://www.tandfonline.com/doi/abs/10.1080/15599612.2011.633209 (accessed on 15 July 2020). [CrossRef]
- Naseer, N.; Qureshi, N.K.; Noori, F.M.; Hong, K.S. Analysis of Different Classification Techniques for Two-Class Functional Near-Infrared Spectroscopy-Based Brain-Computer Interface. Comput. Intell. Neurosci. 2016, 2016, 5480760. [Google Scholar] [CrossRef] [Green Version]
- Kohavi, R.; John, G.H. Wrappers for feature subset selection. Artif. Intell. 1997, 97, 273–324. [Google Scholar] [CrossRef] [Green Version]
- Kira, K.; Rendell, L.A. A practical approach to feature selection. In Machine Learning Proceedings 1992; Morgan Kaufmann: San Francisco, CA, USA, 1992; pp. 249–256. [Google Scholar]
- Robnik-Šikonja, M.; Kononenko, I. Theoretical and Empirical Analysis of ReliefF and RReliefF. Mach. Learn. 2003, 53, 23–69. [Google Scholar] [CrossRef] [Green Version]
- Kohavi, R. A study of cross-validation and bootstrap for accuracy estimation and model selection. In Proceedings of the International Joint Conference on Articial Intelligence, Montreal, QC, Canada, 20–25 August 1995; Volume 14, pp. 1137–1145. [Google Scholar]
- Buckner, R.L.; Andrews-Hanna, J.R.; Schacter, D.L. The brain’s default network: Anatomy, function, and relevance to disease. Ann. N. Y. Acad. Sci. 2008, 1124, 1–38. [Google Scholar] [CrossRef] [Green Version]
- Gusnard, D.A.; Raichle, M.E. Searching for a baseline: Functional imaging and the resting human brain. Nat. Rev. Neurosci. 2001, 2, 685. [Google Scholar] [CrossRef]
- Koechlin, E.; Hyafil, A. Anterior prefrontal function and the limits of human decision-making. Science 2007, 318, 594–598. [Google Scholar] [CrossRef]
- Velanova, K.; Jacoby, L.L.; Wheeler, M.E.; McAvoy, M.P.; Petersen, S.E.; Buckner, R.L. Functional-anatomic correlates of sustained and transient processing components engaged during controlled retrieval. J. Neurosci. 2003, 23, 8460–8470. [Google Scholar] [CrossRef]
- Reynolds, J.R.; Mcdermott, K.B.; Braver, T.S. A Direct Comparison of Anterior Prefrontal Cortex Involvement in Episodic Retrieval and Integration. Cereb. Cortex 2006, 16, 519–528. Available online: https://academic.oup.com/cercor/article-abstract/16/4/519/382234 (accessed on 15 July 2020). [CrossRef] [Green Version]
- Gilbert, S.J.; Spengler, S.; Simons, J.S.; Steele, J.D.; Lawrie, S.M.; Frith, C.D.; Burgess, P.W. Functional specialization within rostral prefrontal cortex (area 10): A meta-analysis. J. Cogn. Neurosci. 2006, 18, 932–948. [Google Scholar] [CrossRef] [Green Version]


| Classification Accuracy (%) | |||||||
|---|---|---|---|---|---|---|---|
| Left | Mid | Right | Left-Mid | Right-Mid | Whole | ||
| 5 s window | Sub1 | 82.4 | 88.3 | 84.5 | 89.3 | 89.0 | 92.1 |
| Sub2 | 87.2 | 95.5 | 80.0 | 98.3 | 97.6 | 98.6 | |
| Sub3 | 80.0 | 87.2 | 72.1 | 87.2 | 90.0 | 91.4 | |
| Sub4 | 84.1 | 76.9 | 85.2 | 83.8 | 85.2 | 89.3 | |
| Sub5 | 94.1 | 92.1 | 93.1 | 96.9 | 99.3 | 98.6 | |
| Sub6 | 91.4 | 97.9 | 87.6 | 96.2 | 96.9 | 98.3 | |
| Sub7 | 90.0 | 88.9 | 87.9 | 92.4 | 93.4 | 93.1 | |
| Sub8 | 78.3 | 84.1 | 77.2 | 90.7 | 88.3 | 90.3 | |
| Mean ± SD | 85.9 ± 5.7 | 88.9 ± 6.6 | 83.4 ± 6.7 | 91.9 ± 5.0 | 92.5 ± 5.1 | 94.0 ± 3.9 | |
| 10 s window | Sub1 | 82.9 | 92.1 | 85.0 | 91.4 | 89.3 | 91.4 |
| Sub2 | 88.6 | 94.3 | 90.7 | 98.6 | 93.6 | 99.3 | |
| Sub3 | 79.3 | 70.7 | 72.1 | 86.4 | 89.3 | 81.4 | |
| Sub4 | 89.3 | 75.0 | 80.0 | 86.4 | 90.7 | 85.7 | |
| Sub5 | 94.3 | 91.4 | 96.4 | 97.1 | 99.3 | 97.9 | |
| Sub6 | 91.4 | 97.9 | 85.0 | 97.1 | 97.9 | 98.6 | |
| Sub7 | 90.7 | 92.2 | 82.2 | 93.6 | 94.4 | 92.7 | |
| Sub8 | 84.3 | 87.1 | 80.7 | 87.9 | 90.0 | 91.4 | |
| Mean ± SD | 87.6 ± 5.0 | 87.6 ± 9.6 | 84.0 ± 7.3 | 92.3 ± 5.0 | 93.0 ± 3.9 | 92.3 ± 6.3 | |
| 20 s window | Sub1 | 86.7 | 95.0 | 83.3 | 88.3 | 90.0 | 93.3 |
| Sub2 | 93.3 | 100.0 | 93.3 | 98.3 | 95.0 | 95.0 | |
| Sub3 | 83.3 | 81.7 | 70.0 | 86.7 | 85.0 | 85.0 | |
| Sub4 | 93.3 | 70.0 | 86.7 | 91.7 | 93.3 | 90.0 | |
| Sub5 | 98.3 | 98.3 | 93.3 | 98.3 | 100.0 | 100.0 | |
| Sub6 | 96.7 | 100.0 | 90.0 | 96.7 | 96.7 | 93.3 | |
| Sub7 | 86.6 | 94.7 | 85.2 | 95.2 | 94.7 | 95.2 | |
| Sub8 | 88.3 | 93.3 | 90.0 | 93.3 | 88.3 | 93.3 | |
| Mean ± SD | 90.8 ± 5.4 | 91.6 ± 10.5 | 86.49 ± 7.6 | 93.6 ± 4.4 | 92.9 ± 4.8 | 93.2 ± 4.3 | |
| 25 s window | Sub1 | 100.0 | 93.3 | 83.3 | 96.7 | 100.0 | 100.0 |
| Sub2 | 96.7 | 100.0 | 96.7 | 100.0 | 100.0 | 100.0 | |
| Sub3 | 90.0 | 83.3 | 76.7 | 83.3 | 80.0 | 83.3 | |
| Sub4 | 93.3 | 86.7 | 90.0 | 93.3 | 93.3 | 90.0 | |
| Sub5 | 100.0 | 100.0 | 100.0 | 100.0 | 100.0 | 96.7 | |
| Sub6 | 86.7 | 100.0 | 93.3 | 100.0 | 100.0 | 100.0 | |
| Sub7 | 96.7 | 96.7 | 96.7 | 97.5 | 96.7 | 93.3 | |
| Sub8 | 93.3 | 90.0 | 90.0 | 96.7 | 93.3 | 90.0 | |
| Mean ± SD | 94.6 ± 4.7 | 93.8 ± 6.5 | 90.8 ± 7.7 | 95.9 ± 5.6 | 95.4 ± 6.9 | 94.2 ± 6.1 | |
| 48 s window | Sub1 | 100.0 | 100.0 | 90.0 | 100.0 | 100.0 | 100.0 |
| Sub2 | 95.0 | 100.0 | 95.0 | 100.0 | 100.0 | 100.0 | |
| Sub3 | 85.0 | 90.0 | 90.0 | 95.0 | 90.0 | 90.0 | |
| Sub4 | 100.0 | 90.0 | 95.0 | 100.0 | 95.0 | 100.0 | |
| Sub5 | 100.0 | 100.0 | 100.0 | 100.0 | 100.0 | 100.0 | |
| Sub6 | 85.0 | 100.0 | 95.0 | 100.0 | 100.0 | 100.0 | |
| Sub7 | 95.0 | 90.0 | 100.0 | 96.7 | 95.0 | 95.0 | |
| Sub8 | 100.0 | 95.0 | 95.0 | 95.0 | 100.0 | 100.0 | |
| Mean ± SD | 95 ± 6.5 | 95.6 ± 5.0 | 95 ± 3.8 | 98.3 ± 2.4 | 97.5 ± 3.8 | 98.1 ± 3.7 | |
© 2020 by the authors. Licensee MDPI, Basel, Switzerland. This article is an open access article distributed under the terms and conditions of the Creative Commons Attribution (CC BY) license (http://creativecommons.org/licenses/by/4.0/).
Share and Cite
Siddiquee, M.R.; Atri, R.; Marquez, J.S.; Hasan, S.M.S.; Ramon, R.; Bai, O. Sensor Location Optimization of Wireless Wearable fNIRS System for Cognitive Workload Monitoring Using a Data-Driven Approach for Improved Wearability. Sensors 2020, 20, 5082. https://doi.org/10.3390/s20185082
Siddiquee MR, Atri R, Marquez JS, Hasan SMS, Ramon R, Bai O. Sensor Location Optimization of Wireless Wearable fNIRS System for Cognitive Workload Monitoring Using a Data-Driven Approach for Improved Wearability. Sensors. 2020; 20(18):5082. https://doi.org/10.3390/s20185082
Chicago/Turabian StyleSiddiquee, Masudur R., Roozbeh Atri, J. Sebastian Marquez, S. M. Shafiul Hasan, Rodrigo Ramon, and Ou Bai. 2020. "Sensor Location Optimization of Wireless Wearable fNIRS System for Cognitive Workload Monitoring Using a Data-Driven Approach for Improved Wearability" Sensors 20, no. 18: 5082. https://doi.org/10.3390/s20185082