Detection of Ferric Ions and Catecholamine Neurotransmitters via Highly Fluorescent Heteroatom Co-Doped Carbon Dots


Department of Chemical and Biological Engineering, Gachon University, Seongnam 13120, Korea
*
Author to whom correspondence should be addressed.
Sensors 2020, 20(12), 3470; https://doi.org/10.3390/s20123470
Submission received: 4 May 2020
/
Revised: 3 June 2020
/
Accepted: 16 June 2020
/
Published: 19 June 2020
(This article belongs to the Special Issue Fluorescent Sensors)
Abstract
:Carbon dots (CDs) demonstrate very poor fluorescence quantum yield (QY). In this study, with the help of a hydrothermal method, we combined CDs with nitrogen and phosphorus elements belonging to the VA group (in the periodic table) to form heteroatom co-doped CDs, i.e., nitrogen and phosphorus co-doped carbon dots (NPCDs). These displayed a significant improvement in the QY (up to 84%), which was as much as four times than that of CDs synthesized by the same method. The as-prepared NPCDs could be used as an “off-on” fluorescence detector for the rapid and effective sensing of ferric ions (Fe3+) and catecholamine neurotransmitters (CNs) such as dopamine (DA), adrenaline (AD), and noradrenaline (NAD). The fluorescence of NPCDs was “turned off” and the emission wavelength was slightly red-shifted upon increasing the Fe3+ concentration. However, when CNs were incorporated, the fluorescence of NPCDs was recovered in a short response time; this indicated that CN concentration could be monitored, relying on enhancing the fluorescence signal of NPCDs. As a result, NPCDs are considered as a potential fluorescent bi-sensor for Fe3+ and CN detection. Particularly, in this research, we selected DA as the representative neurotransmitter of the CN group along with Fe3+ to study the sensing system based on NPCDs. The results exhibited good linear ranges with a limit of detection (LOD) of 0.2 and 0.1 µM for Fe3+ and DA, respectively.
1. Introduction
Carbon dot (CD) is a new class of fluorescence carbon material that has been attracting considerable interest owing to their outstanding properties such as good water solubility, low toxicity, favorable biocompatibility, good photo-stability, tunable surface functionalities, and cell membrane permeability [1,2]. However, CDs have low quantum yields (QY) and few active sites, which limits their wider applications in fluorescent bioimaging [3,4,5], biosensing [6,7], ions and molecules detection [8,9], novel photoscience [10,11,12,13], and electrocatalysis [14]. Therefore, developing the methods to improve the fluorescent properties of CDs is extremely important. Previous studies proved that heteroatom doping is an effective and smart strategy to enhance their fluorescent performance [15]. Heteroatom doping provides available sites for target sensing [16,17] and can effectively control the band gap, electron density, leading to the QY enhancement of the CDs [18]. In addition, CDs doped with heteroatoms present distinctive photoluminescence (PL) behavior for application in various fields [19,20]. It is known that because nitrogen possesses a similar atomic size to carbon and has five strong valence bonds, it is considered to be a prominent chemical doping element for tailoring the electronic properties of CDs and can also bond strongly with the carbon atoms [21,22]. After doping with N atoms, CDs become n-type semiconductors. In the case where CDs act as n-type semiconductors, they may form substitution defects in sp3-bonded diamond thin films [23]. Hence, nitrogen and phosphorus co-doping would change the electronic characteristics of CDs, as well as control their physical and chemical properties, leading to higher QY.
Ferric ions (Fe3+) play vital roles in several biochemical and biophysical processes including DNA replication, cell proliferation, oxygen transport, enzyme catalysis, etc [24]. Consequently, the deficiency or excess of Fe3+ leads to various diseases. A disproportion in the number of Fe3+ may result in liver and kidney damage, megaloblastic, hemolytic anemia, and heart failure [25,26]. Moreover, determining Fe3+ levels is an important factor for evaluating the quality of drinking water [27]. Hence, detecting Fe3+ is extremely important in environmental and biomedical domains.
Similarly, catecholamine neurotransmitters (CNs) such as dopamine (DA), adrenaline (AD), and noradrenaline (NAD) play roles as messengers of neurological information [28]. Abnormal levels of CNs are related to various diseases including Parkinson’s, Alzheimer’s, schizophrenia, Huntington’s chorea, severe head trauma, neuroblastoma, pituitary adenoma, adrenocortical carcinoma, pheochromocytoma, various cancerous tumors, and depression [29,30]. Therefore, the growth of a selective and sensitive technique for detecting CN is crucial.
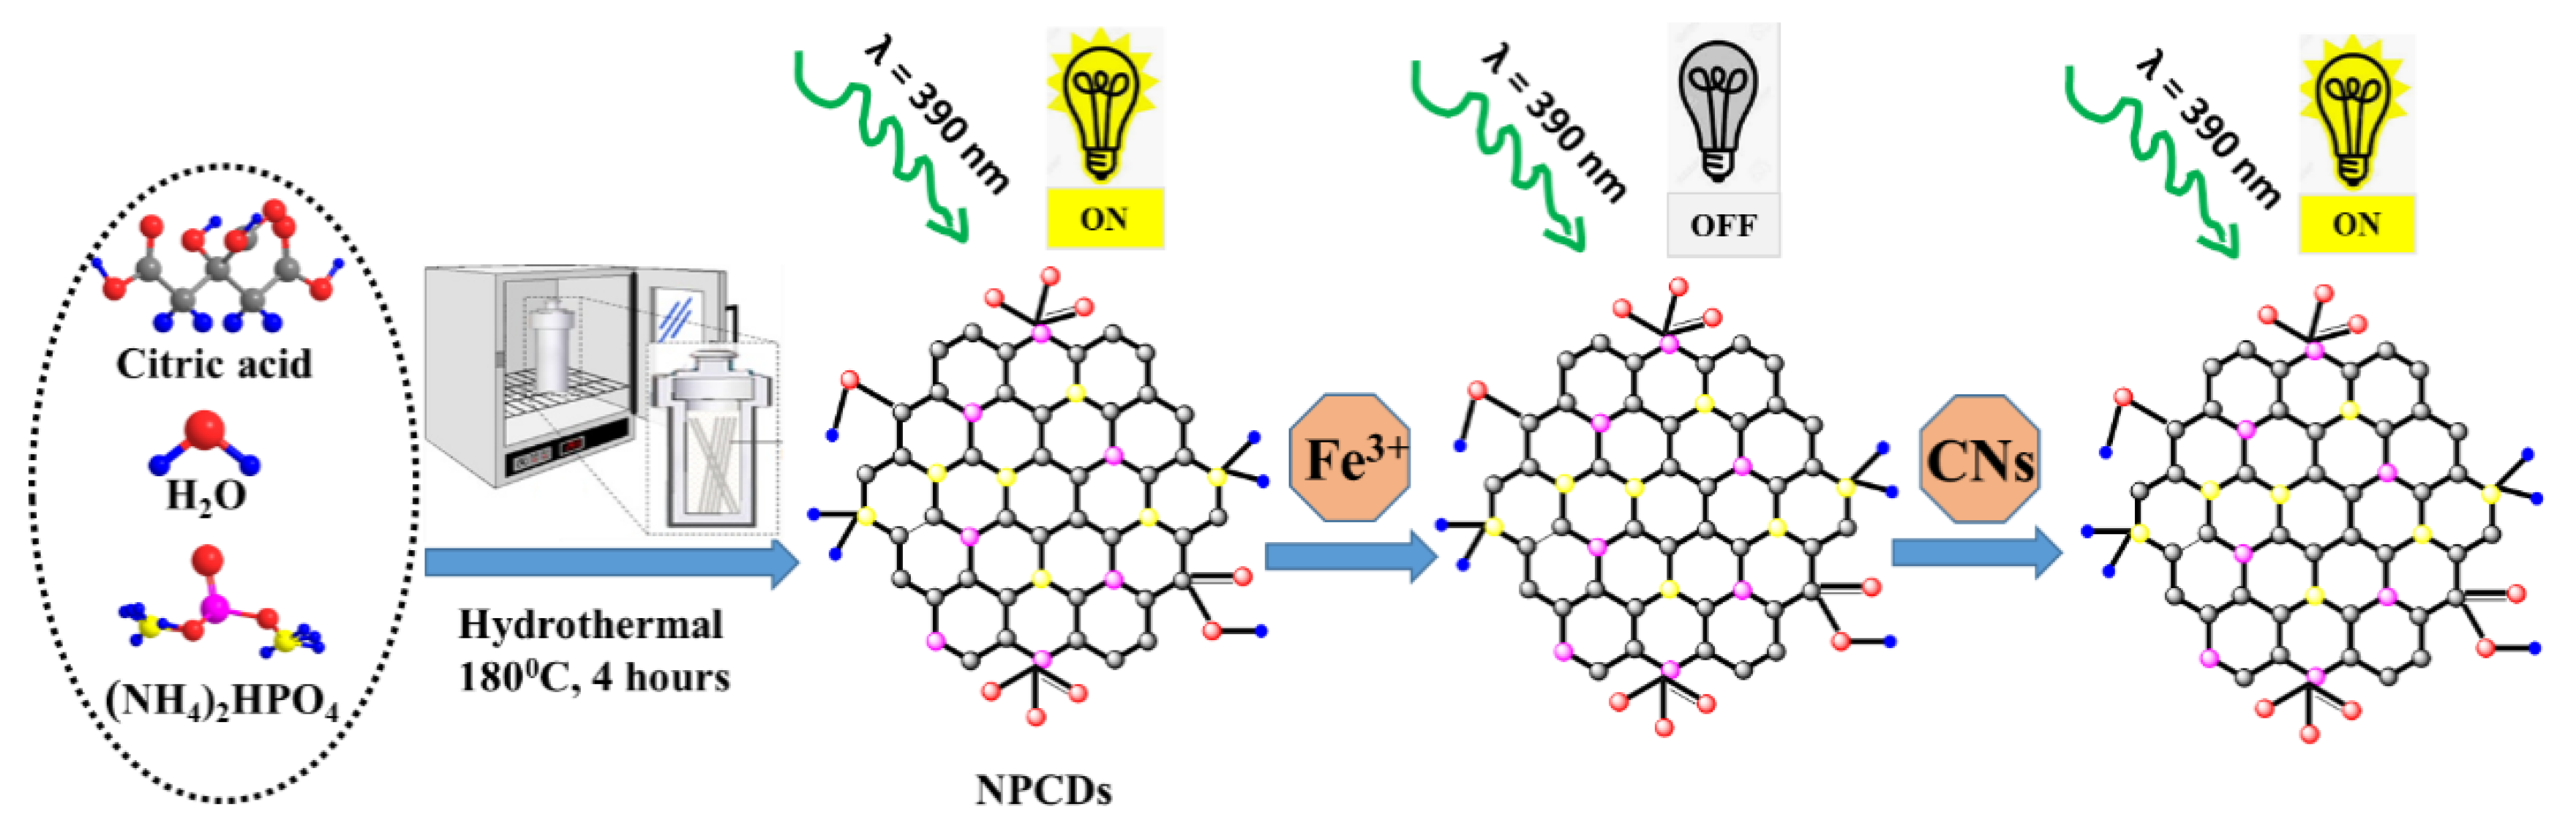
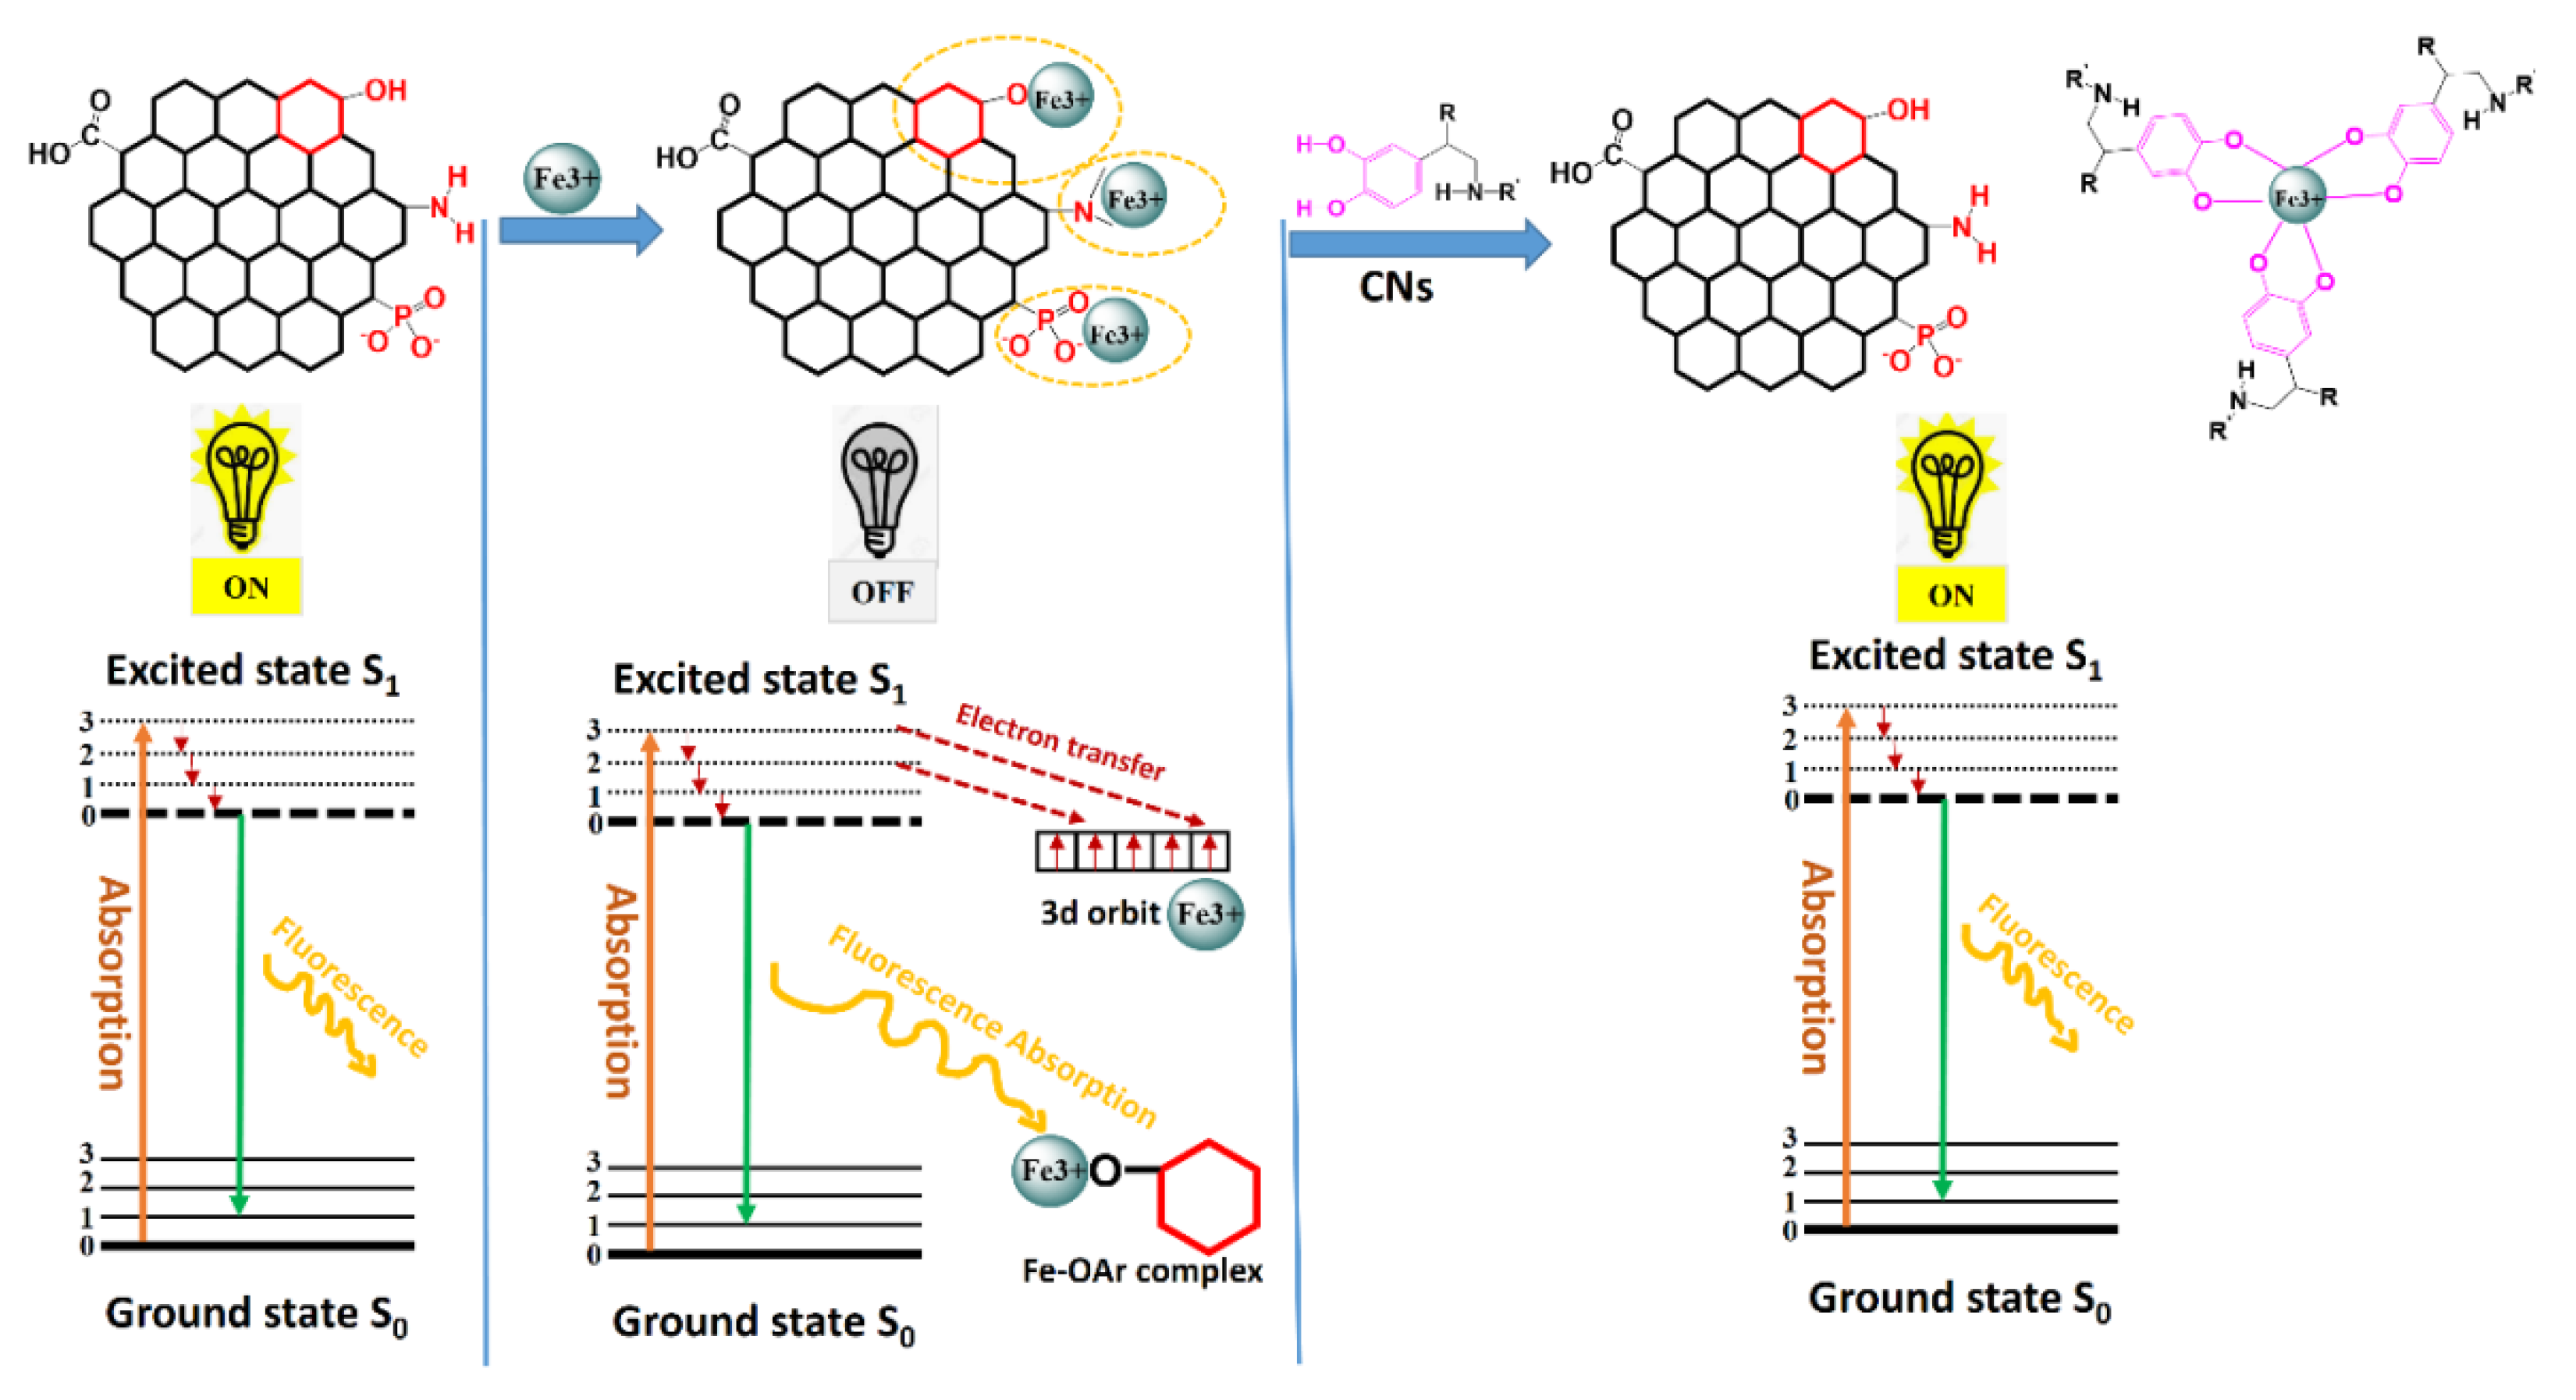
In this study, we used a hydrothermal approach to prepare nitrogen and phosphorus co-doped CDs with excellent fluorescent properties with independent emission behavior and stability over a wide pH range. Then, the as-prepared NPCDs were used in simple and rapid fluorescent bi-sensor for detecting both Fe3+ and CNs (in particular, we chose DA as the representative of CN group), which is based on an “off-on” fluorescence mechanism (Scheme 1). First, the fluorescence intensity of NPCDs was quenched in the presence of Fe3+. Then by adding CNs to the solution, the intensity of the NPCDs/Fe3+ probe was improved. In fact, CNs can reduce Fe3+ to Fe2+, which cannot cause the fluorescence quenching effect. Besides, the catechol group of CNs can interact with Fe3+ and then remove Fe3+ from the surface of NPCDs [31,32], therefore, the quenched fluorescence is recovered. It is clear to see that the fluorescent bi-sensor opens a new potential technique for the detection of Fe3+ and CNs because of its easy preparation, simple-operation, high efficiency, and in-expensive cost when compared with other sensing methods, which require expensive instruments and complex operating processes [28,33].
2. Experimental Details
2.1. Materials
All chemicals were purchased from Sigma–Aldrich and were used without further purification. Chemicals consist of citric acid monohydrate, (NH4)2HPO4, FeCl3, DA, AD, NAD, glucose, fructose, H2O2, urea, glycine, alanine, and phosphate buffer saline (PBS) (pH = 7.4). Deionized (DI) water was utilized in all the processes.
2.2. Instruments and Measurements
Transmission electron microscopy (TEM) was conducted using TEM (FEI, Tecnai, F30S-Twin). The UV-Vis spectra and photoluminescence (PL) were obtained using a G1103A UV-Vis spectrophotometer from Agilent, USA and a QuantaMaster TM 50 PTI spectrofluorometer from Photon Technology International, USA. QY was conducted on FLUORO Q2100. Zeta potential measurements were measured by electrophoretic light scattering (Photal Otsuka Electronics, ELS 8000). X-ray photoelectron spectroscope (XPS) spectra were obtained with an X-ray photoelectron spectrometer (PHI 5000, Japan). Fourier transform infrared (FTIR) spectroscopy measurements were carried out using a Nicolet 6700 spectrometer from Thermo Scientific.
2.3. Synthesis of NPCDs
A hydrothermal method was used to synthesize the NPCDs. In particular, 2 g citric acid monohydrate and 5 g (NH4)2HPO4 (molar ratio of 1:4) were mixed with 30 mL water. Next, the mixture was transferred into a Teflon-lined stainless steel autoclave with a capacity of 50 mL. Subsequently, the mixture was heated at 180 °C for 4 h. After cooling the autoclave to room temperature, a dark brown colored solution was obtained. First, this product solution was filtered through a 0.22 µm polyethersulfone membrane, then further dialyzed using a dialysis bag (MWCO: 1000 Da). After 48 h of dialyzing, the obtained light violet-colored solution was finally lyophilized to acquire a powdery substance for later characterization. Undoped CDs were prepared following the above method without adding (NH4)2HPO4.
2.4. Quantum Yield Measurement
The QY of NPCDs was measured by a comparative method using quinine sulfate in 0.1M H2SO4 as the standard (std) solution (QYstd = 0.54 at excitation wavelength of 360 nm, nstd = 1.33). The QY of NPCDs was calculated by Equation (1):
where Q, I, A, and n represent fluorescence quantum yield, integrated emission intensity, the refractive index of solvent, and absorbance, which is measured by UV-Vis spectrophotometer, respectively.
2.5. Procedure for Detecting Fe3+
The Fe3+ detecting process was conducted at room temperature. First, 60 µL of NPCDs were added to 3 mL DI water. Next, varying volumes of Fe3+ solution were dropped into the NPCDs solution to obtain different concentrations (0, 0.2, 0.5, 1, 3, 5, 10, 15, 20, 25, 30, 40, and 50 µM). The solution was further diluted to the mark using DI water and then was equilibrated for 1 min before fluorescence measurement under an excitation wavelength of 390 nm. This testing for each concentration was repeated three times.
2.6. Diagnosis of CNs
As mentioned in the Introduction, we choose DA as the representative of the CN group for investigation. In a specific test, 60 µL NPCDs were dropped into 3 mL of PBS (pH = 7.4) first. In order to form an NPCDs/Fe3+ probe, a fixed amount of Fe3+ was added to the solution. Then, to study the sensitivity of the NPCDs/Fe3+ probe towards DA, varying concentrations of DA (0, 2, 5, 10, 20, 50, 70, 90, 100, 120, 150, 200, 250, and 300 µM) were adjusted by adding different amount of DA solution to the mixture. The solution was further diluted to the point with DI water. After 10 min of incubation at room temperature, the fluorescence restore spectra were measured with an excitation wavelength of 390 nm. Measurements were taken in triplicate for each concentration.
In addition, to determine the selectivity of the NPCDs/Fe3+ probe towards DA, the effect and interferences of other reducing molecules were investigated.
3. Results and Discussions
Characterization of the NPCDs
Fluorescence and UV-Vis absorption spectroscopy were used to characterize the optical properties of NPCDs. The UV-Vis spectrum (Figure S1) shows that a small peak appears at 234 nm that lies next to a strong peak at 334 nm, which originated owing to trapped excited-state energy from surface states [1,18,34].
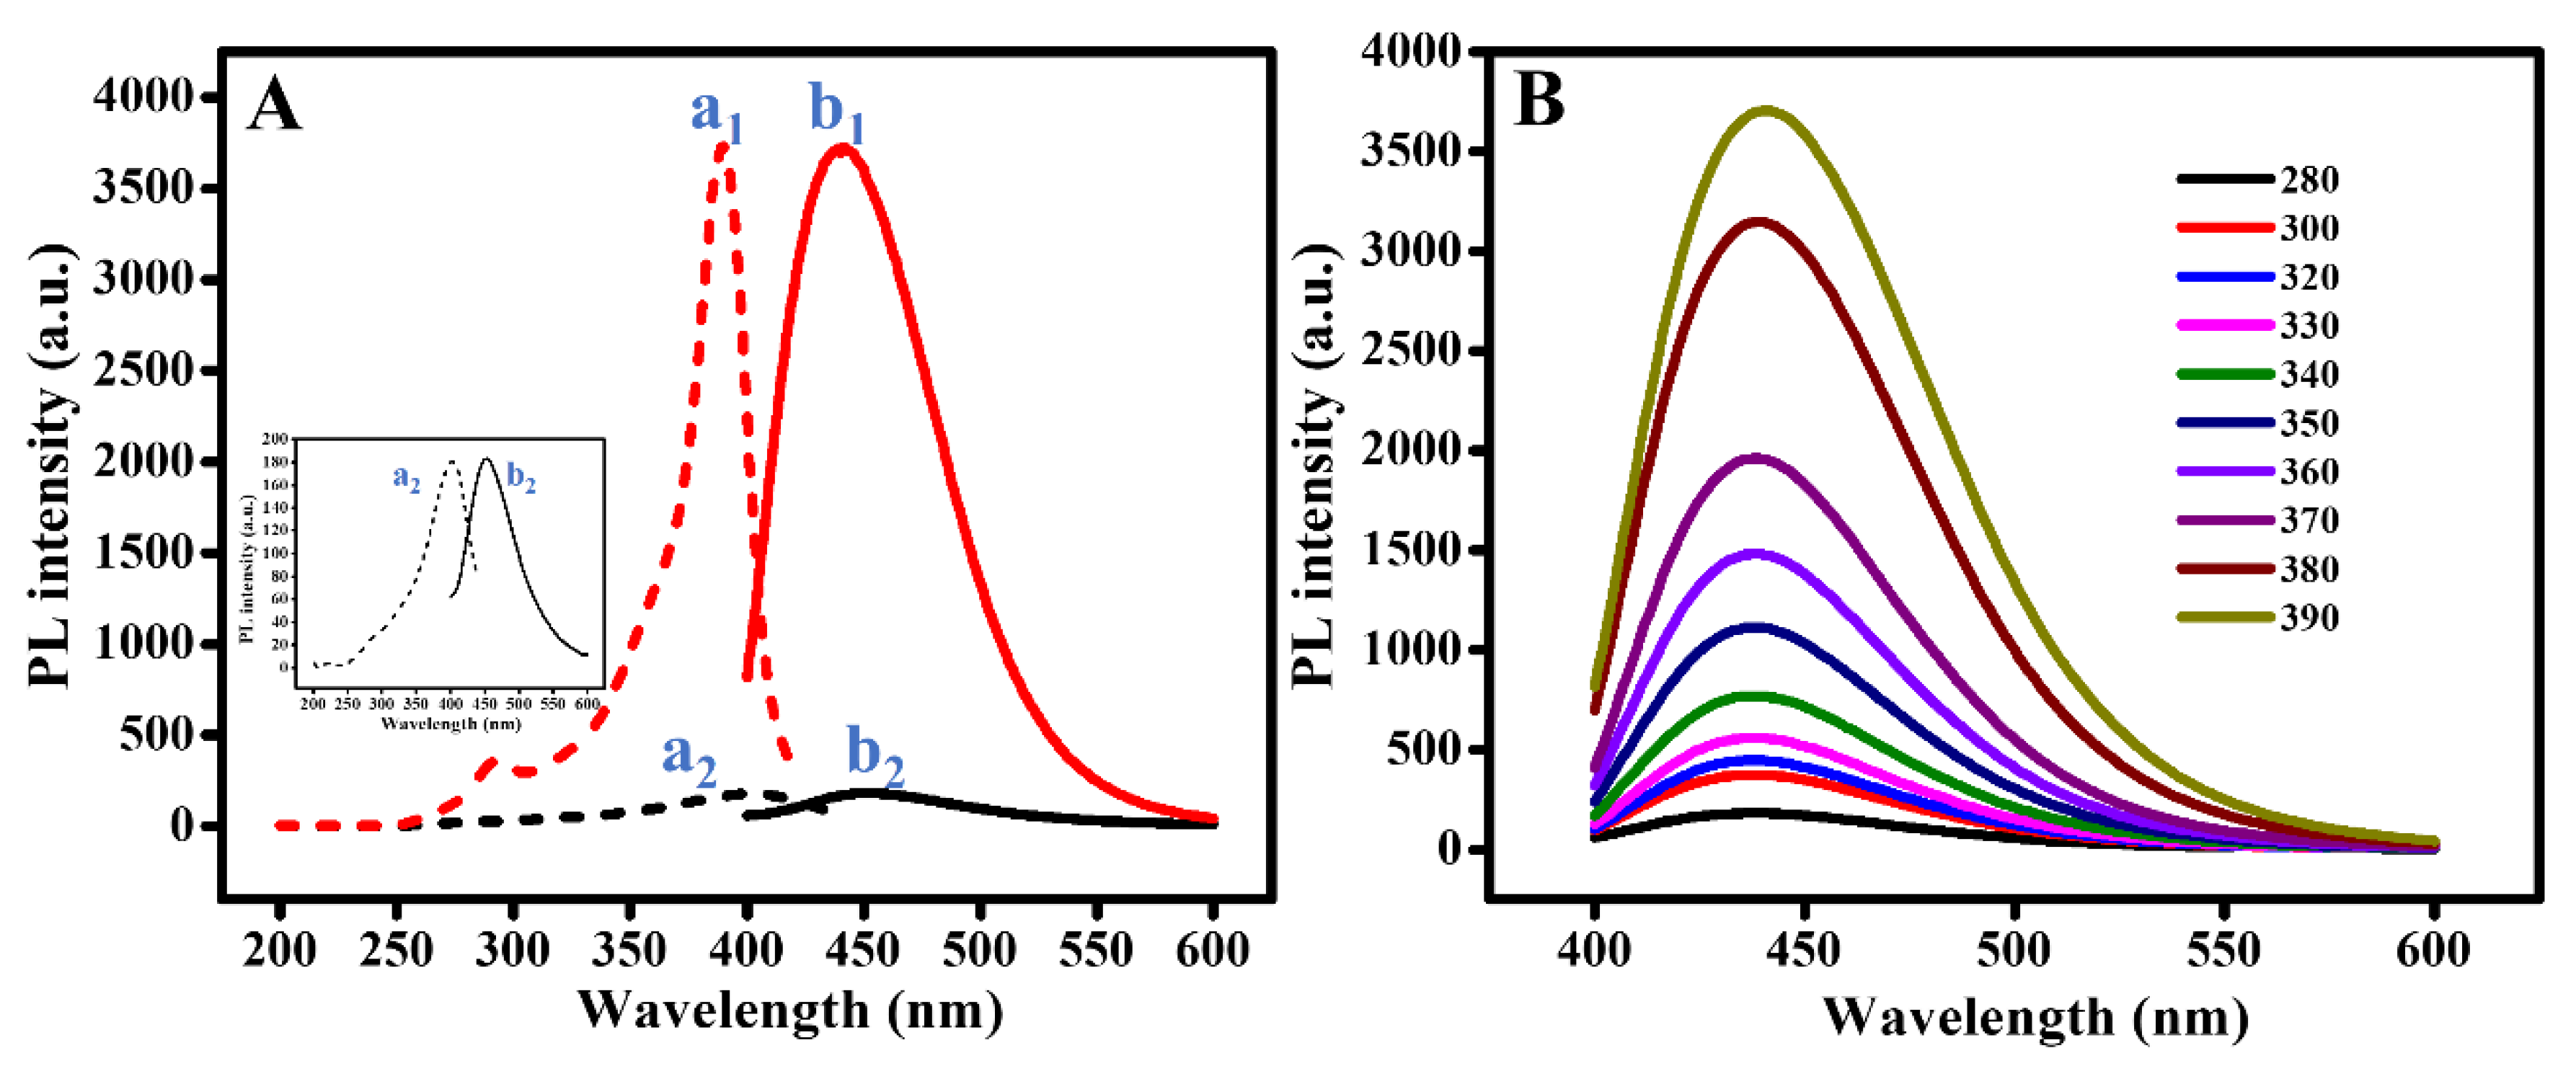
It can be seen from Figure 1A, the CDs fluorescence emission reached the maximum peak at 452 nm under an excitation wavelength of 402 nm, whereas the maximum fluorescence emission peak of the NPCDs was observed at a shorter wavelength of 440 nm when the excitation wavelength was 390 nm. In addition to the change in the location of the emission peaks, the fluorescence intensity of the NPCDs was sharply increased compared to that of the CDs alone. Moreover, NPCDs exhibited a QY of 84% that was four times greater than that of undoped CDs. In the Introduction, we explained the reason why N and P doping can enhance the fluorescence properties of CDs. Table 1 shows the QY comparison of our NPCDs with NPCDs prepared using different methods and CDs co-doped with other elements. It is clear to see that the NPCDs synthesized by our method have an excellent QY when compared to the others.
In addition, we investigated excitation-dependent fluorescence emissions of CDs and NPCDs solutions. As for CDs, when the value of the excitation wavelength was increased, the fluorescence intensity went up along with a red-shift (Figure S2). As for the NPCDs, Figure 1B shows that there was an enhancement in fluorescence intensity; however, there was no shift of emission peaks in the range of excitation wavelengths from 280 to 390 nm. The excitation-independence of the NPCDs indicates that the NPCDs had narrow size distributions and homogeneous surface structures; this was further confirmed using TEM results.
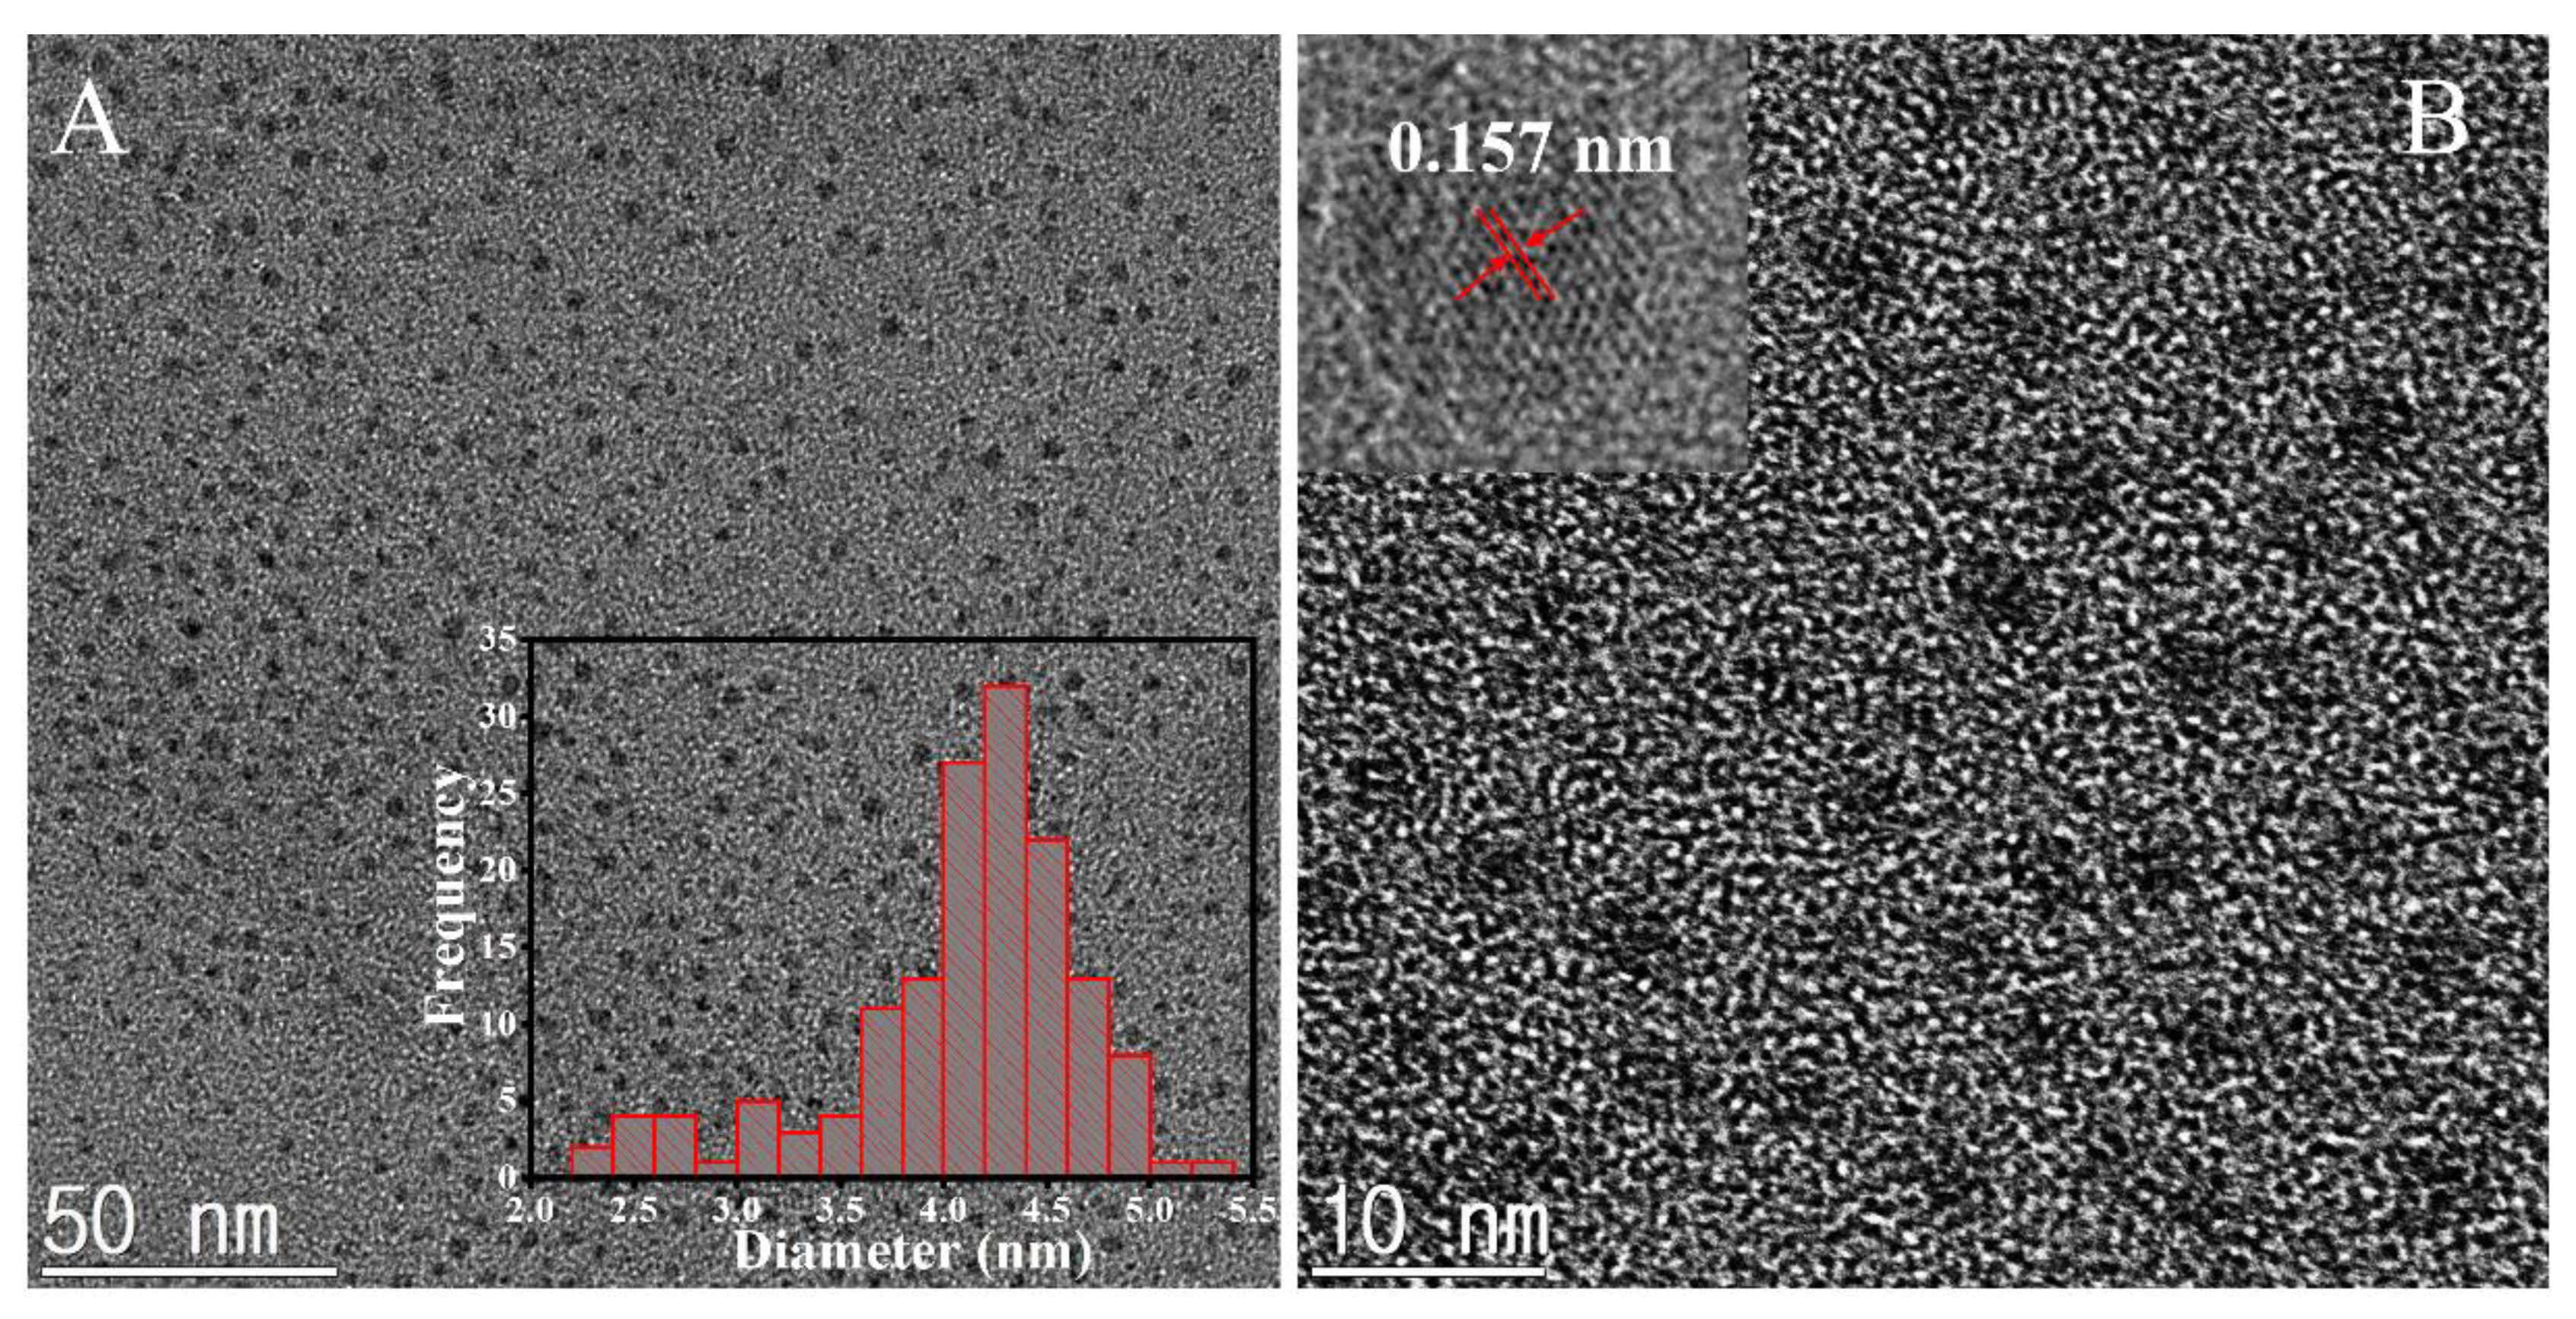
The morphologies of the NPCDs are displayed via TEM images. Moreover, particle size statistics were calculated by measuring 151 particles and the result displayed a narrow size distribution ranging from 2.3 to 5.3 nm. Monodisperse NPCDs were synthesized with an average size of 4.1 nm (standard deviation of 0.6 nm). In the high-resolution (HR) TEM image (inset of Figure 2B), the crystal structure of the CDs was visible and the lattice parameter was 0.157 nm, which was associated with graphitic diffraction planes [39,40].
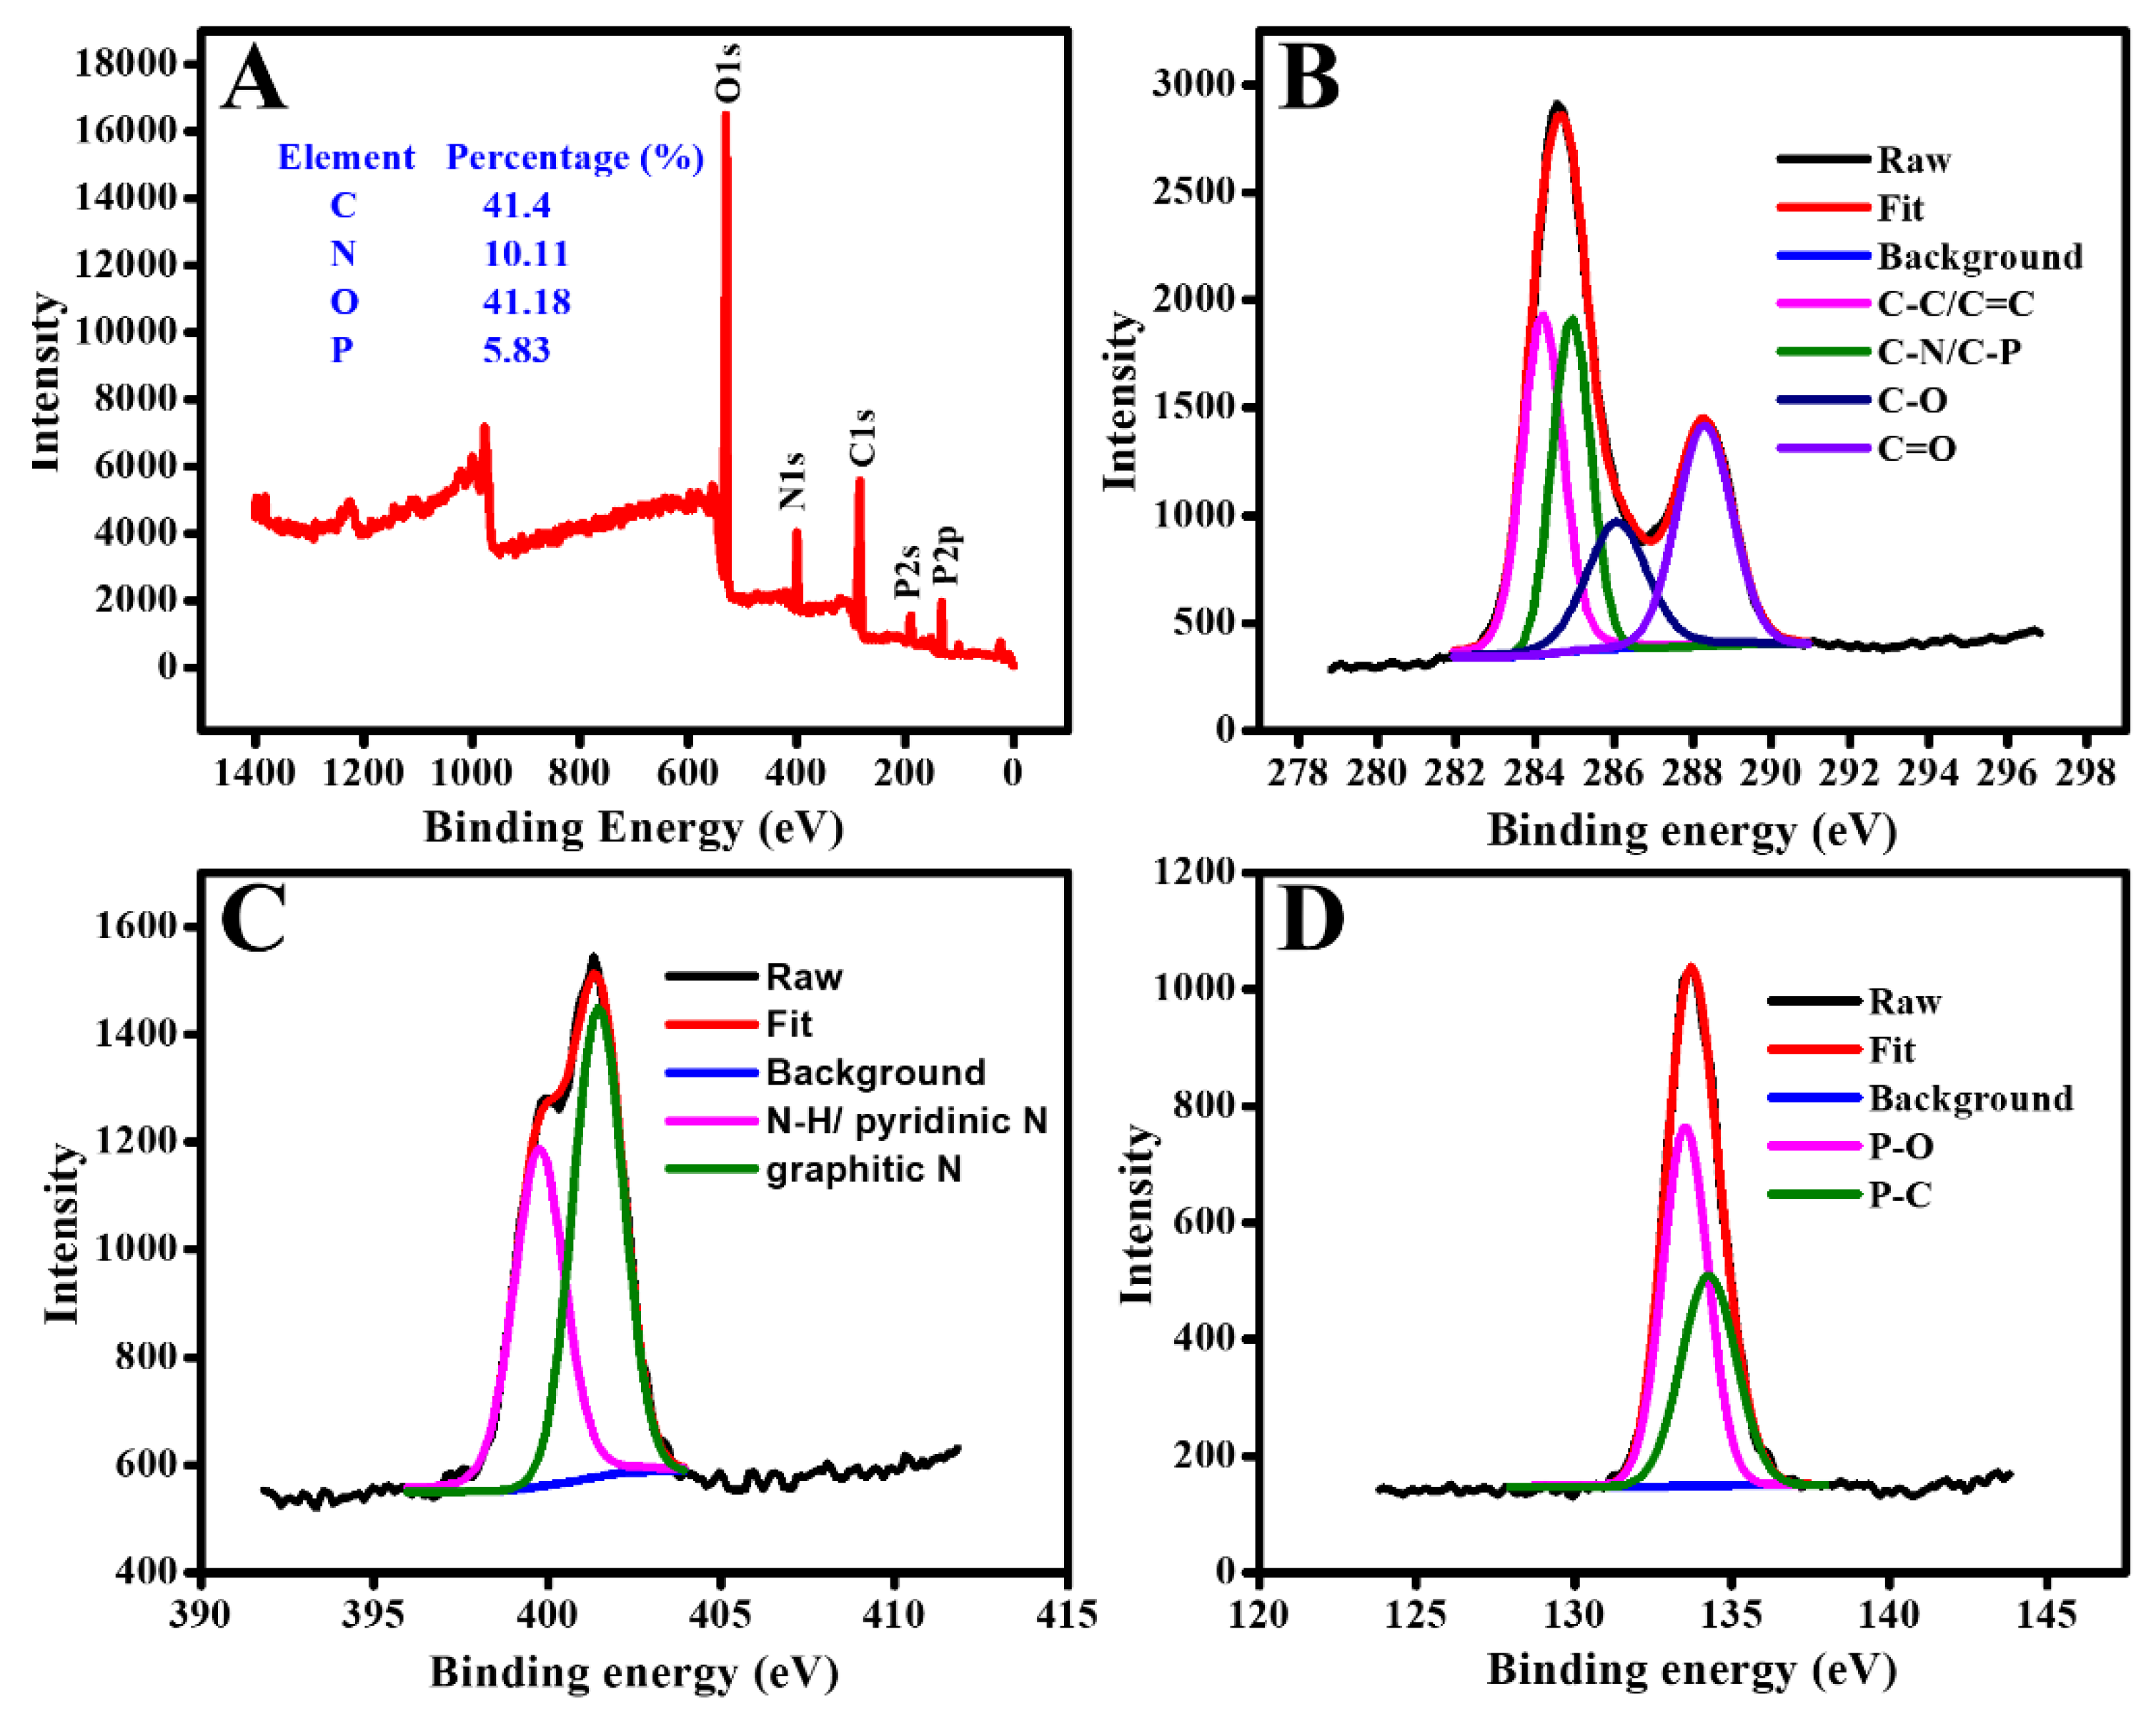
The XPS spectrum (Figure 3A) presents five typical peaks at 280.5, 399.5, 529.5, 187.6, and 132.3 eV, corresponding to C1s, N1s, O1s, P2s, and P2p, respectively. The atomic percentages of C, N, O, and P were analyzed to be 41.4%, 10.11%, 41.18%, and 5.83%, respectively, which confirmed that the CDs were incorporated with N and P. In Figure 3B, C1s peak can be parsed to four peaks placed at 284.2, 285, 286, and 288.4 eV, being suitable for C–C/C=C, C–N/C–P, C–O, and C=O bonds, respectively, originating from the sp2 graphitic structure [35] and several carboxyl, hydroxyl, amine, phosphate, etc. groups on the surface of the NPCDs; this can be further confirmed from the P2p and N1s spectra. The P2p spectrum (Figure 3D) presents two characteristic peaks, corresponding to P–O at 133.5 eV and P–C at 133.8 eV. With reference to the N1s spectrum (Figure 3C), N1s peak can be de-convoluted to a peak position at 399 eV in accord with the N–H bond of an amine group or pyridinic N and one located at 401.5 eV assigned to graphitic N [41,42].
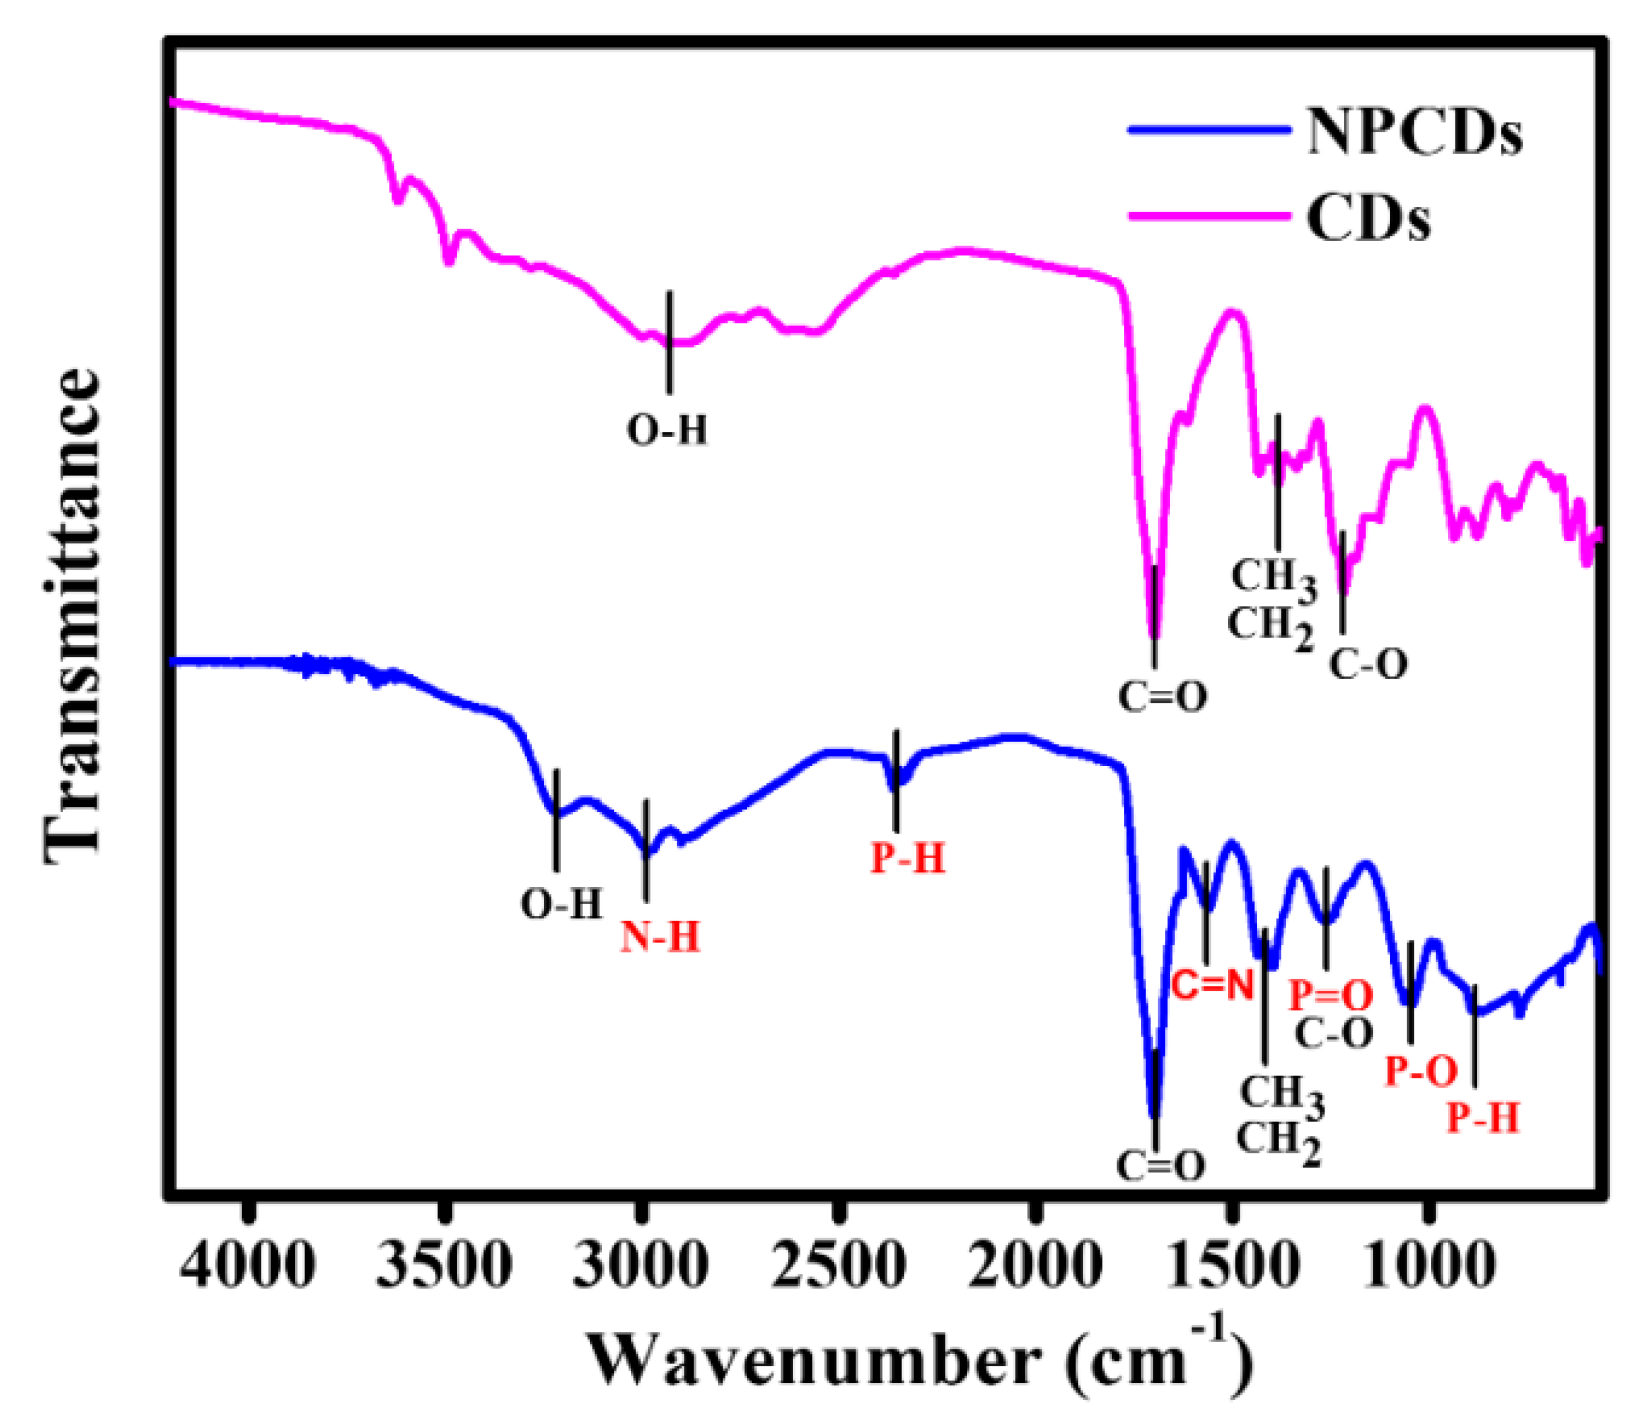
Moreover, we characterized CDs and NPCDs by FTIR spectra. It can be seen from Figure 4 that the spectrum of CDs shows main characteristic peaks, including a broad absorption band at 3300 to 2500 cm−1 that owe to O–H stretching of the carboxylic and hydroxyl groups; peaks at 1702 and 1211 cm−1, that result from the C=O bonding and C–O vibrations, respectively; and peaks at 1379 cm−1, which is due to the bending vibrations of the CH2 and CH3 groups. The spectrum of the NPCDs not only includes all the peaks belonging to the CDs, but further contains specific peaks indicating the existence of N and P elements. A broad peak in the range of 3000 to 2800 cm−1 is a consequence of N–H stretching whereas the peak at 1600 cm−1 is caused by C=N stretching vibration. The peaks appearing at 2332 cm−1 and 874 cm−1 are results of P–H stretching and bending, respectively. Moreover, P=O and P–O stretching vibrations lead to the appearance of peaks at 1259 cm−1 and 1047 cm−1, respectively. Consequently, the XPS result and FTIR spectra are consistent, confirming that N and P elements were successfully co-doped into the CDs.
4. Bi-Sensing of Fe3+ and CNs
4.1. Fe3+ Detection Based on NPCDs
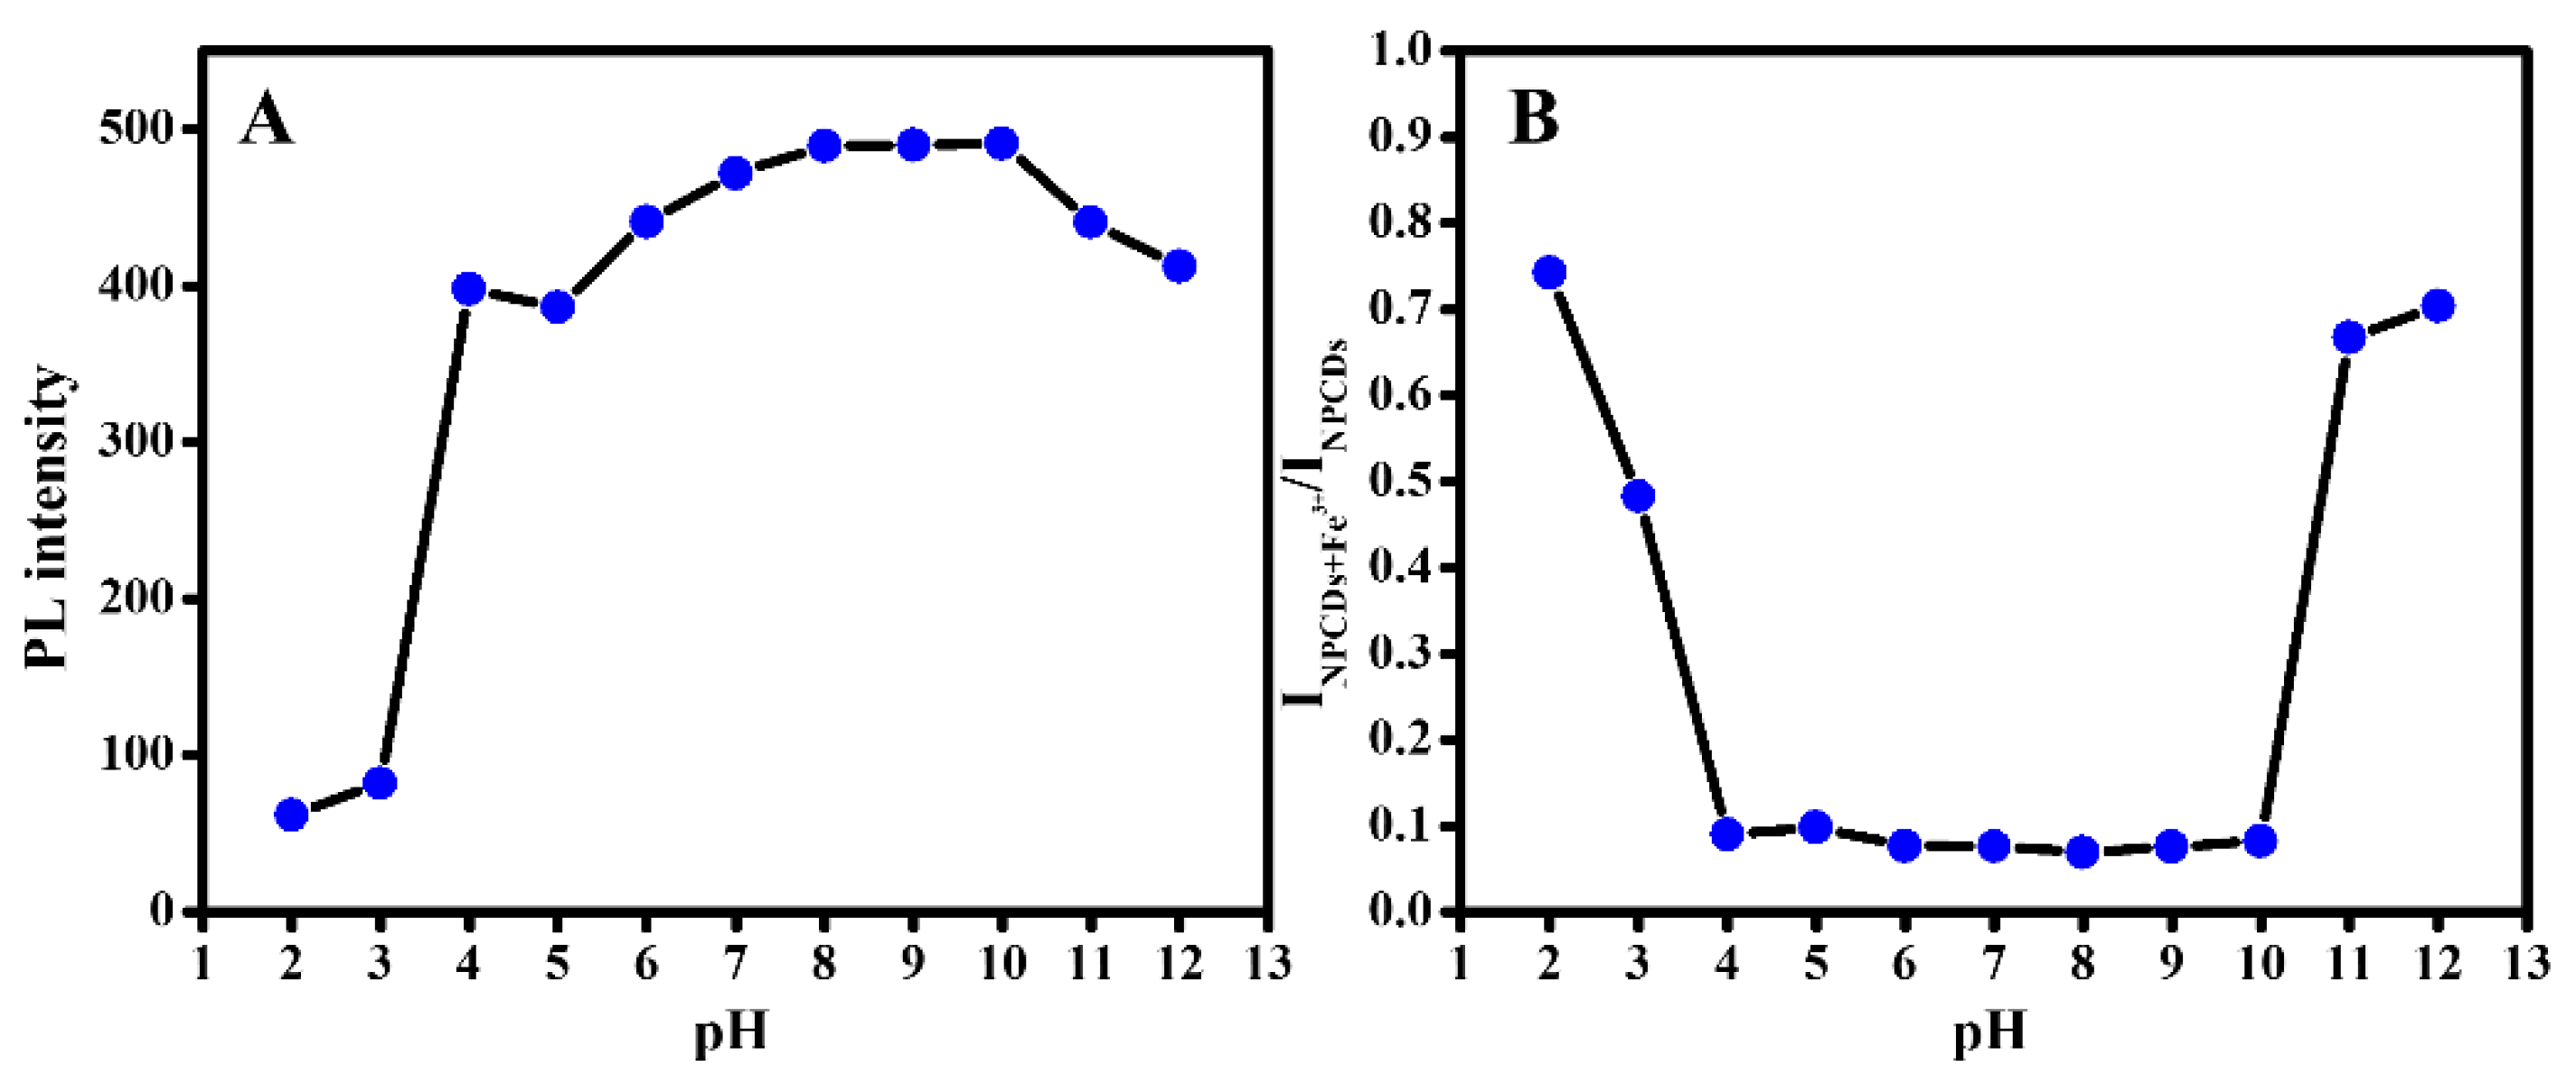
First, we investigated the pH influence that is important to NPCDs fluorescence intensity as well as NPCDs fluorescence response to Fe3+. Figure 5A displayed a very low fluorescence intensity of NPCDs in strongly acidic solutions. It reached to the maximum and kept stable in the range of pH from 7 to 10. In the presence of Fe3+ (Figure 5B), the quenching effect on NPCDs fluorescence intensity occurred strongly when the pH changed from 4 to 10. As for strongly alkaline conditions, Fe3+ ions are easily precipitated owing to the formation of a Fe–OH complex [43], which may affect the quenching phenomenon. From these results, we realized that a value of pH belonging in the range of 7 to 10 is suitable for Fe3+ detection. In particular, we chose PBS buffer (pH = 7.4) for this Fe3+ sensing.
Figure 6 clearly shows the quenching impact of Fe3+ on the fluorescence intensity of the NPCDs. The NPCDs fluorescence intensity went down steadily along with a very slight red-shift corresponding to the increase in Fe3+ concentration from 0.2 to 70 µM (Figure 6A). When the level of Fe3+ was within the range of 0 to 40 µM, the calibration curve between the relative NPCD fluorescence intensity and Fe3+ concentration displayed a good linear relationship with the quenching equation, i.e., INPCDs+Fe3+//INPCDs = 0.97994–0.01351 CM(Fe3+) and a correlation coefficient (R2) value of 0.99058. The experiment was repeated three times and data were expressed as the near ± standard deviation. Moreover, the LOD was determined to be approximately 0.2 µM, which is both considerably lower than the Fe3+ limitation amount in drinking water (5.4 µM) [44] and other previous methods [15,27,45]. Table 2 shows the comparison of our fluorescence probe results with others that have been developed for Fe3+ detection. It is clear that the present method provided excellent results for linear range and LOD. In addition, when investigating fluorescence responses of the NPCD probe to different metal cations, the NPCDs show high selectivity to Fe3+ (Figure S3).
4.2. NPCDs/Fe3+ as Fluorescence Probe for CN Detection
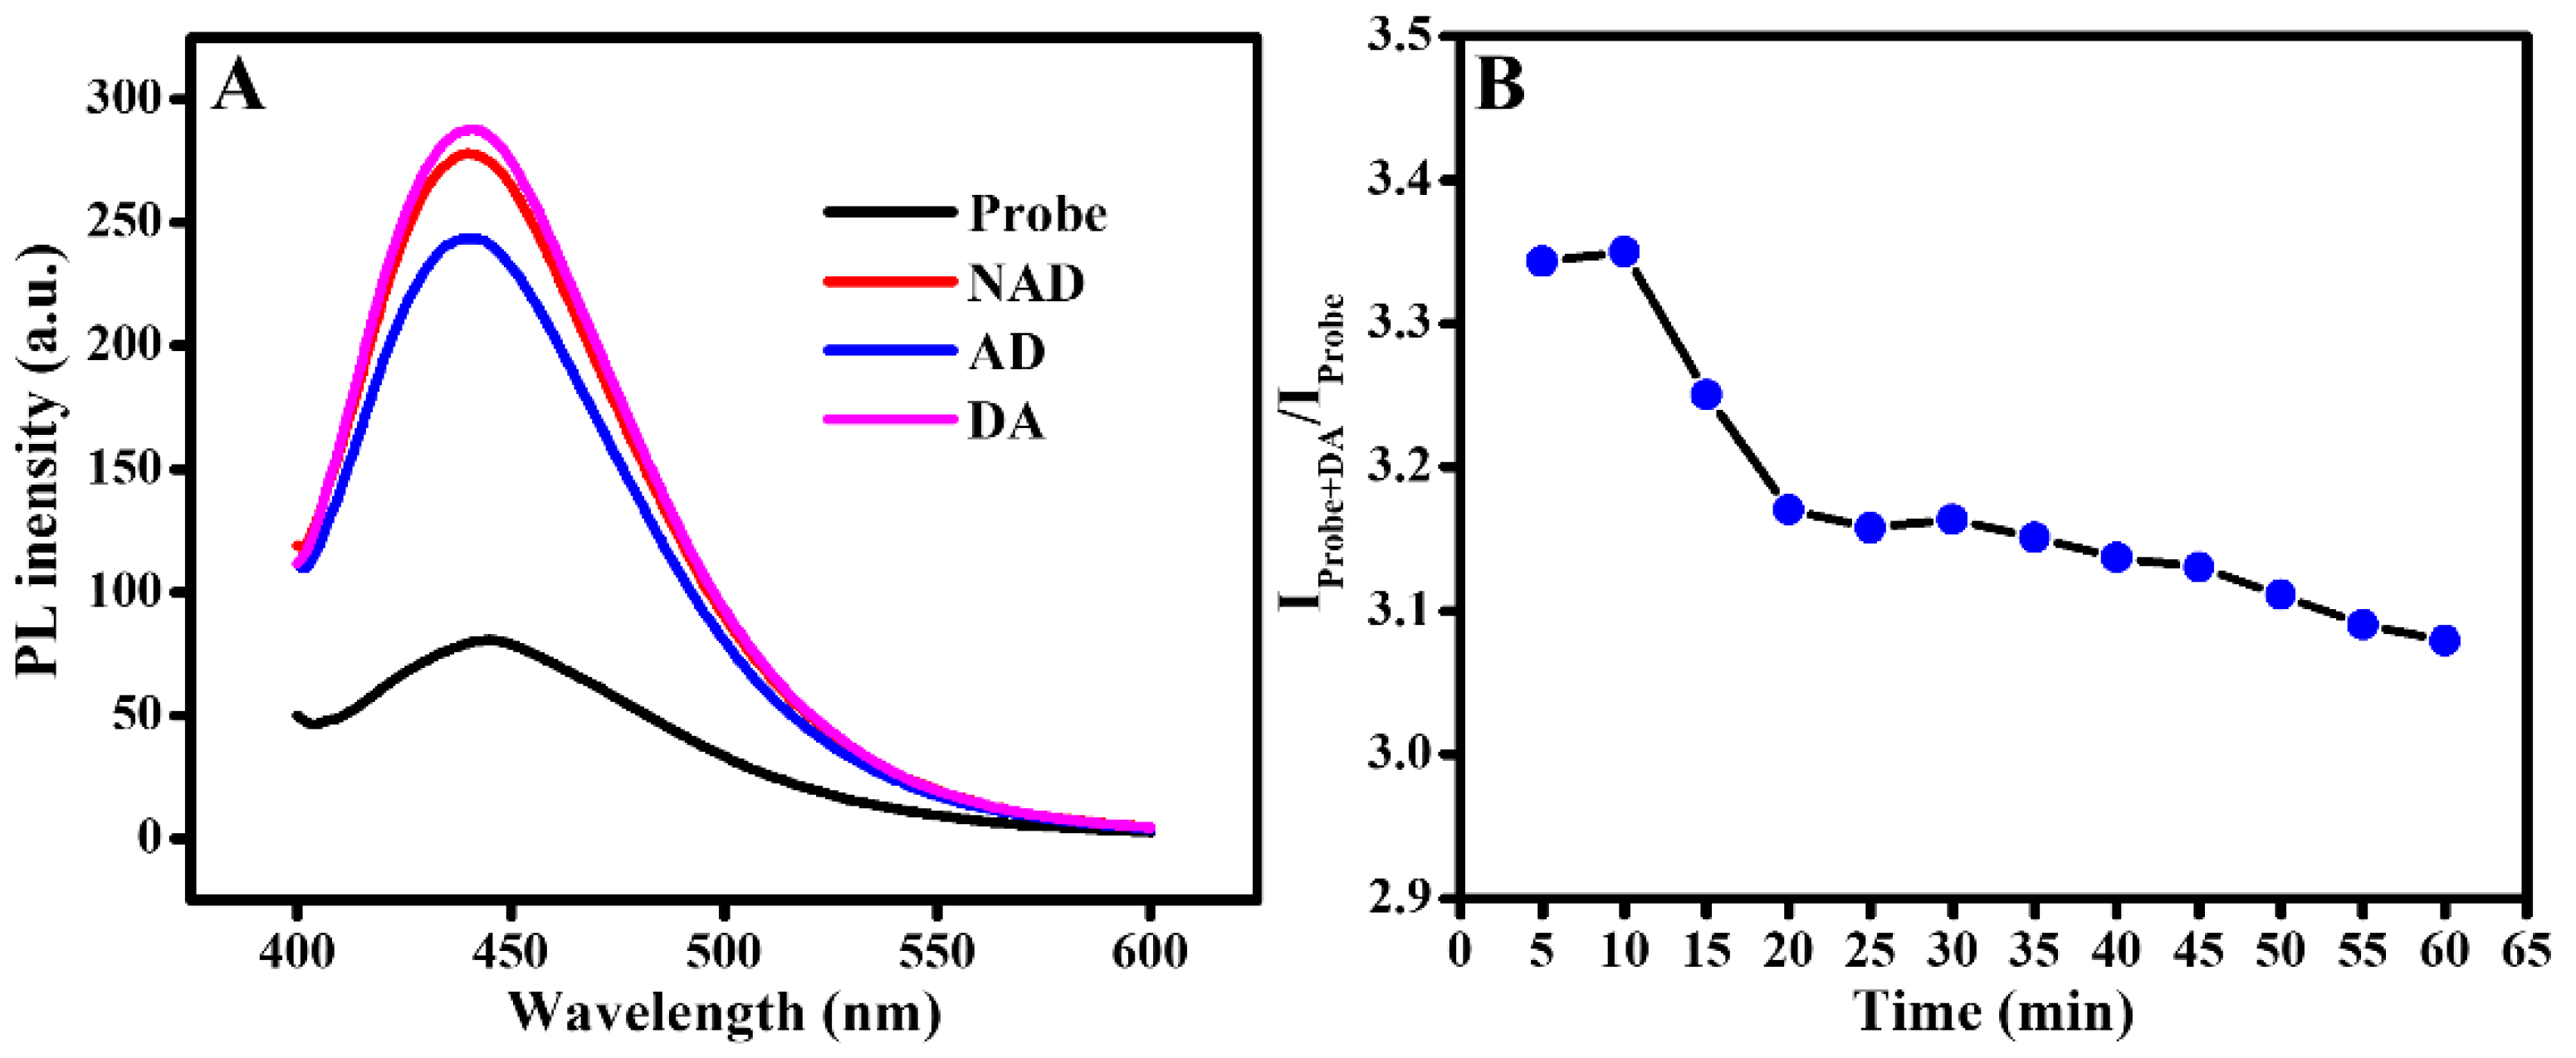
Figure 7A clearly shows that the fluorescence intensity of NPCDs/Fe3+ was recovered dramatically after a certain incubation period on adding CNs such as DA, AD, and NAD with the same concentrations of 5 µM. This confirms that we can use this fluorescence “turn on” phenomenon for the sensing of CNs. In particular, we chose DA—the most important neurotransmitter of the CN group as a representative to investigate further.
As mentioned above, NPCDs keep high fluorescence intensity in solutions with a pH of 7 to 10. In addition, according to previous reports, in alkaline solutions, adherent polydopamine will be produced through the self-polymerization process of DA [51,52], which is a drawback in the accurate detection of DA. Therefore, we used PBS (pH = 7.4) as a medium for DA determination. Moreover, time is an important factor affecting the fluorescence responses. After studying the fluorescence enhancement of NPCDs/Fe3+ probe towards DA by controlling time-dependent variations (Figure 7B), we observed that the optimized time required for detection is 10 min. The short time of incubation is a remarkable feature of this method.
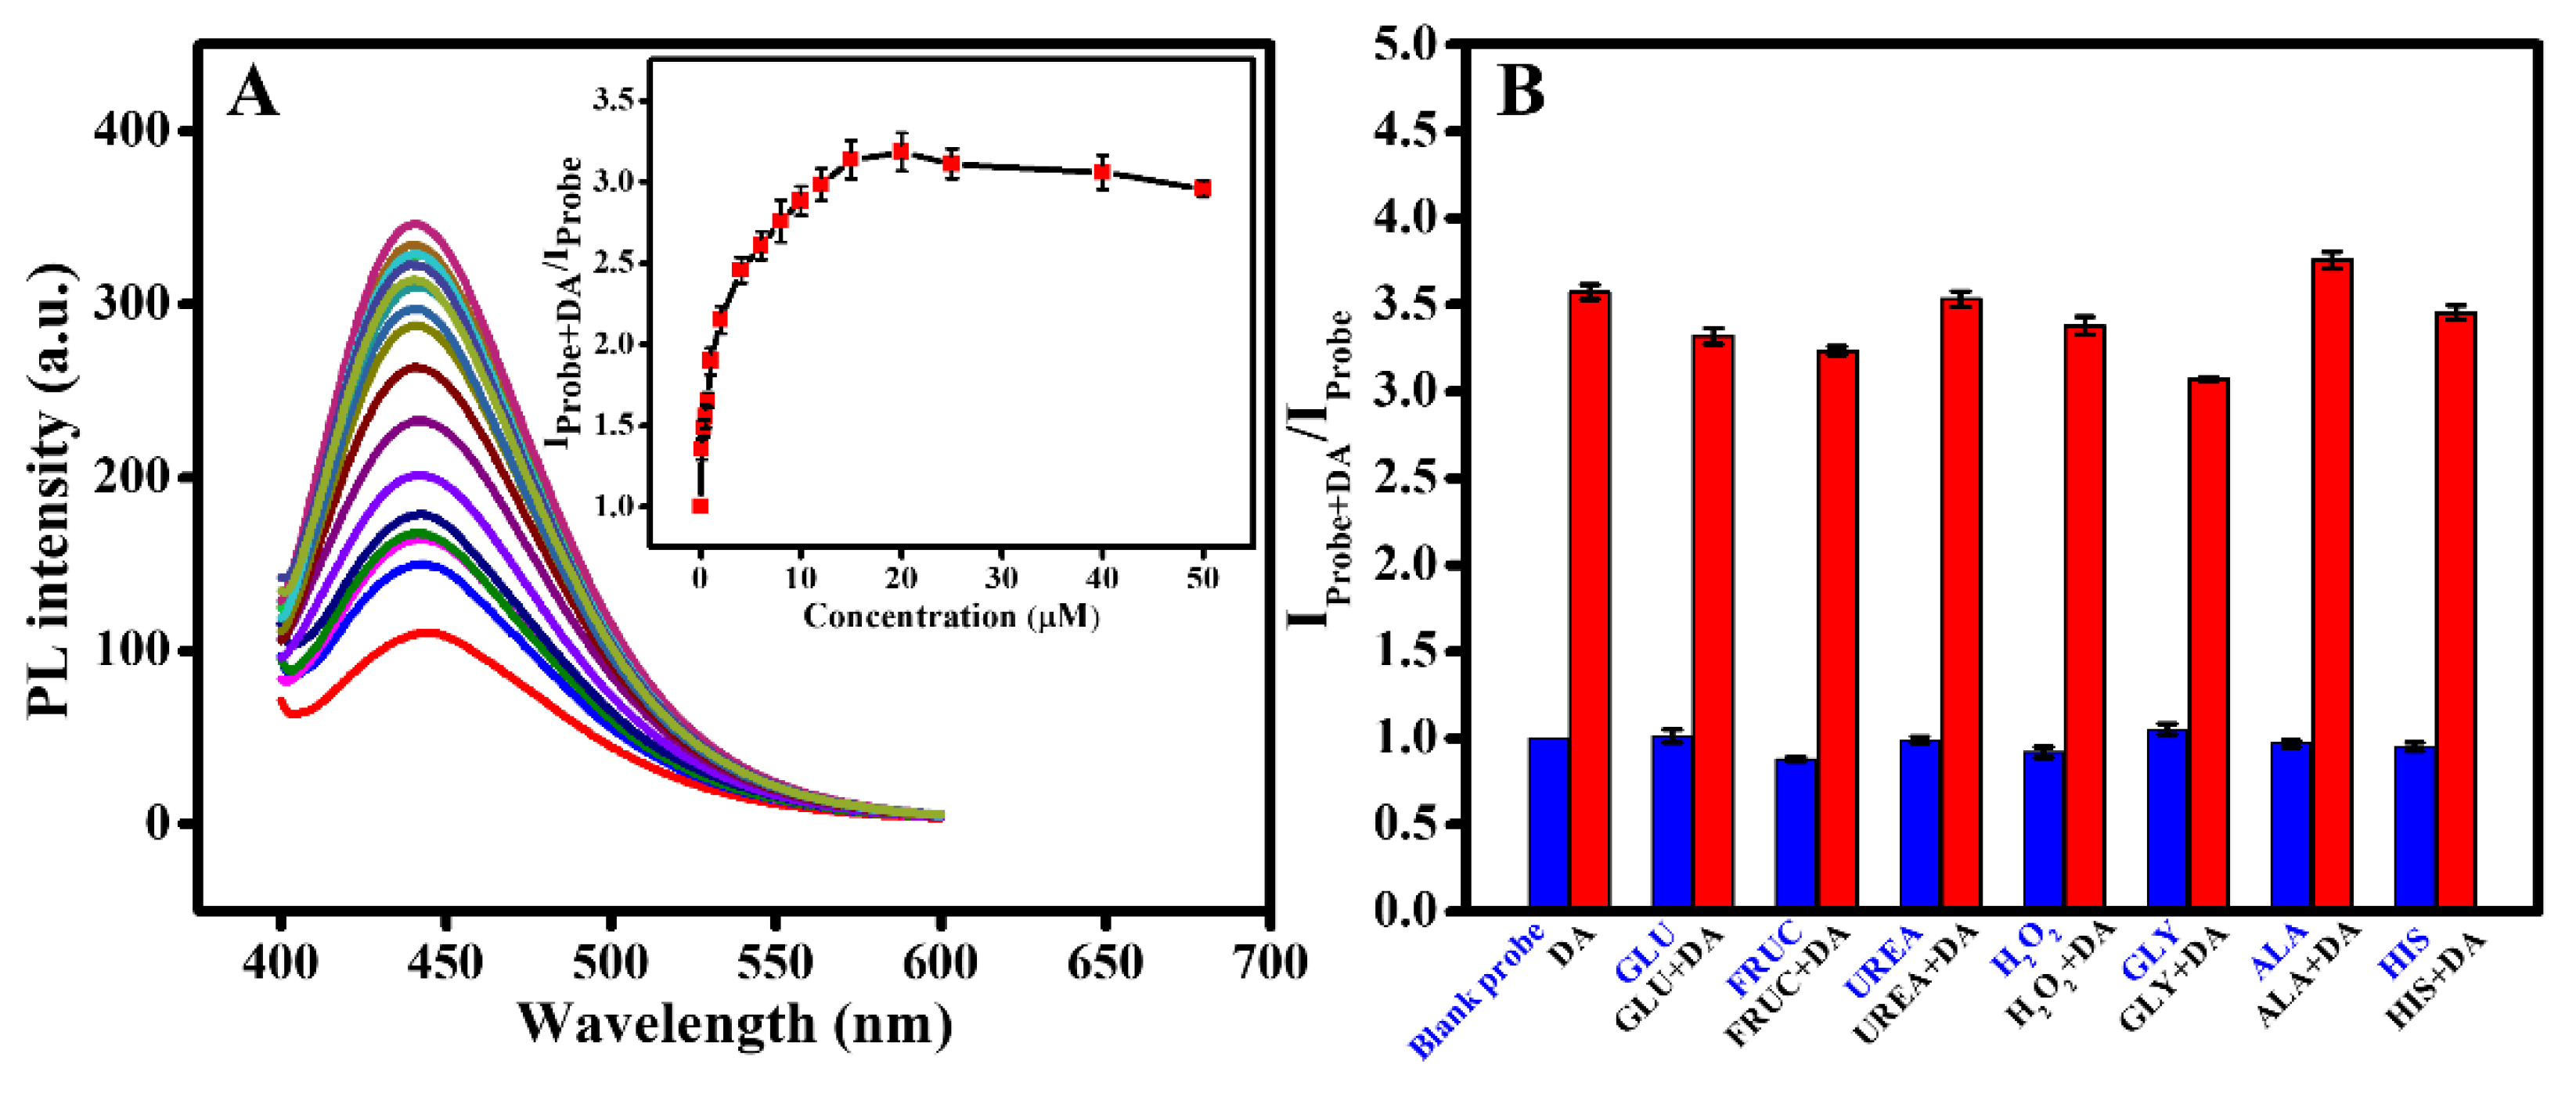
Figure 8A shows that fluorescence of the NPCDs/Fe3+ gradually increased in the existence of varying concentrations of DA from 0 to 20 µM. Thereafter, an increase in the level of DA did not enhance fluorescence intensity any further. Indeed, the fluorescence-enhanced efficiency showed a superb linear response to DA concentration from 4 to 15 µM with equation IProbe+DA/IProbe = 2.22411 + 0.0632 CM (DA) and R2 value of 0.9892. The experiment was repeated in triplicate and the data were expressed as mean ± standard deviations. A LOD of 0.1 µM is an acceptable value.
To verify the specificity of NPCDs/Fe3+ probe towards DA, the fluorescent responses of the probe in the presence of potentially interfering substances were investigated. As shown in Figure 8B, other analogs did not produce variations in the fluorescence intensity of NPCDs/Fe3+; however, on adding DA the fluorescence of the system enhanced significantly. It may be inferred that the enhancement effect did not occur with other substances and they did not have any effect on DA to turn on the fluorescence of the system, which showed that the NPCDs/Fe3+ probe exhibited excellent selectivity for CN detection.
4.3. “Off-On” Effect of Fe3+ and CNs on NPCDs Fluorescence
There are certain reasons for the quenching effect of Fe3+ on NPCDs fluorescence. First, Fe3+ may combine with amino and phosphoric acid groups belonging to the NPCDs surface, therefore, electrons may transfer from excited state S1 of the NPCDs to 3d half-filled orbits of Fe3+, result in quenching in fluorescence intensity [53]. This is confirmed by measuring the zeta potential value. After adding Fe3+, the zeta potential of NPCDs solution varied from −15.92 mV to −5.75 mV. Hence, there was an electrostatic interaction (electron exchange) between NPCDs and Fe3+. This was further supported by the dependence of Fe3+ detecting the performance of NPCDs over a wide pH range. Secondly, Fe3+ may coordinate with substantial phenol (Ar-OH) groups of NPCDs to form Fe–OAr complexes that work as absorbers to quench NPCD fluorescence and cause slightly red-shifted emission wavelengths [54,55]. Finally, there was a change in the average fluorescence lifetime of NPCDs from 2.47 ns (τ1 = 3.298 ns (74.33%), τ2 = 0.104 ns (25.67%)) to 1.86 ns (τ1 = 2.794 ns (63.72%), τ2 = 0.206 ns (36.28%)) in the existence of Fe3+; this confirmed that dynamic quenching occurred during this process [56].
In the case of adding CNs to NPCDs/Fe3+ solution, there is an assumption that CNs can reduce Fe3+ to Fe2+ that cannot cause a fluorescence quenching effect leading to fluorophore formation. The main reason is that the catechol group of CNs can interact with Fe3+ and then remove Fe3+ from the surface of NPCDs [31,32] such that they can inhibit electron movement and fluorescence absorption process between them; therefore, the quenched fluorescence is recovered. This is the reason why, in particular when adding DA, the value of the zeta potential and average fluorescence lifetime was recovered to −12.05 mV and 2.094 ns (τ1 = 3.264 ns (63.05%), τ2 = 0.1001 ns (36.95%)), respectively. The mechanism is clearly described in Scheme 2.
5. Conclusions
We successfully synthesized nitrogen and phosphorus co-doped CDs comprising outstanding fluorescence properties compared to those of traditional undoped CDs. We applied NPCDs to design a bi-sensor for the detection of Fe3+ and CNs relying on an “off-on” mechanism. The fluorescence of NPCDs was quenched with an increase in Fe3+ concentration, and a linear range of 0 to 40 µM with a LOD value of 0.2 µM was obtained. After adding Fe3+, the NPCDs/Fe3+ system was formed, which acted as a fluorescence probe to determine CNs. The fluorescence of NPCDs/Fe3+ was recovered in the presence of CNs. We selected DA—the most important neurotransmitter of the CN group in our study—and the results displayed a superb linear range of 4 to 15 µM with an LOD value of 0.1 µM. With remarkable features such as simple design, speed, sensitivity, and selectivity, the sensor developed in this study establishes a strategy for successful application in the sensing of Fe3+ and CNs in real samples and furthers the development of simple, low cost, and sensitive sensors for potential applications in biomedical systems and environments.
Supplementary Materials
The following are available online at https://www.mdpi.com/1424-8220/20/12/3470/s1, Figure S1: UV-vis absorption spectrum of NPCDs; Figure S2: Fluorescence spectra of the CDs at different excitation; Figure S3: Selectivity of NPCDs for assaying Fe3+. All metal cations have same concentration of 50 μM.
Author Contributions
Investigation, T.H.L.; Formal analysis, J.H.K.; Methodology, H.J.L.; Supervision, S.J.P. All authors have read and agreed to the published version of the manuscript.
Funding
This research was supported by the Basic Science Research Capacity Enhancement Project through Korea Basic Science Institute (National research Facilities and Equipment Center) grant funded by the Ministry of Education (Grant No. 2019R1A6C1010016).
Conflicts of Interest
The authors declare no conflict of interest.
References
- Ming, F.L.; Hou, J.Z.; Hou, C.J.; Yang, M.; Wang, X.F.; Li, J.W.; Huo, D.Q.; He, Q. One-step synthesized fluorescent nitrogen doped carbon dots from thymidine for Cr (VI) detection in water. Spectroc. Acta Part A Mol. Biomol. Spectr. 2019, 222, 8. [Google Scholar] [CrossRef] [PubMed]
- Wu, X.R.; Wu, L.N.; Cao, X.Z.; Li, Y.; Liu, A.R.; Liu, S.Q. Nitrogen-doped carbon quantum dots for fluorescence detection of Cu2+ and electrochemical monitoring of bisphenol A. RSC Adv. 2018, 8, 20000–20006. [Google Scholar] [CrossRef] [Green Version]
- Ding, C.; Deng, Z.; Chen, J.; Jin, Y. One-step microwave synthesis of N,S co-doped carbon dots from 1,6-hexanediamine dihydrochloride for cell imaging and ion detection. Colloids Surf. B Biointerfaces 2020, 189, 110838. [Google Scholar] [CrossRef] [PubMed]
- Liu, C.; Wang, R.J.; Wang, B.; Deng, Z.Q.; Jin, Y.Z.; Kang, Y.J.; Chen, J.C. Orange, yellow and blue luminescent carbon dots controlled by surface state for multicolor cellular imaging, light emission and illumination. Microchim. Acta. 2018, 185, 8. [Google Scholar] [CrossRef]
- Chen, J.; Liu, J.; Li, J.; Xu, L.; Qiao, Y. One-pot synthesis of nitrogen and sulfur co-doped carbon dots and its application for sensor and multicolor cellular imaging. J. Colloid Interface Sci. 2017, 485, 167–174. [Google Scholar] [CrossRef]
- Long, R.Q.; Guo, Y.; Xie, L.W.; Shi, S.Y.; Xu, J.J.; Tong, C.Y.; Lin, Q.L.; Li, T. White pepper-derived ratiometric carbon dots for highly selective detection and imaging of coenzyme A. Food Chem. 2020, 315. [Google Scholar] [CrossRef]
- Adhikari, J.; Rizwan, M.; Keasberry, N.A.; Ahmed, M.U. Current progresses and trends in carbon nanomaterials-based electrochemical and electrochemiluminescence biosensors. J. Chin. Chem. Soc. 2020. [Google Scholar] [CrossRef]
- Sun, S.J.; Guan, Q.W.; Liu, Y.; Wei, B.; Yang, Y.Y.; Yu, Z.Q. Highly luminescence manganese doped carbon dots. Chin. Chem. Lett. 2019, 30, 1051–1054. [Google Scholar] [CrossRef]
- Zhao, P.; Xu, Q.; Tao, J.; Jin, Z.; Pan, Y.; Yu, C.; Yu, Z. Near infrared quantum dots in biomedical applications: Current status and future perspective. Wiley Interdiscipl. Rev. Nanomed. Nanobiotechnol. 2018, 10, e1483. [Google Scholar] [CrossRef]
- Lu, S.; Xiao, G.; Sui, L.; Feng, T.; Yong, X.; Zhu, S.; Li, B.; Liu, Z.; Zou, B.; Jin, M.; et al. Piezochromic Carbon Dots with Two-photon Fluorescence. Angew. Chem. Int. Ed. Engl. 2017, 56, 6187–6191. [Google Scholar] [CrossRef]
- Tao, S.; Lu, S.; Geng, Y.; Zhu, S.; Redfern, S.A.T.; Song, Y.; Feng, T.; Xu, W.; Yang, B. Design of Metal-Free Polymer Carbon Dots: A New Class of Room-Temperature Phosphorescent Materials. Angew. Chem. Int. Ed. Engl. 2018, 57, 2393–2398. [Google Scholar] [CrossRef] [PubMed]
- Wang, Q.; Zhang, S.J.; Wang, B.Y.; Yang, X.Y.; Zou, B.; Yang, B.; Lu, S.Y. Pressure-triggered aggregation-induced emission enhancement in red emissive amorphous carbon dots. Nanoscale Horiz. 2019, 4, 1227–1231. [Google Scholar] [CrossRef]
- Lu, S.Y.; Sui, L.Z.; Wu, M.; Zhu, S.J.; Yong, X.; Yang, B. Graphitic Nitrogen and High-Crystalline Triggered Strong Photoluminescence and Room-Temperature Ferromagnetism in Carbonized Polymer Dots. Adv. Sci. 2019, 6. [Google Scholar] [CrossRef] [PubMed]
- Li, W.D.; Liu, Y.; Wu, M.; Feng, X.L.; Redfern, S.A.T.; Shang, Y.; Yong, X.; Feng, T.; Wu, K.F.; Liu, Z.Y.; et al. Carbon-Quantum-Dots-Loaded Ruthenium Nanoparticles as an Efficient Electrocatalyst for Hydrogen Production in Alkaline Media. Adv. Mater. 2018, 30, 8. [Google Scholar] [CrossRef] [PubMed]
- He, S.L.; Qi, S.W.; Sun, Z.C.; Zhu, G.S.; Zhang, K.; Chen, W.W. Si, N-codoped carbon dots: Preparation and application in iron overload diagnosis. J. Mater. Sci. 2019, 54, 4297–4305. [Google Scholar] [CrossRef]
- Du, Y.; Guo, S.J. Chemically doped fluorescent carbon and graphene quantum dots for bioimaging, sensor, catalytic and photoelectronic applications. Nanoscale 2016, 8, 2532–2543. [Google Scholar] [CrossRef]
- Xu, Q.; Kuang, T.R.; Liu, Y.; Cai, L.L.; Peng, X.F.; Sreeprasad, T.S.; Zhao, P.; Yu, Z.Q.; Li, N. Heteroatom-doped carbon dots: Synthesis, characterization, properties, photoluminescence mechanism and biological applications. J. Mater. Chem. B 2016, 4, 7204–7219. [Google Scholar] [CrossRef]
- Wang, W.J.; Peng, J.W.; Li, F.M.; Su, B.Y.; Chen, X.; Chen, X.M. Phosphorus and chlorine co-doped carbon dots with strong photoluminescence as a fluorescent probe for ferric ions. Microchim. Acta 2019, 186. [Google Scholar] [CrossRef]
- Wu, F.S.; Yang, M.Q.; Zhang, H.; Zhu, S.Z.; Zhu, X.J.; Wang, K. Facile synthesis of sulfur-doped carbon quantum dots from vitamin B1 for highly selective detection of Fe3+ ion. Opt. Mater. 2018, 77, 258–263. [Google Scholar] [CrossRef]
- Kundu, S.; Yadav, R.M.; Narayanan, T.N.; Shelke, M.V.; Vajtai, R.; Ajayan, P.M.; Pillai, V.K. Synthesis of N, F and S co-doped graphene quantum dots. Nanoscale 2015, 7, 11515–11519. [Google Scholar] [CrossRef]
- Wu, B.; Shi, X.F.; Han, W.; Wang, T.S.; Wang, C.R.; Jiang, L. A double fluorescent nanoprobe based on phosphorus/nitrogen co-doped carbon dots for detecting dichromate ions and dopamine. RSC Adv. 2018, 8, 31793–31802. [Google Scholar] [CrossRef] [Green Version]
- Lin, L.P.; Wang, Y.H.; Xiao, Y.L.; Liu, W. Hydrothermal synthesis of carbon dots codoped withnitrogen and phosphorusas a turn-on fluorescent probe for cadmium(II). Microchim. Acta 2019, 186, 7. [Google Scholar] [CrossRef] [PubMed]
- Yang, F.; He, X.; Wang, C.X.; Cao, Y.; Li, Y.; Yan, L.N.; Liu, M.M.; Lv, M.Z.; Yang, Y.N.; Zhao, X.; et al. Controllable and eco-friendly synthesis of P-riched carbon quantum dots and its application for copper (II) ion sensing. Appl. Surf. Sci. 2018, 448, 589–598. [Google Scholar] [CrossRef]
- Shi, B.F.; Su, Y.B.; Zhang, L.L.; Huang, M.J.; Liu, R.J.; Zhao, S.L. Nitrogen and Phosphorus Co-Doped Carbon Nanodots as a Novel Fluorescent Probe for Highly Sensitive Detection of Fe3+ in Human Serum and Living Cells. ACS Appl. Mater. Interfaces 2016, 8, 10717–10725. [Google Scholar] [CrossRef] [PubMed]
- Walker, E.M.; Walker, S.M. Review: Effects of iron overload on the immune system. Ann. Clin. Lab. Sci. 2000, 30, 354–365. [Google Scholar] [PubMed]
- Badawy, S.M.; Liem, R.I.; Rigsby, C.K.; Labotka, R.J.; DeFreitas, R.A.; Thompson, A.A. Assessing cardiac and liver iron overload in chronically transfused patients with sickle cell disease. Br. J. Haematol. 2016, 175, 705–713. [Google Scholar] [CrossRef]
- Lan, M.H.; Zhao, S.J.; Wei, X.F.; Zhang, K.; Zhang, Z.Y.; Wu, S.L.; Wang, P.F.; Zhang, W.J. Pyrene-derivatized highly fluorescent carbon dots for the sensitive and selective determination of ferric ions and dopamine. Dyes Pigments 2019, 170. [Google Scholar] [CrossRef]
- Pradhan, T.; Jung, H.S.; Jang, J.H.; Kim, T.W.; Kang, C.; Kim, J.S. Chemical sensing of neurotransmitters. Chem. Soc. Rev. 2014, 43, 4684–4713. [Google Scholar] [CrossRef]
- Ghasemi, F.; Hormozi-Nezhad, M.R.; Mahmoudi, M. Identification of catecholamine neurotransmitters using fluorescence sensor array. Anal. Chim. Acta 2016, 917, 85–92. [Google Scholar] [CrossRef]
- Mekassa, B.; Tessema, M.; Chandravanshi, B.S.; Baker, P.G.L.; Muya, F.N. Sensitive electrochemical determination of epinephrine at poly(L-aspartic acid)/electro-chemically reduced graphene oxide modified electrode by square wave voltammetry in pharmaceutics. J. Electroanal. Chem. 2017, 807, 145–153. [Google Scholar] [CrossRef]
- Yang, J.; Stuart, M.A.C.; Kamperman, M. Jack of all trades: Versatile catechol crosslinking mechanisms. Chem. Soc. Rev. 2014, 43, 8271–8298. [Google Scholar] [CrossRef] [PubMed]
- Sandrini, S.M.; Shergill, R.; Woodward, J.; Muralikuttan, R.; Haigh, R.D.; Lyte, M.; Freestone, P.P. Elucidation of the Mechanism by Which Catecholamine Stress Hormones Liberate Iron from the Innate Immune Defense Proteins Transferrin and Lactoferrin. J. Bacteriol. 2010, 192, 587–594. [Google Scholar] [CrossRef] [PubMed] [Green Version]
- Huang, J.Y.; Xu, W.T.; Gong, Y.Q.; Weng, S.H.; Lin, X.H. Selective and Reliable Electrochemical Sensor Based on Polythionine/AuNPs Composites for Epinephrine Detection in Serum. Int. J. Electrochem. Sci. 2016, 11, 8193–8203. [Google Scholar] [CrossRef]
- Amjadi, M.; Hallaj, T.; Manzoori, J.L.; Shahbazsaghir, T. An amplified chemiluminescence system based on Si-doped carbon dots for detection of catecholamines. Spectroc. Acta Part A Mol. Biomol. Spectr. 2018, 201, 223–228. [Google Scholar] [CrossRef] [PubMed]
- Xu, Q.; Li, B.F.; Ye, Y.C.; Cai, W.; Li, W.J.; Yang, C.Y.; Chen, Y.S.; Xu, M.; Li, N.; Zheng, X.S.; et al. Synthesis, mechanical investigation, and application of nitrogen and phosphorus co-doped carbon dots with a high photoluminescent quantum yield. Nano Res. 2018, 11, 3691–3701. [Google Scholar] [CrossRef]
- Zhang, J.; Nan, D.Y.; Pan, S.; Liu, H.; Yang, H.; Hu, X.L. N,S co-doped carbon dots as a dual-functional fluorescent sensor for sensitive detection of baicalein and temperature. Spectroc. Acta Part A Mol. Biomol. Spectr. 2019, 221. [Google Scholar] [CrossRef]
- Xu, Q.; Liu, Y.; Gao, C.; Wei, J.F.; Zhou, H.J.; Chen, Y.S.; Dong, C.B.; Sreeprasad, T.S.; Li, N.; Xia, Z.H. Synthesis, mechanistic investigation, and application of photoluminescent sulfur and nitrogen co-doped carbon dots. J. Mater. Chem. C 2015, 3, 9885–9893. [Google Scholar] [CrossRef]
- Dong, Y.Q.; Pang, H.C.; Yang, H.B.; Guo, C.X.; Shao, J.W.; Chi, Y.W.; Li, C.M.; Yu, T. Carbon-Based Dots Co-doped with Nitrogen and Sulfur for High Quantum Yield and Excitation-Independent Emission. Angew. Chem. Int. Ed. 2013, 52, 7800–7804. [Google Scholar] [CrossRef]
- Lu, W.B.; Qin, X.Y.; Liu, S.; Chang, G.H.; Zhang, Y.W.; Luo, Y.L.; Asiri, A.M.; Al-Youbi, A.O.; Sun, X.P. Economical, Green Synthesis of Fluorescent Carbon Nanoparticles and Their Use as Probes for Sensitive and Selective Detection of Mercury(II) Ions. Anal. Chem. 2012, 84, 5351–5357. [Google Scholar] [CrossRef] [PubMed]
- Qu, D.; Sun, Z.C.; Zheng, M.; Li, J.; Zhang, Y.Q.; Zhang, G.Q.; Zhao, H.F.; Liu, X.Y.; Xie, Z.G. Three Colors Emission from S,N Co-doped Graphene Quantum Dots for Visible Light H-2 Production and Bioimaging. Adv. Opt. Mater. 2015, 3, 360–367. [Google Scholar] [CrossRef]
- Xu, Y.; Wu, M.; Liu, Y.; Feng, X.Z.; Yin, X.B.; He, X.W.; Zhang, Y.K. Nitrogen-Doped Carbon Dots: A Facile and General Preparation Method, Photoluminescence Investigation, and Imaging Applications. Chem. Eur. J. 2013, 19, 2276–2283. [Google Scholar] [CrossRef] [PubMed]
- Liu, S.; Tian, J.Q.; Wang, L.; Zhang, Y.W.; Qin, X.Y.; Luo, Y.L.; Asiri, A.M.; Al-Youbi, A.O.; Sun, X.P. Hydrothermal Treatment of Grass: A Low-Cost, Green Route to Nitrogen-Doped, Carbon-Rich, Photoluminescent Polymer Nanodots as an Effective Fluorescent Sensing Platform for Label-Free Detection of Cu(II) Ions. Adv. Mater. 2012, 24, 2037–2041. [Google Scholar] [CrossRef] [PubMed]
- Mel’nik, Y.P. Chapter 3 Conditions of migration and deposition of iron and silica. Dev. Precambrian Geol. 1982, 5. [Google Scholar] [CrossRef]
- Zhao, L.X.; Geng, F.L.; Di, F.; Guo, L.H.; Wan, B.; Yang, Y.; Zhang, H.; Sun, G.Z. Polyamine-functionalized carbon nanodots: A novel chemiluminescence probe for selective detection of iron(III) ions. RSC Adv. 2014, 4, 45768–45771. [Google Scholar] [CrossRef]
- Wang, L.L.; Chung, J.S.; Hur, S.H. Nitrogen and boron-incorporated carbon dots for the sequential sensing of ferric ions and ascorbic acid sensitively and selectively. Dyes Pigments 2019, 171, 8. [Google Scholar] [CrossRef]
- Sachdev, A.; Gopinath, P. Green synthesis of multifunctional carbon dots from coriander leaves and their potential application as antioxidants, sensors and bioimaging agents. Analyst 2015, 140, 4260–4269. [Google Scholar] [CrossRef]
- Qu, K.G.; Wang, J.S.; Ren, J.S.; Qu, X.G. Carbon Dots Prepared by Hydrothermal Treatment of Dopamine as an Effective Fluorescent Sensing Platform for the Label-Free Detection of Iron(III) Ions and Dopamine. Chem. Eur. J. 2013, 19, 7243–7249. [Google Scholar] [CrossRef]
- Sun, Y.Q.; Wang, X.J.; Wang, C.; Tong, D.Y.; Wu, Q.; Jiang, K.L.; Jiang, Y.N.; Wang, C.X.; Yang, M.H. Red emitting and highly stable carbon dots with dual response to pH values and ferric ions. Microchim. Acta. 2018, 185. [Google Scholar] [CrossRef]
- Zhao, L.; Wang, Y.S.; Zhao, X.H.; Deng, Y.J.; Xia, Y.Z. Facile Synthesis of Nitrogen-Doped Carbon Quantum Dots with Chitosan for Fluorescent Detection of Fe3+. Polymers 2019, 11, 1731. [Google Scholar] [CrossRef] [PubMed] [Green Version]
- Lu, W.J.; Gong, X.J.; Nan, M.; Liu, Y.; Shuang, S.M.; Dong, C. Comparative study for N and S doped carbon dots: Synthesis, characterization and applications for Fe3+ probe and cellular imaging. Anal. Chim. Acta. 2015, 898, 116–127. [Google Scholar] [CrossRef]
- Lee, H.; Lee, Y.; Statz, A.R.; Rho, J.; Park, T.G.; Messersmith, P.B. Substrate-independent layer-by-layer assembly by using mussel-adhesive-inspired polymers. Adv. Mater. 2008, 20, 1619–1623. [Google Scholar] [CrossRef] [PubMed] [Green Version]
- Zhou, X.; Ma, P.P.; Wang, A.Q.; Yu, C.F.; Qian, T.; Wu, S.S.; Shen, J. Dopamine fluorescent sensors based on polypyrrole/graphene quantum dots core/shell hybrids. Biosens. Bioelectron. 2015, 64, 404–410. [Google Scholar] [CrossRef] [PubMed]
- Liu, R.H.; Li, H.T.; Kong, W.Q.; Liu, J.; Liu, Y.; Tong, C.Y.; Zhang, X.; Kang, Z.H. Ultra-sensitive and selective Hg2+ detection based on fluorescent carbon dots. Mater. Res. Bull. 2013, 48, 2529–2534. [Google Scholar] [CrossRef]
- Badarau, A.; Dennison, C. Copper Trafficking Mechanism of CXXC-Containing Domains: Insight from the pH-Dependence of Their Cu(I) Affinities. J. Am. Chem. Soc. 2011, 133, 2983–2988. [Google Scholar] [CrossRef] [PubMed]
- Zheng, M.; Xie, Z.G.; Qu, D.; Li, D.; Du, P.; Jing, X.B.; Sun, Z.C. On Off On Fluorescent Carbon Dot Nanosensor for Recognition of Chromium(VI) and Ascorbic Acid Based on the Inner Filter Effect. ACS Appl. Mater. Interfaces 2013, 5, 13242–13247. [Google Scholar] [CrossRef]
- Li, S.H.; Li, Y.C.; Cao, J.; Zhu, J.; Fan, L.Z.; Li, X.H. Sulfur-Doped Graphene Quantum Dots as a Novel Fluorescent Probe for Highly Selective and Sensitive Detection of Fe3+. Anal. Chem. 2014, 86, 10201–10207. [Google Scholar] [CrossRef]
Scheme 1.
Illustration of NPCDs bi-sensor detecting Fe3+ and CNs based on the “off-on”mechanism.

Figure 1.
(A) Excitation (a1, a2) and emission (b1, b2) fluorescence spectra of the CDs and NPCDs (inset: enlarge fluorescence spectrum of CDs), (B) fluorescence spectra of the NPCDs in the range of excitation wavelength from 280 to 390 nm.
Figure 1.
(A) Excitation (a1, a2) and emission (b1, b2) fluorescence spectra of the CDs and NPCDs (inset: enlarge fluorescence spectrum of CDs), (B) fluorescence spectra of the NPCDs in the range of excitation wavelength from 280 to 390 nm.

Figure 2.
TEM images of NPCDs (inset (A) size distribution (B) HRTEM image of NPCDs).

Figure 3.
(A) XPS survey spectra of NPCDs. High-resolution XPS spectra of (B) C1s, (C) N1s, and (D) P2p, respectively.
Figure 3.
(A) XPS survey spectra of NPCDs. High-resolution XPS spectra of (B) C1s, (C) N1s, and (D) P2p, respectively.

Figure 4.
FTIR spectra of CDs and NPCDs.

Figure 5.
(A) Fluorescence intensity of NPCDs and (B) quenching effect of Fe3+ on the fluorescence of NPCDs in a variety of pH values.
Figure 5.
(A) Fluorescence intensity of NPCDs and (B) quenching effect of Fe3+ on the fluorescence of NPCDs in a variety of pH values.

Figure 6.
(A) Fluorescence spectra of NPCDs in the presence of different concentrations of Fe3+ and (B) the linear relationship between INPCDs+Fe3+/INPCDs and the concentration of Fe3+.
Figure 6.
(A) Fluorescence spectra of NPCDs in the presence of different concentrations of Fe3+ and (B) the linear relationship between INPCDs+Fe3+/INPCDs and the concentration of Fe3+.

Figure 7.
(A) Fluorescence intensity of the NPCDs/Fe3+ probe in the existence of various CNs at the same concentration of 5 µM, (B) time-dependence of fluorescence ratio (IProbe+DA/IProbe) in the presence of 5 µM DA.
Figure 7.
(A) Fluorescence intensity of the NPCDs/Fe3+ probe in the existence of various CNs at the same concentration of 5 µM, (B) time-dependence of fluorescence ratio (IProbe+DA/IProbe) in the presence of 5 µM DA.

Figure 8.
(A) Enhancement effect of DA on fluorescence intensity of NPCDs/Fe3+ probe (inset: calibration curve between IProbe+DA/IProbe and concentration of DA), (B) selectivity of NPCDs/Fe3+ probe towards different interferences in the presence and absence of DA in an equal concentration of 5 µM.
Figure 8.
(A) Enhancement effect of DA on fluorescence intensity of NPCDs/Fe3+ probe (inset: calibration curve between IProbe+DA/IProbe and concentration of DA), (B) selectivity of NPCDs/Fe3+ probe towards different interferences in the presence and absence of DA in an equal concentration of 5 µM.

Scheme 2.
“Off-on” mechanism of Fe3+ and CNs on NPCDs fluorescence.


Table 1.
Comparison of QY of co-doped CDs synthesized using different methods.
| Doped Carbon Dots | Material | Method | Quantum Yield | Reference |
|---|---|---|---|---|
| N,P-CDs | Citric acid, O-phosphorylethanolamine | Hydrothermal | 8.17% | [22] |
| N,P-CDs | Ethylenediamine, H3PO4 | Hydrothermal | 25.47% | [21] |
| N,P-CDs | Sodium citrate, (NH4)2HPO4 | Hydrothermal | 53.8% | [35] |
| N,P-CDs | Glucose, ammonia, H3PO4 | Hydrothermal | 54% | [24] |
| N,P-CDs | Citric acid, (NH4)2HPO4 | Hydrothermal | 84% | Our method |
| P,Cl-CDs | Maltose, H3PO4, HCl | Hydrothermal | 15% | [18] |
| Si,N-CDs | Ethylenediamine, APTES | Hydrothermal | 29.7% | [15] |
| S,N-CDs | Citric acid, N-acetyl-L-Cysteine | Hydrothermal | 49% | [36] |
| S,N-CDs | Sodium citrate, sulfamide | Hydrothermal | 55% | [37] |
| S,N-CDs | Citric acid, L-Cysteine | Hydrothermal | 73% | [38] |
© 2020 by the authors. Licensee MDPI, Basel, Switzerland. This article is an open access article distributed under the terms and conditions of the Creative Commons Attribution (CC BY) license (http://creativecommons.org/licenses/by/4.0/).
Share and Cite
MDPI and ACS Style
Le, T.H.; Lee, H.J.; Kim, J.H.; Park, S.J. Detection of Ferric Ions and Catecholamine Neurotransmitters via Highly Fluorescent Heteroatom Co-Doped Carbon Dots. Sensors 2020, 20, 3470. https://doi.org/10.3390/s20123470
AMA Style
Le TH, Lee HJ, Kim JH, Park SJ. Detection of Ferric Ions and Catecholamine Neurotransmitters via Highly Fluorescent Heteroatom Co-Doped Carbon Dots. Sensors. 2020; 20(12):3470. https://doi.org/10.3390/s20123470
Chicago/Turabian StyleLe, Thi Hoa, Hyun Jong Lee, Ji Hyeon Kim, and Sang Joon Park. 2020. "Detection of Ferric Ions and Catecholamine Neurotransmitters via Highly Fluorescent Heteroatom Co-Doped Carbon Dots" Sensors 20, no. 12: 3470. https://doi.org/10.3390/s20123470
Note that from the first issue of 2016, this journal uses article numbers instead of page numbers. See further details here.