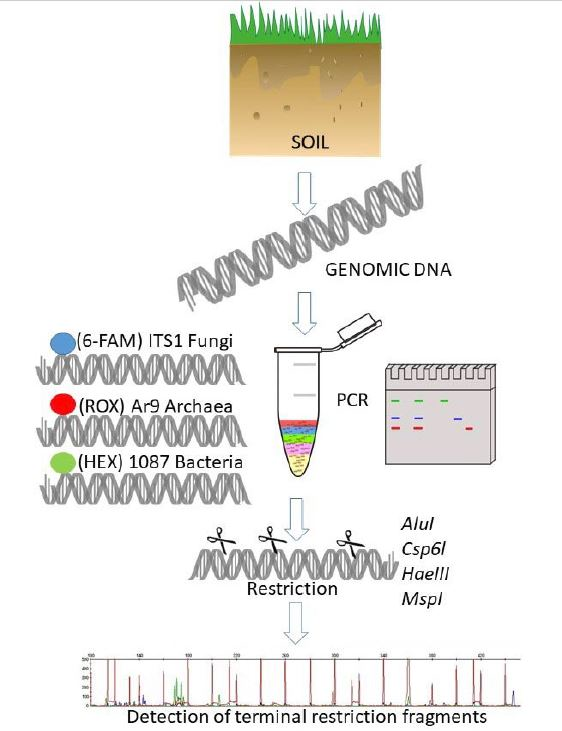
Methodological Aspects of Multiplex Terminal Restriction Fragment Length Polymorphism-Technique to Describe the Genetic Diversity of Soil Bacteria, Archaea and Fungi

Abstract
:
1. Introduction
1.1. Development of Culture-Independent Methods to Describe Microbial Communities
1.2. Microbial Community Analysis Based on t-RFLP
2. Materials and Methods
- NAB–number of common peaks in two restriction profiles
- NA–number of peaks in restriction profile A
- NB–number of peaks in restriction profile B.
3. Results
4. Discussion
4.1. Improvement of the Parameters of the Reaction
4.1.1. DNA Extractions
4.1.2. PCR
4.1.3. Restriction Digestion
4.1.4. Optimizing Capillary Electrophoresis with 3130 Genetic Analyzer Instruments (Applied Biosystems)
5. Conclusions
Supplementary Materials
Author Contributions
Funding
Conflicts of Interest
References
- Nannipieri, P.; Ascher, J.; Ceccherini, M.T.; Landi, L.; Pietramellara, G.; Renella, G. Microbial diversity and soil functions. Eur. J. Soil Sci. 2003, 54, 655–670. [Google Scholar] [CrossRef]
- Philippot, L.; Raaijmakers, J.M.; Lemanceau, P.; van der Putten, W.H. Going back to the roots: The microbial ecology of the rhizosphere. Nat. Rev. Microbiol. 2013, 11, 789–799. [Google Scholar] [CrossRef]
- Sui, X.; Zhang, R.; Frey, B.; Yang, L.; Li, M.H.; Ni, H. Land use change effects on diversity of soil bacterial, Acidobacterial and fungal communities in wetlands of the Sanjiang Plain, northeastern China. Sci. Rep. 2019, 9, 18535. [Google Scholar] [CrossRef] [PubMed]
- Karliński, L.; Ravnskov, S.; Rudawska, M. Soil microbial biomass and community composition relates to poplar genotypes and environmental conditions. Forests 2020, 11, 262. [Google Scholar] [CrossRef] [Green Version]
- van der Heijden, M.G.A.; Bardgett, R.D.; van Straalen, N.M. The unseen majority: Soil microbes as drivers of plant diversity and productivity in terrestrial ecosystems. Ecol. Lett. 2008, 11, 296–310. [Google Scholar] [CrossRef] [PubMed]
- Rincon-Florez, V.; Carvalhais, L.C.; Shenk, P.M. Culture-Independent Molecular Tools for Soil and Rhizosphere Microbiology. Diversity 2013, 5, 581–612. [Google Scholar] [CrossRef]
- Maron, P.A.; Sarr, A.; Kaisermann, A.; Leveque, J.; Mathieu, O.; Guigue, J.; Karimi, B.; Bernard, L.; Dequiedt, S.; Terrat, S.; et al. High microbial diversity promotes soil ecosystem functioning. Appl. Environ. Microbiol. 2018, 84, e02738-17. [Google Scholar] [CrossRef] [Green Version]
- Reed, H.E.; Martiny, J.B.H. Testing the functional significance of microbial composition in natural communities. FEMS Microbiol. Ecol. 2007, 62, 161–170. [Google Scholar] [CrossRef]
- Balvanera, P.; Pfisterer, A.B.; Buchmann, N.; He, J.S.; Nakashizuka, T.; Raffaelli, D.; Schmid, B. Quantifying the evidence for biodiversity effects on ecosystem functioning and services. Ecol. Lett. 2006, 9, 1146–1156. [Google Scholar] [CrossRef] [Green Version]
- Sauberer, N.; Zulka, K.P.; Abensperg-Traum, M.; Berg, H.; Bieringer, G.; Milasowszky, N.; Moser, D.; Plutzar, C.; Pollheimer, M.; Storch, C.; et al. Surrogate taxa for biodiversity in agricultural landscape of eastern Austria. Biol. Conser. 2004, 117, 181–190. [Google Scholar] [CrossRef]
- Gillison, A.N.; Liswanti, N. Assessing biodiversity at landscape level in northern Thailand and Sumatra (Indonesia): The importance of environmental context. Agr. Ecosyst. Environ. 2004, 104, 75–86. [Google Scholar] [CrossRef]
- Nkongolo, K.K.; Narendrula-Kotha, R. Advances in monitoring soil microbial community dynamic and function. J. Appl. Genetics 2020, 61, 249–263. [Google Scholar] [CrossRef] [PubMed]
- Anderson, I.C.; Cairney, J.W.G. Diversity and ecology of soil fungal communities: Increased understanding through the application of molecular techniques. Environ. Microbiol. 2004, 6, 769–779. [Google Scholar] [CrossRef] [PubMed]
- Singh, B.K.; Nazaries, L.; Munro, S.; Anderson, I.C.; Campbel, C.D. Use of multiplex terminal restriction fragment length polymorphism for rapid and simultaneous analysis of different components of the soil microbial community. Appl. Environ. Microbiol. 2006, 72, 7278–7285. [Google Scholar] [CrossRef] [Green Version]
- Elliott, G.N.; Thomas, N.; Macrae, M.; Campbell, C.D.; Ogden, I.D.; Singh, B.K. Multiplex T-RFLP allows for increased target number and specificity: Detection of Salmonella enterica and six species of Listeria in a single test. PLoS ONE 2012, 7, e43672. [Google Scholar] [CrossRef] [Green Version]
- Song, Y.; Kato, N.; Liu, C.; Matsumiya, Y.; Kato, H.; Watanabe, K. Rapid identification of 11 human intestinal Lactobacillus species by multiplex PCR assays using group- and species-specific primers derived from the 16S-23S rRNA intergenic spacer region and its flanking 23S rRNA. FEMS Microbiol. Lett. 2000, 187, 167–173. [Google Scholar] [CrossRef]
- Stankovic, M.; Rakicevic, L.; Mikovic, D.; Jankovic, G.; Nikolic, A. Indirect diagnosis of haemophilia B by multiplex PCR/RFLP. Clin. Lab. Haematol. 2005, 27, 145–146. [Google Scholar] [CrossRef] [PubMed]
- de la Fuente, G.; Belanche, A.; Girwood, S.E.; Pinloche, E.; Wilkinson, T. Pros and Cons of Ion-Torrent Next Generation Sequencing versus Terminal Restriction Fragment Length Polymorphism T-RFLP for Studying the Rumen Bacterial Community. PLoS ONE 2014, 9, e101435. [Google Scholar] [CrossRef] [Green Version]
- Gillevet, P.M.; Sikaroodi, M.; Torzilli, A.P. Analyzing salt-marsh fungal diversity: Comparing ARISA fingerprinting with clone sequencing and pyrosequencing. Fungal. Ecol. 2009, 2, 160–167. [Google Scholar] [CrossRef]
- Cleary, D.F.R.; Smalla, K.; Mendonca-Hagler, L.C.S.; Gomes, N.C.M. Assessment of variation in bacterial composition among microhabitats in a mangrove environment using DGGE fingerprints and barcoded pyrosequencing. PLoS ONE 2012, 7, e29380. [Google Scholar] [CrossRef] [Green Version]
- Dorst, J.; Bissett, A.; Palmer, A.S.; Brown, M.; Snape, I.; Stark, J.S.; Raymond, B.; McKinley, J.; Mukan, J.; Winsley, T.; et al. Community fingerprinting in a sequencing world. Community fingerprinting in a sequencing world. FEMS Microbiol. Ecol. 2014, 89, 316–330. [Google Scholar] [CrossRef] [PubMed]
- Fish, J.A.; Chai, B.; Wang, Q.; Sun, Y.; Brown, C.T.; Tiedje, J.M.; Cole, J.R. FunGene: The functional gene pipeline and repository. Front. Microbiol. 2013, 4, 1–14. [Google Scholar] [CrossRef] [PubMed] [Green Version]
- Junier, P.; Junier, T.; Witzel, K.P. TRiFLe, a Program for In Silico Terminal Restriction Fragment Length Polymorphism Analysis with User-Defined Sequence Sets. Appl. Environ. Microbiol. 2008, 74, 6452–6456. [Google Scholar] [CrossRef] [Green Version]
- Jurgens, G.; Saano, A. Diversity of soil Archaea in boreal forest before, and after clean-cutting and prescribed burning. FEMS Microbiol. Ecol. 1999, 29, 205–213. [Google Scholar]
- Jurgens, G.; Lindstrom, K.; Saano, A. Novel group within the kingdom Crenarchaeota from boreal forest soil. Appl. Environ. Microbiol. 1997, 63, 803–805. [Google Scholar] [CrossRef] [PubMed] [Green Version]
- Marchesi, J.R.; Sato, T.; Weightman, A.J.; Martin, T.A.; Fry, J.C.; Hiom, S.J.; Wade, W.G. Design and evaluation of useful bacterium-specific PCR primers that amplify genes coding for bacterial 16S rRNA. Appl. Environ. Microbiol. 1998, 64, 795–799. [Google Scholar] [CrossRef] [Green Version]
- Hauben, L.; Vauterin, C.; Swings, J.; Moore, E.R.B. Comparison of 16S ribosomal DNA sequence of all Xanthomonas species. Int. J. Syst. Bacteriol. 1997, 47, 328–335. [Google Scholar] [CrossRef] [Green Version]
- Gardes, M.; Bruns, T.D. ITS primers with enhanced specificity for basidiomycetes: Application to the identification of mycorrhiza and rusts. Mol. Ecol. 1993, 2, 113–118. [Google Scholar] [CrossRef]
- White, T.J.; Bruns, T.D.; Lee, S.; Taylor, J. Analysis of phylogenetic relationship by amplification and direct sequencing of ribosomal RNA genes. In PCR Protocol: A Guide to Method and Applications; Innis, M.A., Gelfond, D.H., Sainsky, J.J., White, T.J., Eds.; Academic Press: New York, NY, USA, 1990; pp. 315–322. [Google Scholar]
- Magurran, A.E.; Baillie, S.R.; Buckland, S.T.; Dick, J.; Elston, D.A.; Scott, E.M.; Smith, R.I.; Somerfield, P.J.; Watt, A. Long-term datasets in biodiversity research and monitoring: Assessing change in ecological communities through time. Trends Ecol. Evol. 2010, 10, 574–582. [Google Scholar] [CrossRef]
- Food and Agriculture Organization of the United Nations (FAO); International Union of Soil Sciences (IUSS). World Reference Base for Soil Resources 2014, International Soil Classification System for Naming Soils and Creating Legends for Soil Maps; Food and Agriculture Organization of the United Nations (FAO): Rome, Italy, 2015; p. 192. ISBN 978-92-5-108369-7. [Google Scholar]
- Hullar, M.A.J.; Kaplan, L.A.; Stahl, D.A. Recurring seasonal dynamics of microbial communities in stream habits. Appl. Environ. Microbiol. 2006, 72, 713–722. [Google Scholar] [CrossRef] [Green Version]
- Liu, W.T.; Marsh, T.L.; Cheng, H.; Forney, L.J. Characterization of microbial diversity by determining terminal restriction fragment length polymorphisms of genes encoding 16S rRNA. Appl. Environ. Microbiol. 1997, 63, 4516–4522. [Google Scholar] [CrossRef] [PubMed] [Green Version]
- Viaud, M.; Pasquier, A.; Brygoo, Y. Diversity of soil fungi studied by PCR-RFLP of ITS. Mycol. Res. 2000, 104, 1027–1032. [Google Scholar] [CrossRef]
- Genney, D.R.; Anderson, I.C.; Alexander, I.J. Fine-scale distribution of pine ectomycorrhizas and their extramatrical mycelium. New Phytol. 2006, 170, 381–390. [Google Scholar] [CrossRef] [PubMed]
- Kotsyurbenko, O.R.; Chin, K.J.; Glagolev, M.V.; Stubner, S.; Simankova, M.V.; Nozhevnikova, A.N.; Conrad, R. Acetoclastic and hydrogenotrophic methane production and methanogenic populations in an acidic West-Siberian peat bog. Environ. Microbiol. 2004, 6, 1159–1173. [Google Scholar] [CrossRef]
- Wu, X.L.; Fiedrich, M.W.; Conrad, R. Diversity and ubiquity of thermophilic methanogenic archaea in temperate anoxic soils. Environ. Microbiol. 2006, 8, 394–404. [Google Scholar] [CrossRef]
- Pérez-Jiménez, J.R.; Kerkhof, L.J. Phylogeography of sulfatereducing bacteria among disturbed sediments, disclosed analysis of the dissimilatory sulfite reductase genes (dsrAB). Appl. Environ. Microbiol. 2005, 71, 1004–1011. [Google Scholar] [CrossRef] [Green Version]
- Mohanty, S.R.; Bodelier, P.L.E.; Floris, V.; Conrad, R. Differential effects of nitrogenous fertilizers onmethane-consuming microbes in rice field and forest soils. Appl. Environ. Microbiol. 2006, 72, 1346–1354. [Google Scholar] [CrossRef] [Green Version]
- Dimitrov, M.R.; Veraart, A.J.; Hollander, M.; Smidt, H.; Veen, J.A.; Kurame, E.E. Successive DNA extractions improve characterization of soil microbial communities. Peer J. 2017, 5, e2915. [Google Scholar] [CrossRef]
- Buchan, A.; Newell, S.Y.; Moreta, J.I.L.; Moran, M.A. Analysis of internal transcribed spacer (ITS) regions of rRNA genes in fungal communities in a southeastern U.S. salt marsh. Microb. Ecol. 2002, 43, 329–340. [Google Scholar] [CrossRef]
- Matz, C.; Jurgens, K. Interaction of nutrient limitation and protozoan grazing determines the phenotypic structure of a bacterial community. Microb. Ecol. 2003, 45, 384–398. [Google Scholar] [CrossRef]
- Egert, M.; Friedrich, M.W. Formation of pseudo-terminal restriction fragments, a PCR-related bias affecting terminal restriction fragment length polymorphism analysis of microbial community structure. Appl. Environ. Microbiol. 2003, 69, 2555–2562. [Google Scholar] [CrossRef] [PubMed] [Green Version]
- Lueders, T.; Friedrich, M.W. Evaluation of PCR Amplification Bias by Terminal Restriction Fragment Length Polymorphism Analysis of Small-Subunit rRNA and mcrA Genes by Using Defined Template Mixtures of Methanogenic Pure Cultures and Soil DNA Extracts. Appl. Environ. Microbiol. 2003, 69, 320–326. [Google Scholar] [CrossRef] [PubMed] [Green Version]
- Tu, O.; Knott, T.; Marsh, M.; Bechtol, K.; Harris, D.; Barker, D.; Bashkin, J. The influence of fluorescent dye structure on the electrophoretic mobility of end-labeled DNA. Nucleic Acid Res 1998, 26, 2797–2802. [Google Scholar] [CrossRef] [PubMed]
- Behr, S.; Mätzig, M.; Levin, A.; Eickhoff, H.; Heller, C. A fully automated multicapillary electrophoresis device for DNA analysis. Electrophoresis 1999, 20, 1492–1507. [Google Scholar] [CrossRef]
- Osborne, C.A.; Galic, M.; Sangwan, P.; Janssen, P.H. PCR-generated artifact from 16S rRNA gene-specific primers. FEMS Microbiol. Lett. 2005, 248, 183–187. [Google Scholar] [CrossRef]
- Hoshino, T.; Terahara, T.; Yamada, K.; Okuda, H.; Suzuki, I.; Tsuneda, S.; Hirata, A.; Inamori, Y. Long-term monitoring of the succession of a microbial community in activated sludge from a circulation flush toilet as a closed system. FEMS Microbiol. Ecol. 2006, 55, 459–470. [Google Scholar] [CrossRef] [Green Version]
- Sar, A.; Pal, S.; Dam, B. Isolation of high molecular weight and humic acid-free metagenomic DNA from lignocellulose-rich samples compatible for direct fosmid cloning. Appl. Microbiol. Biotechnol. 2018, 102, 6207–6219. [Google Scholar] [CrossRef]
- Christensen, J.E.; Reynolds, C.E.; Shukla, S.K.; Reed, K.D. Rapid molecular diagnosis of lactobacillus bacteremia by terminal restriction fragment length polymorphism analysis of the 16S rRNA gene. Clin. Med. Res. 2004, 2, 37–45. [Google Scholar] [CrossRef] [Green Version]
- Butler, J.M. Chapter 6: Capillary electrophoresis: Principles and Instrumentation. In Advanced Topics in Forensic DNA Typing: Methodology; Academic Press: Cambridge, MA, USA, 2011; pp. 141–165. [Google Scholar]
- Wei, H.; Therrien, C.; Blanchard, A.; Guan, S.; Zhu, Z. The Fidelity Index provides a systematic quantitation of star activity of DNA restriction endonucleases. Nuc. Acids Res 2008, 36. [Google Scholar] [CrossRef] [Green Version]
- Shyu, C.; Soule, T.; Bent, S.J.; Foster, J.A.; Forney, L.J. MiCA: A webbased tool for the analysis of microbial communities based on terminal-restriction fragment length polymorphisms of 16S and 18S rRNA genes. Microb. Ecol. 2007, 53, 562–570. [Google Scholar] [CrossRef]
- Ricke, P.; Kolb, S.; Braker, G. Application of a newly developed ARB software-integrated tool for in silico terminal restriction fragment length polymorphism analysis reveals the dominance of a novel pmoA cluster in a forest soil. Appl. Environ. Microbiol. 2005, 71, 1671–1673. [Google Scholar] [CrossRef] [PubMed] [Green Version]
- Buttler, J. Fundamentals of Forensic DNA Typing; Academic Press: Cambridge, MA, USA, 2009. [Google Scholar]
- Frąc, M.; Oszust, K.; Lipiec, J. Community level physiological profiles (CLPP), characterization and microbial activity of soil amended with dairy sewage sludge. Sensors 2012, 12, 3253–3268. [Google Scholar] [CrossRef] [PubMed] [Green Version]


| Primer | Sequences (5′-3′) | Length (bases) | Tm a (°C) | GC (%) | Fluorescent Label | Specificity | References |
|---|---|---|---|---|---|---|---|
| Ar3 f | TTC CGG TTG ATC CTG CCG GA | 20 | 55.9 | 60 | - | Archaea | [24] |
| Ar9 c r | CCC GCC AAT TCC TTT AAG TTT C | 22 | 60.0 | 45 | ROX (red) | Archaea | [25] |
| 63 f | AGG CCT AAC ACA TGC AAG TC | 20 | 51.8 | 50 | - | Eubacteria | [26] |
| 1087 c r | CTC GTT GCG GGA CTT ACC CC | 20 | 57.9 | 65 | HEX (green) | Eubacteria | [27] |
| ITS1 f | CTT GGT CAT TTA GAG GAA GTA A | 22 | 49.2 | 36 | 6-FAM b (blue) | Fungi | [28] |
| ITS4 r | TCC GCT TAT TGA TAT GC | 20 | 49.7 | 45 | - | Fungi | [29] |
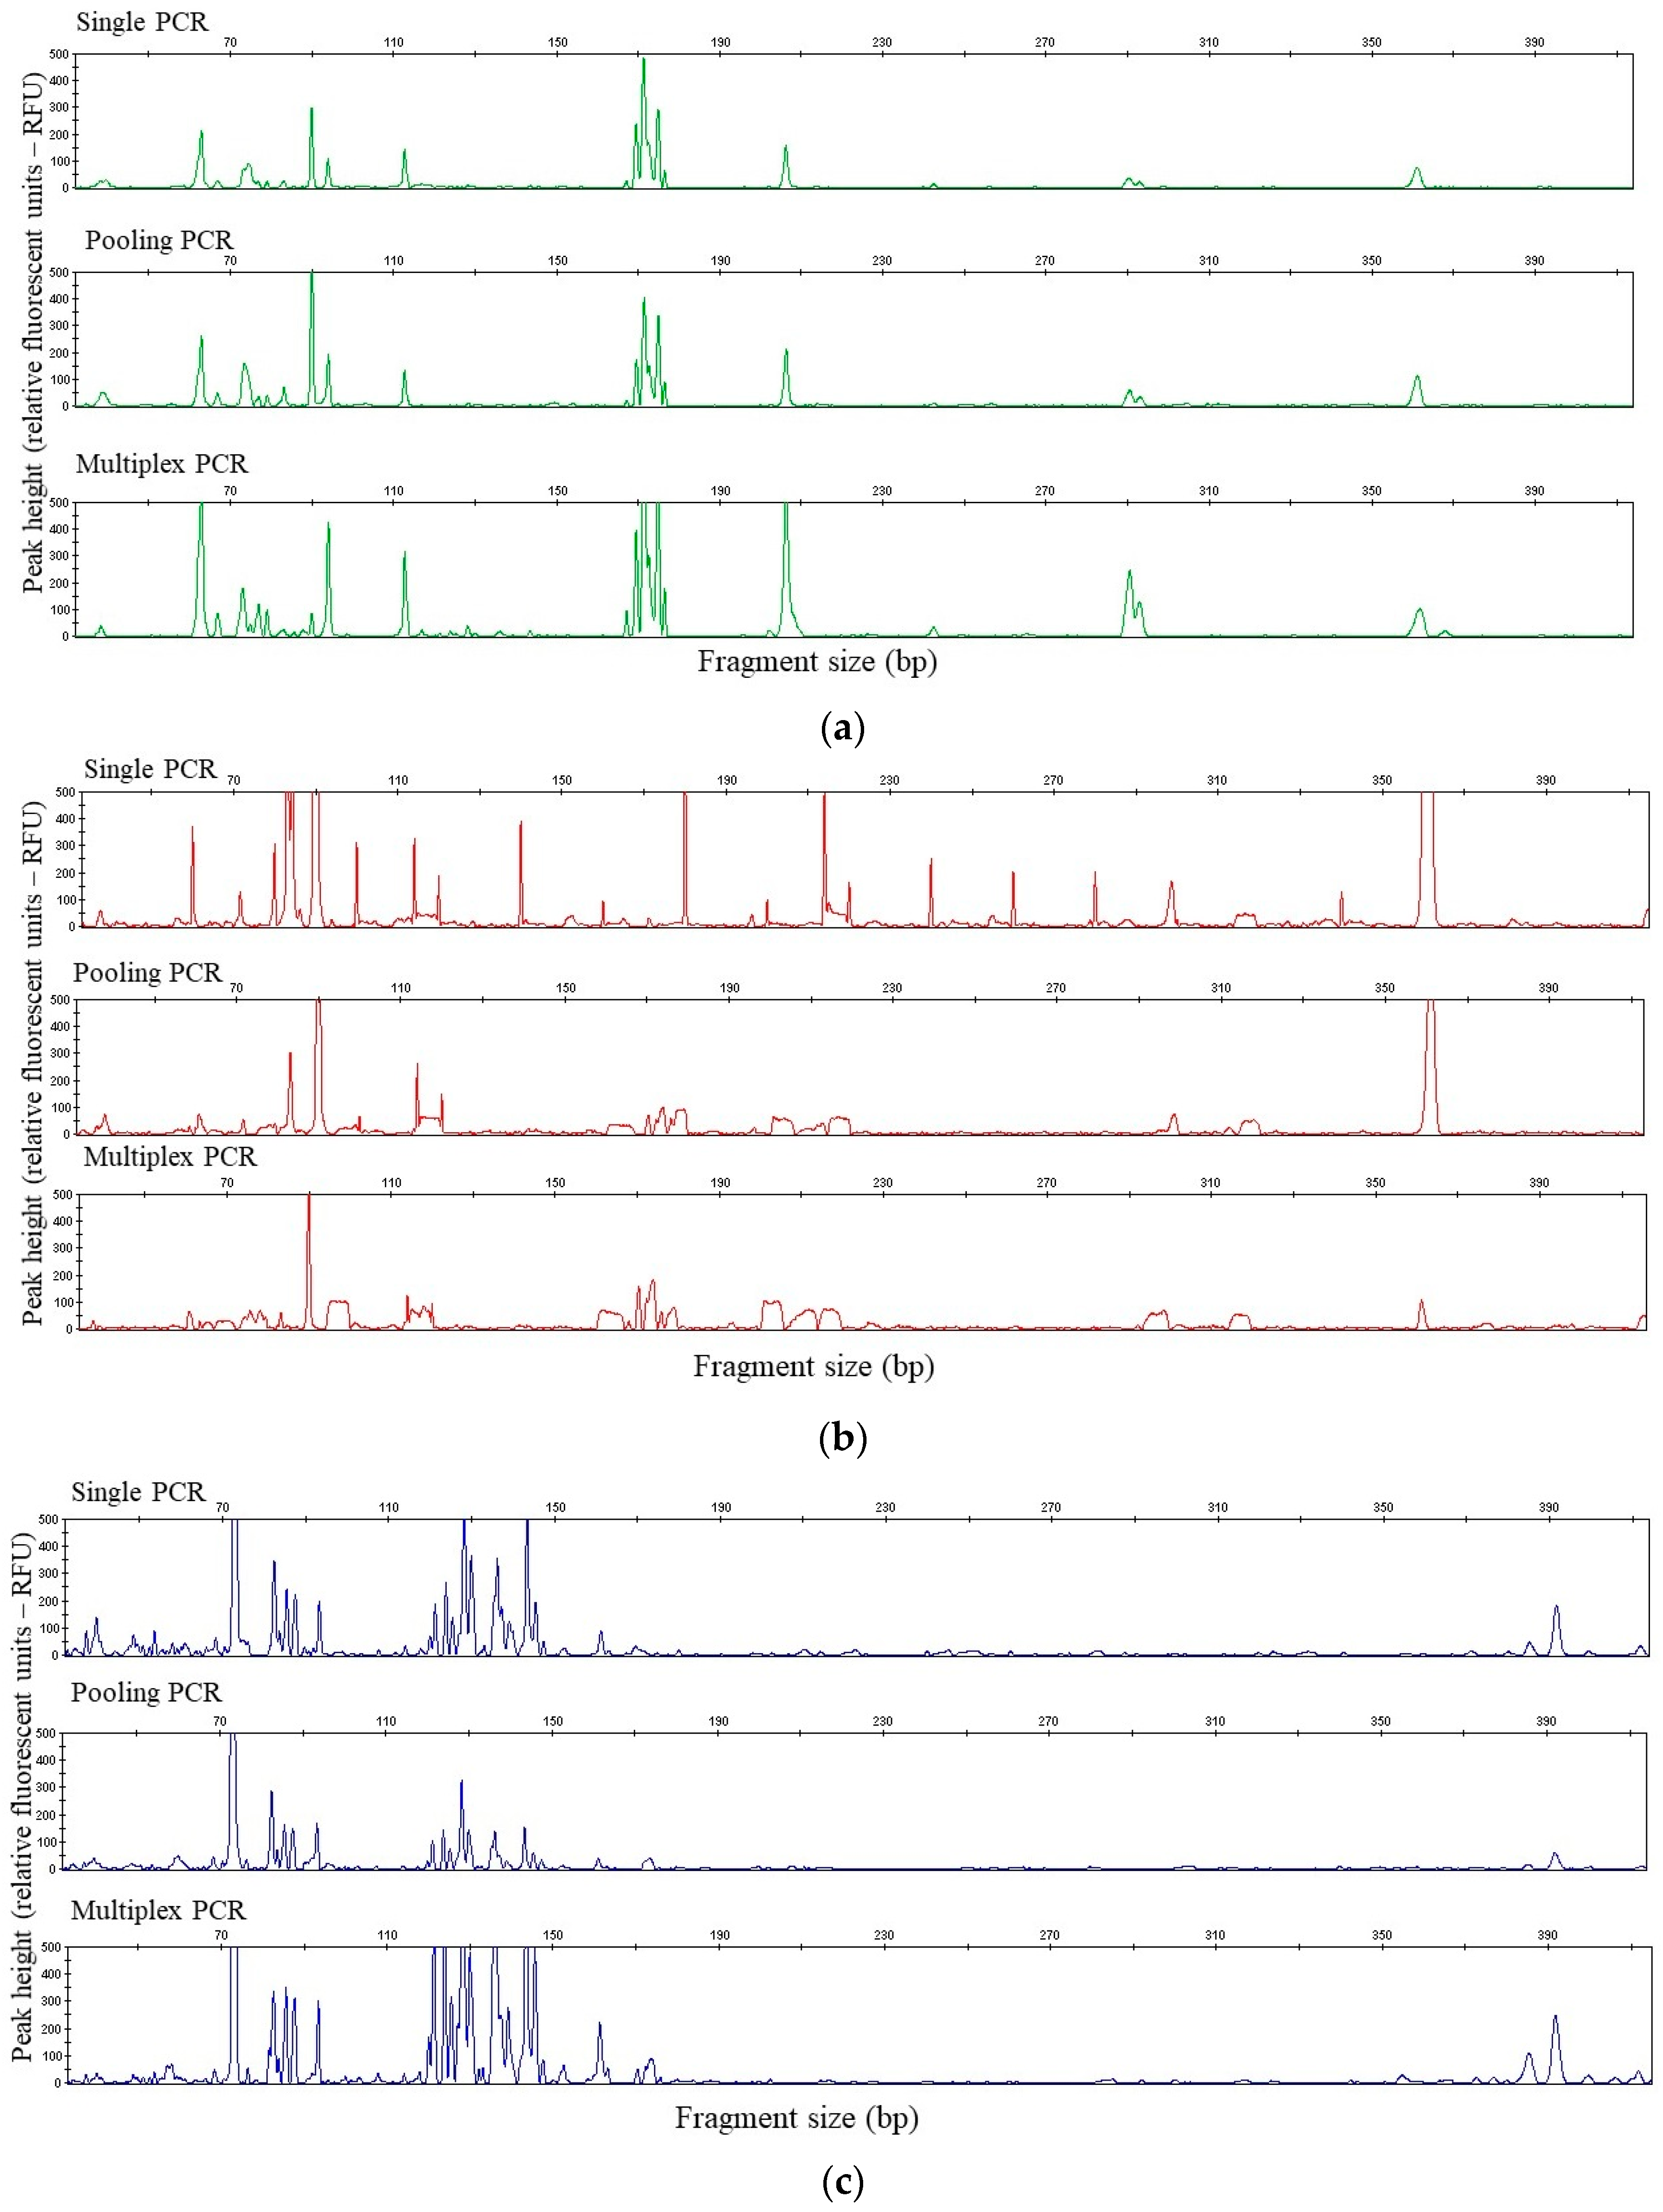
| t-RFLP Approach | PCR * | Restriction Digestion ** | Fragment Analysis |
|---|---|---|---|
| Single | 3 individual reactions | 3 individual digestions for each enzyme | Individual |
| Pooling | 3 individual reactions | 1 digestion with mixture of individual PCR products for each enzyme | Mixture |
| Multiplexing | 1 multiplex reaction | 1 digestion of multiplex PCR products | Mixture |
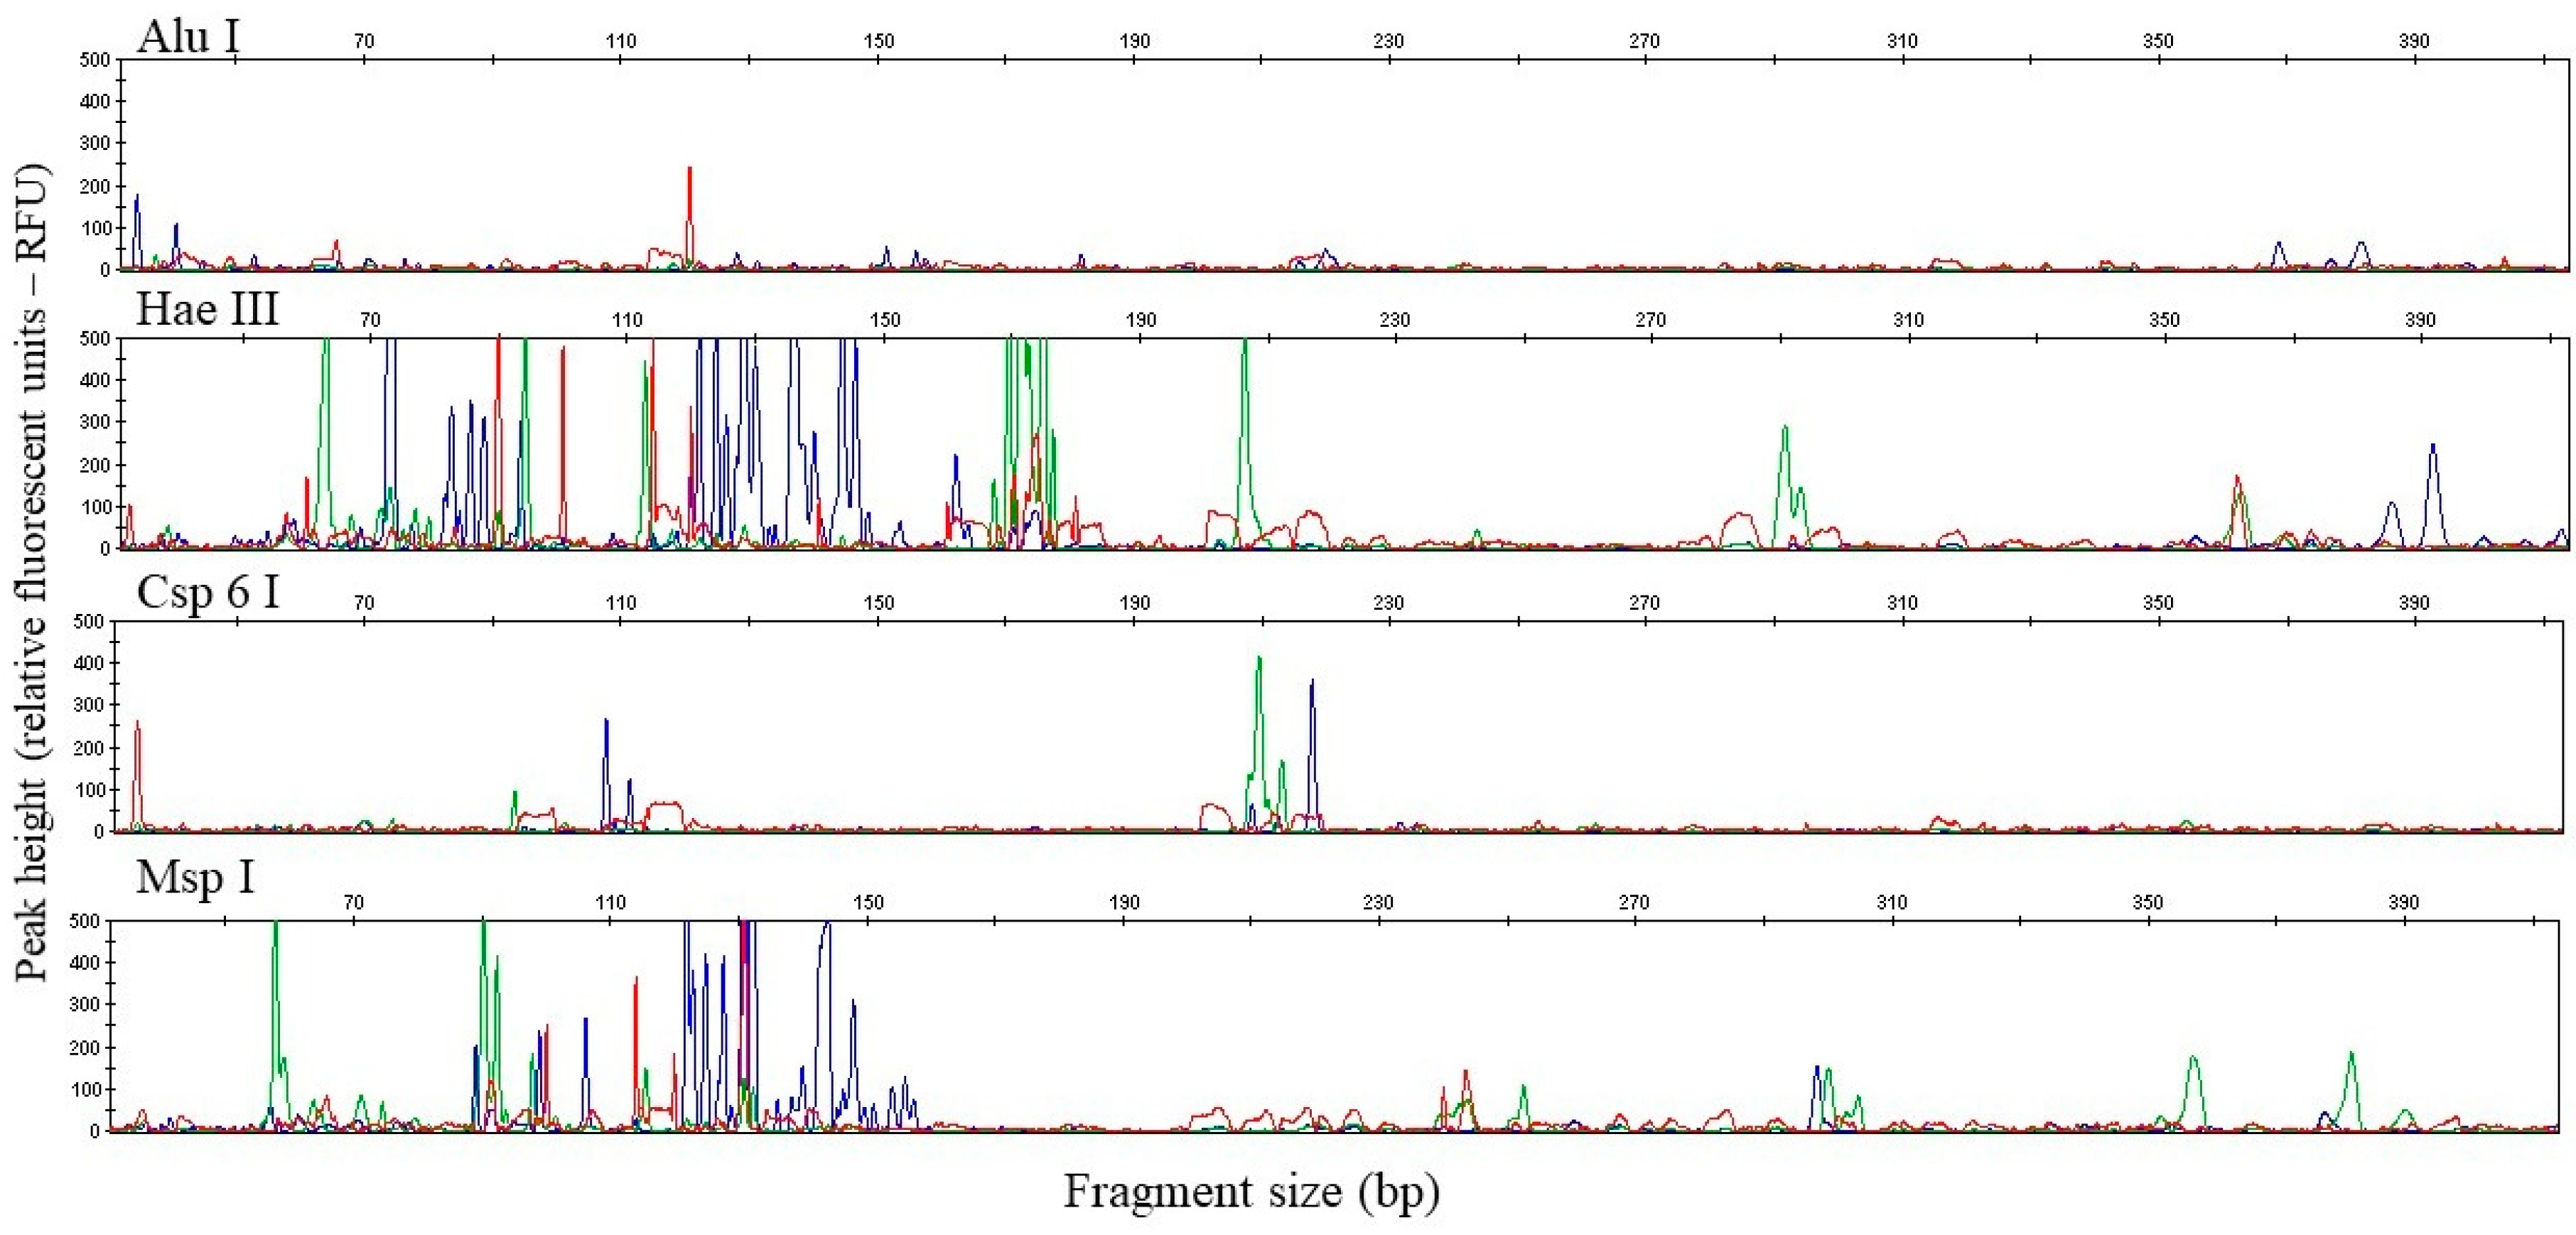
| Restriction Enzyme | Recognized Sequences of the Restriction Enzyme | Condition of Restriction | Condition of Inactivation Enzyme | Enzyme Running Buffer- Composition |
|---|---|---|---|---|
| AluI | 5′ AG↓CT 3′ 3′ TC↑GA 5′ | 37 °C for 60 min | 60 °C for 20 min | 10× Buffer Tango |
| Csp6I | 5′ G↓TAC 3′ 3′ CAT↑G 5′ | 37 °C for 60 min | 60 °C for 20 min | 10× Buffer B |
| HaeIII | 5′ GG↓CC 3′ 3′ CC↑GG 5′ | 37 °C for 60 min | 80 °C for 20 min | Buffer 1× with BSA |
| MspI | 5′ C↓CGG 3′ 3′ GGC↑C 5′ | 37 °C for 60 min | 60 °C for 20 min | 1× ONE Buffer |
| Tested Soil | TRFLP Approach | Bacteria | Archaea | Fungi |
|---|---|---|---|---|
| Soil 1 (S1) | Single vs. pooling | 0.842 | 0.333 | 0.750 |
| Single vs. multiplex | 0.823 | 0.208 | 0.850 | |
| Pooling vs. multiplex | 0.789 | 0.208 | 0.714 | |
| Soil 2 (S2) | Single vs. pooling | 0.750 | 0.433 | 0.469 |
| Single vs. multiplex | 0.818 | 0.905 | 0.773 | |
| Pooling vs. multiplex | 0.909 | 0.500 | 0.613 |
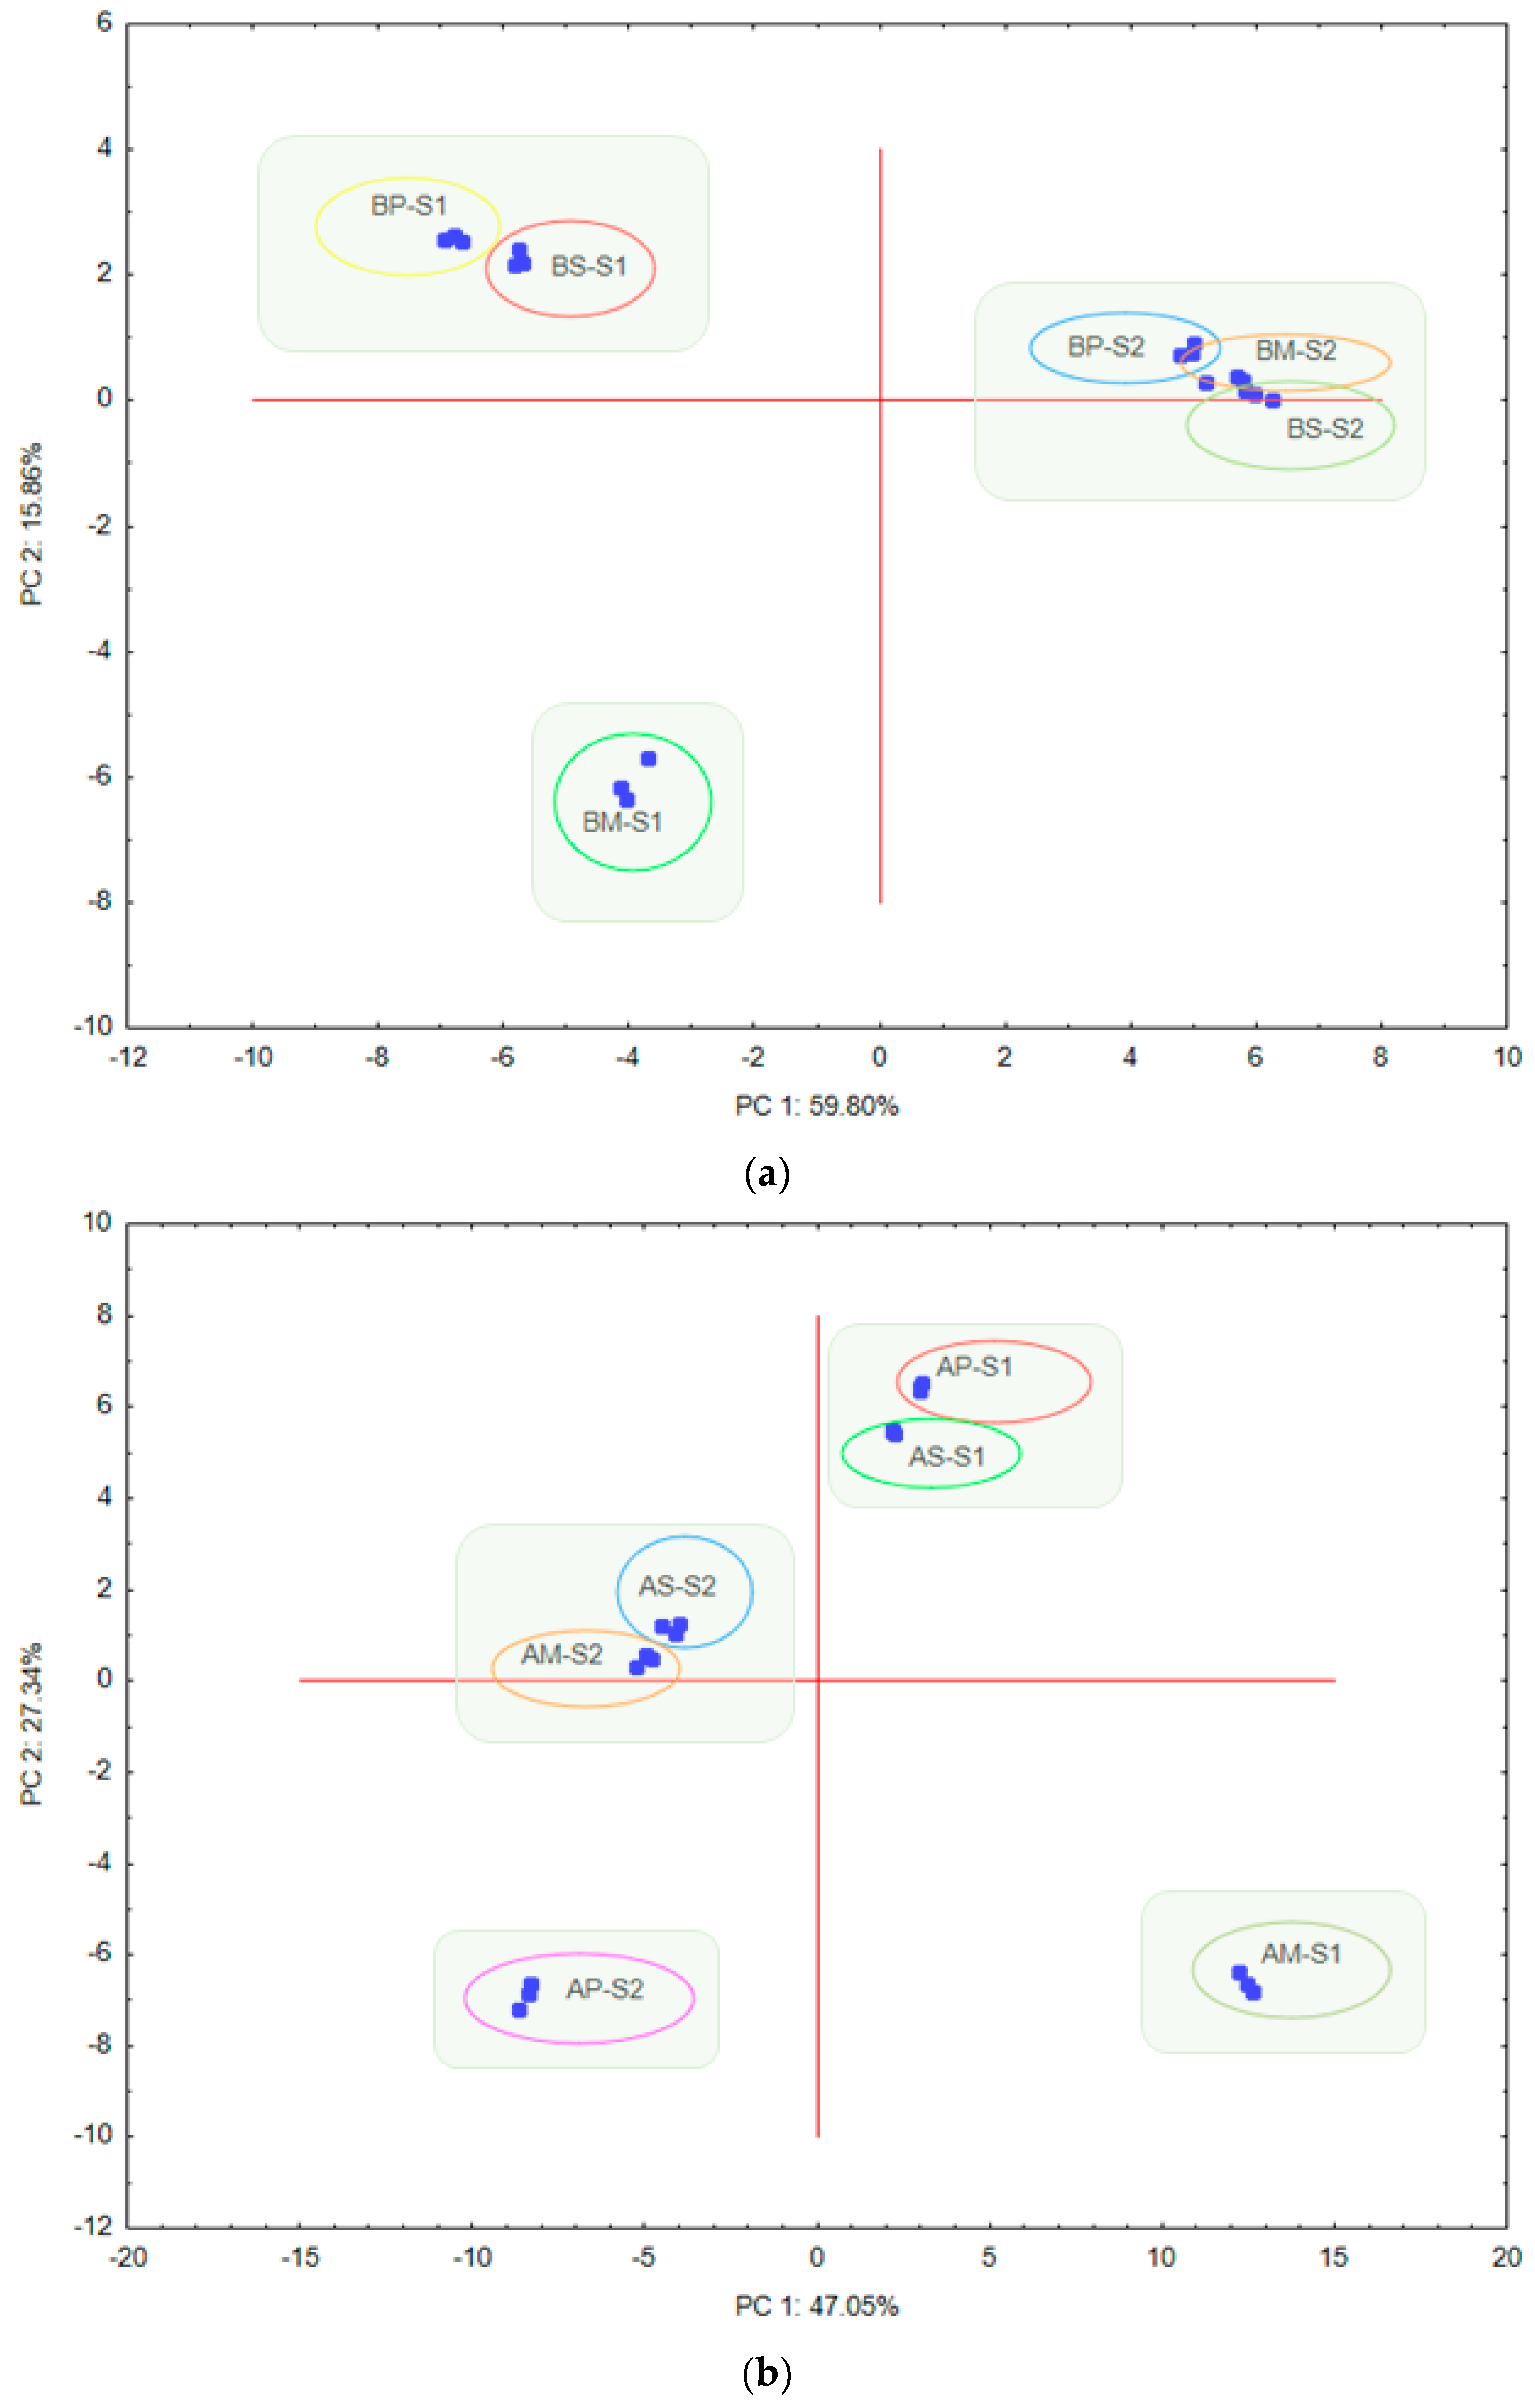
| Bacteria | Archaea | Fungi | ||||
|---|---|---|---|---|---|---|
| Variable | PC1 | PC2 | Variable | PC1 | Variable | PC1 |
| 63-RA | −0.981 | 298-RA | 0.948 | 85-RA | 0.931 | |
| 67-RA | −0.983 | 298-AR | 0.960 | 86-RA | −0.952 | |
| 74-RA | −0.957 | 88-RA | 0.922 | |||
| 77-RA | 0.975 | 125-RA | 0.938 | |||
| 93-RA | −0.975 | 128-RA | 0.979 | |||
| 94-RA | 0.980 | 140-RA | −0.913 | |||
| 113-RA | 0.939 | 143-RA | 0.962 | |||
| 170-RA | 0.930 | 145-RA | 0.904 | |||
| 171-RA | −0.949 | 198-RA | −0.943 | |||
| 173-RA | −0.965 | 445-RA | 0.991 | |||
| 206-RA | −0.997 | 478-RA | −0.911 | |||
| 209-RA | 0,986 | 544-RA | −0.926 | |||
| 290-RA | −0.993 | 83-AR | 0.919 | |||
| 360-RA | 0.981 | 88-AR | 0.941 | |||
| 361-RA | −0.937 | 93-AR | 0.991 | |||
| 63-AR | −0.971 | 121-AR | 0.920 | |||
| 67-AR | −0.968 | 123-AR | 0.911 | |||
| 74-AR | −0.956 | 125-AR | 0.970 | |||
| 93-AR | −0.956 | |||||
| 173-AR | −0.924 | |||||
| 290-AR | −0.988 | |||||
| 360-AR | 0.960 | |||||
| 361-AR | −0.931 | |||||
| Dye | Emission Max (Wavelength nm) | Intensity (not Scaled) |
|---|---|---|
| 6- FAM | 520 | **** |
| VIC | 550 | **** |
| NED | 570 | ** |
| PET | 590 | * |
| LIZ | 655 | *** |
| HEX | 556 | *** |
| ROX | 600 | * |
© 2020 by the authors. Licensee MDPI, Basel, Switzerland. This article is an open access article distributed under the terms and conditions of the Creative Commons Attribution (CC BY) license (http://creativecommons.org/licenses/by/4.0/).
Share and Cite
Gryta, A.; Frąc, M. Methodological Aspects of Multiplex Terminal Restriction Fragment Length Polymorphism-Technique to Describe the Genetic Diversity of Soil Bacteria, Archaea and Fungi. Sensors 2020, 20, 3292. https://doi.org/10.3390/s20113292
Gryta A, Frąc M. Methodological Aspects of Multiplex Terminal Restriction Fragment Length Polymorphism-Technique to Describe the Genetic Diversity of Soil Bacteria, Archaea and Fungi. Sensors. 2020; 20(11):3292. https://doi.org/10.3390/s20113292
Chicago/Turabian StyleGryta, Agata, and Magdalena Frąc. 2020. "Methodological Aspects of Multiplex Terminal Restriction Fragment Length Polymorphism-Technique to Describe the Genetic Diversity of Soil Bacteria, Archaea and Fungi" Sensors 20, no. 11: 3292. https://doi.org/10.3390/s20113292